2020.02.26, north port fire, 2019 actuarial valuation report
TRANSCRIPT

CITY OF NORTH PORT FIREFIGHTERS' PENSION - LOCAL OPTION TRUST FUND
ACTUARIAL VALUATION AS OF OCTOBER 1, 2019
CONTRIBUTIONS APPLICABLE TO THE PLAN/FISCAL YEAR ENDING SEPTEMBER 30, 2021
GASB 67/68 DISCLOSURE INFORMATION AS OF SEPTEMBER 30, 2019

13420 Parker Commons Blvd., Suite 104 Fort Myers, FL 33912 ꞏ (239) 433-5500 ꞏ Fax (239) 481-0634 ꞏ www.foster-foster.com
February 28, 2020
Board of Trustees City of North Port Firefighters’ Pension Board
Re: City of North Port Firefighters' Pension - Local Option Trust Fund
Dear Board:
We are pleased to present to the Board this report of the annual actuarial valuation of the City of North
Port Firefighters' Pension - Local Option Trust Fund. Included are the related results for GASB
Statements No. 67 and No. 68. The funding valuation was performed to determine whether the assets and
contributions are sufficient to provide the prescribed benefits and to develop the appropriate funding
requirements for the applicable plan year. The calculation of the liability for GASB results was
performed for the purpose of satisfying the requirements of GASB Statements No. 67 and No. 68. Use of
the results for other purposes may not be applicable and may produce significantly different results.
The valuations have been conducted in accordance with generally accepted actuarial principles and
practices, including the applicable Actuarial Standards of Practice as issued by the Actuarial Standards
Board, and reflect laws and regulations issued to date pursuant to the provisions of Chapters 112 and 175,
Florida Statutes, as well as applicable federal laws and regulations. In our opinion, the assumptions used
in the valuations, as adopted by the Board of Trustees, represent reasonable expectations of anticipated
plan experience. Future actuarial measurements may differ significantly from the current measurements
presented in this report for a variety of reasons including: changes in applicable laws, changes in plan
provisions, changes in assumptions, or plan experience differing from expectations. Due to the limited
scope of the valuations, we did not perform an analysis of the potential range of such future
measurements.
In conducting the valuations, we have relied on personnel, plan design, and asset information supplied by
the City of North Port, financial reports prepared by the custodian bank, and the actuarial assumptions and
methods described in the Actuarial Assumptions section of this report. While we cannot verify the
accuracy of all this information, the supplied information was reviewed for consistency and
reasonableness. As a result of this review, we have no reason to doubt the substantial accuracy of the
information and believe that it has produced appropriate results. This information, along with any
adjustments or modifications, is summarized in various sections of this report.
The total pension liability, net pension liability, and certain sensitivity information shown in this report
are based on an actuarial valuation performed as of October 1, 2018. The total pension liability was
rolled-forward from the valuation date to the plan’s fiscal year ending September 30, 2019 using
generally accepted actuarial principles. It is our opinion that the assumptions used for this purpose are
internally consistent, reasonable, and comply with the requirements under GASB No. 67 and No. 68.
The undersigned are familiar with the immediate and long-term aspects of pension valuations, and meet
the Qualification Standards of the American Academy of Actuaries necessary to render the actuarial
opinions contained herein. All of the sections of this report are considered an integral part of the actuarial
opinions.
To our knowledge, no associate of Foster & Foster, Inc. working on valuations of the program has any
direct financial interest or indirect material interest in the City of North Port, nor does anyone at Foster &
Foster, Inc. act as a member of the Board of Trustees of the Firefighters' Pension - Local Option Trust
Fund. Thus, there is no relationship existing that might affect our capacity to prepare and certify this
actuarial report.
If there are any questions, concerns, or comments about any of the items contained in this report, please
contact us at 239-433-5500.
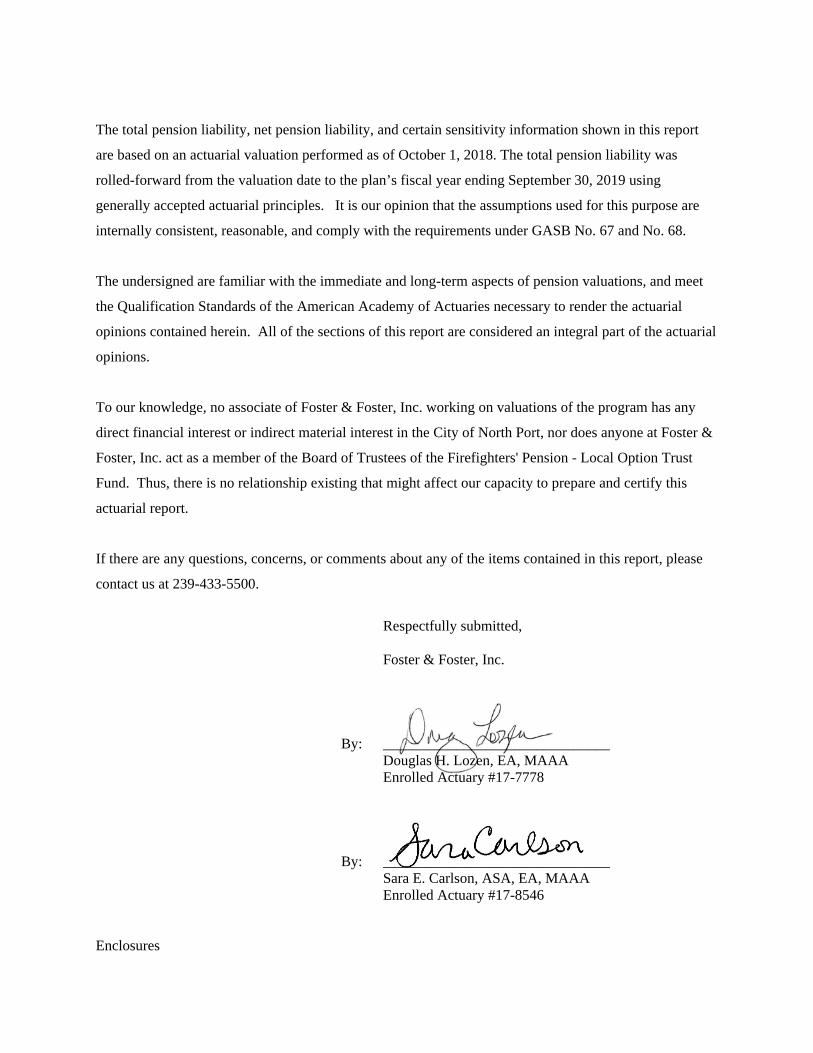
Respectfully submitted,
Foster & Foster, Inc.
By: _______________________________
Douglas H. Lozen, EA, MAAA Enrolled Actuary #17-7778
By: _______________________________
Sara E. Carlson, ASA, EA, MAAA Enrolled Actuary #17-8546
Enclosures

TABLE OF CONTENTS
Section Title Page
I Introduction
a. Summary of Report 5
b. Changes Since Prior Valuation 7
c. Comparative Summary of PrincipalValuation Results 8
II Valuation Information
a. Reconciliation of Unfunded ActuarialAccrued Liabilities 14
b. Detailed Actuarial (Gain)/Loss Analysis 15
c. Actuarial Assumptions and Methods 16
d. Glossary 19
e. Discussion of Risk 20
f. Partial History of Premium Tax Refunds 23
III Trust Fund 24
IV Member Statistics
a. Statistical Data 31
b. Age and Service Distribution 32
c. Valuation Participant Reconciliation 33
V Summary of Current Plan 34
VI Governmental Accounting Standards Board Statements No. 67 and No. 68 Disclosure Information 37
City of North Port Firefighters' Pension - Local Option Trust Fund FOSTER & FOSTER | 4

SUMMARY OF REPORT
The regular annual actuarial valuation of the City of North Port Firefighters' Pension - Local Option Trust
Fund, performed as of October 1, 2019, has been completed and the results are presented in this Report.
The contribution amounts set forth herein are applicable to the plan/fiscal year ending September 30,
2021.
The contribution requirements, compared with those set forth in the January 28, 2020 actuarial impact
statement (determined as of October 1, 2018), are as follows:
Valuation Date 10/1/2019 10/1/2018 Applicable to Fiscal Year Ending 9/30/2021 9/30/2020
Minimum Required Contribution % of Projected Annual Payroll 32.59% 26.93%
Member Contributions (Est.) % of Projected Annual Payroll 10.60% 10.60%
City And State Required Contribution % of Projected Annual Payroll 21.99% 16.33% State Contribution (Est.) ¹ $250,000 $250,000 % of Projected Annual Payroll 6.81% 6.81% Preliminary City Required Contribution ¹ % of Projected Annual Payroll 15.18% 9.52% Balance from City ¹ % of Projected Annual Payroll 18.00% 18.00%
¹ The City may use up to $250,000 in State Contributions for determining its
minimum funding requirements (per Mutual Consent established between the City
and the Membership). However, by Local Ordinance, the City's minimum required
contribution is 18.00% of Active Member Pensionable Payroll.
As you can see, the Minimum Required Contribution shows an increase when compared to the prior year
results. The increase is attributable to lowering the investment return assumption. The increase was
offset in part by the impact of the 18% minimum City contribution over the otherwise actuarially
determined City contribution.
City of North Port Firefighters' Pension - Local Option Trust Fund FOSTER & FOSTER | 5

Plan experience was unfavorable overall on the basis of the plan's actuarial assumptions. Sources of
actuarial loss included less turnover than expected and more retirements than expected. These losses
were offset in part by gains associated with an average salary increase of 4.74% which fell short of the
5.62% assumption and an investment return of 7.74% (Actuarial Asset Basis) which exceeded the 7.50%
assumption.
City of North Port Firefighters' Pension - Local Option Trust Fund FOSTER & FOSTER | 6
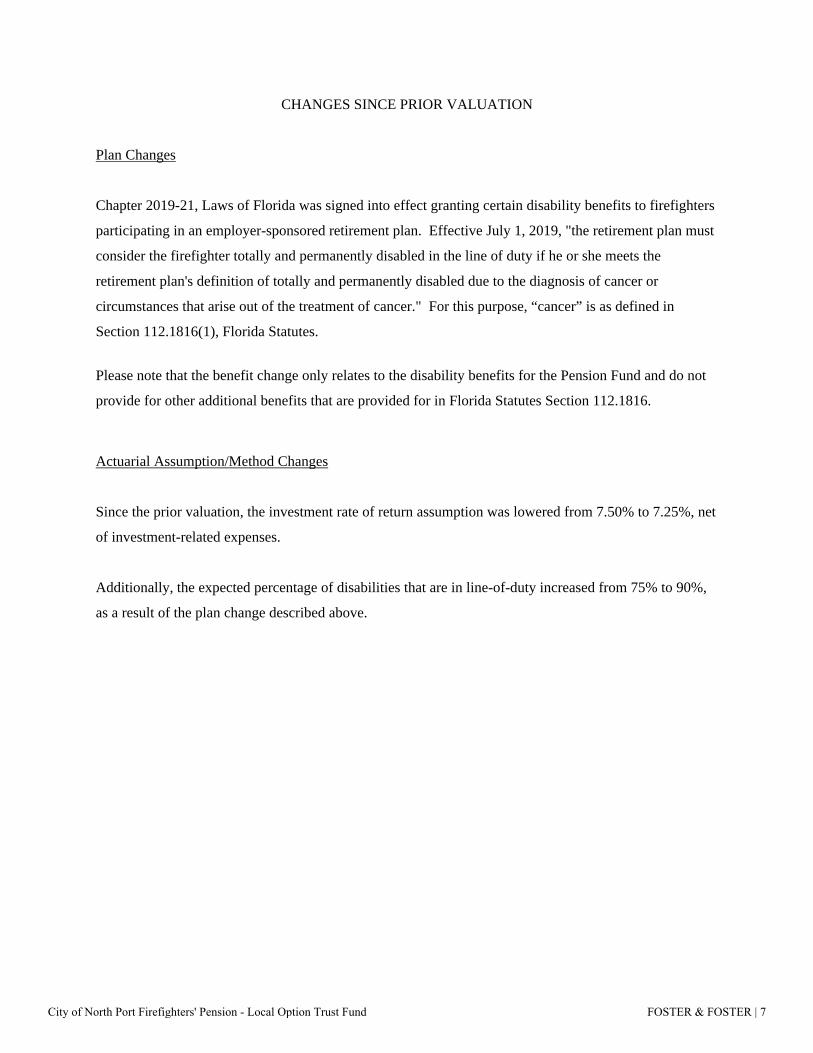
CHANGES SINCE PRIOR VALUATION Plan Changes
Chapter 2019-21, Laws of Florida was signed into effect granting certain disability benefits to firefighters
participating in an employer-sponsored retirement plan. Effective July 1, 2019, "the retirement plan must
consider the firefighter totally and permanently disabled in the line of duty if he or she meets the
retirement plan's definition of totally and permanently disabled due to the diagnosis of cancer or
circumstances that arise out of the treatment of cancer." For this purpose, “cancer” is as defined in
Section 112.1816(1), Florida Statutes.
Please note that the benefit change only relates to the disability benefits for the Pension Fund and do not
provide for other additional benefits that are provided for in Florida Statutes Section 112.1816.
Actuarial Assumption/Method Changes
Since the prior valuation, the investment rate of return assumption was lowered from 7.50% to 7.25%, net
of investment-related expenses.
Additionally, the expected percentage of disabilities that are in line-of-duty increased from 75% to 90%,
as a result of the plan change described above.
City of North Port Firefighters' Pension - Local Option Trust Fund FOSTER & FOSTER | 7

COMPARATIVE SUMMARY OF PRINCIPAL VALUATION RESULTS
New Assump Old Assump10/1/2019 10/1/2019 10/1/2018
A. Participant Data
Actives 38 38 42 Service Retirees 25 25 21 DROP Retirees 3 3 4 Beneficiaries 2 2 2 Disability Retirees 2 2 2 Terminated Vested 38 38 37
Total 108 108 108
Total Annual Payroll $3,672,140 $3,672,140 $3,919,097 Payroll Under Assumed Ret. Age 3,672,140 3,672,140 3,919,097
Annual Rate of Payments to: Service Retirees 1,422,596 1,422,596 1,069,324 DROP Retirees 175,164 175,164 253,094 Beneficiaries 162,408 162,408 157,677 Disability Retirees 81,494 81,494 81,494 Terminated Vested 599,628 599,628 563,186
B. Assets
Actuarial Value (AVA) ¹ 51,179,068 51,179,068 48,598,254 Market Value (MVA) ¹ 51,201,586 51,201,586 50,458,542
C. Liabilities
Present Value of Benefits Actives Retirement Benefits 19,847,629 18,923,144 20,520,679 Disability Benefits 204,122 196,939 201,645 Death Benefits 160,757 156,483 160,242 Vested Benefits 5,467,769 5,187,665 5,209,085 Refund of Contributions 7,854 7,850 21,585 Service Retirees 19,302,123 18,822,779 13,979,616 DROP Retirees ¹ 2,907,917 2,838,592 4,548,019 Beneficiaries 2,066,058 2,014,905 1,995,069 Disability Retirees 880,713 861,813 871,950 Terminated Vested 6,548,055 6,338,357 5,712,223 Share Plan Balances ¹ 1,806,009 1,806,009 1,902,599
Total 59,199,006 57,154,536 55,122,712
City of North Port Firefighters' Pension - Local Option Trust Fund FOSTER & FOSTER | 8

New Assump Old AssumpC. Liabilities - (Continued) 10/1/2019 10/1/2019 10/1/2018
Present Value of Future Salaries 27,280,964 26,978,616 28,358,489
Present Value of Future Member Contributions 2,891,782 2,859,733 3,006,000
Normal Cost (Retirement) 576,822 541,611 581,130 Normal Cost (Disability) 13,412 12,970 14,057 Normal Cost (Death) 6,310 6,076 6,774 Normal Cost (Vesting) 254,389 238,515 241,619 Normal Cost (Refunds) 3,482 3,471 7,598 Total Normal Cost 854,415 802,643 851,178
Present Value of Future Normal Costs 5,918,349 5,493,861 5,763,783
Accrued Liability (Retirement) 15,701,684 15,076,223 16,497,994 Accrued Liability (Disability) 108,898 105,913 106,005 Accrued Liability (Death) 114,963 112,898 114,250 Accrued Liability (Vesting) 3,840,870 3,679,806 3,621,857 Accrued Liability (Refunds) 3,367 3,380 9,347 Accrued Liability (Inactives) ¹ 31,704,866 30,876,446 27,106,877 Share Plan Balances ¹ 1,806,009 1,806,009 1,902,599 Total Actuarial Accrued Liability (EAN AL) 53,280,657 51,660,675 49,358,929
Unfunded Actuarial Accrued Liability (UAAL) 2,101,589 481,607 760,675
Funded Ratio (AVA / EAN AL) 96.1% 99.1% 98.5%
City of North Port Firefighters' Pension - Local Option Trust Fund FOSTER & FOSTER | 9

D. Actuarial Present Value of New Assump Old Assump Accrued Benefits 10/1/2019 10/1/2019 10/1/2018
Vested Accrued Benefits Inactives + Share Plan Balances ¹ 33,510,875 32,682,455 29,009,476 Actives 7,968,276 7,475,466 8,462,122 Member Contributions 3,788,219 3,788,219 3,970,322 Total 45,267,370 43,946,140 41,441,920
Non-vested Accrued Benefits 667,997 631,334 800,798 Total Present Value Accrued Benefits (PVAB) 45,935,367 44,577,474 42,242,718
Funded Ratio (MVA / PVAB) 111.5% 114.9% 119.4%
Increase (Decrease) in Present Value of Accrued Benefits Attributable to: Plan Amendments 0 0 Assumption Changes 1,357,893 0 Plan Experience 0 1,831,080 Benefits Paid 0 (2,568,220) Interest 0 3,071,896 Other 0 0 Total 1,357,893 2,334,756
City of North Port Firefighters' Pension - Local Option Trust Fund FOSTER & FOSTER | 10

New Assump Old AssumpValuation Date 10/1/2019 10/1/2019 10/1/2018Applicable to Fiscal Year Ending 9/30/2021 9/30/2021 9/30/2020
E. Pension Cost
Normal Cost (with interest) $885,388 $832,742 $883,097 % of Total Annual Payroll ² 24.11 22.68 22.53
Administrative Expenses (with interest) 82,021 82,120 89,430 % of Total Annual Payroll ² 2.23 2.24 2.28
Payment Required to Amortize Unfunded Actuarial Accrued Liability over 15 years (as of 10/1/2019, with interest) 229,680 55,841 83,169 % of Total Annual Payroll ² 6.25 1.52 2.12
Minimum Required Contribution 1,197,089 970,703 1,055,696 % of Total Annual Payroll ² 32.59 26.44 26.93
Expected Member Contributions 389,247 389,247 415,424 % of Total Annual Payroll ² 10.60 10.60 10.60
Expected City and State Contribution 807,842 581,456 640,272 % of Total Annual Payroll ² 21.99 15.84 16.33
F. Past Contributions
Plan Years Ending: 9/30/2019
City and State Requirement 588,557
Actual Contributions Made:
Members (excluding buyback) 401,719City 682,166State 250,000Total 1,333,885
G. Net Actuarial (Gain)/Loss 65,920
¹ The asset values and liabilities include accumulated DROP and Share Plan Balances as of9/30/2019 and 9/30/2018.
² Contributions developed as of 10/1/2019 are expressed as a percentage of totalannual payroll at 10/1/2019 of $3,672,140.
City of North Port Firefighters' Pension - Local Option Trust Fund FOSTER & FOSTER | 11

H. Schedule Illustrating the Amortization of the Total Unfunded Actuarial Accrued Liability as of:
Projected UnfundedYear Actuarial Accrued Liability
2019 2,101,5892020 2,016,2392021 1,924,7022024 1,608,313 2028 1,068,5902031 552,1712034 0
I. (i) 5 Year Comparison of Actual and Assumed Salary Increases
Actual Assumed
Year Ended 9/30/2019 4.74% 5.62%Year Ended 9/30/2018 8.90% 5.68%Year Ended 9/30/2017 6.52% 7.50%Year Ended 9/30/2016 2.94% 7.50%Year Ended 9/30/2015 2.87% 7.50%
(ii) 5 Year Comparison of Investment Return on Market Value and Actuarial Value
Market Value Actuarial Value Assumed
Year Ended 9/30/2019 3.75% 7.74% 7.50%Year Ended 9/30/2018 9.32% 7.04% 7.50%Year Ended 9/30/2017 10.78% 6.92% 8.00%Year Ended 9/30/2016 7.24% 7.76% 8.00%Year Ended 9/30/2015 1.09% 10.24% 8.00%
(iii) Average Annual Payroll Growth
(a) Payroll as of: 10/1/2019 $3,672,14010/1/2009 5,994,613
(b) Total Increase -38.74%
(c) Number of Years 10.00
(d) Average Annual Rate -4.78%
City of North Port Firefighters' Pension - Local Option Trust Fund FOSTER & FOSTER | 12

STATEMENT BY ENROLLED ACTUARY
This actuarial valuation was prepared and completed by me or under my direct supervision, and I
acknowledge responsibility for the results. To the best of my knowledge, the results are complete and
accurate, and in my opinion, the techniques and assumptions used are reasonable and meet the
requirements and intent of Part VII, Chapter 112, Florida Statutes. There is no benefit or expense to be
provided by the plan and/or paid from the plan's assets for which liabilities or current costs have not been
established or otherwise taken into account in the valuation. All known events or trends which may
require a material increase in plan costs or required contribution rates have been taken into account in the
valuation.
_____________________________
Douglas H. Lozen, EA, MAAA
Enrolled Actuary #17-7778
Please let us know when the report is approved by the Board and unless otherwise directed we will
provide copies of the report to the following offices to comply with Chapter 112, Florida Statutes:
Mr. Keith Brinkman
Bureau of Local
Retirement Systems
Post Office Box 9000
Tallahassee, FL 32315-9000
Mr. Steve Bardin
Municipal Police and Fire
Pension Trust Funds
Division of Retirement
Post Office Box 3010
Tallahassee, FL 32315-3010
City of North Port Firefighters' Pension - Local Option Trust Fund FOSTER & FOSTER | 13
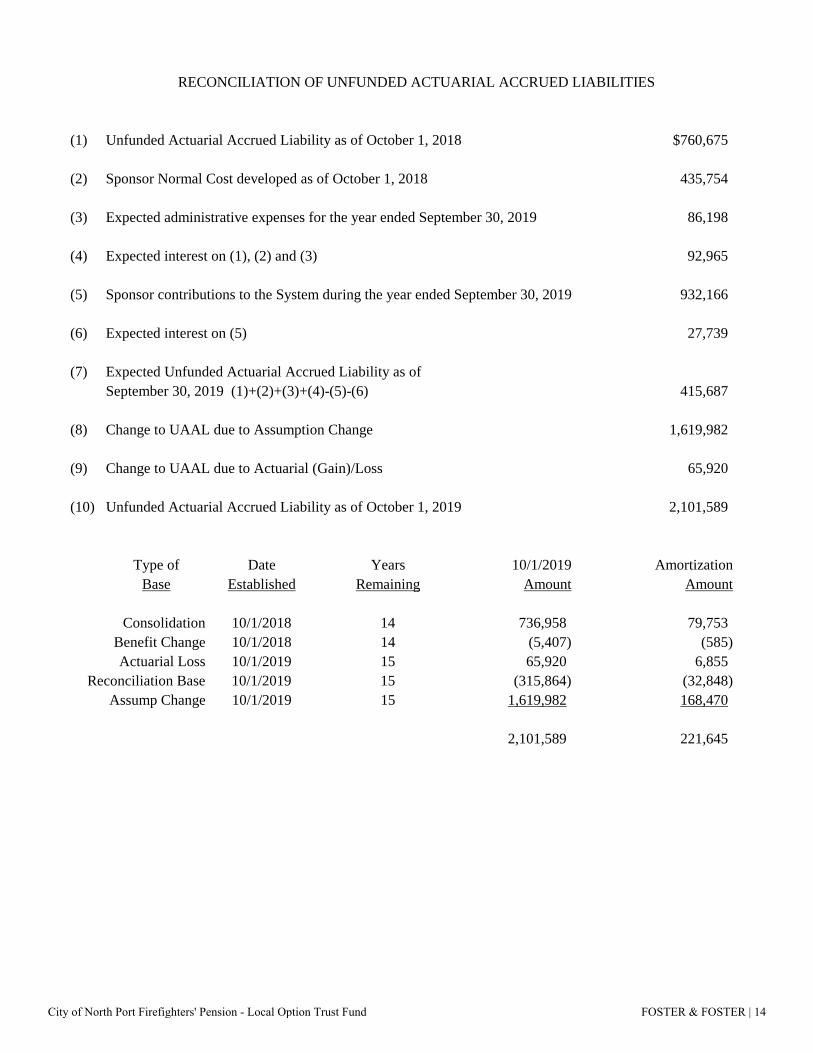
RECONCILIATION OF UNFUNDED ACTUARIAL ACCRUED LIABILITIES
(1) Unfunded Actuarial Accrued Liability as of October 1, 2018 $760,675
(2) Sponsor Normal Cost developed as of October 1, 2018 435,754
(3) Expected administrative expenses for the year ended September 30, 2019 86,198
(4) Expected interest on (1), (2) and (3) 92,965
(5) Sponsor contributions to the System during the year ended September 30, 2019 932,166
(6) Expected interest on (5) 27,739
(7) Expected Unfunded Actuarial Accrued Liability as ofSeptember 30, 2019 (1)+(2)+(3)+(4)-(5)-(6) 415,687
(8) Change to UAAL due to Assumption Change 1,619,982
(9) Change to UAAL due to Actuarial (Gain)/Loss 65,920
(10) Unfunded Actuarial Accrued Liability as of October 1, 2019 2,101,589
Type of Date Years 10/1/2019 AmortizationBase Established Remaining Amount Amount
Consolidation 10/1/2018 14 736,958 79,753Benefit Change 10/1/2018 14 (5,407) (585)Actuarial Loss 10/1/2019 15 65,920 6,855
Reconciliation Base 10/1/2019 15 (315,864) (32,848)Assump Change 10/1/2019 15 1,619,982 168,470
2,101,589 221,645
City of North Port Firefighters' Pension - Local Option Trust Fund FOSTER & FOSTER | 14

(1) Unfunded Actuarial Accrued Liability (UAAL) as of October 1, 2018 $760,675
(2) Expected UAAL as of October 1, 2019 415,687
(3) Summary of Actuarial (Gain)/Loss, by component:
Investment Return (Actuarial Asset Basis) (115,270)
Salary Increases (274,333)
Active Decrements 692,067
Inactive Mortality 97,785
Reconciliation Base (315,864)
Other (18,465)
Increase in UAAL due to (Gain)/Loss 65,920
Assumption Changes 1,619,982
(4) Actual UAAL as of October 1, 2019 $2,101,589
DETAILED ACTUARIAL (GAIN)/LOSS ANALYSIS
City of North Port Firefighters' Pension - Local Option Trust Fund FOSTER & FOSTER | 15
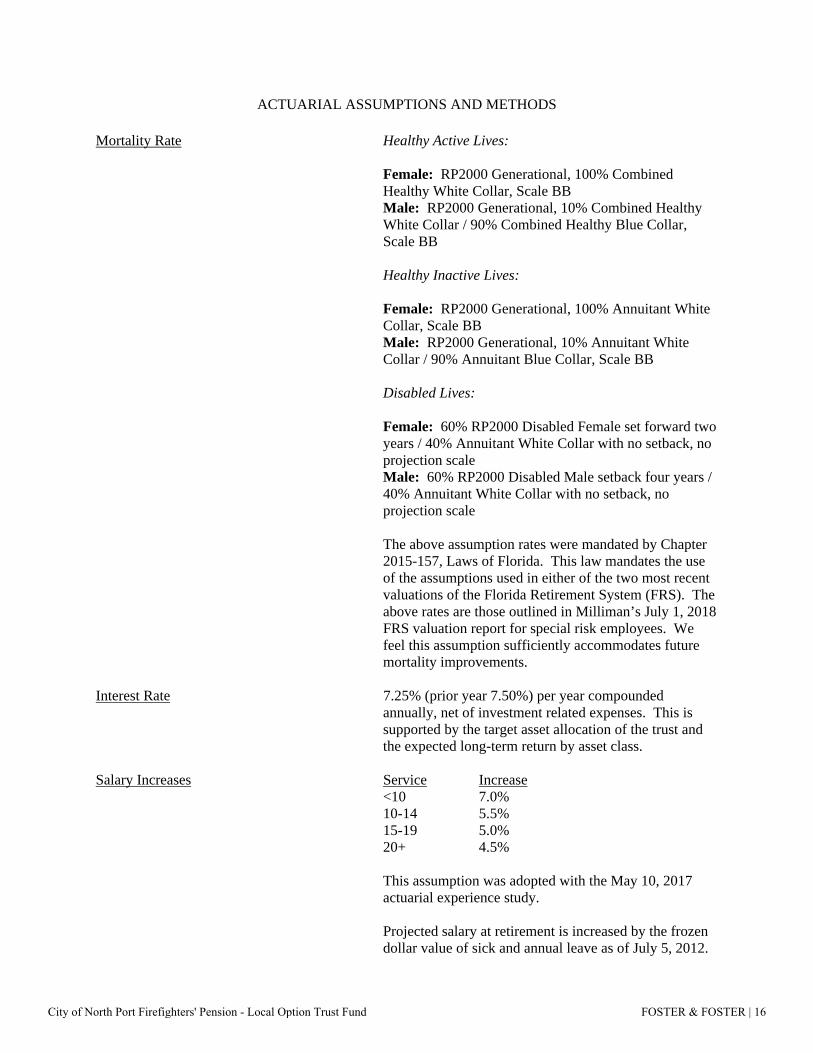
ACTUARIAL ASSUMPTIONS AND METHODS Mortality Rate Healthy Active Lives:
Female: RP2000 Generational, 100% Combined Healthy White Collar, Scale BB Male: RP2000 Generational, 10% Combined Healthy White Collar / 90% Combined Healthy Blue Collar, Scale BB Healthy Inactive Lives:
Female: RP2000 Generational, 100% Annuitant White Collar, Scale BB Male: RP2000 Generational, 10% Annuitant White Collar / 90% Annuitant Blue Collar, Scale BB Disabled Lives: Female: 60% RP2000 Disabled Female set forward two years / 40% Annuitant White Collar with no setback, no projection scale Male: 60% RP2000 Disabled Male setback four years / 40% Annuitant White Collar with no setback, no projection scale
The above assumption rates were mandated by Chapter
2015-157, Laws of Florida. This law mandates the use of the assumptions used in either of the two most recent valuations of the Florida Retirement System (FRS). The above rates are those outlined in Milliman’s July 1, 2018 FRS valuation report for special risk employees. We feel this assumption sufficiently accommodates future mortality improvements.
Interest Rate 7.25% (prior year 7.50%) per year compounded
annually, net of investment related expenses. This is supported by the target asset allocation of the trust and the expected long-term return by asset class.
Salary Increases Service Increase <10 7.0% 10-14 5.5% 15-19 5.0% 20+ 4.5%
This assumption was adopted with the May 10, 2017 actuarial experience study.
Projected salary at retirement is increased by the frozen dollar value of sick and annual leave as of July 5, 2012.
City of North Port Firefighters' Pension - Local Option Trust Fund FOSTER & FOSTER | 16

Payroll Growth 0.00% for purposes of amortizing the Unfunded Actuarial Accrued Liability. This assumption cannot exceed the ten-year average payroll growth, in compliance with Part VII of Chapter 112, Florida Statutes.
Administrative Expenses $79,152 annually, based on the average of actual
expenses incurred in the prior two fiscal years. Previously, the actual expense in the prior fiscal year was used. Using a two-year average results in a less volatile estimate than the prior method.
Retirement Age Service Age Assumed Rate <25 50-51 10.0% 52-53 25.0% 54-57 50.0% 58+ 100.0% 25+ 50 5.0% 51 50.0% 52+ 100.0%
This assumption was adopted in conjunction with the May 10, 2017 actuarial experience study.
Termination Rate Service Age Rate <5 20-24 10.0% 25-29 7.0% 30-49 6.0% 50-54 1.0% 55+ 0.1% 5+ 20-44 6.0% 45-49 5.0% 50-54 1.0% 55+ 0.1%
This assumption was adopted with the May 10, 2017 actuarial experience study.
Disability Rate See sample rates in table below. It is assumed that 90%
(prior year 75%) of disablements are service related. These rates are consistent with the other Florida municipal special risk retirement Plans and was determined reasonable with the May 10, 2017 actuarial experience study.
% Becoming Disabled
Age During the Year
20 0.03% 30 0.04 40 0.07 50 0.18
City of North Port Firefighters' Pension - Local Option Trust Fund FOSTER & FOSTER | 17

Asset Valuation Method Each year, the prior Actuarial Value of Assets is brought forward utilizing the historical geometric 4-year average Market Value return. It is possible that over time this technique will produce an insignificant bias above or below Market Value.
Funding Method Entry Age Normal Actuarial Cost Method.
Amortization Method New UAAL amortization bases are amortized over 15 years.
City of North Port Firefighters' Pension - Local Option Trust Fund FOSTER & FOSTER | 18

GLOSSARY
Total Annual Payroll is the projected annual rate of pay as of the valuation date for all covered Members. Present Value of Benefits is the single sum value on the valuation date of all future benefits to be paid to current Members, Retirees, Beneficiaries, Disability Retirees and Vested Terminations. Total Required Contribution is equal to the Normal Cost plus an amount sufficient to amortize the Unfunded Accrued Liability over no more than 30 years. The required amount is adjusted for interest according to the timing of contributions during the year. Entry Age Normal Cost Method - Under this method, the normal cost is the sum of the individual normal costs for all active participants. For an active participant, the normal cost is the participant’s normal cost accrual rate, multiplied by the participant’s current compensation.
(a) The normal cost accrual rate equals (i) the present value of future benefits for the participant, determined as of the participant’s entry age, divided by (ii) the present value of the compensation expected to be paid to the participant for each year of the participant’s anticipated future service, determined as of the participant’s entry age.
(b) In calculating the present value of future compensation, the salary scale is applied both
retrospectively and prospectively to estimate compensation in years prior to and subsequent to the valuation year based on the compensation used for the valuation.
(c) The accrued liability is the sum of the individual accrued liabilities for all participants and
beneficiaries. A participant’s accrued liability equals the present value, at the participant’s attained age, of future benefits less the present value at the participant’s attained age of the individual normal costs payable in the future. A beneficiary’s accrued liability equals the present value, at the beneficiary’s attained age, of future benefits. The unfunded accrued liability equals the total accrued liability less the actuarial value of assets.
(d) Under this method, the entry age used for each active participant is the participant’s age at the time
he or she would have commenced participation if the plan had always been in existence under current terms, or the age as of which he or she first earns service credits for purposes of benefit accrual under the current terms of the plan.
Unfunded Actuarial Accrued Liability (UAAL) is the difference between the actuarial accrued liability (described above) and the actuarial value of assets. Under the Entry Age Normal Actuarial Cost Method, an actuarial gain or loss, based on actual versus expected UAAL, is determined in conjunction with each valuation of the plan.
City of North Port Firefighters' Pension - Local Option Trust Fund FOSTER & FOSTER | 19
DISCUSSION OF RISK
ASOP No. 51, Assessment and Disclosure of Risk Associated with Measuring Pension Obligations and Determining Pension Plan Contributions, states that the actuary should identify risks that, in the actuary’s professional judgment, may reasonably be anticipated to significantly affect the plan’s future financial condition.
Throughout this report, actuarial results are determined using various actuarial assumptions. These results are based on the premise that all future plan experience will align with the plan’s actuarial assumptions; however, there is no guarantee that actual plan experience will align with the plan’s assumptions. It is possible that actual plan experience will differ from anticipated experience in an unfavorable manner that will negatively impact the plan’s funded position.
Below are examples of ways in which plan experience can deviate from assumptions and the potential impact of that deviation. Typically, this results in an actuarial gain or loss representing the current-year financial impact on the plan’s unfunded liability of the experience differing from assumptions; this gain or loss is amortized over a period of time determined by the plan’s amortization method. When assumptions are selected that adequately reflect plan experience, gains and losses typically offset one another in the long term, resulting in a relatively low impact on the plan’s contribution requirements associated with plan experience. When assumptions are too optimistic, losses can accumulate over time and the plan’s amortization payment could potentially grow to an unmanageable level.
• Investment Return: When the rate of return on the Actuarial Value of Assets falls short of the assumption, this produces a loss representing assumed investment earnings that were not realized. Further, it is unlikely that the plan will experience a scenario that matches the assumed return in each year as capital markets can be volatile from year to year. Therefore, contribution amounts can vary in the future.
• Salary Increases: When a plan participant experiences a salary increase that was greater than assumed, this produces a loss representing the cost of an increase in anticipated plan benefits for the participant as compared to the previous year. The total gain or loss associated with salary increases for the plan is the sum of salary gains and losses for all active participants.
• Demographic Assumptions: Actuarial results take into account various potential events that could happen to a plan participant, such as retirement, termination, disability, and death. Each of these potential events is assigned a liability based on the likelihood of the event and the financial consequence of the event for the plan. Accordingly, actuarial liabilities reflect a blend of financial consequences associated with various possible outcomes (such as retirement at one of various possible ages). Once the outcome is known (e.g. the participant retires) the liability is adjusted to reflect the known outcome. This adjustment produces a gain or loss depending on whether the outcome was more or less favorable than other outcomes that could have occurred.
City of North Port Firefighters' Pension - Local Option Trust Fund FOSTER & FOSTER | 20

Impact of Plan Maturity on Risk
For newer pension plans, most of the participants and associated liabilities are related to active members who have not yet reached retirement age. As pension plans continue in operation and active members reach retirement ages, liabilities begin to shift from being primarily related to active members to being shared amongst active and retired members. Plan maturity is a measure of the extent to which this shift has occurred. It is important to understand that plan maturity can have an impact on risk tolerance and the overall risk characteristics of the plan. For example, closed plans with a large amount of retired liability do not have as long of a time horizon to recover from losses (such as losses on investments due to lower than expected investment returns) as plans where the majority of the liability is attributable to active members. For this reason, less tolerance for investment risk may be warranted for highly mature closed plans with a substantial inactive liability. Similarly, mature closed plans paying substantial retirement benefits resulting in a small positive or net negative cash flow can be more sensitive to near term investment volatility, particularly if the size of the fund is shrinking, which can result in less assets being available for investment in the market.
To assist with determining the maturity of the plan, we have provided some relevant metrics in the table following titled “Plan Maturity Measures and Other Risk Metrics”. Highlights of this information are discussed below:
• The Support Ratio, determined as the ratio of active to inactive members, has decreased from 119.5% on October 1, 2016 to 77.6% on October 1, 2019, indicating that the plan has been maturing during the period.
• The Accrued Liability Ratio, determined as the ratio of the Inactive Accrued Liability, which is the liability associated with members who are no longer employed but are due a benefit from the plan, to the Total Accrued Liability, is 59.5%. With a plan of this maturity, losses due to lower than expected investment returns or demographic factors may result in larger increases in contribution requirements than would be needed for a less mature plan. Please note Chapter 112, Florida Statutes, requires that the plan sponsor contributes the minimum required contribution; thus, there is minimal solvency risk to the plan.
• The Funded Ratio, determined as the ratio of the Actuarial Value of Assets to the Total Accrued Liability, has decreased from 101.2% on October 1, 2016 to 96.1% on October 1, 2019.
• The Net Cash Flow Ratio, determined as the ratio of the Net Cash Flow (contributions minus benefit payments and administrative expenses) to the Market Value of Assets, decreased from 1.7% on October 1, 2016 to -2.2% on October 1, 2019. The current Net Cash Flow Ratio of-2.2% indicates that contributions are not currently covering the plan's benefit payments and administrative expenses.
It is important to note that the actuary has identified the risks in this section as the most significant risks based on the characteristics of the plan and the nature of the project, however, it is not an exhaustive list of potential risks that could be considered. Additional advanced modeling, as well as the identification of additional risks, can be provided at the request of the audience addressed on page 2 of this report.
City of North Port Firefighters' Pension - Local Option Trust Fund FOSTER & FOSTER | 21

PLAN MATURITY MEASURES AND OTHER RISK METRICS
10/1/2016 10/1/2017 10/1/2018 10/1/2019
Support Ratio
Total Actives 49 44 42 38Total Inactives ¹ 41 44 45 49Actives / Inactives ¹ 119.5% 100.0% 93.3% 77.6%
Asset Volatility Ratio
Market Value of Assets (MVA) 42,346,454 47,046,321 50,458,542 51,201,586Total Annual Payroll 4,073,329 3,776,235 3,919,097 3,672,140MVA / Total Annual Payroll 1,039.6% 1,245.9% 1,287.5% 1,394.3%
Accrued Liability (AL) Ratio
Inactive Accrued Liability 21,101,100 26,552,074 27,106,877 31,704,866Total Accrued Liability (EAN) 42,608,830 46,397,844 49,358,929 53,280,657Inactive AL / Total AL 49.5% 57.2% 54.9% 59.5%
Funded Ratio
Actuarial Value of Assets (AVA) 43,129,328 46,276,059 48,598,254 51,179,068Total Accrued Liability (EAN) 42,608,830 46,397,844 49,358,929 53,280,657AVA / Total Accrued Liability (EAN) 101.2% 99.7% 98.5% 96.1%
Net Cash Flow RatioNet Cash Flow ² 717,314 154,724 (904,961) (1,136,643)Market Value of Assets (MVA) 42,346,454 47,046,321 50,458,542 51,201,586Ratio 1.7% 0.3% -1.8% -2.2%
¹ Excludes terminated participants awaiting a refund of member contributions.
² Determined as total contributions minus benefit payments and administrative expenses.
City of North Port Firefighters' Pension - Local Option Trust Fund FOSTER & FOSTER | 22

PARTIAL HISTORY OF PREMIUM TAX REFUNDS
Received During Increase fromFiscal Year Amount Previous Year
1998 52,606.60 _____%
1999 55,358.60 5.2%
2000 68,338.10 23.4%
2001 68,311.30 0.0%
2002 92,515.40 35.4%
2003 101,562.23 9.8%
2004 127,554.50 25.6%
2005 166,534.47 30.6%
2006 242,082.84 45.4%
2007 284,870.08 17.7%
2008 486,956.22 70.9%
2009 388,871.03 -20.1%
2010 400,984.42 3.1%
2011 399,175.25 -0.5%
2012 425,380.30 6.6%
2013 403,183.26 -5.2%
2014 387,316.25 -3.9%
2015 376,215.34 -2.9%
2016 371,775.04 -1.2%
2017 376,129.17 1.2%
2018 414,503.01 10.2%
2019 419,797.03 1.3%
City of North Port Firefighters' Pension - Local Option Trust Fund FOSTER & FOSTER | 23

ASSETS COST VALUE MARKET VALUECash and Cash Equivalents: Short Term Investments 433,018.01 433,018.01 Cash (25,143.59) (25,143.59)
Total Cash and Equivalents 407,874.42 407,874.42
Receivables: City Contributions in Transit 147,402.08 147,402.08 Investment Income 22,106.99 22,106.99
Total Receivable 169,509.07 169,509.07
Investments: Mutual Funds: Fixed Income 15,583,157.32 15,619,816.81 Equity 24,788,043.04 29,652,672.05 Pooled/Common/Commingled Funds: Real Estate 4,468,478.75 5,364,208.77
Total Investments 44,839,679.11 50,636,697.63
Total Assets 45,417,062.60 51,214,081.12
LIABILITIES Payables: Investment Expenses 6,855.83 6,855.83 Administrative Expenses 4,302.40 4,302.40 Prior Refund Payable 1,337.11 1,337.11
Total Liabilities 12,495.34 12,495.34
NET POSITION RESTRICTED FOR PENSIONS 45,404,567.26 51,201,585.78
STATEMENT OF FIDUCIARY NET POSITIONSEPTEMBER 30, 2019
City of North Port Firefighters' Pension - Local Option Trust Fund FOSTER & FOSTER | 24

STATEMENT OF CHANGES IN FIDUCIARY NET POSITIONFOR THE YEAR ENDED SEPTEMBER 30, 2019
Market Value Basis
ADDITIONSContributions: Member 401,719.19 City 682,165.61 State 419,797.03
Total Contributions 1,503,681.83
Investment Income: Net Realized Gain (Loss) 842,431.88 Unrealized Gain (Loss) (779,582.74) Net Increase in Fair Value of Investments 62,849.14 Interest & Dividends 1,934,551.10 Less Investment Expense¹ (117,714.01)
Net Investment Income 1,879,686.23
Total Additions 3,383,368.06
DEDUCTIONSDistributions to Members: Benefit Payments 1,385,890.01 Lump Sum DROP Distributions 856,802.37 Lump Sum Share Distributions 325,527.29 Refunds of Member Contributions 0.00
Total Distributions 2,568,219.67
Administrative Expense 72,104.87
Total Deductions 2,640,324.54
Net Increase in Net Position 743,043.52
NET POSITION RESTRICTED FOR PENSIONSBeginning of the Year 50,458,542.26
End of the Year 51,201,585.78
¹Investment related expenses include investment advisory, custodial and performance monitoring fees.
City of North Port Firefighters' Pension - Local Option Trust Fund FOSTER & FOSTER | 25

ACTUARIAL ASSET VALUATIONSEPTEMBER 30, 2019
Actuarial Assets for funding purposes are developed by increasing the Actuarial Assets used in the most recent actuarial valuation of the Fund by the average annual market value rate of return (net of investment related expenses) for the past four years. Actuarial Assets shall not be less than 80% nor greater than 120% of Market Value of Assets.
Details of the derivation are set forth as follows:
Plan Year End Rate of Return¹
09/30/2016 7.24%
09/30/2017 10.78%
09/30/2018 9.32%
09/30/2019 3.75%
Annualized Rate of Return for prior four (4) years: 7.74%
(A) 10/01/2018 Actuarial Assets: $48,598,253.59
(I) Net Investment Income:
1. Interest and Dividends 1,934,551.10 2. Realized Gains (Losses) 842,431.88 3. Unrealized Gains (Losses) (779,582.74) 4. Change in Actuarial Value 1,837,771.24 5. Investment Related Expenses (117,714.01)
Total 3,717,457.47
(B) 10/01/2019 Actuarial Assets: $51,179,068.35
Actuarial Asset Rate of Return = 2I/(A+B-I): 7.74%
10/01/2019 Limited Actuarial Assets: $51,179,068.35
10/01/2019 Market Value of Assets: $51,201,585.78
Actuarial Gain/(Loss) due to Investment Return (Actuarial Asset Basis) $115,270.00
¹Market Value Basis, net of investment related expenses.
City of North Port Firefighters' Pension - Local Option Trust Fund FOSTER & FOSTER | 26

SEPTEMBER 30, 2019Actuarial Asset Basis
REVENUESContributions: Member 401,719.19 City 682,165.61 State 419,797.03
Total Contributions 1,503,681.83
Earnings from Investments: Interest & Dividends 1,934,551.10 Net Realized Gain (Loss) 842,431.88 Unrealized Gain (Loss) (779,582.74) Change in Actuarial Value 1,837,771.24
Total Earnings and Investment Gains 3,835,171.48
EXPENDITURESDistributions to Members: Benefit Payments 1,385,890.01 Lump Sum DROP Distributions 856,802.37 Lump Sum Share Distributions 325,527.29 Refunds of Member Contributions 0.00
Total Distributions 2,568,219.67
Expenses: Investment related¹ 117,714.01 Administrative 72,104.87
Total Expenses 189,818.88
Change in Net Assets for the Year 2,580,814.76
Net Assets Beginning of the Year 48,598,253.59
Net Assets End of the Year² 51,179,068.35
¹Investment related expenses include investment advisory, custodial and performance monitoring fees.²Net Assets may be limited for actuarial consideration.
CHANGES IN NET ASSETS AVAILABLE FOR BENEFITS
City of North Port Firefighters' Pension - Local Option Trust Fund FOSTER & FOSTER | 27
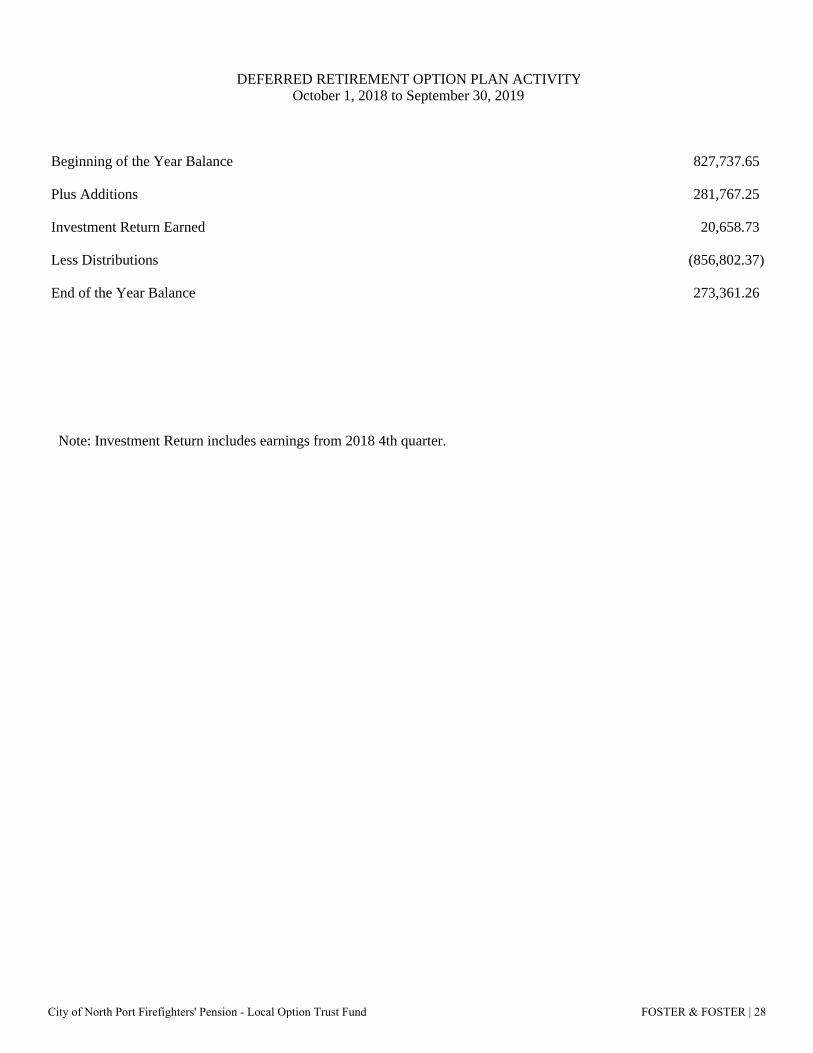
Beginning of the Year Balance 827,737.65
Plus Additions 281,767.25
Investment Return Earned 20,658.73
Less Distributions (856,802.37)
End of the Year Balance 273,361.26
Note: Investment Return includes earnings from 2018 4th quarter.
DEFERRED RETIREMENT OPTION PLAN ACTIVITYOctober 1, 2018 to September 30, 2019
City of North Port Firefighters' Pension - Local Option Trust Fund FOSTER & FOSTER | 28

9/30/2018 Balance 1,902,599.31
Plus Additions 169,797.03
Investment Return Earned (est.) 59,140.20
Administrative Fees 0.00
Less Distributions (325,527.29)
9/30/2019 Balance (est.) 1,806,009.25
SUPPLEMENTAL CHAPTER 175 SHARE PLAN ACTIVITYOctober 1, 2018 through September 30, 2019
City of North Port Firefighters' Pension - Local Option Trust Fund FOSTER & FOSTER | 29

(0) Total Required Contribution Rate 26.13%
(0) Pensionable Payroll Derived from Member Contributions $3,789,803.68
(1) Total Required Contribution (1) x (2) 990,275.70
(2) Less Actual Member Contributions (401,719.19)
(3) Less Allowable State Contribution (250,000.00)
(4) Equals Required City Contribution for Fiscal 2019(Prior to 18% Minimum City Contribution by Ordinance) 338,556.51
(5) Less 2018 Prepaid Contribution 0.00
(6) Less Actual City Contributions (682,165.61)
(7) City Contributions in Excess of Minimum Requirement Applied to Reduce ($343,609.10)Unfunded Actuarial Accrued Liability as of September 30, 2019
CITY CONTRIBUTIONS IN EXCESS OF MINIMUM REQUIREMENTFOR THE FISCAL YEAR ENDED (FYE) SEPTEMBER 30, 2019
City of North Port Firefighters' Pension - Local Option Trust Fund FOSTER & FOSTER | 30
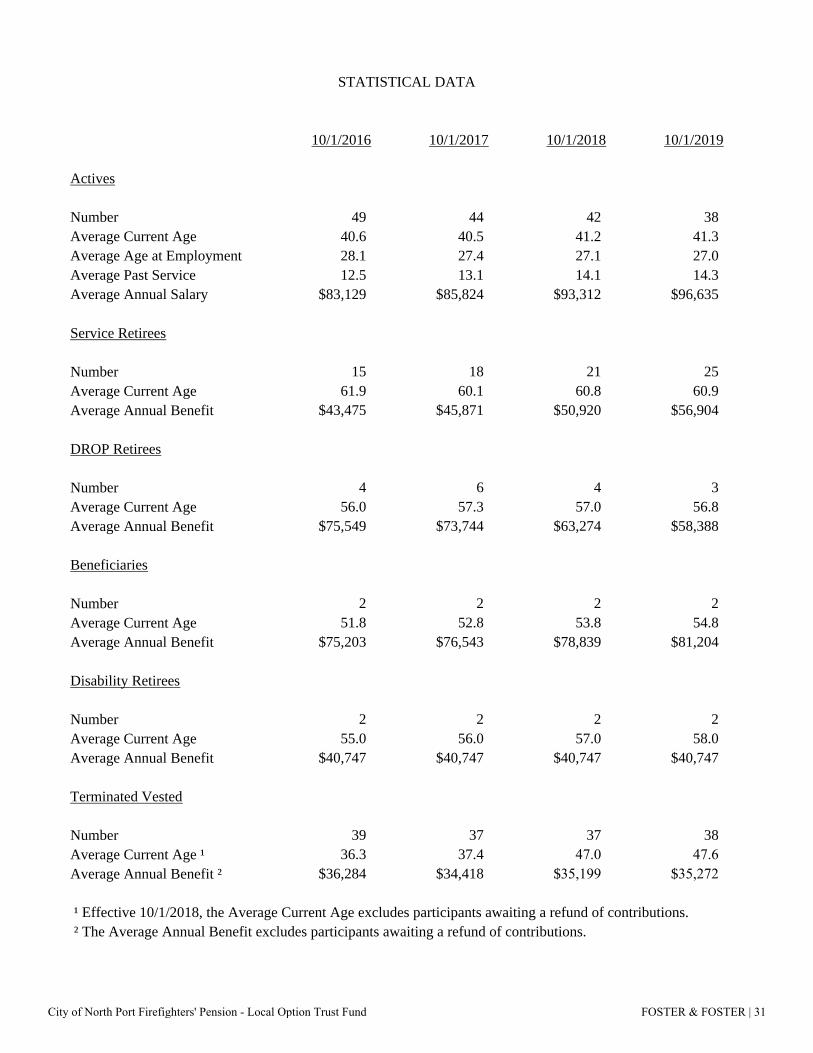
STATISTICAL DATA
10/1/2016 10/1/2017 10/1/2018 10/1/2019
Actives
Number 49 44 42 38Average Current Age 40.6 40.5 41.2 41.3Average Age at Employment 28.1 27.4 27.1 27.0Average Past Service 12.5 13.1 14.1 14.3Average Annual Salary $83,129 $85,824 $93,312 $96,635
Service Retirees
Number 15 18 21 25Average Current Age 61.9 60.1 60.8 60.9Average Annual Benefit $43,475 $45,871 $50,920 $56,904
DROP Retirees
Number 4 6 4 3Average Current Age 56.0 57.3 57.0 56.8Average Annual Benefit $75,549 $73,744 $63,274 $58,388
Beneficiaries
Number 2 2 2 2Average Current Age 51.8 52.8 53.8 54.8Average Annual Benefit $75,203 $76,543 $78,839 $81,204
Disability Retirees
Number 2 2 2 2Average Current Age 55.0 56.0 57.0 58.0Average Annual Benefit $40,747 $40,747 $40,747 $40,747
Terminated Vested
Number 39 37 37 38Average Current Age ¹ 36.3 37.4 47.0 47.6Average Annual Benefit ² $36,284 $34,418 $35,199 $35,272
¹ Effective 10/1/2018, the Average Current Age excludes participants awaiting a refund of contributions. ² The Average Annual Benefit excludes participants awaiting a refund of contributions.
City of North Port Firefighters' Pension - Local Option Trust Fund FOSTER & FOSTER | 31

AGE AND SERVICE DISTRIBUTION
PAST SERVICE
AGE 0 1 2 3 4 5-9 10-14 15-19 20-24 25-29 30+ Total
15 - 19 0 0 0 0 0 0 0 0 0 0 0 0
20 - 24 0 0 0 0 0 0 0 0 0 0 0 0
25 - 29 0 0 0 0 0 0 0 0 0 0 0 0
30 - 34 0 0 0 0 0 1 3 0 0 0 0 4
35 - 39 0 0 0 0 0 0 12 1 0 0 0 13
40 - 44 0 0 0 0 0 2 7 0 0 0 0 9
45 - 49 0 0 0 0 0 0 4 3 2 2 0 11
50 - 54 0 0 0 0 0 0 0 0 0 0 0 0
55 - 59 0 0 0 0 0 0 1 0 0 0 0 1
60 - 64 0 0 0 0 0 0 0 0 0 0 0 0
65+ 0 0 0 0 0 0 0 0 0 0 0 0
Total 0 0 0 0 0 3 27 4 2 2 0 38
City of North Port Firefighters' Pension - Local Option Trust Fund FOSTER & FOSTER | 32

VALUATION PARTICIPANT RECONCILIATION
1. Active lives
a. Number in prior valuation 10/1/2018 42
b. Terminations i. Vested (partial or full) with deferred annuity (1) ii. Vested in refund of member contributions only 0 iii. Refund of member contributions or full lump sum distribution received 0 c. Deaths i. Beneficiary receiving benefits 0 ii. No future benefits payable 0 d. Disabled 0 e. Retired (2) f. DROP (1) g. Continuing participants 38 h. New entrants 0 i. Total active life participants in valuation 38
2. Non-Active lives (including beneficiaries receiving benefits)
ServiceRetirees,Vested Receiving Receiving Vested Vested
Receiving DROP Death Disability (Deferred (Due Benefits Benefits Benefits Benefits Annuity) Refund) Total
a. Number prior valuation 21 4 2 2 16 21 66
Retired 4 (2) 0 0 0 0 2DROP 0 1 0 0 0 0 1Vested (Deferred Annuity) 0 0 0 0 1 0 1Vested (Due Refund) 0 0 0 0 0 0 0Hired/Terminated in Same Year 0 0 0 0 0 0 0Death, With Survivor 0 0 0 0 0 0 0Death, No Survivor 0 0 0 0 0 0 0Disabled 0 0 0 0 0 0 0Refund of Contributions 0 0 0 0 0 0 0Rehires 0 0 0 0 0 0 0Expired Annuities 0 0 0 0 0 0 0Data Corrections 0 0 0 0 0 0 0
b. Number current valuation 25 3 2 2 17 21 70
City of North Port Firefighters' Pension - Local Option Trust Fund FOSTER & FOSTER | 33

SUMMARY OF CURRENT PLAN (Through Ordinance 2018-17)
Original Plan Effective Date November 5, 1974 Latest Amendment April 24, 2018 Eligibility Full-time employees who are classified as full-time
Firefighters shall participate in the System as a condition of employment. Firefighters on or after May 10, 2016 shall participate in the Florida Retirement System. Members active on May 10, 2016 had the option of participating prospectively in the Florida Retirement System.
Credited Service Total years and fractional parts of years of employment
with the City as a firefighter. Salary W-2 Compensation plus tax deferred or tax sheltered
items of income. Effective July 5, 2012 Salary includes up to 300 hours of overtime per fiscal year and only the dollar value of accrued sick and annual leave as of July 5, 2012 is included.
Average Final Compensation Average Salary for the highest 5 years. Previously,
there was a ten-year lookback period for determining this average.
Member Contributions 10.6% of Salary.
City and State Contributions Remaining amount required in order to pay current costs
and amortize unfunded past service cost, if any, as provided in Part VII of Florida Statutes, Chapter 112. In no event will the City’s contribution be less than 18% of the total salary of plan Members.
Normal Retirement
Date Earlier of age 55 and 10 years of Credited Service or age
52 and 25 years of Credited Service.
Benefit 3.50% of Average Final Compensation times Credited Service (3.0% for those hired on and after October 12, 2012).
Form of Benefit Ten Year Certain and Life Annuity (options available).
Cost of Living Allowance Service retirees, vested terminated members, and their
beneficiaries receive annual 3.0% benefit increases beginning at age 55 and ceasing at age 63.
City of North Port Firefighters' Pension - Local Option Trust Fund FOSTER & FOSTER | 34

Early Retirement
Eligibility Age 50 and 10 Years of Credited Service. Benefit Accrued benefit, reduced according to the following schedule:
Credited Service at time of Termination or Retirement
Percent per Year Reduction
Less than 15 years 3% At least 15, but less than 20 years 2% 20 or more years 1%
Vesting
Schedule 100% after 10 years of Credited Service.
Benefit Amount Member will receive the vested portion of his
(her) accrued benefit payable at the otherwise Normal Retirement Date.
Disability
Eligibility
Service Incurred Covered from Date of Employment. Non-Service Incurred 10 years of Credited Service.
Exclusions Disability resulting from use of drugs, illegal
participation in riots, service in military, etc.
Benefit Benefit accrued to date of disability. For Service Incurred, not less than 42% of Average Final Compensation.
Duration Payable as a 10 Year Certain and Life Annuity or until recovery (as determined by the Board; optional forms available).
Death Benefits
Pre-Retirement
Vested Monthly accrued benefit payable to designated
beneficiary for 10 years.
Non-Vested Refund of accumulated contributions, without
City of North Port Firefighters' Pension - Local Option Trust Fund FOSTER & FOSTER | 35

Non-Vested Refund of accumulated contributions, without interest.
Post-Retirement Benefits payable to beneficiary in accordance with
option selected at retirement. Board of Trustees a. Two Commission appointees,
b. Two Members of the Department elected by the membership, and
c. Fifth Member elected by other 4 and appointed by the City Commission.
Deferred Retirement Option Plan
Eligibility Satisfaction of Normal Retirement requirements (earlier of (1) Age 55 with 10 years of Credited Service, or (2) Age 52 with 25 years of Credited Service).
Participation Not to exceed 60 months.
Rate of Return At the Member’s election: (1) 1.0% annual rate, or (2)
actual net rate of investment return (total return net of brokerage commissions, management fees, and transaction costs), credited each fiscal quarter. One change between the above options is allowed.
Form of Distribution Cash lump sum (options available) at termination of
employment. Supplemental Retirement Benefit
Initial Crediting The Share Account of each active firefighter and retiree who was an employee and a member of the Plan between December 1, 2005 and September 30, 2012 shall receive one share for each month of credited service from date of hire through September 30, 2012.
Annual Crediting For plan years beginning October 1, 2012 and later,
premium tax revenues received by the City each year in excess of the $250,000 applicable frozen amount shall be allocated to each Members share account.
Investment earnings Effective December 31, 2013, and each December 31
thereafter, each share account shall be credited or debited with earnings or losses based upon the amount in the share account at the close of the immediately preceding plan year at a rate equal to the net of fees return for the Pension Plan for the preceding plan year.
City of North Port Firefighters' Pension - Local Option Trust Fund FOSTER & FOSTER | 36

GASB 67STATEMENT OF FIDUCIARY NET POSITION
SEPTEMBER 30, 2019
ASSETSCash and Cash Equivalents: Short Term Investments Cash
Total Cash and Equivalents
Receivables: City Contributions in Transit Investment Income
Total Receivable
Investments: Mutual Funds: Fixed Income Equity Real Estate
Total Investments
Total Assets
LIABILITIES Payables: Investment Expenses Administrative Expenses Prior Refund Payable
Total Liabilities
NET POSITION RESTRICTED FOR PENSIONS
MARKET VALUE
433,018(25,144)
407,874
147,40222,107
169,509
15,619,81729,652,672
5,364,209
50,636,698
51,214,081
6,8564,3021,337
12,495
51,201,586
City of North Port Firefighters' Pension - Local Option Trust Fund FOSTER & FOSTER | 37

GASB 67
ADDITIONSContributions: Member 401,719 City 682,166 State 419,797
Total Contributions 1,503,682
Investment Income: Net Increase in Fair Value of Investments 62,849 Interest & Dividends 1,934,551 Less Investment Expense¹ (117,714)
Net Investment Income 1,879,686
Total Additions 3,383,368
DEDUCTIONSDistributions to Members: Benefit Payments 1,385,890 Lump Sum DROP Distributions 856,802 Lump Sum Share Distributions 325,527 Refunds of Member Contributions 0
Total Distributions 2,568,219
Administrative Expense 72,105
Total Deductions 2,640,324
Net Increase in Net Position 743,044
NET POSITION RESTRICTED FOR PENSIONSBeginning of the Year 50,458,542
End of the Year 51,201,586
¹Investment related expenses include investment advisory, custodial and performance monitoring fees.
STATEMENT OF CHANGES IN FIDUCIARY NET POSITIONFOR THE YEAR ENDED SEPTEMBER 30, 2019
Market Value Basis
City of North Port Firefighters' Pension - Local Option Trust Fund FOSTER & FOSTER | 38

GASB 67
Plan Description
Plan Administration
Plan Membership as of October 1, 2018:
Inactive Plan Members or Beneficiaries Currently Receiving Benefits 29 Inactive Plan Members Entitled to But Not Yet Receiving Benefits 37 Active Plan Members 42
108
Benefits Provided
ContributionsMember Contributions: 10.6% of Salary.
InvestmentsInvestment Policy:The following was the Board's adopted asset allocation policy as of September 30, 2019:
Asset Class Target AllocationDomestic Equity 47.5%International Equity 10.0%Broad Market Fixed Income 22.5%Global Fixed Income 5.0%Real Estate 10.0%GTAA 5.0%Total 100.0%
Concentrations: The Plan did not hold investments in any one organization that represent 5 percent or more of the Pension Plan's Fiduciary Net Position.
NOTES TO THE FINANCIAL STATEMENTS
The Plan provides retirement, termination, disability and death benefits.
Incorporated are the benefit changes for measurement date 09/30/2019 as noted under the Notes to Schedule of Changes in Net Pension Liability and Related Ratios.
(For the Year Ended September 30, 2019)
City and State Contributions: Remaining amount required in order to pay current costs and amortize unfunded past service cost, if any, as provided in Part VII of Florida Statutes, Chapter 112. In no event will the City’s contribution be less than 18% of the total salary of plan Members.
Full-time employees who are classified as full-time Firefighters shall participate in the System as a condition of employment. Officers hired after July 1, 2016 shall participate in the Florida Retirement System. Members active on July 1, 2016 had the option of participating prospectively in the Florida Retirement System.
A summary of the benefit provisions can be found in the October 1, 2018 Actuarial Valuation Report for the City of North Port Firefighters' Pension - Local Option Trust Fund prepared by Foster & Foster Actuaries and Consultants.
The Plan is a single-employer defined benefit pension plan administered by the Plan's Board of Trustees comprised of:a. Two Commission appointees,b. Two Members of the Department elected by the membership, andc. Fifth Member elected by other 4 and appointed by the City Commission.
City of North Port Firefighters' Pension - Local Option Trust Fund FOSTER & FOSTER | 39

GASB 67
Rate of Return:
Deferred Retirement Option Program
The DROP balance as September 30, 2019 is $273,361¹.
The money-weighted rate of return expresses investment performance, net of investment expense, adjusted for the changing amounts actually invested.
For the year ended September 30, 2019, the annual money-weighted rate of return on Pension Plan investments, net of Pension Plan investment expense, was 3.75 percent.
¹ Investment Return includes earnings from 2018 4th quarter.
Eligibility: Satisfaction of Normal Retirement requirements (earlier of (1) Age 55 with 10 years of Credited Service, or (2) Age 52 with 25 years of Credited Service).
Rate of Return: At the Member’s election: (1) 1.0% annual rate, or (2) actual net rate of investment return (total return net of brokerage commissions, management fees, and transaction costs), credited each fiscal quarter. One change between the above options is allowed.
Participation: Not to exceed 60 months.
City of North Port Firefighters' Pension - Local Option Trust Fund FOSTER & FOSTER | 40

GASB 67
The components of the Net Pension Liability of the Sponsor on September 30, 2019 were as follows:
Total Pension Liability 52,450,230$ Plan Fiduciary Net Position (51,201,586)$ Sponsor's Net Pension Liability 1,248,644$
Plan Fiduciary Net Position as a percentage of Total Pension Liability 97.62%
Actuarial Assumptions:
Inflation 2.50%Salary Increases Service basedDiscount Rate 7.25%Investment Rate of Return 7.25%
Mortality Rate Healthy Active Lives:Female: RP2000 Generational, 100% Combined Healthy White Collar, Scale BB.
Mortality Rate Healthy Inactive Lives:Female: RP2000 Generational, 100% Annuitant White Collar, Scale BB.Male: RP2000 Generational, 10% Annuitant White Collar / 90% Annuitant Blue Collar, Scale BB.Mortality Rate Disabled Lives:Female: 60% RP2000 Disabled Female set forward two years / 40% Annuitant White Collar with no setback, no projection scale.Male: 60% RP2000 Disabled Male setback four years / 40% Annuitant White Collar with no setback, no projection scale.
Domestic EquityInternational EquityBroad Market Fixed IncomeGlobal Fixed IncomeReal EstateGTAA 3.50%
The Total Pension Liability was determined by an actuarial valuation as of October 1, 2018 updated to September 30, 2019 using the following actuarial assumptions:
7.50%8.50%2.50%3.50%4.50%
The above assumption rates were mandated by Chapter 2015-157, Laws of Florida. This law mandates the use of the assumptions used in either of the two most recent valuations of the Florida Retirement System (FRS). The above rates are those outlined in Milliman’s July 1, 2018 FRS valuation report for special risk employees. We feel this assumption sufficiently accommodates future mortality improvements.
NET PENSION LIABILITY OF THE SPONSOR
The Long-Term Expected Rate of Return on Pension Plan investments can be determined using a building-block method in which best-estimate ranges of expected future real rates of return (expected returns, net of Pension Plan investment expenses and inflation) are developed for each major asset class.
These ranges are combined to produce the Long-Term Expected Rate of Return by weighting the expected future real rates of return by the target asset allocation percentage and by adding expected inflation.
Best estimates of geometric real rates of return for each major asset class included in the Pension Plan's target asset allocation as of September 30, 2019 are summarized in the following table:
Asset Class
The most recent actuarial experience study used to review the other significant assumptions was dated May 10, 2017.
Long Term Expected Real Rate of Return
Male: RP2000 Generational, 10% Combined Healthy White Collar / 90% Combined Healthy Blue Collar, Scale BB.
For 2019 the inflation rate assumption of the investment advisor was 2.50%.
City of North Port Firefighters' Pension - Local Option Trust Fund FOSTER & FOSTER | 41
GASB 67
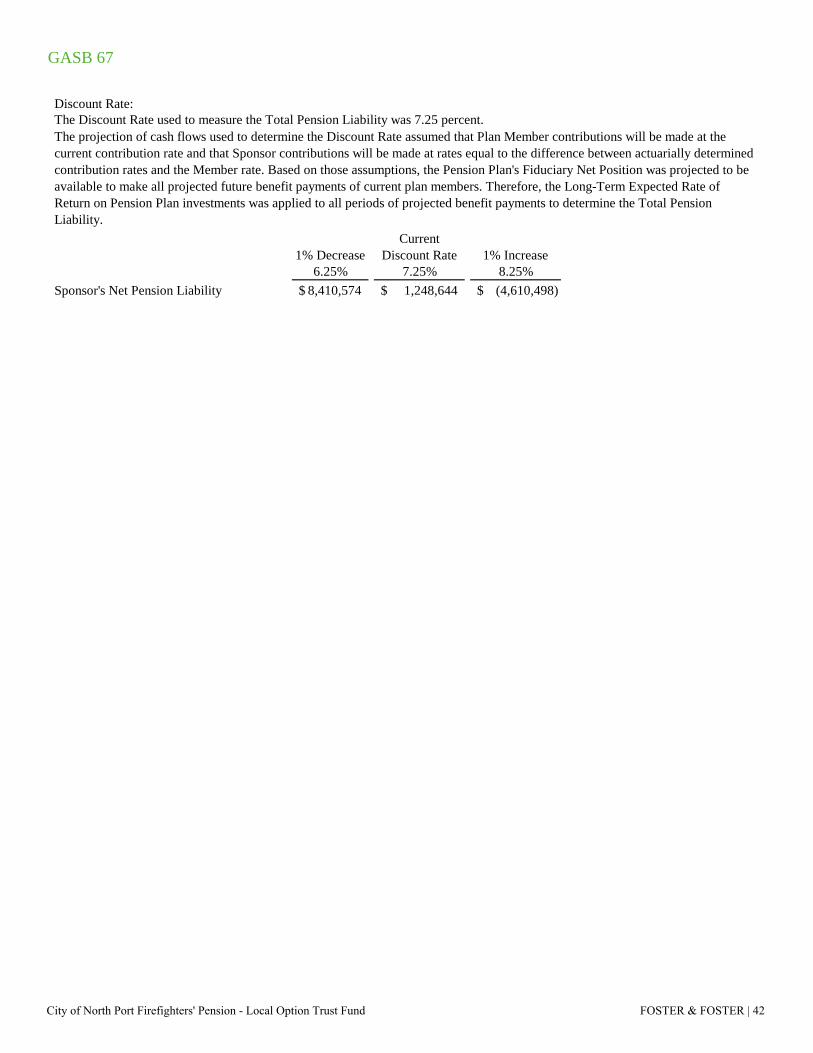
Discount Rate:The Discount Rate used to measure the Total Pension Liability was 7.25 percent.
1% Decrease Current
Discount Rate 1% Increase 6.25% 7.25% 8.25%
Sponsor's Net Pension Liability 8,410,574$ 1,248,644$ (4,610,498)$
The projection of cash flows used to determine the Discount Rate assumed that Plan Member contributions will be made at the current contribution rate and that Sponsor contributions will be made at rates equal to the difference between actuarially determined contribution rates and the Member rate. Based on those assumptions, the Pension Plan's Fiduciary Net Position was projected to be available to make all projected future benefit payments of current plan members. Therefore, the Long-Term Expected Rate of Return on Pension Plan investments was applied to all periods of projected benefit payments to determine the Total Pension Liability.
City of North Port Firefighters' Pension - Local Option Trust Fund FOSTER & FOSTER | 42

GASB 67
09/30/2019 09/30/2018 09/30/2017Total Pension LiabilityService Cost 917,681 904,670 1,264,321 Interest 3,566,667 3,351,560 3,620,964 Share Plan Allocation 169,797 164,503 126,129 Changes of benefit terms (5,208) - - Differences between Expected and Actual Experience 864,392 876,960 (2,641,499) Changes of assumptions 1,577,924 - (831,381) Contributions - Buy Back - - - Benefit Payments, including Refunds of Employee Contributions (2,568,219) (2,306,593) (1,200,337) Net Change in Total Pension Liability 4,523,034 2,991,100 338,197 Total Pension Liability - Beginning 47,927,196 44,936,096 44,597,899 Total Pension Liability - Ending (a) 52,450,230$ 47,927,196$ 44,936,096$
Plan Fiduciary Net PositionContributions - Employer 682,166 675,521 651,310 Contributions - State 419,797 414,503 376,129 Contributions - Employee 401,719 397,806 394,793 Contributions - Buy Back - - - Net Investment Income 1,879,686 4,317,182 4,545,143 Benefit Payments, including Refunds of Employee Contributions (2,568,219) (2,306,593) (1,200,337) Administrative Expense (72,105) (86,198) (86,264) Net Change in Plan Fiduciary Net Position 743,044 3,412,221 4,680,774 Plan Fiduciary Net Position - Beginning 50,458,542 47,046,321 42,365,547 Plan Fiduciary Net Position - Ending (b) $ 51,201,586 $ 50,458,542 $ 47,046,321
Net Pension Liability - Ending (a) - (b) 1,248,644$ (2,531,346)$ (2,110,225)$
Plan Fiduciary Net Position as a percentage of the Total Pension Liability 97.62% 105.28% 104.70%
Covered Payroll¹ 3,789,804$ 3,752,890$ 3,724,458$ Net Pension Liability as a percentage of Covered Payroll 32.95% -67.45% -56.66%
SCHEDULE OF CHANGES IN NET PENSION LIABILITY AND RELATED RATIOSLast 10 Fiscal Years
City of North Port Firefighters' Pension - Local Option Trust Fund FOSTER & FOSTER | 43
GASB 67
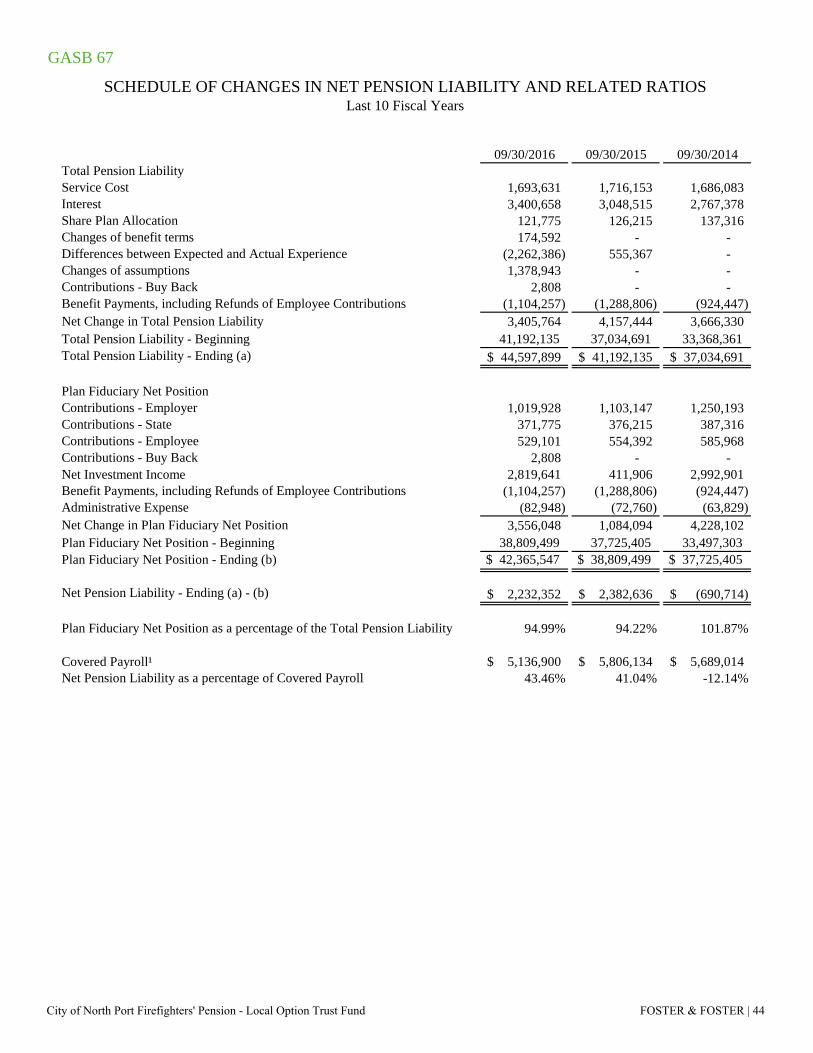
09/30/2016 09/30/2015 09/30/2014Total Pension LiabilityService Cost 1,693,631 1,716,153 1,686,083 Interest 3,400,658 3,048,515 2,767,378 Share Plan Allocation 121,775 126,215 137,316 Changes of benefit terms 174,592 - - Differences between Expected and Actual Experience (2,262,386) 555,367 - Changes of assumptions 1,378,943 - - Contributions - Buy Back 2,808 - - Benefit Payments, including Refunds of Employee Contributions (1,104,257) (1,288,806) (924,447) Net Change in Total Pension Liability 3,405,764 4,157,444 3,666,330 Total Pension Liability - Beginning 41,192,135 37,034,691 33,368,361 Total Pension Liability - Ending (a) 44,597,899$ 41,192,135$ 37,034,691$
Plan Fiduciary Net PositionContributions - Employer 1,019,928 1,103,147 1,250,193 Contributions - State 371,775 376,215 387,316 Contributions - Employee 529,101 554,392 585,968 Contributions - Buy Back 2,808 - - Net Investment Income 2,819,641 411,906 2,992,901 Benefit Payments, including Refunds of Employee Contributions (1,104,257) (1,288,806) (924,447) Administrative Expense (82,948) (72,760) (63,829) Net Change in Plan Fiduciary Net Position 3,556,048 1,084,094 4,228,102 Plan Fiduciary Net Position - Beginning 38,809,499 37,725,405 33,497,303 Plan Fiduciary Net Position - Ending (b) $ 42,365,547 $ 38,809,499 $ 37,725,405
Net Pension Liability - Ending (a) - (b) 2,232,352$ 2,382,636$ (690,714)$
Plan Fiduciary Net Position as a percentage of the Total Pension Liability 94.99% 94.22% 101.87%
Covered Payroll¹ 5,136,900$ 5,806,134$ 5,689,014$ Net Pension Liability as a percentage of Covered Payroll 43.46% 41.04% -12.14%
SCHEDULE OF CHANGES IN NET PENSION LIABILITY AND RELATED RATIOSLast 10 Fiscal Years
City of North Port Firefighters' Pension - Local Option Trust Fund FOSTER & FOSTER | 44

GASB 67
Notes to Schedule of Changes in Net Pension Liability and Related Ratios
Changes of assumptions:
Plan's investment consultant.
4. The withdrawal rates were changed to age and service rates.5. The mortality rates were changed to those used in the July 1, 2016 Florida Retirement System (FRS) valuation report for
special risk lives.
For measurement date 09/30/2016, as a result of Chapter 2015-157, Laws of Florida, the assumed rates of mortality were changed to the assumptions used by the Florida Retirement System for special risk employees.The inflation assumption rate was lowered from 3.00% to 2.50%, matching the long-term inflation assumption utilized by
For measurement date 09/30/2017, amounts reported as changes of assumptions resulted from the following changes based on the May 10, 2017 actuarial experience study:1. The investment return was lowered from 8.00% to 7.50% net of investment related expenses.2. The salary scale was changed from a flat rate to one based on service.3. The retirement rates were changed to age and service rates.
lookback period for determination of this average is eliminated.2. Provide for a reduction in the Early Retirement Penalty from 3% per year to the following schedule:
At least 15, but less than 20 years20 or more years
2%1%
For measurement date 09/30/2019, the investment return was lowered from 7.50% to 7.25% net of investment related expenses.
¹ The Covered Payroll numbers shown are in compliance with GASB 82, except for the 09/30/2015 measurement period
Changes in benefit terms:
Credited Service at time of Termination or RetirementLess than 15 years
Percent per Year Reduction3%
For measurement date 09/30/2019, amounts reported as changes of benefit terms resulted from the provisions of Chapter 112.1816, Florida Statutes. The Statutes state that, effective July 1, 2019, a death or disability (under the Plan's definition of total and permanent disability) for a Firefighter due to the diagnosis of cancer or circumstances that arise out of the treatment of cancer will be treated as duty-related.
which includes DROP payroll.
3. An increase in the Member Contribution Rate from 10.3% to 10.6%.4. Future new hires shall participate in the Florida Retirement System (FRS).
For measurement date 09/30/2016, amounts reported as changes of benefit terms resulted from Ordinance No. 2016-02:1. A definition of Average Final Compensation using the five years that provides the highest average. The ten-year
City of North Port Firefighters' Pension - Local Option Trust Fund FOSTER & FOSTER | 45

GASB 67
Fiscal Year Ended
Actuarially Determined Contribution
Contributions in relation to the
Actuarially Determined
Contributions
Contribution Deficiency (Excess)
Covered Payroll¹
Contributions as a percentage
of Covered Payroll
09/30/2019 932,165$ 932,166$ (1)$ 3,789,804$ 24.60%09/30/2018 925,520$ 925,521$ (1)$ 3,752,890$ 24.66%09/30/2017 920,402$ 901,310$ 19,092$ 3,724,458$ 24.20%09/30/2016 1,250,835$ 1,269,928$ (19,093)$ 5,136,900$ 24.72%09/30/2015 1,353,147$ 1,353,147$ -$ 5,806,134$ 23.31%09/30/2014 1,500,193$ 1,500,193$ -$ 5,689,014$ 26.37%
Notes to Schedule
Valuation Date: 10/01/2017
Methods and assumptions used to determine contribution rates:
Mortality Rate:
Interest Rate:
SCHEDULE OF CONTRIBUTIONSLast 10 Fiscal Years
Actuarially determined contribution rates are calculated as of October 1, two years prior to the end of the fiscal year in which contributions are reported.
¹ The Covered Payroll numbers shown are in compliance with GASB 82, except for the 09/30/2015 measurement period
7.5% per year compounded annually, net of investment-related expenses. This assumption is supported by the Plan’s investment policy and long-term expected returns by asset class.
Healthy Active Lives:Female: RP2000 Generational 100% Combined Healthy White Collar, Scale BB.Male: RP2000 Generational, 10% Combined Healthy White Collar / 90% Combined Healthy Blue Collar, Scale BB.
Disabled Lives:Female: 60% RP2000 Disabled Female set forward two years / 40% Annuitant White Collar with no setback, no projection scale.Male: 60% RP2000 Disabled Male setback four years / 40% Annuitant White Collar with no setback, no projection scale.The assumed rates of mortality were mandated by Chapter 2015157, Laws of Florida. This law mandates the use of the mortality assumptions used in either of the two most recent valuations of the Florida Retirement System (FRS). The above rates are those outlined in the July 1, 2016 FRS actuarial valuation report for special risk employees. We feel this assumption sufficiently accommodates future mortality improvements.
which includes DROP payroll.
Healthy Inactive Lives:Female: RP2000 Generational, 100% Annuitant White Collar, Scale BB.Male: RP2000 Generational, 10% Annuitant White Collar / 90% Annuitant Blue Collar, Scale BB.
City of North Port Firefighters' Pension - Local Option Trust Fund FOSTER & FOSTER | 46

GASB 67
Retirement Age: Service Age Assumed Rate<25 50-51 10.0%
52-53 25.0%54-57 50.0%58+ 100.0%
25+ 50 5.0%51 50.0%52 100.0%
Disability Rates:
Age
% Becoming Disabled During
the Year 20 0.03%30 0.04%40 0.07%50 0.18%
Termination Rates: Service Age Assumed Rate<5 20-24 10.0%
25-29 7.0%30-49 6.0%50-54 1.0%55+ 0.1%
5+ 20-44 6.0%45-49 5.0%50-54 1.0%55+ 0.1%
Salary Increases: Service Increase <10 7.0%
10-14 5.5%15-19 5.0%20+ 4.5%
Post Retirement COLA:Payroll Growth:Asset Valuation Method:
Funding Method:Amortization Method:Remaining Amortization Period:
Each year, the prior Actuarial Value of Assets is brought forward utilizing the historical geometric 4-year average Market Value return. It is possible that over time this technique will produce an insignificant bias above or below Market Value.
See table below (1201). It is assumed that 75% of disablements are service related. These rates are consistent with the other Florida municipal special risk retirement Plans and was determined reasonable with the May 10, 2017 actuarial experience study.
3.0% from age 55 until 63. None. This assumption is supported given that the Plan is closed to new hires.
This assumption was adopted with the May 10, 2017 actuarial experience study.
This assumption was adopted with the May 10, 2017 actuarial experience study.
Level Percentage of Pay, Closed.28 Years (as of 10/01/2017).
Entry Age Normal Actuarial Cost Method.
This assumption was adopted in conjunction with the May 10, 2017 actuarial experience study.
City of North Port Firefighters' Pension - Local Option Trust Fund FOSTER & FOSTER | 47

GASB 67
Fiscal Year EndedAnnual Money-Weighted Rate of Return
Net of Investment Expense09/30/2019 3.75%09/30/2018 9.32%09/30/2017 10.78%09/30/2016 7.24%09/30/2015 1.09%09/30/2014 8.84%
SCHEDULE OF INVESTMENT RETURNSLast 10 Fiscal Years
City of North Port Firefighters' Pension - Local Option Trust Fund FOSTER & FOSTER | 48

GASB 68
General Information about the Pension Plan
Plan Description
Plan Membership as of October 1, 2018:
Inactive Plan Members or Beneficiaries Currently Receiving Benefits 29 Inactive Plan Members Entitled to But Not Yet Receiving Benefits 37 Active Plan Members 42
108
Benefits Provided
Net Pension Liability
The measurement date is September 30, 2019.The measurement period for the pension expense was October 1, 2018 to September 30, 2019.The reporting period is October 1, 2019 through September 30, 2020.
The Sponsor's Net Pension Liability was measured as of September 30, 2019.The Total Pension Liability used to calculate the Net Pension Liability was determined as of that date.
Actuarial Assumptions:
Inflation 2.50%Salary Increases Service basedDiscount Rate 7.25%Investment Rate of Return 7.25%
ContributionsMember Contributions: 10.6% of Salary.City and State Contributions: Remaining amount required in order to pay current costs and amortize unfunded past service cost, if any, as provided in Part VII of Florida Statutes, Chapter 112. In no event will the City’s contribution be less than 18% of the total salary of plan Members.
NOTES TO THE FINANCIAL STATEMENTS(For the Year Ended September 30, 2020)
The Total Pension Liability was determined by an actuarial valuation as of October 1, 2018 updated to September 30, 2019 using the following actuarial assumptions:
The Plan provides retirement, termination, disability and death benefits.
Incorporated are the benefit changes for measurement date 09/30/2019 as noted under the Notes to Schedule of Changes in Net Pension Liability and Related Ratios.
Full-time employees who are classified as full-time Firefighters shall participate in the System as a condition of employment. Officers hired after July 1, 2016 shall participate in the Florida Retirement System. Members active on July 1, 2016 had the option of participating prospectively in the Florida Retirement System.
The Plan is a single-employer defined benefit pension plan administered by the Plan's Board of Trustees comprised of:a. Two Commission appointees,b. Two Members of the Department elected by the membership, andc. Fifth Member elected by other 4 and appointed by the City Commission.
A summary of the benefit provisions can be found in the October 1, 2018 Actuarial Valuation Report for the City of North Port Firefighters' Pension - Local Option Trust Fund prepared by Foster & Foster Actuaries and Consultants.
City of North Port Firefighters' Pension - Local Option Trust Fund FOSTER & FOSTER | 49

GASB 68
Asset Class Target AllocationLong Term Expected Real Rate of Return
Domestic Equity 47.5% 7.50%International Equity 10.0% 8.50%Broad Market Fixed Income 22.5% 2.50%Global Fixed Income 5.0% 3.50%Real Estate 10.0% 4.50%GTAA 5.0% 3.50%Total 100.0%
Discount Rate:The Discount Rate used to measure the Total Pension Liability was 7.25 percent.
The above assumption rates were mandated by Chapter 2015-157, Laws of Florida. This law mandates the use of the assumptions used in either of the two most recent valuations of the Florida Retirement System (FRS). The above rates are those outlined in Milliman’s July 1, 2018 FRS valuation report for special risk employees. We feel this assumption sufficiently accommodates future mortality improvements.
Female: 60% RP2000 Disabled Female set forward two years / 40% Annuitant White Collar with no setback, no projection scale.Male: 60% RP2000 Disabled Male setback four years / 40% Annuitant White Collar with no setback, no projection scale.
The projection of cash flows used to determine the Discount Rate assumed that Plan Member contributions will be made at the current contribution rate and that Sponsor contributions will be made at rates equal to the difference between actuarially determined contribution rates and the Member rate. Based on those assumptions, the Pension Plan's Fiduciary Net Position was projected to be available to make all projected future benefit payments of current plan members. Therefore, the Long-Term Expected Rate of Return on Pension Plan investments was applied to all periods of projected benefit payments to determine the Total Pension Liability.
The Long-Term Expected Rate of Return on Pension Plan investments can be determined using a building-block method in which best-estimate ranges of expected future real rates of return (expected returns, net of Pension Plan investment expenses and inflation) are developed for each major asset class.
These ranges are combined to produce the Long-Term Expected Rate of Return by weighting the expected future real rates of return by the target asset allocation percentage and by adding expected inflation.
Best estimates of geometric real rates of return for each major asset class included in the Pension Plan's target asset allocation as of September 30, 2019 are summarized in the following table:
For 2019 the inflation rate assumption of the investment advisor was 2.50%.
The most recent actuarial experience study used to review the other significant assumptions was dated May 10, 2017.
Female: RP2000 Generational, 100% Annuitant White Collar, Scale BB.Male: RP2000 Generational, 10% Annuitant White Collar / 90% Annuitant Blue Collar, Scale BB.Mortality Rate Disabled Lives:
Mortality Rate Healthy Active Lives:Female: RP2000 Generational, 100% Combined Healthy White Collar, Scale BB.Male: RP2000 Generational, 10% Combined Healthy White Collar / 90% Combined Healthy Blue Collar, Scale BB.Mortality Rate Healthy Inactive Lives:
City of North Port Firefighters' Pension - Local Option Trust Fund FOSTER & FOSTER | 50

GASB 68
Total Pension Liability
Plan Fiduciary Net Position
Net Pension Liability
(a) (b) (a)-(b)Reporting Period Ending September 30, 2019 $ 47,927,196 $ 50,458,542 $ (2,531,346)Changes for a Year:
Service Cost 917,681 - 917,681 Interest 3,566,667 - 3,566,667 Share Plan Allocation 169,797 - 169,797 Differences between Expected and Actual Experience 864,392 - 864,392 Changes of assumptions 1,577,924 - 1,577,924 Changes of benefit terms (5,208) - (5,208)Contributions - Employer - 682,166 (682,166)Contributions - State - 419,797 (419,797)Contributions - Employee - 401,719 (401,719)Contributions - Buy Back - - - Net Investment Income - 1,879,686 (1,879,686)Benefit Payments, including Refunds of Employee Contributions (2,568,219) (2,568,219) - Administrative Expense - (72,105) 72,105
Net Changes 4,523,034 743,044 3,779,990 Reporting Period Ending September 30, 2020 $ 52,450,230 $ 51,201,586 $ 1,248,644
Sensitivity of the Net Pension Liability to changes in the Discount Rate.
1% Decrease Current Discount
Rate 1% Increase 6.25% 7.25% 8.25%
Sponsor's Net Pension Liability 8,410,574$ 1,248,644$ (4,610,498)$
Pension Plan Fiduciary Net Position. Detailed information about the pension Plan's Fiduciary Net Position is available in a separately issued Plan financial report.
Increase (Decrease)
CHANGES IN NET PENSION LIABILITY
City of North Port Firefighters' Pension - Local Option Trust Fund FOSTER & FOSTER | 51

GASB 68
For the year ended September 30, 2019, the Sponsor has recognized a Pension Expense of $71,308.
Deferred Outflows of Resources
Deferred Inflows of Resources
Differences between Expected and Actual Experience 966,255 2,829,006 Changes of assumptions 919,296 415,690 Net difference between Projected and Actual Earnings on Pension Plan investments - 695,968 Employer and State Contributions subsequent to the measurement date 1,101,963 - Total 2,987,514$ 3,940,664$
OUTFLOW INFLOWYear ended September 30:2020 (342,674)$ 471,345$ 567,311$ (490,539)$ 2021 (342,673)$ 471,346$ 40,707$ (1,017,142)$ 2022 317,702$ 679,191$ (22,208)$ (211,837)$ 2023 (189,669)$ 153,216$ 207,887$ (200,982)$ 2024 (189,669)$ 153,216$ 372,416$ (36,453)$ Thereafter (1,115,768)$ (1,424,708)$ (1,862,081)$ (98,160)$
FINAL PENSION EXPENSE AND DEFERRED OUTFLOWS OF RESOURCES AND DEFERRED INFLOWS OF RESOURCES RELATED TO PENSIONS
On September 30, 2019, the Sponsor reported Deferred Outflows of Resources and Deferred Inflows of Resources related to pensions from the following sources:
The outcome of the Deferred Outflows of resources related to pensions resulting from Employer and State Contributions subsequent to the measurement date was recognized as a reduction of the Net Pension Liability in the year ended September 30, 2019.Other amounts reported as Deferred Outflows of Resources and Deferred Inflows of Resources related to pensions will be recognized in Pension Expense as follows:
FISCAL YEAR SEPTEMBER 30, 2019
City of North Port Firefighters' Pension - Local Option Trust Fund FOSTER & FOSTER | 52

GASB 68
For the year ended September 30, 2020, the Sponsor will recognize a Pension Expense of $1,273,538.
Deferred Outflows of Resources
Deferred Inflows of Resources
Differences between Expected and Actual Experience 1,261,570 1,917,255 Changes of assumptions 1,818,030 207,845 Net difference between Projected and Actual Earnings on Pension Plan investments 598,802 - Employer and State Contributions subsequent to the measurement date TBD - Total TBD 2,125,100$
OUTFLOW INFLOWYear ended September 30:2021 (342,673)$ 471,346$ 40,707$ 169,380$ 2022 317,702$ 679,191$ (22,208)$ 974,685$ 2023 (189,669)$ 153,216$ 207,887$ 171,434$ 2024 (189,669)$ 153,216$ 372,416$ 335,963$ 2025 (251,376)$ 153,216$ -$ (98,160)$ Thereafter -$ -$ -$ -$
PRELIMINARY PENSION EXPENSE AND DEFERRED OUTFLOWS OF RESOURCES AND DEFERRED INFLOWS OF RESOURCES RELATED TO PENSIONS
On September 30, 2020, the Sponsor reported Deferred Outflows of Resources and Deferred Inflows of Resources related to pensions from the following sources:
Other amounts reported as Deferred Outflows of Resources and Deferred Inflows of Resources related to pensions will be recognized in Pension Expense as follows:
The outcome of the Deferred Outflows of resources related to pensions resulting from Employer and State Contributions subsequent to the measurement date will be recognized as a reduction of the Net Pension Liability in the year ended September 30, 2020.
FISCAL YEAR SEPTEMBER 30, 2020
City of North Port Firefighters' Pension - Local Option Trust Fund FOSTER & FOSTER | 53

GASB 68
Reporting Period Ending 09/30/2020 09/30/2019 09/30/2018Measurement Date 09/30/2019 09/30/2018 09/30/2017Total Pension LiabilityService Cost 917,681 904,670 1,264,321 Interest 3,566,667 3,351,560 3,620,964 Share Plan Allocation 169,797 164,503 126,129 Changes of benefit terms (5,208) - - Differences between Expected and Actual Experience 864,392 876,960 (2,641,499) Changes of assumptions 1,577,924 - (831,381) Contributions - Buy Back - - - Benefit Payments, including Refunds of Employee Contributions (2,568,219) (2,306,593) (1,200,337) Net Change in Total Pension Liability 4,523,034 2,991,100 338,197 Total Pension Liability - Beginning 47,927,196 44,936,096 44,597,899 Total Pension Liability - Ending (a) $ 52,450,230 $ 47,927,196 $ 44,936,096
Plan Fiduciary Net PositionContributions - Employer 682,166 675,521 651,310 Contributions - State 419,797 414,503 376,129 Contributions - Employee 401,719 397,806 394,793 Contributions - Buy Back - - - Net Investment Income 1,879,686 4,317,182 4,545,143 Benefit Payments, including Refunds of Employee Contributions (2,568,219) (2,306,593) (1,200,337) Administrative Expense (72,105) (86,198) (86,264) Net Change in Plan Fiduciary Net Position 743,044 3,412,221 4,680,774 Plan Fiduciary Net Position - Beginning 50,458,542 47,046,321 42,365,547 Plan Fiduciary Net Position - Ending (b) $ 51,201,586 $ 50,458,542 $ 47,046,321
Net Pension Liability - Ending (a) - (b) 1,248,644$ (2,531,346)$ (2,110,225)$
Plan Fiduciary Net Position as a percentage of the Total Pension Liability 97.62% 105.28% 104.70%
Covered Payroll¹ 3,789,804$ 3,752,890$ 3,724,458$ Net Pension Liability as a percentage of Covered Payroll 32.95% -67.45% -56.66%
SCHEDULE OF CHANGES IN NET PENSION LIABILITY AND RELATED RATIOSLast 10 Fiscal Years
City of North Port Firefighters' Pension - Local Option Trust Fund FOSTER & FOSTER | 54

GASB 68
Reporting Period Ending 09/30/2017 09/30/2016 09/30/2015Measurement Date 09/30/2016 09/30/2015 09/30/2014Total Pension LiabilityService Cost 1,693,631 1,716,153 1,686,083 Interest 3,400,658 3,048,515 2,767,378 Share Plan Allocation 121,775 126,215 137,316 Changes of benefit terms 174,592 - - Differences between Expected and Actual Experience (2,262,386) 555,367 - Changes of assumptions 1,378,943 - - Contributions - Buy Back 2,808 - - Benefit Payments, including Refunds of Employee Contributions (1,104,257) (1,288,806) (924,447) Net Change in Total Pension Liability 3,405,764 4,157,444 3,666,330 Total Pension Liability - Beginning 41,192,135 37,034,691 33,368,361 Total Pension Liability - Ending (a) $ 44,597,899 $ 41,192,135 $ 37,034,691
Plan Fiduciary Net PositionContributions - Employer 1,019,928 1,103,147 1,250,193 Contributions - State 371,775 376,215 387,316 Contributions - Employee 529,101 554,392 585,968 Contributions - Buy Back 2,808 - - Net Investment Income 2,819,641 411,906 2,992,901 Benefit Payments, including Refunds of Employee Contributions (1,104,257) (1,288,806) (924,447) Administrative Expense (82,948) (72,760) (63,829) Net Change in Plan Fiduciary Net Position 3,556,048 1,084,094 4,228,102 Plan Fiduciary Net Position - Beginning 38,809,499 37,725,405 33,497,303 Plan Fiduciary Net Position - Ending (b) $ 42,365,547 $ 38,809,499 $ 37,725,405
Net Pension Liability - Ending (a) - (b) 2,232,352$ 2,382,636$ (690,714)$
Plan Fiduciary Net Position as a percentage of the Total Pension Liability 94.99% 94.22% 101.87%
Covered Payroll¹ 5,136,900$ 5,806,134$ 5,689,014$ Net Pension Liability as a percentage of Covered Payroll 43.46% 41.04% -12.14%
SCHEDULE OF CHANGES IN NET PENSION LIABILITY AND RELATED RATIOSLast 10 Fiscal Years
City of North Port Firefighters' Pension - Local Option Trust Fund FOSTER & FOSTER | 55

GASB 68
Notes to Schedule of Changes in Net Pension Liability and Related Ratios
Changes of assumptions:
¹ The Covered Payroll numbers shown are in compliance with GASB 82, except for the 09/30/2015 measurement period which includes DROP payroll.
Changes in benefit terms:For measurement date 09/30/2019, amounts reported as changes of benefit terms resulted from the provisions of Chapter 112.1816, Florida Statutes. The Statutes state that, effective July 1, 2019, a death or disability (under the Plan's definition of total and permanent disability) for a Firefighter due to the diagnosis of cancer or circumstances that arise out of the treatment of cancer will be treated as duty-related.
For measurement date 09/30/2016, amounts reported as changes of benefit terms resulted from Ordinance No. 2016-02:1. A definition of Average Final Compensation using the five years that provides the highest average. The ten-year
lookback period for determination of this average is eliminated.2. Provide for a reduction in the Early Retirement Penalty from 3% per year to the following schedule:
Credited Service at time of Termination or Retirement Percent per Year ReductionLess than 15 years 3%At least 15, but less than 20 years 2%
5. The mortality rates were changed to those used in the July 1, 2016 Florida Retirement System (FRS) valuation report for
20 or more years 1%
3. An increase in the Member Contribution Rate from 10.3% to 10.6%.4. Future new hires shall participate in the Florida Retirement System (FRS).
For measurement date 09/30/2019, the investment return was lowered from 7.50% to 7.25% net of investment related expenses.
For measurement date 09/30/2017, amounts reported as changes of assumptions resulted from the following changes based on the May 10, 2017 actuarial experience study:1. The investment return was lowered from 8.00% to 7.50% net of investment related expenses.2. The salary scale was changed from a flat rate to one based on service.3. The retirement rates were changed to age and service rates.4. The withdrawal rates were changed to age and service rates.
special risk lives.
For measurement date 09/30/2016, as a result of Chapter 2015-157, Laws of Florida, the assumed rates of mortality were changed to the assumptions used by the Florida Retirement System for special risk employees.The inflation assumption rate was lowered from 3.00% to 2.50%, matching the long-term inflation assumption utilized by Plan's investment consultant.
City of North Port Firefighters' Pension - Local Option Trust Fund FOSTER & FOSTER | 56

GASB 68
Fiscal Year Ended
Actuarially Determined Contribution
Contributions in relation to the
Actuarially Determined
Contributions
Contribution Deficiency (Excess)
Covered Payroll¹
Contributions as a percentage
of Covered Payroll
09/30/2019 932,165$ 932,166$ (1)$ 3,789,804$ 24.60%09/30/2018 925,520$ 925,521$ (1)$ 3,752,890$ 24.66%09/30/2017 920,402$ 901,310$ 19,092$ 3,724,458$ 24.20%09/30/2016 1,250,835$ 1,269,928$ (19,093)$ 5,136,900$ 24.72%09/30/2015 1,353,147$ 1,353,147$ -$ 5,806,134$ 23.31%09/30/2014 1,500,193$ 1,500,193$ -$ 5,689,014$ 26.37%
Notes to Schedule
Valuation Date: 10/01/2017
Methods and assumptions used to determine contribution rates:
Mortality Rate:
Interest Rate:
SCHEDULE OF CONTRIBUTIONSLast 10 Fiscal Years
Actuarially determined contribution rates are calculated as of October 1, two years prior to the end of the fiscal year in which contributions are reported.
¹ The Covered Payroll numbers shown are in compliance with GASB 82, except for the 09/30/2015 measurement period which includes DROP payroll.
Healthy Active Lives:
7.5% per year compounded annually, net of investment-related expenses. This assumption is supported by the Plan’s investment policy and long-term expected returns by asset class.
Female: RP2000 Generational 100% Combined Healthy White Collar, Scale BB.Male: RP2000 Generational, 10% Combined Healthy White Collar / 90% Combined Healthy Blue Collar, Scale BB.
Disabled Lives:Female: 60% RP2000 Disabled Female set forward two years / 40% Annuitant White Collar with no setback, no projection scale.Male: 60% RP2000 Disabled Male setback four years / 40% Annuitant White Collar with no setback, no projection scale.The assumed rates of mortality were mandated by Chapter 2015157, Laws of Florida. This law mandates the use of the mortality assumptions used in either of the two most recent valuations of the Florida Retirement System (FRS). The above rates are those outlined in the July 1, 2016 FRS actuarial valuation report for special risk employees. We feel this assumption sufficiently accommodates future mortality improvements.
Healthy Inactive Lives:Female: RP2000 Generational, 100% Annuitant White Collar, Scale BB.Male: RP2000 Generational, 10% Annuitant White Collar / 90% Annuitant Blue Collar, Scale BB.
City of North Port Firefighters' Pension - Local Option Trust Fund FOSTER & FOSTER | 57

GASB 68
Retirement Age: Service Age Assumed Rate<25 50-51 10.0%
52-53 25.0%54-57 50.0%58+ 100.0%
25+ 50 5.0%51 50.0%52 100.0%
Disability Rates:
Age
% Becoming Disabled During
the Year 20 0.03%30 0.04%40 0.07%50 0.18%%
Termination Rates: Service Age Assumed Rate<5 20-24 10.0%
25-29 7.0%30-49 6.0%50-54 1.0%55+ 0.1%
5+ 20-44 6.0%45-49 5.0%50-54 1.0%55+ 0.1%
Salary Increases: Service Increase <10 7.0%
10-14 5.5%15-19 5.0%20+ 4.5%
Post Retirement COLA:Payroll Growth:Asset Valuation Method:
Funding Method:Amortization Method:Remaining Amortization Period:
Level Percentage of Pay, Closed.28 Years (as of 10/01/2017).
This assumption was adopted in conjunction with the May 10, 2017 actuarial experience study. See table below (1201). It is assumed that 75% of disablements are service related. These rates are consistent with the other Florida municipal special risk retirement Plans and was determined reasonable with the May 10, 2017 actuarial experience study.
This assumption was adopted with the May 10, 2017 actuarial experience study.
This assumption was adopted with the May 10, 2017 actuarial experience study.
None. This assumption is supported given that the Plan is closed to new hires.Each year, the prior Actuarial Value of Assets is brought forward utilizing the historical geometric 4-year average Market Value return. It is possible that over time this technique will produce an insignificant bias above or below Market Value.Entry Age Normal Actuarial Cost Method.
3.0% from age 55 until 63.
City of North Port Firefighters' Pension - Local Option Trust Fund FOSTER & FOSTER | 58

GASB 68
EXPENSE DEVELOPMENT AND AMORTIZATION SCHEDULES
The following information is not required to be disclosed but is provided for informational purposes.
City of North Port Firefighters' Pension - Local Option Trust Fund FOSTER & FOSTER | 59
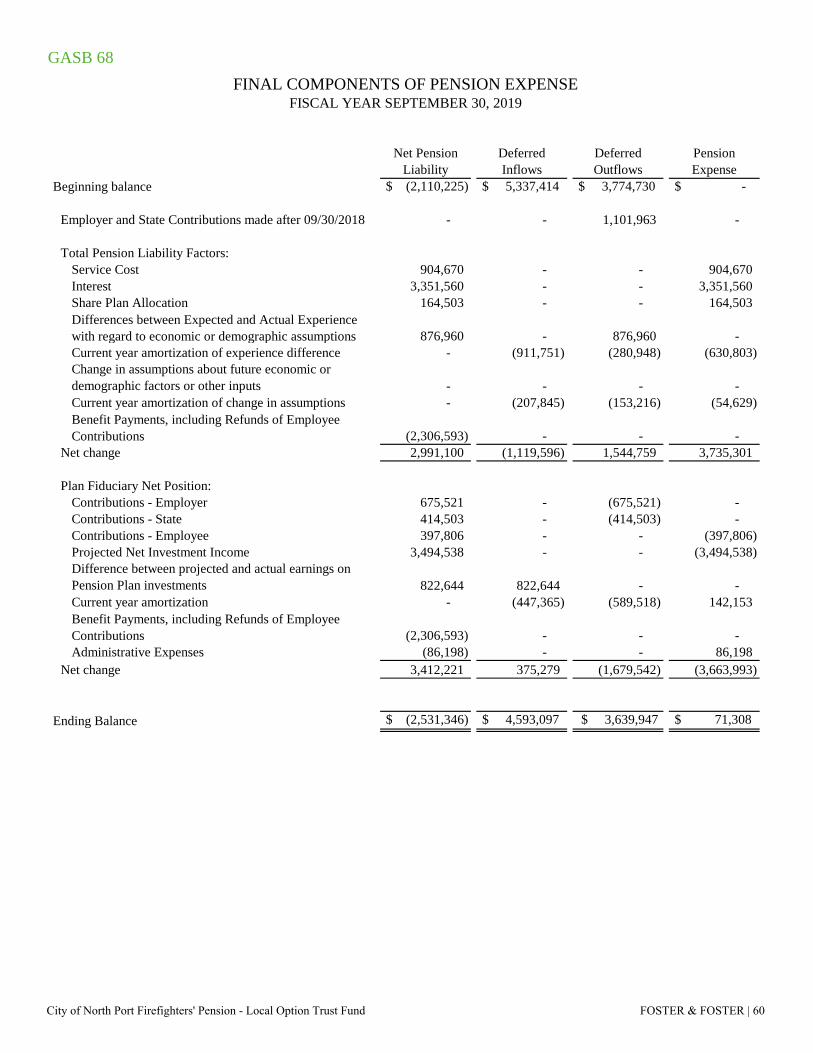
GASB 68
Net Pension Liability
Deferred Inflows
Deferred Outflows
Pension Expense
Beginning balance $ (2,110,225) $ 5,337,414 $ 3,774,730 $ -
Employer and State Contributions made after 09/30/2018 - - 1,101,963 -
Total Pension Liability Factors:Service Cost 904,670 - - 904,670 Interest 3,351,560 - - 3,351,560 Share Plan Allocation 164,503 - - 164,503 Differences between Expected and Actual Experience with regard to economic or demographic assumptions 876,960 - 876,960 - Current year amortization of experience difference - (911,751) (280,948) (630,803) Change in assumptions about future economic or demographic factors or other inputs - - - - Current year amortization of change in assumptions - (207,845) (153,216) (54,629) Benefit Payments, including Refunds of Employee Contributions (2,306,593) - - -
Net change 2,991,100 (1,119,596) 1,544,759 3,735,301
Plan Fiduciary Net Position:Contributions - Employer 675,521 - (675,521) - Contributions - State 414,503 - (414,503) - Contributions - Employee 397,806 - - (397,806) Projected Net Investment Income 3,494,538 - - (3,494,538) Difference between projected and actual earnings on Pension Plan investments 822,644 822,644 - - Current year amortization - (447,365) (589,518) 142,153 Benefit Payments, including Refunds of Employee Contributions (2,306,593) - - - Administrative Expenses (86,198) - - 86,198
Net change 3,412,221 375,279 (1,679,542) (3,663,993)
Ending Balance $ (2,531,346) $ 4,593,097 $ 3,639,947 $ 71,308
FINAL COMPONENTS OF PENSION EXPENSEFISCAL YEAR SEPTEMBER 30, 2019
City of North Port Firefighters' Pension - Local Option Trust Fund FOSTER & FOSTER | 60

GASB 68
Net Pension Liability
Deferred Inflows
Deferred Outflows
Pension Expense
Beginning balance $ (2,531,346) $ 4,593,097 $ 3,639,947 $ -
Employer and State Contributions made after 09/30/2019 - - TBD* -
Total Pension Liability Factors:Service Cost 917,681 - - 917,681 Interest 3,566,667 - - 3,566,667 Share Plan Allocation 169,797 - - 169,797 Changes in benefit terms (5,208) - - (5,208) Differences between Expected and Actual Experience with regard to economic or demographic assumptions 864,392 - 864,392 - Current year amortization of experience difference - (911,751) (569,077) (342,674) Change in assumptions about future economic or demographic factors or other inputs 1,577,924 - 1,577,924 - Current year amortization of change in assumptions - (207,845) (679,190) 471,345 Benefit Payments, including Refunds of Employee Contributions (2,568,219) - - -
Net change 4,523,034 (1,119,596) 1,194,049 4,777,608
Plan Fiduciary Net Position:Contributions - Employer 682,166 - (682,166) - Contributions - State 419,797 - (419,797) - Contributions - Employee 401,719 - - (401,719) Contributions - Buy Back - - - - Projected Net Investment Income 3,741,767 - - (3,741,767) Difference between projected and actual earnings on Pension Plan investments (1,862,081) - 1,862,081 - Current year amortization - (394,624) (961,935) 567,311 Benefit Payments, including Refunds of Employee Contributions (2,568,219) - - - Administrative Expenses (72,105) - - 72,105
Net change 743,044 (394,624) (201,817) (3,504,070)
Ending Balance $ 1,248,644 $ 3,078,877 TBD $ 1,273,538
PRELIMINARY COMPONENTS OF PENSION EXPENSEFISCAL YEAR SEPTEMBER 30, 2020
* Employer and State Contributions subsequent to the measurement date made after September 30, 2019 but made on or before September 30, 2020 need to be added.
City of North Port Firefighters' Pension - Local Option Trust Fund FOSTER & FOSTER | 61

GASB 68
Increase (Decrease) in Pension Expense Arising from the Recognition of the of Differences Between Projected and Actual Earnings on Pension Plan Investments
Plan Year Ending
Differences Between Projected and Actual
EarningsRecognition
Period (Years) 2019 2020 2021 2022 2023 2024 2025 2026 2027 2028 2029Recognitio 0 1 2 3 4 5 6 7 8 9 10
2019 1,862,081$ 5 -$ 372,417$ 372,416$ 372,416$ 372,416$ 372,416$ -$ -$ -$ -$ -$ 2018 (822,644)$ 5 (164,528)$ (164,529)$ (164,529)$ (164,529)$ (164,529)$ -$ -$ -$ -$ -$ -$ 2017 (1,150,474)$ 5 (230,095)$ (230,095)$ (230,095)$ (230,095)$ -$ -$ -$ -$ -$ -$ -$ 2016 314,575$ 5 62,915$ 62,915$ 62,915$ -$ -$ -$ -$ -$ -$ -$ -$ 2015 2,633,014$ 5 526,603$ 526,603$ -$ -$ -$ -$ -$ -$ -$ -$ -$ 2014 (263,708)$ 5 (52,742)$ -$ -$ -$ -$ -$ -$ -$ -$ -$ -$
Net Increase (Decrease) in Pension Expense 142,153$ 567,311$ 40,707$ (22,208)$ 207,887$ 372,416$ -$ -$ -$ -$ -$
AMORTIZATION SCHEDULE - INVESTMENTS
City of North Port Firefighters' Pension - Local Option Trust Fund FOSTER & FOSTER | 62

GASB 68
Plan Year Ending
Changes of Assumptions
Recognition Period (Years) 2019 2020 2021 2022 2023 2024 2025 2026 2027 2028 2029
Recognitio 0 1 2 3 4 5 6 7 8 9 102019 1,577,924$ 3 -$ 525,974$ 525,975$ 525,975$ -$ -$ -$ -$ -$ -$ -$ 2017 (831,381)$ 4 (207,845)$ (207,845)$ (207,845)$ -$ -$ -$ -$ -$ -$ -$ -$ 2016 1,378,943$ 9 153,216$ 153,216$ 153,216$ 153,216$ 153,216$ 153,216$ 153,216$ -$ -$ -$ -$
Net Increase (Decrease) in Pension Expense (54,629)$ 471,345$ 471,346$ 679,191$ 153,216$ 153,216$ 153,216$ -$ -$ -$ -$
AMORTIZATION SCHEDULE - CHANGES OF ASSUMPTIONS
Increase (Decrease) in Pension Expense Arising from the Recognition of the Effects of Changes of Assumptions
City of North Port Firefighters' Pension - Local Option Trust Fund FOSTER & FOSTER | 63

GASB 68
Plan Year Ending
Differences Between Expected and Actual
ExperienceRecognition
Period (Years) 2019 2020 2021 2022 2023 2024 2025 2026 2027 2028 2029Recognitio 0 1 2 3 4 5 6 7 8 9 10
2019 864,392$ 3 -$ 288,130$ 288,131$ 288,131$ -$ -$ -$ -$ -$ -$ -$ 2018 876,960$ 4 219,240$ 219,240$ 219,240$ 219,240$ -$ -$ -$ -$ -$ -$ -$ 2017 (2,641,499)$ 4 (660,375)$ (660,375)$ (660,375)$ -$ -$ -$ -$ -$ -$ -$ -$ 2016 (2,262,386)$ 9 (251,376)$ (251,376)$ (251,376)$ (251,376)$ (251,376)$ (251,376)$ (251,376)$ -$ -$ -$ -$ 2015 555,367$ 9 61,708$ 61,707$ 61,707$ 61,707$ 61,707$ 61,707$ -$ -$ -$ -$ -$
Net Increase (Decrease) in Pension Expense (630,803)$ (342,674)$ (342,673)$ 317,702$ (189,669)$ (189,669)$ (251,376)$ -$ -$ -$ -$
AMORTIZATION SCHEDULE - EXPERIENCE
Increase (Decrease) in Pension Expense Arising from the Recognition of the Effects of Differences between Expected and Actual Experience
City of North Port Firefighters' Pension - Local Option Trust Fund FOSTER & FOSTER | 64