2020 - zj.gov.cn
TRANSCRIPT

绍 兴 市 统 计 局国家统计局绍兴调查队
2020
编
SHAOXING STATISTICAL YEARBOOK
China Statistics Press

© 中国统计出版社有限公司 2020版权所有。未经许可,本书的任何部分不得以任何方式在世界任何地区以任何文字翻印、拷贝、仿制或转载。
©2020 China Statistics Press Co.,Ltd.All rights reserved. No part of the publication may be reproduced or transmitted in any form or by any means, electronic or mechanical, including photocopying, recording, or any information storage and retrieval system, without written permission from the publisher.
绍兴统计年鉴 . 2020 = Shaoxing StatisticalYearbook 2020 : 汉英对照 / 绍兴市统计局 , 国家统计局绍兴调查队编 . -- 北京 : 中国统计出版社 , 2020.9 ISBN 978-7-5037-9236-6
Ⅰ . ①绍… Ⅱ . ①绍… ②国… Ⅲ . ①统计资料-绍兴- 2020 -年鉴-汉、英 Ⅳ . ① C832.553-54
中国版本图书馆 CIP 数据核字 (2020) 第 151981 号
图书在版编目 ( C I P ) 数据
绍兴统计年鉴 -2020
作 者 /绍兴市统计局 国家统计局绍兴调查队
责任编辑 /钟 钰
装帧设计 /义鸣彩印印前中心
出版发行 /中国统计出版社有限公司
地 址 /北京市丰台区西三环南路甲6号
邮政编码 / 100073电 话 /邮购(010)63376909 书店(010)68783171
网 址 / http://www.zgtjcbs.com印 刷 /绍兴市义鸣彩印包装厂
经 销 /新华书店
开 本 / 889mm×1194mm 1/16
字 数 / 990千字
印 张 / 28.5 版 别 / 2020年9月第1版
版 次 / 2020年9月第1次印刷
定 价 / 350.00元 Price:350.00 yuan(RMB)
如有印装差错,由本社发行部调换。

绍兴统计年鉴
编辑委员会
编辑人员
主 任
责任编辑
编辑人员
徐国龙
钟 钰 王水尧 张建飞
(按姓氏笔划为序)
丁 洁 马万里 马 丽 马雅琴 王培培 尹 超
叶兴昌 许卫卫 许 敏 孙丽娜 孙 弼 朱朝晖
华磊波 陈玉大 陈青青 陈金梅 陈林萍 陈家楠
陈新斌 李月红 李晓波 何丹萍 肖 刚 杨伟丰
杨 洋 杨梦盼 张 欣 张建飞 张 峰 何 晖
何耀辉 劳益瑾 陆露璐 孟 宏 金雨菲 周俊杰
林 啸 周 理 柳梦怡 俞东云 俞 麟 施加乐
施菲菲 胡金燕 祝 淮 赵 媛 赵淑敏 翁宇奇
莫 邪 郭亚楠 郭 蒙 陶君豪 倪迪飞 徐 超
徐 彪 梁一奇 梁夏玲 殷键栋 章 勤 黄亚丽
鲁建荣 董 淼 程晓晴 蒋秋琴 蒋燕青 虞 斌
缪宇佳 漏德明 潘康婷
彭上升 张国苗
郭元祥 何晓红 倪伟昶 曹绘宏
张成新 吕惠钰 陶勇成
副主任
委 员
2020

2020Shaoxing Statistical Yearbook
Editorial Board
Editorial Staff
Chairman
Vice-Chairman
Coordinators
Editorial Staff
Editorial Board
Xu Guolong
Peng Shangsheng Zhang Guomiao
Zhong Yu Wang Shuiyao Zhang Jianfei
(in order of strokes of Chinese surname)
Guo Yuanxiang He Xiaohong Ni Weichang Cao Huihong
Zhang Chengxin Lyu Huiyu Tao Yongcheng
Ding Jie Ma Wanli Ma Li Ma Yaqin
Wang Peipei Yin Chao Ye Xingchang Xu Weiwei
Xu Min Sun Lina Sun Bi Zhu Chaohui
Hua Leibo Chen Yuda Chen Qingqing Chen Jinmei
Chen Linping Chen Jianan Chen Xinbin Li Yuehong
Li Xiaobo He Danping Xiao Gang Yang Weifeng
Yang Yang Yang Mengpan Zhang Xin Zhang Jianfei
Zhang Feng He Hui He Yaohui Lao Yijin
Lu Lulu Meng Hong Jin Yufei Zhou Junjie
Lin Xiao Zhou Li Liu Mengyi Yu Dongyun
Yu Lin Shi Jiale Shi Feifei Hu Jinyan
Zhu Huai Zhao Yuan Zhao Shumin Weng Yuqi
Mo Ye Guo Yanan Guo Meng Tao Junhao
Ni Difei Xu Chao Xu Biao Liang Yiqi
Liang Xialing Yin Jiandong Zhang Qin Huang Yali
Lu Jianrong Dong Miao Cheng Xiaoqing Jiang Qiuqin
Jiang Yanqing Yu Bin Miao Yujia Lou Deming
Pan Kangting

编者说明
一、《绍兴统计年鉴 -2020》是一部全面反映绍兴市经济和社会发展的
资料性年刊。本书收录了绍兴各区、县(市)和浙江省、长江三角洲地区城市
2019 年经济和社会各方面大量的统计数据,以及历史重要年份和近二十余年
的全市主要统计数据。
二、全书内容共分 12 个部分,即:1. 综合;2. 人口和劳动工资;3. 农业;4. 工
业;5. 交通、邮电及电力;6. 固定资产投资和建筑业;7. 国内贸易和对外经济;8. 财
政、金融、保险;9. 物价及人民生活;10. 文化、教育、科技和卫生事业;11. 其他;
12. 浙江省及长江三角洲地区各地资料。另附:绍兴市国民经济和社会发展
统计公报、2019 年度绍兴市社会经济综合评价情况。各篇前设本篇主要统计
指标增长情况和统计图表,篇末附有《主要统计指标解释》。
三、资料中所使用的度量衡单位均采用国际统一标准计量单位。
四、本年鉴的资料来源大部分来自年度统计报表,一部分来自抽样调查。
五、本年鉴部分数据合计数或相对数由于单位取舍不同而产生的计算误
差均未作机械调整。
六、本年鉴对过去发表的统计资料重新予以核实,凡与本年鉴数据有出
入的,以本年鉴为准。
七、本年鉴表中的符号使用说明:“-”表示数据不足本表最小单位数或
为零;“空格”表示该项统计指标数据不详或无该项数据;“#”表示其中的主
要项。

PREFACE
Ⅰ. Shaoxing Statistical Yearbook 2020 is an annual statistics publication, which covers
very comprehensive data at Shaoxing, Zhejiang and Yangse River Delta in 2019 and some
selected data at historically important years and the most recent twenty years, reflects
various aspects of Shaoxing’s social and economic development.
Ⅱ . The book contains the following 12 parts, 1.General Survey; 2.Population and
Wages; 3.Agriculture; 4.Industry; 5.Transportation, Post and Telecommunications and
Electricity; 6.Investment in Fixed Assets and Construction; 7.Domestic Trade, Foreign Trade
and Economic Cooperation; 8.Public Finance, Banking and Insurance; 9.Price and People’s
Livelihood; 10.Culture, Education, Technology, Science and Public Health; 11.Others;
12.Reference By City and Prefecture in Zhejiang province and Yangse River Delta. In the
appendices listed are Statistical Bulletins on Economy and Social Development Shaoxing
in 2019. Mainly Statistical Indicators and Charts at the beginning of each part. In addition,
Explanatory Notes on Main Statistical Indicators are provided at the end of each part.
Ⅲ . The units of measurement used in this book are internationally standard
measurement units.
Ⅳ . The major data sources of this publication are obtained from annual statistical
reports, and some from sample surveys.
Ⅴ. Statistical discrepancies due to rounding are not adjusted in this yearbook.
Ⅵ . The statistics in former statistical yearbook have been already checked.
The data in Shaoxing Statistical Yearbook 2019 shall be regarded as authentic ones.
Ⅶ . Notations used in this yearbook:
“ - ” indicates that the figure is not large enough to be measured with the smallest unit
or indicates 0 in the table;
“(blank)” indicates that the data not available;
“#”indicates the major items of the total.

01
目录
目录CONTENTS
特 载
SPECIAL ARTICLES
2019 年绍兴市国民经济和社会发展统计公报 …………………………………………………………001
一、综 合
CHAPTER1 GENERAL SURVEY
统计图………………………………………………………………………………………………………014
Statistical Chart
行政区划及自然资源………………………………………………………………………………………015
Administrative Divisions & Natural Resources
1-1 绍兴市行政区划 ……………………………………………………………………………………017
Divisions of Administrative Areas
1-2 分区、县(市)乡、镇、街道名称(2019 年末) ………………………………………………018
Names of Townships, Towns and Subdistricts in Each District and County (City)(End of 2019)
1-3 分区、县(市)日照时数(2019 年) ……………………………………………………………019
Sunshine Hours in Each District and County (City) (2019)
1-4 分区、县(市)降水量(2019 年) ………………………………………………………………019
Precipitation in Each District and County (City) (2019)
1-5 分区、县(市)平均气温(2019 年) ……………………………………………………………019
Average Temperature in Each District and County (City) (2019)
1-6 全市国民经济和社会发展主要指标 ………………………………………………………………020
National Economy and Social Development Indicators of Shaoxing
1-7 历年绍兴市生产总值 ………………………………………………………………………………024
Gross Domestic Product of Shaoxing Municipality over the Years
1-8 历年绍兴市生产总值构成 …………………………………………………………………………025
Composition of Gross Domestic Product over the Years
1-9 历年绍兴市生产总值发展指数 ……………………………………………………………………026
Indices of Gross Domestic Product of Shaoxing Municipality over the Years

02
绍兴市统计年鉴2020
1-10 历年绍兴市生产总值发展指数 …………………………………………………………………027
Indices of Gross Domestic Product of Shaoxing Municipality over the Years
1-11 历年越城区生产总值 ……………………………………………………………………………028
Gross Domestic Product in Yuecheng District over the Years
1-12 历年越城区生产总值构成 ………………………………………………………………………029
Composition of Gross Domestic Product in Yuecheng District over the Years
1-13 历年越城区生产总值发展指数 …………………………………………………………………030
Indices of Gross Domestic Product in Yuecheng District over the Years
1-14 历年越城区生产总值发展指数 …………………………………………………………………031
Indices of Gross Domestic Product in Yuecheng District over the Years
1-15 历年分区、县(市)生产总值 …………………………………………………………………032
Gross Domestic Product by District and County (City) over the Years
1-16 历年分区、县(市)生产总值发展指数 ………………………………………………………033
Indices of Gross Domestic Product by District and County (City) over the Years
1-17 历年分区、县(市)生产总值发展指数 ………………………………………………………034
Indices of Gross Domestic Product by District and County (City) over the Years
1-18 历年分区、县(市)人均地区生产总值(常住) ……………………………………………035
Per Capita Gross Domestic Product by District and County (City) over the Years (Calculated by
Permanent Residents Population)
1-19 历年分区、县(市)人均地区生产总值(户籍) ……………………………………………036
Per Capita Gross Domestic Product by District and County (City) over the Years (Calculated by
Household Registered Population)
1-20 历年分区、县(市)人均生产总值发展指数(常住) ………………………………………037
Indices of Per Capita Gross Domestic Product by District and County (City) over the Years
(Calculated by Permanent Residents Population)
1-21 历年分区、县(市)人均生产总值发展指数(户籍) ………………………………………038
Indices of Per Capita Gross Domestic Product by District and County (City) over the Years
(Calculated by Household Registered Population)
1-22 分区、县(市)生产总值(2019 年) …………………………………………………………039
Gross Domestic Product by District and County (City) (2019)
1-23 分区、县(市)生产总值发展指数(2019 年) ………………………………………………039
Indices of Gross Domestic Product by District and County (City) (2019)
主要统计指标解释…………………………………………………………………………………………040
Explanatory Notes on Main Statistical Indicators

03
目录
二、人口和劳动力
CHAPTER 2 POPULATION AND LABOUR FORCE
统计图………………………………………………………………………………………………………046
Statistical Chart
2-1 历年全市人口变动情况 ……………………………………………………………………………048
Population Changes of the Whole Municipality
2-2 历年年末总户数 ……………………………………………………………………………………049
Total Year-end Households over the Years
2-3 历年年末户籍人口 …………………………………………………………………………………050
Total Year-end Population over the Years
2-4 历年年末乡村、城镇人口 …………………………………………………………………………051
Total Year-End Rural and Urban Population over the Years
2-5 人口基本情况(2019 年末) ………………………………………………………………………052
Basic Statistics on Year-end Population (End of 2019)
2-6 年末人口变动情况(2019 年) ……………………………………………………………………052
Population Changes (2019)
2-7 离退休、退职人员人数及离退休金构成情况(2019 年) ………………………………………054
Number of Retired and Resigned Persons and Composition of Insurance and Welfare Funds (2019)
2-8 按三次产业划分的就业人员人数及构成 …………………………………………………………055
Number and Composition of Employed Persons by Type of Industry
2-9 城乡劳动力资源配置情况(2019 年末) …………………………………………………………056
Disposition of Urban and Rural Labor Resources (End of 2019)
2-10 历年非私营单位在岗职工年末人数 ……………………………………………………………058
Number of Staff and Workers in Non private-owned units over the Years
2-11 历年非私营国有经济单位在岗职工年末人数 …………………………………………………059
Number of Staff and Workers in State-Owned Units of Non Private Economy over the Years
2-12 历年非私营集体经济类型单位在岗职工年末人数 ……………………………………………060
Number of Staff and Workers in Collective-Owned Units of Non Private Economy over the Years
2-13 历年非私营其他各种经济类型单位在岗职工年末人数 ………………………………………061
Number of Staff and Workers in Other Ownership Units of Non Private Economy over the Years
2-14 历年非私营单位在岗职工工资总额 ……………………………………………………………062
Total Wages of Staff and Workers in Non Private-Owned Units over the Years
2-15 历年非私营国有经济单位在岗职工工资总额 …………………………………………………063
Total Wages of Staff and Workers in State-Owned Units of Non Private Economy over the Years

04
绍兴市统计年鉴2020
2-16 历年非私营集体经济单位在岗职工工资总额 …………………………………………………064
Total Wages of Staff and Workers in Collective-Owned Units of Non Private Economy over the Years
2-17 历年非私营其他各种经济类型单位在岗职工工资总额 ………………………………………065
Total Wages of Staff and Workers in Other Ownership Units of Non Private Economy over the Years
2-18 历年非私营单位在岗职工年平均工资 …………………………………………………………066
Average Annual Wage of Staff and Workers in Non Private-Owned Units over the Years
2-19 历年非私营国有经济单位在岗职工年平均工资 ………………………………………………067
Average Annual Wage of Staff and Workers in State-Owned Units of Non Private Economy over the Years
2-20 历年非私营集体经济单位在岗职工年平均工资 ………………………………………………068
Average Annual Wage of Staff and Workers in Collective-Owned Units of Non Private Economy over the Years
2-21 历年非私营其他各种经济类型单位在岗职工年平均工资 ……………………………………069
Average Annual Wage of Staff and Workers in Other Ownership Units of Non Private Economy over the Years
2-22 分区、县(市)非私营单位年末就业人员数(2019 年末) …………………………………070
Number of Employed Persons in Non Private-Owned Units by District and County (City) (End of 2019)
2-23 非私营单位工资情况(2019 年) ………………………………………………………………070
Remuneration Payment in Non Private-Owned Units (2019)
2-24 全市非私营单位劳动工资统计情况 (2019 年 ) …………………………………………………072
Total Wages of Staff and Workers of the Whole Municipality in Non Private-Owned Units (2019)
2-25 越城区非私营单位劳动工资统计情况 (2019 年 ) ………………………………………………074
Total Wages of Staff and Workers of the Yuecheng District in Non Private-Owned Units (2019)
主要统计指标解释…………………………………………………………………………………………076
Explanatory Notes on Main Statistical Indicators
三、农 业
CHAPTER 3 AGRICULTURE
统计图………………………………………………………………………………………………………080
Statistical Chart
3-1 历年农村劳动力(从业)人员(年末数) ………………………………………………………081
Rural Labor Force (employed persons) over the Years (Year-end)
3-2 农村劳动力资源分布情况 (2019 年末 ) ……………………………………………………………082
Rural Labor Force and Its Distribution(End of 2019)
3-3 历年分区、县(市)农林牧渔业总产值 …………………………………………………………083
Gross Output Value of Farming, Forestry, Animal Husbandry and Fishery by District and County (City)
over the Years

05
目录
3-4 历年全市农林牧渔业总产值构成 …………………………………………………………………084
Composition of Gross Output Value of Farming, Forestry, Animal Husbandry and Fishery over the Years
3-5 历年分区、县(市)农林牧渔业总产值发展指数 ………………………………………………085
Indices of Gross Output Value of Farming, Forestry, Animal Husbandry and Fishery over the Years
3-6 农林牧渔业总产值(2019 年) ……………………………………………………………………086
Gross Output Value of Farming, Forestry, Animal Husbandry and Fishery (2019)
3-7 农林牧渔业增加值 (2019 年 ) ………………………………………………………………………086
The Value-added of Farming, Forestry, Animal Husbandry and Fishery (2019)
3-8 历年粮食总产量 ……………………………………………………………………………………087
Total Output of Grain over the Years
3-9 历年茶叶总产量 ……………………………………………………………………………………088
Total Output of Tea over the Years
3-10 历年猪牛羊肉产量 ………………………………………………………………………………089
Output of Pork, Beef and Mutton over the Years
3-11 历年蚕茧产量 ……………………………………………………………………………………090
Total Output of Silkworm Cocoon over the Years
3-12 历年水产品总产量 ………………………………………………………………………………091
Total Output of Aquatic Products over the Years
3-13 农作物播种面积(2019 年) ……………………………………………………………………092
Total Sown Area of Farm Crops (2019)
3-14 农作物总产量情况(2019 年) …………………………………………………………………096
Total Output of Farm Crops (2019)
3-15 林业生产情况(2019 年) ………………………………………………………………………098
Basic Indicators on Forestry (2019)
3-16 桑、茧、茶叶、水果生产情况(2019 年) ……………………………………………………100
Basic Indicators on Mulberry, Silk-worm Cocoons, Tea and Fruits (2019)
3-17 畜牧业生产情况(2019 年) ……………………………………………………………………102
Basic Indicators on Animal Husbandry (2019)
3-18 水产养殖面积(2019 年) ………………………………………………………………………106
Water Aquiculture Area (2019)
3-19 水产品产量(2019 年) …………………………………………………………………………108
Output of Aquatic Products (2019)
3-20 农业机械年末拥有量(2019 年末) ……………………………………………………………110
Possession of Agricultural Machinery (End of 2019)

06
绍兴市统计年鉴2020
3-21 农业能源和农业物资消耗情况(2019 年) ……………………………………………………112
Consumption of Agricultural Energy and Material (2019)
3-22 农田水利情况(2019 年) ………………………………………………………………………114
Water Conservancy Facilities of Farmland (2019)
主要统计指标解释…………………………………………………………………………………………116
Explanatory Notes on Main Statistical Indicators
四、工 业
CHAPTER 4 INDUSTRY
统计图………………………………………………………………………………………………………120
Statistical Chart
4-1 分区、县(市)规模以上工业企业主要经济指标(2019 年) …………………………………121
Main Economic Indicators of Industrial Enterprises above Designated Size (2019)
4-2 分区、县(市)规模以下工业总产值(2019 年) ………………………………………………121
Output Value of Industry below Designated Size (2019)
4-3 历年规模以上工业企业单位数 ……………………………………………………………………122
Number of Industrial Enterprises above Designated Size over the years
4-4 历年规模以上工业企业总产值 ……………………………………………………………………123
Total Output Value of Industrial Enterprises above Designated Size over the years
4-5 历年规模以上工业企业营业收入 …………………………………………………………………124
Operating Income of Industrial Enterprises above Designated Size over the years
4-6 历年规模以上工业企业利税总额 …………………………………………………………………125
Total Profits and Taxes of Industrial Enterprises above Designated Size over the years
4-7 历年规模以上工业企业利润总额 …………………………………………………………………126
Total Profits of Industrial Enterprises above Designated Size over the years
4-8 历年规模以上工业企业资产总计 …………………………………………………………………127
Total Assets of Industrial Enterprises above Designated Size over the years
4-9 历年规模以上工业企业负债总计 …………………………………………………………………128
Total Liabilities of Industrial Enterprises above Designated Size over the years
4-10 历年规模以上工业企业职工平均人数 …………………………………………………………129
Average Number of Employees of Industrial Enterprises above Designated Size over the years
4-11 规模以上工业企业主要经济效益指标(2019 年) ……………………………………………130
Main Indicators on Economic Benefit of above Designated Size Industrial Enterprises (2019)
4-12 规模以上工业企业主要工业产品生产总量(2019 年) ………………………………………132
Output of Main Industrial Products of above Designated Size Industrial Enterprises (2019)

07
目录
4-13 分地区、分行业规模以上工业企业总产值(2019 年) ………………………………………140
Gross Industrial Output Value of above Designated Size Industrial Enterprises by Sector and Area(2019)
4-14 分地区、分行业规模以上工业企业增加值(2019 年) ………………………………………142
Value-added of Industry of above Designated Size Industrial Enterprises by Sector and Area(2019)
4-15 规模以上工业企业主要财务指标(2019 年) …………………………………………………144
Main Financial Indicators of above Designated Size Industrial Enterprises (2019)
4-16 规模以上外商和港澳台投资工业企业主要财务指标(2019 年) ……………………………160
Main Financial Indicators of Foreign Funded Industrial Enterprises and Enterprises Funded by
Entrepreneurs from Hong kong,Macao and Taiwan above Designated Size(2019)
4-17 全市大中型工业企业主要财务指标(2019 年) ………………………………………………168
Main Financial Indicators of Large and Medium-sized Industrial Enterprises(2019)
4-18 全市规模以上工业企业分行业主要能源消费量(2019 年) …………………………………176
Main Resources Consumption of above Designated Size Industrial Enterprises by Sector(2019)
4-19 分区、县(市)规模以上工业企业能源综合利用及水消费情况(2019 年) ………………178
Energy Comprehensive Utilization and Water Consumption of above Designated Size Industrial
Enterprises(2019)
4-20 规模以上工业企业分行业分地区取水量(2019 年) …………………………………………180
Water Withdrawals of above Designated Size Industrial Enterprises by Sector (2019)
4-21 历年能源消费主要指标 …………………………………………………………………………182
Main Indicators of Resource Consumption Enterprises over the Years
主要统计指标解释…………………………………………………………………………………………183
Explanatory Notes on Main Statistical Indicators
五、交通、邮电及电力
CHAPTER 5 TRANSPORTATION, POST AND TELECOMMUNICATIONS, ELECTRICITY
统计图………………………………………………………………………………………………………190
Statistical Chart
5-1 历年年末公路通车里程 ……………………………………………………………………………192
Total Length of Highways over the Years
5-2 历年全社会客货运输量 ……………………………………………………………………………193
Total Passenger and Freight Traffic over the Years
5-3 分区、县(市)民用车辆拥有量(2019 年末) …………………………………………………194
Number of Civil Vehicles Owned by District and County (City) (End of 2019)
5-4 运输船舶数(2019 年末) …………………………………………………………………………196
Number of Transport Vessels(End of 2019)

08
绍兴市统计年鉴2020
5-5 各类公路到达情况(2019 年末) …………………………………………………………………196
Length of Highways by Level (End of 2019)
5-6 全市公路到达情况(2019 年末) …………………………………………………………………198
Length of Highways (End of 2019)
5-7 全社会客货运输量(2019 年) ……………………………………………………………………198
Passenger Traffic and Freight Traffic (2019)
5-8 历年邮电业务收入 …………………………………………………………………………………200
Business Volume of Post and Telecommunications over the Years
5-9 历年年末固定电话用户数 …………………………………………………………………………200
Number of Fixed Telephone over the Years
5-10 历年年末移动电话用户数 ………………………………………………………………………201
Number of Mobile Telephone Subscribers over the Years
5-11 历年互联网用户数 ………………………………………………………………………………201
Number of Subscribers of Internet Services over the Years
5-12 邮政基本情况(2019 年) ………………………………………………………………………202
Basic Statistics on Post (2019)
5-13 电信基本情况(2019 年) ………………………………………………………………………204
Basic Statistics on Telecommunications (2019)
5-14 历年全社会用电量 ………………………………………………………………………………206
Electricity Consumption over the Years
5-15 历年工业用电量 …………………………………………………………………………………207
Consumption of Industrial Electricity over the Years
5-16 历年生活用电量 …………………………………………………………………………………208
Residents Consumption of Electricity for Non-production over the Years
5-17 供用电设备情况(2019 年) ……………………………………………………………………209
Residents Consumption of Electricity for Non-production (2019)
5-18 水、火、太阳能发电设备情况(2019 年) ……………………………………………………209
Equipment in Water, Fire and Solar Power (2019)
5-19 全社会用电量(2019 年) ………………………………………………………………………210
Electricity Consumption (2019)
主要统计指标解释…………………………………………………………………………………………214
Explanatory Notes on Main Statistical Indicators

09
目录
六、固定资产投资和建筑业
CHAPTER 6 INVESTMENT FIXED ASSET, CONSTRUCTION
统计图………………………………………………………………………………………………………218
Statistical Chart
6-1 历年分区、县(市)固定资产投资完成情况 ……………………………………………………219
Investment in Fixed Assets by District and County (City)
6-2 分区、县(市)固定资产投资增速(2019 年) …………………………………………………220
Investment in Fixed Assets Growth by District and County (City) (2019)
6-3 历年房地产开发投资主要指标 ……………………………………………………………………226
Main Statistical Indicators of Investment in Real Estate Development over the Years
6-4 分区、县(市)房地产开发投资(2019 年) ……………………………………………………228
Investment in Real Estate Development in Each District and County (City) (2019)
6-5 分区、县(市)建筑企业生产情况(2019 年) …………………………………………………230
Productive Condition and Financial Indicators of Construction Enterprises by District and County (City) (2019)
6-6 全市建筑企业生产情况(2019 年) ………………………………………………………………232
Productive Condition of Construction Enterprises (2019)
6-7 全市建筑企业财务情况(2019 年) ………………………………………………………………234
Financial Indicators of Construction Enterprises (2019)
6-8 分区、县(市)建筑企业生产、财务情况(2019 年) …………………………………………236
Productive Condition and Financial Indicators of Construction Enterprises by District and County (City) (2019)
主要统计指标解释…………………………………………………………………………………………238
Explanatory Notes on Main Statistical Indicators
七、国内贸易和对外经济
CHAPTER 7 DOMESTIC TRADE, FOREIGN TRADE AND ECONOMIC COOPERATION
统计图………………………………………………………………………………………………………242
Statistical Chart
7-1 历年分区、县(市)社会消费品零售额 …………………………………………………………244
Total Retail Sales of Consumer Goods in Each District and County (City) over the Year
7-2 历年社会消费品零售额(按行业分) ……………………………………………………………245
Total Retail Sales of Consumer Goods over the Years (by Sector)
7-3 分区、县(市)社会消费品零售总额(2019 年) ………………………………………………246
Total Retail Sales of Consumer Goods in Each District and County (City) (2019)

10
绍兴市统计年鉴2020
7-4 全市限额以上批发零售贸易企业主要商品分类销售额(2017-2019 年) ……………………248
Total Sales of Enterprises above Designated Size in Wholesale and Retail Trade by Category of Main
Commodities (2017-2019)
7-5 全市限额以上批发零售贸易企业财务状况(2019 年) …………………………………………252
Main Financial Indicators of Purchases, Sales and Inventory of Wholesale and Retail Trade above
Designated Size (2019)
7-6 全市限额以上住宿餐饮企业财务状况(2019 年) ………………………………………………260
Main Financial Indicators of Accommodation and Catering Serviced Enterprises Above Designated Size (2019)
7-7 全市规模以上服务业企业主要经济指标(2019 年) ……………………………………………264
Main Indicators of Service Enterprises Above Designated Size(2019)
7-8 分区、县(市)商品交易市场成交情况(2019 年) ……………………………………………268
Transactions at Commodity Market in Each District and County (City) (2019)
7-9 历年分区、县(市)合同利用外资 ………………………………………………………………270
Foreign Capital in the Signed Contracts in Each District and County (City) over the Years
7-10 历年分区、县(市)实际利用外资 ……………………………………………………………271
Foreign Capital Actually Used in Each District and County (City) over the Years
7-11 分区、县(市)利用外资情况(2019 年) ……………………………………………………272
Utilization of Foreign Capital in Each District and County (City) (2019)
7-12 境外投资情况(2019 年) ………………………………………………………………………273
Investment Abroad (2019)
7-13 省级及以上经济开发区利用外资情况(2019 年) ……………………………………………273
The Situation of Utilizing Foreign Capital of Provincial Level and Above Economic Development Zone (2019)
7-14 历年分区、县(市)进出口总额 ………………………………………………………………274
Imports and Exports in Each District and County (City) over the Years
7-15 历年分区、县(市)自营出口额 ………………………………………………………………275
Total Export in Each District and County (City) over the Years
7-16 主要洲、国别(地区)外贸进出口 ……………………………………………………………276
Import and Export by Continent and County (Region)
7-17 进出口贸易方式(2014-2019 年) ………………………………………………………………277
The Types of Import and Export Goods (2014-2019)
7-18 主要进口及出口商品额 (2014-2019 年 ) ………………………………………………………278
The Value of Import and Export Goods (2014-2019)
7-19 外贸企业获权情况(2019 年) …………………………………………………………………279
Basic Conditions of Foreign Trade Enterprises Being Approved (2019)
7-20 对外经济技术合作情况(2019 年) ……………………………………………………………279
Economic Cooperation with Foreign Countries or Territories (2019)

11
目录
主要统计指标解释…………………………………………………………………………………………280
Explanatory Notes on Main Statistical Indicators
八、财政、金融、保险
CHAPTER 8 PUBLIC FINANCE, BANKING AND INSURANCE
统计图………………………………………………………………………………………………………284
Statistical Chart
8-1 历年财政收入 ………………………………………………………………………………………285
Financial Revenue over the Years
8-2 历年一般公共预算收入 ……………………………………………………………………………286
General Public Budget Revenues over the Years
8-3 历年一般公共预算支出 ……………………………………………………………………………287
General Public Budget Expenditures over the Years
8-4 一般公共预算收入(2019 年) ……………………………………………………………………288
General Public Budget Revenues(2019)
8-5 一般公共预算支出(2019 年) ……………………………………………………………………290
General Public Budget Expenditures (2019)
8-6 历年金融机构年末人民币存款余额 ………………………………………………………………292
RMB Deposits Balance in Financial Institutions (Year-end) Over the Years
8-7 历年住户人民币存款 ………………………………………………………………………………293
Household Deposits Over the Years
8-8 历年金融机构人民币贷款余额 ……………………………………………………………………294
RMB Loans Balance in Financial Institutions (Year-end) Over the Years
8-9 金融机构本外币存、贷款余额基本情况(2019 年末) …………………………………………295
Deposits and Loans Balance of Financial Institutions (End of 2019)
8-10 金融机构外币存、贷款余额基本情况(2019 年末) …………………………………………296
Foreign Deposits and Loans Balance of Financial Institutions (End of 2019)
8-11 金融机构人民币存、贷款余额基本情况(2019 年末) ………………………………………297
RMB Deposits and Loans Balance of Financial Institutions (End of 2019)
8-12 历年保费收入 ……………………………………………………………………………………298
Premium of Insurance over the Years
8-13 历年赔偿费支出 …………………………………………………………………………………299
Settled Claim and Payment of Insurance over the Years
8-14 保险事业情况(2019 年) ………………………………………………………………………300
Basic Statistics on Insurance (2019)

12
绍兴市统计年鉴2020
8-15 历年分区、县(市)证券市场基本情况 ………………………………………………………301
Basic Statistics of stock market over the Years
主要统计指标解释…………………………………………………………………………………………302
Explanatory Notes on Main Statistical Indicators
九、物价、人民生活
CHAPTER 9 PRICES AND PEOPLE'S LIVELIHOOD
统计图………………………………………………………………………………………………………306
Statistical Chart
9-1 历年市区物价指数 …………………………………………………………………………………307
Price Indices of Urban District over the Years
9-2 市区居民消费价格指数 (2019 年 ) …………………………………………………………………308
Consumer Price Indices by Urban District (2019)
9-3 省内各市居民消费价格指数(2019 年) …………………………………………………………310
Residential Consumer Price Indices of Zhejiang by City (2019)
9-4 省内各市商品零售价格指数(2019 年) …………………………………………………………312
Retail Price Indices of Commodities of Zhejiang by City (2019)
9-5 全市工业品价格指数(2019 年) …………………………………………………………………314
Ex-Factory Price Indices of Industrial Products (2019)
9-6 历年全体居民家庭收支情况 ………………………………………………………………………315
Basic Statistics on Residential Households in the city over the Years
9-7 分区、县(市)全体居民家庭收支基本情况 (2019 年 ) …………………………………………316
Basic Income and Expenditure of Residential Households in Each County (City) (2019)
9-8 历年城镇常住居民家庭收支情况 …………………………………………………………………318
Basic Statistics on Urban Households over the Years
9-9 分区、县 ( 市 ) 城镇常住居民家庭收支基本情况 (2019 年 ) ……………………………………320
Basic Income and Expenditure of Urban Households in Each District and County (City) (2019)
9-10 分区、县(市)每百户城镇居民家庭主要消费品拥有量(2019 年末) ……………………322
Possession of Main Consumer Goods Per 100 Households In Each District and County (City) (End of 2019)
9-11 历年越城区城镇常住居民家庭基本情况 ………………………………………………………324
Basic Statistics on Urban Households in Yuecheng District
9-12 历年农村常住居民人均可支配收入 ……………………………………………………………326
Per Capita Disposable Income of Rural Households over the Years
9-13 历年农村常住居民人均生活消费支出 …………………………………………………………327
Per Capita Consuming Expenditure of Rural Households over the Years

13
目录
9-14 分区、县(市)农村住户家庭生活基本情况(2019 年) ……………………………………328
Living Conditions of Rural Households in Each District and County (City) (2019)
9-15 每百户农村居民家庭耐用消费品拥有情况(2019 年) ………………………………………330
Durable Consumer Goods Owned Per 100 Rural Households (2019)
主要统计指标解释…………………………………………………………………………………………331
Explanatory Notes on Main Statistical Indicators
十、文化、教育、科技和卫生事业
CHAPTER 10 CULTURE, EDUCATION, TECHNOLOGY SCIENCE AND PUBLIC HEALTH
10-1 文化事业及活动情况(2019 年) ………………………………………………………………336
Cultural Undertaking and Activities (2019)
10-2 历年普通高校、中等职业教育基本情况 ………………………………………………………338
Basic Statistics on Education of Regular Higher Schools and Secondary Vocational Schools over the Years
10-3 历年普通高中在校学生数 ………………………………………………………………………339
Students Enrollment of Regular Senior School over the Years
10-4 历年初中在校学生数 ……………………………………………………………………………340
Students Enrollment of Junior School over the Years
10-5 历年普通中学专任教师数 ………………………………………………………………………341
Number of Full-time Teachers at Regular Secondary Schools over the Years
10-6 历年小学在校学生数 ……………………………………………………………………………342
Students Enrollment at Primary Schools over the Years
10-7 历年小学专任教师 ………………………………………………………………………………343
Full-time Teachers at Primary Schools over the Years
10-8 全市各级各类学校情况 (2019 年 ) ………………………………………………………………344
Basic Statistics on Schools of Different Levels and Types (2019)
10-9 普通高校教育情况(2019 年) …………………………………………………………………346
Basic Statistics on Education of Regular Higher Schools (2019)
10-10 中等职业学校基本情况(2019 年) ……………………………………………………………346
Basic Statistics on Vocational Secondary Schools (2019)
10-11 普通中学基本情况 (2019 年 ) ……………………………………………………………………347
Regular Secondary Schools (2019)
10-12 小学教育基本情况(2019 年) …………………………………………………………………348
Basic Statistics on Primary Education (2019)
10-13 幼儿园基本情况(2019 年) ……………………………………………………………………348
Basic Statistics on Kindergartens (2019)

14
绍兴市统计年鉴2020
10-14 义务教育普及情况(2019 年) …………………………………………………………………349
Popularity of Compulsory Education (2019)
10-15 研究与开发成果获奖情况(2019 年) …………………………………………………………350
Prizes of Research and Development Achievement (2019)
10-16 本地专利情况(2019 年) ………………………………………………………………………350
Basic Statistics on Local Patents (2019)
10-17 高新技术产业发展情况(2018-2019 年) ……………………………………………………351
Statistics on High and New Technology Enterprises (2018-2019)
10-18 科技创新服务体系建设情况(2017-2019 年) ………………………………………………351
Construction of Science and Technology Innovation Service (2017-2019)
10-19 规模以上工业企业科技活动及相关情况(2019 年) …………………………………………352
Basic statistics on R&D Activities of Industrial Enterprises above Designated Size(2019)
10-20 历年分区、县(市)R&D 经费支出 ……………………………………………………………354
R&D Expenditure by District and County (City) over the Years
10-21 历年分区、县(市)R&D 经费支出占 GDP 比重 ……………………………………………355
Proportion of R&D Expenditure in GDP by District and County (City) over the Years
10-22 历年医疗机构数 …………………………………………………………………………………356
Number of Health Institutions over the Years
10-23 历年卫生机构床位数 ……………………………………………………………………………357
Number of Health Beds over the Years
10-24 历年卫生技术人员数 ……………………………………………………………………………358
Number of Medical Technical Personnel over the Years
10-25 历年卫生技术人员中:医生人数 ………………………………………………………………359
Number of Doctors over the Years
10-26 卫生机构、床位情况(2019 年) ………………………………………………………………360
Basic Statistics on Healthcare Institutions and Beds (2019)
10-27 卫生事业从业人员情况(2019 年) ……………………………………………………………362
Persons Engaged in Health Care Institutions (2019)
10-28 体育事业发展情况(2019 年) …………………………………………………………………362
Basic Statistics on Sport Development (2019)
主要统计指标解释…………………………………………………………………………………………364
Explanatory Notes on Main Statistical Indicators

15
目录
十一、其 他
CHAPTER 11 OTHERS
11-1 历年个体私营企业基本情况 ……………………………………………………………………369
Basic Statistics on Self-Employed Individuals and Private Enterprises over the Years
11-2 个体工商户数及人数(2019 年) ………………………………………………………………370
Number of Self-employed Industry and Commerce Enterprises and Personnel (2019)
11-3 私营企业基本情况(2019 年) …………………………………………………………………372
Number of Private Enterprises and Its Investors (2019)
11-4 环境基本情况(2019 年) ………………………………………………………………………374
Environment Protection (2019)
11-5 历年工业废气排放和处理情况 …………………………………………………………………376
Industrial Waste Gas Discharging and Processing Over the Years
11-6 历年工业固体废物排放和处理情况 ……………………………………………………………377
Emission and Treatment of Industrial Solid Wastes Over the Years
11-7 历年废水排放和处理情况 ………………………………………………………………………378
Waste Water Discharging and Processing Over the Years
11-8 环保税征收及企事业污染治理情况(2019 年) ………………………………………………380
Imposition and Utilization of Pollution Fees and Pollution Treatment (2019)
11-9 城市公用事业基本情况(2019 年) ……………………………………………………………382
Basic Statistics on Urban Public Utilities (2019)
11-10 历年全市档案事业机构、人员、设备情况 ……………………………………………………384
Institutions, Persons and Facility of Archives over the Years
11-11 历年档案馆档案资料馆藏和利用情况 …………………………………………………………386
File-stored and Used in the Archives Over the Years
11-12 历年计划生育率 …………………………………………………………………………………388
Rate of Birth under Control over the Years
11-13 历年已婚育龄妇女生育率 ………………………………………………………………………389
Birth Rate of Married Woman at Child-bearing Age over the Years
11-14 社会福利事业单位基本情况(2019 年) ………………………………………………………390
Basic Statistics on Social Welfare Units (2019)
11-15 城市最低生活保障及农村最低生活保障情况(2019 年) ……………………………………390
Urban and Rural Lowest Living Ensure Insurance (2019)
11-16 享受国家优抚、补助及救济情况(2019 年) …………………………………………………392
Enjoying Subsidy, Commiseration and Relief of Country (2019)

16
绍兴市统计年鉴2020
11-17 婚姻登记情况 (2019 年 ) …………………………………………………………………………392
Basic Statistics on Marriage Registration (2019)
11-18 广播、电视机构情况(2019 年) ………………………………………………………………394
Institutions of Broadcasting and Television (2019)
11-19 广播、电视发射设备情况(2019 年) …………………………………………………………394
Transmission Facilities of Broadcasting and Television (2019)
11-20 有线广播基本情况(2019 年) …………………………………………………………………396
Basic Statistics on Wire-broadcasting (2019)
11-21 广播、电视制作情况(2019 年) ………………………………………………………………396
Production of Broadcasting, Television Programs (2019)
11-22 质量技术监督基本情况(2019 年) ……………………………………………………………398
Basic Statistics on Quality Technological Supervising (2019)
11-23 历年质量技术监督经费和固定资产总额 ………………………………………………………400
Funds and Fix Asset Investment of Quality Technological Supervising over the Years
11-24 历年绍兴市接待游客情况 ………………………………………………………………………401
Basic Statistics on Reception of Tourists of Shaoxing Municipality over the Years
11-25 历年分区、县(市)国内游客人数 ……………………………………………………………402
Number of Domestic Tourists by Each District and County (City) over the years
11-26 历年分区、县(市)海外游客人数 ……………………………………………………………403
Number of Overseas Tourists by Each District and County (City) over the years
11-27 历年分区、县(市)国内旅游收入 ……………………………………………………………404
Domestic Tourism Revenue by Each District and County (City) over the years
11-28 历年分区、县(市)海外旅游收入 ……………………………………………………………405
Overseas Tourism Revenue by Each District and County (City) over the years
11-29 旅游部门接待能力(2019 年) …………………………………………………………………406
Reception of Tourism Departments (2019)
11-30 绍兴市友城缔结情况(2019 年末) ……………………………………………………………407
Foreign Friendly Cities of Shaoxing (End of 2019)
主要统计指标解释…………………………………………………………………………………………409
Explanatory Notes on Main Statistical Indicators …………………………………………………………410

17
目录
十二、浙江省及长江三角洲地区城市资料
CHAPTER 12 REFERENCE BY CITY AND PREFECTURE IN ZHEJIANG
主要统计指标………………………………………………………………………………………………415
Main Statistical Indicators
12-1 浙江省各地主要经济指标(2019 年) …………………………………………………………416
Main Economic Indicators by City and Prefecture in Zhejiang Province (2019)
12-2 长江三角洲地区城市主要经济指标 (2019 年 ) …………………………………………………428
Main Economic Indicators by City in the Yangtse River Delta (2019)
附录 1 绍兴市第六次人口普查资料 ……………………………………………………………………432
Basic information of the sixth census of Shaoxing
附录 2 全市第四次经济普查法人单位数 ………………………………………………………………433
Number of units in the fourth economic census of Shaoxing


特载SPECIAL ARTICLES

002
绍兴市统计年鉴2020
2019 年绍兴市国民经济和社会发展统计公报
2019 年,市委、市政府高举习近平新时代中国特色社会主义思想伟大旗帜,以“八八战略”为总纲,深入贯
彻落实市委八届五次、六次全会精神,全面落实“六稳”工作要求,紧紧围绕年初确定的目标任务,找差距、抓
落实,坚定不移推动经济社会高质量发展。全年经济高开稳走提质,社会民生平安和谐稳定。
一、综 合
2019 年,全市生产总值(GDP)5781 亿元,按可比价格计算,比上年增长 7.2%,增速高于全省平均 0.4 个
百分点,居全省第五位。分产业看,第一产业增加值 208 亿元,增长 2.3% ;第二产业增加值 2771 亿元,增长
7.0% ;第三产业增加值 2802 亿元,增长 7.8%。三次产业结构为 3.6 :47.9 :48.5, 全年三产比重首次超过二产。
全年财政总收入 825 亿元,比上年增长 1.7%,其中一般公共预算收入 528 亿元,增长 5.4%。一般公共预
算支出 641 亿元,增长 15.1%。其中民生支出 503 亿元,增长 16.8%。
居民消费价格比上年上涨 2.7%。八大类消费品价格指数“五涨一平两跌”,其中,医疗保健、食品烟酒、教
育文化和娱乐、其他用品和服务、生活用品及服务类上涨 7.2%、6.3%、3.5%、2.0%、0.8%,衣着类同比持平,交通
和通信、居住类下降 0.8%、0.1%。工业生产者出厂价格下降 1.9%,购进价格下降 3.5%。
绍兴市统计局 国家统计局绍兴调查队
表 1 2019 年全市居民消费价格指数
指 标 上年 =100
居民消费价格指数 102.7
一、食品烟酒 106.3
1. 食品 108.2
# 粮食 100.4

003
特载
全年新增市场主体 9.26 万户,其中,企业 3.03 万户,比上年增长 7.3% ;个体工商户 6.23 万户,增长 3.2%。
“个转企”2707 家。年末,在册市场主体 62.15 万户,比上年增长 9.8%,其中企业 19.66 万户,增长 10.7%。注
册资本(金)14321 亿元,增长 18.6%。
二、农业和农村建设
全年农林牧渔业总产值 316 亿元,按可比价格计算,比上年增长 2.5%。早稻种植面积 23.77 万亩,总产量
10.87 万吨,分别下降 1.8% 和 3.4%。年末,生猪存栏 43.02 万头,比上年下降 18.9%。水产品产量 11.93 万吨,
增长 3.0%。名优茶产量 1 万吨、产值 22.7 亿元,分别增长 12.5%、7.3%。
表 2 2019 年农业生产情况
续表
指 标 单 位 绝对数 比上年增长 %
一、农林牧渔业总产值 亿元 316.18 2.5
二、农作物播种面积 千公顷 233.43 1.2
# 粮食作物播种面积 千公顷 120.87 1.0
三、主要农产品产量
# 粮食总产量 万吨 78.28 0.9
油料作物 万吨 3.32 25.9
棉花 吨 382 -10.7
指 标 上年 =100
菜 104.2
畜肉类 130.4
水产品 97.2
干鲜瓜果类 113.3
2. 茶及饮料 101.9
3. 烟酒 101.1
4. 在外餐饮 104.0
二、衣着 100.0
三、居住 99.9
四、生活用品及服务 100.8
五、交通和通信 99.2
六、教育文化和娱乐 103.5
七、医疗保健 107.2
八、其他用品和服务 102.0

004
绍兴市统计年鉴2020
指 标 单 位 绝对数 比上年增长 %
甘蔗 万吨 1.71 -2.4
水果 万吨 59.30 -0.8
茶叶 吨 41729 0.7
蚕茧 吨 263 -25.9
水产品 吨 119336 3.0
续表
全年实施粮食生产功能区提标改造 3.76 万亩,新创建粮食绿色高产示范片 14 个。年末共有农民专业合
作社 4369 家、家庭农场 2730 家、省级以上农业龙头企业 41 家。
全面消除集体经济年总收入 20 万元、经营性收入 6 万元以下薄弱村。低收入农户人均可支配收入 14403
元,增长 12.5%。实施“闲置农房激活计划”,带动农户就业 16847 人,村集体收入和农户农民财产性收入分别
增加 1.82 亿元、2.59 亿元,入选“2019 年浙江省改革创新优秀实践案例”。
新认证绿色食品基地 9800 亩,绿色食品 13 只。有效期内绿色食品认证数量达 114 只,无公害农产品认
证数量为 498 只,地理标志产品 13 只。选拔首批乡村振兴“领雁计划”人才 105 人,完成农民培训 9.87 万人次。
畜禽粪污综合利用率 91.0%,农作物秸秆综合利用率 95.6%,农村清洁能源利用率 83.0%,农药废弃包装物处
置率 100%,农村生活垃圾分类覆盖率 86.7%。
三、工业经济
全年规模以上工业增加值 1400 亿元,比上年增长 8.4%,高于全省平均 1.8 个百分点,增速居全省前三
位。规上工业 36 个行业大类中,25 个行业增加值实现增长,行业增长面 69.4%。增加值总量前十位行业中,
非金属矿物制品业、化学纤维制造业、化学原料和化学制品制造业增长较快,增加值分别增长 20.8%、17.3%、
17.2%。
表 3 2019 年主要工业产品产量
产 品 单 位 产 量 比上年增长 %
纱 万吨 17.65 -16.7
布 亿米 13.37 -0.6
印染布 亿米 203.99 17.2
领带 万条 4404.50 -18.7
袜子 亿双 31.10 -4.2
家具 万件 696.72 -18.2
染料 万吨 56.91 1.1
合成纤维聚合物 万吨 124.33 -7.7
化学药品原药 万吨 11.64 1.8

005
特载
续表
规上工业中高新技术、战略性新兴产业增加值比上年下降 3.8% 和 4.1%,占规上工业比重分别为 50.6%
和 41.9% ;数字经济核心产业制造业增加值增长 8.0%。规上工业五大传统制造业增加值增长 11.5%。
年末,省级工业互联网平台创建名单 14 家,轴承云、袜业云列入省第一批工业互联网推广名单。上虞 e
游小镇、柯桥经济技术开发区等 4 家入围 2019 年度浙江省数字化示范园区,嵊州云电商产业园入围 2019 年
度浙江省数字化试点园区。
四、固定资产投资和房地产
全年固定资产投资比上年增长 10.2%,增速比上年提升 8.3 个百分点。其中民间项目投资、交通投资、生
态环保和公共设施投资、高新技术产业投资均超过 10% 增长目标,分别增长 22.6%、45.0%、17.2%、43.4%,居
全省第二、第二、第一和第三位。
房地产开发投资 825 亿元,比上年增长 3.4%。其中,住宅投资 630 亿元,下降 0.6%。商品房销售面积
1105 万平方米,销售额 1338 亿元,分别比上年增长 3.5% 和 10.6%。
五、国内贸易和对外经济
全年社会消费品零售总额 2207 亿元,比上年增长 10.0%,增速高于全省平均 1.3 个百分点,居全省第二
位。限上单位分类商品零售额,穿类商品增长 30.7% ;吃类商品增长 15.5% ;石油及制品类、汽车类增长 7.2%、
2.8% ;通讯器材类增长 1.6%。新能源汽车、可穿戴智能设备等新型消费品零售额均增长 2.6 倍,智能家用电
器和音像器材增长 42.0%。网络零售额 638 亿元,居民网络消费 695 亿元,分别比上年增长 20.0% 和 17.2%。
产 品 单 位 产 量 比上年增长 %
化学纤维 万吨 369.87 -3.2
塑料制品 万吨 133.80 12.8
水泥 万吨 1003.40 19.5
平板玻璃 万重量箱 852.45 3.1
钢材 万吨 216.54 15.4
滚动轴承 万套 72835 16.7
交流电动机 万千瓦 3471.45 6.6
太阳能电池 万千瓦 23.81 -31.8
电光源 万只 10914 -20.0
汽车仪器仪表 万台 125.95 -9.4
黄酒 万升 30722.1 -9.0
伞 万把 11578 -8.8
珍珠饰品 亿元 3.31 -22.3

006
绍兴市统计年鉴2020
跨境电商网络零售出口 13 亿元,增长 45.0%。
表 4 2019 年社会消费品零售总额
表 5 2019 年进出口主要分类情况
指 标 绝对数(亿元) 比上年增长 %
社会消费品零售总额 2207 10.0
一、按销售单位所在地分
1. 城镇 1902 9.1
2. 乡村 305 15.3
二、按行业分组
1. 批发业 177 20.0
2: 零售业 1804 8.0
3. 住宿业 42 16.2
4. 餐饮业 184 19.5
指 标 绝对数(亿元) 比上年增长(%)
货物进出口总额 2459 9.8
一、货物出口额 2251 10.0
# 一般贸易 2152 10.3
加工贸易 99 4.8
# 纺织品及服装 1354 10.9
机电产品 431 4.7
化工及相关产品 172 2.8
农副产品 37 -18.8
高新技术产品 45 17.1
二、货物进口额 208 7.1
# 一般贸易 153 6.1
加工贸易 43.7 8.7
年末,纳入统计的商品交易市场 396 家,其中成交额超亿元市场 65 家,超十亿元市场 22 家,超百亿元市
场 7 家。全年商品市场成交额 3814 亿元,比上年增长 7.6%,其中消费品市场成交额 2411 亿元,增长 10.0% ;
生产资料市场成交额 1403 亿元,增长 3.6%。
全年货物进出口 2459 亿元,比上年增长 9.8%。其中,出口 2251 亿元,增长 10.0% ;进口 208 亿元,增长
7.1%。按贸易方式分,加工贸易进出口 142 亿元,一般贸易进出口 2305 亿元,其他贸易进出口 12.1 亿元。有
进出口国家和地区 215 个。“一带一路”沿线国家进出口 1047 亿元,比上年增长 17.2%,其中出口 987 亿元,
增长 17.3%。
实现服务进出口总额 141 亿元,比上年增长 12.0%,其中,服务出口总额 110 亿元,增长 16.1%,服务进口

007
特载
总额 31 亿元,与上年基本持平。对“一带一路”沿线国家和地区服务出口总额 31 亿元。
全年新批项目 287 个,比上年增长 24.8%,合同外资(省口径)25.1 亿美元,增长 18.0%,合同外资(部口径)
24.6 亿美元,增长 35.8%。实到外资(省口径)15.3 亿美元,增长 12.9% ;实到外资(部口径)6.6 亿美元。
六、交通运输、邮电和旅游
全年货物运输总量 1.53 亿吨,比上年增长 7.9%。其中,公路货物运输总量 1.36 亿吨,增长 8.1% ;水运货
物运输总量 1662 万吨,增长 6.2%。货物运输总周转量 146.22 亿吨公里,增长 14.2%。其中,公路货物运输周
转量 111.24 亿吨公里,增长 16.9% ;水运货物运输周转量 34.98 亿吨公里,增长 6.1%。
旅客运输总量 2108 万人,比上年下降 27.4%。其中,公路旅客运输总量 2001 万人,下降 28.5% ;水运旅
客运输总量 107 万人,下降 0.35%。旅客运输总周转量 29.14 亿人公里,下降 2.3%。其中,公路旅客运输周转
量 29.10 亿人公里,下降 2.4% ;水运旅客运输周转量 428 万人公里,增长 3.2%。
年末,公路通车里程 10222 公里,比上年增长 0.8%。
杭绍甬高速先行段、杭州中环柯桥高架段、杭甬高速孙端互通等项目开工建设。杭绍台高速 3-10 标、杭
州绕城西复线诸暨段实现主线贯通。萧甬线通勤列车实现与宁波贯通运营。杭甬运河宁波方向双层集装箱
船舶实现通航,全年完成集装箱吞吐量 7.1 万标箱,比上年增长 189%。
推进高水平“四好农村路”建设,完成低等路提升工程 1230 公里,创建美丽经济交通走廊 405 公里。新
增 ETC 用户 76 万。
启用三区统一的公交智能调度系统和公交运行监测平台,推出“车来了”等线上查询服务。
全年建成投产 220 千伏诸中变 110 千伏送出工程、110 千伏梁家(乐家)输变电工程等 7 项重点工程。全
省率先建成 23 座综合供能服务站充电设施,累计建成充电站 42 座,充电量比上年增长 8 倍。
全年旅游总收入 1307 亿元,比上年增长 10.4%。其中,国内旅游收入 1302 亿元,增长 10.4%。接待游客
11488 万人次,增长 5.5%。其中接待国内游客 11473 万人次,增长 5.5%。
年末,有 A 级景区 81 处,其中 5A 级景区 1 处,4A 级景区 18 处,3A 级景区 34 处,2A 级景区 27 处,1A 级
景区 1 处。省 AAA 级景区村庄 118 家。
表 6 2019 年公路、水路运输总周转量
指 标 单 位 绝对数 比上年增长(%)
公路运输总周转量 亿吨公里 114.15 16.4
# 公路货物运输周转量 亿吨公里 111.24 16.9
公路旅客运输周转量 亿人公里 29.10 -2.4
水路运输总周转量 亿吨公里 34.98 6.1
# 水运货物运输周转量 亿吨公里 34.98 6.1
水运旅客运输周转量 万人公里 428 3.2

008
绍兴市统计年鉴2020
七、金融、证券和保险
年末,金融机构本外币存款余额 9582 亿元,比上年末增长 13.6%,其中住户存款 4747 亿元,增长 15.5%。
金融机构本外币各项贷款余额 8568 亿元,增长 14.0%,其中,中长期贷款余额 4690 亿元,增长 18.9%,短期贷
款余额 3558 亿元,增长 6.4%。
全年保费收入 174 亿元,比上年增长 9.5%,总赔付金额 60 亿元,增长 9.9%。其中,财产险公司保费收入
67 亿元,增长 4.1%,赔付金额 42 亿元,增长 10.1% ;人身险公司保费收入 107 亿元,增长 13.3%,赔付金额 18
亿元,增长 9.3%。
全年新增股份公司 184 家,新增 A 股上市公司 1 家。年末,共有上市公司 76 家。全年共融资 52.17 亿元。
八、教育和科学技术
年末,有普通高校 11 所,普通本专科在校生 10.42 万人。中等职业教育学校(含技工学校)18 所,在校生 4.76
万人。新增“中本一体化”培养试点 3 个。普通高中 51 所,在校生 9.12 万人。初中 138 所,在校生 13.71 万人,
初中毕业生升学率 99.3%。小学 324 所,在校生 26.19 万人,小学毕业生升学率 100%。幼儿园 599 所,在园幼
儿 14.08 万人。专任教师 5.77 万人。绍兴文理学院更名绍兴大学正式列入浙江省 2019 年提出设置申报高校
范围。
新认定高新技术企业 416 家、省高成长科技型中小企业 180 家、省科技型中小企业 1199 家。新认定省重
点实验室 2 家、省级企业研究院 16 家、省级高新技术企业研究开发中心 49 家。3 项成果获国家科学技术奖,
创历史最好成绩。新增浙江(绍兴)外国专家工作站 10 家,柔性引进海外工程师 196 人。新认定国家级“星
创天地”4 家、省级众创空间 28 家。新增省级产业创新综合体 5 家,共举办各类科技对接活动 33 场,达成意
向项目合作 131 项,实现技术交易额 56 亿元。新引进上海大学、天津大学、东华大学等 8 家高校共建研究院,
以及国家技术转移东部中心绍兴分中心等 2 家著名技术转移机构。
年末,有专利授权 26934 件,其中发明专利授权 3293 件。高新技术产品出口比上年增长 17.1%,增速高
于全市出口 7.1 个百分点。
九、文化、卫生和体育
年末,有国有艺术表演团体 7 个,全年演出 1037 场次,观众 217 万人次。国有剧院 6 个,全年演出 541 场次,
观众 33 万人次。群艺馆、文化馆(站)114 个,组织文艺活动次数 8062 次。公共图书馆 7 个,公共图书馆总藏
量 644 万册。
越剧《苏秦》《鉴湖风云》《屈原》、绍兴莲花落《孝子的检讨》《越剧优秀剧目巡演》五个项目入选 2019 年
度国家艺术基金资助项目;越剧《苏秦》入选文化广电旅游部 2019 年度剧本扶持工程。大善寺塔、汉建初元
年买地刻石入选第八批全国重点文物保护单位,全国重点文物保护单位数量增至 32 处。虞舜传说、绍派伤寒、
绍兴舜王庙会 3 个项目进入国家级非遗项目评审。

009
特载
年末,有卫生机构 2698 个(含村卫生室 1111 个),比上年末增加 139 个。其中医院 89 个,卫生院及分院(社
区卫生服务中心、站)669 个。卫生机构床位数 28581 张,其中医院床位 22001 张。医生数 16312 人,注册护
士数 16679 人。每万人拥有医疗床位 63.82 张,比上年增加 2.71 张;每万人拥有医生 36.42 人,比上年增加 1.40 人。
成功创建 7 个省级卫生镇,实现省级卫生乡镇全覆盖; 31 个国家卫生乡镇全部创建成功,1 个国家卫生乡
镇通过复评。家庭医生签约 172.12 万人,签约率 41.7%。65 岁以上老人健康管理 59.62 万人,管理率 72.8%。
完成妇女的免费“两癌”筛查 22.55 万人次。未发生重大医疗和公共卫生事件。
全年共举办国际性赛事 21 项、全国性赛事 60 项。其中,世界女子排球俱乐部锦标赛、绍兴国际马拉松赛
等 7 项赛事成功入选《浙江省重点培育品牌体育赛事名录库(2019 年)》。
共 12 个项目入选全省体育产业发展专项项目库,获得补助资金 740 万元。体育彩票销售 11.24 亿元,筹
集公益金总额 2.87 亿元。
年末,我市人均体育场地面积达到 2.51 平方米。全年开展各类全民健身活动超过 2000 场,体质监测
7000 余例。
2019 年,绍兴籍健儿共获世界级金牌 12 人次、银牌 6 人次,亚洲级金牌 7 人次,全国级比赛金牌 141 枚,
银牌 114 枚,铜牌 67 枚。谢震业获第 23 届亚洲田径锦标赛男子 200 米决赛金牌,并以 19 秒 88 的成绩打破
亚洲记录。
十、人口、人民生活和社会保障
据 5‰人口抽样调查显示,年末全市常住人口为 505.7 万,比上年末增加 2.2 万人,增长 0.4%。城镇化率
达 68.4%。
据居民收支与生活状况调查,全年全体居民人均可支配收入 53839 元,比上年增长 9.0%。其中,城镇常
住居民人均可支配收入 63935 元,增长 8.3%,农村常住居民人均可支配收入 36120 元,增长 9.1%。
表 7 2019 年绍兴城乡居民收入增长情况
指 标
全体居民 城镇居民 农村居民
绝对数(元)比上年增长
(%)绝对数(元)
比上年增长(%)
绝对数(元)比上年增长
(%)
人均可支配收入 53839 9.0 63935 8.3 36120 9.1
一、工资性收入 30172 9.2 35449 8.4 20911 9.5
二、经营净收入 11750 8.1 12467 7.8 10491 8.2
三、财产净收入 5189 8.6 7552 7.3 1040 8.4
四、转移净收入 6728 10.3 8466 9.5 3678 10.2
全年,全体居民人均生活消费支出 31109 元,比上年增长 8.4%。其中,城镇常住居民和农村常住居民人
均生活消费支出分别为 35925 元和 22658 元,增长 7.8% 和 8.5%。
年末,全体居民人均住房建筑面积 58.3 平方米。其中,城镇常住居民人均住房建筑面积 52.7 平方米,农
村常住居民人均住房建筑面积 68.2 平方米。

010
绍兴市统计年鉴2020
年末,每百户居民家庭拥有家用汽车 56.0 辆、计算机 76.1 台、移动电话 250.9 部、洗衣机 98.2 台、电冰箱
(柜)109.9 台、彩色电视机 205.4 台、空调 222.9 台、热水器 102.0 台。城镇常住居民恩格尔系数 27.1%,比上年
下降 0.08 个百分点,农村常住居民恩格尔系数 30.1%,比上年下降 0.02 个百分点。
当年新增城镇就业人员 27.46 万人,城镇失业人员实现再就业 11.68 万人,城镇登记失业率 2. 05%,比上
年下降 0.2 个百分点。
年末,基本医疗保险参保人数达到 469.28 万人,比上年末增长 0.2%。基本养老保险参保人数 364.15 万人,
比上年末增长 1.9% ;企业职工养老保险参保人数 245.80 万人,增长 3.8%。城镇失业保险参保人数 120.70 万人,
下降 8.4%。
共建成乡镇(街道)级示范型居家养老中心 80 家,539 家城乡社区居家养老服务照料中心实现公建民营,
助餐、配送餐服务覆盖 1290 个城乡社区,助餐覆盖率巩固在 50% 以上,51 家公办养老机构实现公建民营改革。
现有农村留守儿童 2523 人,均纳入有效监护范围。年末在册低保对象 39649 人,其中,城镇 5267 人,农
村 34382 人。低保资金(含各类补贴)支出 3.30 亿元。城乡最低生活保障标准为每人每月 810 元。2019 年救
助临时困难群众 4206 人次,支出临时救助金 515.41 万元。
全年,福利彩票销售 12.81 亿元,筹集公益金 1.18 亿元,公益金支出 1.40 亿元。
十一、资源、环境保护和社会安全
年末,有气象雷达观测站点 2 个,卫星云图接收站点 5 个,区域自动气象观测站 271 个。全年平均气温
17.9℃,总日照时数 1603.7 小时。
2019 年,全市平均降水量 1844.9 毫米,较多年平均降水量偏多 25.6%,较上年降水量偏多 18.3%。
全年共完成造林更新 1.65 万亩,其中平原绿化 1.21 万亩。新建省级森林城镇 5 个,成功创建国家森林乡
村 44 个。新植珍贵树种 161 万株,建成珍贵树种示范点 14 个、局长示范林 14 片、示范单位 15 个。
完成水利建设投资 51.8 亿元。水利工程年供水量 17.6 亿立方米,下降 3.0%。年末,已建成水库 553
座,比上年减少 2 座,水库总容量 15.53 亿立方米。农村饮用水达标提标 23.91 万人。河湖库塘清污(淤)量
397.24 万方,完成水土流失治理 36.5 平方公里。
全市空气质量综合指数 3.86。空气质量优良天数比例 86.0%。PM2.5 浓度 36 微克 / 立方米。
全市 7 个国家“水十条”考核断面均达到年度目标要求,Ⅰ - Ⅲ类水比例为 100% ;21 个省对市“五水共
治”考核断面Ⅰ - Ⅲ类水比例和功能区达标率均为 100% ;128 个市级考核断面Ⅰ - Ⅲ类水比例和功能区达标
率均为 98.4% ;交接断面考核保持优秀;县级及以上饮用水源水质达标率保持 100%。
年末,拥有国家级生态乡镇(街道)63 个,省级生态乡镇(街道)109 个。
扎实推进“ 无废城市”建设试点,获批成为全国“11+5”全省唯一试点城市。
年末,市区城区生活垃圾分类覆盖率达到 93.06%、县(市)城区生活垃圾分类覆盖率达到 85.20%,全市城
镇资源化利用率为 74.57%,无害化处理率基本达到 100%。
2019 年,发生各类生产安全事故 83 起、死亡 75 人,比上年分别下降 49.7%、45.7%。未发生生产经营性较
大事故。

011
特载
注释:
[1] 本公报所列 2019 年各项数据为年度初步统计数据。部分数据因四舍五入原因,存在与分项合计不等的情况。
[2] 生产总值(GDP)和各产业增加值绝对数按现价计算,增长速度按不变价格计算。
[3] 农林牧渔业总产值增速按可比价计算。农作物播种面积及主要农产品产量使用全面农业统计数据。
[4]“一带一路”沿线国家具体包括印度、俄罗斯、越南、印度尼西亚、伊朗、泰国、土耳其、巴基斯坦、马来西亚、波兰、
菲律宾、沙特阿拉伯等 64 个国家。
[5] 规模以上工业统计范围为年主营业务收入 2000 万元及以上法人工业企业。
[6] 限额以上批发业统计范围为年主营业务收入 2000 万元及以上法人单位。
[7] 限额以上零售业统计范围为年主营业务收入 500 万元及以上法人单位。
[8] 限额以上住宿业统计范围为年主营业务收入 200 万元及以上法人单位。
[9] 限额以上餐饮业统计范围为年主营业务收入 200 万元及以上法人单位。
[10] 各类生产经营性事故包括工矿商贸企业、道路运输、水上运输、渔业船舶、铁路运输、农业机械、海上交通事故。
[11] 从 2018 年起,浙江服务贸易统计执行《国际服务贸易统计监测制度》,口径与上年有调整,增速按可比口径计算。
资料来源:
本公报中财政数据来自市财政局;新增城镇就业、登记失业率、社会养老保障数据来自市人力社保局;医疗保障数据来
自市医保局;粮食生产功能区、农业龙头企业、美丽乡村建设、农家乐等数据来自市农业农村局;市场主体、商品交易实体市
场和交易额数据来自市市场监管局;货物进出口总额、一般贸易和加工贸易进出口额来自绍兴海关;产品进出口、服务贸易
进出口、国外经济合作、网络零售额等数据来自市商务局;利用外资数据来自市招商投资促进中心;公路里程、货物周转量、
旅客周转量等数据来自市交通运输局;户籍人口、汽车拥有量等数据来自市公安局;邮政业务数据来自市邮政局;电话用户、
互联网用户等数据来自电信绍兴分公司、移动绍兴分公司、联通绍兴分公司;公共图书馆、文化馆、博物馆、艺术表演团体、
广播、电视、旅游等数据来自市文广旅游局;货币金融数据来自人民银行绍兴分行;上市公司数据来自市金融办;保险业数
据来自绍兴银保监分局;教育数据来自市教育局;企业技术中心、高新技术企业、专利等数据来自市市场监管局;卫生等数
据来自市卫健委;体育、体育彩票数据来自市体育局;低保、社会服务和救助、福利彩票数据来自市民政局;水资源、水利建
设投资数据来自市水利局;耕地面积、森林资源等数据来自市自然资源和规划局;气象数据来自市气象局;环境监测数据来
自市生态环境局;保障性安居工程住房数据来自市住建局;各类事故发生起数、死亡人数来自市应急管理局;价格、城乡居
民收支、家庭耐用品拥有量等数据来自国家统计局绍兴调查队;其他数据均来自于市统计局。


综 合1 CHAPTER 1 GENERAL SURVEY
014
绍兴市统计年鉴2020
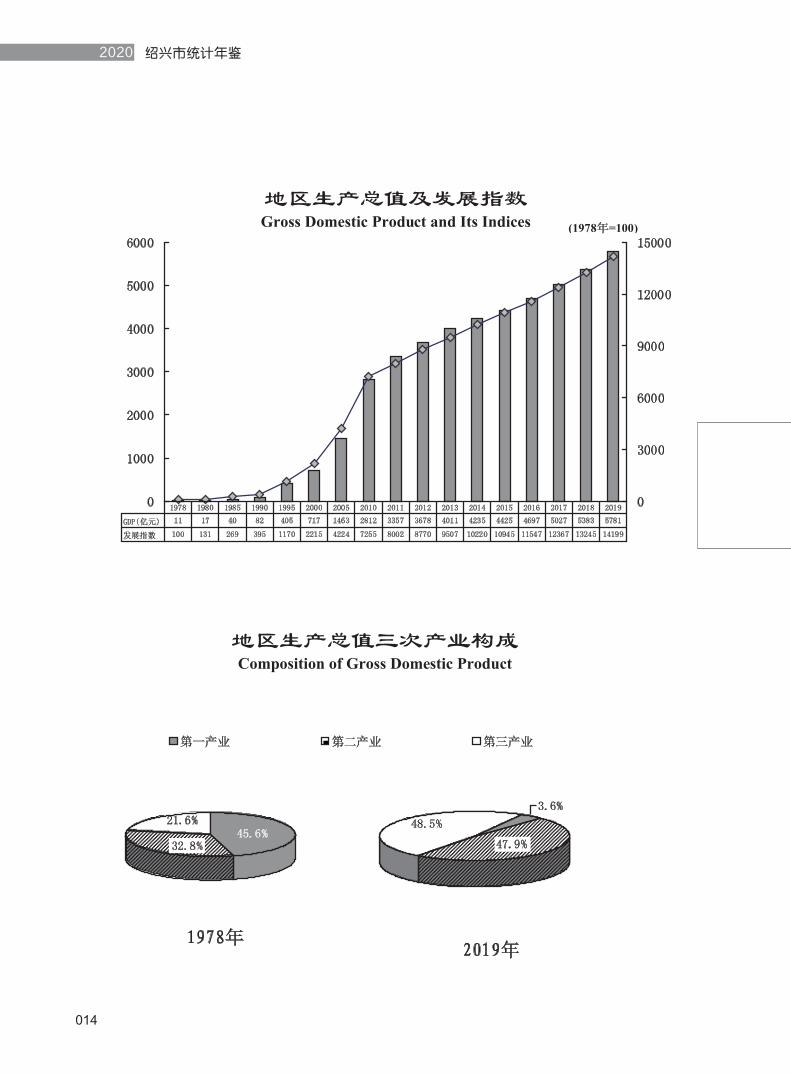
地区生产总值及发展指数Gross Domestic Product and Its Indices
0
1000
2000
3000
4000
5000
6000
0
3000
6000
9000
12000
15000
GDP(亿元) 11 17 40 82 405 717 1463 2812 3357 3678 4011 4235 4425 4697 5027 5383 5781
发展指数 100 131 269 395 1170 2215 4224 7255 8002 8770 9507 10220 10945 11547 12367 13245 14199
1978 1980 1985 1990 1995 2000 2005 2010 2011 2012 2013 2014 2015 2016 2017 2018 2019
(1978年=100)
3.6%
47.9%
48.5%
第一产业 第二产业 第三产业
地区生产总值三次产业构成Composition of Gross Domestic Product
1978年
45.6%32.8%
21.6%
2018年1978年

015
综 合
行政区划及自然资源
行政区划绍兴简称绍。下辖三区二市一县:越城区、柯桥区、上虞区、诸暨市、嵊州市和新昌县。全市共有乡 7 个、
镇 49 个、街道 47 个、居委会 594 个,行政村 1597 个。
位 置绍 兴 市 位 于 浙 江 省 中 北 部,钱 塘 江 口 以 南,介 于 北 纬 29 ° 13 ′ 36 ″ 至 30 ° 16 ′ 17 ″,东 经
119° 53′ 02″至 121° 13′ 38″之间。东连宁波市,南接台州和金华市,西接杭州市,北隔钱塘江与嘉兴相
望。东西长 130.03 公里,南北宽 116.86 公里,海岸线长 40 公里,总面积 8279 平方公里。
地 貌绍兴处于浙西山地丘陵、浙东丘陵山地和浙北平原三大地貌单元的交接地带,地貌比较复杂。境内地势
南高北低,由北部绍虞平原向南逐渐过渡为丘陵山地。全市地貌可概括为“四山三盆两江一平原”。山地丘陵
构成“山”字形的骨架,其中部会稽山脉主峰东白山,海拔 1194.6 米,为全市的最高峰。
面 积全市总面积 8279 平方公里,建成区面积 379.70 平方公里。其中市区总面积 2965 平方公里,建成区面积
242.31 平方公里。
河 流绍兴河道密布、湖泊众多,向以“水乡泽国”享誉海内外。境内主要有汇入钱塘江的曹娥江、浦阳江、鉴湖
水系;浙东运河东西横贯北部,与南北向河流沟通,交织成北部平原区河密率很高的河网水系。
气 候绍兴地处亚热带季风气候区,季风显著,四季分明,气候温和,湿润多雨。年平均气温在 17.9℃,年降水量
1672.2 毫米。

016
绍兴市统计年鉴2020
Administrative Divisions & Natural Resources
Administrative Divisions
Shaoxing is called Shao in short. It governs three district, two county-level cities and one county,
Yuecheng District, Keqiao District, Shangyu District, Zhuji city, Shengzhou city and Xinchang County. There
are 7 small towns, 49 towns, 47 sub-districts, 594 neighborhood committee and 1597 villages in Shaoxing.
Location
Shaoxing lies in the center-north of Zhejiang, on the south of Qiantang River, between 29°13′36″N to
30°16′17″N, and 119°53′02″E to 121°13′38″E. It borders on Ningbo on the east, Taizhou and Jinhua on the
south, Hangzhou on the west and Jaxing on the north across the Qiantang River. It spans 130.03 km long from
east to west, 116.86 km wide from north to south. The coastline stretches for 40 km. The total area of the city is
8279 square kilometers.
Topography
Shaoxing is situated at the junction belt of three different topography units, with a rather diversified
topography. Within its territory, the south is higher than the north, changing from plain area of north to the hilly
regions of south. The topography of the city can be summarized as “40 percent mountain, 30 percent basin,
20 percent river and 10 percent plain”. The mountainous and hilly region forms a structure of W shape. The
highest peak of the city is the 1194.6 meter high Dongbai Mt, main peak of Kuaiji Mountain.
Area
The total area of Shaoxing is 8279 sq. km,the built-up district covers 379.70 sq.km. The total area of
urban district is 2965 sq. km,the built-up urban district covers 242.31 sq.km.
Rivers
Shaoxing has been long widely renowned as a “land of waters”, thanks to its dense rivers and numerous
lakes. There are mainly the Cao’e River, Puyang River and Jianhu Water System within its territory. The East
Zhejiang Canal flows through the city from west to east, interwoven with the local rivers a dense network of
rivers in the north plain region.
Climate
Shaoxing's climate belongs to monsoon of subtropical moist marine climate zone,with distinct four
seasons, Shaoxing has a mild climate with plenty rainfall. Average temperature of the year is 17.9℃ and annual
precipitation is 1672.2 millimeter.

017
综 合
年 份(地 区)
Year(Region)
镇Town
乡Township
街道Subdistrict
社区 ( 居民 )委员会
Community(Neighborhood)
Committee
村民委员会Villager
Committee
土地面积( 平方公里 )
Area of Land
(sq.km)
1985 56 273 4 5164 8256
1990 81 243 4 5161 8256
1995 100 36 5 317 5142 8256
1996 102 34 5 341 5146 8256
1997 102 34 6 359 5146 8256
1998 102 34 6 371 5145 8256
1999 102 34 6 406 5125 8256
2000 101 34 6 424 5124 8256
2001 80 18 20 336 5141 8256
2002 80 18 20 235 5102 8256
2003 80 18 20 299 4625 8256
2004 80 18 20 427 4446 8256
2005 80 17 20 399 4077 8256
2006 79 15 23 436 2939 8256
2007 79 15 24 437 2890 8256
2008 79 15 24 458 2222 8256
2009 79 15 24 480 2195 8256
2010 79 15 24 488 2188 8256
2011 79 15 24 479 2186 8256
2012 79 15 24 482 2186 8256
2013 79 15 24 498 2176 8279
2014 79 15 24 508 2176 8279
2015 79 15 24 514 2175 8279
2016 79 15 24 516 2170 8279
2017 67 15 36 514 2169 8279
2018 67 15 35 558 2129 8279
2019 49 7 47 594 1597 8279
分区、县 ( 市 )Grouped By District and County(city)
越城区 Yuecheng District 1 - 15 171 188 493
柯桥区 Keqiao District 5 - 11 127 214 1066
上虞区 Shangyu District 10 3 8 91 303 1406
诸暨市 Zhuji City 17 1 5 128 398 2311
嵊州市 Shengzhou City 10 1 4 46 241 1789
新昌县 Xinchang County 6 2 4 31 253 1214
1-1 绍兴市行政区划Divisions of Administrative Areas
单位:个 (unit)

018
绍兴市统计年鉴2020
地 区Region
乡、镇、街道数Number
乡、镇、街道名称Townships, Towns and Subdistricts
市 区Urban District
越城区Yuecheng
District16
塔山街道、府山街道、北海街道、城南街道、稽山街道、迪荡街道、东湖街道、灵芝街道、东浦街道、鉴湖街道、斗门街道、皋埠街道、马山街道、孙端街道、陶堰街道、富盛镇Tashan Subdistrict、Fushan Subdistrict、Beihai Subdistrict、Chengnan Subdistrict、Jishan Subdistrict、Didang Subdistrict、 Donghu Subdistrict、Lingzhi Subdistrict、Dongpu Subdistrict、Jianhu Subdistrict、Doumen Subdistrict、Gaobu Subdistrict、Mashan Subdistrict、Sunduan Subdistrict、Taoyan Subdistrict、Fusheng Town
柯桥区KeqiaoDistrict
16
柯桥街道、柯岩街道、华舍街道、湖塘街道、齐贤街道、安昌街道、兰亭街道、福全街道、钱清街道、马鞍街道、杨汛桥街道、平水镇、王坛镇、稽东镇、漓渚镇、夏履镇Keqiao Subdistrict、Keyan Subdistrict、Huashe Subdistrict、Hutang Subdistrict、Qixian Subdistrict、Anchang Subdistrict、Lanting Subdistrict、Fuquan Subdistrict、Qianqing Subdistrict、Ma'an Subdistrict、Yangxunqiao Subdistrict、Pingshui Town、Wangtan Town、Jidong Town、Lizhu Town、Xialv Town
上虞区ShangyuDistrict
21
百官街道、曹娥街道、东关街道、道墟街道、梁湖街道、小越街道、崧厦街道、沥海街道、长塘镇、上浦镇、汤浦镇、章镇镇、下管镇、丰惠镇、永和镇、驿亭镇、谢塘镇、盖北镇、岭南乡、陈溪乡、丁宅乡Baiguan Subdistrict、Cao'e Subdistrict、Dongguan Subdistrict、Daoxu Subdistrict、Lianghu Subdistrict、Xiaoyue Subdistrict、Songxia Subdistrict、Lihai Subdistrict、Changtang Town、Shaopu Town、Tangpu Town、Zhangzheng Town、Xiaguan Town、Fenghui Town、Yonghe Town、Yiting Town、Xietang Town、Gaibei Town、Lingnan Township、Chenxi Township、Dingzhai Township
县 ( 市 )County(Cities)
诸暨市ZhujiCity
23
暨阳街道、浣东街道、陶朱街道、暨南街道、大唐街道、应店街镇、次坞镇、店口镇、姚江镇、山下湖镇、枫桥镇、赵家镇、马剑镇、五泄镇、牌头镇、同山镇、安华镇、璜山镇、陈宅镇、岭北镇、浬浦镇、东白湖镇、东和乡Jiyang Subdistrict、Huandong Subdistrict、Taozhu Subdistrict、Jinan Subdistrict、Datang Subdistrict、Yingdian Town、Ciwu Town、Diankou Town、Yaojiang Town、Shanxiahu Town、Fengqiao Town、Zhaojia Town、Majian Town、Wuxie Town、Paitou Town、Tongshan Town、Anhua Town、Huangshan Town、Chenzhai Town、Lingbei Town、Lipu Town、 Dongbaihu Town、Donghe Township
嵊州市Shengzhou
City15
鹿山街道、剡湖街道、三江街道、浦口街道、甘霖镇、长乐镇、黄泽镇、三界镇、崇仁镇、石璜镇、仙岩镇、谷来镇、金庭镇、下王镇、贵门乡Lushan Subdistrict、Shanhu Subdistrict、Sanjiang Subdistrict、Pukou Subdistrict、Ganlin Town、Changle Town、Huangze Town、Sanjie Town、Chongren Town、Shihuang Town、Xianyan Town、Gulai Town、JinTing Town、Xiawang Town、Guimen Township
新昌县XinchangCounty
12
羽林街道、南明街道、七星街道、澄潭街道、镜岭镇、回山镇、沃州镇、儒岙镇、小将镇、沙溪镇、城南乡、东茗乡Yulin Subdistrict、Nanming Subdistrict、Qixing Subdistrict、Chengtan Subdistrict、Jingling Town、Huishan Town、Wozhou Town、Ru'ao Town、Xiaojiang Town、Shaxi Town、Chengnan Township、Dongming Township
1-2 分区、县(市)乡、镇、街道名称(2019年末)Names of Townships, Towns and Subdistricts in Each District and County (City)(End of 2019)

019
综 合
地 区 Region全 年Annual Total
1 月Jan.
2 月Feb.
3 月Mar.
4 月Apr.
5 月May
6 月June
7 月July
8 月Aug.
9 月Sept.
10 月Oct.
11 月Nov.
12 月Dec.
全市 Whole Municipality 1603.7 69.9 24.7 123.7 136.1 168.1 121.7 144.3 216.8 190.9 139.4 134.5 133.7
柯桥区 Keqiao District 1589.4 74.3 23.6 129.3 126.0 168.0 121.6 152.5 215.3 178.6 132.5 134.6 133.1
上虞区 Shangyu District 1656.6 74.2 23.5 132.7 141.6 175.0 124.4 159.1 230.3 187.4 140.5 133.3 134.6
诸暨市 Zhuji City 1518.1 66.7 25.5 120.1 132.0 146.5 120.0 130.3 201.4 187.2 136.0 130.2 122.2
嵊州市 Shengzhou City 1614.7 72.7 24.5 110.4 137.0 172.5 121.2 141.7 222.3 200.3 139.3 137.0 135.8
新昌县 Xinchang County 1639.6 61.5 26.6 126.0 143.7 178.3 121.1 137.9 214.7 201.0 148.6 137.5 142.7
1-3 分区、县(市)日照时数(2019年)Sunshine Hours in Each District and County (City) (2019)
单位:小时 (hour)
地 区 Region全 年Annual Total
1 月Jan.
2 月Feb.
3 月Mar.
4 月Apr.
5 月May
6 月June
7 月July
8 月Aug.
9 月Sept.
10 月Oct.
11 月Nov.
12 月Dec.
全市 Whole Municipality 1672.2 104.7 190.4 148.0 102.4 125.5 220.7 212.7 210.3 117.2 110.6 24.4 105.3
柯桥区 Keqiao District 1689.5 105.9 196.5 127.3 70.1 158.4 268.1 205.0 228.6 103.9 95.6 25.4 104.7
上虞区 Shangyu District 1881.7 106.0 197.5 121.0 69.3 131.3 245.1 232.6 262.1 192.0 159.4 38.0 127.4
诸暨市 Zhuji City 1577.6 117.0 222.7 147.5 93.4 131.3 212.4 202.8 187.3 84.5 43.2 25.2 110.3
嵊州市 Shengzhou City 1574.1 91.2 163.3 159.2 143.0 91.5 178.1 228.1 187.4 99.8 124.4 16.2 91.9
新昌县 Xinchang County 1638.2 103.6 172.0 185.1 136.3 114.8 199.6 195.2 186.2 105.7 130.2 17.3 92.2
1-4 分区、县(市)降水量(2019年)Precipitation in Each District and County (City) (2019)
单位:毫米 (millimeter)
地 区 Region全 年Annual Total
1 月Jan.
2 月Feb.
3 月Mar.
4 月Apr.
5 月May
6 月June
7 月July
8 月Aug.
9 月Sept.
10 月Oct.
11 月Nov.
12 月Dec.
全市 Whole Municipality 17.9 6.0 6.7 12.4 18.2 21.6 24.7 27.8 29.0 24.6 19.8 14.3 8.9
柯桥区 Keqiao District 18.4 6.3 6.6 12.7 18.4 22.2 25.1 28.6 29.8 25.3 20.4 15.0 9.4
上虞区 Shangyu District 17.8 5.9 6.7 12.1 17.9 21.6 24.6 27.9 29.1 24.3 19.5 14.1 8.7
诸暨市 Zhuji City 18.1 6.0 6.6 12.7 18.6 22.1 25.0 28.0 29.5 24.9 20.1 14.4 8.9
嵊州市 Shengzhou City 17.5 5.8 6.6 12.2 18.0 21.1 24.3 27.2 28.4 24.1 19.4 13.9 8.8
新昌县 Xinchang County 17.6 5.9 6.9 12.3 18.2 21.2 24.3 27.3 28.5 24.1 19.4 14.0 8.9
1-5 分区、县(市)平均气温(2019年)Average Temperature in Each District and County (City) (2019)
单位:摄氏度 (℃ )

020
绍兴市统计年鉴2020
指 标 Item 1978
人口 (万人) Population (10 000 persons)
年末户籍人口 Year-end Population 378.43
# 乡村人口 Rural Population 346.82
就业与劳动工资 Employment and Wage
年末全社会从业人员 (万人) Employed Persons (year-end) (10 000 persons)
# 非私营单位在岗职工 Staff and Workers at work in Non Private-Owned Units
非私营单位在岗职工平均工资 (元) Average Wages of Staff and Workers at work in Non Private-Owned Units (yuan)
国民核算 National Accounting
地区生产总值 ( 现价 ) (亿元) Gross Domestic Product (100 million yuan) 11.29
人均地区生产总值 (元) Per Capita GDP (yuan)
人均地区生产总值(户籍) (元) Per Capita GDP(Calculated by Household Registered Population) (yuan) 299
农业 Agriculture
农林牧渔业总产值 (亿元) Farming,Forestry,Animal Husbandry and Fishery (100 million yuan) 7.09
工业 (亿元) Industry (100 million yuan)
全部工业总产值 Gross Industrial Output Value 9.34
# 规模以上工业 All above Designated Size Industrial Enterprises
运输邮电 Transportation and Postal
全社会货运量 (万吨) Passenger Traffic of the Whole Society (10 000 tons) 693
全社会客运量 (万人次) Passenger Traffic of the Whole Society (10 000 person-times) 1509
邮电业务收入 (亿元) Postal and Telecommunication Business Income (100 million yuan)
国内贸易 Domestic Trade
社会消费品零售总额 (亿元) Total Retail Sales of Consumer Goods (100 million yuan) 3.68
对外经济和国际旅游 (万美元) Foreign Trade and International Tourism (USD 10 000)
1. 进出口总额 ( 海关 ) Total Exports and Imports
# 自营出口总额 Exports
2. 协议 ( 合同 ) 外资金额 Amount of Foreign Capital in the Signed Agreements & Contracts
实际利用外资 Amount of Foreign Capital Actually Utilized
3. 接待境外旅游者人数 (万人) Number of Foreign Tourists (10 000 persons) 0.17
电力 (亿千瓦时) Electricity (100 million kwh)
全社会用电量 Electricity Consumption of the Whole Society 4.49
# 工业用电 Electricity Consumption of Industry 3.44
生活用电 Electricity Consumption by Residents 0.34
固定资产投资 (亿元) Investment in Fixed Assets (100 million yuan)
固定资产投资 Investment in Fixed Assets
# 房地产开发投资 Investment in Real Estate Development
1-6 全市国民经济和社会发展主要指标
注:① 1993 年起社会消费品零售总额已与第四次经济普查数据衔接,下同。② 2009 年起,金融系统存贷款由人民币口径改为本外币口径。③进出口数据 2016 年起按人民币口径统计,下同。④因工业统计制度改革,2017 年和 2018 年规上工业数据分别小于之前的年份,下同。⑤如无备注,人均 GDP 为常住口径,下同。

021
综 合
1985 1990 1995 2000 2005 2010 2015 2016 2017 2018 2019
394.88 412.67 424.70 432.69 435.09 438.91 443.11 444.53 446.48 447.21 447.87
344.66 359.06 359.65 352.02 308.38 290.38 233.88 273.37 257.68 247.41 235.49
293.58 274.45 284.83 341.81 346.80 348.07 348.00 346.60 348.00
41.79 43.61 37.35 58.09 102.99 123.47 133.25 116.93 111.81 99.72
2161 6716 11428 24440 35125 58728 61394 67489 75375 80842
40.04 82.38 404.70 716.85 1462.83 2811.75 4424.69 4697.15 5027.48 5382.72 5780.74
31950 57925 89172 94358 100570 107172 114561
1016 2002 9561 16586 33636 64148 99863 105834 112849 120460 129168
15.90 29.03 83.27 118.31 141.40 225.80 303.25 317.44 316.15 295.10 313.85
60.03 169.72 939.05 1855.31 4290.97 8623.86
1045.13 3215.07 6797.39 9746.38 9826.94 7776.98 6670.92 6994.42
1142 2517 6531 6470 9559 8931 12271 12447 13426 14161.21 15276.53
4162 4134 9574 11753 14202 17398 10020 3081 2926 2905.45 2108.08
19.58 34.19 48.87 57.11 59.97 59.49 63.50 63.94
14.77 31.40 113.12 208.91 380.10 853.12 1578.68 1740.68 1930.39 2139.64 2352.56
3349 49137 166245 1048473 2701612 2990227 1820.90 1997.44 2240.29 2458.97
3338 44917 127735 814162 2108906 2714241 1686.23 1852.02 2046.10 2251.07
1132 26166 16642 202139 144641 157570 128543 278927 212875 251161/245656
503 12959 11598 90095 95327 94152 80031 128666 135141 152543/65739
0.47 0.80 2.71 4.80 20.19 52.28 73.48 82.47 89.13 14.72 15.25
10.54 19.89 42.42 77.67 185.52 295.68 366.25 374.51 411.55 437.72 462.37
8.46 15.51 34.01 63.29 158.62 245.27 293.97 291.98 321.47 338.14 356.30
1.05 2.52 4.91 7.03 13.47 24.83 33.52 39.24 42.07 45.95 48.66
9.12 17.21 162.31 247.18 676.13 1245.56 2582.84 2882.48 3115.67
36.15 103.33 297.80 622.65 641.19 678.07 798.16 825.23
National Economy and Social Development Indicators of Shaoxing
Note: a) The total retail sales of consumer goods have been linked up with the data of the fourth economic census since 1993., the same below. b) The deposit and loan of financial systems use RMB and foreign Currency instead of RMB from 2009. c)Data of imports and exports have been calculated by CNY since 2016, the same below. d) Due to the reform of industrial statistics system,data of industrial enterprises above designated size in 2017 and 2018 is less than that in the years before,the same below. f) If it is not be noted, The per capita GDP is calculated by permanent residents population., the same below.

022
绍兴市统计年鉴2020
指 标 Item 1978
财政 (亿元) Public Finance (100 million yuan)
财政收入 Financial Revenue 1.86
#一般公共预算收入 General Public Budget Revenues
一般公共预算支出 General Public Budget Expenditures 0.74
金融 (亿元) Finance (100 million yuan)
金融机构年末本外币存款余额 Deposit Balance of Financial Institutions 2.29
#住户存款 Household Deposits 0.69
金融机构年末本外币贷款余额 Loans Balance of Financial Institutions 3.62
物价指数 (%) Price Indices (%)
居民消费价格指数(市区) Consumer Price Index(Urban District)
商品零售价格指数(市区) Retail Price Index of Urban Residents(Urban District)
人民生活 (元) People’s Livelihood (yuan)
农村常住居民人均可支配收入 Per Capita Disposable Income of Rural Households
城镇常住居民人均可支配收入 Per Capita Disposable Income of Urban Households
教育 (人) Education (person)
在校学生数 Students Enrollment
小学 (万人) Primary Schools (10 000 persons) 49.29
初中 (万人) Junior Schools (10 000 persons) 17.91
高中 (万人) Senior Schools (10 000 persons) 6.06
普通高校 Regular Institutions of Higher Education 615
中等职业学校 Secondary Vocational Schools
专任教师数 Full-time Teachers
小学 Primary Schools 16687
初高中 Junior & Senior Schools 10873
普通高校 Regular Institutions of Higher Education 63
中等职业学校 Secondary Vocational Schools
卫生 Health Care
卫生机构床位数 (张) Number of Healthcare Beds (bed) 5495
#医院、卫生院 Hospitals
卫生技术人员数 (人) Number of Medical Personnel (person) 6171
#医生 Doctors 2620
1-6 续 表
注:① 2004 年地方财政收入按 2005 年财政体制进行了调整,2011 年及以前,“一般公共预算收入”名称为“地方财政收入”,2012 年起改名为“公共财政预算收入”,口径保持不变,2015 年起,公共财政预算收入按照财政体制进行调整,指标名称改为“一般公共预算收入”, 下同。② 2011 年及以前,“一般公共预算支出”指标名称为“地方财政支出”,2012 年起改名为“公共财政预算支出”,口径保持不变,2015 年起,公共财政预算支出根据财政体制进行调整,改名为“一般公共预算支出”,下同。③ 2015 年前住户存款数据为城乡居民储蓄。④ 2013 年以前农村居民为纯收入 ,下同。

023
综 合
1985 1990 1995 2000 2005 2010 2015 2016 2017 2018 2019
5.72 10.12 20.60 47.87 150.56 349.25 602.19 630.08 705.53 811.85 825.36
9.52 24.54 76.13 193.23 362.89 390.30 431.36 501.34 528.37
2.16 4.59 10.96 25.76 80.04 221.95 421.41 456.10 469.83 556.65 640.87
14.47 54.11 239.41 655.66 1864.89 4948.32 6948.91 7435.32 7837.28 8436.53 9582.13
7.37 34.08 162.88 398.93 889.10 1945.72 3129.61 3431.62 3632.37 4108.65 4747.18
17.19 50.32 193.64 458.51 1381.68 3934.27 6047.93 6153.24 6703.14 7516.71 8568.32
102.3 113.5 102.9 102.4 104.0 101.2 101.9 101.8 102.4 102.7
101.8 112.9 98.7 101.4 103.9 99.8 101.3 101.8 101.8 103.1
569 1212 3183 4982 7704 13651 25648 27744 30331 33097 36120
9422 17516 30164 46747 50305 54445 59049 63935
34.93 34.01 33.25 34.81 33.28 30.04 27.73 26.41 25.58 25.79 26.19
17.25 14.06 15.24 17.20 17.02 17.08 13.88 13.87 13.91 13.94 13.71
2.67 2.83 3.37 5.65 10.62 10.39 9.72 9.31 9.45 9.11 9.12
1238 1512 2313 5800 30702 53869 83831 90277 97345 99270 104232
53673 80454 66039 51516 49763 49300 47581 47572
13315 13026 13005 14551 14527 14764 15714 15718 15863 16043 16316
8623 9197 9939 12537 16430 17876 18498 18814 19436 19565 19871
191 253 275 714 1946 2690 3952 4072 4431 4782 4964
2768 2740 2663 2868 2988 3086 3148 3174
6176 7767 8289 9719 12158 15820 23385 25459 27061 27329 28581
7417 8055 9285 11195 14846 22114 24185 25479 25930 27151
8345 9940 11339 11284 16776 22155 31658 34685 36977 38335 40051
3673 5288 6113 5707 8074 9593 12911 14171 15195 15662 16312
Continued
Note: a) The local financial revenue of year 2004 was adjusted according to the financial system of year 2005, General public budget revenues was named as "Financial Revenue of the Local Government" in 2011 and before, renamed "Public Financial Revenue" from 2012, the caliber unchanged. Since 2015, the public financial revenue was adjusted according to the financial system, and it was named as General Public Budget Revenues, the same below. b) General public budget expenditures was named as "Financial Expenditure of the Local Government" in 2011 and before, renamed "Public Financial Expenditure" from 2012, the caliber unchanged, the same below. c) Since 2015, Public Financial Expenditure was adjusted according to the financial system, and it was named as general public budget expenditures. d) Before 2015, the name of household deposits was residents' savings deposits in urban and rural areas. d) Before 2013, the income of rural residents was the net income of rural residents, the same bellow.

024
绍兴市统计年鉴2020
年 份Year
地区生产总值 Gross Domestic
Product
第一产业 Primary Industry
第二产业 Secondary
Industry
第三产业Tertiary Industry
工 业Industry
建筑业 Construction
1978 112865 51428 37063 24374 31895 5168
1980 165450 65787 66799 32864 58133 8666
1985 400444 118335 204476 77633 186954 17522
1986 475005 128459 251861 94685 232203 19658
1987 567438 142010 310874 114554 280280 30594
1988 679570 159653 370697 149220 335061 35636
1989 761645 178070 406348 177227 367414 38934
1990 823755 197669 435664 190422 396551 39113
1991 981579 220376 538860 222343 491463 47397
1992 1272537 250724 731890 289923 660715 71175
1993 1997321 329515 1213713 454093 1056685 157028
1994 3045664 467246 1801327 777091 1578193 223134
1995 4047006 560470 2427235 1059301 2122777 304458
1996 4953947 639686 2954230 1360031 2611118 343112
1997 5642896 670531 3371562 1600803 3020807 350755
1998 6090956 704998 3632385 1753573 3271157 361228
1999 6509328 713780 3877726 1917822 3495704 382022
2000 7168454 746947 4206693 2214814 3760311 446382
2001 7880179 766060 4572042 2542077 4067191 504851
2002 8860602 758119 5137710 2964773 4546016 591694
2003 10352193 776451 6117633 3458109 5376296 741337
2004 12553004 863701 7532119 4157183 6616887 915232
2005 14628349 930700 8826695 4870954 7907789 918906
2006 17003674 973500 10267217 5762957 9279897 987320
2007 20007291 1044539 12075718 6887035 10979410 1096308
2008 22562045 1145605 13381789 8034652 12189196 1192593
2009 24068971 1219183 13966754 8883035 12519822 1446931
2010 28117467 1456340 15932953 10728174 14043771 1889182
2011 33569446 1662054 18752304 13155088 16353907 2398397
2012 36775219 1772070 20103670 14899479 17461304 2642366
2013 40108363 1823173 21616480 16668710 18695337 2939885
2014 42351578 1844064 22403855 18103658 19251474 3173483
2015 44246910 1878346 22790348 19578216 19496830 3308131
2016 46971537 1948750 23852125 21170662 20421260 3443605
2017 50274840 1957222 25064231 23253387 21232326 3841986
2018 53827168 1960418 26296881 25569870 21900877 4404781
2019 57807360 2084044 27707704 28015612 23256375 4460650
1-7 历年绍兴市生产总值Gross Domestic Product of Shaoxing Municipality over the Years
注:①本表按当年价格计算。②历年 GDP 分别根据历次经济普查情况进行了修正,下同。③ 2019 年 GDP 数据为快报数 ,下同。④第一产业数据根据第三次农业普查情况进行了修正,下同。
Note: a) Data in value terms in this table are calculated at current prices. b)The GDP over the years was adjusted according to the all previous economic census, similarly hereinafter. c) The GDP of 2019 is preliminary data, similarly hereinafter. d) The data of the primary industry has been revised according to the third agricultural census, the same below.
单位:万元 (10 000 yuan)

025
综 合
年 份Year
地区生产总值 Gross Domestic
Product
第一产业 Primary Industry
第二产业 Secondary
Industry
第三产业Tertiary Industry
工 业Industry
建筑业 Construction
1978 100.0 45.6 32.8 21.6 28.2 4.6
1980 100.0 39.8 40.3 19.9 35.1 5.2
1985 100.0 29.5 51.1 19.4 46.7 4.4
1986 100.0 27.1 53.0 19.9 48.9 4.1
1987 100.0 25.0 54.8 20.2 49.4 5.4
1988 100.0 23.5 54.5 22 49.3 5.2
1989 100.0 23.4 53.3 23.3 48.2 5.1
1990 100.0 24.0 52.9 23.1 48.1 4.8
1991 100.0 22.4 54.9 22.7 50.1 4.8
1992 100.0 19.7 57.5 22.8 51.9 5.6
1993 100.0 16.5 60.8 22.7 52.9 7.9
1994 100.0 15.4 59.1 25.5 51.8 7.3
1995 100.0 13.8 60.0 26.2 52.5 7.5
1996 100.0 12.9 59.6 27.5 52.7 6.9
1997 100.0 11.9 59.7 28.4 53.5 6.2
1998 100.0 11.6 59.6 28.8 53.7 5.9
1999 100.0 10.9 59.6 29.5 53.7 5.9
2000 100.0 10.4 58.7 30.9 52.5 6.2
2001 100.0 9.7 58.0 32.3 51.6 6.4
2002 100.0 8.5 58.0 33.5 51.3 6.7
2003 100.0 7.5 59.1 33.4 51.9 7.2
2004 100.0 6.9 60.0 33.1 52.7 7.3
2005 100.0 6.4 60.3 33.3 54.1 6.3
2006 100.0 5.7 60.4 33.9 54.6 5.8
2007 100.0 5.2 60.4 34.4 54.9 5.5
2008 100.0 5.1 59.3 35.6 54.0 5.3
2009 100.0 5.1 58.0 36.9 52.0 6.0
2010 100.0 5.2 56.7 38.2 49.9 6.7
2011 100.0 5.0 55.9 39.2 48.7 7.1
2012 100.0 4.8 54.7 40.5 47.5 7.2
2013 100.0 4.5 53.9 41.6 46.6 7.3
2014 100.0 4.4 52.9 42.7 45.5 7.5
2015 100.0 4.2 51.5 44.2 44.1 7.5
2016 100.0 4.1 50.8 45.1 43.5 7.3
2017 100.0 3.9 49.9 46.3 42.2 7.6
2018 100.0 3.6 48.9 47.5 40.7 8.2
2019 100.0 3.6 47.9 48.5 40.2 7.7
1-8 历年绍兴市生产总值构成Composition of Gross Domestic Product over the Years
注:本表按当年价格计算。 Note: Data in value terms in this table are calculated at current prices.
单位:% (%)

026
绍兴市统计年鉴2020
年 份Year
地区生产总值 Gross Domestic
Product
第一产业 Primary Industry
第二产业 Secondary
Industry
第三产业Tertiary Industry
工 业Industry
建筑业 Construction
1978 100.0 100.0 100.0 100.0 100.0 100.0
1980 131.0 100.5 178.7 122.8 181.3 162.8
1985 268.8 131.5 525.6 212.7 566.8 271.8
1986 309.3 134.8 637.9 238.8 695.4 282.7
1987 344.9 128.8 752.7 261.5 808.6 407.7
1988 367.0 116.8 833.3 282.6 899.6 424.5
1989 371.4 121.1 843.4 278.4 913.2 412.3
1990 394.7 129.4 904.9 282.4 990.1 378.9
1991 461.6 142.9 1097.0 321.6 1205.5 439.2
1992 563.5 152.7 1408.6 392.7 1546.2 569.3
1993 770.5 173.8 2056.5 523.1 2223.4 962.7
1994 980.1 182.1 2747.5 660.1 2981.6 1240.9
1995 1170.2 194.3 3374.0 775.0 3646.5 1579.7
1996 1402.7 212.7 4116.2 923.0 4496.2 1753.4
1997 1609.1 231.9 4783.1 1043.9 5283.0 1797.3
1998 1796.4 253.9 5376.2 1152.5 5969.8 1896.1
1999 1988.5 265.0 6021.3 1264.3 6710.0 2030.7
2000 2214.9 276.6 6737.8 1428.7 7488.4 2343.5
2001 2464.5 289.4 7532.9 1605.8 8372.0 2634.1
2002 2793.6 301.3 8662.8 1817.8 9619.5 3047.6
2003 3200.0 304.9 10144.2 2063.2 11254.8 3599.2
2004 3708.8 313.7 11990.4 2362.4 13370.7 4088.7
2005 4224.3 321.5 13789.0 2700.2 15590.2 4133.7
2006 4773.5 305.4 15609.1 3132.2 17757.2 4406.5
2007 5465.7 308.5 17997.3 3608.3 20669.4 4635.6
2008 5979.5 319.6 19599.1 4005.2 22757.0 4501.2
2009 6535.6 330.8 20951.4 4573.9 24099.7 5338.4
2010 7254.5 347.0 23004.6 5200.5 26341.0 6107.1
2011 8001.7 361.6 25305.1 5803.8 29001.4 6669.0
2012 8769.9 372.1 27734.4 6413.2 31814.5 7289.2
2013 9506.6 383.3 30147.3 6958.3 34614.2 7821.3
2014 10219.6 388.3 32438.5 7521.9 37210.3 8415.7
2015 10945.2 397.6 34417.2 8213.9 39294.1 9206.8
2016 11547.2 404.4 36000.4 8772.4 41062.3 9648.7
2017 12367.1 412.1 38412.4 9465.4 44142.0 9851.3
2018 13245.2 419.1 41062.9 10194.2 47408.5 10235.5
2019 14198.9 428.7 43937.3 10989.3 51343.4 10082.0
1-9 历年绍兴市生产总值发展指数Indices of Gross Domestic Product of Shaoxing Municipality over the Years
注:本表按可比价格计算。Note: The indices in this table are calculated at comparable prices.
(1978 年 =100) (year of 1978=100)

027
综 合
年 份Year
地区生产总值 Gross Domestic
Product
第一产业 Primary Industry
第二产业 Secondary
Industry
第三产业Tertiary Industry
工 业Industry
建筑业 Construction
1978
1980 117.2 97.0 144.3 111.0 146.1 133.9
1985 132.5 107.0 153.1 120.1 152.0 170.0
1986 115.1 102.5 121.4 112.3 122.7 104.0
1987 111.5 95.5 118.0 109.5 116.3 144.2
1988 106.4 90.7 110.7 108.1 111.3 104.1
1989 101.2 103.7 101.2 98.5 101.5 97.1
1990 106.3 106.9 107.3 101.4 108.4 91.9
1991 116.9 110.4 121.2 113.9 121.8 115.9
1992 122.1 106.9 128.4 122.1 128.3 129.6
1993 136.7 113.8 146.0 133.2 143.8 169.1
1994 127.2 104.7 133.6 126.2 134.1 128.9
1995 119.4 106.7 122.8 117.4 122.3 127.3
1996 119.9 109.5 122.0 119.1 123.3 111.0
1997 114.7 109.0 116.2 113.1 117.5 102.5
1998 111.6 109.5 112.4 110.4 113.0 105.5
1999 110.7 104.3 112.0 109.7 112.4 107.1
2000 111.4 104.4 111.9 113.0 111.6 115.4
2001 111.3 104.7 111.8 112.4 111.8 112.4
2002 113.4 104.1 115.0 113.2 114.9 115.7
2003 114.5 101.2 117.1 113.5 117.0 118.1
2004 115.9 102.9 118.2 114.5 118.8 113.6
2005 113.9 102.5 115.0 114.3 116.6 101.1
2006 113.0 95.0 113.2 116.0 113.9 106.6
2007 114.5 101.0 115.3 115.2 116.4 105.2
2008 109.4 103.6 108.9 111.0 110.1 97.1
2009 109.3 103.5 106.9 114.2 105.9 118.6
2010 111.0 104.9 109.8 113.7 109.3 114.4
2011 110.3 104.2 110.0 111.6 110.1 109.2
2012 109.6 102.9 109.6 110.5 109.7 109.3
2013 108.4 103.0 108.7 108.5 108.8 107.3
2014 107.5 101.3 107.6 108.1 107.5 107.6
2015 107.1 102.4 106.1 109.2 105.6 109.4
2016 105.5 101.7 104.6 106.8 104.5 104.8
2017 107.1 101.9 106.7 107.9 107.5 102.1
2018 107.1 101.7 106.9 107.7 107.4 103.9
2019 107.2 102.3 107.0 107.8 108.3 98.5
1-10 历年绍兴市生产总值发展指数Indices of Gross Domestic Product of Shaoxing Municipality over the Years
注:本表按可比价格计算。Note: The indices in this table are calculated at comparable prices.
( 上年 =100) (preceding year=100)

028
绍兴市统计年鉴2020
年 份Year
地区生产总值 Gross Domestic
Product
第一产业 Primary Industry
第二产业 Secondary
Industry
第三产业Tertiary Industry
工 业Industry
建筑业 Construction
1978 14045 2099 8197 3749 7734 463
1980 25004 1736 16973 6295 15918 1055
1985 65118 3157 44195 17766 42028 2167
1986 75624 4102 51133 20389 48288 2845
1987 96812 4703 66225 25884 61317 4908
1988 113008 5035 72638 35335 68155 4483
1989 126206 5121 78010 43075 73083 4927
1990 137415 5760 85053 46602 80623 4430
1991 161700 6575 101415 53710 96063 5352
1992 198974 7066 128369 63539 117128 11241
1993 296304 9970 190369 95965 158724 31645
1994 414595 15576 255354 143665 213788 41566
1995 505279 17610 297022 190647 246674 50348
1996 624514 26760 345053 252701 292068 52985
1997 686823 26755 362707 297361 313660 49047
1998 691415 27039 332091 332285 275846 56245
1999 744068 27173 350149 366746 283799 66350
2000 1112628 71793 505323 535512 391134 114189
2001 1247725 71209 564717 611799 425242 139475
2002 1452918 66801 683902 702215 531413 152489
2003 1831304 57652 958802 814850 746209 212593
2004 2245702 57774 1194770 993157 937843 256928
2005 2598717 63479 1365352 1169886 1120540 244812
2006 3011614 64742 1606271 1340601 1326539 279732
2007 3466342 69034 1806508 1590800 1543890 262618
2008 3847246 66373 1954588 1826285 1683455 271133
2009 4111579 64429 1977844 2069306 1674888 302956
2010 4717733 74019 2209728 2433986 1836225 373503
2011 5514555 82915 2524741 2906899 2080556 444185
2012 5963853 82381 2609324 3272149 2132007 477317
2013 6743229 145041 2869921 3728268 2364970 506062
2014 7031865 128566 2914625 3988674 2380075 536458
2015 7163369 123740 2788962 4250667 2262627 527882
2016 7473648 127295 2861584 4484770 2304878 558251
2017 8111172 115971 3145198 4850003 2495330 651174
2018 8812346 116106 3399057 5297182 2611117 789759
2019 9440821 124974 3543590 5772256 2743134 802366
1-11 历年越城区生产总值Gross Domestic Product in Yuecheng District over the Years
注 : ① 2000 年、2013 年越城区地区生产总值按行政区划调整后的口径计算,下同。②本表按当年价格计算。Note: a) After 2000, Gross Domestic Product of Yuecheng District are calculated with administration division adjusted, the same as
2013, similarly hereinafter. b) Data in value terms in this table are calculated at current prices.
单位:万元 (10 000 yuan)

029
综 合
年 份Year
地区生产总值 Gross Domestic
Product
第一产业 Primary Industry
第二产业 Secondary
Industry
第三产业Tertiary Industry
工 业Industry
建筑业 Construction
1978 100.0 14.9 58.4 26.7 55.1 3.3
1980 100.0 6.9 67.9 25.2 63.7 4.2
1985 100.0 4.8 67.9 27.3 64.6 3.3
1986 100.0 5.4 67.6 27.0 63.9 3.7
1987 100.0 4.9 68.4 26.7 63.3 5.1
1988 100.0 4.4 64.3 31.3 60.3 4.0
1989 100.0 4.1 61.8 34.1 57.9 3.9
1990 100.0 4.2 61.9 33.9 58.7 3.2
1991 100.0 4.1 62.7 33.2 59.4 3.3
1992 100.0 3.6 64.5 31.9 58.9 5.6
1993 100.0 3.4 64.2 32.4 53.6 10.6
1994 100.0 3.7 61.6 34.7 51.6 10.0
1995 100.0 3.5 58.8 37.7 48.8 10.0
1996 100.0 4.3 55.3 40.4 46.8 8.5
1997 100.0 3.9 52.8 43.3 45.7 7.1
1998 100.0 3.9 48.0 48.1 39.9 8.1
1999 100.0 3.7 47.0 49.3 38.1 8.9
2000 100.0 6.5 45.4 48.1 35.1 10.3
2001 100.0 5.7 45.3 49.0 34.1 11.2
2002 100.0 4.6 47.1 48.3 36.6 10.5
2003 100.0 3.1 52.4 44.5 40.8 11.6
2004 100.0 2.6 53.2 44.2 41.8 11.4
2005 100.0 2.4 52.5 45.0 43.1 9.4
2006 100.0 2.1 53.3 44.5 44.0 9.3
2007 100.0 2.0 52.1 45.9 44.5 7.6
2008 100.0 1.7 50.8 47.5 43.8 7.0
2009 100.0 1.6 48.1 50.3 40.7 7.4
2010 100.0 1.6 46.8 51.6 38.9 7.9
2011 100.0 1.5 45.8 52.7 37.7 8.1
2012 100.0 1.4 43.8 54.9 35.7 8.0
2013 100.0 2.2 42.6 55.3 35.1 7.5
2014 100.0 1.8 41.4 56.7 33.8 7.6
2015 100.0 1.7 38.9 59.3 31.6 7.4
2016 100.0 1.7 38.3 60.0 30.8 7.5
2017 100.0 1.4 38.8 59.8 30.8 8.0
2018 100.0 1.3 38.6 60.1 29.6 9.0
2019 100.0 1.3 37.5 61.1 29.1 8.5
1-12 历年越城区生产总值构成Composition of Gross Domestic Product in Yuecheng District over the Years
注:本表按当年价格计算。Note: Data in value terms in this table are calculated at current prices.
单位:% (%)

030
绍兴市统计年鉴2020
年 份Year
地区生产总值 Gross Domestic
Product
第一产业 Primary Industry
第二产业 Secondary
Industry
第三产业Tertiary Industry
工 业Industry
建筑业 Construction
1978 100.0 100.0 100.0 100.0 100.0 100.0
1980 170.5 65.0 205.6 152.9 204.7 221.2
1985 395.5 85.9 516.9 316.4 525.4 375.1
1986 444.3 105.5 588.4 334.3 596.4 456.5
1987 537.6 104.5 729.5 384.2 729.5 729.9
1988 558.3 90.2 745.6 434.9 754.6 596.0
1989 555.5 85.4 739.6 440.0 749.1 582.2
1990 599.2 92.4 810.3 449.3 830.1 479.0
1991 689.7 104.4 947.8 503.2 971.6 553.5
1992 799.8 105.5 1134.3 557.2 1130.2 1004.4
1993 1030.0 128.8 1467.2 715.3 1379.5 2164.8
1994 1232.0 147.1 1764.6 850.1 1661.5 2578.6
1995 1395.9 152.4 1990.3 980.8 1873.5 2913.6
1996 1620.3 215.7 2212.9 1213.5 2103.3 3027.0
1997 1773.6 224.1 2353.8 1404.9 2277.3 2798.7
1998 1799.2 240.9 2228.5 1578.3 2095.3 3288.0
1999 1964.1 249.7 2406.4 1757.6 2226.8 3926.6
2000 2186.9 258.6 2694.1 1963.6 2475.1 4575.2
2001 2438.4 261.7 3041.2 2190.9 2737.5 5522.1
2002 2812.3 254.7 3653.8 2474.2 3395.5 5959.9
2003 3354.8 219.9 4724.6 2785.3 4414.7 7553.6
2004 3915.1 203.8 5631.7 3225.4 5319.7 8633.8
2005 4459.3 208.9 6352.6 3738.2 6218.7 8348.9
2006 5083.6 211.0 7356.3 4209.2 7226.1 9501.0
2007 5729.2 220.9 8202.3 4815.3 8338.9 8873.9
2008 6210.5 228.0 8735.4 5335.4 9022.7 8563.3
2009 6763.2 186.0 9058.6 6178.4 9284.4 9359.7
2010 7344.8 189.5 9674.6 6839.5 9897.2 10117.8
2011 8042.6 194.2 10429.2 7612.4 10797.8 10269.6
2012 8718.2 188.8 11107.1 8396.5 11478.1 11101.4
2013 9363.3 200.5 11740.2 9143.8 12224.2 11223.5
2014 9925.1 200.9 12362.4 9774.7 12945.4 11448.0
2015 10550.4 194.7 12720.9 10703.3 13463.2 11081.7
2016 10919.7 193.7 13102.5 11120.7 13880.6 11392.0
2017 11662.2 188.9 13901.8 11954.8 14838.4 11722.4
2018 12536.9 192.9 14833.2 12923.1 15817.7 12554.7
2019 13414.5 197.3 15752.9 13918.2 17067.3 12404.0
1-13 历年越城区生产总值发展指数Indices of Gross Domestic Product in Yuecheng District over the Years
注:①本表按可比价格计算。②发展指数计算不考虑行政区划调整。Note: a) The indices in this table are calculated at comparable prices. b) Regardless of changes in administrative areas.
(1978 年 =100) (year of 1978=100)

031
综 合
年 份Year
地区生产总值 Gross Domestic
Product
第一产业 Primary Industry
第二产业 Secondary
Industry
第三产业Tertiary Industry
工 业Industry
建筑业 Construction
1978
1980 146.5 68.5 170.3 128.5 169.2 191.8
1985 148.2 95.4 163.7 122.1 164.0 158.3
1986 112.4 122.8 113.8 105.7 113.5 121.7
1987 121.0 99.0 124.0 114.9 122.3 159.9
1988 103.8 86.3 102.2 113.2 103.4 81.7
1989 99.5 94.7 99.2 101.2 99.3 97.7
1990 107.9 108.2 109.6 102.1 110.8 82.3
1991 115.1 113.0 117.0 112.0 117.1 115.6
1992 116.0 101.1 119.7 110.7 116.3 181.5
1993 128.8 122.1 129.4 128.4 122.1 215.5
1994 119.6 114.2 120.3 118.8 120.4 119.1
1995 113.3 103.6 112.8 115.4 112.8 113.0
1996 116.1 141.5 111.2 123.7 112.3 103.9
1997 109.5 103.9 106.4 115.8 108.3 92.5
1998 101.4 107.5 94.7 112.3 92.0 117.5
1999 109.2 103.6 108.0 111.4 106.3 119.4
2000 111.3 103.6 112.0 111.7 111.2 116.5
2001 111.5 101.2 112.9 111.6 110.6 120.7
2002 115.3 97.3 120.1 112.9 124.0 107.9
2003 119.3 86.3 129.3 112.6 130.0 126.7
2004 116.7 92.7 119.2 115.8 120.5 114.3
2005 113.9 102.5 112.8 115.9 116.9 96.7
2006 114.0 101.0 115.8 112.6 116.2 113.8
2007 112.7 104.7 111.5 114.4 115.4 93.4
2008 108.4 103.2 106.5 110.8 108.2 96.5
2009 108.9 81.6 103.7 115.8 102.9 109.3
2010 108.6 101.9 106.8 110.7 106.6 108.1
2011 109.5 102.5 107.8 111.3 109.1 101.5
2012 108.4 97.2 106.5 110.3 106.3 108.1
2013 107.4 106.2 105.7 108.9 106.5 101.1
2014 106.0 100.2 105.3 106.9 105.9 102.0
2015 106.3 96.9 102.9 109.5 104.0 96.8
2016 103.5 99.5 103.0 103.9 103.1 102.8
2017 106.8 97.5 106.1 107.5 106.9 102.9
2018 107.5 102.1 106.7 108.1 106.6 107.1
2019 107.0 102.3 106.2 107.7 107.9 98.8
1-14 历年越城区生产总值发展指数Indices of Gross Domestic Product in Yuecheng District over the Years
注:本表按可比价格计算。Note: The indices in this table are calculated at comparable prices.
( 上年 =100) (preceding year=100)

032
绍兴市统计年鉴2020
年 份Year
全 市Whole
Municipality
越城区Yuecheng
District
柯桥区Keqiao District
上虞区Shangyu District
诸暨市ZhujiCity
嵊州市Shengzhou
City
新昌县Xinchang County
1978 112865 14045 26109 19782 24835 17490 10604
1980 165450 25004 37475 29325 33794 25246 14606
1985 400444 65118 123309 63174 67539 49805 31499
1986 475005 75624 153914 77744 78071 57169 32483
1987 567438 96812 170624 96563 93096 68439 41904
1988 679570 113008 196179 121666 115814 86501 51212
1989 761645 126206 213734 139342 134814 93557 53992
1990 823755 137415 251260 146831 140399 99845 61183
1991 981579 161700 311931 162519 164753 121725 82180
1992 1272537 198974 409038 204718 242795 159414 101467
1993 1997321 296304 605393 328819 434423 244980 136977
1994 3045664 414595 922334 586556 634501 328929 191629
1995 4047006 505279 1180609 770969 906033 447045 256648
1996 4953947 624514 1551650 886969 1183562 528410 325866
1997 5642896 686823 1746736 978487 1216016 560393 378532
1998 6090956 691415 1885099 1052060 1382533 597305 429905
1999 6509328 744068 2028629 1142943 1452311 651447 488823
2000 7168454 1112628 1825800 1289231 1569096 701619 573592
2001 7880179 1247725 2049003 1441394 1754116 782167 645284
2002 8860602 1452918 2361166 1541006 2002076 877807 723619
2003 10352193 1831304 2741026 1741186 2330563 1000405 854826
2004 12553004 2245702 3349827 1999671 2798142 1191027 1050811
2005 14628349 2598717 3920980 2313032 3272210 1422972 1188213
2006 17003674 3011614 4572343 2660398 3820579 1662396 1350498
2007 20007291 3466342 5504920 3144768 4457377 1949633 1550251
2008 22562045 3847246 6215910 3520908 5029447 2198680 1749802
2009 24068971 4111579 6662466 3736741 5336280 2334763 1915419
2010 28117467 4717733 7894449 4432616 6304176 2749039 2204199
2011 33569446 5514555 9475238 5335121 7517922 3299273 2628808
2012 36775219 5963853 10328398 5884465 8352325 3652937 2897602
2013 40108363 6743229 10855022 6363909 9182319 3979508 3158579
2014 42351578 7031865 11376443 6801514 9637487 4197639 3308776
2015 44246910 7163369 11897384 7222398 10072573 4359680 3414714
2016 46971537 7473648 12372287 7763719 10853370 4687938 3625363
2017 50274840 8111172 12960214 8409401 11523295 5089699 3905166
2018 53827168 8812346 13956856 9111401 12155247 5529791 4234436
2019 57807360 9440821 15042661 9781084 13123640 5891476 4514626
1-15 历年分区、县(市)生产总值Gross Domestic Product by District and County (City) over the Years
注 : ① 2000 年、2013 年,越城区、柯桥区地区生产总值按行政区划调整后的口径计算,下同。②本表按当年价格计算。Note: a) After 2000 and 2013, Gross Domestic Product of Yuecheng and Keqiao District are calculated with administration division
adjusted. The sane as in the following table. b) Data in value terms in this table are calculated at current prices.
单位:万元 (10 000 yuan)

033
综 合
年 份Year
全 市Whole
Municipality
越城区Yuecheng
District
柯桥区Keqiao District
上虞区Shangyu District
诸暨市ZhujiCity
嵊州市Shengzhou
City
新昌县Xinchang County
1978 100.0 100.0 100.0 100.0 100.0 100.0 100.0
1980 131.0 170.5 133.6 128.8 117.8 128.8 131.6
1985 268.8 395.5 433.3 244.8 192.0 210.2 226.1
1986 309.3 444.3 588.4 289.2 208.0 230.2 261.2
1987 344.9 537.6 614.4 340.1 243.1 273.7 304.4
1988 367.0 558.3 619.4 387.8 284.7 304.9 340.7
1989 371.4 555.5 611.5 384.1 332.6 305.8 322.6
1990 394.7 599.2 663.7 395.8 344.0 313.2 347.6
1991 461.6 689.7 821.5 443.1 396.2 397.7 466.2
1992 563.5 799.8 1024.3 536.5 550.7 492.8 552.4
1993 770.5 1030.0 1272.7 748.5 832.2 602.2 594.7
1994 980.1 1232.0 1644.9 959.4 1004.3 657.2 696.5
1995 1170.2 1395.9 1912.8 1133.7 1254.0 798.6 834.0
1996 1402.7 1620.3 2412.3 1248.7 1610.4 918.2 1056.0
1997 1609.1 1773.6 2725.2 1377.0 1684.2 972.1 1224.2
1998 1796.4 1799.2 3055.9 1513.2 1949.4 1075.4 1409.7
1999 1988.5 1964.1 3409.2 1707.3 2082.2 1193.8 1630.1
2000 2214.9 2186.9 3800.2 1940.6 2336.5 1289.8 1845.4
2001 2464.5 2438.4 4270.0 2181.7 2613.7 1435.4 2069.7
2002 2793.6 2812.3 4846.6 2355.3 2979.9 1609.0 2317.5
2003 3200.0 3354.8 5636.8 2661.2 3416.4 1814.0 2637.6
2004 3708.8 3915.1 6634.5 3028.4 3976.7 2078.8 3099.2
2005 4224.3 4459.3 7623.0 3400.9 4549.3 2386.5 3458.7
2006 4773.5 5083.6 8652.1 3829.4 5172.6 2701.5 3880.7
2007 5465.7 5729.2 10097.0 4380.8 5912.3 3220.2 4408.5
2008 5979.5 6210.5 11036.0 4761.9 6485.8 3535.8 4809.7
2009 6535.6 6763.2 12172.7 5185.7 7121.4 3854.0 5266.6
2010 7254.5 7344.8 13463.0 5885.8 7954.6 4328.0 5751.1
2011 8001.7 8042.6 14903.5 6509.7 8845.5 4769.5 6360.7
2012 8769.9 8718.2 16453.5 7167.2 9747.7 5236.9 6996.8
2013 9506.6 9363.3 17802.7 7797.9 10664.0 5640.1 7619.5
2014 10219.6 9925.1 18959.9 8452.9 11602.4 6063.1 8282.4
2015 10945.2 10550.4 20381.9 9162.9 12414.6 6493.6 8787.6
2016 11547.2 10919.7 21074.9 9804.3 13320.9 6987.1 9358.8
2017 12367.1 11662.2 22571.2 10510.2 14253.4 7532.1 10070.1
2018 13245.2 12536.9 24106.0 11288.0 15208.4 8134.7 10815.3
2019 14198.9 13414.5 25938.1 12123.3 16349.0 8647.2 11496.7
1-16 历年分区、县(市)生产总值发展指数Indices of Gross Domestic Product by District and County (City) over the Years
注:本表按可比价格计算。Note: The indices in this table are calculated at comparable prices.
(1978 年 =100) (year of 1978=100)

034
绍兴市统计年鉴2020
年 份Year
全 市Whole
Municipality
越城区Yuecheng
District
柯桥区Keqiao District
上虞区Shangyu District
诸暨市ZhujiCity
嵊州市Shengzhou
City
新昌县Xinchang County
1978
1980 117.2 146.5 110.1 109.6 107.3 111.9 112.7
1985 132.5 148.2 146.4 128.6 122.4 122.3 120.6
1986 115.1 112.4 135.8 118.2 108.3 109.5 115.5
1987 111.5 121.0 104.4 117.6 116.9 118.9 116.6
1988 106.4 103.8 100.8 114.0 117.1 111.4 111.9
1989 101.2 99.5 98.7 99.0 116.8 100.3 94.7
1990 106.3 107.9 108.5 103.1 103.4 102.4 107.7
1991 116.9 115.1 123.8 112.0 115.2 127.0 134.1
1992 122.1 116.0 124.7 121.1 139.0 123.9 118.5
1993 136.7 128.8 124.2 139.5 151.1 122.2 107.6
1994 127.2 119.6 129.3 128.2 120.7 109.1 117.1
1995 119.4 113.3 116.3 118.2 124.9 121.5 119.7
1996 119.9 116.1 126.1 110.1 128.4 115.0 126.6
1997 114.7 109.5 113.0 110.3 104.6 105.9 115.9
1998 111.6 101.4 112.1 109.9 115.7 110.6 115.2
1999 110.7 109.2 111.6 112.8 106.8 111.0 115.6
2000 111.4 111.3 111.5 113.7 112.2 108.0 113.2
2001 111.3 111.5 112.4 112.4 111.9 111.3 112.2
2002 113.4 115.3 113.5 108.0 114.0 112.1 112.0
2003 114.5 119.3 116.3 113.0 114.6 112.7 113.8
2004 115.9 116.7 117.7 113.8 116.4 114.6 117.5
2005 113.9 113.9 114.9 112.3 114.4 114.8 111.6
2006 113.0 114.0 113.5 112.6 113.7 113.2 112.2
2007 114.5 112.7 116.7 114.4 114.3 119.2 113.6
2008 109.4 108.4 109.3 108.7 109.7 109.8 109.1
2009 109.3 108.9 110.3 108.9 109.8 109.0 109.5
2010 111.0 108.6 110.6 113.5 111.7 112.3 109.2
2011 110.3 109.5 110.7 110.6 111.2 110.2 110.6
2012 109.6 108.4 110.4 110.1 110.2 109.8 110.0
2013 108.4 107.4 108.2 108.8 109.4 107.7 108.9
2014 107.5 106.0 106.5 108.4 108.8 107.5 108.7
2015 107.1 106.3 107.5 108.4 107.0 107.1 106.1
2016 105.5 103.5 103.4 107.0 107.3 107.6 106.5
2017 107.1 106.8 107.1 107.2 107.0 107.8 107.6
2018 107.1 107.5 106.8 107.4 106.7 108.0 107.4
2019 107.2 107.0 107.6 107.4 107.5 106.3 106.3
1-17 历年分区、县(市)生产总值发展指数Indices of Gross Domestic Product by District and County (City) over the Years
注:本表按可比价格计算。Note: The indices in this table are calculated at comparable prices.
( 上年 =100) (preceding year=100)

035
综 合
年 份Year
全 市Whole
Municipality
越城区Yuecheng
District
柯桥区Keqiao District
上虞区Shangyu District
诸暨市ZhujiCity
嵊州市Shengzhou
City
新昌县Xinchang County
2001 17903
2002 19974
2003 23110
2004 27874
2005 31950
2006 36725
2007 42696
2008 47655
2009 50401
2010 57925
2011 68189
2012 74470
2013 81098
2014 85519
2015 89172
2016 94358
2017 100570
2018 107172 89949 141975 114544 102624 79858 109318
2019 114561 95822 151457 122601 110524 84885 116281
1-18 历年分区、县(市)人均地区生产总值(常住)Per Capita Gross Domestic Product by District and County (City) over the Years
(Calculated by Permanent Residents Population)
单位:元 (yuan)

036
绍兴市统计年鉴2020
1-19 历年分区、县(市)人均地区生产总值(户籍)Per Capita Gross Domestic Product by District and County (City) over the Years
(Calculated by Household Registered Population)
单位:元 (yuan)
年 份Year
全 市Whole
Municipality
越城区Yuecheng
District
柯桥区Keqiao District
上虞区Shangyu District
诸暨市ZhujCity
嵊州市Shengzhou
City
新昌县Xinchang County
1978 299 299 290 265 257 275
1980 433 428 424 355 366 372
1985 1016 2631 1392 890 692 704 763
1986 1198 2972 1731 1090 794 805 781
1987 1417 3705 1902 1340 939 958 999
1988 1680 4226 2164 1669 1156 1204 1213
1989 1865 4629 2332 1895 1332 1294 1273
1990 2002 4968 2714 1981 1380 1373 1435
1991 2371 5785 3340 2177 1614 1666 1919
1992 3057 7029 4349 2725 2369 2174 2362
1993 4774 10300 6394 4351 4225 3333 3182
1994 7239 14032 9697 7715 6143 4468 4443
1995 9561 16651 12352 10083 8714 6066 5941
1996 11635 20214 16109 11543 11312 7160 7531
1997 13188 21782 18022 12687 11565 7589 8738
1998 14182 21498 19380 13601 13099 8093 9917
1999 15107 22565 20846 14753 13713 8828 11262
2000 16586 18940 25214 16629 14781 9494 13200
2001 18200 20968 28294 18594 16531 10581 14835
2002 20443 24000 32875 19904 18897 11895 16629
2003 23869 28856 39089 22502 22055 13586 19678
2004 28914 35002 47687 25841 26508 16286 24216
2005 33636 40197 55695 29886 30984 19380 27364
2006 39062 46429 64744 34405 36161 22653 31085
2007 45902 53378 77632 40692 42106 26569 35637
2008 51671 59239 87237 45552 47354 29957 40174
2009 55027 63353 93025 48301 50084 31811 43963
2010 64148 72614 109660 57174 59019 37453 50531
2011 76388 84644 130899 68672 70210 44922 60141
2012 83500 91183 142173 75639 77858 49727 66097
2013 90898 90721 158457 81694 85417 54206 71910
2014 95742 94216 176010 87228 89366 57235 75342
2015 99863 95576 182557 92607 93275 59576 77975
2016 105834 99192 188189 99528 100426 64203 83085
2017 112849 107024 194162 107709 106321 69791 89602
2018 120460 115669 205998 116693 111984 76013 97269
2019 129168 123169 219713 125412 120973 81238 103962

037
综 合
年 份Year
全 市Whole
Municipality
越城区Yuecheng
District
柯桥区Keqiao District
上虞区Shangyu District
诸暨市ZhujiCity
嵊州市Shengzhou
City
新昌县Xinchang County
2001
2002 112.5
2003 113.4
2004 114.6
2005 112.7
2006 111.7
2007 113.1
2008 108.3
2009 108.4
2010 109.2
2011 108.8
2012 109.3
2013 108.2
2014 107.3
2015 106.9
2016 105.1
2017 106.6
2018 106.6 106.9 106.2 106.9 106.2 107.5 106.9
2019 106.7 106.4 106.5 107.1 107.2 106.1 106.1
1-20 历年分区、县(市)人均生产总值发展指数(常住)Indices of Per Capita Gross Domestic Product by District and County (City) over the Years
(Calculated by Permanent Residents Population)
( 上年 =100) (preceding year=100)
注:本表按可比价格计算。Note: The indices in this table are calculated at comparable prices.

038
绍兴市统计年鉴2020
1-21 历年分区、县(市)人均生产总值发展指数(户籍)Indices of Per Capita Gross Domestic Product by District and County (City) over the Years
(Calculated by Household Registered Population)
( 上年 =100) (preceding year=100)
年 份Year
全 市Whole
Municipality
越城区Yuecheng
District
柯桥区Keqiao District
上虞区Shangyu District
诸暨市ZhujiCity
嵊州市Shengzhou
City
新昌县Xinchang County
1978
1980 116.6 110.1 108.9 106.8 111.2 111.7
1985 132.0 144.8 146.4 128.5 121.8 122.0 119.8
1986 114.3 109.3 135.3 117.7 107.6 109.1 114.6
1987 110.5 117.8 103.5 116.3 115.8 118.2 115.6
1988 105.3 101.5 99.8 112.7 115.9 110.7 111.2
1989 100.2 97.6 97.7 98.2 115.7 99.7 94.2
1990 105.5 106.3 107.4 102.2 102.9 101.8 107.2
1991 116.2 113.9 122.7 111.2 114.8 126.4 133.6
1992 121.4 114.5 123.8 120.3 138.5 123.5 118.1
1993 136.0 126.7 123.4 138.7 150.6 121.9 107.4
1994 126.5 116.5 128.7 127.4 120.1 109.0 116.9
1995 118.7 110.3 115.7 117.5 124.0 121.4 119.6
1996 119.2 114.0 125.1 109.6 127.6 114.8 126.4
1997 114.1 107.3 112.3 109.9 104.1 105.8 115.8
1998 111.2 99.5 111.7 109.6 115.3 110.7 115.1
1999 110.3 106.5 111.5 112.7 106.4 111.0 115.5
2000 111.0 109.6 111.5 113.6 112.0 107.9 113.1
2001 111.1 110.1 112.4 112.4 111.9 111.3 112.0
2002 113.2 113.4 113.2 108.1 114.2 112.3 111.9
2003 114.5 117.8 116.0 113.0 114.9 113.0 114.0
2004 115.7 113.7 119.1 113.8 116.5 113.1 117.6
2005 113.7 113.0 114.6 112.4 114.4 114.9 111.5
2006 112.9 113.6 113.1 112.7 113.6 113.3 112.1
2007 114.4 112.5 116.2 114.5 114.0 119.2 113.5
2008 109.2 108.3 108.8 108.6 109.4 109.8 108.9
2009 109.1 109.0 109.7 108.8 109.5 109.0 109.5
2010 110.8 108.5 110.0 113.2 111.4 112.3 109.0
2011 110.0 109.2 110.1 110.4 111.0 110.1 110.4
2012 109.4 107.9 110.0 109.9 110.0 109.5 109.6
2013 108.1 107.2 114.7 108.7 109.1 108.2 108.7
2014 107.2 105.6 112.9 108.3 108.5 107.6 108.7
2015 107.0 105.9 106.6 108.3 106.8 107.4 106.4
2016 105.3 102.9 102.5 107.0 107.1 107.8 106.8
2017 106.6 106.2 105.5 107.1 106.7 107.9 107.7
2018 106.7 106.9 105.2 107.3 106.5 108.2 107.5
2019 107.0 106.4 106.5 107.5 107.6 106.6 106.6
注:本表按可比价格计算。Note: The indices in this table are calculated at comparable prices.

039
综 合
指 标 Item全 市Whole
Municipality
越城区Yuecheng
District
柯桥区Keqiao District
上虞区Shangyu District
诸暨市ZhujiCity
嵊州市Shengzhou
City
新昌县Xinchang County
地区生产总值
Gross Domestic Product
57807360 9440821 15042661 9781084 13123640 5891476 4514626
# 第一产业 Primary Industry 2084044 124974 372120 496989 477046 391944 220971
第二产业 Secondary Industry 27707704 3543590 7553843 5049645 6468524 2836684 2238034
# 工业 Industry 23256375 2743134 6399922 4271788 5410860 2434269 1978577
建筑业 Construction 4460650 802366 1155243 778706 1061643 403052 259640
第三产业 Tertiary Industry 28015612 5772256 7116697 4234450 6178070 2662848 2055621
指 标 Item全 市Whole
Municipality
越城区Yuecheng
District
柯桥区Keqiao District
上虞区Shangyu District
诸暨市ZhujiCity
嵊州市Shengzhou
City
新昌县Xinchang County
地区生产总值
Gross Domestic Product
107.2 107.0 107.6 107.4 107.5 106.3 106.3
# 第一产业 Primary Industry 102.3 102.3 102.4 102.3 102.4 102.3 102.2
第二产业 Secondary Industry 107.0 106.2 107.9 106.9 107.4 106.5 105.6
# 工业 Industry 108.3 107.9 109.3 108.0 109.1 107.5 106.4
建筑业 Construction 98.5 98.8 98.5 99.9 97.4 98.8 97.5
第三产业 Tertiary Industry 107.8 107.7 107.6 108.7 108.2 106.6 107.8
1-22 分区、县(市)生产总值(2019年)Gross Domestic Product by District and County (City) (2019)
1-23 分区、县(市)生产总值发展指数(2019年)Indices of Gross Domestic Product by District and County (City) (2019)
单位:万元
( 上年 =100)
(10 000 yuan)
(preceding year=100)
注:本表按当年价格计算。Note: Data in value terms in this table are calculated at current prices.
注:本表按可比价格计算。Note: The indices in this table are calculated at comparable prices.

040
绍兴市统计年鉴2020
主要统计指标解释
地区生产总值(GDP) 是按市场价格计算的地区生产总值的简称。它是一个国家 ( 或地区 ) 所有常住单
位在一定时期内生产活动的最终成果。国内生产总值有三种表现形态,即价值形态、收入形态和产品形态。从
价值形态看,它是所有常住单位在一定时期内所生产的全部货物和服务价值超过同期投入的全部非固定资产货
物和服务价值的差额,即所有常住单位的增加值之和;从收入形态看,它是所有常住单位在一定时期内所创造并
分配给常住单位和非常住单位的初次分配收入之和;从产品形态看,它是最终使用的货物和服务减去进口货物
和服务。在实际核算中,国内生产总值的三种表现形态表现为三种计算方法,即生产法、收入法和支出法。三种
方法分别从不同的方面反映国内生产总值及其构成。
各个计划时期 各个计划时期代表的年份如下:恢复时期为 1950 年至 1952 年;第一个五年计划时期 ( 简称
“一五”时期 ) 为 1953 年至 1957 年;第二个五年计划时期 ( 简称“二五”时期 ) 为 1958 年至 1962 年;三年调整时
期为 1963 年至 1965 年;第三个五年计划时期 ( 简称“三五”时期 ) 为 1966 年至 1970 年;第四个五年计划时期 ( 简
称“四五”时期 ) 为 1971 年至 1975 年;第五个五年计划时期 ( 简称“五五”时期 ) 为 1976 年至 1980 年;第六个五
年计划时期 ( 简称“六五”时期 ) 为 1981 年至 1985 年;第七个五年计划时期 ( 简称“七五”时期 ) 为 1986 年至
1990 年;第八个五年计划时期 ( 简称“八五”时期 ) 为 1991 年至 1995 年;第九个五年计划时期 ( 简称“九五”时期 )
为 1996 年至 2000 年;第十个五年计划时期 ( 简称“十五”时期 ) 为 2001 年至 2005 年;第十一个五年计划时期 ( 简
称“十一五”时期 ) 为 2006 年至 2010 年;第十二个五年计划时期 ( 简称“十二五”时期 ) 为 2011 年至 2015 年;第
十三个五年计划时期 ( 简称“十三五”时期 ) 为 2016 年至 2020 年。
国有企业 指企业全部资产归国家所有,并按《中华人民共和国企业法人登记管理条例》规定登记注册的
非公司制的经济组织。不包括有限责任公司中的国有独资公司。
集体企业 指企业资产归集体所有,并按《中华人民共和国企业法人登记管理条例》规定登记注册的经济
组织。
股份合作企业 指以合作制为基础,由企业职工共同出资入股,吸收一定比例的社会资产投资组建,实行自
主经营,自负盈亏,共同劳动,民主管理,按劳分配与按股分红相结合的一种集体经济组织。
联营企业 两个及两个以上相同或不同所有制性质的企业法人或事业单位法人,按自愿、平等、互利的原
则,共同投资组成的经济组织。联营企业包括国有联营企业、集体联营企业、国有与集体联营企业和其他联营企
业。
有限责任公司 指根据《中华人民共和国公司登记管理条例》规定登记注册,由两个以上,五十个以下的股
东共同出资,每个股东以其所认缴的出资额对公司承担有限责任,公司以其全部资产对其债务承担责任的经济组
织。有限责任公司包括国有独资公司以及其他有限责任公司。
(1) 国有独资公司:指国家授权的投资机构或者国家授权的部门单独投资设立的有限责任公司。
(2) 其他有限责任公司:指国有独资公司以外的有限责任公司。
股份有限公司 指根据《中华人民共和国公司登记管理条例》规定登记注册,其全部注册资本由等额股份
构成并通过发行股票筹集资本,股东以其认购的股份对公司承担有限责任,公司以其全部资产对其债务承担责任

041
综 合
的经济组织。
私营企业 指由自然人投资设立或由自然人控股,以雇佣劳动为基础的营利性经济组织。包括按照《公司
法》、《合伙企业法》、《私营企业暂行条例》规定登记注册的私营有限责任公司、私营股份有限公司、私营合伙企业
和私营独资企业。
其他企业 指上述企业之外的其他内资经济组织。
外商投资企业 指外国投资者根据中华人民共和国有关涉外经济的法律、法规,以合资、合作或独资的形
式在中国大陆境内开办的企业。包括中外合资经营企业、中外合作经营企业和外资企业。
港、澳、台投资企业 指港、澳、台地区投资者参照中华人民共和国有关涉外经济的法律、法规,以合资、合作
或独资的形式在祖国大陆举办的企业。包括合资经营企业、合作经营企业和独资企业。
三次产业 根据社会生产活动历史发展的顺序对产业结构的划分,产品直接取自自然界的部门称为第一产
业,对初级产品进行再加工的部门称为第二产业,为生产和消费提供各种服务的部门称为第三产业。它是世界
通用的产业结构分类,但各国的划分不尽一致。我国的三次产业划分是:
第一产业:农、林、牧、渔业 ( 不含农林牧渔服务业 )。
第二产业:采矿业(不含开采辅助活动),制造业(不含金属制品、机械和设备修理业),电力、热力、燃气及水生
产和供应业、建筑业。
第三产业:除第一、二产业以外的其他行业。

042
绍兴市统计年鉴2020
Explanatory Notes on Main Statistical Indicators
Gross Domestic Product (GDP) refers to the final products of all resident units in a country
(or a region) during a certain period of time. Gross Domestic Product is expressed in three different forms,
i.e.value,income, and products respectively. The form of value refers to the total value of all products and
services produced by all resident units during a certain period of time minus total value of intimidate input
of materials and services of the nature of non-fixed assets or the summation of the value-added of all resident
units; the form of income includes all the income created by all resident units and distributed primarily to
all resident and non-resident units; the form of products refers to the value of all final goods and services
for final use by all resident units plus the value of net exports of goods and services during a given period
of time. In the practice of national accounting, gross domestic product is calculated with three approaches,
i.e.production approach, income approach, and expenditure approach, which reflect gross domestic product
and its composition from different aspects.
Various Planning Periods the conventional division of time period is as follows :Economic
Rehabilitation Period, 1950-1952;the First Five-year Plan period,1953-1957; the Second Five-year Plan
period,1958-1962; the Third Five-year Plan period,1966-1970; the Fourth Five-year Plan period,1971-1975; the
Fifth Five-year Plan period,1976-1980; the Sixth Five-year Plan period,1981-1985; the Seventh Five-year Plan
period,1986-1990; the Eighth Five-year Plan period,1991-1995; the Ninth Five-year Plan period,1996-2000; the
Tenth Five-year Plan period,2001-2005; the Eleventh Five-year Plan period,2006-2010; the Twelfth Five-year
Plan period,2011-2015; the Thirteenth Five-year Plan period,2016-2020.
State-owned Enterprises refers to non-corporation economic units where the entire assets are
owned by the state and which have registered in accordance with the Regulation of the People’s Republic of
China on the Management of Registration of Corporate Enterprises.Excluded from this category are sole state-
funded corporations in the limited liability corporations.
Collective-owned Enterprises refers to economic units where the assets are owned collectively
and which have registered in accordance with the Regulation of the People’s Republic of China on the
Management of Registration of Corporate Enterprises.
Cooperative Enterprises refers to a form of collective economic units (enterprises) where
capitals come mainly from employees as their shares, with certain proportion of capital from the outside,
where production is organized on the basis of independent operation, independent accounting for profits and
losses, joint work, democratic management, and a distribution system that integrates remuneration according
to work with dividend according to capital share.
Joint Ownership Enterprises refers to economic units established by two or more corporate
enterprises or corporate institutions of the same or different ownership, through joint investment on the
basis of equality, voluntary participation and mutual benefits. They include state joint ownership enterprises,
collective joint ownership enterprises, joint state-collective enterprises, other joint ownership enterprises.

043
综 合
Limited Liability Corporations refers to economic units established with investment from
2-50 investors and registered in accordance with the Regulation of the People’s Republic of China on the
Management of Registration of Corporations, each investor bearing limited liability to the corporation
depending on its share of investment, and the corporation bearing liability to its debt to the maximum of its
total assets.Limited liability corporations include exclusive state-funded limited liability corporations and
other limited liability corporations.
(1) Exclusive State-funded Corporations refers to limited liability corporations established with exclusive
investment from investment institutions or departments authorized by the state.
(2) Other Limited Liability Corporations refers to limited liability corporations other than exclusive state-
funded corporations.
Share-holding Corporations Ltd. refers to economic units registered in accordance with the
Regulation of the People’s Republic of China on the Management of Registration of Corporations, with total
registered capitals divided into equal shares and raised through issuing stocks. Each investor bears limited
liability to the corporation depending on the holding of shares,and the corporation bears liability to its debt to
the maximum of its total assets.
Private Enterprises refers to profit-making economic units invested and established by natural
persons, or controlled by natural persons using employed labour. Included in this category are private limited
liability corporations, private shareholding corporations Ltd., private partnership enterprises and private-
funded enterprises registered in accordance with the Corporation Law, Partnership Enterprises Law and
Interim Regulations on Private Enterprises.
Other Domestic-funded Enterprises refers to domestic-funded economic units other than
those mentioned above.
Enterprises with Foreign Investment refers to enterprises set up in mainland China in the
forms of joint investment, cooperation or solely-owned investment by foreign investors in accordance with
foreign-related economic laws & regulations of China. They include joint-venture enterprises with foreign
investment, cooperation enterprises with foreign investment and enterprises with sole (exclusive) foreign
investment.
Enterprises with Investment from HongKong, Macao and Taiwan refers to
enterprises set up in mainland China in the forms of joint investment,cooperation or solely-owned investment
by investors from HongKong, Macao and Taiwan in accordance with foreign-related economic laws &
regulations of China. They include joint-venture enterprises, cooperative enterprises & solely-owned
enterprises.
Three Industries Industry structure has been classified according to the historical sequence
of development. Primary industry refers to extraction of natural resources; secondary industry involves
processing of primary products;and tertiary industry provides services of various kinds for production and
consumption. The above classification is universal although it varies to some extent form country to country.

044
绍兴市统计年鉴2020
Industry in China comprises:
Primary industry: agriculture (including farming, forestry, animal husbandry and fishery).
Secondary industry: industry (including mining and quarrying, manufacturing, production and supply of
electricity, water and gas) and construction.
Tertiary industry: all other industries not included in primary or secondary industry.

人口和劳动力2 CHAPTER 2 POPULATION AND LABOUR FORCE

046
绍兴市统计年鉴2020
年 末 户 籍 总 人 口Total Year-end Population
0
50
100
150
200
250
300
350
400
450
500
1949 1965 1970 1975 1980 1985 1990 1995 2000 2005 2010 2015 2016 2017 2018 2019
单位:万人 (10 000 persons)
男 女 人 口 比 例 情 况Proportion of Male and Female
50.0%
50.1%
51.4%
51.5%
51.7%
51.8%
51.6%
51.3%
50.9%
50.5%
50.2%
49.9%
49.9%
49.8%
49.8%
48.6%
48.5%
48.3%
48.2%
48.4%
48.7%
49.1%
49.5%
49.8%
50.0%
50.1%
50.2%
50.2%
1970
1975
1980
1985
1990
1995
2000
2005
2010
2015
2016
2017
2018
2019
女性人口
男性人口

047
人口和劳动力
人 口 自 然 增 长 率Natural Growth Rate of Population
0.431.49
26.46
18.40
11.12
4.303.68
7.24 6.83
3.51
1.972.64 2.59 2.88
1.06
0
5
10
15
20
25
30
1965 1970 1975 1980 1985 1990 1995 2000 2005 2010 2015 2016 2017 2018 2019
单位:‰
1182714732
1686219692
2150724630
269152995630636
3250235125
5872861394
67489
75375
80842
0
10000
20000
30000
40000
50000
60000
70000
80000
90000
2000 2001 2002 2003 2004 2005 2006 2007 2008 2009 2010 2015 2016 2017 2018 2019
非私营单位在岗职工年平均工资Average Annual Wage of Staff and Workers at work in Non
Private-Owned Units
单位:元 (yuan)

048
绍兴市统计年鉴2020
年 份Year
出生人数 ( 人 )出生率 (‰ )Birth Rate
(‰)
死亡人数 ( 人 )死亡率 (‰ )Death Rate
(‰)
自然增长率 (‰ )Natural Growth
Rate (‰)
迁入人口 ( 人 ) 迁出人口 ( 人 )
Birth Population (person)
Death Population (person)
Population Transferred into
(person)
Population Transferred out (person)
1962 92192 32.89 25778 9.20 23.70
1965 104771 34.21 23758 7.76 26.46
1970 84160 24.64 21307 6.24 18.40
1975 65018 17.74 24247 6.62 11.12
1980 41530 10.87 25107 6.57 4.30
1985 41531 10.54 27049 6.86 3.68
1990 56839 13.81 27026 6.57 7.24 54621 54582
1991 53479 12.92 26449 6.39 6.53 36710 36219
1992 49400 11.87 27925 6.71 5.16 41192 41247
1993 53994 12.91 27853 6.66 6.25 31935 32795
1994 52450 12.47 28410 6.75 5.72 48327 49488
1995 58376 13.79 29454 6.96 6.83 55939 55100
1996 53564 12.58 28229 6.63 5.95 48192 49209
1997 50388 11.78 27604 6.45 5.32 43192 43193
1998 44197 10.29 29847 6.95 3.34 52889 54444
1999 44869 10.41 28324 6.57 3.84 69209 68948
2000 45736 10.58 30560 7.07 3.51 78055 80652
2001 41370 9.56 28210 6.52 3.04 70853 76877
2002 41089 9.48 29435 6.79 2.69 74655 80332
2003 37498 8.64 30815 7.10 1.54 54358 55826
2004 41698 9.60 28183 6.49 3.11 44141 48207
2005 39974 9.19 31395 7.22 1.97 42809 47105
2006 33263 7.64 29079 6.68 0.96 44865 44643
2007 34600 7.94 29410 6.75 1.19 45485 43005
2008 31328 7.17 30396 6.96 0.21 43136 35316
2009 31573 7.22 32583 7.45 -0.23 39601 31434
2010 32438 7.40 31197 7.12 0.28 42278 31383
2011 31851 7.25 30013 6.83 0.42 35621 25508
2012 35215 8.00 31837 7.23 0.77 32368 26097
2013 33460 7.58 30436 6.90 0.69 28653 22643
2014 42043 9.50 30368 6.87 2.64 29759 26899
2015 32235 7.28 30342 6.85 0.43 21274 19651
2016 38469 8.67 26989 6.08 2.59 21071 18187
2017 47982 10.77 35135 7.89 2.88 24670 18008
2018 37466 8.38 32728 7.32 1.06 22760 19926
2019 36049 8.05 29390 6.57 1.49 20778 20644
2-1 历年全市人口变动情况Population Changes of the Whole Municipality
注:人口统计均为公安户籍人口,下同。Note: Data in this table were taken from the annual reports of the Bureau of Public Security (The same as the following table).

049
人口和劳动力
年 份Year
全 市Whole
Municipality
越城区Yuecheng
District
柯桥区KeqiaoDistrict
上虞区Shangyu District
诸暨市ZhujiCity
嵊州市Shengzhou
City
新昌县Xinchang County
1949 58.19 18.60 8.47 14.55 10.43 6.14
1957 64.74 19.50 11.07 15.12 12.02 7.03
1962 69.03 20.91 12.31 15.95 12.44 7.42
1965 70.74 21.27 12.55 16.57 12.77 7.58
1970 77.89 23.62 13.86 17.90 14.13 8.38
1975 86.57 25.92 15.48 19.91 16.15 9.11
1980 96.30 27.87 17.13 22.92 18.26 10.12
1985 110.60 7.26 24.42 20.20 26.81 20.48 11.43
1990 128.87 8.99 27.72 23.47 31.73 23.47 13.50
1991 130.36 9.14 28.17 23.58 32.55 23.27 13.66
1992 133.82 9.37 28.48 24.13 34.07 23.76 14.01
1993 134.57 9.45 28.75 24.16 34.17 23.99 14.05
1994 135.95 9.76 28.79 24.55 34.54 24.17 14.14
1995 137.46 9.90 29.19 24.47 35.16 24.35 14.40
1996 139.73 10.07 30.08 25.25 35.16 24.72 14.46
1997 142.16 10.23 30.55 25.95 35.31 25.22 14.89
1998 143.85 10.47 31.13 26.00 35.69 25.43 15.13
1999 145.99 10.76 31.79 26.09 36.25 25.74 15.36
2000 147.73 19.69 23.52 26.18 36.80 25.96 15.59
2001 149.90 20.25 23.80 26.39 37.31 26.15 15.98
2002 152.20 20.92 24.12 26.58 37.82 26.55 16.21
2003 152.56 22.62 24.26 27.03 36.86 26.26 15.53
2004 155.18 23.00 24.66 27.54 37.35 26.83 15.79
2005 156.74 23.13 24.92 28.06 37.76 26.89 15.98
2006 159.00 23.26 25.27 28.53 38.77 27.03 16.14
2007 161.08 23.48 25.51 28.89 39.75 27.10 16.35
2008 162.23 23.55 25.79 29.20 40.14 27.06 16.49
2009 162.39 23.88 25.66 29.29 40.15 26.90 16.51
2010 161.88 23.43 25.54 29.38 40.22 26.79 16.52
2011 162.07 23.45 25.43 29.41 40.46 26.64 16.68
2012 162.00 23.48 25.32 29.41 40.45 26.47 16.87
2013 161.55 26.50 22.20 29.14 40.27 26.31 17.13
2014 161.48 26.42 22.02 28.81 41.02 26.02 17.19
2015 161.43 26.43 22.11 28.70 41.19 25.78 17.22
2016 161.53 26.53 22.28 28.60 41.07 25.70 17.35
2017 161.29 26.54 22.59 28.52 40.80 25.50 17.34
2018 161.34 26.82 22.83 28.49 40.65 25.37 17.18
2019 161.77 27.22 23.05 28.55 40.54 25.37 17.03
2-2 历年年末总户数Total Year-end Households over the Years
单位:万户 (10 000 households)

050
绍兴市统计年鉴2020
年 份Year
全 市Whole
Municipality
越城区Yuecheng
District
柯桥区KeqiaoDistrict
上虞区Shangyu District
诸暨市ZhujiCity
嵊州市Shengzhou
City
新昌县Xinchang County
1949 222.86 67.97 36.71 54.00 40.69 23.49
1957 263.33 80.09 46.75 62.46 46.72 27.31
1962 284.09 84.98 50.73 66.61 51.22 30.55
1965 310.28 91.82 55.49 74.51 55.60 32.86
1970 344.89 100.75 61.94 84.82 61.49 35.89
1975 368.64 106.50 66.65 91.62 66.12 37.75
1980 382.71 109.74 69.29 95.20 69.05 39.43
1985 394.88 25.09 88.61 71.05 97.87 70.86 41.40
1990 412.67 27.80 92.98 74.39 101.84 72.91 42.75
1991 415.31 28.10 93.80 74.94 102.31 73.23 42.91
1992 417.16 28.51 94.28 75.31 102.64 73.41 43.00
1993 419.62 29.03 95.07 75.82 103.01 73.58 43.10
1994 421.83 30.07 95.15 76.23 103.58 73.65 43.16
1995 424.70 30.63 96.01 76.70 104.38 73.75 43.23
1996 426.84 31.17 96.64 76.98 104.88 73.86 43.31
1997 428.94 31.90 97.20 77.28 105.40 73.83 43.32
1998 430.04 32.43 97.33 77.43 105.69 73.78 43.38
1999 431.70 33.52 97.29 77.51 106.13 73.81 43.44
2000 432.69 59.09 72.42 77.54 106.18 73.99 43.47
2001 433.27 59.92 72.42 77.49 106.04 73.86 43.52
2002 433.59 61.15 72.00 77.35 105.85 73.73 43.51
2003 433.84 63.86 70.16 77.41 105.49 73.54 43.38
2004 434.72 64.46 70.33 77.42 105.63 73.47 43.41
2005 435.09 64.84 70.47 77.37 105.59 73.38 43.44
2006 435.50 64.89 70.77 77.28 105.72 73.39 43.46
2007 436.24 64.99 71.05 77.28 106.00 73.37 43.55
2008 437.06 64.90 71.46 77.31 106.42 73.42 43.56
2009 437.74 64.90 71.78 77.42 106.67 73.37 43.59
2010 438.91 65.04 72.20 77.64 106.96 73.43 43.65
2011 440.01 65.26 72.58 77.74 107.20 73.46 43.77
2012 440.83 65.55 72.72 77.85 107.35 73.46 43.91
2013 441.66 74.46 64.29 77.95 107.65 73.37 43.94
2014 443.04 74.81 64.98 78.00 108.04 73.31 43.90
2015 443.11 75.09 65.36 77.98 107.94 73.05 43.69
2016 444.53 75.60 66.12 78.03 108.21 72.99 43.58
2017 446.48 75.98 67.37 78.12 108.55 72.87 43.59
2018 447.21 76.39 68.13 78.04 108.54 72.63 43.48
2019 447.87 76.91 68.80 77.94 108.43 72.41 43.37
2-3 历年年末户籍人口Total Year-end Population over the Years
单位:万人 (10 000 persons)

051
人口和劳动力
年 份Year
全 市 Whole Municipality 越城区 Yuecheng District乡村人口 城镇人口 乡村人口 城镇人口
Rural Population Urban Population Rural Population Urban Population1978 346.82 31.611980 346.69 36.021981 345.61 39.921982 347.12 42.391983 348.35 43.35 9.56 14.391984 348.77 44.28 9.54 14.871985 344.66 50.22 9.37 15.721986 346.61 51.63 9.45 16.351987 350.34 52.27 9.55 16.911988 353.46 53.08 9.61 17.411989 356.38 53.93 9.72 17.791990 359.06 53.61 9.82 17.981991 361.65 53.65 9.97 18.141992 361.69 55.47 9.95 18.561993 359.71 59.91 9.84 19.181994 359.24 62.58 9.54 20.531995 359.65 65.05 9.46 21.171996 359.24 67.60 9.20 21.971997 358.83 70.11 9.08 22.821998 357.39 72.65 9.03 23.401999 354.39 77.31 8.81 24.722000 352.02 80.68 30.17 28.922001 347.53 85.73 28.82 31.102002 342.68 90.91 26.43 34.722003 330.84 103.01 21.22 42.642004 313.58 121.14 19.03 45.432005 308.38 126.71 18.94 45.902006 303.26 132.24 18.56 46.342007 299.92 136.32 18.17 46.812008 297.09 139.97 17.90 47.002009 294.27 143.46 17.52 47.382010 290.38 148.53 16.86 48.172011 287.94 152.07 16.39 48.872012 284.24 156.59 15.93 49.622013 281.49 160.17 22.79 51.682014 279.03 164.00 22.32 52.492015 233.88 209.23 25.74 49.352016 273.37 171.17 36.15 39.452017 257.68 188.80 32.82 43.152018 247.41 199.80 30.11 46.282019 235.49 212.37 27.42 49.49
2-4 历年年末乡村、城镇人口Total Year-End Rural and Urban Population over the Years
单位:万人 (10 000 persons)
注:2015 年前乡村人口为农业人口、城镇人口为非农业人口。Note: Before 2015, Rural population was named as the agricultural population, urban population was named as the non-
agriculture.

052
绍兴市统计年鉴2020
指 标 Item全 市Whole
Municipality
一、年末总户数 ( 户 ) Total Households (Year-end) (household) 1617669
二、年末户籍人口 Total Population (Year-end) 4478657
1. 按性别分 By Sex
男性 Male 2228701
女性 Female 2249956
2. 按城乡分 By Urban and Rural
乡村人口 Rural Population 2354934
城镇人口 Urban Population 2123723
三、年平均人口 Average Population 4475379
指 标 Item全 市Whole
Municipality
迁入 Population Transferred into 20778
迁出 Population Transferred out 20644
出生 Birth Population 36049
死亡 Death Population 29390
自然增长数 Natural Growth Population 6659
出生率 (‰ ) Birth Rate (‰ ) 8.05
死亡率 (‰ ) Death Rate (‰ ) 6.57
自然增长率 (‰ ) Natural Growth Rate (‰ ) 1.49
2-5 人口基本情况(2019年末)
2-6 年末人口变动情况(2019年)
单位:人
单位:人

053
人口和劳动力
Basic Statistics on Year-end Population (End of 2019)
Population Changes (2019)
(person)
(person)
越城区Yuecheng
District
柯桥区KeqiaoDistrict
上虞区ShangyuDistrict
诸暨市ZhujiCity
嵊州市Shengzhou
City
新昌县XinchangCounty
272236 230518 285543 405426 253678 170268
769054 688003 779448 1084321 724124 433707
375476 336171 383666 541320 370187 221881
393578 351832 395782 543001 353937 211826
274178 297258 406380 656353 448735 272030
494876 390745 373068 427968 275389 161677
766495 684651 779919 1084844 725214 434257
越城区Yuecheng
District
柯桥区KeqiaoDistrict
上虞区ShangyuDistrict
诸暨市ZhujiCity
嵊州市Shengzhou
City
新昌县XinchangCounty
5297 6880 2804 2855 1744 1198
3454 2377 3516 4774 4032 2491
6734 6690 5762 8589 4983 3291
4170 4056 5641 7617 4864 3042
2564 2634 121 972 119 249
8.79 9.77 7.39 7.92 6.87 7.58
5.44 5.92 7.23 7.02 6.71 7.01
3.35 3.85 0.16 0.90 0.16 0.57

054
绍兴市统计年鉴2020
指 标 Item 总 计Total
1. 企业Enter-prises
2. 事业Institu-tions
3. 机关Agencies
andOrganiza-
tions
4. 自由职业Free
profession
5. 其他Other
国有企业State-Owned
enterprises
年末离退休退职人数 ( 人 )
Retired and Resigned persons at the Year-end (person)
839011 296081 85019 40783 13312 488158 677
#离休人员 Retired Veteran Carders 257 198 40 59 - - -
退休人员 Retired 837776 295169 84781 40631 13306 488002 668
退职人员 Resigned 978 714 198 93 6 156 9
离退休金构成( 万元 )
Pensions for Retired and Resi-gned Persons (10 000 yuan)
2693599 1001992 264808 329900 112719 1243492 5496
#离休金Pensions for Retired Veterans
3339 2683 698 656 - - -
退休金 Pensions for Retired Persons 2687052 997116 263447 328742 112693 1243063 5438
退职生活费
Resignation Allowances for Living Expenses
3208 2193 663 502 26 429 58
2-7 离退休、退职人员人数及离退休金构成情况(2019年)Number of Retired and Resigned Persons and Composition of Insurance and Welfare Funds (2019)

055
人口和劳动力
年 份Year
从业人员数( 万人 )
Total(10000 persons)
构 成 (%) Composition in Percentage
第一产业Primary Industry
第二产业Secondary
Industry
第三产业Tertiary Industry
第一产业Primary Industry
第二产业Secondary
Industry
第三产业Tertiary Industry
1995 293.58 113.52 119.59 60.47 38.7 40.7 20.6
2000 274.45 93.55 119.19 61.71 34.1 43.4 22.5
2001 282.56 85.72 131.06 65.78 30.3 46.4 23.3
2002 284.27 81.50 135.26 67.51 28.7 47.6 23.7
2003 284.66 80.17 136.73 67.76 28.2 48.0 23.8
2004 285.23 75.27 140.02 69.94 26.4 49.1 24.5
2005 284.83 64.52 147.65 72.66 22.7 51.8 25.5
2006 293.72 56.02 156.72 80.98 19.1 53.4 27.6
2007 300.88 52.71 161.56 86.61 17.5 53.7 28.8
2008 315.37 52.70 170.12 92.55 16.7 53.9 29.3
2009 328.99 52.21 171.92 104.86 15.9 52.3 31.9
2010 341.81 51.46 180.55 109.80 15.1 52.8 32.1
2011 343.28 51.52 180.77 110.99 15.0 52.7 32.3
2012 343.90 51.38 180.08 112.44 14.9 52.4 32.7
2013 344.39 51.28 179.11 114.00 14.9 52.0 33.1
2014 345.67 46.25 179.11 120.31 13.4 51.8 34.8
2015 346.80 45.78 178.01 123.01 13.2 51.3 35.5
2016 348.07 45.70 178.33 124.04 13.1 51.2 35.6
2017 348.00 45.02 177.52 125.46 12.9 51.0 36.1
2018 346.60 45.05 174.51 127.04 13.0 50.3 36.7
2019 348.00 45.09 173.01 129.90 12.96 49.72 37.33
2-8 按三次产业划分的就业人员人数及构成Number and Composition of Employed Persons by Type of Industry

056
绍兴市统计年鉴2020
指 标 Item 总 计 Total
一、年末常住人口数 Total Population (Year-end) 505.70
年未 16 岁以上全部人口数 Total Population Over 16 Year-old (Year-end) 426.56
# 不计入劳动力资源的人数 Population not Added to the Total Labors 33.23
二、年末劳动力资源总数 Total Labors (Year-end) 393.33
三、经济活动人口 Economically Active Population 351.67
1. 就业人员 Total Number of Employed Persons 348.00
按就业身份分组 Grouped by Employed Status 348.00
非私营单位从业人员 Employed in Non Private-Owned Units 157.23
私营单位从业人员 Employed in Private Units 128.43
个体户主 Self-employed Individuals 29.74
个体从业人员 Employed in Individual Units 28.13
其它 Others 4.47
2-9 城乡劳动力资源配置情况(2019年末)
单位:万人

057
人口和劳动力
指 标 Item 总 计 Total
按国民经济行业分组 Grouped by Sector
农、林、牧、渔业 Farming, Forestry, Animal Husbandry and Fishery 45.09
采矿业 Mining 0.20
制造业 Manufacturing 120.00
电力、燃气及水的生产和供应业 Production and Supply of Electric Gas and Water Power 1.37
建筑业 Construction 51.44
批发和零售业 Wholesale and Retail Trade 49.55
交通运输、仓储和邮政业 Traffic, Storage and Mail Business 13.28
住宿和餐饮业 Accommodation and Food 12.38
信息传输、计算机服务和软件业 Information Transfer, Computer Service and Software 1.63
金融业 Finance 3.90
房地产业 Realty Business 4.63
租赁和商务服务业 Leasehold and Business Service 9.67
科学研究、技术服务和地质勘查业 Scientific Research, Technical Service and Geologic Examination 3.33
水利、环境和公共设施管理业 Water Conservancy, Environment and Public Institution Management 1.43
居民服务和其他服务业 Neighborhood Services and Other Service 7.83
教育 Education 8.29
卫生、社会保障和社会福利业 Sanitation, Social Security and Social Welfare 4.19
文化、体育和娱乐业 Cultural, Physical and Entertainment 2.51
公共管理和社会组织 Public Administration and Social Organization 7.28
国际组织 International Organizations -
2. 城镇登记失业人员 Registered Unemployment Rate in Urban Areas 3.67
Disposition of Urban and Rural Labor Resources (End of 2019)
(10 000 persons)

058
绍兴市统计年鉴2020
年 份Year
全 市Whole
Municipality
越城区Yuecheng
District
柯桥区KeqiaoDistrict
上虞区Shangyu District
诸暨市ZhujiCity
嵊州市Shengzhou
City
新昌县Xinchang County
1986 372961 109269 68459 54305 65167 43868 31893
1987 392425 111044 70907 58771 69692 47013 34998
1988 407332 112597 73374 62249 69477 51705 37930
1989 408165 112444 70880 62302 74191 51087 37261
1990 417908 115467 74022 64992 72119 53471 37837
1991 419037 119917 57418 65369 79290 55892 41151
1992 417159 124076 51798 54010 88459 54022 44794
1993 449976 131250 59318 65893 91253 55749 46513
1994 430986 129683 56364 53996 94009 52436 44498
1995 436066 127469 56317 59059 95985 52104 45132
1996 464730 122462 56476 70046 114221 55860 45665
1997 461576 129438 56912 65546 109747 54691 45242
1998 423101 119013 52798 57685 102470 48876 42259
1999 401950 111275 48566 52889 103472 47376 38372
2000 373487 97266 36368 50185 107839 45204 36625
2001 352735 89651 31685 47236 106134 41264 36765
2002 365355 88596 30725 50384 113255 45938 36457
2003 389119 104133 33540 46086 121800 46661 36899
2004 472938 107244 35070 45228 189527 44500 51369
2005 580907 184683 39590 83224 171936 60001 41473
2006 608457 194128 37004 84796 194428 55956 42145
2007 680758 205469 80459 92177 196900 58719 47034
2008 783351 183182 173630 112619 208551 56868 48501
2009 917517 277851 174118 120767 244509 53840 46432
2010 1029896 256521 186853 173591 294113 70834 47984
2011 1135691 282052 279797 141901 314460 65109 52372
2012 1176791 297437 320595 141268 308003 53342 56146
2013 1212438 302824 325706 130721 329740 61283 62164
2014 1248459 305147 332937 135189 353923 56239 65024
2015 1234727 290591 336143 140054 357019 54290 56630
2016 1332541 293030 337959 227275 362182 52250 59845
2017 1169305 269578 318764 202994 260756 47064 70149
2018 1118083 283514 280497 200611 238203 45602 69656
2019 997199 289449 251317 177055 175816 45038 58524
2-10 历年非私营单位在岗职工年末人数Number of Staff and Workers in Non private-owned units over the Years
单位:人 (person)
注:从 2008 年起劳动工资制度中职工指标取消,采用在岗职工口径,从 2016 年起在岗职工包含劳务派遣人员。下同。

059
人口和劳动力
年 份Year
全 市Whole
Municipality
越城区Yuecheng
District
柯桥区KeqiaoDistrict
上虞区Shangyu District
诸暨市ZhujiCity
嵊州市Shengzhou
City
新昌县Xinchang County
1986 176303 62261 18755 24301 28676 23838 18472
1987 187383 64643 19842 26416 31016 25941 19525
1988 198864 66069 20788 27973 33128 28329 22577
1989 204508 67920 20860 29749 33898 28242 23839
1990 208736 69907 21482 29728 34525 29379 23715
1991 216855 71436 22285 30755 36278 30113 25988
1992 227989 73973 23439 32800 37235 31439 29103
1993 233485 78450 25787 32589 37932 31026 27701
1994 232558 76799 25584 33738 38142 30326 27969
1995 233553 73971 27497 34486 39506 31065 27028
1996 236771 75375 27484 35411 39441 31757 27303
1997 237289 77397 28984 31904 40951 31105 26948
1998 215990 67143 26546 28154 39204 30114 24829
1999 191804 61132 25300 25958 36657 24752 18005
2000 168304 47214 20319 24296 35259 27203 14013
2001 144826 39912 18167 23411 31362 18912 13062
2002 138538 33671 17619 22233 31136 20902 12977
2003 134097 31451 18805 19707 31180 19909 13045
2004 131291 31311 18182 19804 30478 18724 12792
2005 122470 29417 18767 20470 25341 15595 12880
2006 128313 30898 20029 20356 27600 16533 12897
2007 131341 32792 19245 21393 27479 17250 13182
2008 126179 30370 19599 20533 27245 15726 12706
2009 127997 32748 18475 19872 27415 16348 13139
2010 127572 30024 19072 20326 28384 16469 13297
2011 129748 28868 19872 22356 29423 17089 12140
2012 132592 32644 19754 20784 30530 16886 11994
2013 125524 26658 19586 19317 31840 15948 12175
2014 131944 30108 20524 21559 31881 15431 12441
2015 138577 35137 20593 22582 31936 15878 12451
2016 149502 40384 20991 24881 32071 17396 13779
2017 151628 42634 21785 23555 32266 17384 14004
2018 151311 41951 22746 22765 32338 17258 14253
2019 149855 40974 22231 26107 29202 17640 13701
2-11 历年非私营国有经济单位在岗职工年末人数Number of Staff and Workers in State-Owned Units of Non Private Economy over the Years
单位:人 (person)
Note: Worker caliber has applied instead of worker indicator among Labor Wage System since 2008 (labor dispatch workers included since 2016).

060
绍兴市统计年鉴2020
年 份Year
全 市Whole
Municipality
越城区Yuecheng
District
柯桥区KeqiaoDistrict
上虞区Shangyu District
诸暨市ZhujiCity
嵊州市Shengzhou
City
新昌县Xinchang County
1986 196658 47008 49704 30004 36491 20030 13421
1987 204580 46401 51065 32355 38214 21072 15473
1988 207302 46528 52079 34276 35878 23188 15353
1989 202091 44524 49154 32553 39818 22620 13422
1990 207361 44814 52540 35264 37192 23824 13727
1991 198924 47269 34739 34614 42413 24994 14895
1992 186252 49318 27947 21210 50222 22197 15358
1993 201086 47491 32425 32260 51070 21857 15983
1994 176605 47104 28449 18909 53687 15570 12886
1995 169292 38663 25514 22788 54214 13898 14215
1996 196685 33159 24690 32377 71439 21283 13737
1997 189974 36576 23894 28878 66589 20827 13210
1998 143205 27135 19925 13342 57675 16085 9043
1999 110626 23015 16069 8225 43451 14313 5553
2000 69557 13740 8441 6908 23887 13197 3384
2001 51619 4933 5287 4982 22231 11582 2604
2002 44897 4886 2832 4357 18791 11676 2355
2003 50679 12471 2465 4245 18635 10640 2223
2004 53607 6814 2347 3891 26965 9270 4320
2005 39794 7304 2643 7262 9531 9712 3342
2006 37757 7222 2769 5534 13188 7196 1848
2007 20584 3520 3733 5305 3479 2859 1688
2008 19211 3258 4132 4378 3708 1961 1774
2009 22973 7574 4211 4803 2796 1941 1648
2010 22172 9143 4329 3789 2925 1136 850
2011 19583 6034 3698 2324 2909 1192 3426
2012 16189 3294 2847 2132 2837 1958 3121
2013 17626 5519 2825 2331 1536 1776 3639
2014 15120 5532 1944 1557 1301 1537 3249
2015 8502 1446 905 711 1040 1427 2973
2016 8839 1504 856 1087 995 1236 3161
2017 5857 1811 695 346 916 572 1517
2018 3865 1408 228 138 632 303 1156
2019 3588 1095 564 775 345 347 462
2-12 历年非私营集体经济类型单位在岗职工年末人数Number of Staff and Workers in Collective-Owned Units of Non Private Economy over the Years
单位:人 (person)

061
人口和劳动力
年 份Year
全 市Whole
Municipality
越城区Yuecheng
District
柯桥区KeqiaoDistrict
上虞区Shangyu District
诸暨市ZhujiCity
嵊州市Shengzhou
City
新昌县Xinchang County
1986 - - - - - - -
1987 462 - - - 462 - -
1988 1166 - 507 - 471 188 -
1989 1566 - 866 - 475 225 -
1990 1811 746 - - 402 268 395
1991 3258 1212 394 - 599 785 268
1992 2918 785 412 - 1002 386 333
1993 15405 5309 1106 1044 2251 2866 2829
1994 21823 5780 2331 1349 2180 6540 3643
1995 33221 14835 3306 1785 2265 7141 3889
1996 31274 13928 4302 2258 3341 2820 4625
1997 34313 15465 4034 4764 2207 2759 5084
1998 63906 24735 6327 16189 5591 2677 8387
1999 99520 27128 7197 18706 23364 8311 14814
2000 135626 36312 7608 18981 48693 4804 19228
2001 156290 44806 8231 18843 52541 10770 21099
2002 181920 50039 10274 23794 63328 13360 21125
2003 204343 60211 12270 22134 71985 16112 21631
2004 288040 69119 14541 21533 132084 16506 34257
2005 418643 147962 18180 55492 137064 34694 25251
2006 442387 156008 14206 58906 153640 32227 27400
2007 528833 169157 57481 65479 165942 38610 32164
2008 637961 149554 149899 87708 177598 39181 34021
2009 766547 237529 151432 96092 214298 35551 31645
2010 880152 217354 163452 149476 262804 53229 33837
2011 986360 247150 256227 117221 282128 46828 36806
2012 1028010 261499 297994 118352 274636 34498 41031
2013 1069288 270647 303295 109073 296364 43559 46350
2014 1101395 269507 310469 112073 320741 39271 49334
2015 1087648 254008 314645 116761 324043 36985 41206
2016 1174200 251142 316112 201307 329116 33618 42905
2017 1011820 225133 296284 179093 227574 29108 54628
2018 962907 240155 257523 177708 205233 28041 54247
2019 843756 247380 228522 150173 146269 27051 44361
2-13 历年非私营其他各种经济类型单位在岗职工年末人数Number of Staff and Workers in Other Ownership Units of Non Private Economy over the Years
单位:人 (person)

062
绍兴市统计年鉴2020
年 份Year
全 市Whole
Municipality
越城区Yuecheng
District
柯桥区KeqiaoDistrict
上虞区Shangyu District
诸暨市ZhujiCity
嵊州市Shengzhou
City
新昌县Xinchang County
1986 48233 15212 8434 6760 8352 5424 4051
1987 56114 17315 9760 7989 9725 6504 4821
1988 72889 22077 12938 10640 11723 8897 6614
1989 79592 24020 14079 11557 13102 9369 7465
1990 88146 26985 15107 12797 14238 10652 8367
1991 98962 30605 14247 14859 17035 12261 9955
1992 116695 38401 15654 14647 21870 13704 12419
1993 178892 55871 24739 27569 34678 19641 16394
1994 249571 82236 32654 29433 56395 27252 21601
1995 289166 95669 41968 35187 58576 31166 26600
1996 336428 102280 44222 49586 74745 35387 30208
1997 381906 117825 51227 50057 92525 38067 32205
1998 376639 114284 53274 48768 89055 37094 34164
1999 399292 118498 55025 51269 96981 41004 36515
2000 431195 123733 50025 58005 115472 44667 39293
2001 510509 146762 57768 69083 138252 52375 46269
2002 594021 157719 68299 75840 170610 67937 53617
2003 742774 198989 90329 92484 210807 81440 68725
2004 1001572 237121 104864 117762 350840 92254 98731
2005 1410955 426522 125444 233775 377760 146023 101431
2006 1565740 461675 138276 226065 481703 153121 104900
2007 1981463 540265 332924 273473 530598 174862 129341
2008 2381041 515936 583484 354484 602222 178736 146179
2009 2923702 823254 632601 391697 742363 180698 153089
2010 3479430 824913 756572 601983 867227 253802 174933
2011 4425898 1087835 1112790 591270 1155189 263567 215247
2012 5311926 1401780 1380059 650474 1364693 246518 268402
2013 6026388 1527842 1564067 710012 1626648 290979 306840
2014 6752428 1703710 1709626 790702 1902915 304906 340569
2015 7175981 1814403 1848650 879359 1996340 319578 317651
2016 8155142 1997078 1975507 1307439 2152204 360715 362199
2017 7836846 1978050 2022369 1234143 1751409 375082 475793
2018 8379398 2283530 1963649 1370756 1804485 413407 543571
2019 8009775 2429125 1925320 1324433 1386442 434973 509482
2-14 历年非私营单位在岗职工工资总额Total Wages of Staff and Workers in Non Private-Owned Units over the Years
单位:万元 (10 000 yuan)

063
人口和劳动力
年 份Year
全 市Whole
Municipality
越城区Yuecheng
District
柯桥区KeqiaoDistrict
上虞区Shangyu District
诸暨市ZhujiCity
嵊州市Shengzhou
City
新昌县Xinchang County
1986 24510 9216 2527 3245 3889 3124 2509
1987 28526 10528 2910 3773 4619 3741 2955
1988 38783 13874 4204 5139 6137 5164 4265
1989 43540 15588 4523 6049 6727 5563 5090
1990 48649 17703 5039 6702 7309 6186 5710
1991 55986 19834 5931 7638 8701 7139 6743
1992 70417 25584 7328 9693 10576 8666 8569
1993 98317 36991 10544 13298 15290 11778 10416
1994 146980 55611 16526 20345 21496 18036 14966
1995 170581 62659 21367 23538 24973 20808 17236
1996 187186 68282 23826 26035 27469 22763 18811
1997 212577 79284 27888 25762 35075 24104 20464
1998 214279 72724 29873 26279 37776 25526 22101
1999 219924 73353 31606 28623 42246 24686 19410
2000 231018 71268 30949 32110 47362 30540 18789
2001 276651 83595 38869 42143 57224 32504 22316
2002 308197 80786 47370 45075 66969 41250 26749
2003 394007 96374 65177 55097 88300 52633 36426
2004 471296 116341 72927 68270 106710 61973 45075
2005 542833 132528 83308 91732 113409 68173 53683
2006 593708 142616 95619 95637 128728 80371 50737
2007 703012 174942 114089 117203 146578 89002 61198
2008 716787 171941 118073 119573 161410 83843 61947
2009 816355 201273 132373 128330 192397 92166 69816
2010 898101 207116 153502 147959 208949 106039 74536
2011 1000474 227811 175325 164597 234522 118430 79789
2012 1115860 296311 183367 168157 258293 126532 83200
2013 1132659 262038 189478 187644 280810 124769 87920
2014 1266969 312489 215429 208075 298779 131943 100254
2015 1479471 411991 242400 239912 325991 145820 113357
2016 1753788 490566 281830 281697 369718 184349 145628
2017 1964431 551016 323397 304461 415040 204273 166244
2018 2252455 621505 381393 353171 468894 228053 199440
2019 2259632 589180 385968 400008 441070 247344 196062
2-15 历年非私营国有经济单位在岗职工工资总额Total Wages of Staff and Workers in State-Owned Units of Non Private Economy over the Years
单位:万元 (10 000 yuan)

064
绍兴市统计年鉴2020
年 份Year
全 市Whole
Municipality
越城区Yuecheng
District
柯桥区KeqiaoDistrict
上虞区Shangyu District
诸暨市ZhujiCity
嵊州市Shengzhou
City
新昌县Xinchang County
1986 23723 5996 5907 3515 4463 2300 1542
1987 27512 6787 6850 4216 5030 2763 1866
1988 33955 8202 8700 5502 5493 3708 2350
1989 35735 8432 9440 5508 6220 3760 2375
1990 39076 9130 10069 6095 6797 4421 2564
1991 42193 10483 8225 7221 8166 4975 3123
1992 45454 12612 8210 4954 10983 4953 3742
1993 73967 16082 13734 13926 18477 6827 4921
1994 91002 22848 14843 8476 33685 5980 5170
1995 96865 22372 18356 10524 32196 6490 6927
1996 126406 22852 17317 22092 45307 10869 7969
1997 141466 24756 20140 20633 55711 12260 7966
1998 107565 17582 18377 8716 47119 9865 5906
1999 92737 17457 17238 6135 37765 9975 4167
2000 66114 11892 11525 6083 23429 10539 2646
2001 60960 5825 10036 5302 26982 10408 2407
2002 63677 6299 7974 5190 28944 12355 2916
2003 76418 14699 8868 5880 32352 11628 2991
2004 89412 9293 8732 6682 46146 11830 6729
2005 78577 10936 11054 13468 23877 13302 5940
2006 86080 10339 13759 10825 35257 12409 3491
2007 56048 9210 17123 12749 6881 6032 4053
2008 60035 10521 20006 12063 8625 4992 3828
2009 79113 25178 21983 14494 6489 5910 5059
2010 98951 46272 24171 14432 7969 3208 2899
2011 101850 48419 16920 13708 9802 3500 9501
2012 82435 22573 16019 12855 10076 6914 13998
2013 110926 48452 17054 16529 7254 6799 14838
2014 105319 55590 14228 9617 5641 6484 13759
2015 41266 8780 4576 4118 4533 6766 12493
2016 45898 9943 4453 7517 5184 5814 12987
2017 32840 10814 3914 2921 5793 4665 4733
2018 23797 10310 1305 1268 3866 1731 5316
2019 30047 7967 5622 9773 2239 1907 2540
2-16 历年非私营集体经济单位在岗职工工资总额Total Wages of Staff and Workers in Collective-Owned Units of Non Private Economy over the Years
单位:万元 (10 000 yuan)

065
人口和劳动力
年 份Year
全 市Whole
Municipality
越城区Yuecheng
District
柯桥区KeqiaoDistrict
上虞区Shangyu District
诸暨市ZhujiCity
嵊州市Shengzhou
City
新昌县Xinchang County
1986 - - - - - - -
1987 76 - - - 76 -
1988 151 - - - 92 25 -
1989 317 - 115 - 156 46 -
1990 421 151 - - 132 45 93
1991 782 288 91 - 167 147 89
1992 824 205 117 - 309 85 108
1993 6608 2797 462 345 911 1036 1057
1994 11589 3778 1285 612 1214 3235 1465
1995 21720 10638 2245 1125 1407 3868 2437
1996 22836 11146 3080 1458 1969 1755 3428
1997 27863 13785 3199 3662 1739 1703 3775
1998 54795 23978 5024 13773 4160 1703 6157
1999 86634 27688 6182 16511 16970 6344 12939
2000 134063 40573 7551 19812 44681 3588 17858
2001 172900 57343 8863 21639 54047 9462 21546
2002 222147 70635 12956 25576 74697 14332 23952
2003 272349 87916 16284 31507 90155 17179 29308
2004 440864 111487 23205 42810 197984 18451 46927
2005 789546 283055 31083 128576 240475 64549 41808
2006 885952 308719 28897 119603 317718 60342 50673
2007 1222403 356113 201712 143522 377139 79828 64089
2008 1604219 333475 445406 222848 432186 89901 80403
2009 2028234 596803 478245 248873 543477 82622 78214
2010 2482378 571525 578899 439592 650309 144555 97498
2011 3323575 811605 920546 412965 910865 141637 125957
2012 4113631 1082896 1180673 469462 1096324 113072 171204
2013 4782804 1217352 1357536 505840 1338583 159412 204081
2014 5380140 1335632 1479970 573009 1598495 166479 226555
2015 5655244 1393632 1601673 635329 1665816 166992 191802
2016 6355456 1496569 1689223 1018226 1777302 170552 203584
2017 5839576 1416220 1695059 926762 1330576 166144 304815
2018 6103146 1651716 1580951 1016317 1331726 183623 338815
2019 5720096 1831978 1533730 914652 943134 185722 310880
2-17 历年非私营其他各种经济类型单位在岗职工工资总额Total Wages of Staff and Workers in Other Ownership Units of Non Private Economy over the Years
单位:万元 (10 000 yuan)

066
绍兴市统计年鉴2020
年 份Year
全 市Whole
Municipality
越城区Yuecheng
District
柯桥区KeqiaoDistrict
上虞区Shangyu District
诸暨市ZhujiCity
嵊州市Shengzhou
City
新昌县Xinchang County
1986 1221 1291 1160 1187 1236 1172 1205
1987 1371 1480 1299 1318 1380 1296 1338
1988 1828 1990 1765 1739 1763 1767 1815
1989 1976 2150 1970 1868 1846 1863 2051
1990 2161 2378 2093 1992 2106 2023 2216
1991 2417 2581 2521 2289 2258 2268 2489
1992 2875 3142 3078 2759 2608 2586 2900
1993 4089 4436 4236 4210 3961 3593 3605
1994 5898 6309 5910 5485 6385 5263 4937
1995 6716 7511 7422 6116 6317 5976 6014
1996 7402 8445 7900 7134 6955 6447 6634
1997 8385 9232 8978 7554 8783 6962 7136
1998 8892 9643 9849 8125 8979 7627 7922
1999 9830 10442 11205 9575 9589 8464 9024
2000 11428 12206 13408 11051 11054 9853 10802
2001 14357 14832 18020 14358 12994 12414 12702
2002 16503 17655 22432 16297 15374 14602 14839
2003 19342 19070 27373 19811 18099 17346 18790
2004 21281 21179 30717 26517 18760 20854 20195
2005 24440 23232 32297 26873 22514 24681 24779
2006 26745 24680 38538 28196 25851 28069 25334
2007 29807 26982 41383 30867 27717 30351 27856
2008 30636 28565 33562 31539 29356 31529 30132
2009 32502 31125 35600 33439 30926 33441 33185
2010 35125 33110 40010 35250 32856 36509 36356
2011 39810 39764 40935 41901 37427 40761 41452
2012 45614 47078 43890 48616 44185 45830 48010
2013 50380 51561 49051 54674 49128 48001 51648
2014 54762 56651 52306 58470 54196 53466 54865
2015 58728 63052 55586 63186 56699 58692 56867
2016 61394 68026 58924 57854 59180 69469 62557
2017 67489 75590 63940 61442 65661 80023 69185
2018 75375 82813 70316 69629 75573 90829 78735
2019 80842 85934 76385 76297 77545 96033 87264
2-18 历年非私营单位在岗职工年平均工资Average Annual Wage of Staff and Workers in Non Private-Owned Units over the Years
单位:元 (yuan)

067
人口和劳动力
年 份Year
全 市Whole
Municipality
越城区Yuecheng
District
柯桥区KeqiaoDistrict
上虞区Shangyu District
诸暨市ZhujiCity
嵊州市Shengzhou
City
新昌县Xinchang County
1986 1292 1378 1243 1232 1254 1220 1286
1987 1451 1570 1367 1353 1426 1345 1460
1988 1994 2158 2040 1849 1885 1859 1990
1989 2167 2339 2175 2052 2024 1998 2222
1990 2361 2596 2366 2228 2153 2153 2397
1991 2625 2840 2695 2486 2442 2407 2654
1992 3157 3517 3216 2985 2887 2799 3126
1993 4346 5005 4175 4120 4147 3862 3798
1994 6351 7148 6643 6134 5707 5978 5391
1995 7380 8490 7862 6898 6499 6780 6402
1996 8023 9140 8832 7385 7299 7195 6942
1997 9010 10261 9872 8031 8714 7710 7583
1998 9859 10710 10976 9303 9780 8531 8688
1999 11317 11699 12482 11114 11533 9881 10245
2000 13488 14419 14772 13019 13609 11111 13458
2001 19192 21125 21596 18064 18255 17166 17211
2002 22361 24045 27163 20409 21623 21623 20792
2003 29636 30794 35068 28352 28700 26339 28274
2004 35866 37161 40835 34581 34222 33346 35414
2005 44554 45275 44564 44936 45125 43754 42121
2006 46872 46879 48790 47198 47203 49323 39682
2007 53751 53900 59471 54911 53443 51563 46652
2008 57399 57055 61789 58626 59968 53536 48928
2009 64221 61953 71844 65278 70880 56599 53230
2010 71207 69448 81395 74079 74673 64872 56712
2011 78364 79953 89033 76262 80822 69862 66847
2012 85297 91760 94636 82345 86075 75084 70081
2013 91343 99984 98697 98330 89013 78738 72548
2014 97026 104637 106243 97427 94368 86412 82493
2015 107647 119183 118406 108225 101450 92525 91891
2016 117993 121545 135920 114274 115141 107049 107419
2017 129931 129499 149950 129641 128162 117743 119989
2018 150769 149300 171459 156714 147572 133811 140718
2019 152415 144520 175448 155102 153635 141948 144546
2-19 历年非私营国有经济单位在岗职工年平均工资Average Annual Wage of Staff and Workers in State-Owned Units of Non Private Economy over the Years
单位:元 (yuan)

068
绍兴市统计年鉴2020
年 份Year
全 市Whole
Municipality
越城区Yuecheng
District
柯桥区KeqiaoDistrict
上虞区Shangyu District
诸暨市ZhujiCity
嵊州市Shengzhou
City
新昌县Xinchang County
1986 1157 1178 1128 1148 1221 1113 1093
1987 1296 1357 1272 1288 1337 1235 1183
1988 1670 1758 1663 1647 1641 1653 1565
1989 1783 1870 1887 1700 1670 1691 1761
1990 1951 2043 1979 1785 2044 1865 1891
1991 2182 2195 2408 2112 2077 2105 2180
1992 2521 2579 2966 2403 2373 2282 2475
1993 3757 3419 4270 4329 3803 3157 3215
1994 5338 4870 5278 4412 6947 3913 4148
1995 5826 5757 7026 4871 6193 4550 5160
1996 6609 6931 6949 6836 6779 5340 5753
1997 7632 7053 8122 7068 8866 5908 6006
1998 7691 6937 8887 6518 8565 6155 6265
1999 8344 7513 10227 7348 9049 6791 6635
2000 9320 8136 13179 8264 10093 7869 7324
2001 11433 11271 16958 10262 12176 8454 9274
2002 13919 12799 26821 11851 15280 15280 12166
2003 14839 11795 36153 11465 17567 10698 13802
2004 16900 14087 38382 16254 17455 12833 15766
2005 20419 15002 43881 20359 25762 13793 18881
2006 23626 14247 52099 19546 29247 17306 19678
2007 27808 26626 48866 24145 19774 21722 24491
2008 31468 32284 48452 29010 23656 23336 21914
2009 35172 34785 52279 32556 23342 25954 32831
2010 45334 51187 56979 39006 27500 29376 33899
2011 52457 82010 45766 57962 34071 29460 28069
2012 51005 69220 56885 60324 35618 35044 44410
2013 64680 88336 62744 70999 46503 36791 46209
2014 70613 101237 73683 61887 45530 41324 43945
2015 48881 60097 51771 57833 49375 44424 42434
2016 52952 65073 51543 69535 54857 44417 44159
2017 57775 62111 56884 80688 60284 83300 34499
2018 63407 72349 56996 90593 68790 56951 48638
2019 84378 71197 101475 126261 69099 55909 56579
2-20 历年非私营集体经济单位在岗职工年平均工资Average Annual Wage of Staff and Workers in Collective-Owned Units of Non Private Economy over the Years
单位:元 (yuan)

069
人口和劳动力
年 份Year
全 市Whole
Municipality
越城区Yuecheng
District
柯桥区KeqiaoDistrict
上虞区Shangyu District
诸暨市ZhujiCity
嵊州市Shengzhou
City
新昌县Xinchang County
1986 - - - - - - -
1987 1812 - - - 1812 - -
1988 1495 - 885 - 1970 1558 -
1989 2364 - 1765 - 3281 2158 -
1990 2645 2537 - - 3349 2029 2449
1991 2750 2884 2680 - 3485 1938 3319
1992 3245 3489 2986 - 3308 2580 3641
1993 4592 5595 4728 3346 4347 4076 3849
1994 5467 6698 5708 4778 5577 5114 4158
1995 6553 7231 6929 6237 6102 5371 6275
1996 7630 8296 7539 7534 6579 6053 7480
1997 8147 9034 7972 7326 7707 6388 7535
1998 8258 9492 8111 7483 7506 6334 7452
1999 8603 10049 8920 8493 7452 7232 8492
2000 9923 10869 9932 9681 9620 8059 9498
2001 10934 12558 10886 11029 10218 8648 10326
2002 12595 13900 12911 12743 12234 12234 11477
2003 13646 14511 13615 14243 13398 10671 13616
2004 15397 15054 16569 20825 15301 11227 14714
2005 18934 19251 17633 21442 18028 19020 16694
2006 20978 20665 21184 21996 21611 19430 18875
2007 23791 21672 34921 23159 23494 21244 20243
2008 25333 22651 29573 25369 24756 23117 23576
2009 27045 26552 30841 26753 25865 23291 24849
2010 29459 27179 34875 29884 27902 27756 28577
2011 34453 33933 37051 35247 32912 30445 34409
2012 40426 41300 40400 42200 39719 32339 41879
2013 45333 46003 45716 46641 44919 37137 46298
2014 49470 50328 48580 51016 50233 41423 48420
2015 52557 55362 51465 54633 52212 44930 47266
2016 54273 59462 53854 50846 53757 51071 49174
2017 58144 65147 57648 52355 57011 57364 56928
2018 63671 70983 61566 58345 62543 65188 63009
2019 68180 76083 66828 62211 62977 67467 70064
2-21 历年非私营其他各种经济类型单位在岗职工年平均工资Average Annual Wage of Staff and Workers in Other Ownership Units of Non Private Economy over the Years
单位:元 (yuan)

070
绍兴市统计年鉴2020
指 标 Item全 市Whole
Municipality
单位就业人员 Employed Persons 1029472
#女性 Female 281332
( 一 ) 在岗职工 Staff and Workers at Work 997199
# 非劳务派遣人员 Non Labor Dispatching Persons 853825
劳务派遣人员 Labor Dispatching Persons 143374
( 三 ) 其他就业人员 Other Employed Persons 32273
指 标 Item全 市Whole
Municipality
一、单位就业人员工资总额 Total Remuneration 8180404
( 一 ) 在岗职工工资总额 Wages of Staff and Workers at Work 8009775
# 非劳务派遣人员 Non Labor Dispatching Persons 7318338
劳务派遣人员Remuneration Payment to Labor Dispatching Persons
691437
( 三 ) 其他就业人员工资总额Remuneration Payment to Other Employed Persons
170630
二、单位就业人员平均工资 ( 元 ) Average Wage of Employed Persons 80020
三、在岗职工平均工资 ( 元 ) Average Wage of Staff and Workers at Work (yuan) 80842
2-22 分区、县(市)非私营单位年末就业人员数(2019年末)
2-23 非私营单位工资情况(2019年)
单位:人
单位:万元

071
人口和劳动力
Number of Employed Persons in Non Private-Owned Units by District and County (City) (End of 2019)
Remuneration Payment in Non Private-Owned Units (2019)
(person)
(10 000 yuan)
越城区Yuecheng
District
柯桥区KeqiaoDistrict
上虞区ShangyuDistrict
诸暨市ZhujiCity
嵊州市Shengzhou
City
新昌县XinchangCounty
301023 256874 186784 178697 46073 60021
79427 62414 51026 40561 22896 25008
289449 251317 177055 175816 45038 58524
232801 244441 110942 169592 43126 52923
56648 6876 66113 6224 1912 5601
11574 5557 9729 2881 1035 1497
越城区Yuecheng
District
柯桥区KeqiaoDistrict
上虞区ShangyuDistrict
诸暨市ZhujiCity
嵊州市Shengzhou
City
新昌县XinchangCounty
2489808 1954494 1372034 1406193 440170 517705
2429125 1925320 1324433 1386442 434973 509482
2138075 1894362 1031889 1357460 423216 473335
291050 30957 292544 28982 11757 36147
60683 29175 47601 19751 5197 8223
84766 75855 75011 77390 94946 86386
85934 76385 76297 77545 96033 87264

072
绍兴市统计年鉴2020
指 标 Item
年末就业人员数Number of
EmployedPersons (Year-end)
总计 Total 1029472
按企业、事业、机关分组 Grouped by Enterprises, Institutions and Agencies
1. 企业 Enterprises 871220
2. 事业 Institutions 104926
3. 机关 Agencies and Organizations 48377
4. 民间非营利组织 Folk non-profit organizations 4886
5. 其他 Others 63
按国民经济行业分组 Grouped by Sector
1. 农、林、牧、渔业 Farming, Forestry, Animal Husbandry and Fishery 288
2. 采矿业 Mining 615
3. 制造业 Manufacturing 251128
4. 电力、燃气及水的生产和供应业 Production and Supply of Electric Power, Gas and Water 9454
5. 建筑业 Construction 507196
6. 批发和零售业 Wholesale and Retail Trade 19676
7. 交通运输、仓储和邮政业 Traffic, Storage and Mail Business 15475
8. 住宿和餐饮业 Accommodation and Food 6280
9. 信息传输、计算机服务和软件业 Information Transfer, Computer Service and Software 4041
10. 金融业 Finance 24973
11. 房地产业 Realty Business 7257
12. 租赁和商务服务业 Leasehold and Business Service 10395
13. 科学研究、技术服务和地质勘查业 Scientific Research, Technical Service and Geologic Examination 6735
14. 水利、环境和公共设施管理业 Water Conservancy, Environment and Public Institution Management 8944
15. 居民服务和其他服务业 Neighborhood Services and Other Service 1462
16. 教育 Education 61811
17. 卫生、社会保障和社会福利业 Sanitation, Social Security and Social Welfare 37552
18. 文化、体育和娱乐业 Cultural, Physical and Entertainment 3477
19. 公共管理和社会组织 Public Administration and Social Organization 52713
2-24 全市非私营单位劳动工资统计情况(2019年)
单位:人

073
人口和劳动力
在岗职工工资总额( 万元 )
Total Wages of Staff and Workers (10 000 yuan)
在岗职工平均工资 ( 元 )Average Annual Wage of Staff and Workers at Work (yuan)
在岗职工人数Number of Staff and
Workers at Work
其他就业人数Number of Other
Employed Persons
997199 32273 8180404 80842
849617 21603 5904107 68537
98670 6256 1480157 147987
44187 4190 753980 167749
4662 224 41830 87492
63 - 330 52397
286 2 1923 66832
597 18 3840 62661
248561 2567 1910538 75459
9254 200 115003 122691
495619 11577 2876598 57647
19286 390 151767 77300
14969 506 132218 84677
5697 583 33147 55104
4030 11 54021 134405
21765 3208 375873 165389
6848 409 74978 106496
9944 451 76098 74858
6581 154 75067 112662
7695 1249 64603 78472
1039 423 7712 67034
56694 5117 814816 140919
36427 1125 547348 149791
3355 122 42478 124734
48552 4161 822378 166566
Total Wages of Staff and Workers of the Whole Municipality in Non Private-Owned Units (2019)
(person)

074
绍兴市统计年鉴2020
指 标 Item
年末就业人员数Number of
EmployedPersons (Year-end)
总计 Total 301023
按企业、事业、机关分组 Grouped by Enterprises, Institutions and Agencies
1. 企业 Enterprises 259920
2. 事业 Institutions 29571
3. 机关 Agencies and Organizations 10681
4. 民间非营利组织 Folk non-profit organizations 788
5. 其他 Others 63
按国民经济行业分组 Grouped by Sector
1. 农、林、牧、渔业 Farming, Forestry, Animal Husbandry and Fishery 15
2. 采矿业 Mining -
3. 制造业 Manufacturing 55207
4. 电力、燃气及水的生产和供应业 Production and Supply of Electric Power, Gas and Water 2064
5. 建筑业 Construction 146132
6. 批发和零售业 Wholesale and Retail Trade 9306
7. 交通运输、仓储和邮政业 Traffic, Storage and Mail Business 7970
8. 住宿和餐饮业 Accommodation and Food 3377
9. 信息传输、计算机服务和软件业 Information Transfer, Computer Service and Software 3137
10. 金融业 Finance 19894
11. 房地产业 Realty Business 2332
12. 租赁和商务服务业 Leasehold and Business Service 3414
13. 科学研究、技术服务和地质勘查业 Scientific Research, Technical Service and Geologic Examination 3323
14. 水利、环境和公共设施管理业 Water Conservancy, Environment and Public Institution Management 2813
15. 居民服务和其他服务业 Neighborhood Services and Other Service 799
16. 教育 Education 17262
17. 卫生、社会保障和社会福利业 Sanitation, Social Security and Social Welfare 9878
18. 文化、体育和娱乐业 Cultural, Physical and Entertainment 1027
19. 公共管理和社会组织 Public Administration and Social Organization 13073
2-25 越城区非私营单位劳动工资统计情况(2019年)
单位:人

075
人口和劳动力
在岗职工工资总额( 万元 )
Total Wages of Staff and Workers (10 000 yuan)
在岗职工平均工资 ( 元 )Average Annual Wage of Staff and Workers at Work (yuan)
在岗职工人数Number of Staff and
Workers at Work
其他就业人数Number of Other
Employed Persons
289449 11574 2429125 85934
250935 8985 1879804 76959
27196 2375 377941 139164
10550 131 165433 158007
705 83 5616 77680
63 - 330 52397
15 - 58 38533
- - - -
54463 744 432928 77952
1980 84 17986 89752
143807 2325 853156 62879
9197 109 77123 82795
7569 401 67877 84476
2990 387 16999 57391
3126 11 42258 135225
16784 3110 270482 161463
2173 159 23428 108211
3165 249 27963 88322
3259 64 35729 110309
1789 1024 17149 98558
392 407 2044 60112
15262 2000 192841 126503
9583 295 144932 151650
973 54 10827 110366
12922 151 195346 152447
Total Wages of Staff and Workers of the Yuecheng District in Non Private-Owned Units (2019)
(person)

076
绍兴市统计年鉴2020
人口数 指一定时点、一定地区范围内的有生命的个人的总和。年度统计的年末人口数是指每年 12 月
31 日 24 时的常住人口数。不包括户籍不在本市的外来人数。
出生率(又称粗出生率) 指在一定时期内 ( 通常为一年 ) 出生的人数与同期平均人数 ( 或期中人数 ) 比率,
一般用千分率表示。计算公式:
出生率 = 年出生人数 / 年平均人数 ×1000‰
出生人数是指活产婴儿,即胎儿脱离母体时 ( 不管怀孕月数 ),有过呼吸或其他生命现象。
目前出生率的计算,在市级有公安的户籍口径、计生委的常住人口统计口径;国家、省级还有年度人口抽
样调查公布口径等。本年鉴用的为公安口径出生数,包括补报往年出生数在内。
年平均人数是年初、年底人口数的平均数,也可用年中人口数代替。
死亡率(又称粗死亡率) 指在一定时期内 ( 通常为一年 ) 一定地区的死亡人数与同期平均人数 ( 或期中
人数 ) 之比,一般用千分率表示。计算公式:
死亡率 = 年死亡人数 / 年平均人数 ×1000‰
人口自然增长率 指在一定时期内 ( 通常为一年 ) 人口自然增加数 ( 出生人数减死亡人数 ) 与该时期内
平均人数 ( 或期中人数 ) 之比,一般用行千分率表示。计算公式:
人口自然增长率= ( 本年出生人数 - 本年死亡人数 )/ 年平均人数 ×1000‰=人口出生率-人口死亡率
劳动力资源 是指劳动年龄内,有劳动能力,在正常情况下,可能或实际参加社会劳动的人口。
单位从业人员 指在各级国家机关、政党机关、社会团体及企业、事业单位中工作,取得工资或其他形式
的劳动报酬的全部人员。包括:在岗职工、再就业的离退休人员、民办教师以及在各单位中工作的外方人员和
港澳台方人员、兼职人员、借用的外单位人员和第二职业者。不包括离开本单位仍保留劳动关系的职工。
在岗职工 指在本单位工作且与本单位签订劳动合同,并由单位支付工资的人员,以及有工作岗位,但由
于学习、病伤产假等原因暂未工作,仍由单位支付工资的人员。
在岗职工工资总额 指各单位在一定时期内直接支付给本单位全部在岗职工的劳动报酬。
工资总额的计算原则 是以直接支付给职工的全部劳动报酬为依据。各单位支付给本单位全部职工的劳
动报酬,不论是计入成本还是不计入成本,不论是以货币形式支付还是以实物形式支付,不论是单位自筹的资
金还是上级 ( 或政府财政部门 ) 下拨的资金,不论是厂级单位筹集的资金还是下属车间 ( 科室 ) 及附属经营
单位筹集的资金,均应列入工资总额计算的范围。
职工平均工资 指各单位的职工 ( 包括在岗职工和离开本单位仍保留劳动关系的职工 ) 在一定时期内平
均每人所得的货币工资额。它表明一定时期内职工工资收入高低程度,是反映职工工资水平的主要指标。计
算公式为:
职工平均工资 = 报告期实际支付的全部职工工资总额 / 报告期全部职工平均人数
主要统计指标解释

077
人口和劳动力
Total Population refers to the total number of people alive at a certain point of time within a given
area.
The annual statistics on total population is taken at midnight, the 3lst of December, excluding migrant
population without household register in Shaoxing city.
Birth Rate or (Crude Birth Rate) refers to the ratio of the number of births to the average population
(or mid-period population) during a certain period of time (usually a year) which is often expressed in ‰. Birth
rate in the chapter refers to annual birth rate. The following formula is used:
Birth Rate = Number of Births/Average Number of Population×1000‰
Number of births refers to live births i.e. the births when babies had showed any vital phenomena
regardless of the length of pregnancy.
The current calculation of birth rate is based on data residency by the public security data of permanent
residency by the family planning commission at city levels, and can also be based on annual population
sampling at country and provincial levels, including the late registration for births of previous year.
Annual average number of population is the average of the number of population at the beginning of the
year and that at the end of the year, and can be substituted with the mid-year population.
Death Rate (or Crude Death Rate) refers to the ratio of the number of deaths to the average
population (or mid-period population) during a certain period of time (usually a year) which is often expressed
in ‰. Death rate in the chapter refers to annual death rate. The following formula is used:
Death Rate= Number of Deaths/Annual Average Number of Population×1000‰
Natural Growth Rate of Population refers to the ratio of natural increase in population (number of
births minus number of deaths) in a certain period of time (usually a year) to the average population (or mid-
period population) of the same period which is often expressed in ‰. The following formulas are applied:
Natural Growth of Population = (Number of Births-Number of Deaths)/Average Number of
Population×1000‰
Natural Growth Rate of Population = Birth Rate-Death Rate
Labor Force Resource refers to the population who is capable or have already to participate the social
work in the whole population in another word, the population with a certain working ability above a certain
age.
Persons Employed in Various Units refer to all the persons working in government agencies of
various levels, political and party organizations, social organizations, enterprises and institutions, and receiving
wages or other forms of payment, including fully-employed staff and workers, re-employed retirees, teachers
in schools run by the local people, foreigners and Chinese compatriots from Hong Kong, Macao, and Taiwan
working in various units, part-time employees, employees of other units working temporarily at current posts,
and employees holding the second job, but exclude staff and workers who have left their working units while
Explanatory Notes on Main Statistical Indicators

078
绍兴市统计年鉴2020
keeping their labor contract (employment relation) unchanged.
Fully Employed Staff and Workers refer to persons who signed contracts, and receive wages from
their working units, as well as persons who have their work posts, but are temporarily absent from work for
reasons of study or on sick, injury or maternal leave and still receive wages from their working units.
Total Wages of Staff and Workers refer to the total remuneration payment to full-employed staff and
workers in various units during a certain period of time.
Calculation Principle of Gross Wages is based on the total remuneration for labor that directly
pays staff and workers. The total remuneration for labor offered by various work units should be included in
the scope of calculation of gross wages on matter whether calculated in the cost, no matter whether pay in the
form of currency or material object, no matter whether self-raised funds or appropriate money from the higher
authorities (or government agencies), no matter whether self-raised funds by the factory (company) or self-
raised by the affiliated workshops (departments) or affiliated management units.
Average Wages of Staff and Workers refers to the average wage in money terms per person during
a certain period of time for staff and workers in enterprises, institutions, and government agencies, which
reflects the general level of wage income during a certain period of time and is calculated as follows:
Average Wage of Staff and Workers = Total Wages of Staff and Workers in Reference Period/Average
Number of Staff and Workers in Reference Period.

农 业3 CHAPTER 3 AGRICULTURE

080
绍兴市统计年鉴2020
9.5515.90
29.03
83.27
118.31
141.40
225.80
303.25294.30 294.62 295.10
313.85
0
50
100
150
200
250
300
350
1980 1985 1990 1995 2000 2005 2010 2015 2016 2017 2018 2019
单位:亿元
(100 million yuan)
农 林 牧 渔 业 总 产 值Gross Output Value of Farming,Forestry,Animal Husbandry and Fisher
79.6%
2.2% 16.9%
1.3%
农 Farming 林 Forestry 牧 Animal Husbandry 渔 Fisher 服务业 Services
66.4%
9.7% 11.0% 11.7% 1.2%
2019年1978年
农 林 牧 渔 业 总 产 值 构 成Composition of Farmin,Forestry,Animal Husbandry and Fisher

081
农 业
年 份Year
全 市Whole
Municipality
越城区Yuecheng
District
柯桥区Keqiao District
上虞区Shangyu District
诸暨市ZhujiCity
嵊州市Shengzhou
City
新昌县Xinchang County
1949 80.99 21.34 14.15 20.15 16.27 9.08
1952 85.76 23.14 15.99 20.26 16.93 9.44
1957 98.85 26.67 19.29 22.79 19.53 10.57
1962 107.52 28.06 20.45 24.39 23.10 11.52
1965 126.60 37.16 23.69 28.73 24.46 12.56
1970 149.65 43.19 31.18 33.60 26.83 14.85
1975 170.99 47.12 35.27 40.75 30.41 17.44
1980 184.38 50.54 39.11 44.02 31.74 18.97
1985 205.15 6.00 49.24 40.83 50.85 36.71 21.52
1986 208.99 6.17 50.32 41.58 51.94 37.42 21.56
1987 212.86 6.27 49.89 42.69 53.54 38.10 22.37
1988 215.63 6.27 50.01 43.04 54.77 38.78 22.76
1989 214.89 6.33 47.67 43.12 55.58 39.15 23.04
1990 214.15 6.39 46.54 43.29 56.71 38.05 23.17
1991 221.53 6.52 47.28 41.77 59.28 40.08 26.60
1992 212.73 6.40 45.94 40.40 57.95 38.25 23.79
1993 209.69 6.31 44.01 38.59 58.89 38.10 23.79
1994 205.51 6.16 43.27 37.19 59.23 35.96 23.70
1995 201.53 6.19 42.20 35.83 58.17 35.34 23.80
1996 198.44 5.90 41.48 35.22 58.11 34.26 23.47
1997 200.24 5.67 42.89 35.66 57.94 34.68 23.40
1998 199.09 5.55 42.00 35.30 57.80 35.16 23.28
1999 197.40 5.44 41.83 34.70 57.11 35.12 23.20
2000 201.30 16.19 32.27 34.79 57.52 36.67 23.86
2001 211.98 17.85 35.77 38.69 57.66 36.33 25.68
2002 211.08 18.29 35.42 38.14 57.72 37.18 24.33
2003 216.07 19.71 39.16 38.78 57.85 37.09 23.48
2004 214.93 20.76 36.83 39.31 56.94 37.43 23.66
2005 216.99 21.89 37.72 38.41 58.05 37.68 23.24
2006 216.01 21.25 39.13 38.02 58.66 36.61 22.34
2007 220.11 22.25 41.46 38.16 59.11 37.02 22.11
2008 223.39 21.58 44.80 38.12 59.02 38.09 21.78
2009 226.67 21.72 46.56 37.30 59.31 40.27 21.51
2010 227.98 21.96 48.94 37.42 59.47 39.16 21.03
2011 230.45 22.44 49.79 37.77 59.42 39.60 21.43
2012 233.93 22.51 52.38 37.85 59.89 39.98 21.32
2013 239.22 22.59 53.61 38.51 60.18 43.17 21.16
2014 236.36 27.47 48.09 37.64 60.52 42.16 20.48
2015 231.40 26.77 46.03 37.09 60.41 41.28 19.82
2016 226.48 26.46 44.14 36.36 60.19 39.52 19.81
2017 221.67 22.27 44.63 36.59 59.57 39.42 19.19
2018 220.43 22.80 43.70 35.54 59.70 39.41 19.28
2019 213.92 21.17 43.02 35.27 60.78 36.39 17.29
3-1 历年农村劳动力(从业)人员(年末数)Rural Labor Force (employed persons) over the Years (Year-end)
单位:万人 (10 000 persons)

082
绍兴市统计年鉴2020
指 标 Item全 市Whole
Municipality
越城区Yuecheng
District
柯桥区Keqiao District
上虞区Shangyu District
诸暨市ZhujiCity
嵊州市Shengzhou
City
新昌县Xinchang County
农村住户数 ( 万户 )
Number of Households (10 000 households)
129.33 13.95 23.88 21.69 36.99 21.09 11.73
农村人口 Rural Population 365.72 39.68 75.04 62.29 98.54 60.46 29.71
农村劳动力资源总数
Rural Laborers 234.55 23.95 47.86 38.94 64.85 39.20 19.75
农村从业人员数
Rural Real Laborers 213.92 21.17 43.02 35.27 60.78 36.39 17.29
男劳动力 Male 111.34 10.84 22.35 18.31 31.50 19.30 9.04
女劳动力 Female 102.58 10.33 20.67 16.96 29.28 17.09 8.25
3-2 农村劳动力资源分布情况(2019年末)Rural Labor Force and Its Distribution(End of 2019)
单位:万人 (10 000 persons)
注:本表数据来源于农村基本情况统计表。 Note: Data come from statistical reporting of rural basic conditions.

083
农 业
年 份Year
全 市Whole
Municipality
越城区Yuecheng
District
柯桥区Keqiao District
上虞区Shangyu District
诸暨市ZhujiCity
嵊州市Shengzhou
City
新昌县Xinchang County
1949 13974 3917 2063 3848 2726 14201952 20660 5610 3344 5996 3728 19821957 24872 6146 4447 6869 4783 26271962 27815 7067 4868 7825 5075 29801965 39309 9539 8727 10317 6934 37921970 49472 11530 9863 13568 9742 47691975 52158 12554 10431 13148 10952 50731980 95502 23502 18375 24999 19771 88551985 158962 3920 36628 28919 41655 30264 175761990 290287 7915 71578 71900 63179 51415 243001991 318869 9209 78830 73353 68043 60364 290701992 356633 9806 83924 79577 77461 72554 333111993 472245 14115 112139 102174 104782 98002 410331994 681985 23169 151519 144722 165045 133261 642691995 832738 26717 184039 183483 196144 162015 803401996 955209 39832 192697 222946 233370 181356 850081997 1012204 38773 203339 246093 242108 189270 926211998 1084958 39194 212501 259760 282068 195859 955761999 1109925 39893 217272 269260 283687 202680 971332000 1183122 107576 176266 288609 300471 206652 1035482001 1207380 110208 192992 308433 309810 174744 1111932002 1227796 103944 206557 307804 310065 191014 1084122003 1266297 92103 214685 320192 325598 200500 1132192004 1291929 87958 221301 324179 331704 218132 1086632005 1414046 99222 243733 348777 359767 233401 1291462006 1425617 90291 256539 328813 359088 254651 1362352007 1626010 108717 299390 366378 410487 288590 1524482008 1781427 104398 333964 402879 453684 320392 1661102009 1900613 99846 358037 434114 484596 344347 1796732010 2258049 114940 426344 506583 572370 419563 2182492011 2601659 127851 494222 581588 660658 487910 2494302012 2787681 127392 531661 626406 708670 523846 2697062013 2912077 211645 476265 656658 743242 543573 2806942014 2969532 213063 484762 669961 763327 553004 2854152015 3032473 209254 499227 687831 782434 563636 2900912016 2943018 194864 511336 743524 679780 534341 2791732017 2946200 188474 509475 745716 673804 546644 2820872018 2950972 188732 515548 745753 671072 548033 2818342019 3138524 202631 546120 800980 713958 575130 299705
3-3 历年分区、县(市)农林牧渔业总产值Gross Output Value of Farming, Forestry, Animal
Husbandry and Fishery by District and County (City) over the Years单位:万元 (10 000 yuan)
注:① 2002 年开始不包括“农民家庭兼营工业”。2003 年开始包括“农林牧渔服务业”,下同。② 2004 年数据进行了核减;2006 年至 2018 年以第三次农业普查数据为基础进行了核减,下同。
Note: a) Since 2002, the survey object does not include "the farmer family concurrently runs the industry". Since 2003, the survey object has included " agriculture, forestry, animal husbandry and fishery services", the same below. b) In 2004, the data were subtracted. From 2006 to 2018, based on the data of the third agricultural census, the data were subtracted, the same below.

084
绍兴市统计年鉴2020
年 份Year
农林牧渔业总产值Total
农 业Farming
林 业Forestry
牧 业Animal
Husbandry
渔 业Fishery
农林牧渔服务业Service for Farming,
Forestry, Animal Husbandry and Fishery
1949 13974 11395 985 1434 160
1952 20660 16610 1181 2608 261
1957 24872 19031 1128 4390 323
1962 27815 21913 1597 3938 367
1965 39309 30830 1314 6751 414
1970 49472 38316 1348 9256 552
1975 52158 40854 1113 9661 530
1980 95502 75210 1788 17356 1148
1985 158962 109072 5077 40012 4801
1990 290287 195475 8952 69849 16011
1991 318869 213505 10448 77627 17289
1992 356633 232791 13645 89095 21102
1993 472245 304149 22961 115041 30094
1994 681985 431501 23838 186542 40104
1995 832738 546313 27611 208660 50154
1996 955209 611995 38119 235371 69724
1997 1012204 639248 45217 240586 87153
1998 1084958 699399 75921 196215 113423
1999 1109925 703668 83422 180827 142008
2000 1183122 710545 106916 200979 164682
2001 1207380 716749 114048 202391 174192
2002 1227796 709547 126013 207170 185066
2003 1266297 726679 131721 213485 192140 2272
2004 1291929 740224 111690 263059 172510 4446
2005 1414046 841836 113769 269300 182723 6418
2006 1425617 920602 122159 233468 140149 9239
2007 1626010 993922 138694 319875 162432 11087
2008 1781427 1086254 148166 359993 174536 12478
2009 1900613 1181223 166798 356072 183330 13190
2010 2258049 1436307 190181 408204 208531 14826
2011 2601659 1617599 217313 515815 234151 16781
2012 2787681 1754108 240244 520909 254000 18420
2013 2912077 1832284 251963 531127 276581 20122
2014 2969532 1924238 261538 462836 299512 21408
2015 3032473 1980509 269055 439031 319983 23895
2016 2943018 1945744 279175 364178 327624 26297
2017 2946200 1994848 290750 296075 334629 29898
2018 2950972 2006715 288770 270709 351193 33585
2019 3138524 2084570 303143 345254 367576 37981
3-4 历年全市农林牧渔业总产值构成Composition of Gross Output Value of Farming, Forestry, Animal Husbandry and Fishery over the Years
单位:万元 (10 000 yuan)

085
农 业
年 份Year
全 市Whole
Municipality
越城区Yuecheng
District
柯桥区Keqiao District
上虞区Shangyu District
诸暨市ZhujiCity
嵊州市Shengzhou
City
新昌县Xinchang County
1949 100.0 100.0 100.0 100.0 100.0 100.0
1952 146.1 147.5 158.0 152.5 136.0 129.7
1957 185.8 178.3 228.5 186.1 165.7 181.1
1962 161.0 154.5 191.9 164.0 142.9 172.0
1965 242.1 223.4 362.6 232.2 201.9 219.4
1970 260.0 231.1 334.3 267.2 238.7 242.8
1975 268.3 243.4 355.1 246.8 270.5 253.5
1980 373.6 362.0 461.7 351.7 372.2 337.0
1985 490.9 109.3 504.6 610.8 430.3 452.0 491.0
1990 560.4 147.8 542.1 831.5 488.2 465.8 448.9
1991 582.1 147.1 560.0 855.8 507.5 493.5 470.6
1992 604.3 155.8 561.3 873.8 520.1 549.5 494.7
1993 639.6 163.3 582.5 958.8 532.5 595.8 522.3
1994 674.7 174.9 582.5 1044.6 529.6 666.8 581.6
1995 741.5 225.8 612.0 1128.6 596.2 755.8 612.4
1996 816.3 279.4 642.9 1213.5 686.6 842.7 652.9
1997 856.6 290.9 654.5 1291.7 724.5 892.5 679.2
1998 929.1 323.9 676.2 1450.2 833.9 909.8 722.3
1999 1050.8 350.9 817.4 1718.2 934.7 940.6 802.4
2000 1227.6 636.3 1238.1 1710.4 1026.7 981.1 866.9
2001 1310.4 794.1 1285.8 2144.9 1049.4 778.5 931.6
2002 1381.9 769.0 1407.5 2228.5 1072.9 896.2 982.6
2003 1425.2 681.4 1462.8 2318.1 1126.6 940.7 1026.2
2004 1454.0 650.7 1507.9 2347.0 1147.7 1023.4 984.9
2005 1591.5 734.1 1660.7 2525.0 1244.8 1095.1 1170.6
2006 1659.9 755.4 1748.7 2621.0 1293.3 1154.2 1224.4
2007 1736.3 784.9 1808.2 2681.3 1348.9 1210.8 1281.9
2008 1791.8 750.0 1882.3 2840.3 1415.0 1255.6 1315.3
2009 1854.5 723.0 1967.0 2948.2 1470.2 1302.1 1362.7
2010 1925 733.8 2043.7 3063.2 1527.5 1355.5 1418.6
2011 1999.7 744.4 2123.2 3184.7 1589.8 1411.7 1473.5
2012 2057.7 715.9 2191.1 3286.1 1641.2 1461.1 1521.3
2013 2112.2 717.3 2261.2 3391.3 1693.7 1502.0 1568.5
2014 2151.1 725.2 2304.2 3455.7 1725.9 1530.5 1598.3
2015 2192.0 704.9 2352.6 3531.7 1762.1 1573.4 1628.7
2016 2229.3 719.6 2416.1 3616.5 1802.6 1548.2 1667.8
2017 2280.0 711.5 2456.8 3710.3 1837.4 1587.2 1688.8
2018 2323.3 723.6 2486.3 3810.5 1881.5 1596.8 1719.2
2019 2368.3 732.9 2537.9 3899.6 1929.2 1599.8 1771.1
3-5 历年分区、县(市)农林牧渔业总产值发展指数Indices of Gross Output Value of Farming, Forestry, Animal Husbandry and Fishery over the Years
(1949 年 =100) (year of 1949=100)

086
绍兴市统计年鉴2020
3-6 农林牧渔业总产值(2019年)Gross Output Value of Farming, Forestry, Animal Husbandry and Fishery (2019)
3-7 农林牧渔业增加值(2019年)The Value-added of Farming, Forestry, Animal Husbandry and Fishery (2019)
单位:万元
单位:万元
(10 000 yuan)
(10 000 yuan)
指 标 Item全 市Whole
Municipality
越城区Yuecheng
District
柯桥区Keqiao District
上虞区Shangyu District
诸暨市ZhujiCity
嵊州市Shengzhou
City
新昌县Xinchang County
总产值合计 Total 3138524 202631 546120 800980 713958 575130 299705
1. 农业 Farming 2084570 116675 386570 481014 449820 409632 240859
2. 林业 Forestry 303143 8795 51180 49030 101730 56982 35426
3. 牧业 Animal Husbandry 345254 20039 42293 93463 83504 93089 12866
4. 渔业 Fishery 367576 53821 60871 165471 71146 11293 4974
5. 农林牧渔 服务业
Service for Farming, Forestry, Animal Husbandry and Fishery
37981 3301 5206 12002 7758 4134 5580
指 标 Item全 市Whole
Municipality
越城区Yuecheng
District
柯桥区Keqiao District
上虞区Shangyu District
诸暨市ZhujiCity
嵊州市Shengzhou
City
新昌县Xinchang County
增加值合计 Total 2109755 126736 374123 507235 482850 394855 223956
1. 农业 Farming 1448657 82298 260432 294457 309451 316122 185897
2. 林业 Forestry 224998 6790 38659 36098 76732 38506 28213
3. 牧业 Animal Husbandry 164289 13607 25447 49470 42411 29734 3620
4. 渔业 Fishery 245162 22279 47430 116529 48452 7250 3222
5. 农林牧渔 服务业
Service for Farming, Forestry, Animal Husbandry and Fishery
26649 1762 2155 10681 5804 3243 3004

087
农 业
年 份Year
全 市Whole
Municipality
越城区Yuecheng
District
柯桥区Keqiao District
上虞区Shangyu District
诸暨市ZhujiCity
嵊州市Shengzhou
City
新昌县Xinchang County
1949 485438 146955 89977 103026 99190 46290
1952 763093 207525 157834 200884 130250 66600
1957 767930 207480 142400 210475 141690 65885
1962 760560 212526 133511 207852 134651 72020
1965 1100809 308430 201575 321819 191780 77205
1970 1195197 343180 204507 330400 217210 99900
1975 1184651 319950 201526 328495 227040 107640
1980 1571384 443144 252770 417255 324110 134105
1985 1787787 50442 489130 327324 458421 329900 132570
1990 1862007 56550 528531 340067 478698 328340 129821
1991 1900798 56594 529987 347351 496270 337205 133391
1992 1865999 56444 514004 341781 497350 327698 128722
1993 1729881 49096 449908 329783 471949 303805 125340
1994 1685600 46575 453405 322361 448110 296931 118218
1995 1742472 39397 465289 329028 479244 314878 114636
1996 1854589 42678 487904 345068 516800 336138 126001
1997 1812626 42891 483395 349191 489291 323017 124841
1998 1820846 43154 480929 345433 510445 315204 125681
1999 1801722 42134 472586 332266 505393 322807 126536
2000 1444149 130880 245927 295991 411141 247478 112732
2001 1131807 88613 181945 246113 332094 188778 94264
2002 1000057 69497 162084 228851 294147 164659 80819
2003 838295 48090 140635 210669 256902 127682 54317
2004 953495 57203 162898 240543 286372 147829 58650
2005 963920 54141 163356 242649 295489 149760 58525
2006 800883 50003 135041 189869 252661 125950 47359
2007 842633 50618 146390 194722 270925 127579 52399
2008 822433 48291 145623 186154 264937 125263 52165
2009 858122 48068 155720 201674 273226 125685 53749
2010 823086 43846 150469 193412 265713 117400 52246
2011 825905 43592 147891 200800 265968 115978 51676
2012 786429 40337 139373 189372 252357 112487 52503
2013 776488 41743 137783 186424 249171 110023 51344
2014 791001 60621 90710 217691 242742 132083 47154
2015 751001 58852 89859 201947 231603 125864 42876
2016 734708 57006 88315 199881 227531 119590 42385
2017 751198 58687 90002 203787 231710 122767 44245
2018 775810 58833 92728 212505 235147 132004 44593
2019 782799 67608 83374 228611 223187 133903 46116
3-8 历年粮食总产量Total Output of Grain over the Years
单位:吨 (ton)
注:2007 年开始马铃薯统计在粮食作物中,2014 年起粮食产量数据为粮食生产统计监测调查推算数。Note: Potato was added up in food crops from 2007, since2014, grain output data statistical monitoring survey estimate for food
production.

088
绍兴市统计年鉴2020
年 份Year
全 市Whole
Municipality
越城区Yuecheng
District
柯桥区Keqiao District
上虞区Shangyu District
诸暨市ZhujiCity
嵊州市Shengzhou
City
新昌县Xinchang County
1949 3583 834 179 504 1600 466
1952 4532 1007 270 643 1974 638
1957 5932 1329 345 1020 2500 738
1962 2606 721 185 455 944 301
1965 3254 797 230 484 1318 425
1970 6146 1670 508 952 2200 816
1975 10039 2479 1183 2003 2775 1599
1980 20693 4622 2321 4801 5321 3628
1985 26052 84 6679 3064 5252 7335 3638
1990 33684 261 8407 3875 5910 9806 5425
1991 32622 274 8440 3743 6087 9005 5073
1992 32258 455 7817 4224 5875 8979 4908
1993 32600 279 8073 4293 5936 8953 5066
1994 29432 430 7695 4074 5028 7422 4783
1995 27233 291 6901 4263 3908 7153 4717
1996 25816 224 7427 3683 3013 7037 4432
1997 26943 149 7542 3396 3554 7770 4532
1998 30609 200 8124 4188 4005 9158 4934
1999 31426 183 8641 2792 5017 9647 5146
2000 31605 954 7530 2661 5380 10057 5023
2001 31994 846 7150 2483 6935 9516 5064
2002 37421 765 7783 2631 8822 12261 5159
2003 39125 755 8833 2944 9540 11592 5461
2004 41840 670 8602 2922 9267 14837 5542
2005 43415 665 9222 3304 9492 15098 5634
2006 46584 545 9173 3511 10694 16991 5670
2007 48027 397 9244 3305 11777 17406 5898
2008 48181 393 8589 3376 11903 17904 6016
2009 50295 510 9509 3286 12282 18554 6154
2010 49580 480 8432 3339 12266 19138 5925
2011 50307 422 8844 2968 12400 19710 5963
2012 51319 430 8797 2992 12501 20601 5998
2013 49710 440 8766 2817 12175 19867 5645
2014 43269 1117 7400 2950 5779 20229 5794
2015 48535 1219 7172 2485 12430 19359 5870
2016 47302 792 7183 2557 12730 18154 5886
2017 47925 781 7295 2795 12957 18377 5720
2018 41442 759 7523 2446 8043 17394 5277
2019 41729 768 7597 2392 8207 17311 5454
3-9 历年茶叶总产量Total Output of Tea over the Years
单位:吨 (ton)

089
农 业
年 份Year
全 市Whole
Municipality
越城区Yuecheng
District
柯桥区Keqiao District
上虞区Shangyu District
诸暨市ZhujiCity
嵊州市Shengzhou
City
新昌县Xinchang County
1949 7349 358 915 4528 912 636
1952 9389 386 1100 5261 1325 1317
1957 21075 1285 2543 11911 3070 2266
1962 8340 1549 746 3172 1919 954
1965 40030 8708 4439 16213 7091 3579
1970 42380 8256 4904 17719 7351 4150
1975 50769 10897 5872 19791 9219 4990
1980 70617 17644 9181 25516 12854 5422
1985 82538 1547 18288 10756 28740 15713 7494
1990 79695 2190 15443 10292 31663 13880 6227
1991 84015 2193 15750 11507 32941 14673 6951
1992 89089 2493 18661 13776 33560 13604 6995
1993 81380 2343 16296 10315 31843 13919 6664
1994 75852 2043 14221 11544 29551 11581 6912
1995 74874 2696 15415 12745 28508 9127 6383
1996 72038 3377 16155 11293 27399 7907 5907
1997 79459 5055 19158 12266 28912 8471 5597
1998 82789 5762 16913 12428 30244 11208 6234
1999 89164 6240 19049 16113 28921 11893 6948
2000 97046 11293 20145 14961 30029 12875 7743
2001 103085 10886 22580 17809 29841 13380 8589
2002 105526 10085 24470 19798 29169 13155 8849
2003 105206 8056 22602 22123 30388 13948 8089
2004 111287 8834 23803 23533 32093 15167 7857
2005 118601 8074 26170 24599 32156 19247 8355
2006 97712 6280 24577 16328 26218 19162 5148
2007 93290 5642 22638 15901 24504 20337 4268
2008 118533 5698 27196 26448 33579 21297 4315
2009 127882 5316 29032 30363 35504 22996 4671
2010 137789 5532 31590 32475 36707 26628 4857
2011 146185 5964 34126 35782 38976 26255 5082
2012 147496 5795 33808 32134 40149 30199 5411
2013 104765 6565 27927 37909 12712 18283 1369
2014 103462 10242 21087 37029 12841 20815 1448
2015 93130 4927 21235 32608 13298 19711 1351
2016 87679 5138 18461 25884 14487 22395 1314
2017 74826 4302 13615 25957 9920 19811 1221
2018 67358 4255 8764 22259 9497 18880 3703
2019 67440 3520 5568 17153 14150 24696 2353
3-10 历年猪牛羊肉产量Output of Pork, Beef and Mutton over the Years
单位:吨 (ton)

090
绍兴市统计年鉴2020
年 份Year
全 市Whole
Municipality
越城区Yuecheng
District
柯桥区Keqiao District
上虞区Shangyu District
诸暨市ZhujiCity
嵊州市Shengzhou
City
新昌县Xinchang County
1949 734 1 405 328
1952 1792 3 26 1096 551 116
1957 1918 10 51 1077 609 171
1962 1153 22 42 583 391 115
1965 1336 27 49 684 456 120
1970 2576 71 158 1226 820 301
1975 3486 123 318 1419 1148 478
1980 4437 153 551 1771 1395 567
1985 5248 1 187 827 1718 1723 792
1990 7718 187 1535 2053 2653 1290
1991 9023 199 1794 2214 3275 1541
1992 11758 258 2299 2825 4196 2180
1993 12245 296 2459 2835 4404 2251
1994 13148 256 2719 2419 5069 2685
1995 11535 268 2506 1935 4326 2500
1996 7141 154 1976 799 2456 1756
1997 7643 162 1978 1156 2305 2042
1998 8151 186 2085 1271 2485 2124
1999 7505 141 1864 1080 2492 1928
2000 7009 30 94 1655 989 2299 1942
2001 7850 37 100 2148 1087 2517 1961
2002 8275 32 95 2731 1127 2343 1947
2003 6465 24 68 2403 754 1886 1330
2004 5980 - 60 2203 742 1644 1331
2005 5500 - 58 1663 747 1652 1380
2006 5476 - 56 1541 727 1723 1429
2007 5678 - 56 1720 711 1731 1460
2008 4383 - 50 1308 620 1333 1072
2009 3459 - 48 1115 520 956 820
2010 3048 - 31 911 501 836 769
2011 2976 - 42 863 503 815 753
2012 2754 - 33 738 406 812 765
2013 2599 - 14 455 207 402 362
2014 1291 - - 329 60 515 387
2015 977 - - 286 47 401 243
2016 560 - 22 185 27 180 146
2017 433 - 3 111 19 197 103
2018 355 - 3 86 17 177 72
2019 263 - 2 52 18 140 51
3-11 历年蚕茧产量Total Output of Silkworm Cocoon over the Years
单位:吨 (ton)

091
农 业
年 份Year
全 市Whole
Municipality
越城区Yuecheng
District
柯桥区Keqiao District
上虞区Shangyu District
诸暨市ZhujiCity
嵊州市Shengzhou
City
新昌县Xinchang County
1949 3859 2000 1575 284
1952 6338 3320 2523 480 15
1957 9784 4290 3844 1350 265 35
1962 8783 3705 4317 576 160 25
1965 9530 3475 5085 650 225 95
1970 13244 4675 7211 1188 150 20
1975 12804 3640 7879 1000 210 75
1980 12082 4745 5314 1425 512 86
1985 18706 2437 6119 6785 2000 990 375
1990 31980 3317 10742 12412 3215 1540 754
1991 33339 3232 11261 12960 3400 1665 821
1992 36069 3477 12052 13789 3951 1863 937
1993 39745 3698 13064 14661 4962 2305 1055
1994 43253 3981 14387 15859 5455 2318 1253
1995 45614 4019 15133 16315 6274 2515 1358
1996 48216 4093 16126 17120 6698 2617 1562
1997 51546 5090 16873 18200 7000 2715 1668
1998 54996 4810 18908 19317 7250 2885 1826
1999 63772 5396 20245 25507 7500 3117 2007
2000 74013 10196 18104 32137 8200 3320 2056
2001 91413 10532 24716 40120 10405 3510 2130
2002 99532 11835 25030 45767 11000 3690 2210
2003 102360 13301 25450 46557 11500 3242 2310
2004 91781 13545 23441 37053 11700 3730 2312
2005 99033 14088 24420 39754 14485 3956 2330
2006 86613 12497 21080 34709 12730 3536 2061
2007 86998 12415 20693 35536 12659 3559 2136
2008 90606 9511 23843 36252 14815 3585 2600
2009 89325 9479 24002 34479 15150 3640 2575
2010 93931 9654 24432 37825 15700 3713 2607
2011 93549 8410 25338 38557 14720 3824 2700
2012 96594 8910 26452 38804 15630 4015 2783
2013 99459 9561 26867 37745 18360 4216 2710
2014 103023 19475 18363 37899 20240 4346 2700
2015 106486 18817 19071 40094 21260 4520 2724
2016 109848 18232 19648 41345 23100 4670 2853
2017 112756 18560 20239 42213 23950 4820 2974
2018 115808 18886 20555 43148 24710 4959 3550
2019 119336 19330 21073 44537 25685 5071 3640
3-12 历年水产品总产量Total Output of Aquatic Products over the Years
单位:吨 (ton)

092
绍兴市统计年鉴2020
3-13 农作物播种面积(2019年)
单位:公顷
指 标 Item全 市Whole
Municipality
农作物播种面积总计 Total Area of Crops 233426
一、粮食作物合计 Total Grain Crops 120873
二、油料 Oilseed 13888
1. 油菜籽 Rapeseeds 9729
2. 花生 Peanut 3471
3. 芝麻 Sesame 494
三、棉花 ( 皮棉 ) Cotton 262
四、麻类 Fiber Crops 16
五、甘蔗 Sugar Crops 328
六、烟叶 Tobacco 321
七、药材类 Medicinal Crops 2063
八、蔬菜 Vegetables 53530

093
农 业
Total Sown Area of Farm Crops (2019)
(hectare)
越城区Yuecheng
District
柯桥区KeqiaoDistrict
上虞区ShangyuDistrict
诸暨市ZhujiCity
嵊州市Shengzhou
City
新昌县XinchangCounty
16268 30643 61278 58963 44783 21491
9820 12426 36671 33884 20433 7639
522 1068 4089 2217 1740 4252
454 912 3595 1164 710 2894
26 134 382 759 870 1300
40 22 86 294 - 52
3 8 119 6 46 80
1 - - - 14 1
23 7 63 156 59 20
- - - - 125 196
15 170 141 357 795 585
3703 9856 14726 7290 12945 5010
094
绍兴市统计年鉴2020
3-13 续表
单位:公顷
指 标 Item全 市Whole
Municipality
九、果用瓜 Fruits 8835
1. 西瓜 Watermelon 6839
2. 甜瓜 Muskmelon 579
3. 草莓 Strawberry 496
4. 其他 Others 921
十、花卉园艺 Flowers & Horticultures
1. 花卉苗木 Flowers and Plants Nursery Stock 18569
⑴花卉 Flowers and Plants 2684
⑵苗木 Plants Nursery Stock 15654
⑶草皮 Sod 231
2. 盆栽类园艺 ( 万盆 ) Potted Horticultures (10 000 pots) 466.03
十一、其他作物 Other Farm Crops 14741
1. 绿肥 Green Manure 12545
2. 席草 Rush 10
3. 饲料草 Forage Grass 181
4. 其他 Others 2005

095
农 业
Continued
(hectare)
越城区Yuecheng
District
柯桥区KeqiaoDistrict
上虞区ShangyuDistrict
诸暨市ZhujiCity
嵊州市Shengzhou
City
新昌县XinchangCounty
573 1029 2365 2301 1822 745
392 813 1854 1623 1481 676
18 62 171 167 132 29
29 40 43 306 66 12
134 114 297 205 143 28
1311 4424 2249 2758 5550 2277
69 924 549 273 565 304
1241 3471 1658 2339 4974 1971
1 29 42 146 11 2
5.50 217.00 178.10 39.30 21.50 4.63
297 1655 855 9994 1254 686
237 1261 633 9357 850 207
- - - - - 10
- 40 29 28 54 30
60 354 193 609 350 439

096
绍兴市统计年鉴2020
3-14 农作物总产量情况(2019年)
单位:吨
指 标 Item全 市Whole
Municipality
一、粮食作物合计 Total Grain Crops 782799
二、油 料 Oil-bearing Crops 33198
1. 油菜籽 Rapeseeds 21840
2. 花生 Peanuts 10105
3. 芝麻 Sesame 964
三、棉花 ( 皮棉 ) Cotton 382
四、麻类 Fiber Crops 76
五、甘蔗 Sugar Crops 17149
六、烟叶 Tobacco 684
七、药材类 Medicinal Crops 14788
八、蔬菜 Vegetables 1761262
九、食用菌 Edible Mushroom 6273
十、果用瓜 Fruits 296266
1. 西瓜 Watermelon 247371
2. 甜瓜 Muskmelon 15223
3. 草莓 Strawberry 13322
4. 其他 Others 20350

097
农 业
Total Output of Farm Crops (2019)
(ton)
越城区Yuecheng
District
柯桥区KeqiaoDistrict
上虞区ShangyuDistrict
诸暨市ZhujiCity
嵊州市Shengzhou
City
新昌县XinchangCounty
67608 83374 228611 223187 133903 46116
1435 2609 9578 5928 4219 9429
1264 2120 8327 2236 1491 6402
118 449 1017 3074 2531 2916
47 40 171 618 - 88
9 13 148 9 60 143
3 - - - 71 2
1266 448 3411 8188 3166 670
- - - - 228 456
2 642 3304 1195 7990 1655
125108 402972 545961 157683 378059 151479
150 72 120 741 5150 40
20877 42073 78799 75176 61964 17377
16295 34806 66037 58552 55138 16543
505 1977 4280 4992 3056 413
850 1195 858 8734 1528 157
3227 4095 7624 2898 2242 264

098
绍兴市统计年鉴2020
3-15 林业生产情况(2019年)
指 标 Item全 市Whole
Municipality
一、造林面积 ( 公顷 ) Build Forestry Areas (hectare) 919
#竹林 Bamboo Forest -
1. 用材林 Timber Forest 110
2. 经济林 Economic Forest 278
3. 防护林 Shelter Forest 524
二、迹地更新 ( 公顷 ) Forest Updating (hectare) -
三、封山育林(新封) ( 公顷 ) Afforestation in Enclosed Mountain (hectare) 352
四、四旁植树 ( 万株 ) Planting Trees Piecemeal (10 000 plants) 148
五、种籽采集 ( 吨 ) Seed Collection (ton) 14673
六、退化林修复面积 ( 公顷 ) Restoration Area of Degraded Forests (hectare) 3100
七、林产品产量 ( 吨 ) Output of Forest Products (ton)
#竹笋干 Dried Bamboo Shoots 34586
板栗 Chestnut 15909
香榧 Chinese Torreya 5340
八、木材采伐量 ( 立方米 ) Timber Cut (cu.m) 22820
九、毛竹篙竹采伐量 ( 万根 ) Bamboo Cut (10 000 pieces) 3213

099
农 业
Basic Indicators on Forestry (2019)
越城区Yuecheng
District
柯桥区KeqiaoDistrict
上虞区ShangyuDistrict
诸暨市ZhujiCity
嵊州市Shengzhou
City
新昌县XinchangCounty
15 64 167 208 388 77
- - - - - -
- 40 20 - - 50
1 20 17 80 133 27
7 4 130 128 255 -
- - - - - -
- 19 - - 333 -
2 6 10 50 30 50
- - 173 8000 3000 3500
267 800 1333 700 - -
1879 6500 4899 4200 14410 2698
6 230 3746 2220 786 8921
- 264 1 2750 2300 25
132 3133 649 8940 5878 4088
58 1964 200 686 300 6

100
绍兴市统计年鉴2020
3-16 桑、茧、茶叶、水果生产情况(2019年)
指 标 Item全 市Whole
Municipality
一、桑园总面积 ( 公顷 ) Total Area of Mulberry Field (hectare) 1329
本年新增面积 Newly Increased Area This Year 4
本年采摘面积 Picked Area This Year 1138
二、饲养蚕种张数 ( 张 ) Number of Silkworm Cocoon (piece) 5775
1. 春蚕 Number of Spring's Silkworm Cocoon 3630
2. 夏蚕 Number of Summer's Silkworm Cocoon 186
3. 秋蚕 Number of Autumn's Silkworm Cocoon 1959
三、蚕茧总产量 ( 吨 ) Output of Silkworm Cocoon (ton) 263
1. 春蚕 Number of Spring's Silkworm Cocoon 169
2. 夏蚕 Number of Summer's Silkworm Cocoon 8
3. 秋蚕 Number of Autumn's Silkworm Cocoon 86
四、茶园面积 ( 公顷 ) Area of Tea (hectare) 31429
本年新增面积 New-added Area in This Year 233
本年采摘面积 Picked Area in This Year 29501
五、茶叶总产量 ( 吨 ) Output of Tea (ton) 41729
1. 春茶 Spring Tea 23930
2. 夏茶 Summer Tea 8887
3. 秋茶 Autumn Tea 8912
六、果园面积 ( 公顷 ) Area of Orchards (hectare) 20389
七、水果总产量 ( 吨 ) Output of Fruit (ton) 593047

101
农 业
Basic Indicators on Mulberry, Silk-worm Cocoons, Tea and Fruits (2019)
越城区Yuecheng
District
柯桥区KeqiaoDistrict
上虞区ShangyuDistrict
诸暨市ZhujiCity
嵊州市Shengzhou
City
新昌县XinchangCounty
- 102 201 431 495 100
- - - 4 - -
- 21 201 321 495 100
- 45 1050 400 3124 1156
- 45 880 200 1800 705
- - - 20 129 37
- - 170 180 1195 414
- 2 52 18 140 51
- 2 45 9 81 32
- - - 1 5 2
- - 7 8 54 17
677 4526 1769 6187 11379 6891
- 17 2 10 43 161
674 4339 1627 5743 11219 5899
768 7597 2392 8207 17311 5454
431 4564 1306 5726 9186 2717
126 2119 407 1181 3762 1292
211 914 679 1300 4363 1445
307 1834 6033 5067 5263 1885
28264 54855 182364 148620 139454 39490

102
绍兴市统计年鉴2020
3-17 畜牧业生产情况(2019年)
指 标 Item全 市Whole
Municipality
一、生猪 ( 万头 ) Hogs (10 000 heads)
1. 年末存栏头数 ( 含未断奶小猪 ) Being Raised at Year-end 42.06
⑴能繁殖的母猪 Reproducible Hogs 4.30
⑵其他生猪 Others 37.76
2. 年内肥猪出栏头数 Slaughtered Fattened Hogs 83.86
3. 全年饲养量 Number of Hogs Raised 125.92
二、牛 ( 头 ) Cattle and Buffaloes (head)
1. 年末存栏头数 Being Raised at Year-end 7218
#良种及改良种乳牛 Milch Cows of Fine Breed and Improved Varieties
2. 年内牛出栏头数 Slaughtered Cattle and Buffaloes of the Year 1943
三、羊 ( 万只 ) Sheep and Goats (10 000 heads)
1. 年末存栏只数 Being Raised at Year-end 6.83
2. 年内羊出栏只数 Slaughtered Sheep and Goat of the Year 6.76
四、家禽 ( 万只 ) Poultry (10 000 heads)
1. 年末存栏只数 Being Raised at Year-end 463.00
2. 年内出栏只数 Slaughtered Poultry of the Year 1120.04

103
农 业
Basic Indicators on Animal Husbandry (2019)
越城区Yuecheng
District
柯桥区KeqiaoDistrict
上虞区ShangyuDistrict
诸暨市ZhujiCity
嵊州市Shengzhou
City
新昌县XinchangCounty
2.41 4.72 6.59 9.90 15.70 2.74
0.25 0.41 0.53 1.01 1.85 0.25
2.16 4.31 6.06 8.89 13.85 2.49
4.16 6.98 21.09 17.50 31.26 2.87
6.57 11.70 27.68 27.40 46.96 5.61
3 46 4568 1676 541 384
- 27 600 1010 55 251
1.05 0.54 2.48 1.98 0.66 0.12
1.39 0.40 2.93 1.35 0.56 0.13
9.51 27.95 42.63 139.60 226.15 17.16
10.93 16.06 42.35 118.70 922.96 9.04

104
绍兴市统计年鉴2020
3-17 续表
指 标 Item全 市Whole
Municipality
五、兔 ( 万只 ) Rabbits (10 000 heads)
1. 年末存栏只数 Being Raised at Year-end
⑴肉用兔 Table Rabbits
⑵长毛兔 Long Wool Rabbits
2. 年内出栏只数 Slaughtered Rabbits
六、养蜂年末箱数 ( 箱 ) Number of Beehives (box) 45678
七、畜禽产品产量 ( 吨 ) Output of Livestock Production (ton)
1. 肉类产量 Output of Meat
⑴猪肉 Pork 66110
⑵牛肉 Beef 261
⑶羊肉 Mutton 1069
⑷兔肉 Rabbits Meat
⑸禽肉 Fresh poultry 17617
⑹其它 Others
2. 禽蛋产量 Output of poultry eggs 16035
3. 蜂蜜产量 Output of Honey 2304
4. 蜂皇浆产量 ( 千克 ) Output of Royal Jelly (kg) 149085
5. 牛奶产量 Output of milk 15663
6. 兔毛产量 Output of Rabbit Wool

105
农 业
Continued
越城区Yuecheng
District
柯桥区KeqiaoDistrict
上虞区ShangyuDistrict
诸暨市ZhujiCity
嵊州市Shengzhou
City
新昌县XinchangCounty
705 1584 4501 13862 16350 8676
3300 5500 16610 13800 24600 2300
- 4 81 136 7 33
220 64 462 214 89 20
200 300 700 1900 14417 100
1000 2634 1906 8795 899 801
30 159 230 414 1210 261
1944 13600 8561 33411 75537 16032
- - 15663 - - -

106
绍兴市统计年鉴2020
3-18 水产养殖面积(2019年)
单位:公顷
指 标 Item全 市Whole
Municipality
水产品养殖面积 Water Aquiculture Area 18364
( 一 ) 海水养殖面积 Seawater Aquiculture Area -
1. 鱼类 Fish -
2. 甲壳类 Crustacean -
( 二 ) 淡水养殖面积 Freshwater Aquiculture Area 18364
1. 池塘 Ponds 9748
2. 湖泊 Lake 1194
3. 河沟 River 3515
4. 水库 Reservoirs 3893
5. 其它 Others 14
内陆集约化养殖方式 ( 平方米 ): Inland Intensive Aquatic Breeding(sq.m)
1. 网箱养殖 Mesh Cage Breeding 9500
2. 围栏养殖 Fence Breeding -
3. 工厂化养殖 Factory Aquiculture 97000
附:稻田养殖 Breeding in Farmland 5895
注:稻田养殖产量统计在养殖产量内,面积不统计在养殖面积中。

107
农 业
Water Aquiculture Area (2019)
( hectare )
越城区Yuecheng
District
柯桥区KeqiaoDistrict
上虞区ShangyuDistrict
诸暨市ZhujiCity
嵊州市Shengzhou
City
新昌县XinchangCounty
2580 2307 6509 3331 1657 1980
- - - - - -
- - - - - -
- - - - - -
2580 2307 6509 3331 1657 1980
150 1345 5185 1903 965 200
467 46 318 353 10 -
1963 897 613 - 42 -
- 14 393 1075 631 1780
- 5 - - 9 -
- - - - - 9500
- - - - - -
- - - 76000 - 21000
730 205 1953 2818 176 13
Note: Output of breeding in farmland includes in output of aquatic products, but its area doesn' t includes in aquiculture area.

108
绍兴市统计年鉴2020
3-19 水产品产量(2019年)
单位:吨
指 标 Item全 市Whole
Municipality
水产品总产量 Total Aquatic Products 119336
( 一 ) 海水产品产量 Seawater Aquatic Products 3430
1. 海洋捕捞 Seawater Catching 705
2. 海水养殖 Seawater Aquiculture -
3. 远洋渔业 Distant Fishery 2725
( 二 ) 内陆水产品产量 Inland-Water Aquatic Products 115906
1. 淡水捕捞 Freshwater Catching 13863
2. 淡水养殖 Freshwater Aquiculture 102043
#青鱼 Mackerel 1770
草鱼 Glass Carp 8022
鲢鱼 Silver Carp 18909
鳙鱼 Aristrichthys Nobilis 14613
鲫鱼 Crucian Carp 15412
鳊鲂 Bream 4813
鲤鱼 Cyprinus carpio 2325
鲈鱼 Perch Fish 3908
虾 Shrimp 25957
蟹 River Crab 143
鳖 Soft-shelled Turtle 3857
珍珠 Pearl 193
内陆水产品产量中: Inland-Water Aquatic Products
①鱼类 Fish 80683
②甲壳类 Crustacean 26908
③贝类 Shell-fish 3621
④其它类 Others 4694

109
农 业
Output of Aquatic Products (2019)
(ton)
越城区Yuecheng
District
柯桥区KeqiaoDistrict
上虞区ShangyuDistrict
诸暨市ZhujiCity
嵊州市Shengzhou
City
新昌县XinchangCounty
19330 21073 44537 25685 5071 3640
2725 - 705 - - -
- - 705 - - -
- - - - - -
2725 - - - - -
16605 21073 43832 25685 5071 3640
4990 1990 5640 - 853 390
11615 19083 38192 25685 4218 3250
1080 390 124 45 42 89
1200 1240 3492 1500 305 285
3150 3210 3813 7140 956 640
2640 2360 3317 4830 630 836
990 1690 5712 6040 585 395
980 1000 745 1690 256 142
225 195 318 970 475 142
- 55 3497 350 6 -
460 7940 16746 615 177 19
6 35 102 - - -
840 675 675 1050 583 34
- - 3 190 - -
12298 12078 25297 23220 4230 3560
796 8195 17072 615 205 25
2650 125 785 - 40 21
861 675 678 1850 596 34

110
绍兴市统计年鉴2020
3-20 农业机械年末拥有量(2019年末)
指 标 Item全 市Whole
Municipality
农业机械总动力 ( 千瓦 ) Total Power of Agricultural Machinery (kw) 1910412
#柴油机 Diesel Oil Machinery 1070956
汽油机 Gasoline Machinery 110284
电动机 Electrical Machinery 728642
一、耕作机械动力 ( 千瓦 ) Cultivation Machinery (kw) 207361
1. 大中型拖拉机 ( 台 ) Large and Medium Tractors (unit) 1892
2. 小型拖拉机 ( 台 ) Mini-tractors (unit) 3605
3. 机动插秧机 ( 台 ) Motorized Rice Transplantors (unit) 2374
二、收获机械动力 ( 千瓦 ) Harvest Machinery (kw) 114693
1. 联合收割机 ( 台 ) Combine Harvesters (unit) 2514
2. 机动割晒机 ( 台 ) Motorized Swathers (unit) 84
3. 机动打稻机 ( 台 ) Motorized Harvesters (unit) 2827
4. 谷物烘干机 ( 台 ) Cereal Dryer (unit) 1497
三、植保机械动力 ( 千瓦 ) Plant Protection Machinery (kw) 30803
机动喷雾粉器 ( 架 ) Motorized Sprayer (unit) 11715
四、排灌机械动力 ( 千瓦 ) Drainage and Irrigation Machinery (kw) 210921
1. 农用水泵 ( 台 ) Water Pump for Agricultural Use (unit) 53939
2. 节水灌溉类机械 ( 套 ) Water-saving irrigation machinery (set) 969
3. 水肥一体设备 ( 套 ) Water and fertilizer integrated equipment (set) 7
五、农产品加工机械动力 ( 千瓦 ) Processing Machinery of Agricultural Products (kw) 121942
1. 粮食加工机械 ( 台 ) Grain Processing Machinery (unit) 8645
2. 棉花加工机械 ( 台 ) Cotton Processing Machinery (unit) 351
3. 油料加工机械 ( 台 ) Oil Processing Machinery (unit) 945
六、运输机械动力 ( 千瓦 ) Transport Machinery (kw) 201885
1. 农用运输车 ( 辆 ) Vehicles for Agricultural Use (unit) -
2. 运输拖拉机 ( 辆 ) Trucks for Transport (unit) 8002
七、其他机械动力 ( 千瓦 ) Other Machinery (kw) 291437
八、渔业机械动力 ( 千瓦 ) Fishery Machinery (kw) 66357

111
农 业
Possession of Agricultural Machinery (End of 2019)
越城区Yuecheng
District
柯桥区KeqiaoDistrict
上虞区ShangyuDistrict
诸暨市ZhujiCity
嵊州市Shengzhou
City
新昌县XinchangCounty
99884 178245 419314 660682 355005 197281
59731 74894 266228 471840 146743 51520
8239 4177 19551 41254 23804 13259
31914 99174 133235 147588 184459 132272
20053 25164 63214 58716 29194 11020
94 128 1019 440 206 5
1051 1135 474 695 249 1
177 133 617 1068 373 6
13872 13892 38247 28610 18880 1192
323 205 747 750 481 8
- - - - 84 -
- - 32 - 2295 500
222 99 590 486 94 6
2154 885 13071 5874 6451 2368
370 316 6133 1520 2864 512
17449 22778 50099 72955 35087 12553
3271 4186 10945 25548 7272 2717
59 165 15 259 182 289
- - - 5 2 -
4892 8928 25655 32181 30625 19661
354 812 1496 2278 2274 1431
6 2 200 33 63 47
49 16 447 140 139 154
15902 19720 32068 68584 46611 19000
- - - - - -
282 1011 1214 2541 1941 1013
4756 20057 55891 192926 10145 7662
5763 7688 49208 3243 414 41

112
绍兴市统计年鉴2020
3-21 农业能源和农业物资消耗情况(2019年)
指 标 Item全 市Whole
Municipality
一、农村用电量 ( 万千瓦时 ) Electricity Consumed (10 000 kwh) 2348540
二、农用化肥施用量 ( 吨 ) Agricultural Consumption of Chemical Fertilizers (ton)
1. 按实物量计算合计 Calculated by Kind 245307
氮肥 Nitrogenous Fertilizer 151397
磷肥 Phosphate Fertilizer 31167
钾肥 Potash Fertilizer 13628
复合肥 Compound Fertilizer 49115
2. 按折纯法计算合计 100% Effective Component 75176
氮肥 Nitrogenous Fertilizer 46030
磷肥 Phosphate Fertilizer 5640
钾肥 Potash Fertilizer 3704
复合肥 Compound Fertilizer 19802
三、农用塑料薄膜使用量 ( 吨 ) Agriculture Plastic Film Use (ton) 5148
#地膜使用量 Ground Sheeting Use 2578
地膜覆盖面积 ( 公顷 ) Area of Ground Sheeting covered (hectare) 19958
四、农用柴油 ( 吨 ) Agriculture Diesel Oil (ton) 13375
五、农药使用量 ( 吨 ) Pesticide use (ton) 4824

113
农 业
Consumption of Agricultural Energy and Material (2019)
越城区Yuecheng
District
柯桥区KeqiaoDistrict
上虞区ShangyuDistrict
诸暨市ZhujiCity
嵊州市Shengzhou
City
新昌县XinchangCounty
113632 1187601 215401 671196 112000 48710
18956 16282 69989 69087 38230 32763
10496 7307 46692 39452 23750 23700
2507 1307 7344 9342 7510 3157
1910 418 3077 4928 1995 1300
4043 7250 12876 15365 4975 4606
5046 6063 19756 23655 11136 9520
3074 2658 12607 14085 7118 6488
497 156 1322 1682 1428 555
487 245 677 1235 598 462
988 3004 5150 6653 1992 2015
972 720 695 1192 1272 297
286 575 115 606 799 197
1440 5150 1356 8260 1198 2554
1210 3350 2008 2732 3325 750
328 430 1286 1360 950 470

114
绍兴市统计年鉴2020
3-22 农田水利情况(2019年)
指 标 Item全 市Whole
Municipality
已建成水库 ( 座 ) Number of Reservoirs (set) 553
总库容 ( 万立方米 ) Capacity of Reservoirs (10 000 cu.m) 155287
有效实灌面积 ( 千公顷 ) Effective Irrigated Area (1000 hectares) 152.48
除涝面积 ( 千公顷 ) Flooded or Water Logged Area under Control (1000 hectares) 42.06
治理水土流失面积 ( 千公顷 ) Area of Soil Erosion under Control (1000 hectares) 254.15
堤防长度 ( 公里 ) Total Length of Dykes (km) 1350.71
水利资金总投入 ( 亿元 ) Expend capital (100 million yuan) 51.79
水电站 ( 座 ) Hydropower Station (set) 311
总供水量 ( 亿立方米 ) Total Water Supply (100 million cu.m) 17.55

115
农 业
Water Conservancy Facilities of Farmland (2019)
越城区Yuecheng
District
柯桥区KeqiaoDistrict
上虞区ShangyuDistrict
诸暨市ZhujiCity
嵊州市Shengzhou
City
新昌县XinchangCounty
14 51 54 170 140 124
395 6773 26758 42329 25872 53160
9.53 14.38 33.22 44.03 37.93 13.39
2.58 6.29 13.33 17.43 2.43 -
5.72 35.52 29.66 27.87 111.23 44.15
19.40 135.39 407.38 309.64 328.70 150.20
17.99 9.70 11.00 7.40 3.60 2.10
- 19 15 46 121 110
2.17 4.34 3.20 4.13 2.39 1.32

116
绍兴市统计年鉴2020
农林牧渔业总产值 是指以货币表现的农、林、牧、渔业全部产品总量,它用价值量形式综合反映一定时
期农林牧渔业生产的总规模和总成果。
农、林、牧、渔业的统计范围是:
(1) 农业 包括农作物种植业和其他农业。
农作物种植业 包括谷物、豆类、薯类、棉花、油料、糖料、麻类、烟叶、蔬菜、药材、瓜类和其他农作物的种植
以及茶园、桑园、果园的生产经营。
其他农业 包括采集野生植物的果实、纤维、树胶、树脂、油料以及柴草、野生药材、菌类等。
(2) 林业 包括林木的栽培 ( 不包括茶园、桑园和果园的栽培、管理和收获等活动 )、林产品的采集和村及
村以下合作经济组织和农户的竹木采伐。
(3) 牧业 包括除渔业养殖以外的一切动物饲养和放牧以及野生动物的捕猎和饲养。
(4) 渔业 包括水生动物和海类植物的养殖和捕捞。
粮食产量 指全社会的粮食产量。包括国有经济经营的、集体统一经营的和农民家庭经营的粮食产量,
还包括工矿企业家属办的农场和其他生产单位的产量。粮食除包括稻谷、小麦、玉米、高粱、谷子及其杂粮外,
还包括薯类和大豆。
油料产量 指全部油料作物的生产量。包括花生、油菜籽、芝麻、向日葵籽、胡麻籽 ( 亚麻籽 ) 和其他油料。
不包括大豆,也不包括木本油料和野生油料。花生以带壳干花生计算。
水产品产量 指人工养殖的水产品和天然生长的水产品捕捞量,包括海水的鱼类、虾蟹类、贝类和藻类以
及内陆水域的鱼类、虾蟹类和贝类,不包括淡水生植物。
猪、牛、羊肉产量 指当年出栏并已屠宰后除去头蹄下水后带骨肉的重量(即胴体重)。
农作物播种面积 指实际播种或移植有农作物的面积。凡是实际种植有农作物的面积,不论种植在耕地
上还是种植在非耕地上,均包括在农作物播种面积中,同时还包括因遭灾而重新改种和补种的农作物面积,种
一公顷算一公顷。
主要统计指标解释

117
农 业
Explanatory Notes on Main Statistical Indicators
Gross Output Value of Farming, Forestry, Animal Husbandry and Fishery refers to the total
volume of products of farming, forestry, animal husbandry and fishery in value terms, which reflects the total
scale and total result of agricultural production during a given period of time.
The statistical scopes for farming, forestry, animal husbandry and fishery are:
(1) Farming include crop cultivation and other farming crop cultivation, include planting of grain, beans,
tubers, cotton, oil-bearing crops, sugar crops, fiber crops, tobacco, vegetables, medicinal materials, melons and
others, as well as tea, mulberry and fruit plantation.
Other farming include gathering of wild plant fruits, fiber, gum, oil, firewood, wild medicinal materials,
fungi and commodity industry run by rural household.
(2) Forestry includes planting of trees (not including planting, management & harvest of tea, mulberry
and fruit plantation), collection of forest products, cutting and felling of bamboo and trees by villages and other
cooperative organizations under villages.
(3) Animal Husbandry include raising and grazing of any kind of animal and hunting and raising of wild
animal, excluding fish breeding.
(4) Fishery includes cultivation and catches of aquatic animals and seaweed.
Grain Yield refers to the yield in the whole country including grains produced by state farms,
collective units, industrial enterprises and mines. Grain includes rice, wheat, corn, sorghum, millet and other
miscellaneous grains as well as tubers and beans.
Yield of Oil-bearing Crops refers to the total yield of oil-bearing crops of various kinds, including
peanuts, (dry, in shell) rapeseeds, sesame, sunflower seeds, flax seeds, and other oil-bearing crops. Soybeans,
oil-bearing woody plants, and wild oil-bearing crops are not included.
Output of Aquatic Products refers to catches of both artificially cultured and naturally grown aquatic
products, including fish, shrimps, crabs and shellfish in sea and inland water as well as seaweed. Freshwater
plants are not included.
Output of Pork, Beef, and Mutton refers to the meat of slaughtered hogs, cattle, sheep and goats
with head, feet, and offal taken away.
Sown Area of Crops refers to area of land sown or transplanted with crops regardless of being in
cultivated area or non-cultivated area. Area of land re-sown due to natural disasters is also included.


工 业4CHAPTER 4 INDUSTRY

120
绍兴市统计年鉴2020
0.5%
2.4%
0.9%
0.1%
0.0%
0.0%
10.4%
35.2%
22.2%
87.6%
51.1%
60.0%
10.1%
16.1%
17.5%
工业企业数
工业总产值
从业人员数
国有经济 集体经济 股份制经济 私营经济 外商及港澳台
Enterprises
Employees
Output Value
规模以上工业企业分所有制构成Composition of Industrial Enterprises above Designated Size
3.19 5.81 18.70 39.66
212.28
376.03
790.78
1404.38
1635.39
1746.131869.53
1925.151949.68
2042.132123.23
2190.092325.64
0
500
1000
1500
2000
2500
1978 1980 1985 1990 1995 2000 2005 2010 2011 2012 2013 2014 2015 2016 2017 2018 2019
工 业 增 加 值Value-added of Industry
单位:亿元(100 million yuan)

121
工 业
地 区 Region
工业企业数(个)
Number of Enterprises
(unit)
工业总产值( 万元 )
Gross Industrial Output Value(10 000 yuan)
国有及国有控股企业
State-owned and State-holding Enterprises
国有及国有控股企业
State-owned and State-holding Enterprises
全市 Whole Municipality 4769 68 69944226 6442796
越城区 Yuecheng District 546 21 12578799 3241785
柯桥区 Keqiao District 1229 13 20754454 874004
上虞区 Shangyu District 785 15 15613370 967350
诸暨市 Zhuji City 1184 6 11208364 615216
嵊州市 Shengzhou City 719 5 4929359 204476
新昌县 Xinchang County 306 8 4859879 539965
地 区 Region
规模以下工业总产值( 万元 )
Gross Industrial Output Value
(10 000 yuan)
规模以下工业企业Industrial Enterprises
below Designated Size
个体工业Self-Employed Individuals
全市 Whole Municipality 25127046 12698825 12428221
越城区 Yuecheng District 1155844 1136102 19742
柯桥区 Keqiao District 5553077 3207147 2345930
上虞区 Shangyu District 3819311 2189731 1629580
诸暨市 Zhuji City 7538114 3326092 4212022
嵊州市 Shengzhou City 4899774 1992776 2906998
新昌县 Xinchang County 2160926 846977 1313949
4-1 分区、县(市)规模以上工业企业主要经济指标(2019年)Main Economic Indicators of Industrial Enterprises above Designated Size (2019)
4-2 分区、县(市)规模以下工业总产值(2019年)Output Value of Industry below Designated Size (2019)

122
绍兴市统计年鉴2020
年 份Year
全 市Whole
Municipality
越城区Yuecheng
District
柯桥区KeqiaoDistrict
上虞区Shangyu District
诸暨市ZhujiCity
嵊州市Shengzhou
City
新昌县Xinchang County
1997 1681 215 627 248 266 219 106
1998 1631 196 595 280 271 190 99
1999 1618 192 579 280 262 201 104
2000 1776 322 445 293 400 216 100
2001 1975 351 551 322 418 234 99
2002 2125 418 553 372 411 234 137
2003 2448 486 597 484 466 253 162
2004 3877 683 1055 710 782 376 271
2005 3676 711 866 698 752 425 224
2006 4032 725 1074 705 832 477 219
2007 4428 784 1118 732 936 612 246
2008 5213 832 1396 884 1079 703 319
2009 5266 787 1438 882 1155 674 330
2010 5545 777 1498 900 1270 765 335
2010(新口径) 3226 480 1018 496 758 291 183
2011 3427 504 1112 520 789 305 197
2012 3682 513 1196 552 844 367 210
2013 4079 593 1201 599 1021 440 225
2014 4231 585 1223 638 1111 438 236
2015 4352 571 1227 669 1134 519 232
2016 4430 533 1240 723 1127 579 228
2017 4494 513 1187 737 1207 595 255
2018 4391 523 1233 731 1025 612 267
2019 4769 546 1229 785 1184 719 306
4-3 历年规模以上工业企业单位数Number of Industrial Enterprises above Designated Size over the years
单位:个 (unit)
注:规模以上工业统计口径:2005 年及 2005 年以前为国有和年产品销售收入 500 万元及以上非国有法人工业企业,2006-2010 年为年主营业务收入 500 万元及以上法人工业企业,2010 年新口径、2011 年及以后为年主营业务收入2000 万及以上法人工业企业。
Note: Industrial statistics above the scale: In 2005 and before, it included state-owned enterprises and non-state-owned industrial enterprises with annual product sales revenue of 5 million yuan or above. From 2006 to 2010, it included corporate industrial enterprises with annual main business income of 5 million yuan or above. Since 2010, new calibre has been adopted for the data, including industrial enterprises with annual main business income of 20 million yuan or above.

123
工 业
年 份Year
全 市Whole
Municipality
越城区Yuecheng
District
柯桥区KeqiaoDistrict
上虞区Shangyu District
诸暨市ZhujiCity
嵊州市Shengzhou
City
新昌县Xinchang County
1997 7211872 992313 2799065 1613109 888121 481641 437624
1998 7879920 874835 3282955 1782169 1007909 466870 465184
1999 8959160 891141 3689587 2031548 1214450 549234 583200
2000 10451307 1599471 3538483 2297214 1731582 626617 657940
2001 12019285 1616156 4487689 2552035 1985584 644698 733124
2002 14714046 2120701 5765052 2679015 2564027 627240 958012
2003 18953957 3194921 7167382 3067101 3497515 778999 1248039
2004 25774503 4947249 9595972 3637539 4916811 1165685 1511246
2005 32150738 5928778 11592806 4696333 6548648 1495497 1888676
2006 39108689 7298954 13846380 5588093 8267115 1852968 2255178
2007 48690061 8764222 17566837 6777867 10559911 2462829 2558396
2008 53901974 9002439 19478296 7529603 12219221 2804516 2867900
2009 55189053 8225619 20461657 7758145 12945029 2888509 2910094
2010 67973914 9675474 24146733 10268524 16274166 3764761 3844256
2010(新口径) 65137633 9314632 23526452 9765821 15672941 3193667 3664120
2011 79326832 11275089 29431019 11999172 18444581 3788470 4388501
2012 85512533 11242708 33104587 13240163 19323472 3957492 4644111
2013 93393104 12450594 34900455 14470671 22243608 3998203 5329571
2014 97353042 12481226 35467362 16187191 23414036 3923254 5879974
2015 97463846 12189832 34724692 17225391 23001761 4195522 6126648
2016 98269408 11774424 34387590 18215544 23078480 4687379 6125991
2017 77769797 11815504 24161603 13230195 19339970 4708622 4513903
2018 66709153 12233023 19471677 14629252 10923540 4699449 4752212
2019 69944226 12578799 20754454 15613370 11208364 4929359 4859879
4-4 历年规模以上工业企业总产值Total Output Value of Industrial Enterprises above Designated Size over the years
单位:万元 (10 000 yuan)

124
绍兴市统计年鉴2020
4-5 历年规模以上工业企业营业收入Operating Income of Industrial Enterprises above Designated Size over the years
年 份Year
全 市Whole
Municipality
越城区Yuecheng
District
柯桥区KeqiaoDistrict
上虞区Shangyu District
诸暨市ZhujiCity
嵊州市Shengzhou
City
新昌县Xinchang County
1997 6691543 971213 2635137 1464263 817803 435237 367891
1998 7221544 828822 3023876 1622534 952362 428425 365525
1999 8431187 847960 3532945 1904402 1174465 507245 464171
2000 9968523 1529076 3416932 2158299 1683211 600168 580839
2001 11545999 1554063 4367528 2424675 1897138 628551 674043
2002 14211004 2047046 5592724 2553028 2500999 621690 895517
2003 18490024 3084394 6972126 2966475 3481066 786900 1199063
2004 24978860 4918083 9279111 3448171 4789961 1125319 1418215
2005 31481179 5949575 11259205 4491407 6449868 1478607 1852517
2006 38278416 7333700 13522091 5354236 8125449 1813349 2129591
2007 47961175 8854176 17200329 6548797 10453146 2411324 2493403
2008 52968220 9135741 19037029 7175787 12080407 2708470 2830787
2009 54387246 8344538 19965888 7529055 12879931 2766050 2901784
2010 66938501 9817692 23792522 9780382 16110989 3635961 3800954
2010(新口径) 64171945 9464254 23182610 9293981 15529256 3077809 3624035
2011 77803109 11410053 28905041 11348285 18220682 3568548 4350501
2012 83336072 11198573 32162004 12518777 19076115 3788462 4592140
2013 90797957 12320834 33953271 13601828 21812864 3817352 5291808
2014 94482483 12449156 34579342 15014134 22804275 3756328 5879249
2015 94056019 12008788 33888537 15933880 22040447 4064629 6119738
2016 93379772 11599845 33009434 16529767 21835658 4510963 5894104
2017 75208195 11712781 23276094 12863956 18288227 4544649 4522488
2018 63914999 12150913 18205531 13680756 10617170 4467311 4793319
2019 69030158 13143494 19097201 15170903 11979399 4691488 4947673
单位:万元 (10 000 yuan)
注:2019 年以前数据为主营业务收入。Note: The data was main business income before 2019.

125
工 业
4-6 历年规模以上工业企业利税总额Total Profits and Taxes of Industrial Enterprises above Designated Size over the years
年 份Year
全 市Whole
Municipality
越城区Yuecheng
District
柯桥区KeqiaoDistrict
上虞区Shangyu District
诸暨市ZhujiCity
嵊州市Shengzhou
City
新昌县Xinchang County
1997 617245 74942 228991 160849 75113 31705 45646
1998 641490 43769 250539 192318 90901 29475 34487
1999 815409 69364 295925 238221 119183 43448 49268
2000 1044398 143767 298170 265253 203564 57918 75726
2001 1215380 133366 408358 307217 224989 52204 89245
2002 1467281 176754 493998 322919 294625 57626 121359
2003 1875905 308516 585685 370520 398471 69394 143319
2004 2204176 311928 752884 374454 519731 85190 159989
2005 2556911 398864 725860 511978 619528 117389 183291
2006 2952497 484291 800752 582239 741780 136547 206889
2007 3846356 653271 1141657 689286 946471 166888 248784
2008 4089133 587308 1101981 736582 1051390 163412 448461
2009 4465295 547926 1275502 790958 1145644 178645 526620
2010 5888665 748940 1747924 1116834 1448332 217520 609115
2010(新口径) 5719527 734059 1712198 1091057 1390592 192867 598754
2011 6888602 838576 2149261 1321384 1655159 233376 690846
2012 6770522 678781 2325615 1325542 1587673 216130 636781
2013 7442350 779098 2604570 1364427 1867168 225576 601511
2014 8083659 772206 2793725 1648213 1941346 230851 697317
2015 8143562 789462 2927709 1607045 1837140 290902 691303
2016 8595795 876840 2837051 1811320 1834663 317673 918248
2017 7423565 942147 2273837 1546502 1550506 383228 727347
2018 6696753 929265 1764280 1792759 914217 424847 871384
2019 7269903 974851 1870916 2079678 1048881 445062 850515
单位:万元 (10 000 yuan)

126
绍兴市统计年鉴2020
4-7 历年规模以上工业企业利润总额Total Profits of Industrial Enterprises above Designated Size over the years
年 份Year
全 市Whole
Municipality
越城区Yuecheng
District
柯桥区KeqiaoDistrict
上虞区Shangyu District
诸暨市ZhujiCity
嵊州市Shengzhou
City
新昌县Xinchang County
1997 298517 15191 125425 78954 38970 10624 29354
1998 326070 -917 144688 105121 46569 11110 19498
1999 451180 21167 177376 133630 67846 22344 28818
2000 604164 66321 179558 155187 127025 30510 45564
2001 753826 62932 257057 197083 147907 28666 60182
2002 945465 93225 321535 214186 199157 32045 85318
2003 1172042 139579 375505 243630 282040 39071 92217
2004 1339749 188636 404789 250219 361260 48811 86036
2005 1614950 234342 409724 346149 466012 65589 93135
2006 1878509 284225 451366 393439 566461 70393 112625
2007 2507812 421822 673165 454558 723958 93211 141098
2008 2642189 374461 593084 479088 805569 79581 310406
2009 2984838 328125 763493 540772 876543 95974 379931
2010 4052658 483798 1103390 805664 1112284 112341 435182
2010(新口径) 3970427 480228 1086687 793984 1073934 104065 431530
2011 4807592 558935 1355003 955856 1291212 134707 511878
2012 4546728 399784 1453914 948820 1213318 98765 432127
2013 5054964 463267 1710742 957775 1416525 92201 414454
2014 5475273 463295 1833311 1207055 1402620 101799 467193
2015 5452213 471425 1924110 1144782 1338146 115118 458633
2016 5921035 560545 1852910 1315468 1373033 145897 673183
2017 5049055 621441 1476258 1142634 1061371 196511 550840
2018 4398041 584301 1111446 1332726 522802 212085 634681
2019 4979591 646308 1209990 1597413 633856 260156 631869
单位:万元 (10 000 yuan)

127
工 业
4-8 历年规模以上工业企业资产总计Total Assets of Industrial Enterprises above Designated Size over the years
年 份Year
全 市Whole
Municipality
越城区Yuecheng
District
柯桥区KeqiaoDistrict
上虞区Shangyu District
诸暨市ZhujiCity
嵊州市Shengzhou
City
新昌县Xinchang County
1997 7344393 1607942 3139753 929952 811241 411036 444469
1998 7747512 1631006 3355586 1015954 878014 371060 495892
1999 8160390 1660974 3401921 1107417 1000637 400442 588999
2000 9057313 2289813 3130050 1259348 1257796 485215 635091
2001 10016442 2373744 3577387 1412407 1432282 465506 755116
2002 12652138 2896666 4760458 1709879 1734189 571610 979337
2003 17945772 4040066 6842705 2381673 2536951 766909 1377468
2004 23714153 4758579 9058702 3245079 3884697 1121584 1645512
2005 29545157 5673404 11641949 4041050 4713659 1370195 2104901
2006 34299117 6445561 12976985 4975287 5726252 1682554 2492479
2007 42149009 7266105 16059874 6266631 7567123 2226845 2762433
2008 49186838 8153319 18633613 7676824 9135987 2649001 2938096
2009 54212680 8597845 19613389 8801536 11078478 2783831 3337601
2010 63285559 10040853 21212395 10454965 14013706 3342965 4220674
2010(新口径) 60112019 9600818 20567954 9878987 13197136 2844926 4022199
2011 68369718 10474581 23918923 11510887 14177783 3284818 5002726
2012 74503680 11408792 25632594 12788978 15495942 3733003 5444371
2013 81702472 12702035 26079241 13972454 18512634 4365678 6070430
2014 85903536 13120974 25930766 15910459 19862235 4276780 6802322
2015 87247792 12872048 25181961 17334500 19915466 4507115 7436702
2016 89664146 12239745 23775844 20461465 20347238 4437277 8402577
2017 79885334 11406555 18521683 18879534 18517441 4345227 8214894
2018 78632241 11863735 18553265 20378093 13721040 5117255 8998852
2019 80950204 12327980 18524814 20448730 14086256 5476293 10086131
单位:万元 (10 000 yuan)

128
绍兴市统计年鉴2020
4-9 历年规模以上工业企业负债总计Total Liabilities of Industrial Enterprises above Designated Size over the years
年 份Year
全 市Whole
Municipality
越城区Yuecheng
District
柯桥区KeqiaoDistrict
上虞区Shangyu District
诸暨市ZhujiCity
嵊州市Shengzhou
City
新昌县Xinchang County
1997 4485634 880989 2020349 545879 472157 284432 281829
1998 4595470 909216 2108928 543863 497998 240803 294663
1999 4780195 881614 2164764 550461 573854 241429 368072
2000 5295519 1522147 1822629 596530 672561 299982 381671
2001 5697106 1555292 2026190 665840 726394 278845 444546
2002 7175311 1844534 2789563 797945 803738 355312 584218
2003 10520444 2615076 4090103 1241126 1239703 479285 855152
2004 14016009 2561736 5874504 1774794 2077117 704885 1022973
2005 17800833 3683484 7597770 2109400 2306737 804686 1298757
2006 20848315 4142171 8480754 2666212 3011307 1042806 1505065
2007 25794706 4563996 10716533 3442187 3939129 1411061 1721800
2008 30178354 5170756 12589693 4283801 4797744 1710904 1625456
2009 33215150 5498919 13632363 4989475 5624619 1783259 1686516
2010 38168303 6289919 14654043 5626094 7388918 2192332 2016997
2010(新口径) 36122352 6002534 14168348 5241275 6974798 1856081 1879316
2011 41262985 6591280 16271991 6160518 7651585 2232063 2355549
2012 44548814 7094429 17407699 6647063 8288087 2577250 2534286
2013 48812926 8149755 17170800 7234282 10072874 3141515 3043700
2014 50441389 8192975 16670983 8538234 10667850 3069232 3302115
2015 49959158 7752048 15819415 9276463 10431869 3209304 3470059
2016 48581510 6985318 14256353 10713596 9971566 3051930 3602747
2017 43009405 6494297 11668858 9662978 9532983 2872434 2777856
2018 43090157 6715528 12296630 9989164 7491593 3200338 3396905
2019 43683803 6937601 11659771 10053205 7831665 3423139 3778422
单位:万元 (10 000 yuan)

129
工 业
4-10 历年规模以上工业企业职工平均人数Average Number of Employees of Industrial Enterprises above Designated Size over the years
年 份Year
全 市Whole
Municipality
越城区Yuecheng
District
柯桥区KeqiaoDistrict
上虞区Shangyu District
诸暨市ZhujiCity
嵊州市Shengzhou
City
新昌县Xinchang County
1997 458530 77460 175793 64357 66692 44379 29849
1998 442618 74074 170169 60471 64826 42336 30742
1999 429423 67949 161992 60760 66582 41738 30402
2000 446636 91956 131303 66595 82558 43806 30418
2001 467085 87203 145758 68052 91546 42439 32087
2002 487526 95910 153547 69335 93865 36602 38267
2003 549633 109568 174817 79066 104323 38342 43517
2004 676692 123557 223969 93787 133273 47768 54338
2005 709684 135288 225785 102021 143286 49631 53673
2006 766076 145273 240691 111069 156375 57878 54790
2007 840419 150286 265820 126365 167088 69043 61817
2008 864796 145655 271677 136781 172059 73648 64976
2009 847517 140820 262601 133751 174695 72750 62900
2010 888903 139972 276345 143430 182550 80865 65741
2010(新口径) 782511 123394 256388 124102 159522 62317 56788
2011 810375 125963 269945 128380 164729 65241 56117
2012 801270 120241 266972 129186 159706 67587 57578
2013 811628 128699 252817 134827 168196 68923 58166
2014 811176 122951 252804 136313 171050 67813 60245
2015 790789 116207 245676 139260 161843 67392 60411
2016 758349 106878 226916 141001 155850 67098 60606
2017 689564 100652 198411 120491 146400 67118 56492
2018 637905 96942 180384 122246 111704 69499 57130
2019 642243 94849 181502 122741 111629 72813 58709
单位:人 (person)

130
绍兴市统计年鉴2020
4-11 规模以上工业企业主要经济效益指标(2019年)
年 份(地 区)
Year(Area)
产销率 (%)Proportion of Products Sold
(%)
资产负债率 (%)Assets
Liability Ratio (%)
成本费用利润率(%)
Rate Between Profit and Cost
(%)
每百元固定资产原值实现利税 ( 元 )
Pre-tax Profits per 100 Yuan Original Value
of Fixed Assets (yuan)
年 份 Year
2001 96.68 56.88 6.98 18.81
2002 96.96 56.71 7.11 19.75
2003 97.68 58.62 6.76 20.34
2004 97.61 60.52 5.71 20.33
2005 97.49 60.25 5.40 18.63
2006 97.82 60.78 5.16 19.02
2007 97.95 61.20 5.52 21.69
2008 97.74 61.35 5.24 20.44
2009 98.05 61.27 5.80 20.72
2010 97.70 60.31 6.45 25.23
2010(新口径) 97.70 60.09 6.60 25.75
2011 97.41 60.36 6.54 26.90
2012 97.55 59.79 5.77 24.56
2013 97.35 59.74 5.90 24.85
2014 96.99 58.72 6.14 25.64
2015 96.79 57.26 6.14 24.82
2016 96.75 54.18 6.67 25.30
2017 96.80 53.84 7.03 24.07
2018 96.52 54.80 7.10 21.27
2019 53.96 7.70 22.26
分县(市、区) Grouped by Area
越 城 区 Yuecheng District 56.28 5.13 13.09
柯 桥 区 Keqiao District 62.94 6.74 19.10
上 虞 区 Shangyu District 49.16 11.70 31.09
诸 暨 市 Zhuji City 55.60 5.53 24.93
嵊 州 市 Shengzhou City 62.51 5.83 20.19
新 昌 县 Xinchang County 37.46 13.96 36.70

131
工 业
Main Indicators on Economic Benefit of above Designated Size Industrial Enterprises (2019)
每百元销售收入实现利
税 ( 元 )Pre-tax Profits
per 100 Yuan Sales Revenue
(yuan)
流动比率CurrentRatio
速动比率QuickRatio
企业亏损面(%)
Ratio of Number of Deficit
Enterprises to Total Enterprises
Number (%)
亏损率 (%)Ratio of
Total Loss to Total Profit
(%)
出口交货值占工业销售
产值比重 (%)Export
Delivery Value Proportion in Industry Sale Output Value
(%)
利润总额占利税比重 (%)
Total Profit Proportion
in Profit Payments and Tax Turnover
(%)
存货周转次数 ( 次 )Number of Times of
Turnover of Inventory
(time)
10.53 1.00 0.69 10.89 3.17 24.28 62.02 7.53
10.33 1.04 0.77 9.98 2.22 25.28 64.44 8.43
10.15 1.02 0.81 10.70 2.72 27.01 62.48 8.76
8.90 1.04 0.81 16.59 5.70 26.47 60.82 17.86
8.12 1.05 0.82 12.00 3.92 24.74 63.16 16.71
7.71 1.04 0.80 10.64 2.83 22.84 63.62 16.60
8.02 1.05 0.81 10.34 2.49 21.48 65.20 15.79
7.72 1.08 0.85 15.21 5.28 21.97 64.61 7.70
8.21 1.11 0.88 11.22 3.09 18.38 66.85 7.16
8.80 1.14 0.91 8.03 1.77 18.45 68.82 7.48
8.91 1.15 0.92 6.11 1.42 18.60 69.42 7.59
8.77 1.17 0.46 8.35 2.05 17.27 69.79 7.63
8.12 1.22 0.97 11.03 4.19 15.66 67.15 7.66
8.20 1.22 0.96 11.30 3.88 14.79 67.92 7.64
8.56 1.23 0.97 11.18 3.61 14.04 67.73 7.63
8.66 1.22 0.97 12.45 5.39 13.36 66.95 7.80
9.21 1.25 1.00 11.22 3.98 12.32 68.88 7.98
9.87 1.22 0.95 11.37 6.41 13.10 68.01 14.70
10.13 1.16 0.90 12.84 9.98 14.45 65.67 12.88
10.53 1.18 0.92 12.73 7.78 68.50 12.50
7.42 1.23 0.93 14.10 15.61 66.30 15.14
9.80 0.95 0.71 7.57 6.15 64.67 12.64
13.71 1.26 1.00 12.48 6.59 76.81 10.23
8.76 1.20 0.93 9.21 6.53 60.43 12.64
9.49 0.99 0.79 26.84 17.07 58.45 16.49
17.19 1.67 1.45 12.09 1.69 74.29 10.95

132
绍兴市统计年鉴2020
4-12 规模以上工业企业主要工业产品生产总量(2019年)
指 标 Item全 市Whole
Municipality
铁矿石原矿量 (吨) Iron Ore (ton) 249853
铜金属含量 (吨) Copper Content in Copper Concentrate (ton) 1363
锌金属含量 (吨) Zinc Content in Zinc Concentrate (ton) 4244
硫铁矿石(折含 S35%) (吨) Sulfur Iron Ore (Equivalent to S35%) (ton) 49906
小麦粉 (吨) Wheat Powder (ton) 48941
大米 (吨) Rice (ton) 83239
饲料 (吨) Forage (ton) 521512
罐头 (吨) Canned Food (ton) 30621
酱油 (吨) Soy Sauce (ton) 9387
饮料酒 (千升) Alcoholic Beverages (1000units) 314782
#白酒(折 65 度) (千升) Liquor (1000units) 7561
黄酒 (千升) Millet Wine (1000units) 307221
饮料 (吨) Drinks (ton) 29129
精制茶 (吨) Tea (ton) 103158
纱 (吨) Yarn (ton) 176462
布 (万米) Cloth (10 000 m) 133704
#棉布 (万米) Cotton Cloth (10 000 m) 41899
棉混纺布 (万米) Blended Colth (10 000 m) 25032
化学纤维布 (万米) Pure Chemical-fiber Colth (10 000 m) 66773
印染布 (万米) Printed Fabric (10 000 m) 2039889
毛纱(原绒线 < 毛线 >) (吨) wool yarn (Original yarn) (ton) 20020
毛机织物(呢绒) (万米) Woolen Piece Goods (10 000 m) 8516
蚕丝 (吨) Silk (ton) 850
领带 (万条 ) tie (10 000 units) 4405
无纺布 ( 无纺织物 ) (吨) Non-woven (ton) 73736
袜子 ( 万双 ) socks (10 000 units) 310953
服装 (万件) Costumes (10 000 units) 46479
#针织服装 (万件) Knitting Costumes (10 000 units) 34534
#梭织服装 (万件) Shuttle Woven Costumes (10 000 units) 11945

133
工 业
Output of Main Industrial Products of above Designated Size Industrial Enterprises (2019)
越城区Yuecheng
District
柯桥区KeqiaoDistrict
上虞区ShangyuDistrict
诸暨市ZhujiCity
嵊州市Shengzhou
City
新昌县XinchangCounty
- 249853 - - - -
- 1363 - - - -
- 1950 - 2294 - -
- 49906 - - - -
- - 48941 - - -
- 13732 16944 - 52563 -
- 497466 - 24046 - -
- - - - - 30621
- 9387 - - - -
110922 144831 46112 12917 - -
5177 1768 441 175 - -
105745 143063 45671 12742 - -
29129 - - - - -
1427 28802 14776 3248 52762 2144
53853 36012 34667 48288 3432 210
16100 56667 3600 31776 19089 6472
1362 5768 1697 15914 11422 5736
5807 7452 635 7096 3307 736
8931 43448 1268 8767 4359 -
123702 1809358 52049 43628 11152 -
- - - 20020 - -
- 69 271 7849 328 -
- - - - 420 430
- - - - 4405 -
7979 65634 - - 122 -
- - 1645 307805 1503 -
8416 3976 2760 22914 7201 1212
3124 2136 2585 19751 5831 1108
5292 1840 175 3163 1370 104

134
绍兴市统计年鉴2020
4-12 续表1
指 标 Item全 市Whole
Municipality
#羽绒服 (万件) Eiderdown Costumes (10 000 units) 169
西服套装 (万件) Western-style Clothes (10 000 units) 995
衬衫 (万件) Shirt (10 000 units) 2782
轻革 (平方米) Light Leather (squaremeter) 451960
实木木地板 (平方米) Wooden Board (squaremeter) 43090
复合木地板 (平方米) engineered hardwood (squaremeter) 500961
家具 (件) Furniture (unit) 6967186
#木质家具 (件) Wooden Furniture (unit) 2081535
金属家具 (件) Metal Furniture (unit) 129307
软体家具 ( 含床垫、沙发 ) (件) Soft Furniture (include Mattress and Settee) (unit) 639820
机制纸及纸板 (吨) Machine-made Paper and Paperboard (ton) 699665
#箱纸板 (吨) Box carton (ton) 38762
纸制品 (吨) Paper Products (ton) 545868
#瓦楞纸箱 (吨) Cardboard box (ton) 250100
硫酸(折 100%) (吨) sulfuric Acid (ton) 764819
合成氨 (吨) Synthetic Ammonia (ton) -
农用氮磷钾化肥 ( 折纯 ) (吨) Chemical Fertilizer (ton) -
#氮肥 ( 折含 N100% ) (吨) Nitrogenous Fertilizer(100%) (ton) -
涂料 (吨) Dope (ton) 37560
染料 (吨) Dye (ton) 569094
合成纤维单体 (吨) Synthetic Fiber Monomer (ton) 1211822
合成纤维聚合物 (吨) Synthetic Fiber Polymer (ton) 1243333
#聚脂 (吨) Polyester (ton) 1240088
化学药品原药 (吨) Chemical Medicine (ton) 116383
中成药 (吨) Traditional Chinese Medicine (ton) 5794
化学纤维 (吨) Chemical Fiber (ton) 3698728
#合成纤维 (吨) Synthetic Fiber (ton) 3697737
锦纶纤维 (吨) Polyamide fiber (ton) 82935

135
工 业
Continued 1
越城区Yuecheng
District
柯桥区KeqiaoDistrict
上虞区ShangyuDistrict
诸暨市ZhujiCity
嵊州市Shengzhou
City
新昌县XinchangCounty
133 4 - 28 4 -
233 75 25 533 129 -
1707 452 - 272 351 -
451960 - - - - -
43090 - - - - -
365518 - - 135443 - -
5711011 423590 490877 84458 257250 -
1186986 423590 338482 8149 124328 -
- - 6935 75000 47372 -
569328 - - 1309 69183 -
40514 224226 - - 434925 -
- 38762 - - - -
251174 134352 38571 95136 26635 -
101154 25014 27309 77830 18793 -
242123 - 522696 - - -
- - - - - -
- - - - - -
- - - - - -
- 5620 30474 1466 - -
- 12464 556630 - - -
- 1211822 - - - -
755714 484374 3246 - - -
755714 484374 - - - -
1309 41 80670 - 512 33852
2713 234 1 689 2135 23
1150045 2080789 7495 457239 3160 -
1149113 2080789 7495 457181 3160 -
- 2905 2630 77400 - -
136
绍兴市统计年鉴2020
4-12 续表2
指 标 Item全 市Whole
Municipality
涤纶纤维 (吨) Polyester Fiber (ton) 3367675
氨纶纤维 (吨) Polypropylene Fiber (ton) 77721
塑料制品 (吨) Plastic Membrane (ton) 1338021
#塑料薄膜 (吨) Plastic Film (ton) 801837
#农用薄膜 (吨) Plastic Sheeting for Farm use (ton) 471
日用塑料制品 (吨) Household Plastic Products (ton) 36637
硅酸盐水泥熟料 (万吨) Portland Cement clinker (10 000 tons) 169
水泥 (万吨) Cement (10 000 tons) 1003
预应力混凝土桩 (米) prestressed-concretepile (meter) 4439805
砖(折标准砖) (万块) Bricks (10 000 pieces) 41314
平板玻璃 (重量箱) Plate Glass (weight cases) 8524486
玻璃包装容器 (原日用玻璃制品) (吨) Glass packaging container(Daily-use glass products) (ton) 63412
耐火材料制品 (吨) Fireproof Material Products (ton) 398413
钢材 (吨) Steel Products (ton) 2165417
#线材(盘条 ) (吨) Wire Material (ton) 33550
中板 (吨) Medium Plate (ton) 137331
冷轧薄板 (吨) Cold-rolled sheet (ton) 1276606
冷轧窄钢带 (吨) Steel Strip (ton) 141970
无缝钢管 (吨) Seamless Steel Pipe (ton) 148080
焊接钢管 (吨) Welded Steel Pipe (ton) 182360
白银 (千克) Silver (ton) 928608
铜材 (吨) Copper Material (ton) 613254
铝材 (吨) Aluminum (ton) 281188
金属切削工具 (万件) Metal-cutting tools (10 000 pieces) 9
不锈钢日用制品 (吨) Daily Use Stainless Steel Product (ton) 3309
发动机 (千瓦) Engine (kw) 9400000
金属切削机床 (台) Metal-cutting Machine Tools (unit) 8407
# 数控金属切削机床 (台) Numerically Metal-cutting Machine Tools (unit) 6025

137
工 业
Continued 2
越城区Yuecheng
District
柯桥区KeqiaoDistrict
上虞区ShangyuDistrict
诸暨市ZhujiCity
嵊州市Shengzhou
City
新昌县XinchangCounty
1144142 1934126 4865 282771 1771 -
4767 11674 - 61280 - -
334963 471991 146747 175233 16778 192310
276205 398325 - 127307 - -
- - - 471 - -
764 5715 24904 1398 3856 -
- - - 169 - -
164 137 164 484 54 -
- 716138 2911484 - 812183 -
586 - 22881 - 17847 -
8524486 - - - - -
63412 - - - - -
- - 383491 733 14190 -
14553 1168137 589666 285101 107960 -
- - - 33550 - -
- 51783 - 85548 - -
14553 821511 440542 - - -
- 86476 - - 55494 -
- - 34772 71061 42247 -
- 175882 - - 6478 -
- 666 927943 - - -
- 53594 199487 332839 13136 14198
26833 201804 14449 23494 14608 -
- 7 - - - -
- - 3309 - - -
- - - - - 9400000
- - 107 4969 980 2351
- - - 3115 559 2351

138
绍兴市统计年鉴2020
4-12 续表3
指 标 Item全 市Whole
Municipality
金属成形机床 (台) Metal forming machine tools (unit) 4348
起重机 (吨) Derrick (ton) 31827
泵 (台) Pump (unit) 1382530
阀门 (吨) Valve (ton) 100196
滚动轴承 (万套) Bearing (10 000 units) 72835
风机 (台) Wind Machine (unit) 1032251
工商用制冷、空调设备 〔台(套)〕 Industrial and Commercial Refrigeration and Air-conditioner (unit(set)) 909492
电动手提式工具 (台) Electric Portable Tool (unit) 737104
纺织专用设备 (台) Special Textile Equipment (unit) 39225
环境污染防治专用设备 〔台(套)〕 Special Equipment for Prevention and Control of Environmental Pollution (unit(set)) 14051
工业机器人 (套) Industrial Robot (unit) 280
两轮脚踏自行车 (辆) Bicycle (unit) 45075
电动自行车 (辆) Electric Bicycle (unit) 5870
交流电动机 (千瓦) Alternating Current Motor (kw) 34714463
高压开关板 (面) High Voltage Switchboard (panel) 6617
低压开关板 (面) Low Voltage Switchboard (panel) 9398
通信及电子网络用电缆 (对千米) Communication and electronic network cable (pair km) 869712
电力电缆 (千米) Electric Power Cable (kw) 97483
铅酸蓄电池 (千伏安时) Storage Battery (kvah) 1875642
太阳能电池(光伏电池) (千瓦) solar cell (kw) 238080
家用吸排油烟机 (台) Household Smoke Absorbers (unit) 2754870
家用燃气灶具 (台) Houdehold Gas Burning Appliance (set) 2206316
灯具及照明装置 〔万套(台、个)〕 Lamps and illumination devices (10 000 pcs) 20828
集成电路 ( 万块 ) Integrated Circuit (10 000 units) 189953
电子元件 ( 万只 ) Electronic Component (10 000 units) 298764
汽车仪器仪表 (台) Automobile Instrument (set) 1259525
伞类制品 ( 万把 ) Umbrella (10 000 units) 11578
发电量 ( 万千瓦时 ) Electricity (10 000 kwh) 1147570
#火电 ( 万千瓦时 ) Thermal Power Generation (10 000 kwh) 1142414

139
工 业
Continued 3
越城区Yuecheng
District
柯桥区KeqiaoDistrict
上虞区ShangyuDistrict
诸暨市ZhujiCity
嵊州市Shengzhou
City
新昌县XinchangCounty
- - - - 4348 -
3756 3175 21300 2108 1488 -
119011 - 486885 770903 5111 620
- 1567 7505 90526 - 598
10032 249 19453 4950 6767 31385
- - 795402 - 63975 172874
65066 - 228089 458414 157923 -
462405 43079 - 231620 - -
8216 1602 234 21390 2759 5025
1073 - 3951 8517 510 -
- 44 - - 236 -
- 45075 - - - -
- 5870 - - - -
664182 - 30261546 - 3561963 226771
4150 - 2467 - - -
5860 - 1249 - - 2289
477948 - 187105 204659 - -
- 70383 21368 - 5732 -
694064 - 1181578 - - -
185467 - 8578 - 44035 -
502382 - - - 2252488 -
1333631 - - - 872685 -
437 217 19577 - 596 -
189953 - - - - -
- - 1636 7154 289974 -
143032 1116493 - - - -
- - 11578 - - -
64400 725190 243085 48119 47009 19767
64157 725190 243085 45367 44848 19767

140
绍兴市统计年鉴2020
4-13 分地区、分行业规模以上工业企业总产值(2019年)
指 标 Item全 市Whole
Municipality总计 Whole Municipality 69944226 采掘业 Mining and Quarrying 75944 黑色金属矿采选业 Ferrous Metals Mining and Dressing 9648 有色金属矿采选业 Nonferrous Metals Mining and Dressing 14256 非金属矿采选业 Nonmetal Minerals Mining and Dressing 52039 制造业 Manufacturing 63587779 农副食品加工业 Manufacturing of Agricultural and Non-staple Foodstuff 386203 食品制造业 Foodstuff Manufacturing Industry 94936 酒、饮料和精制茶制造业 Manufacturing Industry of beverage, drinking and refiined tea 656947 纺织业 Textile Industry 11675919 纺织服装、服饰业 Manufacturing Industry of Textile Costumes, Shoes, and Caps 2716618
皮革、毛皮、羽毛及其制品和制鞋业 Manufacturing Industry of Leather, Fur, Feather (Cloth with Soft Nap) and their Products 148196
木材加工和木、竹、藤、棕、草制品业 Wood Processing and Manufacturing Industry of Wood, Bamboo, Rattan, Palm, and Straw-made Articles 50569
家具制造业 Cabinetmaking Industry 536130 造纸和纸制品业 Papermaking and Paper Product Industry 547928 印刷和记录媒介复制业 Printing Industry and Reproduction of Record Media 606360 文教、工美、体育和娱乐用品制造业 Manufacturing Industry of Culture, Education and Sports stuff 2134108 石油加工、炼焦和核燃料加工业 Petroleum Processing,Coking and Nuclear Fuel Manufacture 18000 化学原料和化学制品制造业 Chemical Feedstock and Chemical Manufacturing Industry 7762377 医药制造业 Medicine Manufacturing Industry 2665348 化学纤维制造业 Chemical Fiber Manufacturing Industry 5708196 橡胶和塑料制品业 Manufacturing industriy of robber and plastic 2255158 非金属矿物制品业 Non-metallic Minerals Product Industry 2863918 黑色金属冶炼和压延加工业 Ferrous Metal Smelting and Extrusion 639424 有色金属冶炼和压延加工业 Non-ferrous Smelting and Extrusion 4174661 金属制品业 Metalwork Industry 2007199 通用设备制造业 General-purpose Equipment Manufacturing Industry 4882644 专用设备制造业 Specialized Facility Manufacturing Industry 2488903 汽车制造业 Automobile Manufacturing Industry 1373216
铁路、船舶、航空航天和其他运输设备制造业 Manufacturing Industry of railway, shipping, spackflight and other transiport equipments 188566
电气机械和器材制造业 Electric Machinery and Equipment Manufacturing Industry 5123646
计算机、通信和其他电子设备制造业 Manufacturing Industry of Computers,Communication and Other Electronic Equipment 1146840
仪器仪表制造业 Manufacturing Industry of Instruments and Meters 199828 其他制造业 Other Manufacturing Industries 290457 废弃资源综合利用业 Utilization of Waste Resources 239166 金属制品、机械和设备修理业 Repair Service of Metalwork, Machinery and Equipment 6320 电力、燃气及水的生产和供应业 Production and Supply of Electric Power, Gas and Water 6280503 电力、热力生产和供应业 Production and Supply of Electric Power and Heat Power 5037913 燃气生产和供应业 Gas Generation and Supply 894349 水的生产和供应业 Water Production and Supply 348241
单位:万元
注:2017 年始采用新《国民经济行业分类》(GB/T4754-2017),下同。

141
工 业
Gross Industrial Output Value of above Designated Size Industrial Enterprises by Sector and Area(2019)
越城区Yuecheng
District
柯桥区KeqiaoDistrict
上虞区ShangyuDistrict
诸暨市ZhujiCity
嵊州市Shengzhou
City
新昌县XinchangCounty
12578799 20754454 15613370 11208364 4929359 4859879- 18355 8699 33211 12578 3101- 9648 - - - -- 8707 - 5549 - -- - 8699 27662 12578 3101
9614162 19344414 14825839 10516038 4632635 465469258732 218013 42656 49493 17310 -31210 7718 - 5013 16126 34869
171278 251104 98627 31670 97781 64881847734 7352155 675927 893514 673947 232643285769 153816 173232 1587131 480466 36206
49200 27869 16878 31960 22290 -
15001 13592 5485 3098 13393 -
356069 2867 84851 13916 78427 -132258 162162 93753 2363 157391 -68370 143992 247693 95175 24790 2634077379 1450653 163343 134691 243698 64343
- 2334 7006 8660 - -1357841 1292455 4890387 72411 145350 3933
430880 133498 867622 50986 177190 10051721398394 3533722 32418 743663 - -
533632 636006 532892 231478 52907 268243545021 734973 706675 601140 229079 47030
6722 109458 241124 172139 109982 -116597 328303 1819436 1781734 88362 40230131193 791563 568578 358433 100128 57305199980 295547 870450 1595136 488624 1432907199314 410845 395400 974602 141770 36697279272 292990 240286 407646 54291 298731
5730 - - 20615 6006 156214
1194772 836270 1667317 369778 1014254 41255
205879 83993 55790 85187 196894 519097
15158 59845 43438 62495 2180 167135880 - 284577 - - -
94901 18672 - 125593 - -- - - 6320 - -
2964637 1391685 778832 659116 284146 2020862425161 999873 655944 561890 245803 149242465598 253177 68787 64915 - 41873
73878 138636 54102 32311 38343 10971
(10 000 yuan)

142
绍兴市统计年鉴2020
4-14 分地区、分行业规模以上工业企业增加值(2019年)
单位:万元
指 标 Item全 市Whole
Municipality总计 Whole Municipality 15030031
采掘业 Mining and Quarrying 19033
黑色金属矿采选业 Ferrous Metals Mining and Dressing -
有色金属矿采选业 Nonferrous Metals Mining and Dressing 5410
非金属矿采选业 Nonmetal Minerals Mining and Dressing 19150
制造业 Manufacturing 14026893
农副食品加工业 Manufacturing of Agricultural and Non-staple Foodstuff 58108
食品制造业 Foodstuff Manufacturing Industry 27954
酒、饮料和精制茶制造业 Manufacturing Industry of beverage, drinking and refiined tea 174175
纺织业 Textile Industry 3115688
纺织服装、服饰业 Manufacturing Industry of Textile Costumes, Shoes, and Caps 581177
皮革、毛皮、羽毛及其制品和制鞋业 Manufacturing Industry of Leather, Fur, Feather (Cloth with Soft Nap) and their Products 27645
木材加工和木、竹、藤、棕、草制品业 Wood Processing and Manufacturing Industry of ood, Bamboo, Rattan, Palm, and Straw-made Articles 9961
家具制造业 Cabinetmaking Industry 154257
造纸和纸制品业 Papermaking and Paper Product Industry 133079
印刷和记录媒介复制业 Printing Industry and Reproduction of Record Media 172708
文教、工美、体育和娱乐用品制造业 Manufacturing Industry of Culture, Education and Sports stuff 453062
石油加工、炼焦和核燃料加工业 Petroleum Processing,Coking and Nuclear Fuel Manufacture 1100
化学原料和化学制品制造业 Chemical Feedstock and Chemical Manufacturing Industry 1783199
医药制造业 Medicine Manufacturing Industry 780827
化学纤维制造业 Chemical Fiber Manufacturing Industry 792028
橡胶和塑料制品业 manufacturing industriy of robber and plastic 474236
非金属矿物制品业 Non-metallic Minerals Product Industry 551472
黑色金属冶炼和压延加工业 Ferrous Metal Smelting and Extrusion 81719
有色金属冶炼和压延加工业 Non-ferrous Smelting and Extrusion 490172
金属制品业 Metalwork Industry 352648
通用设备制造业 General-purpose Equipment Manufacturing Industry 1302765
专用设备制造业 Specialized Facility Manufacturing Industry 649941
汽车制造业 Manufacturing Industry of Transport and Communication Facilities 345746
铁路、船舶、航空航天和其他运输设备制造业 Manufacturing Industry of railway, shipping, spackflight and other transiport equipments 58580
电气机械和器材制造业 Electric Machinery and Equipment Manufacturing Industry 979410
计算机、通信和其他电子设备制造业 Manufacturing Industry of Communication Equipment, Computers and Other Electronic Equipment 287964
仪器仪表制造业 Manufacturing Industry of Instruments and Meters 55393
其他制造业 Artwork and Other Manufacturing Industries 56490
废弃资源综合利用业 Processing of Discarded Resources, and Waste and cycle 72629
金属制品、机械和设备修理业 Repair of Metalwork, Machinery and Equipments 2761
电力、燃气及水的生产和供应业 Production and Supply of Electric Power, Gas and Water 984105
电力、热力生产和供应业 Production and Supply of Electric Power and Heat Power 817779
燃气生产和供应业 Gas Generation and Supply 79971
水的生产和供应业 Water Production and Supply 86355

143
工 业
Value-added of Industry of above Designated Size Industrial Enterprises by Sector and Area(2019)
越城区Yuecheng
District
柯桥区KeqiaoDistrict
上虞区ShangyuDistrict
诸暨市ZhujiCity
嵊州市Shengzhou
City
新昌县XinchangCounty
2174564 4404362 3586672 2517447 1025576 1321410
- - 2648 11935 4425 691
- - - - - -
- 4860 - 550 - -
- - 2648 11385 4425 691
1851584 4110699 3412239 2419867 946086 1286419
16979 23230 4487 12161 1252 -
3796 1756 - 1870 3327 17205
66618 65761 22654 11171 6812 1161
417228 2214900 126734 204119 121711 30996
50377 21550 46533 360461 99385 2872
4121 5302 3917 8598 5707 -
2240 4604 804 841 1473 -
85182 225 30058 9417 29376 -
17917 30755 60391 675 23341 -
8760 38120 94601 21611 5093 4523
16982 296217 30638 28783 55832 24610
- 175 1000 - - -
200699 149994 1395726 16793 19458 529
127559 15539 242953 11828 59560 323389
125610 515147 6456 144816 - -
101646 110585 144611 55311 12077 50005
91848 111121 149798 153223 33809 11674
906 15288 18723 35887 10916 -
12766 39752 155849 276134 3172 2500
26194 99840 109417 85594 16784 14820
61907 61384 226036 464903 114876 373660
44518 103825 110274 258961 26521 105843
14583 81487 43499 107209 11525 87442
606 - - 4210 1124 52639
295536 64297 303318 62785 243754 9721
16766 23440 19783 23766 38939 165270
3383 9647 9605 24935 262 7561
2112 - 54377 - - -
34748 6762 - 31120 - -
- - - 2761 - -
322979 294330 171785 85645 75065 34300
263370 242668 150422 67863 63957 29500
31534 29294 11619 4338 - 3186
28076 22368 9745 13444 11109 1613
(10 000 yuan)

144
绍兴市统计年鉴2020
4-15 规模以上工业企业主要财务指标(2019年)
单位:万元
分 类 Item
企业个数( 个 )
Number of Enterprises
(unit)
工业总产值现行价Gross
Industrial Output Value
工业增加值(收入法)
Value-added of Industry(Income ethod)
全市总计 Whole Municipality 4769 69944226 15030031
总计中:越城区 Yuecheng District 546 12578799 2174564
柯桥区 Keqiao District 1229 20754454 4404362
上虞区 Shangyu District 785 15613370 3586672
诸暨市 Zhuji City 1184 11208364 2517447
嵊州市 Shengzhou City 719 4929359 1025576
新昌县 Xinchang County 306 4859879 1321410
按登记注册类型分 Grouped by Registration Status
内资企业 Domestic Funded Enterprises 4326 59179414 12304687
集体企业 Collective-owned Enterprises 1 1655 330
股份合作企业 Share-holding Cooperative Enterprises 2 12195 3162
有限责任公司 Limited liability Corporations 339 16037161 2767219
国有独资公司 Sole State-funded Corporations 22 1603762 227351
其他有限责任公司 Other Limited Liability Corporations 317 14433399 2539868
股份有限公司 Share-holding Corporations Ltd. 138 9039025 2367559
私营企业 Private Enterprises 3846 34089378 7166416
私营独资企业 Private-Funded Enterprises 172 619002 107778
私营合伙企业 Private Partnership Enterprises 7 20532 3588
私营有限责任公司 Private Limited Liability Corporations 3574 31729125 6639133
私营股份有限公司 Private Shareholding Corporations Ltd., 93 1720720 415918

145
工 业
Main Financial Indicators of above Designated Size Industrial Enterprises (2019)
(10 000 yuan)
本年应付职工薪酬WagesPayable
全部职工年均人数
( 人 )Average
Employees(person)
资产总计Total
Assets
流动资产合计
Circulating Funds
固定资产合计TotalFixed
Assets
累计折旧
Depre-ciation
负债总计Total
Liabilities
营业收入
Operating Income
产成品Products
本年 折旧
Depre-ciation in ThisYear
5636723 642243 80950204 44493261 4697182 32657348 14713830 2343412 43683803 69030158
835005 94849 12327980 6502593 777001 7444788 3998968 443832 6937601 13143494
1590005 181502 18524814 9632271 1310156 9792891 4032887 873877 11659771 19097201
1090499 122741 20448730 11337488 1201744 6690124 2752152 447297 10053205 15170903
1140481 111629 14086256 8368029 832446 4207647 1868343 291694 7831665 11979399
485893 72813 5476293 3123758 232990 2204555 1002787 134604 3423139 4691488
494840 58709 10086131 5529123 342845 2317344 1058693 152108 3778422 4947673
4621471 530664 66498038 35630999 3811749 27324826 12047580 1987353 36525406 57336138
288 54 2818 1934 372 3846 2961 149 28 1565
2060 177 13395 8009 2301 7409 4039 153 4751 12742
836655 78238 13098784 5983236 739962 10140785 5070022 645755 8186301 16262573
86987 5981 2062135 443656 8073 1980435 1055286 118415 1149270 1659661
749668 72257 11036649 5539580 731889 8160350 4014736 527340 7037031 14602912
765363 69149 19741015 9728479 759903 4056282 1677919 276848 7667788 8687251
3017105 383046 33642027 19909341 2309213 13116504 5292639 1064448 20666538 32372007
53351 7771 467789 345917 40938 185965 91876 12085 345899 582829
2042 360 21244 17896 1487 6348 3769 396 16291 19243
2812095 358374 29872441 17674786 2056323 12193162 4882844 1009453 18899198 30061898
149617 16541 3280553 1870742 210464 731029 314150 42515 1405150 1708037

146
绍兴市统计年鉴2020
4-15 续表1
单位:万元
分 类 Item营业成本Operating
Cost
营业税金及附加
Business Tax and Extra Charges
销售费用Business Expenses
全市总计 Whole Municipality 57927382 350990 1647759
总计中:越城区 Yuecheng District 11602147 57030 275969
柯桥区 Keqiao District 16336230 94352 253775
上虞区 Shangyu District 12121333 77641 347736
诸暨市 Zhuji City 10375208 49027 258498
嵊州市 Shengzhou City 3789701 37437 173686
新昌县 Xinchang County 3702763 35503 338095
按登记注册类型分 Grouped by Registration Status
内资企业 Domestic Funded Enterprises 48126439 293398 1452997
集体企业 Collective-owned Enterprises 1635 14 5
股份合作企业 Share-holding Cooperative Enterprises 10101 88 564
有限责任公司 Limited liability Corporations 14395220 65622 285169
国有独资公司 Sole State-funded Corporations 1610066 7738 12519
其他有限责任公司 Other Limited liability Corporations 12785154 57884 272649
股份有限公司 Share-holding Corporations Ltd. 6525724 62407 493841
私营企业 Private Enterprises 27193758 165268 673419
私营独资企业 Private-funded Enterprises 512612 2375 8834
私营合伙企业 Private Partnership Enterprises 16709 129 569
私营有限责任公司 Private Limited Liability Corporations 25328712 153701 611728
私营股份有限公司 Private Shareholding Corporations Ltd., 1335725 9063 52288

147
工 业
Continued 1
(10 000 yuan)
管理费用Management
Expenses
财务费用Finance
Expenses
利息支出Interest
Expenditure
利息收入Interest Income
营业利润Operating
Profits
利润总额Total
Profits
亏损企业亏损额
Total Loss
利税总额Total Pre-tax Profits
本年应交增值税
Value Added Tax Payable
2477640 797295 929504 203064 4682592 4979591 420110 7269903 1939323
345613 110826 124003 29215 594001 646308 119557 974851 271513
654731 256112 270700 41787 1166989 1209990 79239 1870916 566575
598750 175592 216246 60800 1541249 1597413 112658 2079678 404624
383882 131934 140979 18687 587608 633856 44253 1048881 365998
267986 75628 86756 9295 212830 260156 53561 445062 147470
226679 47204 90821 43280 579916 631869 10842 850515 183143
2057878 677713 784016 175137 3884031 4139538 327390 5993705 1560770
75 -11 - 11 -153 -153 153 -107 32
1270 106 108 5 252 257 - 842 497
341100 137406 155059 31312 799614 842219 134198 1265148 357307
31980 27661 25534 1043 -26538 -13473 38907 33960 39695
309120 109745 129525 30269 826152 855692 95291 1231188 317612
358471 116269 204603 101901 1194550 1247671 34401 1616689 306611
1356962 423943 424246 41909 1889769 2049543 158638 3111134 896323
21147 7064 6674 162 21497 22316 1645 37914 13223
907 391 396 5 331 428 195 1164 607
1255878 397400 391046 36686 1663676 1827903 151807 2816216 834612
79029 19088 26130 5055 204265 198896 4992 255840 47880

148
绍兴市统计年鉴2020
4-15 续表2
单位:万元
分 类 Item
企业个数( 个 )
Number of Enterprises
(unit)
工业总产值现行价Gross
Industrial Output Value
工 业增加值(收入法)
Value-added of Industry(Income ethod)
港、澳、台商投资公司 Enterprises with Investment from Hong Kong, Macao and Taiwan 258 5985840 1470882
合资经营企业 ( 港或澳、台资 )
Joint-venture Enterprises with Investment from Hong Kong, Macao and Taiwan 161 4359022 1137316
合作经营企业 ( 港或澳、台资 )
Cooperative Enterprises with Investment from Hong Kong, Macao and Taiwan 3 37013 12015
港澳台商独资经营企业 Sole Investment from Hong Kong, Macao and Taiwan 85 1037314 250223
港澳台商投资股份有限公司
Share-holding Corporations Ltd. With Investment from Hong Kong, Macao and Taiwan
6 527598 62678
外商投资企业公司 Enterprises with Foreign Investment 185 4778972 1254462
中外合资经营企业 Joint-venture Enterprises with Foreign Investment 112 3691463 932231
中外合作经营企业 Cooperative Enterprises with Foreign Investment 1 4159 3064
外资企业 Enterprises with Sole Foreign Investment 67 986301 295890
外商投资股份有限公司 Share-holding Corporations Ltd. with Foreign Investment 3 86313 22962
总计中:亏损企业 Loss Enterprises 607 4377031 664293
总计中:国有及国有控股企业
State-owned and State-holding Enterprises 68 6442796 1029593
总计中:轻工业 Light Industry 2865 33465696 7776040
重工业 Heavy Industry 1904 36478530 7253991
总计中:大型企业 Large 55 10610974 2661383
中型企业 Medium-sized 406 21464384 5720380
小型企业 Small 3724 33427042 6169608
微型企业 Miniature 584 4441826 478660
按主营业务收入分 Grouped by Main Business Income
2000-3000 万 20 -30million 1353 3396382 695372
3000-5000 万 30 -50million 1078 4430221 884496
5000-1 亿 50 -100million 886 6632106 1373704
1 亿 -5 亿 100-500 million 896 20096332 5101122
5 亿 -10 亿 500-1000 million 119 8925270 2254711
10 亿 -50 亿 1-5 billion 85 17554282 3523229
50 亿 -100 亿 5-10 billion 6 3844966 469388
100 亿及以上 Above10 billion 3 4482528 601893

149
工 业
Continued 2
(10 000 yuan)
本年应付职工薪酬WagesPayable
全部职工年均人数
( 人 )Average
Employees(person)
资产总计Total
Assets
流动资产合计
Circulating Funds
固定资产合计TotalFixed
Assets
累计折旧Depre-ciation
负债总计Total
Liabilities
营业收入Operating Income产成品
Products
本年 折旧
Depre-ciation in ThisYear
534047 62653 7651951 5127075 603835 3095693 1543452 210285 3871874 5903941
380057 43488 5702257 3845355 317377 2320859 1122320 160789 2876047 4379391
2819 301 68603 48477 631 38519 23880 2074 24421 70495
114033 14362 1241359 837196 111259 601856 331361 40575 797251 971604
30668 3708 604653 378106 173788 97899 42134 4513 161461 457880
481205 48926 6800215 3735187 281598 2236829 1122798 145774 3286524 5790079
337695 30929 5634234 3021885 205677 1540317 723543 106987 2731636 4645890
1142 86 9757 1567 - 11313 6307 328 3444 4860
132385 16519 1048637 633326 74053 643045 373833 35650 475295 1036281
9745 1345 58950 35491 1622 37744 17166 2613 34062 92270
562588 76251 9311110 4038343 488243 4635384 2111056 312669 6247971 4180319
298707 20682 6573157 2187767 179158 6728369 3602891 387395 3719894 6481393
3176287 388488 36263551 21061297 2711078 15231485 6528277 1183135 19955509 32018321
2460436 253755 44686653 23431964 1986104 17425862 8185553 1160277 23728294 37011837
1020289 98249 15795180 8400368 800030 4431327 1753342 318726 7073803 11628581
2029496 214443 28883062 14562227 1486632 12161855 5559394 885651 13570129 20689902
2455731 316680 33082260 19956786 2293410 13491990 5877754 976243 20392532 32145672
131207 12871 3189702 1573881 117110 2572176 1523340 162793 2647339 4566003
382250 59756 4278407 2715506 293098 1658964 692328 105130 2884971 3259389
477163 70880 4836657 3042010 385922 1923049 837124 141763 3195118 4186866
669362 90257 7338316 4290079 509768 2849717 1290490 213668 4498551 6276069
2140480 244569 24806004 13419919 1378344 11582369 5103578 881135 14356732 19521959
762857 77879 10687465 5559369 645037 4108519 1717410 314369 4701584 8557352
875114 70407 23114333 12858340 1211983 6135074 2704375 408188 10129985 17364764
91837 8314 1672089 791827 112403 1296832 584668 74253 724755 3925132
160840 7241 3248857 1213024 53996 2638707 1566864 176529 2483972 5473951

150
绍兴市统计年鉴2020
4-15 续表3
单位:万元
分 类 Item营业成本Operating
Cost
营业税金及附加
Business Tax and Extra Charges
销售费用Business Expenses
港、澳、台商投资公司 Enterprises with Investment from Hong Kong, Macao and Taiwan 4860030 31128 110186
合资经营企业 ( 港或澳、台资 )
Joint-venture Enterprises with Investment from Hong Kong, Macao and Taiwan 3589427 22937 62619
合作经营企业 ( 港或澳、台资 )
Cooperative Enterprises with Investment from Hong Kong, Macao and Taiwan 61164 256 876
港澳台商独资经营企业 Sole Investment from Hong Kong, Macao and Taiwan 797116 6206 22398
港澳台商投资股份有限公司
Share-holding Corporations Ltd. With Investment from Hong Kong, Macao and Taiwan
390555 1583 23591
外商投资企业公司 Enterprises with Foreign Investment 4940913 26464 84577
中外合资经营企业 Joint-venture Enterprises with Foreign Investment 4000656 18410 64387
中外合作经营企业 Cooperative Enterprises with Foreign Investment 2535 117 -
外资企业 Enterprises with Sole Foreign Investment 851047 7595 19320
外商投资股份有限公司 Share-holding Corporations Ltd. with Foreign Investment 76130 258 858
总计中:亏损企业 Loss Enterprises 3811550 30902 147335
总计中:国有及国有控股企业
State-owned and State-holding Enterprises 5849762 32449 230786
总计中:轻工业 Light Industry 26466818 187214 991305
重工业 Heavy Industry 31460564 163775 656454
总计中:大型企业 Large 9653201 55793 449849
中型企业 Medium-sized 16593916 127440 529862
小型企业 Small 27369593 157053 644498
微型企业 Miniature 4310672 10705 23551
按主营业务收入分 Grouped by Main Business Income
2000-3000 万 20 -30million 2772114 17667 64291
3000-5000 万 30 -50million 3559971 21856 95087
5000-1 亿 50 -100million 5254143 34584 165544
1 亿 -5 亿 100-500 million 15957848 125966 489183
5 亿 -10 亿 500-1000 million 6819356 46955 280021
10 亿 -50 亿 1-5 billion 14402526 82615 463648
50 亿 -100 亿 5-10 billion 3554351 11536 57387
100 亿及以上 Above10 billion 5221162 6154 22719

151
工 业
Continued 3
(10 000 yuan)
管理费用Management
Expenses
财务费用Finance
Expenses
利息支出Interest
Expenditure
利息收入Interest Income
营业利润Operating
Profits
利润总额Total Profits
亏损企业亏损额
Total Loss
利税总额Total Pre-tax Profits
本年应交增值税
Value Added Tax Payable
230103 73998 83362 12835 464262 482790 29468 698363 184445
159833 56044 62399 9105 386483 395013 13285 563348 145398
1462 358 380 143 4894 4814 - 6192 1121
54936 17418 15854 570 57092 65615 13587 98111 26290
10713 122 4652 2991 17616 19106 739 31015 10327
189659 45585 62126 15093 334299 357263 63252 577835 194108
134975 32756 48420 14246 237981 259632 58735 444291 166248
826 113 113 1 1269 1272 - 1534 146
48893 11762 12842 660 87228 87967 4226 120989 25428
4678 915 707 179 8084 8680 - 11169 2232
310792 154680 156072 7677 -454822 -420110 420110 -271573 117635
113617 76530 77915 3390 157781 183251 72885 361130 145430
1264152 369708 433992 95091 2177801 2312500 169020 3495435 995721
1213488 427587 495512 107973 2504792 2667091 251090 3774468 943602
308229 83537 154435 72485 1098049 1146348 5626 1556990 354850
785464 219366 284016 89909 1886347 1973111 169945 2810283 709732
1309908 471157 471922 37084 1586694 1743904 230293 2714611 813655
74039 23235 19131 3586 111502 116229 14247 188019 61086
192064 60190 59298 2128 92754 111680 35637 213054 83708
241185 62231 58134 3849 91607 117833 66485 249532 109843
339725 95044 95262 9672 231602 268079 51208 472951 170289
951058 311775 323253 36444 1169506 1312680 234994 2069498 630852
324511 64085 82790 20746 876441 915944 10519 1232429 269530
343672 155091 253174 108802 1890621 1899582 2078 2445866 463669
-1699 22494 20484 6395 199561 215227 - 312112 85349
46418 8918 20442 13577 132407 138435 - 256855 112266

152
绍兴市统计年鉴2020
4-15 续表4单位:万元
分 类 Item
企业个数( 个 )
Number ofEnterprises
(unit)
工业总产值现行价Gross
Industrial Output Value
工 业增加值(收入法)
Value-added of Industry(Income ethod)
按工业行业类别分 Grouped by Economic Sector
采掘业 Mining and Quarrying 12 75944 19033
黑色金属矿采选业 Ferrous Metals Mining and Dressing 1 9648 -5527
有色金属矿采选业 Nonferrous Metals Mining and Dressing 2 14256 5410
非金属矿采选业 Nonmetal Minerals Mining and Dressing 9 52039 19150
制造业 Manufacturing 4702 63587779 14026893
农副食品加工业 Manufacturing of Agricultural and Non-staple Foodstuff 32 386203 58108
食品制造业 Foodstuff Manufacturing Industry 10 94936 27954
酒、饮料和精制茶制造业
Manufacturing Industry of Beverage, Drinking and Refiined Tea 44 656947 174175
黄酒制造 Yellow Rice or Millet Wine Manufacturing Industry 12 440627 138140
纺织业 Textile Industry 1132 11675919 3115688
棉纺织及印染精加工 Cotton Textile, Printing and Dyeing Finish Machining 428 6632367 2145390
毛纺织及染整精加工 Wool Weaving, Dyeing and Finish Machining 11 120072 23594
麻纺织及染整精加工 Linen Weaving, Dyeing and Finish Machining 3 25690 5958
丝绢纺织及印染精加工 Silk Weaving , Printing and Dyeing, and Finish Machining 39 678446 156323
化纤织造及印染精加工 Chemical Fibre Product, Printing and Dyeing and Finish Machining 76 730842 166183
针织或钩针编织物及其制品制造 Knitwear, Braid and their Product Manufacturing 471 2829113 513274
家用纺织制成品制造 Manufacturing of Textile Products In Home Application 79 475568 72058
产业用纺织制成品制造 Manufacturing of Industrial Textile Products not in Home Application 25 183820 32909
纺织服装、服饰业 Manufacturing Industry of Textile Costumes, Shoes, and Caps 531 2716618 581177
机织服装制造 Manufacturing Industry of Textile Costumes In Machine 160 807084 177040
针织或钩针编织服装制造 Manufacturing Industry of Stockinet and Knitting 78 409108 95185
服饰制造 Manufacturing Industry of Clothes 293 1500427 308953
皮革、毛皮、羽毛及其制品和制鞋业
Manufacturing Industry of Leather, Fur, Feather (Cloth with Soft Nap) and Their Products 28 148196 27645
木材加工和木、竹、藤、棕、草制品业
Wood Processing and Manufacturing Industry of Wood, Bamboo, Rattan, Palm, and Straw-made Articles
13 50569 9961
家具制造业 Cabinetmaking Industry 34 536130 154257
造纸和纸制品业 Papermaking and Paper Product Industry 43 547928 133079
印刷和记录媒介复制业 Printing Industry and Reproduction of Record Media 56 606360 172708
文教、工美、体育和娱乐用品制造业
Manufacturing Industry of Culture, Education and Sports Stuff 176 2134108 453062
石油加工、炼焦和核燃料加工业
Petroleum Processing,Coking and Nuclear Fuel Manufacture 4 18000 1100

153
工 业
Continued 4(10 000 yuan)
本年应付职工薪酬WagesPayable
全部职工年均人数
( 人 )Average
Employees(person)
资产总计Total
Assets
流动资产合计
Circulating Funds
固定资产合计TotalFixed
Assets
累计折旧Depre-ciation
负债总计Total
Liabilities
营业收入Operating Income
产成品Products
本年 折旧
Depre-ciation in ThisYear
6574 1683 386427 83851 2112 37339 18331 2373 99497 77062
- 738 56481 24440 291 - - - 1364 14209
3857 546 35314 10064 1102 26553 14348 1015 23839 11680
2717 399 294632 49347 719 10786 3983 1358 74294 51173
5411445 628879 75171433 43264144 4691956 25747272 11113768 1938522 39842869 62670462
22535 2699 327232 197117 30340 133423 54846 9328 216587 347339
6889 1009 118477 64337 5791 34184 13285 1731 72554 98827
58442 6917 1463181 845889 316593 526043 198491 24534 521353 571441
46183 4931 1170235 611470 293276 442509 157277 19916 346165 338404
1387494 170240 11757394 6136204 738153 6553287 2749732 556323 7987820 11032624
951723 111198 7149234 3523896 332314 4509333 1936608 374047 4735270 6277413
12883 1814 117077 61107 13229 87720 46370 4084 55516 119345
3717 565 26684 17819 10321 17591 9458 553 14219 27626
88621 10049 708836 379771 32403 331876 154234 19998 446921 604635
72684 10886 799137 364455 48748 391894 136187 44024 624723 668347
206775 27308 2449769 1465364 266431 1050883 390852 98621 1736186 2700014
36669 6226 348306 229789 25995 86129 37680 7433 278786 465891
14422 2194 158352 94004 8711 77862 38342 7564 96200 169354
351459 51101 2225082 1590509 198773 756807 394536 43828 1509418 2602566
107619 17736 652617 486172 65324 169628 90734 8650 420734 774361
68817 10536 418915 283059 22810 163192 99835 10348 276840 400998
175023 22829 1153551 821278 110640 423987 203968 24830 811844 1427207
16862 3143 121373 90599 9641 41421 15463 2252 92869 134988
5651 1118 59801 42346 3059 20001 9033 832 45126 48324
80469 8321 902303 472245 26185 218811 69636 14044 478574 495791
32618 4127 568636 375044 18078 248039 109901 20421 292107 531051
61100 7239 558219 370027 48355 263985 116461 23591 369472 566081
164696 19976 2493850 1503501 359868 615954 266484 55416 1273274 1905305
961 95 48538 43617 212 3335 1221 163 43462 18010

154
绍兴市统计年鉴2020
4-15 续表5单位:万元
分 类 Item营业成本Operating
Cost
营业税金及附加
Business Tax and Extra Charges
销售费用Business Expenses
按工业行业类别分 Grouped by Economic Sector
采掘业 Mining and Quarrying 48899 2390 2166
黑色金属矿采选业 Ferrous Metals Mining and Dressing 12012 167 1305
有色金属矿采选业 Nonferrous Metals Mining and Dressing 8468 741 202
非金属矿采选业 Nonmetal Minerals Mining and Dressing 28419 1482 659
制造业 Manufacturing 52038749 326792 1634591
农副食品加工业 Manufacturing of Agricultural and Non-staple Foodstuff 306682 982 8283
食品制造业 Foodstuff Manufacturing Industry 80829 785 2474
酒、饮料和精制茶制造业
Manufacturing Industry of Beverage, Drinking and Refiined Tea 404549 14439 60635
黄酒制造 Yellow Rice or Millet Wine Manufacturing Industry 207038 13158 51350
纺织业 Textile Industry 9339755 61013 116426
棉纺织及印染精加工 Cotton Textile, Printing and Dyeing Finish Machining 5183075 42376 54916
毛纺织及染整精加工 Wool Weaving, Dyeing and Finish Machining 105160 686 1098
麻纺织及染整精加工 Linen Weaving, Dyeing and Finish Machining 24670 150 135
丝绢纺织及印染精加工 Silk Weaving , Printing and Dyeing, and Finish Machining 507171 3976 10054
化纤织造及印染精加工 Chemical Fibre Product, Printing and Dyeing and Finish Machining 582674 2968 4459
针织或钩针编织物及其制品制造
Knitwear, Braid and their Product Manufacturing 2377754 9035 29210
家用纺织制成品制造 Manufacturing of Textile Products In Home Application 412522 1217 11964
产业用纺织制成品制造 Manufacturing of Industrial Textile Products not in Home Application 146729 604 4592
纺织服装、服饰业 Manufacturing Industry of Textile Costumes, Shoes, and Caps 2238195 13017 69923
机织服装制造 Manufacturing Industry of Textile Costumes In Machine 661365 3802 26481
针织或钩针编织服装制造 Manufacturing Industry of Stockinet and Knitting 339071 2654 10665
服饰制造 Manufacturing Industry of Clothes 1237759 6561 32776
皮革、毛皮、羽毛及其制品和制鞋业
Manufacturing Industry of Leather, Fur, Feather (Cloth with Soft Nap) and Their Products 118087 627 2365
木材加工和木、竹、藤、棕、草制品业
Wood Processing and Manufacturing Industry of Wood, Bamboo, Rattan, Palm, and Straw-made Articles
41955 684 962
家具制造业 Cabinetmaking Industry 362343 3945 30150
造纸和纸制品业 Papermaking and Paper Product Industry 433885 3797 11007
印刷和记录媒介复制业 Printing Industry and Reproduction of Record Media 430839 3153 17731
文教、工美、体育和娱乐用品制造业
Manufacturing Industry of Culture, Education and Sports Stuff 1554376 17898 46680
石油加工、炼焦和核燃料加工业
Petroleum Processing,Coking and Nuclear Fuel Manufacture 17298 82 333

155
工 业
Continued 5(10 000 yuan)
管理费用Management
Expenses
财务费用Finance
Expenses
利息支出Interest
Expenditure
利息收入Interest Income
营业利润Operating
Profits
利润总额Total Profits
亏损企业亏损额
Total Loss
利税总额Total Pre-tax Profits
本年应交增值税
Value Added Tax Payable
19054 789 1070 670 3632 2856 8354 8760 3513
6876 -9 - 19 -5971 -5986 5986 -5357 462
2903 766 761 8 -1400 -2368 2368 -495 1132
9276 32 310 643 11003 11210 - 14612 1920
2373540 705929 839004 199882 4444628 4731074 350032 6894557 1836692
10869 4497 4430 285 13020 14043 3719 24534 9509
4066 2081 2124 59 7707 7559 79 12622 4279
26526 7796 9621 2135 59543 60955 1239 96879 21485
19167 5890 6843 1274 47185 48169 930 78220 16893
483092 177491 176781 13761 608783 672957 45202 1133083 399114
292354 114646 115658 7942 421622 466565 29295 779433 270491
4915 1307 1392 102 2815 3020 1572 6887 3181
1146 216 217 1 1067 1101 - 1667 416
31075 10060 8756 -907 24098 30085 4496 54349 20288
33847 13954 13400 591 27796 28837 3183 53597 21792
96521 31443 29401 4104 113827 121482 5119 198518 68001
17046 3409 5332 1734 14063 15775 1495 26683 9691
6189 2456 2626 194 3495 6092 43 11950 5254
136556 32335 31204 2125 105740 99402 19364 190366 77947
43052 6639 6852 426 24458 26654 6192 57340 26885
30251 9573 9727 841 38498 22857 3092 35914 10403
63252 16124 14625 858 42784 49891 10081 97112 40659
5365 2057 2157 61 3864 4497 245 7588 2464
2719 395 243 5 1414 1705 107 3516 1128
33888 9254 10157 2098 58525 63655 1595 81410 13810
21638 6110 6408 470 45853 57526 4668 90513 29190
35148 5645 5456 740 58730 62701 1113 86141 20287
72157 24572 21995 4664 154143 162125 3040 231583 51559
423 26 - - -227 -227 291 -29 116

156
绍兴市统计年鉴2020
4-15 续表6单位:万元
分 类 Item
企业个数( 个 )
Number ofEnterprises
(unit)
工业总产值现行价Gross
Industrial Output Value
工 业增加值(收入法)
Value-added of Industry(Income ethod)
化学原料和化学制品制造业
Chemical Feedstock and Chemical Manufacturing Industry 188 7762377 1783199
涂料、油墨、颜料及类似产品制造
Coat, Ink, Coloring Agent and Similar Product Manufacturing 48 2279851 541285
合成材料制造 Synthetic Material Manufacturing 26 2197752 270887
专用化学产品制造 Special Chemical Product Manufacturing 54 880520 204957
医药制造业 Medicine Manufacturing Industry 87 2665348 780827
化学纤维制造业 Chemical Fiber Manufacturing Industry 200 5708196 792028
橡胶和塑料制品业 Manufacturing industriy of robber and plastic 164 2255158 474236
非金属矿物制品业 Non-metallic Minerals Product Industry 170 2863918 551472
黑色金属冶炼和压延加工业 Ferrous Metal Smelting and Extrusion 34 639424 81719
有色金属冶炼和压延加工业 Non-ferrous Smelting and Extrusion 117 4174661 490172
金属制品业 Metalwork Industry 198 2007199 352648
通用设备制造业 General-purpose Equipment Manufacturing Industry 549 4882644 1302765
轴承、齿轮和传动部件制造 Manufacturing of Bearing, Gear, Driving Unit 137 1121119 320491
烘炉、风机、衡器、包装等设备制造
Dring furnace, Fans, Weighing Apparatus, Package and Other General-purpose Equipment's manufacturing
113 1337446 338127
通用零部件制造 General-purpose Spare Parts Manufacturing and Machinery Repairs 115 898726 240412
专用设备制造业 Specialized Facility Manufacturing Industry 247 2488903 649941
纺织、服装和皮革加工专用设备制造
Specialized Facility's Manufacturing Industry of Textile Costumes and Leather transform 105 959156 226692
环保、社会公共服务及其他专用设备制造
Environmental Protection, Social Public Security and Other Special Use 69 755569 196961
汽车制造业 Manufacturing Industry of Transport and Communication Facilities 130 1373216 345746
铁路、船舶、航空航天和其他运输设备制造
Manufacturing Industry of railway, shipping, spackflight and other transiport equipments 14 188566 58580
电气机械和器材制造业 Electric Machinery and Equipment Manufacturing Industry 318 5123646 979410
计算机、通信和其他电子设备制造业
Manufacturing Industry of Communication Equipment, Computers and Other Electronic Equipment 88 1146840 287964
仪器仪表制造业 Manufacturing Industry of Instruments and Meters 24 199828 55393
其他制造业 Artwork and Other Manufacturing Industries 61 290457 56490
废弃资源综合利用业 Processing of Discarded Resources, and Waste and cycle 9 239166 72629
金属制品、机械和设备修理业
Repair of Metalwork, Machinery and Equipments 1 6320 2761
电力、燃气及水的生产和供应业
Production and Supply of Electric Power, Gas and Water 55 6280503 984105
电力、热力生产和供应业 Production and Supply of Electric Power and Heat Power 23 5037913 817779
燃气生产和供应业 Gas Generation and Supply 11 894349 79971
水的生产和供应业 Water Production and Supply 21 348241 86355

157
工 业
Continued 6(10 000 yuan)
本年应付职工薪酬WagesPayable
全部职工年均人数
( 人 )Average
Employees(person)
资产总计Total
Assets
流动资产合计
Circulating Funds
固定资产合计TotalFixed
Assets
累计折旧Depre-ciation
负债总计Total
Liabilities
营业收入Operating Income
产成品Products
本年 折旧
Depre-ciation in ThisYear
362493 33672 10506162 6081507 538865 3023974 1315399 186634 4796607 7823294
97105 9046 4385600 2517672 213474 577705 242389 31553 1964927 2168780
64385 6653 1782280 1089142 103210 731656 311352 45902 1145968 2419495
50575 4655 938526 580265 35378 360413 139289 25329 375487 864571
251522 25292 5918235 3558575 250453 1728545 740760 117585 1723701 2590014
228572 22313 4352400 2575361 364144 2165760 927389 186858 2844858 5535649
159777 20548 2575005 1344627 121793 1108031 555022 68015 1050360 2219254
141226 16170 2703271 1652731 159557 866753 403672 63340 1564370 2811768
27033 3239 559388 325656 33501 231048 108177 11501 329155 670744
181821 12412 2878165 1616152 161803 458182 207343 38274 1808133 5284306
152058 18355 1614415 1024243 115712 621240 238733 61323 951515 1747899
612964 72065 7093581 4410576 386838 2227677 1024029 165117 3307513 4649764
146462 19902 1627095 922556 94226 701293 355824 56608 861803 1087106
156838 16626 1535303 1114488 68298 398185 179455 28238 805498 1316762
107527 14906 1190707 853098 73951 338790 168433 23219 482410 844669
283961 26201 4040902 2698616 241885 826128 351915 55927 2172024 2486399
91728 10229 1095509 740086 45361 333656 150725 23948 597938 899174
118462 8116 1470647 980836 86136 264845 101853 15481 908854 788738
152050 19248 2420350 1316382 120588 721386 302575 54864 1200611 1361803
27040 3163 571089 149100 8883 106299 40940 8838 160312 188367
422039 52059 6221672 3324497 277974 1320754 540072 94754 3493655 5126378
150118 19365 2446270 1070741 107308 669768 276546 55700 1159143 1115663
19290 2059 217585 154476 12120 63186 23899 4129 135682 188080
31532 5153 189131 133377 18818 63934 25986 4290 141319 276444
17393 1451 212443 90856 16559 126412 30852 8510 98127 236649
1380 129 7282 5238 107 2908 1371 400 3170 5640
218704 11681 5392345 1145266 3114 6872737 3581731 402517 3741437 6282634
157281 6828 3296339 656403 - 4952136 2650309 299370 2154157 4998375
14440 1035 315370 90547 843 294570 119460 16169 175628 899140
46983 3818 1780636 398316 2271 1626031 811962 86979 1411652 385120

158
绍兴市统计年鉴2020
4-15 续表7单位:万元
分 类 Item营业成本Operating
Cost
营业税金及附加
Business Tax and Extra Charges
销售费用Business Expenses
化学原料和化学制品制造业
Chemical Feedstock and Chemical Manufacturing Industry 6271519 36497 117183
涂料、油墨、颜料及类似产品制造
Coat, Ink, Coloring Agent and Similar Product Manufacturing 1678021 12574 32332
合成材料制造 Synthetic Material Manufacturing 2212077 6384 8340
专用化学产品制造 Special Chemical Product Manufacturing 676698 4955 25262
医药制造业 Medicine Manufacturing Industry 1664331 23408 368766
化学纤维制造业 Chemical Fiber Manufacturing Industry 5074271 13728 39851
橡胶和塑料制品业 Manufacturing industriy of robber and plastic 1821623 11095 55623
非金属矿物制品业 Non-metallic Minerals Product Industry 2301332 15429 108438
黑色金属冶炼和压延加工业 Ferrous Metal Smelting and Extrusion 605947 1461 4032
有色金属冶炼和压延加工业 Non-ferrous Smelting and Extrusion 4967745 5585 24322
金属制品业 Metalwork Industry 1498882 7897 33666
通用设备制造业 General-purpose Equipment Manufacturing Industry 3639738 30283 180994
轴承、齿轮和传动部件制造 Manufacturing of Bearing, Gear, Driving Unit 869949 7811 23310
烘炉、风机、衡器、包装等设备制造
Dring furnace, Fans, Weighing Apparatus, Package and Other General-purpose Equipment's manufacturing
1020202 7500 73462
通用零部件制造 General-purpose Spare Parts Manufacturing and Machinery Repairs 655280 5282 23866
专用设备制造业 Specialized Facility Manufacturing Industry 1972960 14271 70122
纺织、服装和皮革加工专用设备制造
Specialized Facility's Manufacturing Industry of Textile Costumes and Leather transform 712790 5477 28633
环保、社会公共服务及其他专用设备制造
Environmental Protection, Social Public Security and Other Special Use 668661 4507 21614
汽车制造业 Manufacturing Industry of Transport and Communication Facilities 1083201 8427 43147
铁路、船舶、航空航天和其他运输设备制造
Manufacturing Industry of railway, shipping, spackflight and other transiport equipments 150771 1704 3857
电气机械和器材制造业 Electric Machinery and Equipment Manufacturing Industry 4181063 25025 178130
计算机、通信和其他电子设备制造业
Manufacturing Industry of Communication Equipment, Computers and Other Electronic Equipment
907460 7001 23034
仪器仪表制造业 Manufacturing Industry of Instruments and Meters 135216 1246 3263
其他制造业 Artwork and Other Manufacturing Industries 246231 998 5482
废弃资源综合利用业 Processing of Discarded Resources, and Waste and cycle 184018 2242 7302
金属制品、机械和设备修理业
Repair of Metalwork, Machinery and Equipments 3650 74 410
电力、燃气及水的生产和供应业
Production and Supply of Electric Power, Gas and Water 5839735 21808 11002
电力、热力生产和供应业
Production and Supply of Electric Power and Heat Power 4629055 14542 187
燃气生产和供应业 Gas Generation and Supply 842063 1571 2621
水的生产和供应业 Water Production and Supply 368617 5695 8195

159
工 业
Continued 7(10 000 yuan)
管理费用Management
Expenses
财务费用Finance
Expenses
利息支出Interest
Expenditure
利息收入Interest Income
营业利润Operating
Profits
利润总额Total Profits
亏损企业亏损额
Total Loss
利税总额Total Pre-tax Profits
本年应交增值税
Value Added Tax Payable
219015 62892 89633 48230 913152 913559 12088 1190840 240784
75729 23371 40207 31310 324610 324034 1938 441662 105054
23291 30967 26012 6759 108805 110773 846 159520 42363
31072 3015 4960 543 93883 93293 7303 118789 20541
147377 8246 41832 31961 337146 344210 42927 489305 121687
61054 51077 68605 19985 246659 254784 7728 361450 92938
80220 21435 27990 9125 178318 185450 7077 257177 60632
87807 24733 25131 -1476 246292 252983 3583 360151 91739
10777 305 4434 468 32551 33643 1137 41800 6697
53478 48578 38707 3991 109101 120470 5814 241312 115257
72891 18200 17651 1450 36582 53802 40447 102192 40493
287492 48506 70885 22516 323324 376376 25853 556426 149768
69514 15723 19726 4549 64816 85989 5074 131267 37467
79855 5838 15192 11576 93820 111894 4795 164235 44842
47912 10634 10748 718 76291 77581 1827 107569 24705
130840 28266 33548 6731 213071 232150 26661 319959 73538
43578 6122 8716 2219 67962 74966 5975 113496 33053
47125 17499 16738 494 50236 54545 2806 78282 19230
78683 21892 26169 5530 88273 96149 10395 149787 45211
11093 2967 4278 1928 10909 11710 3040 23732 10318
199407 80699 95599 16316 442153 475682 22733 597108 96401
67251 8565 17227 6319 93335 106729 56937 145963 32233
12442 2427 2058 162 24362 26187 2040 33539 6106
13421 2770 2501 87 2539 3498 912 12008 7512
7340 1944 2015 156 29358 36323 - 52664 14098
505 167 167 2 409 473 - 941 394
85045 90578 89430 2513 234332 245661 61724 366587 99118
51726 41353 41341 1459 257300 245127 10952 345098 85429
9004 1297 1188 -223 42579 42730 - 49407 5106
24315 47928 46901 1278 -65547 -42196 50772 -27918 8584

160
绍兴市统计年鉴2020
4-16 规模以上外商和港澳台投资工业企业主要财务指标(2019年)
单位:万元
分 类 Item
企业个数( 个 )
Number ofEnterprises
(unit)
工业总产值现行价Gross
Industrial Output Value
工业增加值(收入法)
Value-added of Industry(Income ethod)
全市总计 Whole Municipality 443 10764811 2725344
总计中:越城区 Yuecheng District 106 1722970 479065
柯桥区 Keqiao District 87 2155561 638308
上虞区 Shangyu District 94 3556129 882499
诸暨市 Zhuji City 62 2262273 468958
嵊州市 Shengzhou City 74 633452 124261
新昌县 Xinchang County 20 434426 132255
按工业行业类别分 Grouped by Economic Sector
农副食品加工业 Manufacturing of Agricultural and Non-staple Foodstuff 3 9033 2974
酒、饮料和精制茶制造业 Manufacturing Industry of beverage, drinking and refiined tea 3 14218 8709
纺织业 Textile Industry 117 2489831 774628
纺织服装、服饰业 Manufacturing Industry of Textile Costumes, Shoes, and Caps 82 561494 135887
木材加工和木、竹、藤、棕、草制品业
Wood Processing and Manufacturing Industry of Wood, Bamboo, Rattan, Palm, and Straw-made Articles
1 2880 393
家具制造业 Cabinetmaking Industry 3 18810 5117
造纸和纸制品业 Papermaking and Paper Product Industry 5 139115 70534
印刷和记录媒介复制业 Printing Industry and Reproduction of Record Media 3 133522 63716
文教、工美、体育和娱乐用品制造业
Manufacturing Industry of Culture, Education and Sports stuff 14 447731 48411

161
工 业
Main Financial Indicators of Foreign Funded Industrial Enterprises and Enterprises Fundedby Entrepreneurs from Hong kong,Macao and Taiwan above Designated Size(2019)
(10 000 yuan)
本年应付职工薪酬WagesPayable
全部职工年均人数
( 人 )Average
Employees(person)
资产总计Total
Assets
流动资产合计
Circulating Funds
固定资产合计TotalFixed
Assets
累计折旧Depre-ciation
负债总计Total
Liabilities
营业收入Operating Income
产成品Products
本年 折旧
Depre-ciation in ThisYear
1015252 111579 14452166 8862263 885433 5332522 2666250 356059 7158397 11694020
238424 27040 2874822 1655368 110830 1296799 739624 81631 1281489 1911706
230696 27020 2509810 1459684 279864 1386595 712096 123949 1290922 1958975
209166 22888 4417562 2970207 263969 1391010 572530 76033 1907306 3623598
205212 15823 2950764 1673379 149034 554548 290481 42657 1762964 3209277
79265 12429 934251 501756 41766 469792 247666 20748 670683 559256
52490 6379 764957 601869 39970 233778 103853 11041 245033 431209
867 164 13133 9421 339 6264 3682 274 3157 8835
2591 243 76934 61582 1661 34414 21043 1155 47290 50788
352623 41417 3087841 1777276 168540 1743144 898535 119199 1803808 2349052
79848 12631 584923 426328 54230 227679 129086 11400 350228 529757
188 27 3787 2925 1066 1176 386 76 3273 2582
3784 538 13994 10760 1480 5775 3129 464 10186 16591
7429 1027 257598 185926 5591 99491 42255 6316 77446 134423
12338 852 84580 51534 10260 54329 23850 5048 36190 126284
25018 3414 511651 361232 168077 46561 24849 2859 174724 384726

162
绍兴市统计年鉴2020
4-16 续表1单位:万元
分 类 Item营业成本Operating
Cost
营业税金及附加
Business Tax and Extra Charges
销售费用Business Expenses
全市总计 Whole Municipality 9800943 57592 194762
总计中:越城区 Yuecheng District 1651241 11060 34175
柯桥区 Keqiao District 1531966 13954 43640
上虞区 Shangyu District 2888380 19489 63412
诸暨市 Zhuji City 2949173 6041 31940
嵊州市 Shengzhou City 457554 4212 11300
新昌县 Xinchang County 322629 2837 10295
按工业行业类别分 Grouped by Economic Sector
农副食品加工业 Manufacturing of Agricultural and Non-staple Foodstuff 6312 62 176
酒、饮料和精制茶制造业 Manufacturing Industry of beverage, drinking and refiined tea 41729 254 3103
纺织业 Textile Industry 1918184 17534 31255
纺织服装、服饰业 Manufacturing Industry of Textile Costumes, Shoes, and Caps 443342 3554 13086
木材加工和木、竹、藤、棕、草制品业
Wood Processing and Manufacturing Industry of Wood, Bamboo, Rattan, Palm, and Straw-made Articles
2188 3 31
家具制造业 Cabinetmaking Industry 13201 140 568
造纸和纸制品业 Papermaking and Paper Product Industry 76936 1298 2641
印刷和记录媒介复制业 Printing Industry and Reproduction of Record Media 75912 999 2218
文教、工美、体育和娱乐用品制造业
Manufacturing Industry of Culture, Education and Sports stuff 328191 1170 21729

163
工 业
Continued 1(10 000 yuan)
管理费用Management
Expenses
财务费用Finance
Expenses
利息支出Interest
Expenditure
利息收入Interest Income
营业利润Operating
Profits
利润总额Total Profits
亏损企业亏损额
Total Loss
利税总额Total Pre-tax Profits
本年应交增值税
Value Added Tax Payable
419762 119582 145488 27927 798561 840053 92720 1276198 378553
91816 20336 27939 6396 83368 93049 54052 153965 49856
97015 27159 31897 7081 177455 187993 2314 272673 70727
105008 17293 25668 3485 403021 406352 10825 540591 114750
57802 25088 29696 8907 78660 89737 4681 208504 112726
45592 24136 23407 663 5358 9575 19012 32777 18990
22529 5571 6881 1395 50699 53347 1836 67688 11504
428 -32 93 68 1562 1600 450 1808 146
2261 135 148 14 3306 3325 34 4368 788
131539 38863 41580 1928 177051 189279 15845 299404 92591
30683 10808 11166 810 18142 18990 8602 42447 19904
109 150 - - 102 102 - 129 24
2054 173 146 22 325 361 - 881 380
4185 299 658 347 46628 51314 - 61392 8780
7417 -622 65 270 36211 36266 - 45253 7988
7257 2347 4096 2821 12713 13067 32 22481 8244

164
绍兴市统计年鉴2020
4-16 续表2
单位:万元
分 类 Item
企业个数( 个 )
Number ofEnterprises
(unit)
工业总产值现行价Gross
Industrial Output Value
工业增加值(收入法)
Value-added of Industry(Income ethod)
石油加工、炼焦和核燃料加工业
Petroleum Processing,Coking and Nuclear Fuel Manufacture 1 8660 -75
化学原料和化学制品制造业 Chemical Feedstock and Chemical Manufacturing Industry 42 2140452 532688
医药制造业 Medicine Manufacturing Industry 10 183105 59538
化学纤维制造业 Chemical Fiber Manufacturing Industry 15 381942 80586
橡胶和塑料制品业 manufacturing industriy of robber and plastic 15 388709 104152
非金属矿物制品业 Non-metallic Minerals Product Industry 5 29019 7213
黑色金属冶炼和压延加工业 Ferrous Metal Smelting and Extrusion 2 208640 15205
有色金属冶炼和压延加工业 Non-ferrous Smelting and Extrusion 4 1430025 218358
金属制品业 Metalwork Industry 12 183238 55368
通用设备制造业 General-purpose Equipment Manufacturing Industry 38 894687 266248
专用设备制造业 Specialized Facility Manufacturing Industry 16 171688 42009
汽车制造业 Manufacturing Industry of Transport and Communication Facilities 8 199303 53648
电气机械和器材制造业 Electric Machinery and Equipment Manufacturing Industry 26 281153 70947
计算机、通信和其他电子设备制造业
Manufacturing Industry of Communication Equipment, Computers and Other Electronic Equipment
11 111084 -9466
仪器仪表制造业 Manufacturing Industry of Instruments and Meters 2 45189 4854
其他制造业 Artwork and Other Manufacturing Industries 1 8438 930
废弃资源综合利用业 Processing of Discarded Resources, and Waste and Cycle 1 60293 19962
电力、热力生产和供应业 Production and Supply of Electric Power and Heat Power 2 218395 89745
水的生产和供应业 Water Production and Supply 1 4159 3064

165
工 业
Continued 2
(10 000 yuan)
本年应付职工薪酬WagesPayable
全部职工年均人数
( 人 )Average
Employees(person)
资产总计Total
Assets
流动资产合计
Circulating Funds
固定资产合计TotalFixed
Assets
累计折旧Depre-ciation
负债总计Total
Liabilities
营业收入Operating Income
产成品Products
本年 折旧
Depre-ciation in ThisYear
53 12 45494 41300 197 2156 819 91 40920 8778
110358 10797 2850842 1918868 178918 855245 391803 51349 1197862 2175735
20111 2377 250367 165221 17773 133449 67222 9707 74494 191268
27293 2712 870359 568011 73783 402704 237822 30838 481582 427891
23065 3001 372216 237869 11541 256445 147586 16550 123017 377858
2647 424 44662 25683 4048 27353 18223 1101 19199 31500
7930 836 171217 93393 8363 109758 47705 3491 101364 212470
85983 3545 1782519 853779 32591 123283 64075 7680 1143625 2564557
23801 2513 306485 167209 15497 124225 39449 16465 129134 180471
107844 11407 1158069 946906 62406 302393 162748 19780 455336 889045
23735 2601 253712 193259 13828 72917 36549 4188 124473 159937
18838 2605 326729 192408 6047 148632 72707 8008 96035 164523
39533 4492 322680 238891 14648 128935 78970 8446 179922 263519
20563 2330 735450 207471 21764 134731 33379 15062 332697 105454
3012 333 36974 29216 5897 11278 4922 704 36447 41203
454 64 4801 2244 312 1880 658 197 4168 7605
5151 527 70624 19126 6576 56072 10330 3381 27567 71512
9055 604 204768 72856 - 210922 98162 11903 80811 212796
1142 86 9757 1567 - 11313 6307 328 3444 4860

166
绍兴市统计年鉴2020
4-16 续表3单位:万元
分 类 Item营业成本Operating
Cost
营业税金及附加
Business Tax and Extra Charges
销售费用Business Expenses
石油加工、炼焦和核燃料加工业
Petroleum Processing,Coking and Nuclear Fuel Manufacture 8757 64 12
化学原料和化学制品制造业 Chemical Feedstock and Chemical Manufacturing Industry 1742543 11986 34328
医药制造业 Medicine Manufacturing Industry 147279 1657 2655
化学纤维制造业 Chemical Fiber Manufacturing Industry 399560 1461 3352
橡胶和塑料制品业 manufacturing industriy of robber and plastic 299503 1991 6433
非金属矿物制品业 Non-metallic Minerals Product Industry 24174 328 2064
黑色金属冶炼和压延加工业 Ferrous Metal Smelting and Extrusion 201734 464 672
有色金属冶炼和压延加工业 Non-ferrous Smelting and Extrusion 2444416 1630 11854
金属制品业 Metalwork Industry 141495 1360 6057
通用设备制造业 General-purpose Equipment Manufacturing Industry 680958 4469 26325
专用设备制造业 Specialized Facility Manufacturing Industry 120888 963 5503
汽车制造业 Manufacturing Industry of Transport and Communication Facilities 115295 1599 8092
电气机械和器材制造业 Electric Machinery and Equipment Manufacturing Industry 209522 2942 7642
计算机、通信和其他电子设备制造业
Manufacturing Industry of Communication Equipment, Computers and Other Electronic Equipment
120800 633 3060
仪器仪表制造业 Manufacturing Industry of Instruments and Meters 31454 118 832
废弃资源综合利用业 Processing of Discarded Resources, and Waste and Cycle 7076 8 -
其他制造业 Artwork and Other Manufacturing Industries 58170 282 1076
电力、热力生产和供应业 Production and Supply of Electric Power and Heat Power 138791 510 -
水的生产和供应业 Water Production and Supply 2535 117 -

167
工 业
Continued 3(10 000 yuan)
管理费用Management
Expenses
财务费用Finance
Expenses
利息支出Interest
Expenditure
利息收入Interest Income
营业利润Operating
Profits
利润总额Total Profits
亏损企业亏损额Total Loss
利税总额Total Pre-tax Profits
本年应交增值税
Value Added Tax Payable
162 - - - -291 -291 291 -222 5
48095 9394 17039 1343 223182 220021 10071 308517 76510
8742 -692 2169 1470 24452 25860 - 30801 3284
8306 18388 17629 457 9765 12616 55 19239 5162
11182 2471 5906 4219 49171 50249 448 65446 13206
2388 597 591 - 1554 2165 370 4058 1565
1989 619 816 283 538 535 - 2962 1963
19016 24828 18905 1704 23282 27818 2078 110477 81029
11510 2507 2511 183 10336 11638 676 15656 2658
48042 1276 8927 8393 100034 104697 1657 136320 27154
18120 1184 2309 472 7484 8726 667 13312 3624
19306 -41 2133 2116 16248 17366 2923 24855 5890
16293 3483 3674 421 14442 14366 2736 23066 5758
10222 845 2262 379 -49400 -41630 45786 -38124 2873
2718 332 309 9 232 125 - 949 707
286 139 140 1 35 50 - 124 66
1193 678 670 41 7223 7220 - 10520 3018
5435 1339 1434 158 62968 62948 - 68546 5089
826 113 113 1 1269 1272 - 1534 146

168
绍兴市统计年鉴2020
4-17 全市大中型工业企业主要财务指标(2019年)
单位:万元
分 类 Item
企业个数( 个 )
Number ofEnterprises
(unit)
工业总产值现行价Gross
Industrial Output Value
工业增加值(收入法)
Value-added of Industry(Income ethod)
全市总计 Whole Municipality 461 32075358 8381763
总计中:越城区 Yuecheng District 73 5020737 1196858
柯桥区 Keqiao District 160 10640555 2834573
上虞区 Shangyu District 89 7586869 2080113
诸暨市 Zhuji City 62 4208142 925482
嵊州市 Shengzhou City 45 1507951 419751
新昌县 Xinchang County 32 3111104 924986
按工业行业类别分 Grouped by Economic Sector
有色金属矿采选业 Nonferrous Metals Mining and Dressing 1 8707 4860
农副食品加工业 Manufacturing of Agricultural and Non-staple Foodstuff 1 20018 3603
食品制造业 Foodstuff Manufacturing Industry 1 15362 3245
酒、饮料和精制茶制造业 Manufacturing Industry of beverage, drinking and refiined tea 4 394237 126924
纺织业 Textile Industry 162 6363302 2189381
纺织服装、服饰业 Manufacturing Industry of Textile Costumes, Shoes, and Caps 26 415609 120089
皮革、毛皮、羽毛及其制品和制鞋业
Manufacturing Industry of Leather, Fur, Feather (Cloth with Soft Nap) and their Products
1 10868 3607
家具制造业 Cabinetmaking Industry 7 399525 119203
造纸和纸制品业 Papermaking and Paper Product Industry 1 73520 57051
印刷和记录媒介复制业 Printing Industry and Reproduction of Record Media 6 276775 104115
文教、工美、体育和娱乐用品制造业
Manufacturing Industry of Culture, Education and Sports stuff 14 814008 191093

169
工 业
Main Financial Indicators of Large andMedium-sized Industrial Enterprises(2019)
(10 000 yuan)
本年应付职工薪酬WagesPayable
全部职工年均人数
( 人 )Average
Employees(person)
资产总计Total
Assets
流动资产合计
Circulating Funds
固定资产合计TotalFixed
Assets
累计折旧Depre-ciation
负债总计Total
Liabilities
营业收入Operating Income
产成品Products
本年 折旧
Depre-ciation in ThisYear
3049785 312692 44678242 22962594 2286663 16593182 7312736 1204376 20643931 32318483
468498 49220 5869787 3004676 372596 2853031 1388197 168639 2494366 5273282
1070140 114645 10603497 4782308 646824 6134441 2470864 528051 6213432 9789796
549719 54175 12739058 6735208 682315 3718475 1524012 245752 5251644 7317547
466356 37086 6048277 3325782 291891 1597366 823223 114477 3309722 5241211
184700 23756 1875947 971568 58472 971264 470742 56740 1043507 1444215
310371 33810 7541676 4143052 234564 1318605 635699 90717 2331260 3252432
3089 392 22135 2824 189 24145 12515 960 8453 9523
2601 385 14937 12145 9875 3982 1516 250 13558 16251
1925 300 18699 1721 - 3368 2118 150 11497 15362
40441 4203 1082031 570297 281366 399487 141143 17820 272188 291629
993675 114367 6868856 3116765 245473 4294851 1729132 367114 4348456 5998026
88874 12466 437400 292330 39222 168738 98341 7686 302527 399744
2903 659 14701 12326 252 3995 2455 191 16682 11019
65595 6252 723493 387895 18852 120179 48005 5400 368953 371450
2380 398 151446 125347 551 33072 10900 1863 9773 71849
28205 2887 253488 175274 14226 120922 54657 9015 142572 264729
81381 8601 1214571 598144 183713 263174 112116 22201 389010 705643

170
绍兴市统计年鉴2020
4-17 续表1
单位:万元
分 类 Item营业成本Operating
Cost
营业税金及附加
Business Tax and Extra Charges
销售费用Business Expenses
全市总计 Whole Municipality 26247117 183232 979710
总计中:越城区 Yuecheng District 4374991 32048 181331
柯桥区 Keqiao District 8102230 56603 155720
上虞区 Shangyu District 5615287 46695 175126
诸暨市 Zhuji City 4731488 14637 98271
嵊州市 Shengzhou City 1089394 9760 85331
新昌县 Xinchang County 2333727 23490 283932
按工业行业类别分 Grouped by Economic Sector
有色金属矿采选业 Nonferrous Metals Mining and Dressing 6728 472 198
农副食品加工业 Manufacturing of Agricultural and Non-staple Foodstuff 14217 24 910
食品制造业 Foodstuff Manufacturing Industry 13258 125 519
酒、饮料和精制茶制造业 Manufacturing Industry of beverage, drinking and refiined tea 173153 11660 46038
纺织业 Textile Industry 4892139 40799 58097
纺织服装、服饰业 Manufacturing Industry of Textile Costumes, Shoes, and Caps 326246 2484 18780
皮革、毛皮、羽毛及其制品和制鞋业
Manufacturing Industry of Leather, Fur, Feather (Cloth with Soft Nap) and their Products
9242 140 170
家具制造业 Cabinetmaking Industry 261870 3110 26525
造纸和纸制品业 Papermaking and Paper Product Industry 21556 1025 177
印刷和记录媒介复制业 Printing Industry and Reproduction of Record Media 177540 1872 9876
文教、工美、体育和娱乐用品制造业
Manufacturing Industry of Culture, Education and Sports stuff 570025 3877 26985

171
工 业
Continued 1
(10 000 yuan)
管理费用Management
Expenses
财务费用Finance
Expenses
利息支出Interest
Expenditure
利息收入Interest Income
营业利润Operating
Profits
利润总额Total Profits
亏损企业亏损额
Total Loss
利税总额Total Pre-tax Profits
本年应交增值税
Value Added Tax Payable
1093693 302903 438451 162394 2984396 3119459 175570 4367273 1064582
137812 35207 47678 18140 418267 449975 56718 630914 148892
362982 140073 162706 30869 740689 770095 35320 1165185 338486
262933 51390 93560 53771 1008024 1021880 68314 1320314 251739
128651 44850 58912 16503 187734 203406 3954 358127 140085
79568 20814 24579 5104 122694 150343 11265 214671 54569
121748 10569 51017 38006 506989 523760 - 678062 130812
2316 363 358 8 -553 -570 570 754 852
368 251 251 - 557 557 - 740 159
296 347 347 1 528 528 - 1134 482
15743 3371 4760 1265 47078 47836 - 74864 15368
291866 103559 108025 9351 427300 469695 24663 797380 286886
32373 5956 5764 631 6230 8724 5883 23455 12247
563 652 663 1 -183 -77 77 526 463
25438 7127 8779 2044 51413 56111 612 69495 10273
1836 12 - - 44972 49267 - 57102 6811
17716 396 500 397 49324 51083 444 66390 13435
25606 8448 8848 3544 56898 59069 1455 84660 21714

172
绍兴市统计年鉴2020
4-17 续表2
单位:万元
分 类 Item
企业个数( 个 )
Number ofEnterprises
(unit)
工业总产值现行价Gross
Industrial Output Value
工业增加值(收入法)
Value-added of Industry(Income ethod)
化学原料和化学制品制造业 Chemical Feedstock and Chemical Manufacturing Industry 30 4207313 1212387
医药制造业 Medicine Manufacturing Industry 21 2033580 608425
化学纤维制造业 Chemical Fiber Manufacturing Industry 13 3405597 470525
橡胶和塑料制品业 manufacturing industriy of robber and plastic 12 1004803 243431
非金属矿物制品业 Non-metallic Minerals Product Industry 7 492944 115833
黑色金属冶炼和压延加工业 Ferrous Metal Smelting and Extrusion 2 235935 17873
有色金属冶炼和压延加工业 Non-ferrous Smelting and Extrusion 5 1313302 206625
金属制品业 Metalwork Industry 9 372186 93592
通用设备制造业 General-purpose Equipment Manufacturing Industry 46 2115777 612699
专用设备制造业 Specialized Facility Manufacturing Industry 14 1120554 325652
汽车制造业 Manufacturing Industry of Transport and Communication Facilities 8 697455 185773
铁路、船舶、航空航天和其他运输设备制造业
Manufacturing Industry of railway, shipping, spackflight and other transiport equipments
2 139791 47552
电气机械和器材制造业 Electric Machinery and Equipment Manufacturing Industry 39 3080162 635274
计算机、通信和其他电子设备制造业
Manufacturing Industry of Communication Equipment, Computers and Other Electronic Equipment
10 675258 171663
其他制造业 Artwork and Other Manufacturing Industries 3 68331 18594
废弃资源综合利用业 Processing of Discarded Resources, and Waste and Cycle 1 60293 19962
电力、热力生产和供应业 Production and Supply of Electric Power and Heat Power 9 1996581 411230
燃气生产和供应业 Gas Generation and Supply 1 122233 15436
水的生产和供应业 Water Production and Supply 5 141333 46065

173
工 业
Continued 2
本年应付职工薪酬WagesPayable
全部职工年均人数
( 人 )Average
Employees(person)
资产总计Total
Assets
流动资产合计
Circulating Funds
固定资产合计TotalFixed
Assets
累计折旧Depre-ciation
负债总计Total
Liabilities
营业收入Operating Income
产成品Products
本年 折旧
Depre-ciation in ThisYear
221425 18993 7051453 3847727 310415 1931411 844695 119768 2807030 4228940
185213 17292 4994347 2998666 183287 1294705 544412 86910 1306718 1974684
124913 11613 2115044 1096488 170770 1425735 625070 117783 1347570 3244370
62127 7268 1054719 581534 45903 345626 195600 21025 322196 999575
29918 3285 561484 243424 38408 157207 61387 12973 257907 467610
9922 1014 268386 145334 12362 121513 58777 3719 120301 254194
99658 4626 1833652 869153 42707 135812 62906 14948 1124405 2346123
43878 4261 413686 239585 28170 151970 64855 26808 194307 270626
281734 28421 3322137 2006753 186644 895656 419927 66797 1377170 2093201
128461 8237 2355494 1691578 148173 261909 103510 15778 1179734 1184053
70941 8182 1400335 677945 68627 366380 168702 27312 571699 748613
20497 2420 188450 92351 4807 86847 34802 7565 118128 135816
246199 26877 3933658 1900129 164327 729991 290076 46016 1765041 3165222
93878 11434 1917101 699642 73110 432736 156297 35185 835600 669651
9724 1439 47337 33616 6458 15190 6471 877 36469 67668
5151 527 70624 19126 6576 56072 10330 3381 27567 71512
75187 3411 1476071 366456 - 1900113 943049 122892 720562 1960547
3567 272 66906 10825 - 84776 43514 5800 42397 126088
26326 2210 805604 147197 2203 763623 465457 36191 605465 154767
(10 000 yuan)

174
绍兴市统计年鉴2020
4-17 续表3单位:万元
分 类 Item营业成本Operating
Cost
营业税金及附加
Business Tax and Extra Charges
销售费用Business Expenses
化学原料和化学制品制造业 Chemical Feedstock and Chemical Manufacturing Industry 3244804 24186 57020
医药制造业 Medicine Manufacturing Industry 1233026 17760 322545
化学纤维制造业 Chemical Fiber Manufacturing Industry 2974490 6971 28455
橡胶和塑料制品业 Manufacturing Industriy of Robber and Plastic 787546 5399 29778
非金属矿物制品业 Non-metallic Minerals Product Industry 356757 2523 28071
黑色金属冶炼和压延加工业 Ferrous Metal Smelting and Extrusion 244174 532 1528
有色金属冶炼和压延加工业 Non-ferrous Smelting and Extrusion 2232868 1938 12392
金属制品业 Metalwork Industry 219627 2048 9918
通用设备制造业 General-purpose Equipment Manufacturing Industry 1631723 12928 97597
专用设备制造业 Specialized Facility Manufacturing Industry 944021 5742 26800
汽车制造业 Manufacturing Industry of Transport and Communication Facilities 593777 4366 25080
铁路、船舶、航空航天和其他运输设备制造业
Manufacturing Industry of railway, shipping, spackflight and other transiport equipments
109403 1470 2096
电气机械和器材制造业 Electric Machinery and Equipment Manufacturing Industry 2558001 16984 127343
计算机、通信和其他电子设备制造业
Manufacturing Industry of Communication Equipment, Computers and Other Electronic Equipment
552074 4745 12016
其他制造业 Artwork and Other Manufacturing Industries 57532 255 1513
废弃资源综合利用业 Processing of Discarded Resources, and Waste and Cycle 58170 282 1076
电力、热力生产和供应业 Production and Supply of Electric Power and Heat Power 1727827 5958 185
燃气生产和供应业 Gas Generation and Supply 117615 275 264
水的生产和供应业 Water Production and Supply 137711 3284 7759

175
工 业
Continued 3(10 000 yuan)
管理费用Management
Expenses
财务费用Finance
Expenses
利息支出Interest
Expenditure
利息收入Interest Income
营业利润Operating
Profits
利润总额Total Profits
亏损企业亏损额
Total Loss
利税总额Total Pre-tax Profits
本年应交增值税
Value Added Tax Payable
100155 26355 52717 42183 650114 649594 - 848085 174304
96028 1982 32068 29268 291299 293902 30006 413244 101582
22210 12533 29616 13582 160305 164264 - 223524 52289
25761 3111 10393 7711 130077 133198 - 171040 32443
14178 1837 1654 1102 62494 62816 - 82974 17635
3367 -3686 428 279 -228 73 14 3413 2809
23500 25301 17337 1912 14540 20256 1041 82201 60007
15469 519 1670 1061 -20487 -19327 35188 -13400 3879
108246 7996 23249 16846 182796 197821 2424 274014 63265
46273 9263 14850 5592 158727 167516 2288 202013 28754
38941 10161 15010 4862 63672 68306 - 99429 26757
6159 2291 3212 1248 10050 10438 - 21115 9207
94795 25033 40507 12609 370736 397813 3717 472403 57607
35031 192 8611 5480 74728 87704 44845 109143 16693
4412 884 684 45 1217 1326 398 4092 2511
1193 678 670 41 7223 7220 - 10520 3018
29178 27272 27350 746 163863 151265 - 195647 38424
2807 130 117 12 4997 4999 - 6113 840
11873 20570 20012 573 -25290 -21948 21948 -14794 3869

176
绍兴市统计年鉴2020
4-18 全市规模以上工业企业分行业主要能源消费量(2019年)
行 业 Item
综合能耗( 吨标准煤 )Total Energy Consumption(Ton standard
coal)
总计 Total 11654784
黑色金属矿采选业 Ferrous Metals Mining and Dressing 1272
有色金属矿采选业 Nonferrous Metals Mining and Dressing 2435
非金属矿采选业 Nonmetal Minerals Mining and Dressing 3722
农副食品加工业 Manufacturing of Foodstuff and Non-Staple Foodstuff 18893
食品制造业 Foodstuff Manufacturing 6400
酒、饮料和精制茶制造业 Manufacturing Industry of beverage, drinking and refiined tea 44632
纺织业 Textile 5362561
纺织服装、服饰业 Manufacturing Industry of Textile Costumes, Shoes, and Caps 93417
皮革、毛皮、羽毛及其制品和制鞋业 Manufacturing Industry of Leather, Fur, Feather (Cloth with Soft Nap) and their Products 14766
木材加工及竹、藤、棕、草制品业 Wood Processing and Manufacturing of Wood, Bamboo, Rattan, Palm, and Straw-made Articles 2219
家具制造业 Cabinetmaking 8120
造纸及纸制品业 Papermaking and Paper Product 181797
印刷和记录媒介复制业 Printing Industry and Reproduction of Record Media 42958
文教、工美、体育和娱乐用品制造业 Manufacturing Industry of Culture, Education and Sports stuff 88562
石油加工、炼焦及核燃料加工 Petroleum Processing, Coking and Nuclear Fuel Manufacture 107
化学原料及化学制品制造业 Chemical Feedstock and Chemical Manufacture 1179110
医药制造业 Medicine Manufacturing 286059
化学纤维制造业 Chemical Fiber Manufacturing 886414
橡胶和塑料制品业 Manufacturing Industriy of Robber and Plastic 262172
非金属矿物制品业 Non-metallic Minerals Product 483658
黑色金属冶炼及压延加工业 Ferrous Metal Smelting and Extrusion 90644
有色金属冶炼及压延加工业 Non-ferrous Smelting and Extrusion 126422
金属制品业 Metalwork 83042
通用设备制造业 General-purpose Equipment Manufacturing 155155
专用设备制造业 Specialized Facility Manufacturing 88748
汽车制造业 Automotive Manufacturing 95834
铁路、船舶、航空航天和其他运输设备制造业
Manufacturing Industry of railway, shipping, spackflight and other transiport equipments 36451
电气机械及器材制造业 Electric Machinery and Equipment Manufacturing 91546
计算机、通信和其他电子设备制造业 Manufacturing Industry of Communication Equipment, Computers and Other Electronic Equipment 37984
仪器仪表制造业 Manufacturing Industry of Instruments and Meters 1977
其他制造业 Artwork and Other Manufacturing Industries 6475
废弃资源综合利用业 Processing of Discarded Resources, and Waste and cycle 72030
金属制品、机械和设备修理业 Metal Products,Machinery and Equipment Repair Industry 208
电力、热力的生产和供应业 Production and Supply of Electric Power and Heat Power 1740278
燃气生产和供应业 Gas Generation and Supply 496
水的生产和供应业 Water Production and Supply 58219
注:能源统计数据为快报数。

177
工 业
Main Resources Consumption ofabove Designated Size Industrial Enterprises by Sector(2019)
万元产值能耗 ( 吨标
准煤 / 万元 )Energy
Consumption per 10 000
RMB Output
原 煤( 吨 )Coal(ton)
热 力( 百万千焦 )
Heat(million kilo-
joule)
电 力( 万千瓦时 )Electricity
(10 000 kwh)
汽 油( 吨 )
Gasoline(ton)
柴 油( 吨 )
Diesel Oil(ton)
燃料油( 吨 )
Fuel Oil(ton)
天然气( 万立方米 )Natural Gas
(10000 cu.m)
0.1658 10551355 123950953 2553636 24086 43443 9933 173401
0.1318 - - 1019 1 24 - -
0.1708 - - 1983 17 18 - 17
0.0622 - - 1503 - 1287 - -
0.0481 156 239928 5772 185 256 - 148
0.0636 - 27039 1232 44 136 - 319
0.0664 63 173738 7399 406 263 - 2450
0.4724 201776 92830520 753509 2372 2471 - 90723
0.0343 3 471219 45579 2748 692 - 1345
0.0945 - 257858 4110 68 24 - 40
0.0470 - 30510 927 14 22 - -
0.0144 35 - 5945 143 95 - 80
0.2884 548 4107583 30231 500 868 - 193
0.0803 - 431125 11254 311 300 - 561
0.0529 - 558784 34626 303 242 - 1858
0.0053 - - 75 2 - - -
0.1507 159603 15995510 259414 780 1560 - 13761
0.1051 - 4427184 84375 896 1020 4239 1905
0.1575 694060 2111855 374885 437 901 - 2104
0.1042 49179 283609 113944 3311 459 576 4701
0.1716 261233 221721 93900 364 21579 5093 2572
0.0890 331 248247 41793 70 98 - 2230
0.0297 448 147362 72658 304 405 6 2554
0.0524 - 156955 42537 929 646 - 1428
0.0313 2192 170549 104232 3217 3417 20 1030
0.0324 73 146279 34149 1705 1054 - 2950
0.0704 - 4586 44386 770 834 - 2893
0.1911 - - 5985 7 137 - 2138
0.0177 4 110732 62117 2051 1253 - 778
0.0332 - 35951 24800 595 382 - 487
0.0107 - - 1348 163 47 - 18
0.0206 - 14515 4172 241 141 - 75
0.1338 69229 - 16188 2 230 - 176
0.0330 - - 195 - - - -
0.3414 9109073 747597 221887 997 2438 - 33609
0.0005 - - 374 63 - - -
0.1684 3350 - 45136 71 145 - 260
Note: The statistics of energy is preliminary data.

178
绍兴市统计年鉴2020
4-19 分区、县(市)规模以上工业企业能源综合利用及水消费情况(2019年)
单位:吨标准煤
指 标 Item全 市Whole
Municipality
综合能耗 Total Energy Consumption 11654784
万元产值能耗 ( 每一万元产值耗能 ) Energy Consumption per 10 000 RMB Output 0.1658
节能率 ±% The Rate of Saved Energy 4.4
消费量 Consumption 18040192
# 工业生产消费 Industry Production Consumption 17966909
非工业生产消费 Non-industrial Production Consumption 73283
主要能源消费量 ( 吨 ) Consumption of Main Energy (ton)
原煤 Coal 10551355
天然气 ( 万立方米 ) Natural Gas (10 000 cu.m) 173401
汽油 Gasoline 24086
煤油 Kerosene 966
柴油 Diesel Oil 43443
燃料油 Fuel Oil 9933
液化石油气 Liquefied Petroleum Gas 4968
热力 ( 百万千焦 ) Heat (million kilo-joule) 123950953
电力 ( 万千瓦时 ) Electricity (10 000 kwh) 2553636
水资源消费量 ( 万立方米 ) Water Consumption (10 000 cu.m)
取水总量 Total Water 99329
地表淡水 Surface Fresh Water 71674
地下淡水 Ground Fresh Water 173
自来水 Tap Water 26161
其他水 Other Water 946
重复用水量 Repeat Water Consumption 207638

179
工 业
Energy Comprehensive Utilization and Water Consumption of above Designated Size Industrial Enterprises(2019)
(Ton standard coal)
越城区Yuecheng
District
柯桥区KeqiaoDistrict
上虞区ShangyuDistrict
诸暨市ZhujiCity
嵊州市Shengzhou
City
新昌县XinchangCounty
1968721 6208378 1704202 1022194 429173 322116
0.1553 0.3030 0.1077 0.0885 0.0883 0.0657
3.4 4.5 6.7 6.1 1.3 7.3
2663532 10262230 2661273 1300100 764716 388341
2658009 10241405 2647181 1280398 752820 387096
5523 20826 14092 19702 11895 1245
1368558 6713273 1133795 685390 503291 147048
29492 75778 46046 13939 1858 6288
1916 5452 3441 7476 3585 2216
27 23 20 202 14 680
6903 10221 5858 8399 6686 5375
5093 576 4104 20 6 135
393 2905 298 145 681 546
15192526 82213169 18615080 1915411 5131983 882784
472598 1095082 414547 339554 123283 108573
28783 31269 15644 11732 6944 4958
26082 15401 10610 10326 5334 3921
3 76 1 55 21 18
2570 14866 4798 1319 1589 1018
60 716 169 - - -
28942 104579 62959 4262 4617 2279

180
绍兴市统计年鉴2020
4-20 规模以上工业企业分行业分地区取水量(2019年)
单位:立方米
指 标 Item全 市Whole
Municipality
总 计 Total 993291006
黑色金属矿采选业 Ferrous Metals Mining and Dressing 385249
有色金属矿采选业 Nonferrous Metals Mining and Dressing 151298
非金属矿采选业 Nonmetal Minerals Mining and Dressing 98357
农副食品加工业 Manufacturing of Foodstuff and Non-Staple Foodstuff 669097
食品制造业 Foodstuff Manufacturing 1092321
酒、饮料和精制茶制造业 Manufacturing Industry of beverage, drinking and refiined tea 2810586
纺织业 Textile 203935061
纺织服装、服饰业 Manufacturing Industry of Textile Costumes, Shoes, and Caps 4756701
皮革、毛皮、羽毛及其制品和制鞋业 Manufacturing Industry of Leather, Fur, Feather (Cloth with Soft Nap) and their Products 498246
木材加工及竹、藤、棕、草制品业 Wood Processing and Manufacturing of Wood, Bamboo, Rattan, Palm, and Straw-made Articles 66794
家具制造业 Cabinetmaking 804271
造纸及纸制品业 Papermaking and Paper Product 4353160
印刷和记录媒介复制业 Printing Industry and Reproduction of Record Media 1079210
文教、工美、体育和娱乐用品制造业 Manufacturing Industry of Culture, Education and Sports stuff 3419064
石油加工、炼焦及核燃料加工 Petroleum Processing, Coking and Nuclear Fuel Manufacture 12118
化学原料及化学制品制造业 Chemical Feedstock and Chemical Manufacture 34258613
医药制造业 Medicine Manufacturing 10042193
化学纤维制造业 Chemical Fiber Manufacturing 13038579
橡胶和塑料制品业 Manufacturing Industriy of Robber and Plastic 8915747
非金属矿物制品业 Non-metallic Minerals Product 6050666
黑色金属冶炼及压延加工业 Ferrous Metal Smelting and Extrusion 1177172
有色金属冶炼及压延加工业 Non-ferrous Smelting and Extrusion 2186534
金属制品业 Metalwork 2552002
通用设备制造业 General-purpose Equipment Manufacturing 6583050
专用设备制造业 Specialized Facility Manufacturing 4147808
汽车制造业 Automotive Manufacturing 2099605
铁路、船舶、航空航天和其他运输设备制造业
Manufacturing Industry of railway, shipping, spackflight and other transiport equipments 728523
电气机械及器材制造业 Electric Machinery and Equipment Manufacturing 4699840
计算机、通信和其他电子设备制造业 Manufacturing Industry of Communication Equipment, Computers and Other Electronic Equipment 3423082
仪器仪表制造业 Manufacturing Industry of Instruments and Meters 112454
其他制造业 Artwork and Other Manufacturing Industries 422729
废弃资源综合利用业 Processing of Discarded Resources, and Waste and cycle 943284
金属制品、机械和设备修理业 Metal Products,Machinery and Equipment Repair Industry 11505
电力、热力的生产和供应业 Production and Supply of Electric Power and Heat Power 71761935
燃气生产和供应业 Gas Generation and Supply 38559
水的生产和供应业 Water Production and Supply 595965593

181
工 业
Water Withdrawals of above Designated Size Industrial Enterprises by Sector (2019)
(cubic meter)
越城区Yuecheng
District
柯桥区KeqiaoDistrict
上虞区ShangyuDistrict
诸暨市ZhujiCity
嵊州市Shengzhou
City
新昌县XinchangCounty
287828246 312694353 156436123 117315056 69439507 49577721
- 385249 - - - -
- 37443 - 113855 - -
2748 - 2637 21959 71013 -
244303 223792 145667 51736 3599 -
10058 77093 22280 6874 74520 901496
1188396 1168925 331029 40677 72759 8800
29010285 143438383 13472978 7023534 10256514 733367
534537 269881 457605 1835969 1610633 48076
185182 218050 19997 34010 41007 -
17889 8212 1050 21439 18204 -
345174 70742 239890 11399 137066 -
721802 809180 250886 46863 2524429 -
74264 455612 460737 27707 34465 26425
124299 2937493 167085 77836 25182 87169
- - 7076 5042 - -
5725812 8580298 19398179 325814 220063 8447
1610803 812771 4081790 75473 463555 2997801
1813939 9345107 50907 1828627 - -
782622 1388303 953871 305986 5204096 280869
1707051 1076389 1013158 1769289 340500 144279
20936 477673 358154 160933 159476 -
147237 508892 896850 467681 132821 33053
189740 405063 1275463 478526 110794 92415
193910 366883 787725 1916103 1075749 2242680
199432 1631327 201767 1655451 155256 304576
66020 214394 359491 640121 140842 678737
3126 - 4054 9343 3314 708687
1762873 180882 1323074 544176 847676 41159
458568 147473 98731 39563 756011 1922736
46991 15861 39475 5155 1482 3490
11159 - 411500 70 - -
843835 96406 - 3043 - -
- - - 11505 - -
7934955 47964959 9466919 3210678 2741682 442742
17384 4707 2366 6378 - 7724
231832917 89376910 100133732 94542243 42216798 37862993

182
绍兴市统计年鉴2020
4-21 历年能源消费主要指标Main Indicators of Resource Consumption Enterprises over the Years
年 份(地区)
Year(Area)
万元 GDP能耗降低率
(%)Energy
Consumption Reduction
Rate of 10,000 Yuan GDP(%)
规上工业能源消费量
原 煤(吨)Coal(ton)
热 力(百万千焦)
Heat(million kilo-
joule)
电 力(万千瓦时)
Electricity(10 000 kwh)
天然气(万立方米)Natural Gas
(10 000 cu.m)
年 份 Year
2010 3.1 10907863 77618589 1975179 10774
2011 4.6 10856910 82282530 2059863 10463
2012 6.3 9996051 85486712 2141953 16431
2013 4.1 11039412 88226461 2267118 31700
2014 5.3 10520038 88226351 2315280 55841
2015 3.9 10085907 94977204 2412778 93269
2016 4.4 9537949 109484966 2387407 133358
2017 1.6 10219537 119075376 2477592 143188
2018 5.4 10182916 120305389 2456317 161762
2019 4.9 10551355 123950953 2553636 173401
分县(市、区) Grouped by Area
越城区 Yuecheng District 4.7 1368558 15192526 472598 29492
柯桥区 Keqiao District 4.8 6713273 82213169 1095082 75778
上虞区 Shangyu District 5.8 1133795 18615080 414547 46046
诸暨市 Zhuji City 5.9 685390 1915411 339554 13939
嵊州市 Shengzhou City 3.8 503291 5131983 123283 1858
新昌县 Xinchang County 4.9 147048 882784 108573 6288

183
工 业
主要统计指标解释
工业 指从事自然资源的开采,对采掘品和农产品进行加工和再加工的物质生产部门。具体包括:(1) 采矿业;
(2) 制造业;(3) 电力、燃气及水的生产和供应业。
轻工业 指主要提供生活消费品和制作手工工具的工业。按其所使用的原料不同,可分为两大类:(1) 以农
产品为原料的轻工业,是指直接或间接以农产品为基本原料的轻工业。主要包括食品制造、饮料制造、烟草加工、
纺织、缝纫、皮革和毛皮制作、造纸以及印刷等工业;(2) 以非农产品为原料的轻工业,是指以工业品为原料的轻
工业。主要包括文教体育用品、化学药品制造、合成纤维制造、日用化学制品、日用玻璃制品、日用金属制品、手工
工具制造、医疗器械制造、文化和办公用机械制造等工业。
重工业 是指为国民经济各部门提供物质技术基础的主要生产资料的工业。按其生产性质和产品用途,
可以分为下列三类:(1) 采掘工业,是指对自然资源的开采,包括石油开采、煤炭开采、金属矿开采、非金属矿开采
等工业;(2) 原材料工业,指向国民经济各部门提供基本材料、动力和燃料的工业。包括金属冶炼及加工、炼焦及
焦炭、化学、化工原料、水泥、人造板以及电力、石油和煤炭加工等工业;(3) 加工工业,是指对工业原材料进行再加
工制造的工业。包括装备国民经济各部门的机械设备制造工业、金属结构、水泥制品等工业,以及为农业提供
的生产资料如化肥、农药等工业。
工业总产值 是以货币形式表现的,工业企业在一定时期内生产的工业最终产品或提供工业性劳务活动
的总价值量,是反映一定时期内工业生产总规模和总水平的价值量指标,是计算工业增加值的基础指标。工业
总产值包括本企业报告期内生产的不再进行加工,经检验包装入库 ( 规定不需要包装的产品除外 ) 的成品价值、
对外加工费收入和自制半成品在产品期末期初差额价值。
工业销售产值 是以货币形式表现的,工业企业在报告期内销售的本企业生产的工业产品或提供工业性
劳务活动的价值总量,是反映一定时期内工业企业产品销售总规模和总水平的重要指标。工业销售产值包括
本企业报告期内销售的成品价值和对外加工费收入。
主营业务收入 工业企业主营业务收入主要包括销售产品、自制半成品、代制品、代修品、提供工业性劳务
及让渡资产使用权等日常性活动所取得的收入。
利润总额 是指企业一定时期的最终经营成果,是企业在一定时期内实现的盈亏相抵后的利润总额 ( 亏损
以“-”号表示 ) 它等于营业利润加上补贴收入、投资收益、营业外净收入、以前年度损益调整。
利税总额 是指企业产品销售税金及附加、应交增值税和利润总额之和。
资产总计 是指企业拥有或控制的能以货币计量的经济资源,包括各种财产、债权和其他权利。资产按其
流动性可分为流动资产、长期投资、固定资产、无形资产、递延资产和其他资产。
负债总计 是指企业资产总额中属于债权人的那部分权益,是企业所承担的能以货币计量,将以资产或劳
务偿付的债务。负债一般按偿还期长短分为流动负债和长期负债。
资产负债率 反映企业经营风险的大小和企业利用债权人提供的资金从事经营活动的能力。
资产负债率 (%)= 负债总额 / 资产总额×100%
全员劳动生产率 是工业企业平均每个职工在单位时间内创造的工业生产最终成果,反映企业的生产效

184
绍兴市统计年鉴2020
率和劳动投入的经济效益。
全员劳动生产率 ( 元 /人 )=工业增加值 / 全部从业人员平均人数
产品销售率 是反映工业产品已实现销售的程度,是分析工业产销衔接状况、研究工业产品满足社会需求
程度的指标。
产品销售率 (%)=工业销售产值 / 工业总产值 ( 现价 )×100%
独资企业 包括国有企业、集体企业、私营独资企业、港澳台商独资经营企业、外商独资经营企业。
合作合伙企业 包括股份合作企业、国有联营企业、集体联营企业、国有与集体联营企业、私营合伙企业、内
地与港澳台合作经营企业、中外合作经营企业、其他企业 ( 内资 )。
股份有限公司 包括股份有限公司 ( 内资 )、私营股份有限公司、港澳台商投资股份有限公司、外商投资股份
有限公司。
有限责任公司 包括国有独资公司、私营有限责任公司、内地与港澳台合资经营企业、中外合资经营企业、
其他有限责任公司。

185
工 业
Explanatory Notes on Main Statistical Indicators
Industry refers to the material production sector which is engaged in extraction of natural resources
and processing and reprocessing of minerals and agricultural products, including (1) Mining and Quarrying (2)
Manufacturing (3) Production and Supply of Electric Power, Gas and Water.
Light Industry refers to the industry that produces consumer goods and hand tools. It consists of
two categories, depending on the materials used:
(1) Industries using farm products as raw materials. These are branches of light industry which directly or
indirectly use farm products as basic raw materials, including the manufacture of food and beverages, tobacco
processing, textile, clothing, fur and leather manufacturing, paper making, printing, etc.
(2) Industries using non farm products as raw materials. These are branches of light industry which use
manufactured goods as raw materials, including the manufacture of cultural, educational articles and sports
goods, chemicals, synthetic fiber, chemical products for daily use, glass products for daily use, metal products
for daily use, hand tools, medical apparatus and instruments, and the manufacture of cultural and clerical
machinery.
Heavy Industry refers to the industry, which produces capital goods, and provides various sectors of
the national economy with necessary material and technical basis. It consists of the following three branches
according to the purpose of production or the use of products:
(1) Mining, quarrying and logging industry refers to the industry that extracts natural resources,
including extraction of petroleum, coal, metal and non-metal ores and logging.
(2) Raw materials industry refers to the industry that provides various sectors of the national economy
with raw materials, fuels and power. It includes smelting and processing of metals, coking and coke chemistry,
chemical materials and building materials such as cement, plywood, and power, petroleum refining and coal
dressing.
(3) Manufacturing industry refers to the industry that processes raw materials. It includes machine-
building industry, which equips sectors of the national economy, industries of metal structure and cement
products, industries producing means of agricultural production, such as chemical fertilizers and pesticides.
According to the above principle of classification, the repairing trades, which are engaged primarily in
repairing products of heavy industry, are classified into heavy industry while these engaged in repairing
products of light industry are classified into light industry.
Gross Industrial Output Value refers to the total volume of final industrial products and
industrial services provided during a given period. It reflects the total achievements and overall scale of
industrial production during a given period. It’s the basic of calculating value-added of industry. It includes
the value of the finished products, which are not to be further processed in the enterprises and have been
inspected, packed and put in storage, the value of industrial services rendered to other units, and the changes
in the value of the semi-finished products and products in process between the beginning and closing of the

186
绍兴市统计年鉴2020
period.
Industrial Sales Output Value refers to the total volume of industrial products sold and
industrial services provided by an industrial enterprise during a given period and in the form of currency.
It reflects the total achievements and overall scale of the sales of industrial production sale during a given
period. Industrial Sales Output Value consists of the value of the finished products during the reference period
and the income from external processing.
Revenue on Main Business The revenue on main business of industrial enterprises mainly
include incomes from sales product, self manufactured semi-product, alternate product, repaired product,
industrial labor service, transfer of transition assets right of use, and other regular activities.
Total Profits refers to the final achievements of production and operation of the enterprises,
represented by the total profits after deducting losses (loss is expressed by the negative figure).It is the sum
of profits from operation, income from subsidies, investment earnings, net income from activities other than
operation, and adjustment of profits an losses of previous years.
Total pre-tax Profits refers to the total sum of profits, products sales tax and surcharges and the
value added tax payable of industrial enterprises.
Total Assets refers to all economic resources, owned or controlled by enterprises, which could be
measured in monetary terms, including properties, creditors equity and other economic rights of all forms.
Classified by the degree of equitability, total assets include circulating assets, long-term investment, fixed
assets, intangible assets and deferred assets, and other assets.
Total Liabilities refers to the rights and interests belong to creditor in enterprise’s total assets, it’s
the debts, measured in monetary terms, which enterprises are responsible for repayment in the form of cash,
assets or labor. Classified by terms of repayment, liabilities include liquid liabilities and long-term liabilities.
Ratio of Debts to Assets reflect both the operation risk and the capability of the enterprise in
making use of the capital from the creditors. It is calculated as follows:
Ratio of debts to assets (%) = (Total debts / total assets)×100%
Overall Labor Productivity of Industrial Enterprises refers to the average output per
employed person in industrial enterprises. Reflects efficiency of production and economic results labor input
of enterprises.
Overall Labor Productivity=(Value-added of Industry) / (Average Number of Staff and Workers)
Ratio of Sales to Gross Output Value refers to the sales of industrial products to the
gross industrial output value during the reference period, and is important in reflecting the linkage between
production and sales and the extent of the needs of the society that has been met by the supply of industrial
products.
Ratio of Sales to Gross Output Value=[Industrial sales / Gross industrial output value (at current prices)]
×100%
Sole-owned Enterprises includes state-owned enterprises, collective-owned enterprises,

187
工 业
private-funded enterprises, sole investment from Hong Kong, Macao and Taiwan, enterprises with sole foreign
investment.
Cooperation and Partnership includes share-holding cooperative enterprises, state joint
ownership enterprises, collective joint ownership enterprises, joint state-collective ownership enterprises,
private partnership enterprises, cooperative enterprises with investment from Hong Kong, Macao and Taiwan,
Cooperative enterprises with foreign investment, other enterprises.
Share-holding Corporations Ltd. includes Share-holding Corporations Ltd., Private Shareholding
Corporations Ltd., Share-holding Corporations Ltd. with Investment from Hong Kong, Macao and Taiwan,
Share-holding Corporations Ltd. with Foreign Investment.
Limited Liability Corporations includes sole state-funded corporations, private limited liability
corporations, joint-venture enterprises with investment from Hong Kong, Macao and Taiwan, joint-venture
enterprises with foreign investment, other limited liability corporations.


交通、邮电及电力5 CHAPTER 5 TRANSPORTATION, POST AND TELECOMMUNICATIONS, ELECTRICITY

190
绍兴市统计年鉴2020
全社会客货运输情况Total Passenger and Freight Traffic
0
3000
6000
9000
12000
15000
18000
21000
客运量 2302 4162 4134 9574 11753 14202 17398 10020 3081 2926 2905 2108
货运量 844 1142 2517 6531 6470 9559 8931 12271 12447 13426 14161 15277
1980 1985 1990 1995 2000 2005 2010 2015 2016 2017 2018 2019
单位:万人次、万吨(10 000 persons, 10 000 tons)
年末公路通车里程情况Length of Highways (Year-end)
10222
19052365
29163307
3893
4398
9281
9959 10068 10136 10137
0
1000
2000
3000
4000
5000
6000
7000
8000
9000
10000
11000
1980 1985 1990 1995 2000 2005 2010 2015 2016 2017 2018 2019
单位:公里 (km)

191
交通、邮电及电力
0
100
200
300
400
500
600
700 电 话 用 户 数Number of Telephone Subscribers
固定电话 0.65 1.16 3.47 23.80 96.02 221.39 201.80 144.09 127.48 116.93 106.79 116.95
移动电话 0 0 0 2.14 52.74 243.91 436.45 537.26 559.34 578.59 596.81 587.98
1980 1985 1990 1995 2000 2005 2010 2015 2016 2017 2018 2019
单位:万户(10 000 subscribers)
注:2008年起移动电话用户数口径变为通话用户数。
Note: From 2008, the number of callers was applied instead of the number of mobile phone users caliber.
0
50
100
150
200
250
300
350
400
450
500
全社会用电量 6.32 10.54 19.89 42.42 77.67 185.52 295.68 366.25 374.51 411.55 437.72 462.37
工业用电量 5.02 8.46 15.51 34.01 63.29 158.62 245.27 293.97 291.98 321.47 338.14 356.30
1980 1985 1990 1995 2000 2005 2010 2015 2016 2017 2018 2019
全 社 会 用 电 情 况Electricity Consumption
单位:亿千瓦时(100 million kwh)

192
绍兴市统计年鉴2020
5-1 历年年末公路通车里程Total Length of Highways over the Years
单位:公里 (km)
年 份Year
全 市Whole
Municipality
越城区及柯桥区
Yuecheng District &
Keqiao District
越城区Yuecheng
District
柯桥区Keqiao District
上虞区Shangyu District
诸暨市ZhujiCity
嵊州市Shengzhou
City
新昌县Xinchang County
1978 1638 262 197 334 476 369
1979 1721 262 209 354 517 379
1980 1905 275 246 386 554 444
1986 2479 404 313 513 711 538
1987 2586 431 330 539 736 550
1988 2698 481 340 554 743 581
1989 2839 553 351 565 769 602
1990 2916 550 360 610 778 618
1991 2939 563 364 605 781 626
1992 3176 651 375 629 814 708
1993 3212 681 375 637 811 708
1994 3253 683 378 654 828 711
1995 3307 690 394 672 829 722
1996 3321 675 394 686 835 731
1997 3423 726 391 704 851 752
1998 3556 740 434 750 857 775
1999 3643 783 438 780 858 784
2000 3893 800 160 640 460 826 872 788
2001 3955 843 172 672 502 883 904 823
2002 4087 876 183 694 520 963 904 823
2003 4167 920 202 718 520 989 904 834
2004 4235 950 202 749 551 991 904 839
2005 4398 1010 202 808 551 1005 987 845
2006 8390 1964 420 1544 1382 1980 2006 1057
2007 8663 1977 433 1544 1386 2074 2027 1200
2008 8891 1986 434 1552 1394 2240 2039 1231
2009 9079 1999 429 1569 1425 2333 2054 1269
2010 9281 2003 429 1574 1498 2430 2071 1279
2011 9480 2049 450 1599 1506 2491 2135 1298
2012 9587 2059 451 1608 1511 2532 2176 1309
2013 9786 2067 651 1416 1559 2604 2231 1324
2014 9893 2080 663 1417 1573 2638 2278 1325
2015 9959 2095 672 1424 1575 2646 2306 1337
2016 10068 2099 674 1424 1582 2710 2316 1360
2017 10136 2104 665 1439 1595 2735 2324 1377
2018 10137 2117 652 1466 1578 2737 2329 1377
2019 10222 2140 652 1487 1583 2763 2352 1383
注:① 2000 年 147.1 公里高速公路未分解到各县市。② 2006 年末公路通车里程包括村道。Note: a) The 147.1 km expressway of year 2000 was not broken down to different counties. b) At the end of 2006, the total length
of highway include village highway.

193
交通、邮电及电力
5-2 历年全社会客货运输量Total Passenger and Freight Traffic over the Years
年 份Year
客运量( 万人次 )Passenger
Traffic(10 000
person-times)
客运周转量( 万人公里 )
Turnover Volume of Passenger
Traffic (10 000 person-km)
货运量( 万吨 )
Freight Traffic(10 000 tons)
货运周转量( 万吨公里 )
Turnover Volume of
Freight Traffic(10 000 ton-km)
公 路Highway
公 路Highway
公 路Highway
公 路Highway
1978 1509 1086 26666 21287 693 187 22821 5692
1979 1825 1338 31414 25233 788 207 29237 6273
1980 2302 1733 38874 31733 844 206 33648 6605
1985 4162 3700 88416 82607 1142 471 56545 19947
1986 4235 3887 95433 91111 1204 550 64101 25494
1987 4511 4189 108159 104594 3287 1242 129260 50449
1988 4021 3772 100109 97256 2940 1286 122287 54040
1989 4107 3923 95342 93228 2810 1309 125878 50328
1990 4134 4000 110600 109062 2517 1235 115838 47077
1991 4511 4412 128162 126979 2583 1292 128990 54341
1992 8240 8153 220861 219795 5550 4268 208667 123277
1993 8926 8856 248288 247457 5964 4628 233157 140566
1994 9095 9046 251063 250560 6214 4786 241180 143910
1995 9574 9539 278508 278203 6531 5120 238990 151628
1996 10037 10014 299589 299397 6668 5390 241545 162889
1997 10531 10517 322356 322250 6723 5615 244209 172368
1998 9416 9406 319587 319501 5495 4489 230478 165224
1999 11009 11003 349365 349311 5534 4570 263034 185495
2000 11753 11751 376372 376350 6470 5560 284851 210913
2001 12634 12632 408970 408951 6555 5646 262139 194151
2002 13020 13017 426003 425960 7134 6079 298670 213791
2003 12946 12944 432626 432598 7894 6766 332862 233961
2004 13739 13737 458666 458643 9308 8132 359577 252243
2005 14202 14200 475619 475598 9559 8406 413781 262383
2006 14989 14985 490708 490658 10119 9014 480997 289771
2007 15878 15874 539767 539724 11032 9852 579820 347219
2008 16340 16279 549269 549076 11273 10235 581133 361802
2009 17088 17025 452668 452445 8528 7612 872895 673793
2010 17398 17314 459033 458779 8931 7890 1001862 707482
2011 17415 17328 475338 475100 8899 7694 1102870 784353
2012 17512 17414 479957 479693 9274 8051 1110714 819204
2013 17546 17441 495883 495573 9871 8560 1185468 877218
2014 9824 9721 368421 368086 11481 10091 1124146 818443
2015 10020 9899 344391 343888 12271 10866 1196809 880876
2016 3081 2957 308493 307914 12447 11134 1195386 878421
2017 2926 2805 295153 294639 13426 12055 1238488 914886
2018 2905 2798 298459 298044 14161 12596 1280905 951264
2019 2108 2001 291449 291021 15277 13615 1462202 1112447
注:2009 年、2014 年客货运输量、2016 年客运运输量统计口径变化,不可比。Note: The caliber of passengers and cargo transportation with road of 2009 and 2014, and the caliber of passengers of 2016 has
changed.

194
绍兴市统计年鉴2020
5-3 分区、县(市)民用车辆拥有量(2019年末)
单位:辆
指 标 Item全 市Whole
Municipality
总计 Total 1667880
汽车 Vehicles 1533721
载客汽车 Passenger Vehicles 1422345
# 大型 Large-Sized 6850
中型 Medium-Sized 1923
小型 Small-Sized 1409882
微型 Minicar 3690
载货汽车 Trucks 107742
# 大型 Large-Sized 17904
中型 Medium-Sized 4574
小型 Small-Sized 85116
微型 Minicar 147
其它汽车 Others 3634
摩托车 Motorcycles 130830
普通 Ordinary 127613
轻便 Lightweigh 3217
挂车 Trailers 3329
注:5-3 表数据来源于公安局车辆管理所。

195
交通、邮电及电力
Number of Civil Vehicles Owned by District and County (City) (End of 2019)
(unit)
越城区Yuecheng
District
柯桥区KeqiaoDistrict
上虞区ShangyuDistrict
诸暨市ZhujiCity
嵊州市Shengzhou
City
新昌县XinchangCounty
373780 364384 214427 394722 196295 124272
371270 339394 203773 363351 158788 97145
348081 310627 192856 331355 147528 91898
2018 1277 1048 1394 580 533
544 272 316 427 143 221
344575 308540 191204 328391 146404 90768
944 538 288 1143 401 376
22028 28201 10333 31276 10885 5019
5472 3610 2936 3234 1702 950
1239 1304 537 868 434 192
15316 23263 6858 27059 8745 3875
1 24 2 114 4 2
1161 566 584 720 375 228
1528 24530 9894 30696 37200 26982
1495 23566 9862 30339 36712 25639
33 964 32 357 488 1343
982 460 760 675 307 145
Note: The data of sheet 5-3 are provided by police automobile administration.

196
绍兴市统计年鉴2020
5-4 运输船舶数(2019年末)
5-5 各类公路到达情况(2019年末)
单位:辆
单位:公里
指 标 Item全 市Whole
Municipality
一、机动船 Motor Vessels
艘数 ( 艘 ) Number (unit) 857
净载重量 ( 吨位 ) Dead Weight Tonnage (ton) 345486
载客量 ( 客位 ) Passenger Capacity (seat) 3616
功率 ( 千瓦 ) Power (kw) 96170
1. 客船 Passenger Ship
艘数 ( 艘 ) Number (unit) 61
载客量 ( 客位 ) Passenger Capacity (seat) 3616
功率 ( 千瓦 ) Power (kw) 4393
2. 货船 Cargo Ship
艘数 ( 艘 ) Number (unit) 796
载货量 ( 吨位 ) Freight Capacity (ton) 345486
功率 ( 千瓦 ) Power (kw) 91777
3. 拖船 Tugboats
艘数 ( 艘 ) Number (unit) -
功率 ( 千瓦 ) Power (kw) -
二、货驳 Cargo Barge
艘数 ( 艘 ) Number (unit) -
载货量 ( 吨位 ) Freight Capacity (ton) -
指 标 Item全 市Whole
Municipality
通车里程 Total Length of Highway 10221.84
1. 国省道干线公路 State & Provincial Trunk Highway 1024.37
#国道 State Highway 681.79
省道 Provincial Highway 342.58
2. 农村公路 Rural Highway 9197.47
#县道 County Highway 2389.60
乡道 Township Highway 1581.05
专用公路 Special Highway 24.44
村道 Village Highway 5202.38

197
交通、邮电及电力
Number of Transport Vessels(End of 2019)
Length of Highways by Level (End of 2019)
(unit)
(km)
越城区Yuecheng
District
柯桥区KeqiaoDistrict
上虞区ShangyuDistrict
诸暨市ZhujiCity
嵊州市Shengzhou
City
新昌县XinchangCounty
283 140 208 198 24 4
68464 49187 124883 98128 4824 -
545 1012 - 1856 - 203
21398 15055 31090 26269 2149 209
16 24 - 17 - 4
545 1012 - 1856 - 203
1077 2170 - 937 - 209
267 116 208 181 24 -
68464 49187 124883 98128 4824 -
20321 12885 31090 25332 2149 -
- - - - - -
- - - - - -
- - - - - -
- - - - - -
越城区Yuecheng
District
柯桥区KeqiaoDistrict
上虞区ShangyuDistrict
诸暨市ZhujiCity
嵊州市Shengzhou
City
新昌县XinchangCounty
652.28 1487.46 1583.33 2763.45 2352.38 1382.93
104.14 109.56 145.26 292.34 212.48 160.61
65.86 53.36 141.74 108.24 176.13 136.47
38.28 56.20 3.52 184.09 36.35 24.14
548.14 1377.90 1438.08 2471.12 2139.91 1222.33
134.82 396.83 400.67 573.55 482.95 400.78
109.77 297.51 108.94 386.58 354.62 323.63
3.59 11.44 - 7.71 0.59 1.12
299.97 672.12 928.46 1503.28 1301.75 496.79

198
绍兴市统计年鉴2020
5-6 全市公路到达情况(2019年末)单位:公里
类 别 Type通车里程
Total Length of Highways
按技术等级分Grouped by Technical Grade
高速公路Expressway
一级First Class
二级Second Class
通车里程 Total Length of Highways 10221.84 440.62 520.43 967.88
#国道 State Highway 681.79 304.71 170.41 169.23
省道 Provincial Highway 342.58 135.91 6.70 158.99
县道 County Highway 2389.60 - 343.33 527.99
乡道 Township Highway 1581.05 - - 26.30
专用道 Special Highway 24.44 - - -
村道 Village Highway 5202.38 - - 85.38
5-7 全社会客货运输量(2019年)
指 标 Item全 市Whole
Municipality
客运量 ( 万人次 ) Passenger Traffic (10 000 person-times) 2108
公路 Highways 2001
水路 Waterways 107
客运周转量 ( 万人公里 ) Passenger-Kilometers (10 000 person-km) 291449
公路 Highways 291021
水路 Waterways 428
货 运 量 ( 万吨 ) Freight Traffic (10 000 tons) 15277
公路 Highways 13615
水路 Waterways 1662
货运周转量 ( 万吨公里 ) Freight Ton-kilometers (10 000 ton-km) 1462202
公路 Highways 1112447
水路 Waterways 349755

199
交通、邮电及电力
Length of Highways (End of 2019)(km)
按路面等级分Grouped by Standard of Road Surface
三级Third Class
四级Forth Class
等 外Highway Below
Class IV
高级路面High
次高级路面Sub-high
中级路面Medium
460.55 7832.37 - 10069.41 90.52 61.91
1.46 36.00 - 681.79 - -
11.52 29.46 - 342.58 - -
211.15 1307.13 - 2381.17 8.43 -
95.79 1458.97 - 1541.81 39.24 -
- 24.44 - 19.99 4.36 0.09
140.63 4976.37 - 5102.07 38.50 61.81
Passenger Traffic and Freight Traffic (2019)
越城区Yuecheng
District
柯桥区KeqiaoDistrict
上虞区ShangyuDistrict
诸暨市ZhujiCity
嵊州市Shengzhou
City
新昌县XinchangCounty
620 255 317 416 250 251
617 190 317 378 250 249
3 65 - 38 - 2
82638 28971 53515 53686 35020 37618
82608 28897 53515 53369 35020 37611
30 74 - 317 - 6
2179 4319 3201 2906 1528 1143
1806 4132 2652 2376 1505 1143
373 187 549 530 23 -
204097 359847 347436 307329 140282 103211
145418 329342 203044 194567 136866 103211
58680 30505 144392 112761 3417 -

200
绍兴市统计年鉴2020
5-8 历年邮电业务收入Business Volume of Post and Telecommunications over the Years
5-9 历年年末固定电话用户数Number of Fixed Telephone over the Years
单位:万元
单位:万户
(10 000 yuan)
(10 000 subscribers)
年 份Year
全 市Whole
Municipality
越城区及柯桥区Yuecheng District &
Keqiao District
上虞区Shangyu District
诸暨市ZhujiCity
嵊州市Shengzhou
City
新昌县Xinchang County
2000 195778 92673 24541 41211 22456 148962001 195275 95972 23319 40237 21502 142442002 231416 111348 27969 48821 26016 172622003 281971 135915 34222 58750 31593 214922004 324367 151371 42115 68477 36966 254382005 341938 161868 43371 72696 37283 267202006 364976 172561 48001 79045 39131 262392007 412391 194402 55965 89943 43374 287072008 456851 220908 61083 97432 46849 305792009 473446 232167 62194 101030 47191 308632010 488718 236355 65564 106943 49080 307762011 536414 258713 72182 119075 53264 331812012 580994 287784 76278 125951 55972 350092013 618020 300216 82542 137183 60491 37588 2014 607749 298610 79148 134337 59215 364402015 571110 282061 73337 125321 56923 334682016 599673 300979 76262 127277 59241 359142017 594927 274939 80821 137366 63068 38732 2018 634982 293561 87627 145297 67631 40866 2019 639437 287137 87137 154079 67960 43123
年 份Year
全 市Whole
Municipality
越城区及柯桥区Yuecheng District &
Keqiao District
上虞区Shangyu District
诸暨市ZhujiCity
嵊州市Shengzhou
City
新昌县Xinchang County
2000 96.02 37.25 15.89 21.41 13.43 8.052001 119.00 44.40 20.10 26.30 17.20 11.002002 135.15 49.33 22.99 29.58 20.36 12.892003 159.47 59.42 26.35 34.88 23.94 14.882004 189.92 70.52 31.31 42.03 28.06 18.002005 221.39 82.86 35.20 50.37 31.95 21.022006 236.65 90.08 37.42 54.12 33.31 21.722007 242.78 92.91 39.45 54.75 33.65 22.012008 240.78 93.84 39.15 54.13 32.45 21.212009 226.28 90.83 36.64 50.13 29.60 19.082010 201.80 81.69 32.64 44.60 26.69 16.192011 199.22 82.57 31.31 44.19 25.77 15.382012 195.06 81.93 30.47 43.41 24.92 14.332013 179.04 74.85 28.14 40.49 22.87 12.692014 150.94 65.86 22.84 34.92 18.06 9.262015 144.09 64.44 23.13 32.15 16.14 8.242016 127.48 57.15 19.04 29.95 14.36 6.992017 116.93 53.38 17.00 27.42 12.78 6.35 2018 106.79 49.99 15.20 24.53 11.42 5.66 2019 116.95 55.19 17.15 25.60 12.56 6.44

201
交通、邮电及电力
5-10 历年年末移动电话用户数Number of Mobile Telephone Subscribers over the Years
5-11 历年互联网用户数Number of Subscribers of Internet Services over the Years
单位:户
单位:万户
(subscriber)
(10 000 subscribers)
年 份Year
全 市Whole
Municipality
越城区及柯桥区Yuecheng District &
Keqiao District
上虞区Shangyu District
诸暨市ZhujiCity
嵊州市Shengzhou
City
新昌县Xinchang County
2000 527428 236760 72997 111757 66853 390612001 693021 291767 95637 146920 80322 783752002 1046226 507564 120112 206020 119915 926152003 1502853 718742 180388 309024 179979 1147202004 1786216 781812 236173 382769 234275 1511872005 2439132 1150567 296800 512899 290387 1884792006 2659168 1269970 331184 561187 301681 195146 2007 3538970 1702169 456332 751631 385481 2433572008 3340246 1627243 422657 694396 362967 2329832009 3785190 1697692 519585 830128 445723 292062 2010 4364458 1918834 617400 968741 518567 3409162011 4847622 2127665 693962 1073060 576408 3765262012 4976080 2169332 723554 1093094 597784 3923162013 5269019 2346860 753641 1150944 614206 403376 2014 5323072 2379045 744960 1158080 629884 411103 2015 5372602 2416709 784599 1121749 637753 411792 2016 5593426 2509240 788168 1211707 658858 4254532017 5785932 2567560 840354 1241298 699556 4371642018 5968082 2710142 858911 1236617 711416 4509962019 5879834 2566223 870103 1273499 717856 452153
年 份Year
全 市Whole
Municipality
越城区及柯桥区Yuecheng District &
Keqiao District
上虞区Shangyu District
诸暨市ZhujiCity
嵊州市Shengzhou
City
新昌县Xinchang County
2000 7.62 3.34 1.25 1.08 1.13 0.802001 17.00 7.40 2.80 2.42 2.36 2.022002 24.16 11.86 3.31 4.11 2.86 2.022003 42.17 20.56 5.96 7.07 5.08 3.492004 38.72 19.87 4.29 6.66 4.82 3.082005 74.66 34.40 9.47 15.10 9.66 6.042006 114.65 51.85 15.65 23.84 14.36 8.962007 91.77 42.91 12.81 19.28 10.18 6.592008 150.10 76.87 19.87 30.68 13.65 9.04 2009 255.32 123.70 35.65 56.69 24.16 15.11 2010 342.65 165.66 46.60 73.09 32.99 21.83 2011 360.47 172.48 49.31 77.32 36.92 24.49 2012 434.86 209.07 60.01 91.48 44.75 29.55 2013 519.98 244.75 70.90 112.73 54.47 37.14 2014 548.33 254.47 74.34 118.99 60.37 40.16 2015 573.17 264.30 79.43 122.27 60.54 46.63 2016 695.26 327.27 92.22 147.93 77.90 49.952017 740.37 338.97 101.90 158.32 84.78 56.41 2018 853.11 396.88 121.94 170.46 95.42 68.412019 765.91 342.18 111.52 165.28 90.87 56.06
注:2014 年起包括移动上网卡用户。Note: The SIM users are included from 2014.

202
绍兴市统计年鉴2020
5-12 邮政基本情况(2019年)
指 标 Item
邮政业务收入 ( 万元 ) Postal Business Revenue (10 000 yuan)
邮政局所总数 ( 个 ) Number of Post offices (unit)
#自办局所数 ( 个 ) Number of Self-established Post Offices (unit)
邮政储蓄点 ( 个 ) Postal Saving Services (unit)
信筒信箱 ( 个 ) Number of Post Boxes (unit)
邮路及农村投递路线总长度 ( 公里 ) Length of Postal Routes and Rural Delivery Routes (km)
1. 邮路总长度 ( 公里 ) Length of Postal Routes (km)
#汽车邮路 ( 公里 ) Highway Routes (km)
2. 农村投递路线长度 ( 公里 ) Rural Delivery Routes (km)
函件总数 ( 万件 ) Number of Letters (10 000 pieces)
国内普通包裹 ( 万件 ) Domestic ordinary package (10 000 pieces)
快递包裹 ( 万件 ) Express packages (10 000 pieces)
汇票 ( 万张 ) Number of Bill of Exchange (10 000 pieces)
特快专递 ( 万件 ) Pieces of Express Mail Services (10 000 pieces)
订销报纸累计数 ( 万份 ) Total of Newspaper Subscribed (10 000 copies)
订销杂志累计数 ( 万份 ) Total of Magazine Subscribed (10 000 copies)
集邮业务 ( 万枚 ) Philately (10 000 pieces)
每百人平均函件量 ( 件 / 百人 ) Average Number of Letters Mailed per 100 Persons (piece/100 persons)
每百人平均订阅报刊量 ( 份 / 百人 ) Average Number of Newspaper Subscribed per 100 Persons (copy/100 persons)
每百人平均汇票量 ( 张 / 百人 ) Average Number of Money Order 100 Persons (piece/100 persons)
注:从 2004 年开始函件总数包括邮送广告量。

203
交通、邮电及电力
Basic Statistics on Post (2019)
指 标 Item
邮政业务收入 ( 万元 ) Postal Business Revenue (10 000 yuan)
邮政局所总数 ( 个 ) Number of Post offices (unit)
#自办局所数 ( 个 ) Number of Self-established Post Offices (unit)
邮政储蓄点 ( 个 ) Postal Saving Services (unit)
信筒信箱 ( 个 ) Number of Post Boxes (unit)
邮路及农村投递路线总长度 ( 公里 ) Length of Postal Routes and Rural Delivery Routes (km)
1. 邮路总长度 ( 公里 ) Length of Postal Routes (km)
#汽车邮路 ( 公里 ) Highway Routes (km)
2. 农村投递路线长度 ( 公里 ) Rural Delivery Routes (km)
函件总数 ( 万件 ) Number of Letters (10 000 pieces)
国内普通包裹 ( 万件 ) Domestic ordinary package (10 000 pieces)
快递包裹 ( 万件 ) Express packages (10 000 pieces)
汇票 ( 万张 ) Number of Bill of Exchange (10 000 pieces)
特快专递 ( 万件 ) Pieces of Express Mail Services (10 000 pieces)
订销报纸累计数 ( 万份 ) Total of Newspaper Subscribed (10 000 copies)
订销杂志累计数 ( 万份 ) Total of Magazine Subscribed (10 000 copies)
集邮业务 ( 万枚 ) Philately (10 000 pieces)
每百人平均函件量 ( 件 / 百人 ) Average Number of Letters Mailed per 100 Persons (piece/100 persons)
每百人平均订阅报刊量 ( 份 / 百人 ) Average Number of Newspaper Subscribed per 100 Persons (copy/100 persons)
每百人平均汇票量 ( 张 / 百人 ) Average Number of Money Order 100 Persons (piece/100 persons)
全 市Whole
Municipality
越城区及柯桥区Yuecheng District& Keqiao District
上虞区ShangyuDistrict
诸暨市ZhujiCity
嵊州市Shengzhou
City
新昌县XinchangCounty
87536 26521 10846 34997 10485 4686
157 37 23 56 25 16
143 37 23 56 17 10
126 32 11 56 17 10
2018 565 417 561 35 440
30287 13091 4742 6562 3313 2579
6284 4556 455 864 260 149
6284 4556 455 864 260 149
24003 8535 4287 5698 3053 2430
333 212 23 46 35 17
4.52 1.33 1.03 1.40 0.55 0.21
7093.20 1290.45 1071.17 4393.71 152.86 185.01
9.96 6.09 1.85 1.35 0.48 0.19
12.51 4.34 0.96 5.48 0.95 0.78
10543.10 4091.86 2616.47 1746.05 1257.45 831.27
262.30 116.67 33.03 53.79 33.74 25.07
394.47 198.73 46.91 64.48 40.39 43.96
74.46 145.79 29.23 42.16 48.43 40.26
2412.64 2888.38 3399.20 1659.88 1783.11 1974.47
2.22 4.18 2.37 1.25 0.66 0.44
Note: From the year of 2004, the total mail number includes the advertisement mails.

204
绍兴市统计年鉴2020
5-13 电信基本情况(2019年)
指 标 Item
电信业务收入 ( 万元 ) Telecommunications Business Revenue (10 000 yuan)
自办营业网点 ( 个 ) Self-established Business Points (unit)
委托代办点总数 (个) Number of Authorized Business Point (unit)
固定电话交换机容量 ( 万门 ) Fixed Switchboard (10 000 lines)
移动电话交换机容量 ( 万门 ) Mobile Switchboard (10 000 lines)
固定电话年末户数 ( 包括小灵通 ) ( 万户 )
Number of Subscribers of Fixed Telephone at Year-end(Including PAS) (10 000 subscribers)
固定电话主线普及率 (号线/百人) Popularization Rate of Telephone Line (line/100 persons)
移动电话年末户数 ( 万户 ) Number of Mobile Telephone Subscribers at Year-end (10 000 subscribers)
移动电话普及率 ( 部 / 百人 ) Popularization Rate of Mobile Telephone (set/100 persons)
长途电话通话量 ( 万分钟 ) Communication time by Long Distance Telephone Call (10 000 minutes)
互联网用户数(包括手机上网、移动上网卡用户) ( 万户 )
Number of Subscribers of Internet Services (Including WAP and SIM users) (10 000 subscribers)
注:电信公司委托代办点口径为合营网点。

205
交通、邮电及电力
Basic Statistics on Telecommunications (2019)
指 标 Item
电信业务收入 ( 万元 ) Telecommunications Business Revenue (10 000 yuan)
自办营业网点 ( 个 ) Self-established Business Points (unit)
委托代办点总数 (个) Number of Authorized Business Point (unit)
固定电话交换机容量 ( 万门 ) Fixed Switchboard (10 000 lines)
移动电话交换机容量 ( 万门 ) Mobile Switchboard (10 000 lines)
固定电话年末户数 ( 包括小灵通 ) ( 万户 )
Number of Subscribers of Fixed Telephone at Year-end(Including PAS) (10 000 subscribers)
固定电话主线普及率 (号线/百人) Popularization Rate of Telephone Line (line/100 persons)
移动电话年末户数 ( 万户 ) Number of Mobile Telephone Subscribers at Year-end (10 000 subscribers)
移动电话普及率 ( 部 / 百人 ) Popularization Rate of Mobile Telephone (set/100 persons)
长途电话通话量 ( 万分钟 ) Communication time by Long Distance Telephone Call (10 000 minutes)
互联网用户数(包括手机上网、移动上网卡用户) ( 万户 )
Number of Subscribers of Internet Services (Including WAP and SIM users) (10 000 subscribers)
全 市Whole
Municipality
越城区Yuecheng
District
柯桥区KeqiaoDistrict
上虞区Shangyu District
诸暨市ZhujiCity
嵊州市Shengzhou
City
新昌县Xinchang County
551901 155468 105149 76291 119082 57475 38436
206 50 33 35 43 25 20
2697 645 497 340 616 405 194
73 8 1 4 4 1 1
1636 242 91 101 162 73 52
116.95 30.84 24.35 17.15 25.60 12.56 6.44
26.11 40.10 35.40 22.00 23.61 17.35 14.84
587.98 147.94 108.68 87.01 127.35 71.79 45.22
131.29 192.37 157.97 111.63 117.45 99.13 104.25
2329410 564740 537215 359710 527093 213516 127136
765.91 197.33 144.85 111.52 165.28 90.87 56.06
Note: The caliber of the telecommunications company's commissioned agent branch was joint venture outlets.

206
绍兴市统计年鉴2020
5-14 历年全社会用电量Electricity Consumption over the Years
单位:万千瓦时 (10 000 kwh)
年 份Year
全 市Whole
Municipality
越城区Yuecheng
District
柯桥区Keqiao District
上虞区Shangyu District
诸暨市ZhujiCity
嵊州市Shengzhou
City
新昌县Xinchang County
1978 44878 22976 5966 8194 5279 2462
1979 55515 26943 7726 10734 6839 3228
1980 63173 30482 9218 12079 7645 3750
1985 105359 32366 22336 14197 17477 11706 7277
1986 122413 35495 27502 16616 19612 13306 8137
1987 150258 38521 34628 20193 23999 16056 10079
1988 170433 43117 39387 22773 28057 17960 12414
1989 176566 47915 40880 21919 29588 17451 13105
1990 198941 43523 59890 23207 32628 18005 14247
1991 236011 48316 80067 26386 39478 21606 15994
1992 286151 55381 102783 31178 49210 25415 18442
1993 335634 62064 124500 35676 60766 28746 19855
1994 378856 67354 147822 42451 64757 32049 22129
1995 424186 72931 160686 46201 74224 34596 26701
1996 490389 81578 197420 50094 88610 35117 29277
1997 566921 87493 251914 52822 95942 38019 32108
1998 625175 90563 289370 56064 103564 39965 36382
1999 678196 92446 313637 64021 119663 43480 40909
2000 776702 156974 289992 75924 150731 47493 50653
2001 901529 174502 355878 84580 180254 47701 53374
2002 1111592 220261 442823 103723 219205 56723 62432
2003 1376353 278521 540416 132517 266700 70824 77732
2004 1547773 305812 631495 142298 291024 79549 85712
2005 1855228 353473 752030 182068 365030 98200 93534
2006 2144386 396981 853876 231237 424740 114059 104390
2007 2395751 433115 942139 268440 485970 129705 114280
2008 2443122 432693 944071 271684 517351 141039 118527
2009 2588674 423091 1026363 292751 559365 148379 118377
2010 2956778 485155 1166762 343075 630370 168502 134728
2011 3246028 532462 1295069 360520 690933 188719 154981
2012 3377115 548642 1391248 381631 689912 190070 154284
2013 3595559 589949 1439654 417712 740511 209546 175217
2014 3649320 669243 1385783 446541 733673 216252 178467
2015 3662549 699169 1358398 473602 683443 223043 179937
2016 3745135 707220 1283401 523406 734428 251843 191691
2017 4115520 745878 1458747 573304 820278 274023 213953
2018 4377184 782472 1546632 612717 903585 293570 227373
2019 4623663 817513 1656526 648848 947344 301521 228343

207
交通、邮电及电力
5-15 历年工业用电量Consumption of Industrial Electricity over the Years
单位:万千瓦时 (10 000 kwh)
年 份Year
全 市Whole
Municipality
越城区Yuecheng
District
柯桥区Keqiao District
上虞区Shangyu District
诸暨市ZhujiCity
嵊州市Shengzhou
City
新昌县Xinchang County
1978 34365 18355 3270 5263 3502 1753
1979 43587 21705 5160 7229 4856 2257
1980 50233 24990 6560 8401 5453 2587
1985 84582 29277 16418 11301 12740 8582 4742
1986 98370 32212 20622 12958 13455 10051 5570
1987 119647 34722 25678 16603 16634 12071 6914
1988 133523 38808 30203 17923 18713 13021 8129
1989 138107 42992 32280 16886 20118 11845 8275
1990 155071 37970 49732 17298 21783 11539 9309
1991 185980 41977 67423 19943 27039 14913 10521
1992 229909 48286 89513 24028 34768 17456 12115
1993 271024 53167 109940 27040 42468 20119 14254
1994 304052 55959 131181 31569 45070 21721 16260
1995 340095 59923 141229 33868 53134 23320 19775
1996 397625 66850 175921 36659 65121 23411 21369
1997 464228 70514 227320 39178 69499 26172 22922
1998 508033 70530 260955 39984 75196 26491 25710
1999 557276 71310 285627 48796 88651 29990 28862
2000 632883 126612 262635 57710 111901 32671 36421
2001 735265 138981 321518 64545 135410 31778 37792
2002 912926 175596 397327 81563 168274 39159 44582
2003 1127661 216735 482700 103109 210708 49158 55610
2004 1287520 240651 560697 111080 239627 56577 67004
2005 1586233 283190 698269 145164 305371 69323 74015
2006 1832517 318919 787764 187441 355271 81106 82911
2007 2036465 340939 866021 215800 409210 91957 90436
2008 2041913 332587 857056 211850 431992 98837 91835
2009 2151960 311058 932355 226289 468863 103629 89410
2010 2452700 357015 1053169 264452 528836 118526 102516
2011 2686777 391252 1161160 280997 577485 133361 119177
2012 2768333 396203 1244942 297084 564656 128703 115417
2013 2908052 420192 1270554 322867 601789 138998 130683
2014 2972695 491984 1230027 355149 593658 148218 134297
2015 2939660 492663 1205573 376412 537368 150541 132148
2016 2919811 491396 1106864 404238 560721 166195 137251
2017 3214714 518113 1266592 440976 627918 178957 152822
2018 3381429 532762 1336280 467197 687203 189326 157826
2019 3563045 556299 1427884 494196 715129 191787 154181

208
绍兴市统计年鉴2020
5-16 历年生活用电量Residents Consumption of Electricity for Non-production over the Years
单位:万千瓦时 (10 000 kwh)
年 份Year
全 市Whole
Municipality
越城区Yuecheng
District
柯桥区Keqiao District
上虞区Shangyu District
诸暨市ZhujiCity
嵊州市Shengzhou
City
新昌县Xinchang County
1978 3354 1029 686 977 414 249
1979 4026 1228 756 1247 464 331
1980 5104 1640 996 1495 565 408
1985 10539 1390 3101 1278 2356 1621 793
1986 12817 1882 4080 1659 2724 1476 1013
1987 16540 1900 6034 2023 3477 2014 1212
1988 19435 2035 5939 2452 4750 2483 1777
1989 21314 2471 5535 2711 5198 3137 2262
1990 25179 2739 6160 3463 6403 4039 2483
1991 29725 3062 8790 3738 7177 4239 2720
1992 32212 3320 8999 4002 7821 4873 3197
1993 36712 3786 9477 5205 9203 5553 3488
1994 44156 4891 10982 6421 11462 6473 3926
1995 49071 5533 12158 7422 12965 6802 4191
1996 55124 6165 14061 8339 14587 7074 4898
1997 57710 6500 14710 8177 15284 7502 5538
1998 63368 7118 15567 9165 16864 8400 6255
1999 61407 6689 13765 8826 16970 8535 6622
2000 70328 11658 11973 9934 19910 9197 7656
2001 77995 13346 12562 10515 23504 9457 8611
2002 92075 16098 15267 11843 28496 10287 10083
2003 112251 21489 17658 14671 32154 13409 12871
2004 111502 23910 19196 14034 30524 13648 10190
2005 134711 28419 24229 17741 36233 16513 11577
2006 158827 33469 29640 20945 42098 19541 13133
2007 181692 38211 34379 24504 46958 22740 14899
2008 203703 41947 39315 28275 51665 25843 16658
2009 220397 46453 42129 31176 54897 27867 17874
2010 248269 51870 47836 35558 61582 31663 19761
2011 272042 56133 54614 37679 66719 35108 21789
2012 298645 60734 60921 40929 73416 38746 23899
2013 344917 70191 73543 48208 81243 44956 26776
2014 318879 69378 62017 43898 75591 42684 25311
2015 335183 73101 65916 47168 76881 45322 26795
2016 392441 85746 78351 56045 88905 52592 30802
2017 420664 90816 85553 59818 95295 56136 33047
2018 459540 97910 93745 64676 108623 59200 35385
2019 486562 102560 98121 68245 119308 61095 37233

209
交通、邮电及电力
5-17 供用电设备情况(2019年)Residents Consumption of Electricity for Non-production (2019)
5-18 水、火、太阳能发电设备情况(2019年)Equipment in Water, Fire and Solar Power (2019)
指 标 Item 合 计Total 500kV 220kV 110kV 35kV 20kV 10kV
及以下
变电所 ( 所 ) Transformer Substation (place) 372 - 40 167 165 - -
公用 Public 241 - 37 150 54 - -
用户自备 Provide 131 - 3 17 111 - -
变压器 ( 台 ) Transformer (unit) 62254 - 87 339 321 612 60895
公用 Public 29769 - 82 307 103 159 29118
用户自备 Provide 32485 - 5 32 218 453 31777
铭牌容量 ( 万 kVA) Capacity (10000 kVA) 6236.75 - 1673.75 1601.00 315.99 40.43 2605.58
公用 Public 4593.45 - 1650.00 1487.90 155.66 8.52 1291.37
用户自备 Provide 1643.30 - 23.75 113.10 160.33 31.91 1314.21
线路条数 ( 条 ) Number of Lines (line) 4103 35 130 321 271 63 3283
线路长度 ( 公里 ) Length of Lines (km) 30104.10 1107.59 1909.64 2534.96 1644.24 389.31 22518.37
年 份Year
全 市Whole
Municipality
越城区Yuecheng
District
柯桥区Keqiao District
上虞区Shangyu District
诸暨市ZhujiCity
嵊州市Shengzhou
City
新昌县Xinchang County
水、火、太阳能发电厂 ( 座 )Water Fire and Solar Powerplants (set)
21935 4160 1279 4825 5266 3881 2524
≥ 6000kw 22 4 5 6 2 3 2
发电容量 ( 千瓦 )Power Capacity (kW) 1969536 269892 558690 449734 293261 239323 158635
≥ 6000kw 877050 126000 344000 180000 92000 98300 36750
发电量 ( 万千瓦时 )Electricity (10000kWh) 653363 77645 268671 120807 69257 73447 43535
≥ 6000kw 533004 65015 252611 97204 44809 51035 22330

210
绍兴市统计年鉴2020
5-19 全社会用电量(2019年)
单位:万千瓦时
指 标 Item全 市Whole
Municipality
全社会用电量总计 Total 4623663.18
A、全行业用电合计 Consumption of Electricity for Production 4137100.90
B、城乡居民生活用电合计 Residents Consumption of Electricity for Non-production 486562.28
城镇居民 Urban Residents 264161.87
乡村居民 Rural Residents 222400.40
全行业用电分类 Grouped by Sector 4137100.90
一、农、林、牧、渔业 Farming, Forestry, Animal Husbandry and Fishery 32422.94
二、工业 Industry 3563045.16
(一)采矿业 Mining and Quarrying 11995.13
(二)制造业 Manufacturing 3265911.05
1. 农副食品加工业 Manufacturing of Agricultural and Non-staple Foodstuff 9884.70
2. 食品制造业 Foodstuff Manufacturing Industry 6760.26
3. 酒、饮料及精制茶制造业 Manufacturing Industry of Beverage, Drinking and Refiined Tea 12145.00
4. 烟草制品业 Tobacco Industry 38.62
5. 纺织业 Textile Industry 1480666.79
6. 纺织服装、服饰业 Manufacturing Industry of Textile Costumes, Shoes, and Caps 91778.91
7. 皮革、毛皮、羽毛及其制品和制鞋业
Manufacturing Industry of Leather, Fur, Feather (Cloth with Soft Nap) and their Products 11882.51
8. 木材加工和木、竹、藤、棕、草制品业
Wood Processing and Manufacturing Industry of Wood, Bamboo, Rattan, Palm, and Straw-made Articles 4630.88
9. 家具制造业 Cabinetmaking Industry 8790.55
10. 造纸和纸制品业 Papermaking and Paper Product Industry 35573.36
11. 印刷和记录媒介复制业 Printing Industry and Reproduction of Record Media 6857.23
12. 文教、工美、体育和娱乐用品制造业
Manufacturing Industry of Culture, Education and Sports stuff 10191.38
13. 石油、煤炭及其他燃料加工业 Petroleum Processing, Cooking and Other Fuel Processing 401.20
14. 化学原料和化学制品制造业 Chemical Feedstock and Chemical Manufacturing Industry 255094.81
15. 医药制造业 Medical and Pharmaceutical Products 106490.09
16. 化学纤维制造业 Chemical Fiber Manufacturing Industry 272850.35
17. 橡胶和塑料制品业 Manufacturing Industriy of Robber and Plastic 176748.10
18. 非金属矿物制品业 Non-Metallic Minerals Product Industry 102462.27
19. 黑色金属冶炼和压延加工业 Ferrous Metal Smelting and Extrusion 18092.25
20. 有色金属冶炼和压延加工业 Non-ferrous Smelting and Extrusion 48592.86
21. 金属制品业 Metalwork Industry 179376.68
22. 通用设备制造业 General-Purpose Equipment Manufacturing Industry 192646.66
23. 专用设备制造业 Specialized Facility Manufacturing Industry 28573.44
注:①各县(市)相加与全市数不等,因全市合计数中包括 110KV 及以上电网线损等。②电力数据越城区包括沥海街道,上虞区不包括沥海街道。

211
交通、邮电及电力
Electricity Consumption (2019)
(10 000 kwh)
越城区Yuecheng
District
柯桥区KeqiaoDistrict
上虞区ShangyuDistrict
诸暨市ZhujiCity
嵊州市Shengzhou
City
新昌县XinchangCounty
817512.97 1656526.11 648847.74 947343.56 301521.29 228343.32
714952.87 1558404.87 580602.48 828035.62 240426.52 191110.36
102560.11 98121.24 68245.26 119307.94 61094.77 37232.96
76392.45 49010.78 35505.89 55227.70 28914.80 19110.26
26167.66 49110.46 32739.37 64080.24 32179.97 18122.70
714952.87 1558404.87 580602.48 828035.62 240426.52 191110.36
10394.29 5683.39 6148.06 5160.49 3169.44 1867.27
556298.76 1427884.38 494196.42 715128.88 191787.44 154181.09
182.40 5857.10 1767.36 2304.23 1056.37 827.67
541134.31 1280665.02 460945.08 669962.92 168473.27 144730.45
2080.11 3690.95 1325.50 1837.51 769.21 181.41
1658.93 1808.50 922.64 741.30 679.44 949.45
3453.48 3800.70 931.66 585.12 3024.72 349.31
5.37 - 0.72 17.59 9.38 5.56
158763.87 875563.22 49310.16 344577.11 43006.16 9446.26
19016.97 42595.27 3973.15 8493.61 16878.49 821.43
4631.03 1769.54 1555.38 2715.21 392.05 819.31
652.61 385.74 881.44 805.29 1522.11 383.69
3019.61 2051.01 2109.14 502.20 1097.39 11.21
5584.32 10503.89 1882.96 1530.06 15976.33 95.80
1608.38 384.29 730.63 3271.18 562.05 300.71
3156.61 2485.10 2283.79 1402.81 558.93 304.13
10.27 250.52 16.02 91.38 29.39 3.62
52366.25 10913.72 183886.79 3097.72 1179.66 3650.67
35592.61 2232.31 41156.57 2592.55 3145.34 21770.70
110769.83 139919.09 3038.74 18966.94 135.88 19.87
41533.13 54004.14 40905.44 26811.34 5134.94 8359.10
17817.63 11946.77 20974.72 41402.75 8702.28 1618.11
-77.29 10783.89 - 7385.65 - -
1775.52 26536.50 8878.19 7040.44 3986.04 376.17
13804.06 31908.69 40977.02 63541.18 18336.34 10809.39
7315.53 14155.33 14977.74 80542.25 10710.20 64945.62
6017.78 5509.97 3566.69 11574.70 596.25 1308.05
Note: a) Since the total number of the city include the line loss of 110 KV and up networks, the sum of the counties does not equal to that of the whole city. b) Yuecheng District includes Lihai Subdistrict and Shangyu District doesn't in electric data.

212
绍兴市统计年鉴2020
5-19 续表
单位:万千瓦时
指 标 Item全 市Whole
Municipality
24. 汽车制造业 Automobile Manufacturing Industry 33741.00
25. 铁路 . 船舶 . 航空航天和其他运输设备制造业 Common Use and Special Purpose Equipment 9538.38
26. 电气机械和器材制造业 Electric Machinery and Equipment Manufacturing Industry 76593.53
27. 计算机、通信和其他电子设备制造业
Manufacturing Industry of Communication Equipment, Computers and Other Electronic Equipment 32531.71
28. 仪器仪表制造业 Manufacturing Industry of Instruments and Meters 2406.47
29. 其他制造业 Other Manufacturing Industries 42796.87
30. 废弃资源综合利用业 Processing of Discarded Resources,and Waste and Cycle 5275.97
31. 金属制品、机械和设备修理业 Metal Products, Machinery and Equipment Repair Industry 2498.24
(三)电力、热力、燃气及水生产和供应业 Production and Supply of Electric Power, Gas and Water 285138.97
三 . 建筑业 Construction 54522.69
四 . 交通运输、仓储和邮政业 Transport, Storage and Post 52312.65
1. 铁路运输业 Railway Transport 33693.47
2. 道路运输业 Highway Transport 8901.90
3. 水上运输业 Waterway Transport 149.08
4. 航空运输业 Air Transport 21.13
5. 管道运输业 Pipeline Transport 940.70
6. 多式联运和运输代理业 Multimodal Transport and Transportation Agents 124.29
7. 装卸搬运和仓储业 Carrying and Storage 7564.06
8. 邮政业 Post 918.01
五 . 信息传输、软件和信息技术服务业 Information Transmission, Software and Information Technology Services 31626.17
六 . 批发和零售业 Wholesale and Retail Trade 127713.00
七 . 住宿和餐饮业 Accommodation and Catering 33094.98
八 . 金融业 Finance 8606.76
九 . 房地产业 Real Estate 81376.03
十 . 租赁和商务服务业 Renting and Business Services 14083.94
十一 . 公共服务及管理组织 Public Service and Management Organization 138296.57
1. 科学研究和技术服务业 Scientific Research and Technical Service 3538.29
2. 水利、环境和公共设施管理业 Water Conservancy, Environment and Public Institution Management 30553.59
3. 居民服务、修理和其他服务业 Service for the Residents,Repair and Others 7633.54
4. 教育、文化、体育和娱乐业 Education, Cultural, Physical and Entertainment Industry 42096.24
5. 卫生和社会工作 Health Care and Social Work 25704.40
6. 公共管理和社会组织、国际组织 Publ ic Administrat ion, Social Organizat ion and International Organizations 28770.50

213
交通、邮电及电力
Continued
(10 000 kwh)
越城区Yuecheng
District
柯桥区KeqiaoDistrict
上虞区ShangyuDistrict
诸暨市ZhujiCity
嵊州市Shengzhou
City
新昌县XinchangCounty
4969.70 5245.82 431.69 6971.06 801.47 15321.26
1847.68 2414.42 2252.07 1864.05 961.73 198.43
10744.79 13155.44 17347.79 17750.42 16553.85 1041.23
10957.86 1454.07 5639.75 3632.37 9508.81 1338.86
125.42 545.40 1562.46 112.34 48.62 12.24
21616.46 1506.88 7925.55 7688.50 3878.96 180.52
298.04 3069.24 1405.29 243.38 189.74 70.28
17.73 74.64 95.41 2174.90 97.50 38.06
14982.05 141362.25 31483.98 42861.73 22257.80 8622.97
12757.50 11484.74 8469.71 7403.97 7552.98 6853.80
11462.24 3365.31 14510.50 20547.77 1461.50 965.33
4287.55 65.16 11977.65 17288.43 74.68 -
2297.41 1596.99 793.20 2182.78 1174.45 857.07
27.34 - 42.35 79.35 0.04 -
- 16.86 - - 4.28 -
836.28 -5.72 10.09 100.05 - -
26.76 0.04 54.42 41.41 - 1.65
3694.86 1584.61 1438.50 633.29 161.66 51.16
292.05 107.37 194.30 222.45 46.38 55.45
7877.50 10592.92 3636.00 4715.94 2849.91 1953.89
28513.71 28595.44 17879.22 33096.16 10963.18 8665.29
11278.15 5154.99 4840.64 5474.00 3546.61 2800.59
3656.88 1306.71 1181.74 829.55 922.62 709.27
25227.62 32326.40 8393.76 8133.16 5356.85 1938.24
3190.73 6413.88 1222.71 877.40 1450.78 928.45
44295.49 25596.70 20123.72 26668.31 11365.22 10247.13
1659.87 683.97 265.52 451.94 216.05 260.94
7604.14 7741.21 4523.10 5568.81 2321.40 2794.94
1549.05 879.38 1774.09 1819.50 926.78 684.75
15556.87 7052.22 6109.93 8608.81 2436.93 2331.48
8327.74 3826.72 3301.23 4984.25 3116.97 2147.50
9597.83 5413.20 4149.85 5235.00 2347.09 2027.53

214
绍兴市统计年鉴2020
主要统计指标解释
公路里程 指在一定时期内实际达到《公路工程技术标准 JTJ0l ─ 88》规定的等级公路,并经公路主管部门
正式验收交付使用的公路里程数。其计算单位为:KM。它包括大中城市的郊区公路以及通过小城镇街道部分
的公路里程,也包括桥梁、渡口的长度,但不包括大中城市的街道、厂矿、林区生产用道和农业生产用道的里程。
两条或多条公路共同经由同一路段,只计算一次,不得重复计算里程长度。公路里程是反映公路建设发展规模
的重要指标,也是计算运输网密度等指标的基础资料。
货 ( 客 ) 运量 指在一定时期内,各运输部门实际运送的货物 ( 旅客 ) 数量。是反映运输业为国民经济和
人民生活服务的数量指标,也是制定和检查运输生产计划,研究运输发展规模和速度的重要指标。货运按吨计
算,客运按人计算。货物不论运输距离长短,货物类别,均按实际重量统计;旅客不论行程远近或票价多少,均按
一人一次作为客运量统计。半价票、小孩票也按一人统计。
货物 ( 旅客 ) 周转量 指在一定时期内,由各种运输工具运送的货物 ( 旅客 ) 数量与其相应运输距离的乘
积之总和,是反映运输业生产总成果的重要指标,也是编制和检查运输生产计划,计算运输效率、劳动生产率以
及核算运输单位成本的主要基础资料。通常以吨公里和人公里为计算单位。计算货物周转量通常按发出站与
到达站之间的最短距离,也就是计费距离计算。
移动电话用户 指在邮电部门登记,通过移动电话交换机进入移动电话网,占有移动电话号码的电话用户。
用户数量以实际办理登记手续进入邮电部门移动电话网的户数计算,一部或一台移动电话统计为一户。
国际互联网用户数 指连接计算机网的网络,范围遍及全世界,包括局域网、城域网和广域网。用户数包括
在邮电部门办理登记手续且已入网的用户数。

215
交通、邮电及电力
Explanatory Notes on Main Statistical Indicators
Length of Highways refers to the length of highways which are built in conformity with the
grades specified by the highway engineering standard formulated by the Ministry of Communications, and
have been formally checked and accepted by the departments of highways and put into use. The length of
highways includes that of the suburb highways at large and medium-sized cities, highways passing through
streets at small cities and towns, and also the length of bridges and ferries. It does not include the length of
streets in big and medium-sized cities and highways built for the production purpose at factories, mines, forest
areas and agricultural areas. If two or more highways go the same section of the way, the length of the section
is only calculated for once and no duplication is allowed. The length of highways is an important indicator
to show the development of the highway construction and to provide essential information to calculate the
transport network density.
Freight (Passenger) Traffic refers to the volume of freight (passenger) transported with various
means. Freight transport is calculated in tons and passenger traffic is calculated in the number of persons.
Despite the type of freight and traveling distance, the freight transport is calculated in the actual weight of the
goods: and despite the traveling distance and ticket price, the passenger traffic is calculated by the principle
that one person can be counted only once in one travel. The passenger who travels with a half price ticket or a
child ticket is also calculated as one person. The freight (passenger) traffic provides a quantitative measure to
show how the transport industry serves the national economy and people, and is also an important indicator
for planning the transport industry and for studying the development scale and speed of the transport industry.
Freight Ton-kilometers (Passenger-kilometers) refer to the sum of the products of the
volume of transported cargo (passengers) multiplying by the transport distance, usually using ton-kilometer
and passenger-kilometer as units for measurement. Normally, the shortest distance between the departure
station and the destination station (i.e., the payable distance) is the basis to calculate the freight ton-kilometers.
This is an important indicator to show the total results of the transport industry, to prepare and examine the
transport plan and to measure the efficiency, the labor productivity and the unit cost of transport.
The formula is as follows:
Freight Ton-kilometers (Passenger-kilometers)=∑{Freight (Passenger) Traffic×Distance of Transportation}
Measuring unit: ton-kilometer (person-kilometer)
Mobile Telephone Subscribers refer to the persons who own mobile telephone numbers and
are connected with the mobile telephone communication network through the mobile telephone switchboards.
The number of subscribers is calculated by the subscribers who have completed registration and have entered
into the mobile telephone network. One mobile telephone is taken as a subscriber.
Internet Subscribers refer to the nets connect the computer with the scope of all over the world,
involved direct net, city nets and world-wide-web. The amount involves the subscribers sign up in the post
office and applied for the Internet.


固定资产投资和建筑业6 CHAPTER 6 INVESTMENT FIXED ASSET, CONSTRUCTION

218
绍兴市统计年鉴2020
房 地 产 投 资Investment in Real Estate
0.80 18.22 36.15
297.80
103.33128.57
178.59202.06210.46
622.65641.19
678.07
798.16825.23
0
100
200
300
400
500
600
700
800
900
1990 1995 2000 2005 2006 2007 2008 2009 2010 2015 2016 2017 2018 2019
单位:亿元(100 million yuan)

219
固定资产投资和建筑业
6-1 历年分区、县(市)固定资产投资完成情况Investment in Fixed Assets by District and County (City)
单位:万元 / 增速(%) (10 000 yuan/%)
年 份Year
全 市Whole
Municipality
越城区Yuecheng
District
柯桥区Keqiao District
上虞区Shangyu District
诸暨市ZhujiCity
嵊州市Shengzhou
City
新昌县Xinchang County
1985 91199 14656 36490 14629 11297 8565 5562
1986 105796 20010 36808 18503 12465 10674 7336
1987 145438 21549 56829 26165 19426 12065 9404
1988 180734 27804 68770 29873 23250 18167 12870
1989 164330 24164 63035 27510 22340 16467 10814
1990 172053 26802 63564 27791 21937 19450 12509
1991 244522 39597 97689 36554 31778 24491 14413
1992 446114 88259 187514 64691 43249 38437 23964
1993 1113334 229305 476373 181522 135859 49886 40389
1994 1365648 343260 413708 281572 170162 84408 72598
1995 1623146 296269 520951 354325 254324 94676 102601
1996 1775979 306788 644014 316622 323521 88286 96748
1997 1645175 263643 535625 289445 351042 89790 115630
1998 1701775 303936 440282 301621 364521 147485 143930
1999 1910004 368786 426538 345087 386872 186403 196318
2000 2471758 625330 455071 449359 442916 207467 291615
2001 2865486 882621 574631 426809 484175 258705 238545
2002 3674797 991002 978044 517439 668223 350955 306770
2003 5350324 1674106 1465906 660001 885179 450318 414814
2004 6291005 1780256 1750399 852928 1119275 552826 465321
2005 6761274 1613747 1701098 951719 1452253 628835 413622
2006 7657451 1853917 1930531 1067368 1650809 696341 458485
2007 8433749 1905495 2145773 1258393 1855540 738990 529558
2008 9157476 1844390 2423840 1453185 2048263 798102 589696
2009 10550321 2291186 2720659 1659054 2277492 933589 668341
2010 12455609 2740810 3116361 1980031 2739361 1099745 779301
2011 14262594 3079529 3568042 2410721 3246709 1174366 783227
2012 17225646 3494601 4300358 2965372 4110993 1391712 962610
2013 20019855 4056194 4916245 3475055 4822789 1625096 1124476
2014 23046833 4255258 5769451 4090485 5687691 1921196 1322752
2015 25828403 4143197 6631446 4850575 6490347 2230187 1482651
2016 28824824 4064395 7466694 5481183 7410546 2691198 1710808
2017 31156693 4365613 8195193 5396345 8254693 2995141 1949708
2018(增速) 1.9 27.2 0.7 -11.1 -20.2 17.0 4.4
2019 10.2 13.1 8.9 11.3 7.3 2.5 -3.3
注:① 1985-2010 年为全社会固定资产投资 ,2011 年起改为固定资产投资(计划总投资 500 万元及以上项目投资和房地产开发投资)。② 2018 年起因 500-5000 万元投资项目财务支出法改革 , 只出增速 , 下同。
Note: a) In 1985-2010, it was referred as "Total Investment in Fixed Assets", and instead of "Investment in Fixed Assets"(the projects completed and investment of real estate development plan a total investment of 5000 million yuan and above)since 2011. b) Since 2018, due to the reform of the financial expenditure law for investment projects of 5-50 million yuan, only the growth rate will be provided, the same below.

220
绍兴市统计年鉴2020
6-2 分区、县(市)固定资产投资增速(2019年)
单位:%
指 标 Item全 市Whole
unicipality
一、固定资产投资合计 Investment in Fixed Assets 10.2
#建筑安装工程投资 Construction and Installation 27.0
1. 房地产开发投资 Investment of Real Estate Development 3.4
2. 项目完成投资数 Number of Projects Completed 15.3
#工业投资 Industrial Investment 6.7
#基础设施投资 Infrastructure Investment 24.2
二、按国有控股情况分 By Type of State-Holding
国有投资 State-owned Units 16.4
非国有投资 Non-State-owned Units 7.7
#民间投资 Nongovernmental Investment 8.6
三、按国民经济行业分组 Grouped by Sector
农林牧渔业 Farming, Forestry, AnimalHusbandry and Fishery 15.5
农业 Farming 17.0
林业 Forestry -34.0
畜牧业 Animal Husbandry 249.5
渔业 Fishery -36.2
农林牧渔专业及辅助性活动 Services 8.5
采矿业 Mining and Quarrying ***
非金属矿采选业 Nonmetal Minerals Mining and Dressing ***
制造业 Manufacturing 10.3
农副食品加工业 Non-staple Food Processing 35.7
食品制造业 Food Manufacturing -29.2
酒、饮料和精制茶制造业 Wine, Soft Drinks and Refined Tea Manufacturing -50.5
纺织业 Textile Industry -14.3
纺织服装和服饰业 Garments and ApparelIndustryindustry -20.1
皮革、毛皮、羽毛 ( 绒 ) 及其制品业
Leather, Furs, Down and Related Production, Shoes Manufacturing -21.9
木材加工及木、竹、藤、棕、草制品业
Timber Processing, Bamboo, Cane Palm Fiber and Straw ProductionTimber Processing, Bamboo, Cane Palm Fiber and StrawProduction
-41.1
家具制造业 Furniture Manufacturing -1.6
造纸及纸制品业 Papermaking and Paper Production 36.5
印刷业和记录媒介的复制业 Printing and Record Medium Reproduction 3.5
文教体育用品制造业 Cultural and Educational, Artsand Crafts, Sports and Chemical Production -28.9
石油加工、炼焦及核燃料加工业
Petroleum Processing, Cookingand Nuclear Fuel Processing 54.0
化学原料及化学制品制造业 Raw Chemical Materials andChemical Production 31.2
医药制造业 Medical and Pharmaceutical Production 46.7
注: 表格中“***”表示该数据去年数值为零,增速无法计算。

221
固定资产投资和建筑业
Investment in Fixed Assets Growth by District and County (City) (2019)
%
越城区Yuecheng
District
柯桥区KeqiaoDistrict
上虞区ShangyuDistrict
诸暨市ZhujiCity
嵊州市Shengzhou
City
新昌县XinchangCounty
13.1 8.9 11.3 7.3 2.5 -3.3
35.5 13.9 42.6 15.8 39.2 5.0
6.2 16.9 -1.0 6.6 -14.8 -21.7
23.8 3.3 20.3 7.8 16.7 4.7
29.3 -3.3 21.6 6.3 12.2 -3.7
45.9 7.8 19.8 -7.7 18.4 12.7
15.9 28.3 21.6 -7.0 27.6 10.2
11.9 0.7 7.4 10.4 -5.8 -13.6
13.1 1.4 7.0 10.6 -2.8 -13.7
*** 114.1 47.9 17.4 -16.8 -100.0
114.1 47.9 21.2 -31.6
-34.0
249.5
-36.2
3.7 24.4 -100.0
*** *** *** *** *** *** *** ***
21.8 2.8 26.9 9.9 16.4 -8.0
1131.0 *** 5.1 -42.6 1144.2
-37.7 -83.4 23.7 -48.3 1.2
28.1 -65.1 -69.5 66.8
-69.5 -15.5 79.6 38.6 -21.3 96.0
*** -51.5 -63.5 -20.4 -8.1 71.7
-24.7 261.2 -100.0 -17.5
*** -87.1 -57.0
428.4 351.5 134.3 2511.3 -57.0 159.3
-81.3 750.7 146.1 -79.5 73.7
*** -69.7 *** -32.5 *** ***
64.2 32.5 3367.5 -51.7 -80.2 -26.1
54.0
-76.5 71.0 52.7 142.4 101.6 *** -7.6 -76.5 65.8 259.9 0.9 43.3
Note: "***" in the table means that the value of this data was zero last year, which makes it impossible to calculate the growth rate.

222
绍兴市统计年鉴2020
6-2 续表1
单位:%
指 标 Item全 市Whole
unicipality
化学纤维制造业 Chemical Fiber -25.9
橡胶和塑料制品业 Rubber and Plastic Production 35.2
非金属矿制品业 Nonmetal Mineral Production 3.1
黑色金属冶炼及压延加工业 Smelting and Pressing of Ferrous MetalsMetals 64.6
有色金属冶炼及压延加工业 Smelting and Pressing of Nonferrous Metals 15.5
金属制品业 Metal Production 18.2
通用设备制造业 Ordinary Machinery 24.5
专用设备制造业 For Special Purpose Equipment Manufacturing 38.5
汽车制造业 Automotive Manufacturing 63.9
铁路、船舶、航空航天等制造业 Railway, Shipbuilding, Aerospace and other Equipment -77.4
电气机械及器材制造业 Electric Equipment and Machinery -17.1
计算机、通信和其他电子设备制造业 Computers, Communications and Other Electronic Equipment Manufacturing 164.9
仪器仪表制造业 Instruments Manufacturing -49.8
其他制造业 Other Manufacturing 17.2
废弃资源综合利用业 Comprehensive Utilization of Waste Resource -39.1
电力、热力、燃气及水的生产和供应业 Electricity, Heating Power, Gas and Water Production and Supply -46.6
电力、热力的生产和供应业 Production and Supply of Electricity and Heating Power -30.2
燃气生产和供应业 Production and Supply of Gas 233.6
水的生产和供应业 Production and Supply of Water -81.7
建筑业 Construction ***
土木工程建筑业 Civil Engineering ***
建筑安装业 Construction and Installation
批发和零售业 Wholesale and Retail Trade 17.6
批发业 Wholesale -12.2
零售业 Retail Sale 26.9
交通运输、仓储和邮政业 Transport, Storage and Post 43.3
铁路运输业 Railway Transport 153.3
道路运输业 Highway Transport 29.1
水上运输业 Waterway Transport 151.9
管道运输业 Pipeline Transport -95.8
装卸搬运和仓储业 Carrying and Storage 1.7
住宿和餐饮业 Hotels and Catering Services -13.2
住宿业 Hotels 27.6
餐饮业 Catering Services -86.7
信息传输、软件和信息技术服务业 Information Transmission, Software and Information Technology Services -14.6

223
固定资产投资和建筑业
Continued 1
%
越城区Yuecheng
District
柯桥区KeqiaoDistrict
上虞区ShangyuDistrict
诸暨市ZhujiCity
嵊州市Shengzhou
City
新昌县XinchangCounty
-95.3 13.9 -67.7 -53.5
-84.6 42.9 9.4 64.1 173.0 -21.7
-3.7 58.1 -44.1 -13.6 -1.0 171.4
*** -93.9 -20.0 138.4
66.1 -43.1 -2.8 106.0 378.8 ***
877.4 -20.8 56.2 -3.7 25.6 193.4
258.7 38.2 47.7 -19.0 86.8 15.5
5024.2 797.2 83.4 -14.9 -38.7 79.2
-82.9 79.8 34.6 94.1 309.9 10.3
1.2 *** 92.5 203.7 -91.9
-77.9 -28.4 -26.6 -38.6 8.1 -53.6
325.0 41.8 402.6 91.7 64.2 53.1
-100.0 -60.8 -62.0 568.0
*** -22.0 -29.9 -67.6 41.1
-42.2 -90.2 -84.6 40.9 1283.5
168.0 -58.9 -95.5 -70.5 -43.9 -22.4
997.2 -31.1 -95.2 -73.3 -61.5 -24.8
42.3 *** *** ***
-100.0 -96.0 -99.5 -94.1 -39.6 -81.5
*** *** *** *** *** *** ***
-25.6 6368.3 -82.1 47.6 -86.0 469.5
8416.0 3626.7 -59.5 ***
-51.3 *** -82.1 149.1 -86.0 436.9
159.0 7.3 24.1 25.8 9.8 21.4
158.8 13.4 80.3 4.1 8.9 25.3
-100.0 473.3 125.6
-100.0 -100.0 -82.8
184.0 -90.8 -11.0 562.8 -98.1 -100.0
-79.5 70.7 83.3 -9.7 1371.2 -51.8
25.5 70.7 83.3 1.4 1371.2 -51.8
-98.9 -49.3
-30.2 *** *** 30.5 *** ***

224
绍兴市统计年鉴2020
6-2 续表2
单位:%
指 标 Item全 市Whole
unicipality
电信、广播电视和卫星传输服务业
Telecommunication, Radio and Television, Satellite Transmission Services -31.8
软件和信息技术服务业 Software and Information Technology Services 299.8
金融业 Banking 1.4
货币金融服务 Monetary and Financial Services 1.4
房地产业 Real Estate 0.1
租赁和商务服务业 Renting and Business Services 88.0
租赁业 Ieasing industry 66.1
商务服务业 Commercial Services 88.5
科学研究和技术服务业 Scientific Research and Technical Services 138.7
研究与试验发展 Research and Experiment Development 48.8
专业技术服务业 Technical Services 399.7
科技推广和应用服务业 Promotion and Application of Science and Technology Services 323.8
水利、环境和公共设施管理业 Water Conservancy, Environment and Public Facilities Management 17.2
水利管理业 Water Conservancy 10.2
生态保护和环境治理业 Ecological Protection and Environmental Management 183.7
公共设施管理业 Public Facilities 15.0
居民服务和其他服务业 Service for the Residents and Others 151.1
居民服务业 Resident Services 323.7
机动车、电子产品和日用产品修理业
Motor Vehicles, Electronics and Household Goods Repair Industry
其他服务业 Other Services -100.0
教育 Education 75.1
卫生和社会工作 Health Care and Social Work -9.8
卫生 Health Care 3.3
社会工作 Social Work -25.1
文化、体育和娱乐业 Culture,Sports and Recreation -16.0
广播、电视、电影和影视录音制作业 Radio, Television, Film and Video Recording Production -61.4
文化艺术业 Culture and Arts -7.2
体育 Sports -68.5
娱乐业 Recreation -9.6
公共管理和社会组织 Public Administration and Social Organization 8.0
国家机构 Government Agencies 0.9
基层群众自治组织 Mass Grassroot Organizations ***

225
固定资产投资和建筑业
Continued 2
%
越城区Yuecheng
District
柯桥区KeqiaoDistrict
上虞区ShangyuDistrict
诸暨市ZhujiCity
嵊州市Shengzhou
City
新昌县XinchangCounty
-31.8
-35.0 ***
1.4 *** *** *** *** ***
1.4
-1.1 10.4 -5.1 8.6 -14.0 -15.5
301.2 87.0 143.3 -21.1 26.1 -34.8
66.1
301.2 87.0 143.3 -26.9 26.1 -34.8
99.1 *** 98.4 69.5 55.1 628.2
43.4 109.7 -32.7 -100.0
-44.3 *** -100.0 16101.8 318.5 -83.0
206.6 *** *** -11.6 ***
20.3 26.0 23.5 -4.3 28.0 13.1
12.3 12.4 15.8 22.8 -3.7 -22.5
74.0 343.1 107.4 50.1 78.5 ***
21.6 12.3 22.2 -14.4 32.9 17.3
21.9 *** 1196.0 -24.9 *** ***
85.9 1196.0 98.5
***
-100.0 -100.0
130.0 71.4 75.9 29.5 887.0 -19.8
129.3 -39.9 89.7 -33.8 -48.6 12.8
152.8 -35.9 89.7 -47.5 -53.1 289.0
124.8 -100.0 -24.7 -33.8 -51.6
-56.6 -11.8 -56.7 62.6 -46.1 -68.1
-100.0 -23.9
-49.6 -35.6 14.8 240.2 -43.3 -83.7
-64.3 -73.1 22.3 -83.0
-10.3 250.3 34.4 -71.1
-100.0 *** 10.2 -21.5 128.1 6.0
-100.0 8.0 -21.5 59.4 6.0
*** ***

226
绍兴市统计年鉴2020
6-3 历年房地产开发投资主要指标单位:万元
指 标 Item 2004 2005 2006
房地产开发投资额 Real Estate Development 1203434 1033309 1285667
按区、县 ( 市 ) 分 Grouped by District and County (City)
越城区 Yuecheng District 463204 326728 350893
柯桥区 Keqiao District 319169 278785 341145
上虞区 Shangyu District 138980 113328 186059
诸暨市 Zhuji City 137685 217322 258144
嵊州市 Shengzhou City 87926 69035 111735
新昌县 Xinchang County 56470 28111 37691
按资金来源分 Grouped by Source of Funds
国内贷款 Domestic Loans 355105 280882 412534
利用外资 Foreign Investment 475 500 95450
自筹资金 Fund Raising 338600 354159 483579
其他资金 Others 883782 655624 1037934
按构成分 Grouped by Use of Funds
建筑工程 Construction 679168 599518 704392
安装工程 Installation 33646 27807 55342
设备、工器具购置 Purchase of Equipment and Instruments 8555 4589 12756
其他费用 Others 482065 401395 513177
按用途分 Grouped by Purpose
住宅 Residential Buildings 936902 830717 909152
办公楼 Office Buildings 48154 54440 111526
商业营业用房 Houses for Business Use 193760 120648 201635
其他 Others 24618 27504 63354
新增固定资产 Newly Increased Fixed Assets 479175 470527 518807
竣工房屋价值 Value of Buildings Completed 423556 411849 447320
房屋建筑面积 ( 万平方米 ) Floor Space of Buildings (10 000 sq.m)
施工面积 Floor Space under Construction 1099.93 1122.53 1359.11
#住宅 Residential Buildings 901.35 918.15 1019.27
竣工面积 Floor Space Completed 411.32 363.95 330.17
#住宅 Residential Buildings 339.87 299.77 271.53
房屋竣工率 (%) Rate of Floor Space of Buildings Completed 37.4 32.4 24.3
商品房销售面积 ( 万平方米 ) Floor Space of Selling Houses (10 000 sq.m) 359.72 367.19 387.12
商品房待售面积 ( 万平方米 ) Floor Space of Leaving Unused (10 000 sq.m) 97.00 138.48 191.36
商品房销售额 Total Sales of Commercial Houses 861487 1371516 1696779

227
固定资产投资和建筑业
Main Statistical Indicators of Investment in Real Estate Development over the Years
(10 000 yuan)
2007 2008 2009 2010 2015 2016 2017 2018 2019
1785888 2020573 2104629 2978018 6226472 6411932 6780731 7981645 8252279
527426 583076 655664 813303 1380363 1199833 1421693 2471949 2623711
428997 608193 614246 966942 1466524 1568337 1646727 1797142 2101282
274856 394745 359935 420434 927320 917006 747872 912431 903092
379451 222081 270687 444061 1682820 1762921 1765641 1277068 1361339
127124 121278 86401 164300 426063 585442 759858 1022116 870705
48034 91200 117696 168978 343382 378393 438940 500939 392150
527303 513655 638492 774110 551077 774931 949602 1195641 1882485
32520 4145 1786 - 9800 - - 7350 -
745799 727376 799902 1527790 2532021 2302752 2856721 3695310 3291608
1481627 884002 2251878 2713498 3879387 4680077 5606986 189841 191375
895704 1102823 1187520 1636298 3721579 4180817 4478969 2732461 3364069
72066 88911 118065 129762 616959 564074 488792 268959 195155
12567 30442 31718 19733 79854 149080 91521 48423 64964
805551 798397 767326 1192225 1808080 1517961 1721449 4931802 4628091
1290289 1345987 1399917 1995613 4276397 4313513 5032049 6348705 6301705
119111 245836 185664 197515 363484 489061 357189 167478 133859
240239 251250 372623 603109 1070237 1070319 882398 515012 423451
136249 177500 146425 181781 516354 539039 509095 950450 1393264
691337 1058216 1409181 1178436 3241113 5420810 3059472 2318430 3749856
559556 886824 1248678 942807 2250090 4106451 2139288 1891792 2679273
1665.89 1803.63 1902.49 2178.88 3822.27 3607.11 3200.18 3504.68 4056.83
1221.16 1230.90 1295.85 1466.06 2574.26 2389.36 2164.29 2371.05 2678.89
356.69 390.43 469.18 344.90 696.63 1146.89 588.72 529.62 735.30
254.47 274.28 332.24 223.07 470.05 811.52 414.01 376.96 457.80
21.4 21.6 24.7 15.8 18.2 31.8 18.4 15.1 18.1
479.38 216.87 476.45 610.35 677.76 772.61 1038.69 1067.61 1104.91
154.84 201.88 217.41 177.83 614.54 718.59 524.42 422.27 347.48
2423011 1161205 3029877 4634095 5487042 6141937 9345384 12100006 13382725

228
绍兴市统计年鉴2020
6-4 分区、县(市)房地产开发投资(2019年)
指 标 Item全 市Whole
Municipality
单位数 ( 个 ) Number (unit) 788
计划总投资 ( 万元 ) Total Planning Investment (10 000 yuan) 39293783
本年完成投资 ( 万元 ) Investment Completed This Year (10 000 yuan) 8252279
#土地购置费 Land Fees Purchased 4208670
#住宅 Residential Buildings 6301705
房屋施工面积 ( 万平方米 ) Floor Space under Construction (10 000 sq.m) 4056.83
#住宅 Residential Buildings 2678.89
新开工 ( 万平方米 ) Floor Space Started (10 000 sq.m) 1145.72
#住宅 Residential Buildings 732.18
竣工面积 ( 万平方米 ) Floor Space Completed (10 000 sq.m) 735.30
#住宅 Residential Buildings 457.80
商品房销售面积 ( 万平方米 ) Floor Space of Selling Houses (10 000 sq.m) 1104.91
#住宅 Residential Buildings 824.42
待售面积 ( 万平方米 ) Floor Space of Leaving Unused (10 000 sq.m) 347.48
#住宅 Residential Buildings 83.33
商品房销售额 ( 万元 ) Total Sales of Commercial Houses (10 000 yuan) 13382725
#住宅 Residential Buildings 11496550
注:为了房地产单位数与名录库保持一致,以上单位数包括全市所有房地产企业。

229
固定资产投资和建筑业
Investment in Real Estate Development in Each District and County (City) (2019)
越城区Yuecheng
District
柯桥区KeqiaoDistrict
上虞区ShangyuDistrict
诸暨市ZhujiCity
嵊州市Shengzhou
City
新昌县XinchangCounty
174 200 94 205 61 54
11267998 8486630 4510740 8249135 4512631 2266649
2623711 2101282 903092 1361339 870705 392150
1620905 1158315 493220 538262 275274 122694
1875568 1702228 649637 1087994 660400 325878
851.15 847.45 421.17 1023.38 600.60 313.09
565.61 567.54 258.33 633.68 431.23 222.49
322.35 225.84 168.04 229.91 92.02 107.56
193.74 146.64 97.55 149.28 75.63 69.33
126.07 126.92 67.29 221.22 164.34 29.47
72.79 86.08 47.26 120.55 113.06 18.06
253.90 338.54 126.78 224.25 87.25 74.19
209.90 208.96 114.73 167.36 73.30 50.17
61.91 64.76 47.81 106.77 50.62 15.61
19.45 12.69 14.50 21.95 11.69 3.05
4295946 4077485 1765632 1978364 701378 563920
3908585 3123316 1663135 1710381 635441 455692
Note: To keep the real estate units and list of libraries identical, above units include all real estate companies of the city.

230
绍兴市统计年鉴2020
6-5 分区、县(市)建筑企业生产情况(2019年)
指 标 Item全 市Whole
Municipality
建筑业总产值 ( 亿元 ) Gross Output Value (100 million yuan) 4682.27
#建筑工程 ( 亿元 ) Construction (100 million yuan) 4118.71
竣工产值 ( 亿元 ) Output Value of Construction Completed (100 million yuan) 3104.76
房屋建筑施工面积 ( 万平方米 ) Floor Space of Buildings under Construction (10 000 sq.m) 48088.54
#本年新开工面积 ( 万平方米 ) Floor Space Started This Year (10 000 sq.m) 14006.97
房屋建筑竣工面积 ( 万平方米 ) Floor Space of Building Completed (10 000 sq.m) 14040.86
自有机械设备年末总台数 ( 台 ) Number of Machinery and Equipment Qwned (set) 200730
自有机械设备年末总功率 ( 万千瓦 ) Total Power of Machinery and Equipment Owned (10 000 kw) 383.50
自有机械设备净值 ( 亿元 ) Net Value of Machinery and Equipment Owned (100 million yuan) 76.73
从事建筑业活动的平均人数 ( 万人 ) Average Number of People Engaged in Construction (10 000 persons) 153.83

231
固定资产投资和建筑业
Productive Condition and Financial Indicators of Construction Enterprises by District and County (City) (2019)
越城区Yuecheng
District
柯桥区KeqiaoDistrict
上虞区ShangyuDistrict
诸暨市ZhujiCity
嵊州市Shengzhou
City
新昌县XinchangCounty
669.19 1528.85 1115.45 1106.37 209.80 52.61
610.19 1368.32 1042.97 869.69 184.36 43.19
453.85 996.68 763.14 707.81 148.14 35.13
5751.23 14435.25 9330.94 17034.04 1165.19 371.89
2103.62 5187.91 3575.89 2262.66 705.19 171.71
2176.48 4591.94 3099.28 3378.79 619.62 174.75
23799 63252 40597 55032 14087 3963
47.70 152.22 79.13 79.08 19.08 6.28
19.59 22.78 13.49 13.59 5.25 2.02
22.49 41.54 40.84 37.84 8.52 2.60

232
绍兴市统计年鉴2020
6-6 全市建筑企业生产情况(2019年)
指 标 Item总 计Total
建筑业总产值 ( 亿元 ) Gross Output Value (100 million yuan) 4682.27
1. 建筑工程 Construction 4118.71
2. 安装工程 Installation 423.23
3. 其他产值 Others 140.32
竣工产值 ( 亿元 ) Output Value Of Contraction Completed (100 million yuan) 3104.76
房屋建筑施工面积 ( 万平方米 ) Floor Space of Buildings under Construction (10 000 sq.m) 48088.54
#本年新开工面积 Floor Space Started This Year 14006.97
房屋建筑竣工面积 ( 万平方米 ) Floor Space of Buildings Completed (10 000 sq.m) 14040.86
自有机械设备年末总台数 ( 台 ) Number of Machinery and Equipment Owned (set) 200730
自有机械设备年末总功率 ( 万千瓦 ) Total Power of Machinery and Equipment Owned (10 000 kw) 383.50
自有机械设备净值 ( 亿元 ) Net Value of Machinery and Equipment Owned (100 million yuan) 76.73
从事建筑业活动的平均人数 ( 万人 ) Average Number of People Engaged in Construction (10 000 persons) 153.83

233
固定资产投资和建筑业
Productive Condition of Construction Enterprises (2019)
按资质等级分 (Grouped by Grade)
施工总承包Total Construction
Contracting
专业承包Special
Contracting
特级企业Special Grade Construction Enterprises
一级企业The First Grade
Construction Enterprises
二级企业The Second Grade
Construction Enterprises
三级企业The Third Trade
Construction Enterprises
4325.15 1684.21 2135.86 361.84 143.25 357.12
3850.70 1565.63 1858.59 305.10 121.38 268.01
341.46 107.05 189.56 35.03 9.81 81.78
132.99 11.52 87.72 21.70 12.05 7.33
2904.33 1286.26 1283.60 241.19 93.27 200.43
47468.24 22009.32 22138.12 2511.91 808.90 620.29
13640.31 6392.89 5914.69 850.57 482.16 366.66
13671.59 6833.65 5450.92 980.33 406.69 369.27
187260 50690 100314 26049 10207 13470
369.95 77.47 232.27 40.17 20.04 13.54
72.53 28.40 26.15 12.75 5.22 4.19
145.88 57.50 68.01 14.38 5.99 7.95

234
绍兴市统计年鉴2020
6-7 全市建筑企业财务情况(2019年)
指 标 Item总 计Total
一、年末资产负债 Assets and Liabilities (Year-end)
流动资产合计 Circulating Funds 1915.39
#存货 Inventories 494.64
#在建工程 Projects under Construction 13.84
固定资产原价 Original Value of Fixed Assets 285.65
累计折旧 Accumulative Depreciation 139.85
#本年折旧 Depreciation This Year 16.35
资产总计 Total Assets 2252.84
流动负债合计 Circulating Funds 1130.15
非流动负债合计 Non Curent Liabilities 40.60
所有者权益合计 Creditors' Equity 1057.60
二、损益及分配 Expenditure, Income and Distribution
主营业务收入 Main Business Income 3441.71
主营业务成本 Main Business Cost 3229.25
主营业务税金及附加 Taxes and Extra Charges of Main Business 28.15
其他业务利润 Other Profit from Business 0.88
管理费用 Management Cost 58.46
利润总额 Total Profits 89.48
所得税费用 Income Tax Expense 20.50
应交增值税 Value Added Taxes Payable 91.15
应付职工薪酬 Employee compensation payable 784.05
亏损企业个数 Number of Deficits Enterprises 112
单位:亿元

235
固定资产投资和建筑业
Financial Indicators of Construction Enterprises (2019)
按资质等级分 (Grouped by Grade)
施工总承包Total Construction
Contracting
专业承包Special
Contracting
特级企业Special Grade Construction Enterprises
一级企业The First Grade
Construction Enterprises
二级企业The Second Grade
Construction Enterprises
三级企业The Third Trade
Construction Enterprises
1591.75 573.67 667.32 212.90 137.85 323.65
443.12 154.54 214.18 56.59 17.80 51.53
12.72 1.36 7.59 2.14 1.62 1.12
252.93 79.75 112.81 43.96 16.42 32.72
124.43 38.30 56.82 21.86 7.46 15.42
14.33 3.08 7.24 2.71 1.30 2.02
1864.10 673.58 781.95 254.03 154.54 388.74
913.70 314.60 387.56 125.18 86.37 216.45
40.04 24.70 4.58 7.75 3.00 0.56
889.06 334.22 378.64 114.52 61.68 168.54
3139.00 1168.14 1532.79 302.95 135.13 302.71
2958.64 1113.39 1446.34 274.07 124.84 270.61
26.86 11.66 11.17 2.77 1.25 1.30
0.64 0.32 0.17 0.07 0.09 0.23
48.96 10.54 23.39 9.67 5.36 9.50
76.69 25.63 38.14 10.17 2.76 12.79
18.23 6.46 8.74 2.34 0.69 2.27
84.81 28.65 44.62 7.94 3.60 6.34
742.65 308.99 338.29 66.93 28.44 41.39
79 2 10 15 52 33
(100 million yuan)

236
绍兴市统计年鉴2020
6-8 分区、县(市)建筑企业生产、财务情况(2019年)
指 标 Item全 市Whole
Municipality
建筑业总产值 ( 亿元 ) Gross Output Value (100 million yuan) 4682.27
#建筑工程 ( 亿元 ) Construction (100 million yuan) 4118.71
竣工产值 ( 亿元 ) Output Value of Construction Completed (100 million yuan) 3104.76
房屋建筑施工面积 ( 万平方米 ) Floor Space of Buildings under Construction (10 000 sq.m) 48088.54
#本年新开工面积 ( 万平方米 ) Floor Space Started This Year (10 000 sq.m) 14006.97
房屋建筑竣工面积 ( 万平方米 ) Floor Space of Building Completed (10 000 sq.m) 14040.86
自有机械设备年末总台数 ( 台 ) Number of Machinery and Equipment Qwned (set) 200730
自有机械设备年末总功率 ( 万千瓦 ) Total Power of Machinery and Equipment Owned (10 000 kw) 383.50
自有机械设备净值 ( 亿元 ) Net Value of Machinery and Equipment Owned (100 million yuan) 76.73
从事建筑业活动的平均人数 ( 万人 ) Average Number of People Engaged in Construction (10 000 persons) 153.83
流动资产合计 ( 亿元 ) Circulating Funds (100 million yuan) 1915.39
固定资产原价 ( 亿元 ) Original Value of Fixed Assets (100 million yuan) 285.65
资产总计 ( 亿元 ) Total Assets (100 million yuan) 2252.84
流动负债合计 ( 亿元 ) Circulating Liabilities (100 million yuan) 1130.15
非流动负债合计 ( 亿元 ) Non Current Liabilities (100 million yuan) 40.60
主营业务收入 ( 亿元 ) Main Business Income (100 million yuan) 3441.71
主营业务成本 ( 亿元 ) Main Business Cost (100 million yuan) 3229.25
主营业务税金及附加 ( 亿元 ) Taxes and Extra Charges of Main Business (100 million yuan) 28.15
利润总额 ( 亿元 ) Total Profits (100 million yuan) 89.48
所得税费用 ( 亿元 ) Income Tax Expense (100 million yuan) 20.50
应交增值税 ( 亿元 ) Value Added Taxes Payable (100 million yuan) 91.15
应付职工薪酬 ( 亿元 ) Employee compensation payable (100 million yuan) 784.05

237
固定资产投资和建筑业
Productive Condition and Financial Indicators of Construction Enterprises by District and County (City) (2019)
越城区Yuecheng
District
柯桥区KeqiaoDistrict
上虞区ShangyuDistrict
诸暨市ZhujiCity
嵊州市Shengzhou
City
新昌县XinchangCounty
669.19 1528.85 1115.45 1106.37 209.80 52.61
610.19 1368.32 1042.97 869.69 184.36 43.19
453.85 996.68 763.14 707.81 148.14 35.13
5751.23 14435.25 9330.94 17034.04 1165.19 371.89
2103.62 5187.91 3575.89 2262.66 705.19 171.71
2176.48 4591.94 3099.28 3378.79 619.62 174.75
23799 63252 40597 55032 14087 3963
47.70 152.22 79.13 79.08 19.08 6.28
19.59 22.78 13.49 13.59 5.25 2.02
22.49 41.54 40.84 37.84 8.52 2.60
283.31 499.76 606.53 408.30 79.02 38.46
43.97 85.42 70.89 55.80 23.47 6.10
352.23 573.31 712.95 471.05 97.13 46.17
172.96 300.11 349.46 232.13 44.58 30.91
4.47 2.57 20.64 10.89 1.25 0.78
554.72 1115.32 771.69 766.09 179.36 54.53
523.62 1050.22 719.68 721.04 163.45 51.24
2.64 10.63 7.52 5.78 1.17 0.41
13.89 24.90 21.98 20.77 7.15 0.80
3.38 5.29 4.63 5.25 1.62 0.32
11.60 28.83 21.60 22.90 4.54 1.68
128.69 254.84 172.72 176.07 38.42 13.30

238
绍兴市统计年鉴2020
主要统计指标解释
固定资产投资 指建造和购置固定资产的经济活动,即固定资产的再生产活动。固定资产投资属于实物投
资,它的承担物为机器、设备和建筑物等。固定资产再生产过程包括固定资产的更新、改建、扩建和新建活动(不
包括大修理、养护、维护性质的工程)。
房地产开发投资 指各种登记注册类型的房地产开发公司、商品房建设公司及其他房地产开发法人单位和
附属于其他法人单位实际从事房地产开发或经营活动的单位统一开发的包括统代建、拆迁还建的住宅、厂房、仓
库、饭店、宾馆、度假村、写字楼、办公室等房屋建筑物和配套的服务设施,土地开发工程 ( 如道路、给水、排水、供
电、供热、通讯、平整场地等基础设施工程 ) 的投资;不包括单纯的土地交易活动。
民间投资 民间投资是固定资产投资额中依据投资主体经济类型的不同进行划分的一种分组形式。按控
股情况分,民间固定资产投资包括集体经济和个体私营经济控股的投资主体进行的固定资产投资活动。也就是
固定资产投资中扣除国有、外商和港澳台商腔股的投资主体进行的固定资产投资活动。
基础设施投资 目前关于基础设施的界定,国际、国内尚没有统一的标准。我们通常在进行基础设施投资
分析时,采用的基础设施投资的范围如下:
① 水利、环境和公共设施管理业
② 电力、燃气及水的生产供应业
③ 交通运输、仓储和邮政业
④ 电信和其他信息传输服务业
⑤ 教育设施
⑥ 广播、电视、电影和音像业
⑦ 文化艺术业
⑧ 体育设施
⑨ 卫生设施
房屋施工面积 是从房屋外墙线算起的各层平面面积的总和,包括可供使用的有效面积和房屋结构 ( 如柱、
墙 ) 占用的面积。多层建筑按各自然层 ( 包括地下室 ) 面积总和计算。
房屋竣工面积 指在报告期内房屋建筑按照设计要求已全部完工,达到住人和使用条件,经验收鉴定合格,
正式移交使用单位的建筑面积。
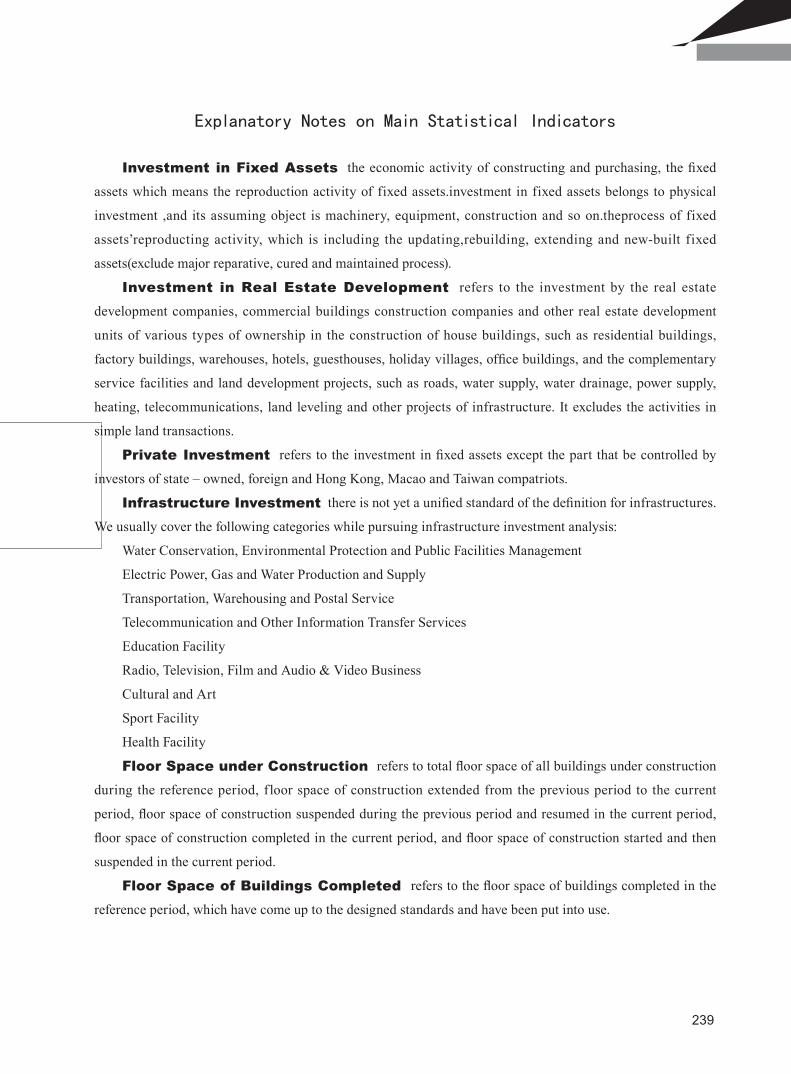
239
固定资产投资和建筑业
Explanatory Notes on Main Statistical Indicators
Investment in Fixed Assets the economic activity of constructing and purchasing, the fixed
assets which means the reproduction activity of fixed assets.investment in fixed assets belongs to physical
investment ,and its assuming object is machinery, equipment, construction and so on.theprocess of fixed
assets’reproducting activity, which is including the updating,rebuilding, extending and new-built fixed
assets(exclude major reparative, cured and maintained process).
Investment in Real Estate Development refers to the investment by the real estate
development companies, commercial buildings construction companies and other real estate development
units of various types of ownership in the construction of house buildings, such as residential buildings,
factory buildings, warehouses, hotels, guesthouses, holiday villages, office buildings, and the complementary
service facilities and land development projects, such as roads, water supply, water drainage, power supply,
heating, telecommunications, land leveling and other projects of infrastructure. It excludes the activities in
simple land transactions.
Private Investment refers to the investment in fixed assets except the part that be controlled by
investors of state – owned, foreign and Hong Kong, Macao and Taiwan compatriots.
Infrastructure Investment there is not yet a unified standard of the definition for infrastructures.
We usually cover the following categories while pursuing infrastructure investment analysis:
Water Conservation, Environmental Protection and Public Facilities Management
Electric Power, Gas and Water Production and Supply
Transportation, Warehousing and Postal Service
Telecommunication and Other Information Transfer Services
Education Facility
Radio, Television, Film and Audio & Video Business
Cultural and Art
Sport Facility
Health Facility
Floor Space under Construction refers to total floor space of all buildings under construction
during the reference period, floor space of construction extended from the previous period to the current
period, floor space of construction suspended during the previous period and resumed in the current period,
floor space of construction completed in the current period, and floor space of construction started and then
suspended in the current period.
Floor Space of Buildings Completed refers to the floor space of buildings completed in the
reference period, which have come up to the designed standards and have been put into use.


国内贸易和对外经济7 CHAPTER 7 DOMESTIC TRADE, FOREIGN TRADE AND ECONOMIC COOPERATION

242
绍兴市统计年鉴2020
665.52
980.00 1049.951204.171258.45
1423.19
1767.06
3123.843314.89 3371.93
3545.13
3814.00
0
400
800
1200
1600
2000
2400
2800
3200
3600
4000
2000 2005 2006 2007 2008 2009 2010 2015 2016 2017 2018 2019
商品交易市场成交额Business Value of Transaction Markets
单位:亿元(100 million yuan)
3.68 5.96 14.77 31.40
380.10
853.12
1578.68
1740.68
1930.39
2139.64
2352.56
0
500
1000
1500
2000
2500
1978 1980 1985 1990 1995 2000 2005 2010 2015 2016 2017 2018 2019
单位:亿元(100 million yuan)
社 会 消 费 品 零 售 总 额Total Retail Sale of Consumer Goods
206.973.68 1740.68111.371740.683.68206.97
3.68

243
国内贸易和对外经济
0.05
1.15
5.30
12.77
29.01
66.09
105.03
174.95
210.89
271.42
255.64
273.15
310.52
326.22
0 40 80 120 160 200 240 280 320 360 400
1988
1992
1996
2000
2002
2004
2006
2008
2010
2015
2016
2017
2018
2019
自 营 出 口 额Exports
单位:亿美元 (USD 10 000 million)
16 503
12959 11598
90095
97188
110476
7723581117
95327 94152
80031
128666135141
65739
0
20000
40000
60000
80000
100000
120000
140000
1985 1990 1995 2000 2005 2006 2007 2008 2009 2010 2015 2016 2017 2018 2019
外 商 实 际 投 资 额Foreign Investment Actually Used
单位:万美元(USD 10 000)
16 503
12959 11598
90095
97188
110476
7723581117
95327 94152
80031
128666135141
65739
0
20000
40000
60000
80000
100000
120000
140000
1985 1990 1995 2000 2005 2006 2007 2008 2009 2010 2015 2016 2017 2018 2019
外 商 实 际 投 资 额Foreign Investment Actually Used
单位:万美元(USD 10 000)
16 503
12959 11598
90095
97188
110476
7723581117
95327 94152
80031
128666135141
65739
0
20000
40000
60000
80000
100000
120000
140000
1985 1990 1995 2000 2005 2006 2007 2008 2009 2010 2015 2016 2017 2018 2019
外 商 实 际 投 资 额Foreign Investment Actually Used
单位:万美元(USD 10 000)

244
绍兴市统计年鉴2020
7-1 历年分区、县(市)社会消费品零售额Total Retail Sales of Consumer Goods in Each District and County (City) over the Year
年 份Year
全 市Whole
Municipality
越城区Yuecheng
District
柯桥区Keqiao District
上虞区Shangyu District
诸暨市ZhujiCity
嵊州市Shengzhou
City
新昌县Xinchang County
1952 9446 4058 1688 1640 1412 648
1955 13375 5625 2404 2496 1898 952
1960 18863 7906 3508 3278 2604 1567
1965 19928 7141 3913 4318 3066 1490
1970 23650 8216 4928 5300 3540 1666
1975 30658 10739 5868 6401 4763 2887
1980 59551 21308 10614 13286 9189 5154
1985 147681 33964 29676 26363 26837 20433 10408
1990 314045 63585 68919 50051 67787 43951 19752
1991 353504 70178 78305 53951 78313 49214 23543
1992 443367 89967 96965 66703 99289 60954 29489
1993 598248 126098 125199 95428 123354 77104 51066
1994 888301 197484 181332 143754 186483 110721 68528
1995 1131227 235034 226785 196699 245513 139262 87935
1996 1399520 283803 280164 244378 313989 173723 103463
1997 1579291 308762 306033 275456 360053 206004 122984
1998 1741674 349233 327964 302728 382516 236107 143125
1999 1904098 381271 352887 334072 412921 264926 158020
2000 2089066 453948 354081 364321 445741 300162 170813
2001 2331665 510619 370885 409410 493027 360212 187512
2002 2600420 602574 397846 451155 550499 391008 207338
2003 2931880 771869 411747 516956 608632 402202 220474
2004 3323238 854507 475494 592051 717364 414401 269421
2005 3800965 970548 560054 686680 808715 458904 316064
2006 4398695 1101136 650307 774625 981415 538365 352846
2007 5157207 1301582 784095 905254 1158879 607153 400244
2008 6207407 1629216 949846 1070375 1402893 701605 453472
2009 7107438 1950126 1087083 1205667 1532773 815924 515866
2010 8531197 2540161 1248692 1399537 1805999 941888 594919
2011 10162838 3009338 1483938 1684663 2182477 1109114 693308
2012 11551344 3307961 1704841 1944807 2540248 1261995 791492
2013 12943402 3451724 1999165 2206485 2877975 1484369 923684
2014 14513322 3867086 2184916 2457991 3272881 1699846 1030600
2015 15786837 4085024 2353635 2725389 3563789 1910160 1148841
2016 17406794 4531318 2639872 3091689 3754064 2132945 1256906
2017 19303885 5106674 2956158 3561041 3914172 2366610 1399230
2018 21396350 5674368 3279632 3962221 4323729 2613725 1542676
2019 23525571 6216932 3620995 4368745 4754372 2862029 1702497
单位:万元 (10 000 yuan)
注:2003 年始,社会消费品零售不包括制造业、农业生产者直接销售部分 , 下同。Note: It started to exclude direct sales from manufacturer and agriculture workers, similarly hereinafter.

245
国内贸易和对外经济
7-2 历年社会消费品零售额(按行业分)Total Retail Sales of Consumer Goods over the Years (by Sector)
年 份Year
合 计Total
批发和零售业Wholesale and
Retail Sale Trade
住宿和餐饮业Accommodation
and Food Industry
制造业Manufac-
turing
农业生产者Agriculture
其他行业零售额Others
1952 10185 8489 275 920 501 -
1955 14673 12231 423 1476 543 -
1960 22969 20594 782 1287 189 117
1965 24393 22169 800 913 285 226
1970 29970 26439 624 893 642 1372
1975 39389 35005 976 1653 950 805
1980 75915 65892 1764 6020 1677 562
1985 171116 129040 4693 22109 9433 5841
1990 358915 255828 13833 39940 32749 16565
1991 401109 288073 16175 37839 36871 22151
1992 499112 360022 21187 42164 45867 29872
1993 598248 531445 33128 - - 33675
1994 888301 797926 51739 - - 38637
1995 1131227 1021728 66902 - - 42598
1996 1399520 1256781 94005 - - 48733
1997 1579291 1400366 124436 - - 54489
1998 1741674 1533379 147022 - - 61273
1999 1904098 1676305 159615 - - 68177
2000 2089066 1850725 163836 - - 74505
2001 2331665 2055047 192702 - - 83915
2002 2600420 2294103 213317 - - 93000
2003 2931880 2556098 271531 - - 104251
2004 3323238 2986262 336976 - - -
2005 3800965 3437924 363040 - - -
2006 4398695 3980636 418059 - - -
2007 5157207 4666249 490958 - - -
2008 6207407 5617279 590128 - - -
2009 7107438 6461798 645639 - - -
2010 8531197 7789134 742063 - - -
2011 10162838 9293294 869544 - - -
2012 11551344 10541876 1009468 - - -
2013 12943402 11958750 984651 - - -
2014 14513322 13392292 1121030 - - -
2015 15786837 14492105 1294733 - - -
2016 17406794 15792673 1614121 - - -
2017 19303885 17600532 1703353 - - -
2018 21396350 19451667 1944683 - - -
2019 23525571 21236529 2289041 - - -
单位:万元 (10 000 yuan)

246
绍兴市统计年鉴2020
7-3 分区、县(市)社会消费品零售总额(2019年)
单位:万元
指 标 Item全 市Whole
Municipality
社会消费品零售总额 Total Retail Sales of Consumer Goods 23525571
( 一 ) 按销售地区分 Grouped by Sales Region
1. 城镇 Municipality 20314737
其中:城区 City 14589448
2. 乡村 Country 3210833
( 二 ) 按行业分组 Grouped by sector
1. 批发零售贸易业 Wholesale and Retail Sale Trade 21236529
2. 住宿和餐饮业 Accommodation and Food Industry 2289041

247
国内贸易和对外经济
Total Retail Sales of Consumer Goods in Each District and County (City) (2019)
(10 000 yuan)
越城区Yuecheng
District
柯桥区KeqiaoDistrict
上虞区ShangyuDistrict
诸暨市ZhujiCity
嵊州市Shengzhou
City
新昌县XinchangCounty
6216932 3620995 4368745 4754372 2862029 1702497
6084729 3343439 3017482 4136304 2246989 1485794
6005735 1427132 2650498 3185429 1320654 -
132203 277556 1351263 618068 615040 216703
6002312 3290208 3993719 4088760 2420953 1440577
214620 330787 375026 665612 441076 261920

248
绍兴市统计年鉴2020
7-4 全市限额以上批发零售贸易企业主要商品分类销售额(2017-2019年)
单位:万元
指 标 Item
总计 Total
粮油、食品类 Cereals and Oils
# 粮油类 Edible Vegetable Oil
肉禽蛋类 Meat, Poultry and Eggs
水产品类 Aquatic product
蔬菜类 Vegetable
干鲜果品类 Dry and fresh fruit
饮料类 Beverages
烟酒类 Tobacco and Liquor
服装、鞋帽、针纺织品类 Clothing, Shoes, Hats and Textiles
# 服装类 Clothing
鞋帽类 Shoes and Hats
针、纺织品类 Knitwear and Textiles
化妆品类 Cosmetics
金银珠宝类 Gold, Silver and Jewelry
日用品类 Articles for Daily Use
# 儿童玩具类 Children Toys
五金、电料类 Hardware and Electrical Materials
体育、娱乐用品类 Sports and Recreation Articles
书报杂志类 Newspapers and Magazines
电子出版物及音像制品类 E-journal and Video Products

249
国内贸易和对外经济
Total Sales of Enterprises above Designated Size in Wholesaleand Retail Trade by Category of Main Commodities (2017-2019)
(10 000 yuan)
销售合计Total 批 发
Wholesale Trade零 售
Retail Trade
2017 2018 2019 2017 2018 2019 2017 2018 2019
27696270 31387649 39076588 20204133 24170338 31453394 7492137 7217311 7623194
873433 825010 1148405 412963 454175 714485 460470 370836 433920
240335 219972 312200 138114 130927 218208 102221 89045 93992
98418 86965 147338 40895 28991 73292 57522 57974 74046
87128 17546 22630 64389 278 3764 22740 17268 18866
45626 46508 62098 13265 14361 21554 32362 32147 40543
124086 39156 41939 23725 2255 2148 100361 36901 39790
139434 134267 169807 72000 67738 101661 67434 66529 68145
1123059 1515123 1643592 1002847 1405825 1528476 120212 109298 115116
10520563 12115388 15465972 9970627 11588348 14786062 549937 527040 679911
596085 631883 845536 333329 355570 468990 262756 276314 376546
79958 83223 125097 20196 23878 32500 59762 59345 92597
9844521 11400282 14495340 9617102 11208901 14284572 227419 191381 210767
52730 57581 79932 278 12094 27150 52452 45487 52782
351400 372563 454604 74598 73575 141030 276802 298988 313574
201219 275154 516413 76544 161064 397974 124675 114090 118439
11240 7900 - 4623 2959 - 124675 4941 -
257877 313106 398168 206992 256243 334009 50884 56864 64158
11647 3472 6106 749 469 3929 10898 3003 2177
50048 48536 50663 4949 5207 6258 45098 43329 44405
4640 5874 5116 3722 4736 3444 918 1138 1672

250
绍兴市统计年鉴2020
7-4 续表
单位:万元
指 标 Item
家用电器和音像器材类 Household Appliances and Video Appliances
中西药品类 Traditional Chinese and Western Medicines
# 西药 Western Medicines
中草药及中成药 Traditional Chinese Medicines
文化办公用品类 Cultural and Official Goods
家具类 Furniture
通讯器材类 Communication Appliances
煤炭及制品类 Coal and Related Products
木材及制品类 Wood and Wooden Products
石油及制品类 Petroleum and Related Products
化工材料及制品类 Raw Chemical Materials
# 化肥类 Fertilizer
金属材料类 Metal Materials
建筑及装潢材料类 Building and Decoration Materials
机电产品设备类 Mechanical and Electrical Products
# 农机类 Agricultural Machinery
汽车类 Automobile
种子饲料类 Seed and Feedstuff
棉麻类 Cotton, Hemp
其他类 Others

251
国内贸易和对外经济
Continued
(10 000 yuan)
销售合计Total 批 发
Wholesale Trade零 售
Retail Trade
2017 2018 2019 2017 2018 2019 2017 2018 2019
684189 724476 1502238 259586 353013 840739 424604 371463 661500
905080 970575 1135519 534286 708136 844660 370794 262439 290859
649630 680703 826054 403887 503620 625547 245743 177083 200507
239126 274588 287886 114538 190595 198966 124588 83993 88919
34863 54371 81282 9623 25271 54065 25240 29100 27217
38705 40024 36435 19480 36699 32396 19225 3325 4039
274102 537574 510106 68886 112907 81848 205216 424667 428258
174913 277481 277669 174833 275608 276959 80 1873 710
38113 32951 3460 38113 32951 3460 - - -
2180197 2812870 2131103 1157122 1611394 1273475 1023075 1201476 857629
3189414 1904847 2341258 3189414 1904847 2341258 - - -
46359 61102 105869 46359 61102 105869 - - -
1590928 3199939 5130241 1590928 3199939 5130241 - - -
147690 345985 576905 125892 324579 543023 21798 21406 33882
575862 678399 671316 568036 671225 662861 7826 7175 8455
3285 3263 5614 3285 3263 5614 - - -
3524832 3240995 3420131 78462 65831 127071 3446370 3175164 3293060
8615 8164 13872 8615 8164 13872 - - -
39802 55505 111488 39798 55494 111375 4 11 114
702916 837418 1194788 514791 754807 1071616 188125 82611 123172

252
绍兴市统计年鉴2020
7-5 全市限额以上批发零售贸易企业财务状况(2019年)
单位:万元
指 标 Item
企业数( 个 )
Number of Enterprises
(unit)
总计 Total 2708
其中:国有控股 State-owned Enterprises 55
按区、县 ( 市 ) 分 Grouped by District and County (City)
越 城 区 Yuecheng District 627
柯 桥 区 Keqiao District 1086
上 虞 区 Shangyu District 243
诸 暨 市 Zhuji City 99
嵊 州 市 Shengzhou City 526
新 昌 县 Xinchang County 127
按登记注册类型分组 Grouped by Registration Status
内资企业 Domestic Funded Enterprise 2669
国有企业 State-owned Enterprises 2
集体企业 Collective-owned Enterprises 5
股份合作企业 Cooperative Enterprises 1
联营企业 Joint Ownership Enterprises 1
集体联营企业 Colleetive Jomt Oweership Enterprises -
有限责任公司 Limited Liability Corporations 243
国有独资公司 State-funded Corporations 14
其他有限责任公司 Other Limited Liability Corporations 229
股份有限公司 Share-holding Corporations Ltd. 22
私营企业 Private Enterprises 2390
私营独资企业 Private-funded Enterprises 27
私营合伙企业 Private Partnership Ewterprise 1
私营有限责任公司 Private Limited Liability Corporations 2346
私营股份有限公司 Private Share-holding Corporations Ltd. 16
其他企业 Other Enterprises 5
港、澳、台商投资企业 Enterprises with Investment from Hong Kong, Macao and Taiwan 20
与港澳台商合资经营企业 Joint-venture Enterprises with Investment from Hong Kong,Macao and Taiwan 3
港澳台商独资经营企业 Cooperative Enterprises with Investment from Hong Kong,Macao and Taiwan 14
外商投资企业 Enterprises with Foreign Investment 19
中外合资经营企业 Joint-venture Enterprises with Foreign Investment 8
外资企业 Enterprises with Foreign Investment 10

253
国内贸易和对外经济
Main Financial Indicators of Purchases, Sales and Inventory ofWholesale and Retail Trade above Designated Size (2019)
(10 000 yuan)
年末资产负债 (Assets and Liabilities)
所有者权益Creditors
Equity流动资产
小计Circulating
Funds
固定资产原价
OriginalValue of
Fixed Assets
资产合计Total
Assets
负债合计Total
Liabilities
实收资本CapitalHold
存 货Deposits
and Loans
本年折旧Deprecation
14900793 1900938 1717714 106349 19486590 14420885 5033558 2729179
863241 188045 254194 6442 1265053 566036 699017 79550
2660370 541707 422728 23907 3138959 2217427 920000 316946
4259169 711881 449301 31938 4882317 3968290 886063 1069191
1174066 183631 258030 12897 1547480 1132503 414148 292446
920422 120696 70285 4588 1251627 937399 314179 112153
5321655 256297 392798 24722 7933891 5648690 2283760 862326
565111 86726 124572 8298 732317 516576 215408 76116
14612294 1881180 1665734 102042 19084440 14154970 4897323 2558486
353157 27445 47425 2355 385514 77551 307963 3846
5902 429 2099 181 11947 9733 2214 409
9462 487 2969 124 11001 5139 5862 253
350 355 162 9 396 36 360 114
- - - - - - - -
2452523 362338 393420 14892 2965810 2307771 633673 279385
216326 80492 104689 1704 377892 207160 170731 7180
2236198 281846 288731 13188 2587918 2100611 462942 272205
1196863 65866 111474 4321 1861386 1110834 750552 244277
10592268 1424053 1107277 80105 13845864 10643341 3194742 2029098
19334 5170 8974 1348 23609 15970 7639 1693
330 96 302 54 824 76 748 600
10494621 1416870 1092646 78291 13513482 10524130 2981571 1973623
77982 1917 5355 414 307949 103165 204784 53182
1770 206 909 57 2523 565 1958 1105
156171 11002 47157 3607 232542 143102 89440 97612
38144 270 16043 442 91017 57371 33646 31131
112462 7580 21797 1866 130655 73224 57430 57138
132328 8755 4822 700 169608 122812 46796 73081
72640 1379 3487 407 96991 69412 27579 62029
53959 7151 1251 293 66885 48370 18515 10952

254
绍兴市统计年鉴2020
7-5 续表1
单位:万元
指 标 Item营业收入OperatingIncome
主营业务收入Main Business
Income
总 计 Total 37242992 37065911
其中:国有控股 State-owned Enterprises 2791536 2774352
按区、县 ( 市 ) 分 Grouped by District and County (City)
越 城 区 Yuecheng District 9112194 9071644
柯 桥 区 Keqiao District 15266080 15245751
上 虞 区 Shangyu District 3657913 3615849
诸 暨 市 Zhuji City 1486215 1478889
嵊 州 市 Shengzhou City 6609536 6555451
新 昌 县 Xinchang County 1111055 1098327
按登记注册类型分组 Grouped by Registration Status
内资企业 Domestic Funded Enterprises 36582786 36412368
国有企业 State-owned Enterprises 884252 883906
集体企业 Collective-owned Enterprises 23838 23838
股份合作企业 Cooperative Enterprises 8113 7443
联营企业 Joint Ownership Enterprises 4024 4024
集体联营企业 Collective Joint Ownership Enterprises - -
有限责任公司 Limited Liability Corporations 5798696 5746177
国有独资公司 State-funded Corporations 156099 149270
其他有限责任公司 Other Limited Liability Corporations 5642597 5596908
股份有限公司 Share-holding Corporations Ltd. 1946633 1930069
私营企业 Private Enterprises 27908625 27808306
私营独资企业 Private-funded Enterprises 101681 101681
私营合伙企业 Private Partnership Enterprises 1232 1232
私营有限责任公司 Private Limited Liability Corporations 27670876 27570557
私营股份有限公司 Private Share-holding Corporations Ltd. 134835 134835
其他企业 Other Enterprises 8606 8606
港、澳、台商投资企业 Enterprises with Investment from Hong Kong,Macao and Taiwan 443492 436829
与港澳台商合资经营企业Joint-venture Enterprises with Investment from Hong Kong, Macao and Taiwan
164200 164200
港澳台商独资经营企业 Hong Kong,Macao and Taiwan-funded Enterprises 245323 239945
外商投资企业 Enterprises with Foreign Investment 216713 216713
中外合资经营企业 Joint-venture Enterprises with Foreign Investment 48304 48304
外资企业 Enterprises with Foreign Investment 147014 147014

255
国内贸易和对外经济
Continued 1
(10 000 yuan)
营业成本Operating
Cost
税金及附加Sales Taxand ExtraCharges
销售费用Selling
Expenses
管理费用Administration
Expenses
营业利润Operating
Profits
利润总额Total Profits
应付职工薪酬Total Wages
Payable
本年应缴增值税额
Value AddedTax Payable
35039327 164502 823213 585413 507234 539752 686660 687633
2447027 122868 72818 54516 102705 110049 65858 51206
8271921 131301 310488 178557 164187 169570 240987 98199
14655126 11550 165591 183182 200450 192033 174734 489200
3468142 5065 93919 67407 15138 20166 137077 16432
1405297 2883 38524 18694 45516 46167 29577 9592
6311148 11314 122502 96512 42820 69302 76089 43382
927693 2389 92189 41061 39124 42514 28197 30828
34430149 162993 793939 567224 503307 535681 668444 676473
599777 119857 13469 25604 135896 135754 30014 39625
20606 85 625 1479 989 958 793 386
6888 112 372 421 1346 1354 351 92
3496 4 157 106 256 255 107 62
- - - - - - - -
5378458 12252 240432 84872 45501 58788 95041 57286
138371 446 9452 8822 -6425 782 7889 744
5240087 11806 230980 76050 51926 58006 87152 56542
1907251 2706 41701 24810 -26300 -20110 87831 5544
26505460 27975 497145 429874 345343 358406 453918 573478
91610 189 2191 2600 4054 4074 1675 973
1045 6 54 86 40 40 36 8
26286726 27439 492033 423642 311154 324155 450369 570792
126079 342 2867 3545 30094 30138 1838 1705
8213 1 37 59 276 276 390 -
409294 806 22708 7153 4316 4853 12770 4615
160936 83 466 1861 812 809 855 -445
223344 654 14025 4905 3420 3955 8505 4269
199884 702 6566 11036 -389 -782 5445 6545
41864 76 4714 5790 -4670 -5226 3299 1928
137321 626 1554 5047 4078 4212 2081 1869

256
绍兴市统计年鉴2020
7-5 续表2
单位:万元
指 标 Item
企业数( 个 )
Number ofEnterprises
(unit)
按国民经济行业分 Grouped by Sector
( 一 ) 批发业 Wholesale Trades 2109
农、林、牧、渔产品批发 Wholesale of Agricultural,Forestry,Livestock and Fishery Products 12
食品、饮料及烟草制品批发 Wholesale of Food, Beverages and Tobaccos 68
纺织、服装及家庭用品批发 Wholesale of Textiles, Garment and Household Goods 1403
文化、体育用品及器材批发 Wholesale of Cultural and Sports Appliances 122
医药及医疗器材批发 Wholesale of Medicines and Medical Appliances 32
矿产品、建材及化工产品批发 Wholesale of Mineral Products, Building Materials and Chemical Products 336
机械设备、五金交电及电子产品批发
Wholesale of Mechanical Facilities, Hardware, Transport, Electric and Electrical Products 112
贸易经纪与代理 Trade Manager and Agency Industry 2
其他批发 Other Wholesale Trade 22
( 二 ) 零售业 Retail Trades 599
综合零售 Specialty Retail of General Products 41
食品、饮料及烟草制品专门零售 Specialty Retail of Food, Beverages and Tobaccos 18
纺织品、服装及日用品专门零售 Specialty Retail of Textiles, Garment and Daily Goods 27
文化、体育用品及器材专门零售 Specialty Retail of Cultural and Sports Appliances 33
医药及医疗器材专门零售 Specialty Retail of Medicines and Medical Appliances 21
汽车、摩托车、零配件和燃料及其他动力销售
Retail of Motor Vehicles, Motorcycle, Parts and Fuel and Other Powers 260
家用电器及电子产品专门零售 Specialty Retail of Electrical Household Appliances and Electronic Products 65
五金、家具及室内装修材料专门零售
Specialty Retail of Metals, Furniture and Building Decoration Materials 40
货摊、无店铺及其他零售 Stall,Direct and Other Wholesale 94

257
国内贸易和对外经济
Continued 2
(10 000 yuan)
年末资产负债 (Assets and Liabilities)
所有者权益Creditors
Equity
流动资产小计
Circulating Funds
固定资产原价
OriginalValue of
Fixed Assets
资产合计Total
Assets
负债合计Total
Liabilities
实收资本CapitalHold
存 货Deposits
and Loans
本年折旧Deprecation
12800613 1336882 985540 59228 16442306 12198089 4213586 2132364
119762 48071 82506 1249 219821 129740 90081 5165
682065 119877 197308 6954 906127 481683 424444 34338
4521502 754839 347953 29312 4901350 4064500 806891 970415
581846 74660 25806 2771 640247 493738 146509 88103
530505 69204 48812 1041 698009 473548 224461 92786
4709708 158200 228223 13338 7102525 5044969 2056884 746366
1562092 101418 44573 3586 1870812 1410193 460619 183213
5080 1017 248 61 5103 4021 1082 860
88054 9596 10112 915 98313 95697 2616 11118
2100180 564056 732174 47121 3044284 2222797 819972 596815
487694 72181 268841 12400 769389 620990 148400 106850
21831 6076 7515 475 27113 10923 16190 4180
24767 8902 12565 636 37755 28517 9238 17406
187957 102363 36328 2493 238173 112120 126053 24461
86848 26293 16250 983 108001 67988 40014 23652
837456 263657 322350 21307 1255694 977460 276819 283085
264217 57576 17712 1094 313188 276651 36588 38618
56679 6410 5981 612 63651 45545 18106 10418
132732 20597 44632 7122 231320 82604 148566 88145

258
绍兴市统计年鉴2020
7-5 续表3
单位:万元
指 标 Item营业收入OperatingIncome
主营业务收入Main Business
Income
按国民经济行业分 Grouped by Sector
( 一 ) 批发业 Wholesale Trades 30727154 30663492
农、林、牧、渔产品批发 Wholesale of Agricultural, Forestry, Livestock and Fishery Products 129586 127464
食品、饮料及烟草制品批发 Wholesale of Food, Beverages and Tobaccos 2446504 2439024
纺织、服装及家庭用品批发 Wholesale of Textiles, Garment and Household Goods 15038381 15031289
文化、体育用品及器材批发 Wholesale of Cultural and Sports Appliances 1736379 1736313
医药及医疗器材批发 Wholesale of Medicines and Medical Appliances 1266408 1257140
矿产品、建材及化工产品批发Wholesale of Mineral Products, Building Mater-ials and Chemical Products
8084642 8063594
机械设备、五金交电及电子产品批发
Wholesale of Mechanical Facilities, Hardware, Transport, Electric and Electrical Products
1581797 1565212
贸易经纪与代理 Trade Manager and Agency Industry 11047 11047
其他批发 Other Wholesale Trade 432409 432409
( 二 ) 零售业 Retail Trades 6515838 6402419
综合零售 Specialty Retail of General Products 948125 892997
食品、饮料及烟草制品专门零售 Specialty Retail of Food, Beverages and Tobaccos 55923 55794
纺织品、服装及日用品专门零售 Specialty Retail of Textiles, Garment and Daily Goods 47615 47611
文化、体育用品及器材专门零售 Specialty Retail of Cultural and Sports Appliances 247265 244822
医药及医疗器材专门零售 Specialty Retail of Medicines and Medical Appliances 248255 247486
汽车、摩托车、零配件和燃料及其他动力销售
Retail of Motor Vehicles, Motorcycle, Parts and Fuel and Other Powers 3487950 3449498
家用电器及电子产品专门零售Specialty Retail of Electrical Household Appliances and Electronic Products
667185 663568
五金、家具及室内装修材料专门零售
Specialty Retail of Metals, Furniture and Building Decoration Materials 73451 73398
货摊、无店铺及其他零售 Stall,Direct and Other Wholesale 740068 727245

259
国内贸易和对外经济
Continued 3
(10 000 yuan)
营业成本Operating
Cost
税金及附加Sales Taxand ExtraCharges
销售费用Selling
Expenses
管理费用Administration
Expenses
营业利润Operating
Profits
利润总额Total Profits
应付职工薪酬Total Wages
Payable
本年应缴增值税额
Value AddedTax Payable
29252333 144507 449771 402311 432364 454370 407822 619273
121679 109 3435 4363 -4567 2595 4048 199
2110305 121502 39071 41690 142513 143148 52399 43445
14424997 8715 179003 205749 158287 157664 246056 400629
1628122 1173 22382 23550 54629 53259 12481 106084
1136729 1946 98849 13824 19053 18864 18149 25525
7935813 5526 70117 71507 23515 29609 41954 18922
1455574 1888 33468 39414 45463 45697 31661 9295
10766 2 56 99 106 110 39 2
428349 3645 3390 2115 -6635 3424 1036 15172
5786994 19995 373442 183101 74870 85382 278838 68360
782656 6171 86743 53828 16293 17456 52929 15581
48970 143 3235 2303 1038 1104 2346 526
40978 138 2453 3723 -137 -113 2990 749
204944 2385 17027 7247 18457 18495 11864 1176
205870 751 24130 10658 6208 6521 14627 5290
3198272 7302 93926 78119 38508 47270 79687 29255
555425 1528 108632 10830 -11565 -11223 13351 10613
66178 251 2614 2171 1354 1440 90017 621
683702 1326 34681 14223 4714 4432 11028 4549

260
绍兴市统计年鉴2020
7-6 全市限额以上住宿餐饮企业财务状况(2019年)
单位:万元
指 标 Item全 市Whole
Municipality
总计 Total 291
其中:国有控股 State-owned Enterprises 6
按区、县 ( 市 ) 分 Grouped by District and County (City)
越城区 Yuecheng District 72
柯桥区 Keqiao District 36
上虞区 Shangyu District 25
诸暨市 Zhuji City 21
嵊州市 Shengzhou City 117
新昌县 Xinchang County 20
按登记注册类型分组 Grouped by Registration Status
内资企业 Domestic Funded Enterprises 285
国有企业 State-owned Enterprises 2
集体企业 Collective-owned Enterprises -
股份合作企业 Cooperative Enterprises -
联营企业 Joint Ownership Enterprises -
集体联营 Collective Joint Ownership Enterprises -
国有与集体联营企业 Joint State-collective Enterprises -
有限责任公司 Liablilty Corporations 36
国有独资 State-funded Corporations 2
其他有限责任公司 Other Limited Liability Corporations 34
股份有限公司 Share-holding Corporations Ltd. 1
私营企业 Private Enterprises 246
私营独资企业 Private-funded Enterprises 53
私营合伙企业 Private Partnership Enterprises 2
私营有限责任公司 Private Limited Liability Corporations 188
私营股份有限公司 Private Share-holding Corporations Ltd. 3
港、澳、台商投资经营企业 Enterprises With Sole Investment from HongKong, Macao and Taiwan 4
外商投资企业 Enterprises with Foreign Investment 2
按国民经济行业分组 Grouped By Sector
旅游饭店 Tourist Hotel 60
一般旅馆 General Hotel 36
正餐服务 Dinner Services 183
快餐服务 Fast Food Services 5
饮料及冷饮服务 Beverage and Cold Drink Services 5
餐饮配送及外卖送餐服务 Take Out Services 1
其他餐饮业 Other Catering Services 1

261
国内贸易和对外经济
Main Financial Indicators of Accommodation and Catering ServicedEnterprises Above Designated Size (2019)
(10 000 yuan)
年末资产负债 (Assets and Liabilities)
所有者权益Creditors
Equity
流动资产小计
Circulating Funds
固定资产原价
OriginalValue of
Fixed Assets
资产合计Total
Assets
负债合计Total
Liabilities
实收资本CapitalHold
存 货Deposits
and Loans
本年折旧Deprecation
533748 19994 579804 27131 1241498 1164675 74593 272102
24775 519 54136 1321 139542 97360 42182 18494
111988 3435 158586 6953 348305 271591 76701 73700
64716 2165 110579 2950 234218 206966 27172 66167
195110 1641 133836 10191 316596 415538 -98942 25588
24647 549 29087 1008 45026 51677 -6650 11231
114624 11600 113743 4960 238759 179895 57366 84112
22663 603 33973 1068 58595 39009 18946 11303
356715 19177 500848 24605 1029310 842267 184813 251344
6133 77 13782 281 102568 85378 17191 10897
- - - - - - - -
- - - - - - - -
- - - - - - - -
- - - - - - - -
- - - - - - - -
103381 2590 171990 6826 292595 237848 54747 32776
12942 336 19924 759 27907 10359 17548 3600
90438 2254 152066 6067 264688 227489 37199 29176
84 4 23 1 88 24 64 10
247118 16506 315053 17497 634058 519017 112811 207661
5441 571 11136 451 17392 7989 9404 4381
486 52 97 5 535 24 510 98
240620 15766 303323 17010 615409 509518 103661 202602
572 117 498 32 722 1486 -763 580
176859 795 78796 2520 211938 322347 -110409 20479
173 22 160 6 250 62 189 279
286525 4541 344292 12327 684825 762644 -77898 99384
71724 9785 62553 7164 128219 129122 -903 16569
173741 5643 172665 7617 426358 271096 153113 155923
139 6 156 11 292 268 24 106
973 14 29 7 1017 946 71 71
560 88 3 689 551 139 50
86 5 21 2 97 49 49 -

262
绍兴市统计年鉴2020
7-6 续表
单位:万元
指 标 Item 营业收入OperatingIncome
主营业务收入Main Business
Income
总计 Total 489379 479664
其中:国有控股 State-owned Enterprises 24129 23767
按区、县 ( 市 ) 分 Grouped by District and County (City)
越城区 Yuecheng District 176337 172646
柯桥区 Keqiao District 79128 78851
上虞区 Shangyu District 85136 85136
诸暨市 Zhuji City 23911 23889
嵊州市 Shengzhou City 91852 88091
新昌县 Xinchang County 33015 31051
按登记注册类型分组 Grouped by Registration Status
内资企业 Domestic Funded Enterprises 461051 452076
国有企业 State-owned Enterprises 9202 9202
集体企业 Collective-owned Enterprises - -
股份合作企业 Cooperative Enterprises - -
联营企业 Joint Ownership Enterprises - -
集体联营 Collective Joint Ownership Enterprises - -
国有与集体联营企业 Joint State-collective Enterprises - -
有限责任公司 Limited Liablilty Corporations 111203 108830
国有独资 State-funded Corporations 9705 9344
其他有限责任公司 Other Limited Liability Corporations 101498 99487
股份有限公司 Share-holding Corporations Ltd. 391 391
私营企业 Private Enterprises 340255 333653
私营独资企业 Private-funded Enterprises 24444 24290
私营合伙企业 Private Partnership Enterprises 902 902
私营有限责任公司 Private Limited Liability Corporations 312569 306144
私营股份有限公司 Private Share-holding Corporations Ltd. 2341 2317
港、澳、台商独资 ( 投资 )经营企业
Enterprises With Sole Investment from HongKong, Macao and Taiwan 27532 26792
外商投资企业 Enterprises with Foreign Investment 796 796
按国民经济行业分组 Grouped By Sector
旅游饭店 Tourist Hotel 196318 190474
一般旅馆 General Hotel 24411 23067
正餐服务 Dinner Services 262327 259802
快餐服务 Fast Food Services 1667 1667
饮料及冷饮服务 Beverage and Cold Drink Services 1533 1533
餐饮配送及外卖送餐服务 Take Out Services 2765 2765
其他餐饮业 Other Catering Services 357 357

263
国内贸易和对外经济
Continued
(10 000 yuan)
营业成本Operating
Cost
税金及附加Sales Taxand ExtraCharges
销售费用Selling
Expenses
管理费用Administration
Expenses
营业利润Operating
Profits
利润总额Total Profits
应付职工薪酬Total Wages
Payable
232721 3939 140439 149895 -26156 -19378 95017
9663 361 6744 6635 1385 1675 8192
69129 1671 62033 38065 2600 3415 36379
38622 613 22938 15119 -4514 -2919 14822
43632 291 26634 13955 -2747 -2113 14333
13232 127 3452 6472 -948 -870 6073
54279 1191 17386 32248 -18866 -15317 15227
13826 47 7996 44038 -1680 -1574 8183
223291 3637 131076 142205 -26392 -20126 89370
3519 181 2348 2826 906 1095 4116
- - - - - - -
- - - - - - -
- - - - - - -
- - - - - - -
- - - - - - -
45659 837 36727 24703 -1669 -1509 19494
3805 8 3321 2481 83 116 2041
41854 828 33406 22222 -1753 -1625 17453
204 1 165 18 3 3 83
173910 2619 91836 114658 -25631 -19715 65676
17491 453 1490 1634 3299 3301 3208
386 33 271 143 65 65 56
155186 2133 89139 112394 -29055 -23144 62068
847 1 937 487 60 64 344
9012 301 9009 7633 272 781 5424
417 1 354 58 -36 -33 224
73875 1183 66338 85633 -10295 -6284 42753
9571 487 7821 9824 -4259 -4136 5380
144739 2217 65504 53742 -11857 -9227 45558
1131 40 241 61 190 190 318
843 5 530 145 11 14 628
2256 5 - 480 22 33 350
306 2 5 11 32 32 30

264
绍兴市统计年鉴2020
7-7 全市规模以上服务业企业主要经济指标(2019年)
单位:万元
项 目 Item
企业个数( 个 )
Number of Enterprises
(unit)
资产总计Total
assets
总计 Total 598 15400558
按登记注册类型分 by Registered Type
国有企业 State-owned 16 199201
集体企业 Collective Owned 9 57759
股份合作企业 Share-cooperations 1 8927
有限责任公司 Limited Liability Corporations 132 10291610
股份有限公司 Share-holding Corporations Ltd. 16 765195
私营企业 Private 410 3542783
其他企业 Others 7 117510
港澳台商投资企业 Investment from HongKong, Macao and Taiwan 3 252958
外商投资企业 Investment from Foreign 4 164616
按国民经济行业(2017)分 by Sector (2017)
交通运输、仓储和邮政业 Transportation, Storage and Post 127 1496638
信息传输、软件和信息技术服务业
Information Transmission, Software and Information Technology Services 40 1883196
金融业 Finance - -
房地产业(除房地产开发经营)
Real Estate (Except Real estate development) 66 4435837
租赁和商务服务业 Renting and Business Services 137 2939971
科学研究和技术服务业 Scientific Research and Technical Services 81 441141
水利、环境和公共设施管理业
Water Conservancy, Environment and Public Utility 25 3091933
居民服务、修理和其他服务业
Service for the Residents, Repair and Others 40 120928
教育 Education 12 166982
卫生和社会工作 Health Care and Social Work 15 50000
文化、体育和娱乐业 Culture, Sports and Recreation 55 773933
注:规模以上服务业单位统计不包括批发零售业,住宿餐饮业,房地产开发业,银行、保险和证券业。

265
国内贸易和对外经济
Main Indicators of Service Enterprises Above Designated Size(2019)
(10 000 yuan)
固定资产原价Original value of
fixed assets
本年折旧This Year
Depreciation
负债合计Total Liabilities
所有者权益Creditors
Equity
营业收入Operating Income
营业成本Operating
Cost
税金及附加Sales Taxesand ExtraCharges
6036337 354965 9774097 5626461 3711124 2706366 44545
206827 13559 44483 154718 109034 83035 1041
16612 320 3951 53808 39118 29369 316
12671 1574 3752 5175 12079 8858 58
3124526 204172 6757898 3533712 1309913 913197 19273
1035204 55509 409544 355651 305066 220587 4161
1221535 59613 2263300 1279483 1802990 1351976 17760
74240 3530 45355 72154 37504 28681 96
254701 15691 119185 133773 80688 64883 904
90021 999 126629 37987 14732 5781 935
694594 48156 1078320 418318 709313 649980 5014
2037380 127785 1167071 716126 1210325 845327 3932
- - - - - - -
757075 23442 3154763 1281073 345601 210699 11305
636898 27462 1757139 1182832 503704 316437 12735
85228 6979 179237 261905 412790 298246 1848
1444967 104236 1733348 1358586 217671 166311 5368
24565 1679 104813 16114 78885 62709 394
97710 4870 53369 113613 57017 37555 250
25497 2181 36032 13969 50967 35627 39
232424 8175 510007 263926 124852 83476 3659
Note: Above designated size services unit statistics do not include wholesale and retail trade, hotel and restaurant industry, the real estate development industry, banking, insurance and securities industries.

266
绍兴市统计年鉴2020
7-7 续表
单位:万元
项 目 Item 销售费用Selling
Expenses
管理费用Administration
Expenses
总计 Total 238346 406081
按登记注册类型分 by Registered Type
国有企业 State-owned 1541 15879
集体企业 Collective Owned 1826 2430
股份合作企业 Share-cooperations - 3209
有限责任公司 Limited Liability Corporations 64678 162661
股份有限公司 Share-holding Corporations Ltd. 23718 22449
私营企业 Private 133863 187125
其他企业 Others 988 5164
港澳台商投资企业 Investment from HongKong, Macao and Taiwan 8842 5958
外商投资企业 Investment from Foreign 2890 1205
按国民经济行业(2017)分 by Sector (2017)
交通运输、仓储和邮政业 Transportation, Storage and Post 18922 71015
信息传输、软件和信息技术服务业
Information Transmission, Software and Information Technology Services 140458 56056
金融业 Finance - -
房地产业(除房地产开发经营)
Real Estate (Except Real estate development) 14363 47613
租赁和商务服务业 Renting and Business Services 25884 81101
科学研究和技术服务业 Scientific Research and Technical Services 10037 51333
水利、环境和公共设施管理业
Water Conservancy, Environment and Public Utility 2445 43749
居民服务、修理和其他服务业
Service for the Residents, Repair and Others 5203 10896
教育 Education 1709 6998
卫生和社会工作 Health Care and Social Work 1995 10075
文化、体育和娱乐业 Culture, Sports and Recreation 17330 27246

267
国内贸易和对外经济
Continued
(10 000 yuan)
财务费用Financial Expenses
营业利润Operating
Profits
利润总额Total
Profits
所得税费用Income Tax Expenses
应付职工薪酬Total Wages
Pagable
应交增值税Value Added
Taxes Payable
平均用工人数( 人)
Average Numberof Employed
Persons (persons)
229798 293156 353200 43536 553637 78826 65049
1219 10660 11258 1243 28134 1576 2006
-53 5241 6226 677 3636 505 304
20 -66 8 - 2239 315 308
161625 203841 250667 21695 203663 24178 20261
4587 25250 26994 5645 48681 4349 3368
50583 53678 61573 13912 244763 39826 37114
364 2211 4082 209 13657 649 1175
5023 -5072 -5077 150 8089 7218 415
6431 -2587 -2530 5 776 210 98
10555 14406 25525 7108 114713 14946 13854
10990 131081 137726 4927 91329 9878 5280
- - - - - - -
61453 -6693 -6437 4455 46646 19287 8826
29653 35418 62714 10558 125642 11500 18375
602 43664 44388 6829 68851 11731 6168
107120 67965 77604 6385 25764 6129 3463
477 -218 142 205 15750 1977 2769
279 14127 15627 2483 22975 895 1819
381 2851 2899 616 14774 6 1741
8290 -9444 -6987 -28 27193 2478 2754

268
绍兴市统计年鉴2020
7-8 分区、县(市)商品交易市场成交情况(2019年)
指 标 Item全 市Whole
Municipality
商品交易市场个数 ( 个 ) Number of Transaction Markets (unit) 396
#超亿元市场 Above 100 Million Yuan 65
超十亿元市场 Above 1000 Million Yuan 22
超百亿元市场 Above 10 000 Million Yuan 7
商品交易市场成交额 ( 万元 ) Business Value of Transaction Markets (10 000 yuan) 38139952
一、消费品市场 Consumer Goods Market 24106066
1. 消费品综合市场 General Market 656854
2. 农副产品市场 Agricultural Products and By-products Market 3904758
3. 工业消费品市场 Industrial Consumer Goods Market 19544454
二、生产资料市场 Means of Industrial Production Market 14033886
1. 生产资料综合市场 General Market 3405000
2. 工业生产资料市场 Means of Industrial Production Market 10628886
3. 农业生产资料市场 Means of Agricultural Production Market -
三、服务市场 Service Market -

269
国内贸易和对外经济
Transactions at Commodity Market in Each District and County (City) (2019)
越城区Yuecheng
District
柯桥区KeqiaoDistrict
上虞区ShangyuDistrict
诸暨市ZhujiCity
嵊州市Shengzhou
City
新昌县XinchangCounty
79 90 52 88 46 41
31 4 11 11 5 3
10 1 2 4 3 2
2 2 - 3 - -
8298050 20503041 1287945 6106538 1080637 863741
1989690 14204704 1256345 4784064 1055222 816041
111450 133606 161583 147218 88162 14835
1283300 251973 632631 521730 565918 649206
594940 13819125 462131 4115116 401142 152000
6308360 6298337 31600 1322474 25415 47700
3405000 - - - - -
2903360 6298337 31600 1322474 25415 47700
- - - - - -
- - - - - -

270
绍兴市统计年鉴2020
7-9 历年分区、县(市)合同利用外资Foreign Capital in the Signed Contracts in Each District and County (City) over the Years
年 份Year
全 市Whole
Municipality
越城区Yuecheng
District
柯桥区Keqiao District
上虞区Shangyu District
诸暨市Zhuji City
嵊州市Shengzhou
City
新昌县Xinchang County
1990 1132
1995 26166 5087 14329 2182 2505 1194 869
1996 32220 7382 15138 7166 1704 43 787
1997 7487 3210 2015 537 354 1205 166
1998 12871 3801 6176 1996 710 152 36
1999 12333 3038 6196 2309 254 398 138
2000 16642 6342 5261 2955 1318 193 573
2001 28826 9634 10150 5622 1726 1010 684
2002 80175 21372 23333 8763 13560 10012 3135
2003 150121 33226 36022 20212 25657 26309 8695
2004 167117 38694 45374 26221 31696 14002 11130
2005 202139 43671 50864 32139 39107 23645 12713
2006 216311 51816 53446 34443 40339 22438 13829
2007 236516 48396 68663 33562 42133 30787 12975
2008 166823 19218 56311 35047 30149 20399 5699
2009 94193 18758 2470 41049 18537 11445 1934
2010 144641 21264 9570 54392 44007 13687 1721
2011 115468 21504 15465 32251 30263 13837 2148
2012 83173 8239 21717 35055 16867 1028 267
2013 93903 12080 26135 34972 18834 -1009 2891
2014 102993 12816 17034 34571 35300 806 2466
2015 157570 19648 21579 34650 61264 18430 1999
2016 128543 5268 23715 17869 68712 9492 3487
2017 278927 31994 86298 69226 66038 17855 7516
2018 212875 47563 50687 40999 38717 22608 12301
2019 251161/245656 43772/42943 63308/62731 53308 /51874 59227/59228 27526 /25020 4020 /3860
注:① 2002 年始,利用外资不包括境外借款,下同。②从 2019 年开始利用外资数据采用部口径数据,2019 年数据斜线前为省口径数据,斜线后为部口径数据,下同。
Note: a) Since 2002, the data of foreign capital utilization doesn't include foreign loans,similarly hereinafter. b) Since 2019, Ministry of Commerce data have started to be utilized in foreign capital data. Here, provincial foreign capital data are used before the slash, while Ministry of Commerce data are used after the slash, similarly hereinafter.
单位:万美元 (USD 10 000)

271
国内贸易和对外经济
7-10 历年分区、县(市)实际利用外资Foreign Capital Actually Used in Each District and County (City) over the Years
年 份Year
全 市Whole
Municipality
越城区Yuecheng
District
柯桥区Keqiao District
上虞区Shangyu District
诸暨市Zhuji City
嵊州市Shengzhou
City
新昌县Xinchang County
1990 503 59 305 57 23 11 48
1995 12959 4532 5130 1565 814 496 422
1996 11518 3338 4847 1540 475 546 772
1997 11481 4213 5737 1002 455 23 51
1998 11789 4064 4587 2061 205 816 56
1999 8249 1351 4816 1725 158 114 86
2000 11598 2857 5050 2302 703 367 319
2001 15777 5167 5212 2804 955 861 778
2002 38167 10780 10453 6221 4031 4066 2616
2003 74271 15760 23016 10842 11081 10006 3566
2004 82344 19249 25120 13535 15027 5066 4347
2005 90095 20278 23480 15504 18912 10246 1675
2006 97188 30086 26502 10104 18813 8597 3086
2007 110476 24760 33136 15518 24525 9018 3519
2008 77235 14283 23221 12012 20510 6307 903
2009 81117 13766 10230 25229 23225 6616 2051
2010 95327 14656 22001 30015 18003 8308 2344
2011 80468 14385 15015 15011 24965 8672 2420
2012 95400 14132 23238 25351 22109 8013 2557
2013 80782 15547 20527 20007 21311 675 2715
2014 67130 11642 21003 22025 10045 209 2206
2015 94152 14700 23133 26457 20026 7549 2287
2016 80031 7008 18299 18674 24013 9337 2700
2017 128666 16479 32817 37508 28577 10006 3279
2018 135141 17688 28898 40429 30103 11170 6853
2019 152543/65739 19349 / 2056 40145 / 20772 43787/34694 30916 /6296 12752 /921 5594 /1000
单位:万美元 (USD 10 000)

272
绍兴市统计年鉴2020
7-11 分区、县(市)利用外资情况(2019年)Utilization of Foreign Capital in Each District and County (City) (2019)
指 标 Item全 市Whole
Municipality
越城区Yuecheng
District
柯桥区Keqiao District
上虞区Shangyu District
诸暨市Zhuji City
嵊州市Shengzhou
City
新昌县Xinchang County
累计三资企业总数 ( 个 )
Accumulative Foreign-funded Enterprises (unit)
7373 1351 2368 1406 1197 795 256
# 2019 年新增
Newly Increased in Current Year
287 32 144 49 45 14 3
累计总投资额 Accumulative Investment 5429095 1103888 1355924 1261951 1028013 462131 217188
# 2019 年新增
Newly Increased in Current Year
447112 101642 75435 172234 66304 27477 4020
累计注册资本Accumulative Registered Capital
3749445 738629 876869 875156 806989 319603 132199
# 2019 年新增
Newly Increased in Current Year
417402 101643 71598 147477 66206 26458 4020
累计合同外资
Accumulative Agreement of Foreign Investment
3093293 559262 747715 678446 697243 293320 117307
# 2019 年新增
Newly Increased in Current Year
251161/245656 43772/42943 63308/62731 53308 /51874 59227/59228 27526 /25020 4020 /3860
累计实到外资Accumulative Foreign Investment
1770064 327894 463067 405518 372920 141768 58897
# 2019 年新增
Newly Increased in Current Year
152543/65739 19349 / 2056 40145 / 20772 43787/34694 30916 /6296 12752 /921 5594 /1000
单位:万美元 (USD 10 000)

273
国内贸易和对外经济
7-12 境外投资情况(2019年)Investment Abroad (2019)
7-13 省级及以上经济开发区利用外资情况(2019年)The Situation of Utilizing Foreign Capital of Provincial Level and Above Economic Development Zone (2019)
指 标 Item全 市Whole
Municipality
越城区Yuecheng
District
柯桥区Keqiao District
上虞区Shangyu District
诸暨市Zhuji City
嵊州市Shengzhou
City
新昌县Xinchang County
累计批准企业数 ( 家 )
Number of Registered Enterprises (unit)
1288 137 514 139 303 81 114
# 2019 年新批Newly Approved in Current Year
46 9 7 6 12 3 9
累计总投资额( 万美元 )
Total Investment (USD 10 000) 923896 36414 110536 247754 295352 11707 222133
# 2019 年新增Newly Increased in Current Year
82530 3880 10909 14104 34072 296 19270
指 标 Item
企业家数 ( 家 )Number of Registered
Enterprises (unit)
合同外资Foreign Capital in the Signed Agreements &
Contracts
实到外资Foreign Capital Actually
Used
当年新批Newly
Approved in Current Year
累 计Accumu-
lative
当年新批Newly
Approved in Current Year
累 计Accumu-
lative
当年新批Newly
Approved in Current Year
累 计Accumu-
lative
合 计 Total 126 2057 129999 1609271 93437 1026560
绍兴高新技术开发区
Shaoxing high&technology Development Zone
15 215 19516 138540 17293 82117
柯桥经济技术开发区
Keqiao Economic Development Zone 47 359 37074 236333 21950 157336
上虞经济开发区 Shangyu Economic Development Zone 13 331 9369 194403 7786 112048
嵊州经济开发区 Shengzhou Economic Development Zone 14 294 22608 208306 12752 121350
诸暨经济开发区 Zhuji Economic Development Zone 13 259 10443 233917 9628 151603
袍江经济技术开发区
Paojiang Economic Development Zone 12 565 18913 334984 1156 207038
杭州湾上虞经济技术开发区
Hangzhou Bay-Shangyu Economic Development Zone
12 34 12076 262788 22872 195068
单位:万美元 (USD 10 000)

274
绍兴市统计年鉴2020
7-14 历年分区、县(市)进出口总额Imports and Exports in Each District and County (City) over the Years
年 份Year
全 市Whole
Municipality
越城区Yuecheng
District
柯桥区KeqiaoDistrict
上虞区Shangyu District
诸暨市ZhujiCity
嵊州市Shengzhou
City
新昌县Xinchang County
1988 786
1989 2637
1990 3349
1991 5770
1992 11673
1993 18624
1994 31871
1995 49137 17141 15824 3425 8166 3422 1159
1996 80914 23145 40453 7098 10127 2556 3010
1997 79792 24530 26994 9098 12043 3724 5628
1998 91023 25930 34320 5708 11071 4392 9602
1999 98019 27949 31056 7285 13250 5047 13432
2000 166245 40358 67173 15766 19534 9647 13767
2001 247085 50028 112223 26081 29876 13256 15621
2002 387036 85014 194037 30978 36934 18245 21828
2003 596134 128727 302124 43526 63192 24577 33988
2004 866224 175118 426990 65043 109430 37271 52370
2005 1048473 223390 454422 96651 163852 51276 58881
2006 1394914 303739 581260 124438 246518 61283 77676
2007 1929473 408201 815000 174696 346573 91580 93421
2008 2382668 478583 989097 229776 444597 117178 123437
2009 2049048 401955 843114 208837 400731 101110 93302
2010 2701612 551791 1092973 286463 500366 140591 129428
2011 3350542 728477 1331964 335012 622945 165997 166247
2012 3209794 699460 1283227 322867 574990 167870 161380
2013 3336650 822021 1254359 373265 540477 162887 183641
2014 3468393 913292 1259669 371689 565184 163577 194980
2015 2990227 697059 1124928 373090 469321 143628 182201
2016 2760537 609237 1002796 371931 457489 138854 180231
2016( 亿元 ) 1820.90 401.82 661.12 245.26 301.91 91.92 118.87
2017 1997.44 441.97 709.24 269.16 337.26 103.07 136.74
2018 2240.29 483.60 791.55 287.02 405.45 114.47 158.19
2019 2458.97 527.57 909.71 302.52 488.08 85.97 145.11
单位:万美元 (USD 10 000)
注:1998 年起按海关口径统计,2016 年起按人民币口径统计,下同。Note: Data since 1998 have been obtained from the customs statistics, and calculated by CNY since 2016. The same below.

275
国内贸易和对外经济
7-15 历年分区、县(市)自营出口额Total Export in Each District and County (City) over the Years
年 份Year
全 市Whole
Municipality
越城区Yuecheng
District
柯桥区KeqiaoDistrict
上虞区Shangyu District
诸暨市ZhujiCity
嵊州市Shengzhou
City
新昌县Xinchang County
1988 786 199 58 2 441 82 4
1989 2273 967 281 367 547 71 40
1990 3338 1155 367 367 941 434 74
1991 5729 2633 778 65 1739 425 89
1992 11500 5105 2597 492 2097 965 244
1993 18109 6500 4292 1530 3823 1635 329
1994 30850 11048 6680 2175 6020 4049 878
1995 44917 16046 13166 3275 7907 3364 1159
1996 53000 20598 16144 6812 9441 2470 3010
1997 65471 22139 17583 7778 11380 3206 5628
1998 58904 19174 16500 3420 9200 3060 7550
1999 71271 19547 22637 4931 8792 4517 10847
2000 127735 28895 51354 12232 14832 8783 11639
2001 187459 32334 85126 21349 23162 12721 12767
2002 290118 50836 146071 26908 31461 16836 18005
2003 453313 76509 236665 37414 53315 21717 27691
2004 660853 115323 321827 57510 88589 32998 44607
2005 814162 163379 337405 80878 134626 46330 51545
2006 1050294 211688 398627 107216 202463 58866 71435
2007 1381235 272598 527909 148418 261954 84078 86277
2008 1749502 338512 642264 191258 353605 108133 115730
2009 1576149 312961 598692 163165 321264 93244 86824
2010 2108906 431327 793902 227014 410180 124717 121766
2011 2598605 544916 946909 273990 507859 154504 152428
2012 2555689 524170 974143 274693 474748 158388 149547
2013 2791483 640230 1052105 311867 461796 152132 173354
2014 2975147 708082 1100265 330851 491438 155035 189476
2015 2714241 619671 1041895 334743 409588 134864 173480
2016 2556423 545105 957351 336066 408936 132266 176698
2016( 亿元 ) 1686.23 359.46 631.08 221.60 269.97 87.60 116.53
2017 1852.02 387.78 684.48 242.01 305.71 99.13 132.90
2018 2046.10 428.06 749.34 255.50 348.97 110.10 154.13
2019 2251.07 466.54 865.76 278.29 416.86 82.63 140.98
单位:万美元 (USD 10 000)

276
绍兴市统计年鉴2020
7-16 主要洲、国别(地区)外贸进出口Import and Export by Continent and County (Region)
国 别( 地区 )
Country(Territory)
2018 年 2019 年
出口额Exports
进口额Imports
出口额Exports
进口额Imports
总 计 Total 2046.10 194.19 2251.07 207.90
亚 洲 Asia 830.21 113.46 979.80 120.56
#香 港 Hong Kong 12.72 0.58 13.91 2.68
日 本 Japan 54.19 26.64 55.54 30.64
韩 国 Korea, Rep. 53.19 26.86 66.44 21.27
印度尼西亚 Indonesia 81.58 2.30 95.66 2.39
新加坡 Singapore 5.42 0.56 6.79 3.76
台 湾 Taiwan 13.83 8.14 15.12 8.59
泰 国 Thailand 35.14 1.87 42.57 1.59
马来西亚 Malaysia 28.42 2.41 36.16 3.23
菲律宾 Philippines 20.34 0.11 23.67 0.09
越 南 Vietnam 87.15 4.41 98.77 4.01
欧 洲 Europe 397.19 24.22 418.84 27.54
#德意志共和国 Germany 64.98 5.28 66.39 6.10
意大利 Italy 36.98 2.63 39.77 1.60
英 国 United Kingdom 32.68 5.89 35.14 5.71
比利时 Belgium 15.26 0.56 18.89 1.14
西班牙 Spain 27.37 1.20 30.30 0.81
法 国 France 31.09 1.60 30.70 0.86
俄罗斯 Russian Fed. 38.52 1.21 42.60 1.34
荷 兰 Netherlands 29.66 0.69 29.16 1.24
北美洲 North America 346.16 20.95 321.85 22.42
#美 国 United States 319.08 18.30 294.26 20.09
加拿大 Canada 27.08 2.65 27.58 2.33
非 洲 Africa 204.37 14.62 255.13 22.01
拉丁美洲 Latin America 242.29 16.81 249.88 12.08
#墨西哥 Mexico 51.94 1.47 51.44 0.68
巴 西 Brazil 69.73 0.42 79.28 1.99
智 利 Chile 28.30 11.65 26.61 7.39
大洋洲 Oceania 25.88 4.12 25.58 3.28
#澳大利亚 Australia 21.20 3.99 20.97 3.13
单位:亿元 (100 million yuan)

277
国内贸易和对外经济
7-17 进出口贸易方式(2014-2019年)The Types of Import and Export Goods (2014-2019)
贸易方式 Type 2014 2015 2016 2016( 亿元 )
2017 2018 2019
进口贸易方式 Imports by Type 493246 275986 204114 134.67 145.42 194.19 207.90
一般贸易 Original Trade 351705 214366 129703 85.62 110.18 144.06 152.80
外商投资企业作为投资进口的设备物品
Imported Commodities as Investment of Foreign Enterprises
86 38 - - - - -
进料加工贸易 Processing Imported Raw Materials 131104 55227 50677 33.36 22.50 37.43 42.09
来料加工装配贸易
Processing and Assembling Raw Material Supplied by Foreign Firms
7540 5198 7169 4.73 4.54 2.79 1.61
保税仓库进出境货物
Import & Export Commodities in Protective Tariff Zone
2441 839 16174 10.70 7.96 9.70 10.76
来料加工装配进口的设备
Assembling Imported Equipment - - - - - - -
加工贸易进口设备 Processing Imported Equipment - - - - - - -
补偿贸易 Compensation Trade - - - - - - -
其他贸易 Others 370 318 391 0.26 0.24 0.21 0.34
捐赠物资 Donations - - - - - - -
出口贸易方式 Exports by Type 2975147 2714241 2556423 1686.23 1852.02 2046.10 2251.07
一般贸易 Original Trade 2699726 2524534 2410277 1589.82 1758.17 1951.69 2151.73
进料加工贸易 Processing Imported Raw Materials 262686 178730 129657 85.49 83.11 84.85 90.76
来料加工装配贸易
Processing and Assembling Raw Material Supplied by Foreign Firms
12038 10508 12779 8.43 8.30 9.25 7.90
国家间、国际无偿援助和赠送的物资
Nonreimbursable Assistance and Donations between Nations
329 133 84 0.05 0.02 - 0.17
保税仓库进出境货物
Import & Export Commodities in Protective Tariff Zone
3 92 3442 2.31 2.23 0.09 0.05
边境小额贸易 Border Small-volume Trade - - 1 - - - -
对外承包工程出口货物
Exported Commodities for Contracted Projects
- 7 - - - - -
其他贸易 Others 365 238 183 0.12 0.18 0.22 0.35
单位:万美元 (USD 10 000)

278
绍兴市统计年鉴2020
7-18 主要进口及出口商品额(2014-2019年)The Value of Import and Export Goods (2014-2019)
贸易方式 Type 2014 2015 2016 2016( 亿元 )
2017 2018 2019
进口商品名称 Import Goods
# 机电产品 Mechanical and Electrical Products 31881 29781 25787 17.07 17.82 21.85 30.24
# 高新技术产品 High Tech Product 12022 13984 12612 8.33 7.11 11.69 19.14 # 对苯二甲酸 Telephthalic Acid 3687 587 440 0.29 0.85 0.49 1.94
乙二醇 Ethylene Glycol 41089 30837 19824 13.11 17.30 10.14 7.87
未锻造的铜及铜材 Unwrought Copper and its Alloys 74645 71403 48253 31.74 18.88 35.71 43.43
初级形状的塑料 Primary Plastics 29519 20794 12210 8.07 7.36 8.48 7.78 纺织机械 Textile Machinery 7194 4284 2967 1.95 2.50 2.42 2.30
纺织纱线、织物及制品
Spinning, Textile and Related produets 21354 17572 12165 8.03 9.59 10.08 7.17
废铜 Waste copper 9338 9134 7976 5.26 12.25 29.21 31.73 农产品 Farm products 2664 3913 5005 3.31 3.08 2.57 2.38 成品油 Processed oil 189 115 116 0.08 0.11 0.03 0.02
印刷、装订机械及零件
Printing, Binding Machinery and Related Parts
966 1001 293 0.20 0.94 0.31 0.62
棉花 Cotton 1027 860 1087 0.72 1.67 1.54 1.24 锯材 Lumber 2430 1733 1075 0.71 0.55 0.61 0.52 废纸 (2018 年起为二甲苯 )
Waste Paper(Xylene from 2018) 237 - - - - 24.12 26.40
制造半导体器件或集成电路用的机器及装置
Machines and devices for manufacturing semiconductor devices or integrated circuits
9.63
出口商品名称 Export Goods
# 机电产品 Mechanical and Electrical Products 496621 491970 491591 324.51 377.89 411.89 434.49
# 高新技术产品 High Tech Product 83345 78666 63022 41.54 37.34 38.09 44.64 # 纺织纱线、织物及制品 Textiles 1500922 1376449 1249923 824.04 880.15 960.34 1079.46
服装及衣着附件 Garments 470480 410061 368607 243.13 246.89 268.05 283.23
未锻造的铜及铜材 Unwrought Copper and its Alloys 38839 34773 27366 18.02 20.89 26.08 25.22
医药品 Medical and Pharmaceutical Products 75657 71915 73460 48.48 52.95 65.67 60.53
汽车零件 Parts of Motor Vehicles 40843 39505 45351 29.95 34.17 33.79 31.36
珍珠、宝石及半宝石 Pearl, Gem and Semi-gem 11400 8988 5720 3.76 2.74 3.11 1.91
电视机 Tv 24704 10238 1839 1.20 0.04 0.04 0.04
摩托车及自行车零件 Parts of motorcycle and bicycle 23011 19010 18699 12.32 12.05 14.41 11.01
纺织机械及零件 Textile machinery and related parts 28875 33586 31005 20.41 24.47 21.16 23.47
灯具、照明装置及类似品 Lighting Installation 42580 58197 60492 39.94 26.57 26.02 27.25
合成有机染料 Synthetic Organic Dyestuffs 30077 25997 24066 15.84 17.08 19.98 21.90
床垫、寝具及类似品 Bedding 16006 16896 16706 11.02 11.88 16.48 14.63 茶叶 Tea 15848 17310 17289 11.39 12.49 12.88 11.83
单位:万美元 (USD 10 000)

279
国内贸易和对外经济
7-19 外贸企业获权情况(2019年)Basic Conditions of Foreign Trade Enterprises Being Approved (2019)
7-20 对外经济技术合作情况(2019年)Economic Cooperation with Foreign Countries or Territories (2019)
指 标 Item全 市Whole
Municipality
越城区Yuecheng
District
柯桥区Keqiao District
上虞区Shangyu District
诸暨市ZhujiCity
嵊州市Shengzhou
City
新昌县Xinchang County
累计获权企业数 Accumulative Approved 27686 5598 12910 2806 4049 1454 869
1. 内资企业 Domestic Funded Enterprises 27440 5569 12891 2760 3949 1427 844
2. 个体工商户 Self-employed Individuals 246 29 19 46 100 27 25
当年新批企业数 Newly Approved in Current Year 2271 487 864 244 456 149 71
1. 内资企业 Domestic Funded Enterprises 2250 485 864 239 448 147 67
2. 个体工商户 Self-employed Individuals 21 2 - 5 8 2 4
指 标 Item全 市Whole
Municipality
越城区Yuecheng
District
柯桥区Keqiao District
上虞区Shangyu District
诸暨市ZhujiCity
嵊州市Shengzhou
City
新昌县Xinchang County
承包工程 Contracting Projects
合同额 Contracted Value - - - - - - -
营业额 Turnover 20896 2528 2711 8050 6100 1505 -
新批境外投资企业
Newly Approved of Foreign Investment Enterprises
企业家数 Number of Enterprises 46 9 7 6 12 3 9
总投资额 Total Investment 82530 3880 10909 14104 34072 296 19270
# 中方投资 China investment 76479 3260 8619 14116 30557 268 19659
单位:家
单位:万美元
(unit)
(USD 10 000)

280
绍兴市统计年鉴2020
主要统计指标解释
社会消费品零售额 指各种经济类型的批发零售贸易业、餐饮业和其他行业对城乡居民和社会集团的消费
品零售额。这个指标反映通过各种商品流通渠道向居民和社会集团供应的生活消费品来满足他们生活需要,是
研究人民生活、社会消费品购买力、货币流通等问题的重要指标。
批发零售贸易业 指不直接从事商品的生产,而是从农业、工业或其他的单位那里购买(或调拨)成品或半成
品。未作任何加工,或只做简单的加工,通过转卖以获取利益的单位。
餐饮业 指在一定的场所内,以烹饪、调制等手段,向购买者提供各种主要供现场消费的食品、饮料,并且所
提供的这种服务要大于所提供的其他服务(如娱乐)的单位。
利用外资 指我国各级政府、部门、企业和其他经济组织通过对外借款、吸收外商直接投资以及用其他方式
筹措的境外现汇、设备、技术等。
外商直接投资 是指外国企业和经济组织或个人 ( 包括华侨、港澳台胞以及我国在境外注册的企业 ) 按我
国有关政策、法规,用现汇、实物、技术等在中国大陆开办外商独资企业、与中国大陆的企业或经济组织共同举办
中外合资经营企业、合作经营企业或者合作开发资源的投资 ( 包括外商投资收益的再投资 ) 以及经政府有关部
门批准的项目投资总额内,企业从境外借入的资金。
自营出口 指对外贸易中报告期内实际离开我国口岸或边境的出口商品。包括来料加工装配 ( 上缴费 ) 和
补偿贸易出口等。实际出口统计的原则是“谁出口、谁统计”。即不论是进出口企业之间的代理出口,还是没有进
出口经营权的企业委托有进出口经营权的企业代理出口,均由代理方做出口统计,委托方不做出口统计。
对外承包工程 指各对外承包公司以招标议标承包方式承揽的下列业务:(1) 承包国外工程建设项目;(2) 承包
我国对外经援项目;(3) 承包我国驻外机构的工程建设项目;(4) 与外国承包公司全营或联合承包工程项目时我国
分包部分;(5) 以服务成果向业主收费的技术项目 ( 包括承担地形地貌测绘;地质资源勘探与普查;建设地域规则;
提供设计文件、图纸、生产工艺技术资料和工程技术经济咨询;工程项目的可行性考察、研究和评估;进行技术指
导和培训人员等 ) ;(6) 对外承包兼营的房屋开发业务,对外承包工程的营业额是以货币表现的本期内完成的对外
承包工程的工作量,包括以前年度签订的合同和本年度新签订的合同在报告期完成的工作量。
对外劳务合作 指以收取工资的形式向业主或承包商提供技术和劳动服务的活动。我国对外承包公司在
境外开办的合资企业,中国公司同时又提供劳务的,其劳务部门也纳入劳务合作统计。劳务合作营业额按报告
期内向雇主提交的结算数 ( 包括工资、加班费和奖金等 ) 统计。

281
国内贸易和对外经济
Explanatory Notes on Main Statistical Indicators
Total Retail Sales of Consumer Goods refer to the sum of retail sales of consumer goods
sold by all sectors of the national economy to urban and rural residents and social groups. This indicator is
used to show the supply of consumers’ goods through various channels to households and institutions, and is
very important for the study on changes at the domestic retail market, and on economic cycles.
Wholesale and Retail Enterprises refer to the enterprises do not produce goods directly but (or
allocate) end product or half-done products from the enterprises of farming, industry or other fields, do not do
any process or only do some easy processing, get profits by selling to the others.
Catering trade refer to the units offer various food and drinks consumed at once in certain places
and this kind of service is more important than other services (entertainment, e.g.) offered.
Utilization of Foreign Capital refers to remittance, equipment and technology financed from
abroad, by loans, foreign direct investment and other forms undertaken by the Chinese governments at all
levels, by various departments, enterprises and other economic units.
Direct Investment by Foreign Entrepreneurs refers to the investments inside China
by foreign enterprises and economic organizations or individuals (including overseas Chinese, compatriots
from Hong Kong and Macao, and Chinese enterprises registered abroad), following the relevant policies and
laws of China, for the establishment of ventures exclusively with foreign own investment, Sino-foreign joint
ventures and cooperative enterprises or for co-operative exploration of resources with enterprises or economic
organizations in China. It includes the reinvestment of the foreign entrepreneurs with the profits gained from
the investment and the funds that enterprises borrow from abroad in the total investment of projects, which
are approved by the relevant department of the government.
Contracted Projects with Foreign Countries refer to projects undertaken by Chinese contractors
(project contracting companies) through bidding process. They include: (1) overseas civil engineering
construction projects financed by foreign investors; (2) overseas projects financed by the Chinese government
through its foreign aid programs; (3) construction projects of Chinese diplomatic missions, trade offices and
other institutions stationed abroad; (4) construction projects in China financed by foreign investment; (5) sub-
contracted projects to be taken by contractors; (6) housing development projects. The business income from
international contracted projects is the work volume of contracted projects completed during the reference
period, expressed in monetary terms, including completed work on projects signed in previous years.
Service Cooperation with Foreign Countries refer to the activities of providing
technology and labour services to employers or contractors in the forms of receiving salaries and wages.
Labour services providing by contractual joint ventures of Chinese international contracting corporations
should be included in the statistics of service co-operation with foreign countries. The business income of
labour service co-operation is the income in the form of wages and salaries, overtime pay, bonuses and other
remuneration received from the employers during the reference period.


财政、金融、保险8CHAPTER 8 PUBLIC FINANCE, BANKING AND INSURANCE

284
绍兴市统计年鉴2020
0
100
200
300
400
500
600
700
800
900
财 政 收 支 情 况Financial Revenue and Expenditure
财政收入 2.35 5.72 10.12 20.60 47.86 150.56 349.25 602.19 630.08 705.53 811.85 825.36
一般公共预算支出 0.92 2.16 4.59 10.96 25.76 80.04 221.95 421.41 456.10 469.83 556.65 640.87
1980 1985 1990 1995 2000 2005 2010 2015 2016 2017 2018 2019
单位:亿元 (100 million yuan)
0
1000
2000
3000
4000
5000
6000
7000
8000
9000
10000
存款余额 4.5 14.5 54.1 239.4 655.7 1864.9 4910.9 6821.0 7263.3 7657.6 8227.0 9408.2
贷款余额 5.6 17.2 50.3 193.6 458.5 1381.7 3820.1 5947.2 6111.2 6676.8 7468.3 8527.5
1980 1985 1990 1995 2000 2005 2010 2015 2016 2017 2018 2019
单位:亿元(100 million yuan)
金融系统年末人民币存贷款余额RMB Deposits and Savings Balance of Financial Institutions (Year-end)

285
财政、金融、保险
8-1 历年财政收入Financial Revenue over the Years
年 份Year
全 市Whole
Municipality
越城区Yuecheng
District
柯桥区KeqiaoDistrict
上虞区Shangyu District
诸暨市ZhujiCity
嵊州市Shengzhou
City
新昌县Xinchang County
1949 1612 790 306 292 165 60
1952 3864 2036 560 637 462 169
1957 6694 3488 788 1136 791 492
1962 7298 3938 937 1002 839 582
1965 7790 3301 1175 1460 1237 617
1970 8897 3945 1329 1541 1476 607
1975 11407 -46 4961 1831 1774 1920 967
1980 23549 1630 10349 3004 3269 3147 2150
1985 57203 15459 17191 8000 6344 6165 4044
1990 101159 26737 33330 13194 10845 10071 6982
1991 108717 28636 35329 14590 11741 10680 7741
1992 115231 30328 37849 14788 12891 10861 8514
1993 155807 40651 53391 20018 17068 14129 10550
1994 182590 48681 60517 23676 21317 15985 12414
1995 205980 54059 67788 27106 25189 17583 14255
1996 235296 61933 77046 30983 28919 20116 16299
1997 270090 72655 87570 35817 32969 22238 18841
1998 306137 81198 98012 41305 38417 25406 21799
1999 341179 84368 107717 47499 45311 30105 26179
2000 478654 130099 139743 55204 76204 40262 37142
2001 623692 149661 182983 72026 110123 51154 57745
2002 849967 212796 240800 109088 141123 74123 72037
2003 1073378 266645 308276 138634 181613 90180 88030
2004 1267090 315216 364454 158168 225978 102902 100372
2005 1505617 376998 423230 201816 271936 117572 114065
2006 1847269 475699 520969 250087 334260 131246 135008
2007 2371225 598699 670247 330278 435500 165698 170803
2008 2746472 691637 757283 398063 503301 193178 203010
2009 2985319 747472 812021 439641 546880 208320 230985
2010 3492469 834568 935035 541333 655100 245103 281330
2011 4264528 981644 1170265 651066 800512 321506 339535
2012 4693118 1037566 1277625 729262 925995 337279 385391
2013 5021486 1081219 1357709 783770 1000066 375723 422999
2014 5463398 1169292 1450907 866963 1095405 414565 466266
2015 6021890 1329214 1605437 975003 1129322 467896 515018
2016 6300779 1471176 1652099 1037245 1125912 487822 526525
2017 7055282 1582618 1809628 1218881 1237812 602767 603576
2018 8118532 1938683 1985767 1412484 1377968 693247 710383
2019 8253592 1984967 1978229 1476134 1420293 696663 697306
单位:万元 ( 10 000 yuan )
注:① 2004 年财政收入按 2005 年财政体制进行了调整;② 2015 年起按照财政体制调整。Note: a) The financial revenue of year 2004 was adjusted according to the financial system of year 2005. b)Since 2015, the financial
revenue was adjusted according to the financial system.

286
绍兴市统计年鉴2020
8-2 历年一般公共预算收入General Public Budget Revenues over the Years
年 份Year
全 市Whole
Municipality
越城区Yuecheng
District
柯桥区KeqiaoDistrict
上虞区Shangyu District
诸暨市ZhujiCity
嵊州市Shengzhou
City
新昌县Xinchang County
1994 84199 23020 26238 10016 12605 6558 5762
1995 95243 26006 28738 11335 15142 7615 6407
1996 108287 30219 32052 12850 17252 8640 7274
1997 125370 35987 36676 14904 19411 9732 8660
1998 142046 40236 40580 17321 22556 11197 10156
1999 170226 45830 47614 21038 27474 14965 13305
2000 245398 73154 65394 26647 41379 20335 18489
2001 355860 93673 98019 41774 64802 29053 28539
2002 396198 112726 105022 45157 68412 36178 28703
2003 504849 141561 135362 59456 89711 43990 34769
2004 635661 175344 170991 73060 119244 53566 43456
2005 761326 211784 201336 100081 141473 57437 49215
2006 945465 268302 256531 122353 174002 64596 59681
2007 1221169 338583 327923 167056 227499 83830 76278
2008 1435954 389598 385212 202334 265235 100045 93530
2009 1604310 430134 435832 227646 295666 108594 106438
2010 1932305 483297 517568 291582 373327 131523 135008
2011 2396916 592237 637690 355195 457520 184346 169928
2012 2657555 637549 704424 391888 526188 197498 200008
2013 2930721 674641 775655 431075 596047 227275 226028
2014 3172705 725584 820088 465581 663386 250538 247528
2015 3628935 826943 978488 535837 715894 291745 280028
2016 3903010 898833 1060220 596523 717938 320096 309400
2017 4313596 957964 1140629 701094 770087 380222 363600
2018 5013379 1175971 1263560 826461 873729 454858 418800
2019 5283698 1282103 1314074 895152 898144 457590 436635
单位:万元 ( 10 000 yuan )

287
财政、金融、保险
8-3 历年一般公共预算支出General Public Budget Expenditures over the Years
年 份Year
全 市Whole
Municipality
越城区Yuecheng
District
柯桥区KeqiaoDistrict
上虞区Shangyu District
诸暨市ZhujiCity
嵊州市Shengzhou
City
新昌县Xinchang County
1949 70 43 3 2 15 7
1952 410 100 39 114 124 33
1957 1606 655 207 349 226 169
1962 2816 695 514 864 491 253
1965 2292 896 360 449 338 250
1970 3289 913 549 618 767 442
1975 5487 429 1500 971 998 832 757
1980 9152 819 2249 1370 2016 1522 1175
1985 21579 5356 4647 3552 3194 2626 2203
1990 45854 10390 11618 6352 7172 5868 4454
1991 50104 11586 12248 7550 7649 6273 4798
1992 55989 12913 13417 8167 9600 6643 5249
1993 77204 17134 19402 12195 12177 9353 6943
1994 100236 20271 32677 15013 14528 8839 8908
1995 109642 24572 30142 15609 17138 11574 10607
1996 123236 29319 33305 18008 19223 11612 11769
1997 141658 35844 35490 21063 22804 13083 13374
1998 164393 41096 40845 26318 25604 15204 15326
1999 194252 47531 48939 30489 31151 18909 17233
2000 257595 71836 57000 38224 43749 24085 22701
2001 373650 96873 92134 48170 66164 35628 34681
2002 451569 119977 111083 58702 79457 42299 40051
2003 570548 146403 150216 74182 99051 52838 47858
2004 645049 186124 146243 84210 115681 59678 53113
2005 800388 222671 188995 111600 144257 70054 62811
2006 954864 271917 231280 133488 165399 79754 73026
2007 1137609 298188 272671 168929 206423 101460 89938
2008 1440939 384274 340021 212191 278350 123887 102216
2009 1695366 405810 420590 267468 322913 145856 132729
2010 2219473 555715 518692 321821 436976 198140 188129
2011 2533091 635331 586443 357568 494358 231803 227588
2012 2787074 687442 626082 399217 556945 268498 248890
2013 3121077 731902 686815 452132 670386 304114 275728
2014 3464437 833881 714241 500112 741445 344500 330258
2015 4214117 1022721 985258 600132 809001 411737 385268
2016 4560959 1018349 989490 650296 972356 516270 414198
2017 4698303 1054306 1018938 725852 913114 531965 454128
2018 5566451 1473291 1128860 864179 922137 610104 567880
2019 6408697 1586084 1269886 1044758 1105037 759482 643450
单位:万元 ( 10 000 yuan )

288
绍兴市统计年鉴2020
8-4 一般公共预算收入(2019年)
指 标 Item全 市Whole
Municipality
财政总收入 Financial Revenue 8253592
一、一般公共预算收入 General Public Budget Revenues 5283698
1. 税收收入 Taxes 4184036
#增 值 税 (50% 部分 ) Value-added Tax (50%) 1067043
改征增值税 (50% 部分 ) The Change from Business Tax to Value-Added Tax(50%) 549523
企业所得税 (40% 部分 ) Enterprises' Income Tax (40%) 638442
个人所得税 (40% 部分 ) Individual Income Tax (40%) 185087
城市维护建设税 Tax on Town Maintenance and Construction 226164
房 产 税 Tax on Real Estates 266670
耕地占用税 Tax on The Occupancy of Cultivated Land 119512
契 税 Contract Tax 399806
其他税收 Other Taxes (Income,Revenue) 731789
2. 行政事业性收费 Administrative Fees 80340
3. 国有资本经营收入 Planning Subsidies to Loss-suffering State-owned Enterprises -28451
4. 罚没收入 Penalty and confiscatory income 155250
5. 专项收入 Expert Project Income 660164
6. 其他收入 Other Revenue 232359
二、地方上划中央六税 Revenue of Central Government 2969894
1. 增 值 税 (50% 部分 ) Value-added Tax (50%) 1067043
2. 消 费 税 Consumption Tax 118032
3. 企业所得税 (60% 部分 ) Enterprises' Income Tax (60%) 957665
4. 个人所得税 (60% 部分 ) Individual Income Tax (60%) 277631
5. 改征增值税 (50% 部分 ) The Change from Business Tax to Value-Added Tax(50%) 549523
单位:万元

289
财政、金融、保险
General Public Budget Revenues(2019)
越城区Yuecheng
District
柯桥区KeqiaoDistrict
上虞区ShangyuDistrict
诸暨市ZhujiCity
嵊州市Shengzhou
City
新昌县XinchangCounty
1984967 1978229 1476134 1420293 696663 697306
1282103 1314074 895152 898144 457590 436635
917090 1087971 756681 746813 350430 325051
164450 236046 220283 248207 83528 114529
159819 126295 85463 95609 43728 38609
143855 160095 143031 86113 54377 50971
37271 38415 37814 31204 19864 20519
61635 42423 41435 44425 18975 17271
49224 104913 31698 46542 17618 16675
-4782 14428 77724 16754 6561 8827
110363 93050 53996 79548 45572 17277
195255 272306 65237 98411 60207 40373
22509 11684 13230 14865 6908 11144
-22000 492 -2943 - -4000 -
53101 16829 15582 28079 33668 7991
271739 167883 69789 79600 45206 25947
39664 29215 42813 28787 25378 66502
702864 664155 580982 522149 239073 260671
164450 236046 220283 248207 83528 114529
106904 4049 3968 2358 455 298
215783 240142 214547 129170 81566 76457
55908 57623 56721 46805 29796 30778
159819 126295 85463 95609 43728 38609
( 10 000 yuan )

290
绍兴市统计年鉴2020
8-5 一般公共预算支出(2019年)
指 标 Item全 市Whole
Municipality
一般公共预算支出合计 General Public Budget Expenditures 6408697
1. 一般公共服务 General Public Services 719414
2. 外交 Diplomacy -
3. 国防 Expenditure for National Defense 7107
4. 公共安全 Public Safety 480204
5. 教育支出 Education Expenditure 1314831
6. 科学技术 Science and Technology 468932
7. 文化旅游体育与传媒 Culture,Tourism,Sports and the Media 124010
8. 社会保障和就业 Social Security and Employment 821521
9. 卫生健康 Public Health 617303
10. 节能环保 Energy Conservation and Environmental Protection 163072
11. 城乡社区事务 Urban and Rural Community Affairs 581508
12. 农林水事务 Agriculture, Forestry, Water Affairs 457441
13. 交通运输 Transport 140284
14. 资源勘探电力信息等事务 Dig and Electric Information 74735
15. 商业服务业等事务 Commercial Services 29946
16. 金融支出 Finance 6100
17. 援助其他地区支出 Aid Other Area Spending 18099
18. 自然资源海洋气象等 Natural resources, marine meteorology, etc 73345
19. 住房保障支出 Housing Security Spending 131369
20. 粮油物资储备 Expenditure of Grain Material Reserve Management 9579
21. 灾害防治及应急管理 Disaster prevention and emergency management 33497
22. 其他支出 Other Expenditure 1099
23. 债务付息支出 Debt Expenditure 134952
24. 债务发行费用支出 Debt issuance expenses 349
单位:万元

291
财政、金融、保险
General Public Budget Expenditures (2019)
越城区Yuecheng
District
柯桥区KeqiaoDistrict
上虞区ShangyuDistrict
诸暨市ZhujiCity
嵊州市Shengzhou
City
新昌县XinchangCounty
1586084 1269886 1044758 1105037 759482 643450
201048 143501 128303 112122 66895 67545
- - - - - -
3205 790 509 1333 535 735
149251 80758 80995 76767 49538 42895
298226 289990 214921 232118 155320 124256
136816 69070 61518 92611 55854 53063
37811 26382 25435 13599 9943 10840
226507 150672 117861 183907 81207 61367
165843 111656 82133 135463 67933 54275
21584 53891 26195 24855 19915 16632
113136 147382 101044 34730 101975 83241
64219 84040 118919 68390 65523 56350
35391 22728 21618 21504 25439 13604
16886 10148 16763 20253 3288 7397
8055 6459 3686 2487 6665 2594
971 - 3623 1157 317 32
6127 4621 3134 3067 1150 -
10076 5460 14825 16420 15479 11085
57991 24610 5172 16029 9202 18365
1381 3128 1663 1034 2134 239
8014 3849 5998 6820 3980 4836
1010 89 - - - -
22486 30618 10366 40335 17075 14072
50 44 77 36 115 27
( 10 000 yuan )

292
绍兴市统计年鉴2020
8-6 历年金融机构年末人民币存款余额RMB Deposits Balance in Financial Institutions (Year-end) Over the Years
年 份Year
全 市Whole
Municipality
越城区Yuecheng
District
柯桥区KeqiaoDistrict
上虞区Shangyu District
诸暨市ZhujiCity
嵊州市Shengzhou
City
新昌县Xinchang County
1949 65 60 1 2 1 1
1952 917 492 84 140 137 64
1957 2751 1101 440 542 366 302
1962 4951 1818 826 1180 833 294
1965 6979 2613 1545 1322 976 522
1970 10489 4258 1987 1946 1575 723
1975 17899 6556 3727 3487 2579 1551
1980 44907 18795 7537 7784 6492 4299
1985 144690 69726 24094 21993 17691 11187
1990 541126 120586 141851 87245 92374 62607 36463
1991 716501 177966 192617 108429 108063 80559 48867
1992 987949 229617 276831 154181 157832 104530 64958
1993 1274253 291989 360479 215845 198278 132619 75043
1994 1776553 397106 527786 293275 275065 180188 103133
1995 2394140 542831 727018 398081 370586 227318 128305
1996 3159406 756360 994546 499721 438260 297897 172622
1997 4008666 954114 1323371 615487 517719 371000 226975
1998 5058127 1253654 1622009 754066 672511 464469 291418
1999 5976042 1590429 1811452 868945 809866 530163 365187
2000 6556579 1974448 1716523 954802 918577 585693 406536
2001 7595686 2618642 1705411 1072799 1094720 630418 473696
2002 9702439 3325640 2251125 1322392 1423109 767033 613140
2003 12801778 4609212 2929131 1777407 1863562 903246 719220
2004 15234995 5449930 3718632 2102526 2194159 1009502 760246
2005 18648862 6913599 4511286 2510803 2628871 1183841 900462
2006 22671625 8521062 5467242 3014011 3190645 1376085 1102580
2007 26392686 10146464 6334024 3481770 3712370 1526121 1191936
2008 32322192 11845854 8151888 4298805 4767320 1825148 1433177
2009 41035362 14837843 10240419 5519567 6213358 2456139 1768037
2010 49108509 17888366 11318528 6827547 7792698 3013718 2267653
2011 54618323 19448885 12248934 7731231 9151326 3403288 2634660
2012 58459494 20319270 13419440 7896743 9906907 3978774 2938361
2013 63654548 21727967 14649968 8307036 10987381 4587041 3395155
2014 65542219 21663322 14420837 9020655 11454039 5055389 3927976
2015 68209613 21329357 16040351 9350101 11859390 5415069 4215345
2016 72633137 21484933 17033481 10704676 12321579 6589219 4499249
2017 76575632 21762892 17680660 11261603 13492399 6847829 5530249
2018 82269775 23641978 19053731 11977484 14360029 7569952 5666600
2019 94081554 28025356 21255310 13699092 16442448 8412413 6246934
单位:万元 ( 10 000 yuan )

293
财政、金融、保险
8-7 历年住户人民币存款Household Deposits Over the Years
年 份Year
全 市Whole
Municipality
越城区Yuecheng
District
柯桥区KeqiaoDistrict
上虞区Shangyu District
诸暨市ZhujiCity
嵊州市Shengzhou
City
新昌县Xinchang County
1952 315 182 35 43 42 13
1957 853 363 150 137 131 71
1962 859 349 131 156 153 70
1965 1867 687 403 318 307 152
1970 2474 990 465 450 395 174
1975 5391 2108 1058 921 845 459
1980 16333 6393 2823 2955 2657 1505
1985 73654 32515 13912 11933 9897 5398
1990 340765 62092 102925 57511 55428 40312 22497
1991 466308 89598 136694 79002 74938 55121 30955
1992 609494 93634 196892 106366 102562 71609 38431
1993 830483 127942 269299 153568 135471 93537 50671
1994 1186165 176394 396330 221381 187747 134793 69520
1995 1628839 241010 572841 302722 242161 179206 90898
1996 2172233 343509 790118 383472 299203 234640 121289
1997 2709469 462863 957115 475147 367153 291507 155684
1998 3413135 615703 1200287 585811 459902 357066 194366
1999 3907533 729803 1355567 672292 519547 395563 234761
2000 3989333 893941 1173680 698497 553701 415766 253748
2001 4566555 1266739 1138451 767330 662454 446898 284683
2002 5396353 1526785 1336128 874296 811057 505355 342732
2003 6649024 1937704 1669822 1051282 1023285 571194 395737
2004 7590618 2227901 1897614 1215560 1208048 622569 418926
2005 8890981 2620744 2192302 1418535 1435301 736659 487440
2006 10450417 3131559 2562497 1649778 1671269 852136 583178
2007 10868531 3270549 2611653 1692720 1810688 890013 592907
2008 14060403 4203963 3548374 2082224 2340157 1131605 754081
2009 16961977 4941577 4212475 2590734 2879007 1421718 916465
2010 19355337 5485734 4650198 3093927 3383042 1682418 1060018
2011 22176428 6280588 5123299 3513849 4050206 1971396 1237091
2012 24920890 6740576 5880757 3780843 4774239 2321042 1423432
2013 27242485 7118402 6199877 4137074 5471969 2664712 1650452
2014 28061541 6661309 6189789 4434845 5865144 3067645 1842808
2015 31130334 6901663 7622536 4846450 6396777 3390629 1972278
2016 34052747 7391474 8130121 5370275 7121561 3906249 2133067
2017 36077511 7798516 8576581 5712059 7461129 4180009 2349217
2018 40828737 8844452 9545849 6523534 8620392 4666645 2627865
2019 47232839 10420100 10989337 7592074 9986825 5324298 2920205
单位:万元 ( 10 000 yuan )

294
绍兴市统计年鉴2020
8-8 历年金融机构人民币贷款余额RMB Loans Balance in Financial Institutions (Year-end) Over the Years
年 份Year
全 市Whole
Municipality
越城区Yuecheng
District
柯桥区KeqiaoDistrict
上虞区Shangyu District
诸暨市ZhujiCity
嵊州市Shengzhou
City
新昌县Xinchang County
1952 345 176 19 74 68 8
1957 5264 2166 787 1001 874 437
1962 10444 4038 1825 1829 1827 925
1965 9690 3290 1888 2105 1494 913
1970 17286 6703 2942 3263 2542 1836
1975 22780 10884 3862 3219 2947 1869
1980 55750 27576 7381 7572 7976 5245
1985 171935 84254 24901 24660 21980 16141
1990 503232 134924 123188 72559 72760 60637 39164
1991 641391 177716 151194 92586 88149 81432 50314
1992 854558 230681 203908 127713 126836 99802 65608
1993 1129387 303332 296097 176072 156664 120341 76881
1994 1488442 380514 419084 233966 205872 156624 92382
1995 1936372 510470 566824 307454 265566 178511 107554
1996 2543421 721108 730842 390681 335758 220034 145004
1997 3161321 861951 1016906 469998 386517 256320 169629
1998 3788597 1049635 1209200 551657 459242 320730 198133
1999 4285624 1273755 1258654 620555 540916 358364 233380
2000 4585080 1527171 1198689 637983 610273 366941 244023
2001 5142476 1861137 1189706 696538 703139 407058 284898
2002 6950958 2670219 1495088 883814 983636 511950 406251
2003 9867918 4003852 2028090 1282967 1323773 675140 554096
2004 11767640 4569898 2702869 1568006 1567348 756146 603373
2005 13816789 5431422 3185553 1846758 1851419 828475 673162
2006 17008493 6492259 4017500 2340293 2363229 1036128 759084
2007 20296222 7859268 4716808 2783492 2920764 1164742 851148
2008 24198779 9152066 5837351 3321085 3594414 1322510 971353
2009 31863826 11754958 7792710 4341915 4973059 1784349 1216835
2010 38201280 14342875 8785299 5122667 6226718 2234655 1489065
2011 43274959 15976621 9765421 6064140 7161669 2520045 1787063
2012 49341738 18142388 11017814 6698163 8458371 2957602 2067400
2013 54478356 19356339 12223560 7237768 9677168 3541706 2441815
2014 58233946 20024581 12560780 7833209 10920153 3999520 2895702
2015 59472120 19424387 12314225 8135839 11894722 4506781 3196166
2016 61111742 20097061 12154365 8379647 11889802 5166913 3423955
2017 66767606 21182424 13445836 9634151 12815063 5628665 4061467
2018 74683142 23956879 15684201 10790592 12911944 6316306 5023220
2019 85275161 28446399 18542473 11828253 13887997 6722903 5847138
单位:万元 ( 10 000 yuan )
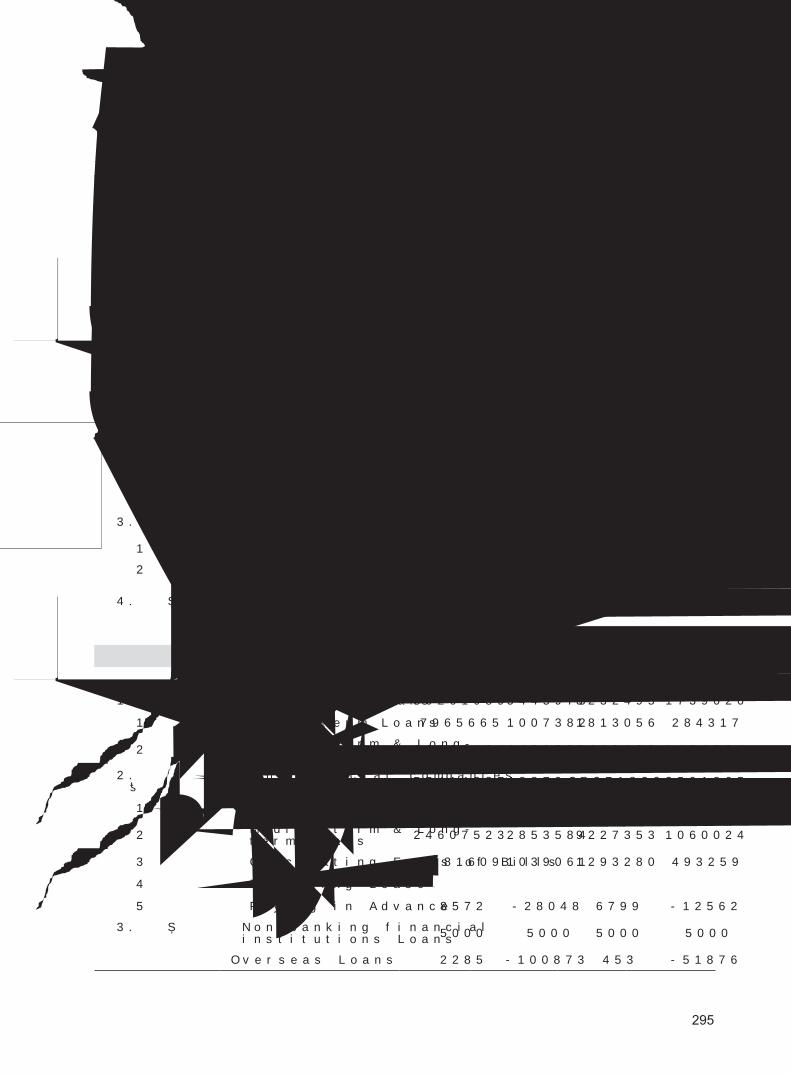
295
财政、金融、保险
8-9 金融机构本外币存、贷款余额基本情况(2019年末)Deposits and Loans Balance of Financial Institutions (End of 2019)
指 标 Item
全 市Whole Municipality
越城区Yuecheng District
总 量Total
比年初 ±Increase overthe Beginning
of the Year
总 量Total
比年初 ±Increase overthe Beginning
of the Year
一、各项存款 Deposits 95821349 11428630 28628589 4090845
(一)境内存款 Domestic Deposits 95571592 11545028 28567493 4049770
1. 住户存款 Household Deposits 47471832 6358136 10532288 1545209
(1)活期存款 Demand Deposits 16614397 1860903 3588344 330368
(2)定期及其他存款 Time and Other Deposits 30857435 4497232 6943944 1214840
2. 非金融企业存款 Non-financial Corporate Deposits 29243630 3593396 11039070 1288293
(1)活期存款 Demand Deposits 12385582 689433 4128371 -75420
(2)定期及其他存款 Time and Other Deposits 16858048 2903962 6910700 1363714
3. 广义政府存款 General Government Deposits 16661362 2071763 5893466 1460726
(1)财政性存款 Fiscal deposits 1794447 818493 1167383 604339
(2)机关团体存款 Organizations Deposit 14866915 1253270 4726084 856387
4. 非银行业金融机构存款
Non-banking financial institutions deposits 2194767 -478266 1102669 -244458
(二)境外存款 Overseas Deposits 249757 -116398 61096 41075
二、各项贷款 Loans 85683211 10236041 28609767 4194009
(一)境内贷款 Domestic Loans 85680926 10336913 28609314 4245885
1. 住户贷款 Households Loans 30261089 5443973 8232495 1739020
(1)短期贷款 Short-term Loans 7965665 1007382 1813056 284317
(2)中长期贷款 Medium-term & Long-term Loans 22295424 4436591 6419438 1454704
2. 非金融企业及机关团体贷款
Non-financial companies and organizations loans 55414837 4887941 20371820 2501865
(1)短期贷款 Short-term Loans 27617134 1023344 9844387 961144
(2)中长期贷款 Medium-term & Long-term Loans 24607523 2853584 9227353 1060024
(3)票据融资 Circulating Funds of Bills 3181609 1039061 1293280 493259
(4)融资租赁 Financing Lease - - - -
(5)各项垫款 Paying in Advance 8572 -28048 6799 -12562
3. 非银行业金融机构贷款
Non-banking financial institutions Loans 5000 5000 5000 5000
(二)境外贷款 Overseas Loans 2285 -100873 453 -51876
单位:万元 ( 10 000 yuan )

296
绍兴市统计年鉴2020
8-10 金融机构外币存、贷款余额基本情况(2019年末)Foreign Deposits and Loans Balance of Financial Institutions (End of 2019)
指 标 Item
全 市Whole Municipality
越城区Yuecheng District
总 量Total
比年初 ±Increase overthe Beginning
of the Year
总 量Total
比年初 ±Increase overthe Beginning
of the Year
一、各项存款 Deposits 249390 -55998 86470 -40112
(一)境内存款 Domestic Deposits 233202 -34227 83923 -42142
1. 住户存款 Household Deposits 34258 -3358 16081 -785
(1)活期存款 Demand Deposits 18054 -1979 8806 -783
(2)定期及其他存款 Time and Other Deposits 16205 -1380 7275 -1
2. 非金融企业存款 Non-financial Corporate Deposits 198782 -30883 67714 -41370
(1)活期存款 Demand Deposits 140967 -26180 41029 -39747
(2)定期及其他存款 Time and Other Deposits 57816 -4703 26685 -1623
3. 广义政府存款 General Government Deposits 90 84 87 84
(1)财政性存款 Fiscal deposits - - - -
(2)机关团体存款 Organizations Deposit 90 84 87 84
4. 非银行业金融机构存款
Non-banking financial institutions deposits 72 -70 40 -71
(二)境外存款 Overseas Deposits 16188 -21771 2548 2030
二、各项贷款 Loans 58492 -12129 23418 -2742
(一)境内贷款 Domestic Loans 58492 -12129 23418 -2742
1. 住户贷款 Households Loans 336 10 185 -3
(1)短期贷款 Short-term Loans 336 10 185 -3
(2)中长期贷款 Medium-term & Long-term Loans - - - -
2. 非金融企业及机关团体贷款
Non-financial companies and organizations loans 58155 -12140 23233 -2738
(1)短期贷款 Short-term Loans 58155 -7472 23233 -2738
(2)中长期贷款 Medium-term & Long-term Loans - -4668 - -
(3)票据融资 Circulating Funds of Bills - - - -
(4)融资租赁 Financing Lease - - - -
(5)各项垫款 Paying in Advance - - - -
3. 非银行业金融机构贷款
Non-banking financial institutions Loans - - - -
(二)境外贷款 Overseas Loans - - - -
单位:万美元 ( USD 10 000)

297
财政、金融、保险
8-11 金融机构人民币存、贷款余额基本情况(2019年末)RMB Deposits and Loans Balance of Financial Institutions (End of 2019)
指 标 Item
全 市Whole Municipality
越城区Yuecheng District
总 量Total
比年初 ±Increase overthe Beginning
of the Year
总 量Total
比年初 ±Increase overthe Beginning
of the Year
一、各项存款 Deposits 94081554 11784774 28025356 4356373
(一)境内存款 Domestic Deposits 93944725 11753583 27982033 4329516
1. 住户存款 Household Deposits 47232839 6377314 10420100 1548779
(1)活期存款 Demand Deposits 16488450 1872445 3526911 334751
(2)定期及其他存款 Time and Other Deposits 30744389 4504869 6893189 1214029
2. 非金融企业存款 Non-financial Corporate Deposits 27856885 3782888 10566684 1564573
(1)活期存款 Demand Deposits 11402172 853181 3842143 192734
(2)定期及其他存款 Time and Other Deposits 16454714 2929707 6724541 1371839
3. 广义政府存款 General Government Deposits 16660737 2071173 5892856 1460136
(1)财政性存款 Fiscal deposits 1794447 818493 1167383 604339
(2)机关团体存款 Organizations Deposit 14866290 1252680 4725474 855798
4. 非银行业金融机构存款
Non-banking financial institutions deposits 2194264 -477792 1102393 -243972
(二)境外存款 Overseas Deposits 136829 31191 43323 26857
二、各项贷款 Loans 85275161 10312678 28446399 4210178
(一)境内贷款 Domestic Loans 85272877 10413550 28445947 4262055
1. 住户贷款 Households Loans 30258742 5443864 8231205 1739021
(1)短期贷款 Short-term Loans 7963319 1007273 1811767 284318
(2)中长期贷款 Medium-term & Long-term Loans 22295423 4436591 6419438 1454704
2. 非金融企业及机关团体贷款
Non-financial companies and organizations loans 55009135 4964686 20209742 2518034
(1)短期贷款 Short-term Loans 27211431 1068052 9682309 977313
(2)中长期贷款 Medium-term & Long-term Loans 24607523 2885621 9227353 1060024
(3)票据融资 Circulating Funds of Bills 3181609 1039060 1293280 493258
(4)融资租赁 Financing Lease - - - -
(5)各项垫款 Paying in Advance 8572 -28048 6799 -12562
3. 非银行业金融机构贷款
Non-banking financial institutions Loans 5000 5000 5000 5000
(二)境外贷款 Overseas Loans 2285 -100873 452 -51876
单位:万元 ( 10 000 yuan )

298
绍兴市统计年鉴2020
8-12 历年保费收入Premium of Insurance over the Years
年 份Year
全 市Whole
Municipality
越城区Yuecheng
District
柯桥区KeqiaoDistrict
上虞区Shangyu District
诸暨市ZhujiCity
嵊州市Shengzhou
City
新昌县Xinchang County
1994 23893 10169 4853 3416 3633 1822
1995 27893 11402 5436 4458 4088 2509
1996 41989 19008 7521 6241 5512 3706
1997 32708 16792 4784 5092 3360 2680
1998 65693 39251 6707 9038 6664 4033
1999 74800 40065 9379 11254 8444 5656
2000 86534 48205 10065 13519 8865 5882
2001 128143 70692 15269 20015 13119 9048
2002 192634 53395 30628 29393 40004 22904 16309
2003 207393 68245 28114 30368 37000 26096 17570
2004 227195 76057 28563 33469 44314 27140 17652
2005 247731 95957 33419 34770 42843 23567 17174
2006 294933 117942 32826 40269 54480 29810 19606
2007 351877 142015 41964 44889 66546 34114 22358
2008 411759 155196 52122 54731 82863 39877 26968
2009 475369 179212 72332 83026 43271 59923 37606
2010 618683 229713 78934 89761 126245 56946 37085
2011 665560 232028 95195 88569 146949 61038 41781
2012 752160 264529 100189 100715 165894 74980 45854
2013 842448 310332 112188 106042 182061 82113 49712
2014 929570 317271 121995 124408 207958 102575 55363
2015 1096929 415968 132043 137020 234620 115750 61528
2016 1292012 520589 158035 162569 261026 122273 67520
2017 1563710 673748 188345 188899 303564 134984 74171
2018 1582717 615480 202532 205580 330907 141681 86538
2019 1744136 790818 147950 169356 373828 176571 85612
单位:万元 ( 10 000 yuan )
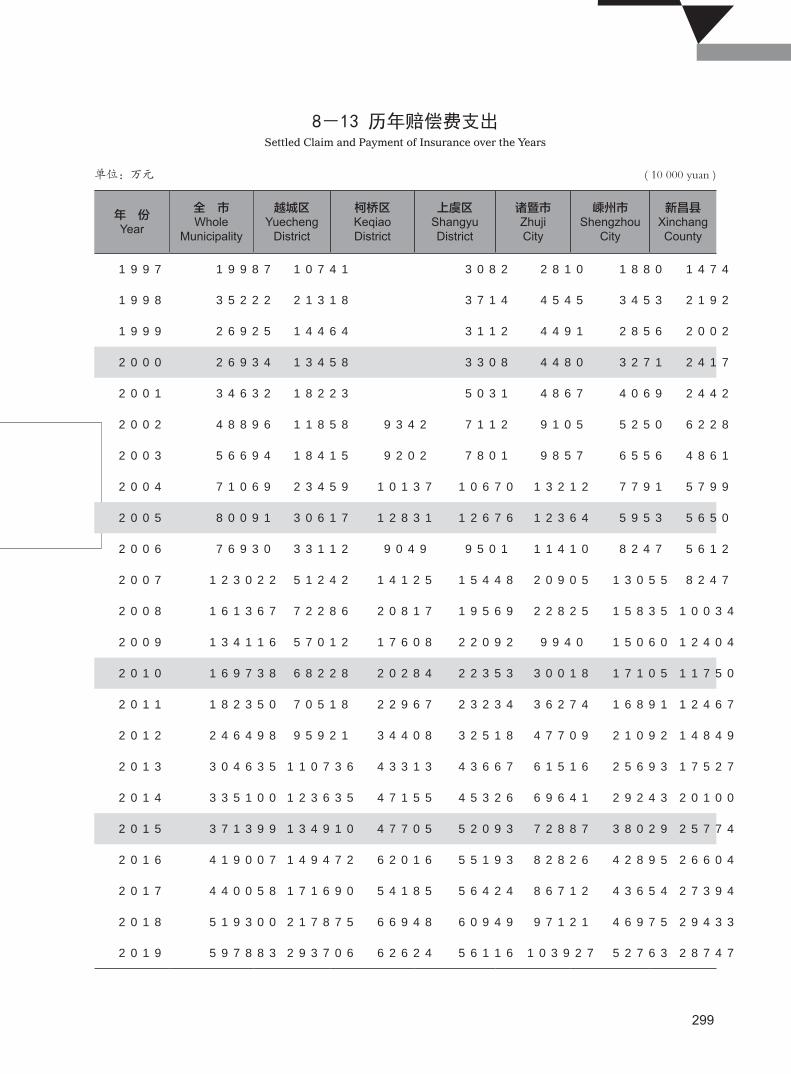
299
财政、金融、保险
8-13 历年赔偿费支出Settled Claim and Payment of Insurance over the Years
年 份Year
全 市Whole
Municipality
越城区Yuecheng
District
柯桥区KeqiaoDistrict
上虞区Shangyu District
诸暨市ZhujiCity
嵊州市Shengzhou
City
新昌县Xinchang County
1997 19987 10741 3082 2810 1880 1474
1998 35222 21318 3714 4545 3453 2192
1999 26925 14464 3112 4491 2856 2002
2000 26934 13458 3308 4480 3271 2417
2001 34632 18223 5031 4867 4069 2442
2002 48896 11858 9342 7112 9105 5250 6228
2003 56694 18415 9202 7801 9857 6556 4861
2004 71069 23459 10137 10670 13212 7791 5799
2005 80091 30617 12831 12676 12364 5953 5650
2006 76930 33112 9049 9501 11410 8247 5612
2007 123022 51242 14125 15448 20905 13055 8247
2008 161367 72286 20817 19569 22825 15835 10034
2009 134116 57012 17608 22092 9940 15060 12404
2010 169738 68228 20284 22353 30018 17105 11750
2011 182350 70518 22967 23234 36274 16891 12467
2012 246498 95921 34408 32518 47709 21092 14849
2013 304635 110736 43313 43667 61516 25693 17527
2014 335100 123635 47155 45326 69641 29243 20100
2015 371399 134910 47705 52093 72887 38029 25774
2016 419007 149472 62016 55193 82826 42895 26604
2017 440058 171690 54185 56424 86712 43654 27394
2018 519300 217875 66948 60949 97121 46975 29433
2019 597883 293706 62624 56116 103927 52763 28747
单位:万元 ( 10 000 yuan )

300
绍兴市统计年鉴2020
8-14 保险事业情况(2019年)Basic Statistics on Insurance (2019)
指 标 Item全 市Whole
Municipality
有效承保金额 ( 亿元 ) Amount Insured (100 million yuan) 103398
1. 财产保险 Property Insurance 61326
2. 人身保险 Life Insurance 42072
保费收入 ( 万元 ) Premium (10 000 yuan) 1744136
1. 财产保险 Property Insurance 635453
#机动车辆保险 Motor Vehicle Insurance 532222
2. 人身保险 Life Insurance 1108683
#寿险 Life Insurance 838426
健康险 Health Insurance 223898
意外伤害险 Unforeseen Injury Insurance 46359
各种赔款和给付 ( 万元 ) Settled Claim and Payment (10 000 yuan) 597883
1. 财产保险 Property Insurance 402513
#机动车辆保险 Motor Vehicle Insurance 346958
2. 人身保险 Life Insurance 195369
#寿险 Life Insurance 128794
健康险 Health Insurance 55351
意外伤害险 Unforeseen Injury Insurance 11225

301
财政、金融、保险
8-15 历年分区、县(市)证券市场基本情况Basic Statistics of stock market over the Years
年 份Year
全 市Whole
Municipality
越城区Yuecheng
District
柯桥区Keqiao District
上虞区Shangyu District
诸暨市ZhujiCity
嵊州市Shengzhou
City
新昌县Xinchang County
上市公司家数 The number of listed companies
2016 45 5 7 11 13 1 8
2017 54 7 8 15 13 2 9
2018 58 8 8 16 13 3 10
2019 59 8 8 17 13 3 10
业务收入 Operating income
2016 14471667 822114 886511 4954837 4717058 31531 3059616
2017 18768833 1112789 1093639 6239549 6489399 96444 3737013
2018 24461900 1276900 1176100 8514900 8666600 216600 4610800
2019 25073206 1486045 1051964 9617075 7904871 237904 4775347
净利润 Net profit
2016 1163956 42911 99406 499541 110214 11896 399987
2017 1506498 67783 123059 746683 77926 15768 475280
2018 1382000 -119300 116400 944900 -220200 24000 636200
2019 1785510 95877 -143840 1079949 144780 24719 584025
净资产 Net assets
2016 14362164 942530 1596827 5561852 2766604 64046 3430305
2017 17690850 1114235 1773641 7133984 2922118 129864 4617008
2018 21024400 1111900 1909200 9609200 2788700 234400 5371000
2019 22835300 1174922 1780187 11061718 3176646 245378 5396449
证券融资 Securities financing
2016 1572900 94000 265200 415600 451400 24400 322300
2017 1265320 54719 46739 251874 128155 24825 759008
2018 987300 49600 84400 505500 207800 51900 88100
2019 521700 44000 96500 43200 315000 23000 -
单位:万元 ( 10 000 yuan )
注:本表统计范围为境内上市企业,证券融资不包含债券。Note: This form's statistical coverage just included the domestic listed companies, furthermore, securities financing did not include
the bonds.

302
绍兴市统计年鉴2020
主要统计指标解释
财政收入 包括:(1) 各项税收 包括增值税、营业税、消费税、土地增值税、城市维护建设税、资源税、城镇土
地使用税、印花税、固定资产投资方向调节税、个人企业所得税、企业所得税退税、农牧税和耕地占用税等。
(2) 专项收入 包括征收排污费、征收城市水资源费收入、教育费附加收入等。
(3) 其他收入 包括基本建设贷款归还收入、国家能源交通重点建设基金收入、国家预算调节基金等。
(4) 国有企业计划亏损补贴 这项为负收入,冲减财政收入。
财政支出 指国家财政将筹集起来的资金进行分配使用,以满足经济建设和各项事业的需要,主要包括:
(1) 一般公共服务
(2) 公共安全
(3) 教育
(4) 科学技术
(5) 文化体育传媒
(6) 社会保障和就业
(7) 医疗卫生和计划生育
(8) 节能环保
(9) 城乡社区事务
(10) 农林水
(11) 交通运输
(12) 商业服务业
存 款 指企业、机关、团体或居民根据可以收回的原则,把货币资金存入银行或其他信用机构保管并取得一
定利息的一种信用活动形式。根据存款对象的不同可划分为企业存款、财政存款、机关团体存款、基本建设存款、
城镇储蓄存款、农村存款等项目。它是银行信贷资金的主要来源。
贷 款 指银行或其他信用机构根据必须归还的原则,按一定利率,为企业、个人等提供资金的一种信用活动
形式。我国银行贷款,分流动资金贷款、固定资产贷款、城乡个体工商户贷款以及农户贷款等科目。
承保额 ( 保险金额 ) 指保险人对被保险人负担损失补偿或约定给付的金额。它是保险合同上的最高责
任额,也是计算保费的依据。
保费 ( 保险费 ) 指保险人根据保险合同的有关规定,为被保险人取得因约定危险事故发生所造成的经济
损失补偿 ( 或给付 ) 权利,付给保险人的代价。包括财产险和人身险储金收入。
保险赔款 指保险事故发生后,经查证确属保险责任范围以内的保险标的损失,保险人根据保险合同的规
定履行赔偿义务,给予被保险人的款项叫做赔款,赔款可分为已决赔款和未决赔款两种。

303
财政、金融、保险
Explanatory Notes on Main Statistical Indicators
Financial Revenue It includes the following main items:
(1) Various tax revenues, including value added tax, business tax, consumption tax, land value added
tax, tax on city maintenance and construction, resources tax,tax on use of urban land, stamp tax , tax on
adjustment of the orientation of investment in fixed assets, personal income tax, enterprise income tax, tax on
agriculture and animal husbandry and tax on occupancy of cultivated land, etc.
(2) Special revenues, including revenue collected from imposing fee on sewage treatment, revenue
collected from imposing fee on urban water resources, and extra-charges for education, etc.
(3) Other revenues, including revenue from the repayment of capital construction loan, the funds for
the state key construction projects in energy industry and transportation, and the funds for state budget
adjustment, etc.
(4) Planned subsidies for the losses of the state-owned enterprises,. This isi an item of negative revenue,
used to eat up part of the government revenue.
Financial Expenditure refers to the distribution and use of the funds the government finance has
risen, so as to meet the needs of economic construction and various causes. It includes the following main
items:
(1) Public Service
(2) Public Safe
(3) Education
(4) Science and Technology
(5) Culture , Physical Culture and the Media
(6) Social Security and Employment
(7) Medical and Health Service
(8) Environment Protect
(9) Urban and Rural Community Affairs
(10) Agriculture , Forestry and Land Reclamation , and Water Conservancy Affairs
(11) Transportation
(12) Industrial and Business Affairs
Deposit is a form of credit by which enterprises, institutions, organizations or households can put
money into banks and other credit institutions for safekeeping and interest earning under the principle of free
withdrawal. According to different depositors, deposits are divided into enterprise deposits, treasury deposits,
deposits of government agencies and organizations, capital construction deposits, urban savings deposits,
rural deposits and other deposits. Deposits are Main sources of the credit funds of banks.
Loan is a form of credit by which banks and other credit institutions provide funds at certain interest
rate to enterprises and individuals in the light of the principle of unconditional repayment. Loans from

304
绍兴市统计年鉴2020
Chinese banks include circulating capital loans, fixed assets loans, loans to urban and rural individuals
engaged in industrial and commercial business and agricultural loans.
Amount Insured refers to the maximum that the insurant will get for the claim of the case insured.
Premium is the fee paid by the insurant to the insurer to obtain the obligation of compensation from
the insurance within the agreed terms.
Settled Claim is the compensation paid by the insurer to the insurant in accordance with the
insurance contract.

物价、人民生活9CHAPTER 9 PRICES AND PEOPLE'S LIVELIHOOD

306
绍兴市统计年鉴2020
物 价 指 数Price Indices of Urban District
90
95
100
105
110
115
120
125
130
1986
1990
1995
2000
2002
2004
2006
2008
2010
2012
2014
2016
2018
2019
市区居民消费价格指数 市区商品零售价格指数
Residential Consumer Price Indices Retail Price Indices of Commodities
居 民 收 入Income of Households
0
10000
20000
30000
40000
50000
60000
70000
1986
1988
1990
1992
1994
1996
1998
2000
2002
2004
2006
2008
2010
2012
2014
2016
2018
2019
城镇居民人均可支配收入 农村居民人均可支配收入
Per Capita Disposable Income of Urban Residents Per Capita Disposable Income of Rural Residents
1182714732
1686219692
2150724630
269152995630636
3250235125
5872861394
67489
75375
80842
0
10000
20000
30000
40000
50000
60000
70000
80000
90000
2000 2001 2002 2003 2004 2005 2006 2007 2008 2009 2010 2015 2016 2017 2018 2019
非私营单位在岗职工年平均工资Average Annual Wage of Staff and Workers at work in Non
Private-Owned Units
单位:元 (yuan)

307
物价、人民生活
9-1 历年市区物价指数Price Indices of Urban District over the Years
年 份Year
居民消费价格指数
Consumer Price Index
商品零售价格指数
Retail PriceIndex
农产品成交价格指数
Transaction Price Indices of Farm
Products
食 品Food Price
Index
服务项目Service Price
Index
1990 102.3 101.6 109.7 101.8
1991 104.4 106.8 107.6 104.1
1992 110.6 114.4 113.5 110.3
1993 121.1 122.5 145.1 118.5
1994 120.5 129.7 125.9 119.4 122.4
1995 113.5 118.8 126.3 112.9 113.3
1996 108.8 107.7 114.5 106.2 103.9
1997 103.0 97.8 129.6 100.0 94.6
1998 100.9 100.8 105.6 99.1 96.2
1999 99.4 96.0 113.9 97.0 93.0
2000 102.9 97.7 126.8 98.7 93.7
2001 99.4 96.8 106.1 98.9 94.8
2002 100.1 103.0 99.6 99.4 102.9
2003 100.0 100.0 106.5 98.3 -
2004 103.6 110.6 103.4 101.9 -
2005 102.4 103.8 103.9 101.4 -
2006 101.4 102.3 102.0 100.9 -
2007 102.7 107.5 101.4 102.1 -
2008 105.0 114.7 98 106.9 -
2009 99.2 101.7 96.6 99.7 -
2010 104.0 106.2 103.7 103.9 -
2011 105.4 111.6 102.7 105.0 -
2012 102.0 103.3 102.7 101.4 -
2013 102.0 103.8 102.3 101.0 -
2014 102.1 104.3 101.7 101.6 -
2015 101.2 103.0 101.7 99.8 -
2016 101.9 104.4 102.3 101.3 -
2017 101.8 97.5 101.8 101.8 -
2018 102.4 102.9 102.8 101.8 -
2019 102.7 108.2 101.5 103.1 -
( 上年 =100) (preceding year=100)
注:1993 年以前居民消费品价格指数栏为生活费用价格指数。Note: The consumer price index of year 1993 and earlier refers to the cost of living index.

308
绍兴市统计年鉴2020
9-2 市区居民消费价格指数(2019年)
指 标 Item市 区
Urban District
居民消费价格总指数 Consumer Price Index 102.7
一、食品烟酒 Food, Tobacco and Liquor 106.3
1. 食品 Food 108.2
(1) 粮食 Grain 100.4
(2) 薯类 Ipomoea batatas 107.2
(3) 豆类 Bean 102.6
(4) 食用油 Oil 102.2
(5) 菜 Vegetables 104.2
鲜菜 Fresh Vegetables 104.6
干菜及菜制品 Dried Vegetables and Theirs Products 99.6
(6) 畜肉类 Meal 130.4
(7) 禽肉类 Fowl 106.0
(8) 水产品 Aquatic Products 97.2
(9) 蛋类 Eggs 103.1
(10) 奶类 Milk 101.8
(11) 干鲜瓜果类 Dried and Fresh Melons and Fruits 113.3
鲜瓜果 Fresh Fruits 116.9
(12) 糖果糕点类 Candy and Beverages 101.8
(13) 调味品 Condiment 101.0
(14) 其他食品类 Other Foods and Manufacturing Services 100.7
2. 茶及饮料 Tea and Beverage 101.9
3. 烟酒 Tobacco and Liquor 101.1
4. 在外餐饮 Outward Dinner 104.0
二、衣着 Clothing 100.0
1. 服装 Garments 100.5
(1) 男式服装 Men's Garments 98.0
(2) 女式服装 Women's Gaements 103.0
(3) 儿童服装 Children's Garments 97.4
2. 服装材料 Materials for Clothing 101.1
3. 其他衣着及配件 Footgear and Hats 98.6
(1) 袜子 Stockings 100.9
(2) 帽子 Hats 100.0
(3) 其他衣着及配件 Dress Accessory 98.6
( 上年 =100)

309
物价、人民生活
Consumer Price Indices by Urban District (2019)
指 标 Item市 区
Urban District
4. 衣着加工服务费 Dress ervice charge 103.9
5. 鞋类 Footwear 98.0
(1) 鞋 Shoes 98.0
(2) 鞋类加工服务 Shoes Ervice Charge 100.0
三、居住 Residence 99.9
1. 租赁房房租 Rent 99.4
2. 住房保养维修及管理 Building Maintain Service 103.8
3. 水电燃料 Water, Electricity and Fuels 99.8
4. 自有住房 Private Housing 99.1
四、生活用品及服务 Articles for Daily Use and Services 100.8
1. 家具及室内装饰品 Furniture and Upholstery 98.3
(1) 家具 Furniture 98.1
(2) 室内装饰品 Upholstery 100.3
2. 家用器具 Home Appliances 98.3
3. 家用纺织品 Home Textiles 105.8
4. 家庭日用杂品 Daily Use Household Articles 100.0
5. 个人护理用品 Personal Care Supplies 103.3
6. 家庭服务 Domestic Services 103.7
五、交通和通讯 Transportation and Communication 99.2
1. 交通 Transportations 98.4
2. 通信 Communications 100.9
六、教育文化和娱乐 Education and Recreation 103.5
1. 教育 Education 104.8
(1) 教育用品 Education Products 103.9
(2) 教育服务 Tuition and Children Care 104.9
2. 文化娱乐 Cultural and Recreational Articles 101.6
(1) 文娱耐用消费品 Durable Consumer Goods 98.6
(2) 其他文娱用品 Cultural Articles 102.1
(3) 文化娱乐服务 Entertainment 103.1
(4) 旅游 Touring and Outgoing 102.0
七、医疗保健 Health Cares 107.2
1. 药品及医疗器具 Medical Appliances and Articles 113.6
2. 医疗服务 Medical Services 102.3
八、其他用品和服务 Other Appliances and Services 102.0
1. 其他用品类 Other Appliances 104.3
2. 其他服务类 Other Services 100.6
(preceding year=100)

310
绍兴市统计年鉴2020
9-3 省内各市居民消费价格指数(2019年)
指 标 Item全 省
Whole Province杭州市区
Hangzhou宁波市区Ningbo
居民消费价格指数 Consumer Price Index 102.9 103.1 103.0
一、食品烟酒 Food,Tobacco and Liquor 106.2 106.3 105.2
二、衣着 Clothing 101.8 101.3 102.8
三、居住 Residence 100.6 100.9 101.1
四、生活用品及服务 Articles for Daily Use and Services 101.8 103.0 103.0
五、交通和通讯 Transportation and Communication 99.0 99.0 98.8
六、教育文化和娱乐 Education and Recreation 103.7 104.3 104.5
七、医疗保健 Health Cares 104.8 107.0 104.3
八、其他用品和服务 Other Appliances and Services 103.2 102.8 105.0
( 上年 =100)

311
物价、人民生活
Residential Consumer Price Indices of Zhejiang by City (2019)
温州市区Wenzhou
嘉兴市区Jiaxin
湖州市区Huzhou
绍兴市区Shaoxing
金华市区Jinhua
衢州市区Quzhou
舟山市区Zhoushan
台州市区Taizhou
丽水市区Lishui
102.2 102.9 103.0 102.7 103.1 103.0 102.3 102.3 103.3
105.3 106.7 105.7 106.3 106.5 107.4 104.4 105.8 107.3
101.6 101.2 102.2 100.0 100.5 100.6 100.5 101.1 99.6
99.3 100.6 100.9 99.9 101.7 103.1 99.9 100.4 102.7
100.4 101.1 102.1 100.8 102.1 100.7 104.4 102.1 98.2
99.5 98.3 99.9 99.2 98.1 97.7 100.7 98.8 97.0
103.2 104.4 104.1 103.5 103.7 101.7 103.0 101.4 105.1
105.5 103.0 104.9 107.2 105.6 101.3 102.8 103.8 104.6
102.0 103.4 102.3 102.0 103.1 102.6 103.7 102.6 103.6
(preceding year=100)

312
绍兴市统计年鉴2020
9-4 省内各市商品零售价格指数(2019年)
指 标 Item全 省
Whole Province杭州市区
Hangzhou宁波市区Ningbo
商品零售价格总指数 Retail Price Index 102.5 103.1 102.3
一、食品类 Food 106.8 106.8 105.8
二、饮料、烟酒 Beverages, Tobacco and Liquor 101.3 101.8 101.7
三、服装、鞋帽类 Garments, Shoes and Hats 101.5 101.2 102.9
四、纺织品类 Textiles 103.7 101.6 108.8
五、家用电器及音像器材
Househo ld App l i ances and Acoustics Appliances 99.0 98.6 97.7
六、文化办公用品 Cultural and Sports Goods 100.3 100.9 98.6
七、日用品 Articles for daily Use 102.4 104.6 103.5
八、体育娱乐用品 Sports and Recreational Goods 101.3 102.7 102.3
九、交通、通信用品 Transportation and Communication 99.7 100.1 99.8
十、家具 Furniture 102.2 103.2 104.4
十一、化妆品类 Cosmetics 102.8 106.7 102.9
十二、金银珠宝类 Jewelry 108.3 107.3 108.8
十三、中西药品及医疗保健用品类
Traditional Chinese and Western Medicines, Medical Articles 107.6 111.2 107.3
十四、书报杂志及电子出版物类
Newspapers, Magazines and Electronic Publication 104.5 104.7 104.5
十五、燃 料 类 Fuels 96.4 97.0 94.7
十六、建筑材料及五金电料类 Building Materials and Metals 101.1 100.7 100.8
( 上年 =100)

313
物价、人民生活
Retail Price Indices of Commodities of Zhejiang by City (2019)
温州市区Wenzhou
嘉兴市区Jiaxin
湖州市区Huzhou
绍兴市区Shaoxing
金华市区Jinhua
衢州市区Quzhou
舟山市区Zhoushan
台州市区Taizhou
丽水市区Lishui
101.9 102.2 102.9 103.1 102.4 101.7 102.1 101.7 101.9
106.3 107.1 106.4 106.9 106.8 107.7 105.2 107.0 108.2
101.1 100.8 100.0 101.4 99.9 101.6 100.6 100.8 101.9
101.5 101.1 102.0 99.9 100.2 100.6 100.5 101.1 99.4
100.8 107.2 110.8 105.5 102.0 100.3 106.6 97.7 99.0
97.8 100.6 100.2 98.5 100.4 98.6 100.0 100.9 96.2
99.3 102.3 98.8 98.1 103.9 102.4 101.8 103.3 99.5
100.6 101.9 103.1 100.1 100.9 100.9 101.1 101.6 100.3
100.3 102.8 100.8 99.8 102.7 100.5 101.1 99.7 100.1
99.8 98.4 101.4 101.1 99.3 97.8 101.9 97.8 96.0
101.8 101.9 100.8 98.1 101.3 100.0 106.0 102.5 97.2
99.3 96.1 101.8 103.4 102.9 100.8 105.4 102.5 97.6
108.7 108.5 108.7 107.9 108.2 108.0 108.1 108.1 108.0
107.0 103.2 107.1 115.3 107.6 102.7 105.8 101.5 109.2
104.1 102.9 103.9 105.3 104.9 104.4 104.0 104.7 105.0
95.8 97.8 96.7 96.1 96.2 96.0 93.3 96.8 98.0
100.2 100.6 102.9 100.4 101.1 100.2 101.3 100.9 101.4
(preceding year=100)

314
绍兴市统计年鉴2020
9-5 全市工业品价格指数(2019年)Ex-Factory Price Indices of Industrial Products (2019)
指 标 Item指 数Index
全部工业品 Total 98.1
按轻重工业分 Grouped by Light and Heavy Industry
轻工业 Light Industry 97.7
重工业 Heavy Industry 98.6
按工业行业大、中类分 Grouped by Sector
黑色金属矿采选业 Ferrous Metals Mining and Dressing 126.3
有色金属矿采选业 Nonferrous Metals Mining and Dressing 80.5
非金属矿采选业 Nonmetal Minerals Mining and Dressing 100.0
农副食品加工业 Manufacturina of agricultural and non-staple food stuff 99.9
食品制造业 Food Production 102.9
酒、饮料和精制茶制造业 Manufacturing Industry of beverage, drinking and refiined tea 99.6
纺织业 Textile Industry 98.6
纺织服装、服饰业 Manufacturing Industry of Textile Costumes, Shoes, and Caps 100.9 皮革、毛皮、羽毛及其制品和制鞋业
Leather, Furs, Feather and Related Products & Shoe-making Industry 101.8
木材加工及木、竹、藤、棕、草制品业
Timber processing, Bamboo, Cane, Palm Fiber and Straw Products 103.9
家具制造业 Furniture Manufacturing 102.4
造纸及纸制品业 Papermaking and Paper Products 94.6
印刷和记录媒介复制业 Printing Industry and Reproduction of Record Media 100.4 文教、工美、体育和娱乐用品制造业 Manufacturing Industry of Culture, Education and Sports stuff 110.5
石油、煤炭及其他燃料加工业 Oil, Coal and Other Fuel Processing Industries 101.0
化学原料和化学制品制造业 Raw Chemical Materials and Chemical Products 97.0
医药制造业 Medical and Pharmaceutical Products 97.8
化学纤维制造业 Chemical Fibers 89.2
橡胶和塑料制品业 Rubber and Plastic Products 99.7
非金属矿物制品业 Nonmetal mineral Products 103.9
黑色金属冶炼及压延加工业 Smelting and pressing of Ferrous Metals 92.7
有色金属冶炼及压延加工业 Smelting and pressing of Nonferrous Metals 96.4
金属制品业 Metal Products 101.1
通用设备制造业 Ordinary Machinery Manufacturing 100.1
专用设备制造业 Special Purpose Equipment Manufacturing 99.2
汽车制造业 Automobile Manufacturing Industry 99.1 铁路、船舶、航空航天和其他运输设备制造业
Manufacturing Industry of railway, shipping, spackflight and other transiport equipments 100.3
电气机械及器材制造业 Electric Equipment and Machinery 99.5 计算机、通信和其他电子设备制造业
Manufacturing Industry of Computers, Communication and Other Electronic Equipment 100.6
仪器仪表制造业 Manufacturing Industry of Instruments and Meters 97.3
其他制造业 Other Manufacturing 97.1
废弃资源综合利用业 Utilization of Waste Resources 98.2
电力、热力生产和供应业 Electricity, Steam and Hot Water Production and Supply 100.7
燃气生产和供应业 Gas Production and Supply 100.7
水的生产和供应业 Tap Water Production and Supply 100.0
( 上年 =100) (preceding year=100)

315
物价、人民生活
9-6 历年全体居民家庭收支情况Basic Statistics on Residential Households in the city over the Years
年 份Year
全 市Whole
Municipality
越城区Yuecheng
District
柯桥区Keqiao District
上虞区Shangyu District
诸暨市ZhujiCity
嵊州市Shengzhou
City
新昌县Xinchang County
人均可支配收入 ( 元 ) Per Capita Disposable Income (yuan)
2013 32191 32908 37280 30639 33140 28539 28213
2014 35335 35931 40850 33602 36434 31492 31092
2015 38389 38870 44358 36580 39668 34284 33890
2016 41506 41816 47763 39476 43005 37139 36827
2017 45306 45069 51672 43173 46994 40747 40309
2018 49389 48990 56220 47188 51130 44495 43937
2019 53839 53154 61111 51529 55793 48544 47704
人均生活消费支出 ( 元 ) Per Capita Consuming Expenditure (yuan)
2013 20040 20540 21065 18729 19215 15310 16561
2014 22002 22524 23050 20581 21257 16950 18565
2015 23785 23964 25144 22005 22970 18017 20708
2016 24541 24510 25789 22664 24040 18625 21448
2017 26459 26160 27611 24680 25783 20065 22615
2018 28691 28244 29969 26976 27963 21799 24631
2019 31109 30676 32342 29320 30252 23563 26784
恩格尔系数 (%) Engle Coefficient (%)
2013 29.4 28.1 28.0 32.70 31.4 31.0 28.2
2014 29.7 28.0 28.3 32.76 30.6 31.8 28.1
2015 28.6 27.9 28.2 32.18 31.0 30.5 28.4
2016 28.4 28.0 28.2 32.11 30.2 30.0 28.8
2017 28.1 27.8 28.1 32.05 29.0 29.7 28.9
2018 27.9 27.7 28.0 31.12 28.8 29.4 28.9
2019 27.9 27.6 27.9 31.0 28.8 29.1 28.7
注:从 2013 年起,国家统计局开展了城乡一体化住户收支与生活状况调查,与 2013 年前的分城镇和农村住户调查的调查范围、调查方法、指标口径有所不同 , 下同。
Note: National Bureau of Statistics of China started an integrated households income and expenditure survey, including both urban and rural households since 2013. The coverage, the methodology and definitions used in the survey has been changed compared with before, the same below.

316
绍兴市统计年鉴2020
9-7 分区、县(市)全体居民家庭收支基本情况(2019年)
指 标 Item全 市Whole
Municipality
人均可支配收入 Per Capita Annual Disposable Income 53839
1. 工资性收入 Wages Income 30172
2. 家庭经营净收入 Income from Households Business Operation 11750
3. 财产性净收入 Property Income 5189
4. 转移性净收入 Transfer Income 6728
人均生活消费支出 Per Capita Consuming Expenditure 31109
1. 食品烟酒 Food, Tobacco and Liquor 8668
2. 衣着 Clothing 2101
3. 居住 Residence 7907
4. 生活用品及服务 Articles for Daily Use and Services 1413
5. 交通和通讯 Transportation and Communication 4802
6. 教育文化和娱乐 Education and Recreation 3386
7. 医疗保健 Health Cares 2081
8. 其他用品和服务 Other Appliances and Services 753
家庭居住情况 Living Conditions
1. 家庭人口 ( 人 / 户 ) Household Size (person/household) 2.9
2. 现住房总建筑面积 ( 平方米 / 人 ) Total Floorage of Buildings (sq.m/person) 58.3
单位:元
注:2013 年起为城乡一体化住户调查新口径数据,城镇和农村居民收入统一为可支配收入,下表同。

317
物价、人民生活
Basic Income and Expenditure of Residential Households in Each County (City) (2019)
越城区Yuecheng
District
柯桥区KeqiaoDistrict
上虞区ShangyuDistrict
诸暨市ZhujiCity
嵊州市Shengzhou
City
新昌县XinchangCounty
53154 61111 51529 55793 48544 47704
30911 32897 34852 27278 21778 28773
9522 17637 8593 17584 13487 9187
5633 5483 2853 4301 5839 4146
7088 5094 5231 6631 7440 5597
30676 32342 29320 30252 23563 26784
8466 9032 9079 8712 6849 7677
2221 2388 3278 1689 1540 1757
7780 7813 5239 7423 5481 5849
1335 1466 1545 1384 1270 1365
4688 4857 4289 5194 4261 4487
3532 3558 3609 3135 2318 2886
1914 2073 1629 2113 1522 2055
741 1155 651 601 322 706
2.6 3.4 3.1 3.1 2.44 2.8
44.2 56.9 58.3 64.5 63.1 62.1
( yuan )
Note: Since 2013, According to the caliber of survey of the integration of urban and rural residents, the incomes of urban and rural residents were unified as disposable income,the same applies to the tables following.

318
绍兴市统计年鉴2020
9-8 历年城镇常住居民家庭收支情况Basic Statistics on Urban Households over the Years
年 份Year
全 市Whole
Municipality
越城区Yuecheng
District
柯桥区Keqiao District
上虞区Shangyu District
诸暨市ZhujiCity
嵊州市Shengzhou
City
新昌县Xinchang County
人均可支配收入 ( 元 ) Per Capita Disposable Income (yuan)
1999 8580 8518 8615 8949 8352 8342
2000 9422 9401 9438 9447 9334 9545
2005 17516 17319 18128 17008 17788 17150 17153
2006 19486 19178 20460 19132 20056 19207 19132
2007 21971 21717 23241 21605 22759 21743 21142
2008 24646 23509 26155 24360 25678 24400 23007
2009 26874 25418 28496 26513 27896 26597 24987
2010 30164 27626 32223 29931 31413 29796 27396
2011 33273 31368 36547 34011 35697 33553 30808
2012 36911 34563 40805 37981 39950 37098 34410
2013 39567 37602 42918 39943 41940 37485 37160
2014 43167 40927 46809 43569 45790 41058 40556
2015 46747 44202 50741 43569 49545 44506 43881
2016 50305 47292 54410 50910 53547 48062 47045
2017 54445 50880 58762 55270 57844 52039 51223
2018 59049 55164 63768 60042 62623 56360 55725
2019 63935 59446 68948 65234 67862 61271 60167
人均生活消费支出 ( 元 ) Per Capita Consuming Expenditure (yuan)
1999 6971 6850 7719 7009 6723 6228
2000 7514 7430 8296 6761 7665 7567
2005 12027 11270 11740 11925 15189 11096 11979
2006 13069 12301 12811 13183 15826 12584 13379
2007 13907 13077 15407 14201 15427 12807 13764
2008 15534 14837 16824 15326 16259 13340 15029
2009 16607 16220 16926 16530 17334 14341 14289
2010 18267 17400 18869 18397 20498 16301 16141

319
物价、人民生活
9-8 续表Continued
年 份Year
全 市Whole
Municipality
越城区Yuecheng
District
柯桥区Keqiao District
上虞区Shangyu District
诸暨市ZhujiCity
嵊州市Shengzhou
City
新昌县Xinchang County
人均生活消费支出 ( 元 ) Per Capita Consuming Expenditure (yuan)
2011 20353 19881 21140 21310 22430 18002 19321
2012 22204 22635 23014 24106 23735 16552 20036
2013 24221 23171 23880 23536 22875 18541 21020
2014 26231 25279 25885 25590 24935 20878 23407
2015 28156 26828 28188 27321 26823 21672 25592
2016 28858 27284 28794 28004 27896 22307 26078
2017 30879 29068 30775 29990 29653 24005 27486
2018 33319 31280 33328 32629 31966 25892 29933
2019 35925 33769 35789 35307 34416 27900 32326
恩格尔系数 (% ) Engle Coefficient (% )
1999 36.7 39.9 34.1 33.0 36.8 37.4
2000 37.0 40.8 31.7 38.0 34.7 34.6
2005 34.0 36.9 35.7 32.8 27.9 34.8 30.0
2006 33.6 35.1 35.7 32.2 31.0 33.0 29.6
2007 35.3 37.3 34.0 34.9 34.3 37.6 30.9
2008 35.4 39.3 35.7 35.4 33.0 38.0 33.0
2009 37.2 37.5 38.2 34.2 37.4 35.3 34.3
2010 34.6 37.5 35.8 33 33.1 32.3 28.4
2011 35.0 38.1 35.6 33.1 30.0 33.2 33.2
2012 35.2 36.1 37.8 31.8 32.1 39.0 34.3
2013 27.6 26.9 27.2 32.1 32.6 31.6 26.0
2014 27.9 27.3 27.6 32.3 31.8 30.5 26.1
2015 27.7 27.2 27.5 31.7 32.2 29.5 26.5
2016 27.6 27.2 27.5 31.7 31.5 28.8 27.1
2017 27.4 27.2 27.5 31.7 30.4 28.5 27.2
2018 27.1 27.0 27.4 30.5 30.0 28.3 27.1
2019 27.1 26.9 27.3 30.4 29.9 28.1 27.0

320
绍兴市统计年鉴2020
9-9 分区、县(市)城镇常住居民家庭收支基本情况(2019年)
指 标 Item全 市Whole
Municipality
人均可支配收入 Per Capita Disposable Income 63935
1. 工资性收入 Wages Income 35449
2. 家庭经营净收入 Income from Households Business Operation 12467
3. 财产性净收入 Property Income 7552
4. 转移性净收入 Transfer Income 8466
人均生活消费支出 Per Capita Consuming Expenditure 35925
1. 食品烟酒 Food, Tobacco and Liquor 9726
2. 衣着 Clothing 2536
3. 居住 Residence 9445
4. 生活用品及服务 Articles for Daily Use and Services 1585
5. 交通和通讯 Transportation and Communication 5380
6. 教育文化和娱乐 Education and Recreation 4042
7. 医疗保健 Health Cares 2296
8. 其他用品和服务 Other Appliances and Services 915
家庭居住情况 Living Conditions
1. 家庭人口 ( 人 / 户 ) Household Size (person/household) 2.92
2. 现住房总建筑面积 ( 平方米 / 人 ) Total Floorage of Buildings (sq.m/person) 52.7
单位:元

321
物价、人民生活
Basic Income and Expenditure of Urban Households in Each District and County (City) (2019)
越城区Yuecheng
District
柯桥区KeqiaoDistrict
上虞区ShangyuDistrict
诸暨市ZhujiCity
嵊州市Shengzhou
City
新昌县XinchangCounty
59446 68948 65234 67862 61271 60167
34332 36542 43743 33053 31281 37067
9501 19088 9483 20112 13399 9536
7356 7210 4725 6779 6899 6376
8257 6108 7283 7918 9692 7188
33769 35789 35307 34416 27900 32326
9081 9782 10716 10307 7829 8741
2523 2758 4101 2143 2076 2275
8893 8798 6567 8100 6754 6940
1425 1552 1668 1376 1499 1621
4964 5323 5252 5776 5042 6032
4008 4021 4437 3527 2779 3644
2025 2160 1755 2364 1423 2215
850 1395 811 822 498 858
2.36 3.2 3.00 3.10 2.61 3.06
40.7 56.1 53.9 60.1 58.3 56.0
( yuan )

322
绍兴市统计年鉴2020
9-10 分区、县(市)每百户城镇居民家庭主要消费品拥有量(2019年末)
指 标 Item全 市Whole
Municipality
1. 摩托车 ( 辆 ) Motorcycle (unit) 10
2. 助力车 ( 辆 ) Electric Bicycles (unit) 86
3. 家用汽车 ( 辆 ) Automobile (unit) 68
4. 洗衣机 ( 台 ) Washing Machine (unit) 102
5. 电冰箱 ( 台 ) Refrigerator (unit) 108
6. 彩色电视机 ( 台 ) Color Television Set (unit) 199
7. 家用电脑 ( 台 ) Computer (unit) 90
8. 照相机 ( 台 ) Camera (unit) 23
9. 中高档乐器 ( 件 ) Medium and High Grade Musical Instrument (unit) 12
10. 微波炉 ( 台 ) Oven (unit) 51
11. 空调器 ( 台 ) Air Conditioner (unit) 235
12. 淋浴热水器 ( 台 ) Shower (unit) 105
13. 洗碗机 ( 台 ) Dishwasher (unit) 4
14. 健身器材 ( 台 ) Healthy Equipment (unit) 12
15. 普通电话 ( 部 ) Telephone (set) 46
16. 移动电话 ( 部 ) Hand Telephone (set) 251

323
物价、人民生活
Possession of Main Consumer Goods Per 100 Households InEach District and County (City) (End of 2019)
越城区Yuecheng
District
柯桥区KeqiaoDistrict
上虞区ShangyuDistrict
诸暨市ZhujiCity
嵊州市Shengzhou
City
新昌县XinchangCounty
1 9 9 9 16 23
98 92 89 69 92 79
62 72 66 76 65 84
99 103 105 96 101 103
105 109 108 116 109 104
184 231 243 193 207 196
85 88 101 81 91 104
36 17 33 16 18 31
8 6 14 9 10 21
60 48 49 41 59 65
199 258 263 224 226 243
97 101 111 108 112 107
4 3 3 4 7 3
9 9 10 13 14 12
30 79 46 63 43 31
248 263 266 247 247 270

324
绍兴市统计年鉴2020
9-11 历年越城区城镇常住居民家庭基本情况
指 标 Item 1999 2000 2005
户均家庭人口 Average Household Size 3.03 2.99 2.72
平均每户就业人口 Average Number of Employed Persons per Household 1.96 1.82 1.73
平均就业负担 Number of Persons Supported By Each Employee 1.54 1.64 1.57
人均可支配收入 ( 元 ) Per Capita Disposable Income (yuan) 8518 9401 17319
人均生活消费支出 ( 元 ) Per Capita Consuming Expenditure (yuan) 6850 7430 11270
1. 食品烟酒 Food, Tobacco and Liquor 2734 3033 4156
2. 衣着 Clothing 521 527 1160
3. 居住 Residence 787 613 861
4. 生活用品及服务 Articles for Daily Use and Services 997 851 678
5. 交通和通讯 Transportation and Communication 350 403 1232
6. 教育文化和娱乐 Education and Recreation 986 1347 2089
7. 医疗保健 Health Cares 313 318 703
8. 其他用品和服务 Other Appliances and Services 160 338 390

325
物价、人民生活
Basic Statistics on Urban Households in Yuecheng District
2006 2007 2008 2009 2010 2011 2012 2013 2014 2015 2016 2017 2018 2019
2.7 2.66 2.63 2.58 2.57 2.71 2.74 2.60 2.63 2.65 2.64 2.64 2.25 2.36
1.7 1.66 1.52 1.64 1.65 1.7 1.69 1.51 1.46 1.44 1.56 1.44 1.15 1.34
1.59 1.6 1.73 1.57 1.56 1.59 1.62 1.72 1.81 1.84 1.69 1.83 1.96 1.76
19178 21717 23509 25418 27626 31368 34563 37602 40927 44202 47292 50880 55164 59446
12301 13077 14837 16220 17400 19881 22635 23171 25279 26828 27284 29068 31280 33769
4323 4882 5828 6075 6532 7581 8163 6238 6900 7293 7431 7892 8453 9081
1234 1263 1423 1592 1789 2248 2132 1843 2004 2050 2035 2183 2345 2523
1029 1104 1189 1794 1486 1311 1431 6452 6918 7257 7215 7554 8181 8893
737 643 843 869 952 1138 1079 1005 1062 1133 1158 1249 1320 1425
1602 1546 1737 1878 1962 2941 4672 3167 3547 1525 3970 1757 4601 4964
2008 2332 2442 2615 2812 2851 3233 2546 2757 3827 3138 4256 3718 4008
928 939 952 852 1384 1039 1134 1251 1416 3027 1638 3421 1868 2025
439 370 423 544 482 770 791 669 677 716 699 756 795 850

326
绍兴市统计年鉴2020
9-12 历年农村常住居民人均可支配收入Per Capita Disposable Income of Rural Households over the Years
年 份Year
全 市Whole
Municipality
越城区Yuecheng
District
柯桥区Keqiao District
上虞区Shangyu District
诸暨市ZhujiCity
嵊州市Shengzhou
City
新昌县Xinchang County
1985 569 722 611 479 469
1986 674 894 687 556 560
1987 725 983 792 641 666 545
1988 905 1183 1018 890 816 622
1989 1083 1411 1101 1059 953 715
1990 1212 1516 1338 1159 1018 731
1991 1358 1822 1389 1216 1151 878
1992 1512 1988 1484 1442 1244 1027
1993 1879 2273 1841 1897 1601 1417
1994 2485 2921 2430 2485 2255 1908
1995 3183 3750 3086 3176 2902 2437
1996 3813 4528 3622 3985 3271 2861
1997 4119 4928 3930 4363 3312 3201
1998 4408 5153 4326 4807 3801 3520
1999 4681 5332 4855 4923 4138 3912
2000 4982 5505 5282 5193 4353 4223
2001 5343 5851 5566 5603 4577 4637
2002 5690 6257 5872 5994 4951 4930
2003 6143 6887 6328 6462 5331 5287
2004 6970 8077 7120 7271 5987 5933
2005 7704 9241 7796 8065 6535 6489
2006 8619 10438 8600 9050 7308 7269
2007 9730 11871 9670 10289 8181 8092
2008 10950 13372 10859 11612 9187 9112
2009 12026 14682 11945 12762 10087 9965
2010 13651 16685 13534 14549 11405 11263
2011 15861 16917 19527 15833 17060 13345 13079
2012 17706 18846 21813 17686 19107 14909 14609
2013 21307 21742 24312 20838 23097 18769 17836
2014 23539 23989 26743 23018 25583 20749 19802
2015 25648 26076 29177 25090 27885 22616 21624
2016 27744 28078 31490 27089 30224 24521 23555
2017 30331 30492 34316 29641 33073 26944 25841
2018 33097 33156 37345 32423 36053 29459 28185
2019 36120 36032 40655 35443 39380 32131 30755
单位:元 ( yuan )
注:2013 年以前农村居民为纯收入 , 下表同。Note: Before 2013, the income of rural residents was the net income of rural residents,the same applies to the tables following.

327
物价、人民生活
9-13 历年农村常住居民人均生活消费支出Per Capita Consuming Expenditure of Rural Households over the Years
年 份Year
全 市Whole
Municipality
越城区Yuecheng
District
柯桥区Keqiao District
上虞区Shangyu District
诸暨市ZhujiCity
嵊州市Shengzhou
City
新昌县Xinchang County
1985 486 589 560 440 356
1986
1987 681 956 751 662 568 469
1988 872 1123 867 872 862 637
1989 937 1290 850 962 888 670
1990 992 1285 1155 884 966 668
1991 1060 1354 1315 919 920 791
1992 1216 1537 1378 1117 1090 926
1993 1277 1581 1091 1469 1240 980
1994 1699 2331 1660 1764 1379 1297
1995 2190 2522 2291 2565 2141 1376
1996 2605 3226 2905 2772 2155 1881
1997 2523 3103 2578 2598 2320 1974
1998 2839 3552 3073 2930 2567 2011
1999 3232 3845 3280 3464 2947 2554
2000 3650 3920 4357 4080 2921 2870
2001 3767 3987 3907 4239 3307 3079
2002 3960 4420 4272 4667 3698 2741
2003 4615 5031 4732 5208 4049 3398
2004 5266 6074 5363 5806 4283 4251
2005 5765 7627 5682 6444 4395 4003
2006 6298 7711 6307 6933 4979 5050
2007 7158 9094 7298 7841 5382 5600
2008 7877 9854 7699 8831 6477 5557
2009 8171 10319 7625 9474 7014 5030
2010 9210 11428 8430 10615 7628 6873
2011 10073 8640 12716 9943 12350 8010 7109
2012 11107 9139 14348 10717 13593 8702 7699
2013 13870 14282 14589 13665 14971 11781 11390
2014 15632 15940 16340 15262 16992 12538 12788
2015 17123 17089 17905 16292 18374 13530 14713
2016 17787 17550 18433 16879 19366 14098 15434
2017 19216 18865 19865 18739 20818 15219 16237
2018 20888 20457 21568 20483 22712 16577 17714
2019 22658 22259 23345 22293 24590 17969 19247
单位:元 ( yuan )

328
绍兴市统计年鉴2020
9-14 分区、县(市)农村住户家庭生活基本情况(2019年)
指 标 Item全 市Whole
Municipality
一、人均可支配收入 ( 元 ) Per Capita Disposable Income (yuan) 36120
1. 工资性收入 Wage Income 20911
2. 家庭经营收入 Income from Households Business Operation 10491
3. 财产性收入 Property Income 1040
4. 转移性收入 Transfer Income 3678
二、人均纯收入 ( 元 ) Per Capital Annual Net Income (yuan) 33072
三、人均生活消费支出 ( 元 ) Per Capita Consuming Expenditure (yuan) 22658
1. 食品烟酒 Food,Tobacco and Liquor 6812
2. 衣着 Clothing 1337
3. 居住 Residence 5207
4. 生活用品及服务 Articles for Daily Use and Services 1110
5. 交通和通讯 Transportation and Communication 3788
6. 教育文化和娱乐 Education and Recreation 2234
7. 医疗保健 Health Cares 1702
8. 其他用品和服务 Other Appliances and Services 468
四、家庭居住情况 Living Conditions
1. 家庭人口 ( 人 / 户 ) Household Size (person/household) 2.9
2.现住房总建筑面积 (平方米/人) Total Floorage of Buildings (sq.m/person) 68.2

329
物价、人民生活
Living Conditions of Rural Households in Each District and County (City) (2019)
越城区Yuecheng
District
柯桥区KeqiaoDistrict
上虞区ShangyuDistrict
诸暨市ZhujiCity
嵊州市Shengzhou
City
新昌县XinchangCounty
36032 40655 35443 39380 32131 30755
21599 23382 24417 19424 12694 17494
9582 13850 7548 14145 13916 8713
945 977 656 930 680 1115
3906 2446 2822 4881 4841 3434
34620 40425 35134 35798 28090 27802
22259 23345 22293 24590 17969 19247
6793 7074 7158 6543 5730 6230
1399 1424 2312 1072 934 1052
4749 5241 3681 6501 3722 4367
1087 1243 1400 1395 899 1018
3936 3639 3159 4403 3170 2387
2238 2348 2637 2602 1772 1855
1611 1846 1482 1772 1599 1838
446 530 464 302 143 500
3.3 3.7 3.1 3.0 2.3 2.8
53.8 58.9 63.5 69.6 68.1 70.0

330
绍兴市统计年鉴2020
9-15 每百户农村居民家庭耐用消费品拥有情况(2019年)Durable Consumer Goods Owned Per 100 Rural Households (2019)
项 目 Item全 市Whole
Municipality
越城区Yuecheng
District
柯桥区Keqiao District
上虞区Shangyu District
诸暨市Zhuji City
嵊州市Shengzhou
City
新昌县Xinchang County
1. 洗衣机 ( 台 ) Washing Machine (unit) 95 98 112 104 93 91 85
2. 电冰箱 ( 台 ) Refrigeration (unit) 113 107 128 114 119 105 107
3. 空调机 ( 台 ) Air Conditioner (unit) 194 216 211 249 204 142 141
4. 抽油烟机 ( 台 ) Exhaust Fan (unit) 80 100 93 96 84 78 65
5. 微波炉 ( 台 ) Oven (unit) 33 39 44 51 26 37 29
6. 热水器 ( 台 ) Shower (unit) 97 99 100 106 105 96 91
7. 摩托车 ( 辆 ) Motorcycle (unit) 19 9 29 11 17 31 35
8 生活用汽车 (辆) Automobile (unit) 44 42 68 53 59 38 39
9. 电话机 ( 部 ) Telephone (set) 39 24 69 50 70 41 18
10. 移动电话 ( 部 ) Hand Telephone (set) 256 285 287 263 260 243 242
11. 彩色电视机 ( 台 ) Color TV Set (unit) 205 215 233 240 217 194 183
12. 照相机 ( 台 ) Camera (set) 10 19 24 15 5 3 3
13. 家用计算机 ( 台 ) Computer (unit) 55 76 90 86 56 48 23
14. 中高档乐器 ( 件 ) Medium and High Grade Musical Instrument (unit) 5 11 5 3 4 3 3

331
物价、人民生活
主要统计指标解释
居民消费价格指数 居民消费价格,指城乡居民支付生活消费品和服务项目消费的价格,是社会产品和服务
项目的最终价格,同人民生活密切相关,在整个国民经济价格体系中具有极为重要的地位。居民消费价格指数,
就是指反映一定时期内居民消费价格变动趋势和变动程度的相对数。
商品零售价格指数 商品零售价格,指工业、商业、餐饮业和其他零售企业向城乡居民、机关团体出售生活消
费品和办公用品的价格。商品零售价格指数,就是指反映一定时期内商品零售价格变动趋势和变动程度的相对
数。
居民家庭人口 指居住在一起、经济上合在一起共同生活的家庭成员,即在同一家庭内共同生活、共同消费
的成员。
居民家庭就业人口 指居民从事社会劳动并取得劳动报酬或经营收入的人口。就业人口包括通过国家统
筹规划和指导由劳动部门介绍就业,自愿组织起来就业和自谋职业等方式,在国有单位、集体单位、中外合资、中
外合作、外资在华独资的企业事业单位和私营企业单位工作或从事个体劳动的有固定性职业或临时性职业的人
口。被聘用或留用的离休人员也记入就业人口。它是反映居民的就业情况,计算就业面、负担系数的资料之一。
生活消费支出 指调查户用于日常生活的全部支出,包括食品、衣着、家庭设备用品及服务、医疗保险、交通
和通讯、娱乐教育文化服务、居住、杂项商品和服务等 8 大类支出,均按用途划分归类。
建筑面积 指住宅用于生活居住的建筑面积。以房产证为准。
农村居民家庭纯收入 指农村常住居民家庭总收入中,扣除从事生产和非生产经营费用支出、缴纳税款和
上交承包集体任务金额以后剩余的,可直接用于进行生产性、非生产性建设投资、生活消费和积蓄的那一部分
收入。它是反映农民家庭实际收入水平的综合性主要指标。农民家庭纯收入,既包括从事生产性和非生产性
的经营收入,又包括取自在外人口寄回带回和国家财政救济、各种补贴等非经营性收入,还包括自产自用的实物
收入。但不包括向银行、信用社和向亲友借款等属于借贷性的收入。
可支配收入 指调查户在调查期内获得的、可用于最终消费支出和储蓄的总和,即调查户可以用来自由支配
的收入。可支配收入包括现金,也包括实物收入。按收入来源,可自配收入包含四项,分别为:工资性收入、经营
净收入、财产净收入和转移净收入。
工资性收入 指就业人员通过各种途径得到的全部劳动报酬和各种福利,包括受雇于单位或个人、从事各
种自由职业、兼职和零星劳动得到的全部劳动报酬和福利。
经营净收入 指住户或住户成员从事生产经营活动所获得的净收入,是全部经营收入中扣除经营费用、生
产性固定资产折旧和生产税净额(生产税减去生产补贴)之后得到的净收入。
财产净收入 指住户或住户成员将其所拥有的金融资产和自然资源交由其他机构单位、住户或个人支配而
获得的回报并扣除相关的费用之后得到的净收入。财产净收入包括利息净收入、红利收入、储蓄性保险净收益
和转让承包土地经营权租金净收入等。

332
绍兴市统计年鉴2020
Explanatory Notes on Main Statistical Indicators
Consumer Price Index Consumer price, refers to the price that consumer goods and services
purchased by urban and rural residents, is the final price of social products and services, which influences the
people’s livehood and lay a prominent role in the whole national economic price system. Consumer price index
reflects the trend and degree of changes in prices of consumer goods purchased by residents.
Retail Price Index the retail price refers to the price that the residents afford for the living
consumer and service. It is the final price of social products and service has a direct bearing on the people’s
lives and has a fairly important states in the whole national economy system.
Household Population refer to the population live together and share the money, in another word,
refer to the members live and consume together in a certain family.
Employment Population in Households refer to residents engaged in certain work and
receiving payment for the labor or income from their business operation, including those who work in state-
owned or collective units, joint ventures, foreign-owned units and private with permanent or temporary jobs.
The self-employed individuals and re-employed retirees are also included. This indictor reflects the situation
of employment and is the basic data for calculating employment rate and dependency ratio.
Capita Consumption Expenditure refers to total expenditure of rural households on daily life,
including expense on food, clothing, housing, fuel, articles for daily use, and expenditures on daily life and
services. This indicator is used to show the actual consumption level of peasants.
Floor area Refers to the construction area of residence for life. in accordance with the Premises
Permit.
Net Income of Rural Households refers to the total income of the permanent residents of the
rural households during a year after the deduction of the expenses for productive and non-productive business
operation, the payment for taxes and the payment for collective units for their contracted tasks, which can
then be spent for investments in productive and non-productive construction, for consumption in daily life
and for savings deposit. It is a comprehensive indicator to show the actual level of the income of the peasants’
household. The net income of the rural households includes not only the income from the productive and
non-productive business operation, but also the income from the non-business operation, such as the money
remitted or brought back by the members of the household who are in other places, the government relief
payment and various subsidies. It includes not only the money income, but also the income in kind. But the
income from borrowing from banks, friends and relatives is excluded.
Disposable income refers to the total income of household acquired during the investigation
period, which can be used discretionary for final consumption and savings. it includes cash and material
object. According to the source, it consists of four parts: wages income, net operating income, net property
income and net transitionary income.
Wages income Refers to all the labor remuneration and welfare obtained by employees through

333
物价、人民生活
full-time, part – time or freelance work.
Net operating income Refers to the net income received by family members though
manufacturing & managing activities, that is the net income after deducting business expense, fixed assets
depreciation and net production tax.
Net property income Refers to the net income of financial assets and natural resources deducted
the relevant expenses, including interest income,dividend income,etc.


10文化、教育、科技和卫生事业CHAPTER 10 CULTURE, EDUCATION, TECHNOLOGY SCIENCE AND PUBLIC HEALTH

336
绍兴市统计年鉴2020
10-1 文化事业及活动情况(2019年)
指 标 Item全 市Whole
Municipality
一、艺术事业 Art Institutions
1. 艺术表演团体 ( 个 ) Art Performance Troupes (unit) 7
#戏曲剧团 Local Opera Troupes 7
演出场数 ( 场 ) Number of Performances (show) 1037
观众人数 ( 万人次 ) Number of Spectators (10 000 person-times) 217.42
2. 艺术表演场所(国有) ( 个 ) Art Centers (state-owned) (unit) 6
#剧场 Theaters 6
二、图书馆事业 Libraries
单位数 ( 个 ) Number of Units (unit) 7
总藏量 ( 万册 ) Total Collections (10 000 volumes) 643.79
#图书 Books 590.11
#古籍 Ancient Books 25.74
书刊文献外借人次 ( 万人次 ) Number of books and literature borrowing (10 000 person-times) 182.07
三、群众文化事业 Mass Culture
文化馆数 ( 个 ) Number of Cultural Centers (unit) 7
文化站数 ( 个 ) Number of Cultural Stations (unit) 107
#乡镇文化站 Village and Town Cultural Stations 84
举办展览培训班活动 ( 次 ) Number of Exhibition and Training Classes (time) 6803
四、文物事业 Cultural Relics
文保单位 ( 个 ) Historical Relic Protection Units (unit) 418
#国家级文保单位 Historical Relic Protection Units of State Level 32
文物藏品的实际数量 ( 件 ) Number of Collections (piece) 102282
#一级文物 Grade One 188
二级文物 Grade Two 606
三级文物 Grade Three 2667
五、电影事业 Film
电影院 ( 个 ) Cinemas (unit) 55
电影放映场次 ( 万场 ) Number of Performances (10 000show) 72.88
电影观众人次 ( 万人次 ) Spectator (10 000person-time) 985.36

337
文化、教育、科技和卫生事业
Cultural Undertaking and Activities (2019)
越城区Yuecheng
District
柯桥区KeqiaoDistrict
上虞区ShangyuDistrict
诸暨市ZhujiCity
嵊州市Shengzhou
City
新昌县XinchangCounty
1 1 2 1 1 1
1 1 2 1 1 1
157 260 136 235 131 118
24.80 65.00 23.25 47.00 30.23 27.14
2 - 1 1 1 1
2 - 1 1 1 1
2 1 1 1 1 1
244.19 125.13 72.65 93.05 60.33 48.44
214.73 121.56 63.64 89.96 55.89 44.33
16.94 - 3.35 1.72 3.72 -
105.77 15.52 20.22 17.80 18.02 4.74
2 1 1 1 1 1
17 16 20 23 15 16
11 12 17 20 11 13
1921 900 1587 1706 330 359
97 70 72 92 51 36
15 6 4 2 4 1
34555 4328 21359 3836 32127 6077
108 35 17 10 16 2
349 120 51 24 37 25
1486 296 153 207 397 128
12 9 7 18 5 4
19.99 12.01 8.57 21.01 5.91 5.38
283.56 197.88 141.12 206.70 94.80 61.29

338
绍兴市统计年鉴2020
10-2 历年普通高校、中等职业教育基本情况Basic Statistics on Education of Regular Higher Schools and Secondary Vocational Schools over the Years
年 份Year
普通高校Regular Institutions of Higher Education
中等职业学校Secondary Vocational Schools
在校学生Student
Enrollment
毕业生数Graduates
专任教师Number of Full-time Teachers
在校学生Student
Enrollment
毕业生数Graduates
专任教师Number of Full-time Teachers
1980 1210 198 79
1981 799 696 115
1982 868 290 139
1983 845 89 146
1984 960 271 149
1985 1238 340 191
1986 1559 361 213
1987 1991 395 238
1988 1885 954 237
1989 1685 777 233
1990 1512 780 253
1991 1408 671 259
1992 1430 593 255
1993 1877 382 254
1994 2102 592 271
1995 2313 787 275
1996 2155 779 289 38291 11209 2137
1997 2367 770 304 43227 11804 2313
1998 2716 809 320 52310 13261 2577
1999 3648 609 332 54373 13802 2801
2000 5800 757 714 53673 14914 2768
2001 8880 989 1039 36056 13810 1956
2002 14290 1746 1114 58306 16902 2898
2003 19344 2776 1383 67929 14996 2656
2004 25034 3435 1592 77313 16290 2806
2005 30702 5717 1946 80454 21988 2740
2006 38332 7356 2133 70151 23867 2816
2007 44103 8566 2300 69823 22142 2876
2008 50258 10873 2494 67497 23787 2815
2009 52898 14771 2561 66678 21879 2785
2010 53869 15111 2690 66039 21407 2663
2011 56455 14635 2761 69287 19991 2619
2012 59758 15545 2874 64422 21823 2699
2013 77532 19124 3807 60672 22518 2760
2014 80348 20127 3912 53624 22435 2772
2015 83831 20786 3952 51516 17970 2868
2016 90277 23105 4072 49763 17840 2988
2017 97345 25713 4431 49300 15865 3086
2018 99270 26875 4782 47581 15096 3148
2019 104232 27518 4964 47572 15829 3174
单位:人 (person)

339
文化、教育、科技和卫生事业
10-3 历年普通高中在校学生数Students Enrollment of Regular Senior School over the Years
年 份Year
全 市Whole
Municipality
越城区Yuecheng
District
柯桥区Keqiao District
上虞区Shangyu District
诸暨市ZhujiCity
嵊州市Shengzhou
City
新昌县Xinchang County
1949 846 489 175 122 60
1952 639 437 119 83
1957 3496 1581 348 533 546 488
1962 4349 1205 443 1038 1029 634
1965 4097 1494 463 890 785 465
1970 4123 1249 54 1401 937 482
1975 32283 8425 4369 8905 6432 4152
1980 25598 5395 4428 6955 5915 2905
1985 26681 3402 4335 4578 6358 5224 2784
1990 28305 2546 4816 5426 7456 5326 2735
1991 27320 2034 4952 5179 7451 5025 2679
1992 27320 2052 5327 4836 7338 5158 2609
1993 27630 2334 5585 4594 7481 5054 2582
1994 30086 2786 5951 4800 8448 5390 2711
1995 33688 2825 6849 5578 10007 5477 2952
1996 35539 2704 7139 6324 10706 5640 3026
1997 39194 2956 7645 7439 12009 5918 3227
1998 43396 3271 8324 7923 13931 6364 3583
1999 49851 4407 9784 8466 16215 6894 4085
2000 56534 7506 8680 8146 19074 8073 5055
2001 61461 8024 9598 8093 20663 9093 5990
2002 70345 8990 10650 9325 23706 10499 7175
2003 84872 11228 13242 13268 27553 11903 7678
2004 96909 13260 15291 15795 31498 12960 8105
2005 106232 13719 18878 17245 33858 14065 8467
2006 102929 12958 18507 15914 32796 14207 8547
2007 102469 12817 18636 15323 32823 14528 8342
2008 98332 12411 16749 14628 32618 14094 7832
2009 101633 12663 16313 15411 34885 14699 7662
2010 103985 12699 15262 15894 37949 14545 7636
2011 111336 12971 16437 16595 43029 14580 7724
2012 111006 12737 17889 15694 43070 13747 7869
2013 109565 12621 19045 15296 41659 12933 8011
2014 101364 12355 16930 14061 38522 11752 7744
2015 97169 12336 16260 13658 36444 10968 7503
2016 93061 12498 14659 12394 35848 10459 7203
2017 94473 13042 14716 12681 36637 10375 7022
2018 91125 13411 13640 12326 34583 10271 6894
2019 91234 13405 13669 12324 34632 10250 6954
单位:人 (person)

340
绍兴市统计年鉴2020
10-4 历年初中在校学生数Students Enrollment of Junior School over the Years
年 份Year
全 市Whole
Municipality
越城区Yuecheng
District
柯桥区Keqiao District
上虞区Shangyu District
诸暨市ZhujiCity
嵊州市Shengzhou
City
新昌县Xinchang County
1949 4862 1431 427 1652 861 491
1952 13335 3994 1611 3551 2569 1610
1957 21091 7369 2862 5912 3236 1712
1962 25962 7662 2530 8376 4989 2405
1965 30087 8883 3121 8637 6376 3070
1970 89247 21055 9431 27187 19688 11886
1975 180815 43146 29564 50272 36389 21444
1980 163595 38479 29135 50378 28308 17295
1985 172474 10556 36300 30325 47525 31584 16184
1990 140611 8715 32550 21772 34605 28798 14171
1991 161016 10221 34288 25720 40217 33851 16719
1992 171138 10507 35006 29757 43148 33799 18921
1993 159276 9778 31868 27863 39307 31371 19089
1994 151539 10267 30179 27419 35690 28710 19274
1995 152386 11107 29557 27398 35478 28577 20269
1996 158101 12762 30843 27508 36857 28767 21364
1997 152854 12542 29113 23669 36978 28605 21947
1998 140893 11819 26075 20338 35125 26445 21091
1999 145672 11567 27746 21935 37548 26082 20794
2000 171966 23037 27951 30807 42664 26715 20792
2001 190065 25495 33367 35529 47632 27945 20097
2002 198082 27825 36657 36677 49065 29220 18638
2003 189307 26770 34671 32861 48601 29211 17193
2004 181674 26469 34789 31399 45187 27903 15927
2005 170181 24570 33227 29771 41515 26192 14906
2006 169398 25775 33826 30817 40251 24795 13934
2007 170860 25964 34067 31267 41824 24265 13473
2008 181161 28618 36256 33229 45627 23815 13616
2009 175974 27550 34671 31030 46381 22892 13450
2010 170817 27572 33916 29278 44674 21931 13446
2011 154333 25101 30187 25173 40708 20297 12867
2012 147252 24518 28787 23809 38016 19436 12686
2013 142370 23461 27357 22430 37571 19153 12398
2014 144725 26691 24943 23028 38169 19388 12506
2015 138845 25896 23000 21942 36190 19011 12806
2016 138735 26120 22650 21696 36208 18615 13446
2017 139077 25480 22718 20651 37764 18469 13995
2018 139398 24964 23611 20515 38931 17753 13624
2019 137099 24328 23616 19707 39531 16835 13082
单位:人 (person)

341
文化、教育、科技和卫生事业
10-5 历年普通中学专任教师数Number of Full-time Teachers at Regular Secondary Schools over the Years
年 份Year
全 市Whole
Municipality
越城区Yuecheng
District
柯桥区Keqiao District
上虞区Shangyu District
诸暨市ZhujiCity
嵊州市Shengzhou
City
新昌县Xinchang County
1949 278 125 25 72 56
1952 567 235 43 116 97 76
1957 777 296 105 192 116 68
1962 1374 361 188 389 309 127
1965 1510 459 172 423 303 153
1970 3843 779 502 1330 685 547
1975 8595 1925 1312 2531 1789 1038
1980 9241 2191 1548 2804 1670 1028
1985 8623 615 1764 1315 2562 1445 922
1990 9197 704 1910 1535 2443 1727 878
1991 9660 715 2056 1604 2579 1798 908
1992 10001 730 2112 1684 2731 1828 916
1993 9849 706 2002 1674 2698 1827 942
1994 9824 755 2027 1687 2586 1811 958
1995 9939 795 2040 1742 2569 1804 989
1996 10322 883 2142 1757 2672 1840 1028
1997 10714 932 2207 1791 2819 1901 1064
1998 11090 959 2357 1782 2887 1980 1125
1999 11618 1031 2472 1889 3033 2028 1165
2000 12537 1775 2053 2094 3368 2054 1193
2001 13422 1926 2231 2276 3582 2139 1268
2002 14019 1978 2342 2437 3749 2240 1273
2003 14912 2124 2539 2628 3898 2435 1288
2004 15785 2205 2763 2878 4093 2519 1327
2005 16430 2193 3022 2925 4334 2594 1362
2006 16715 2225 3152 2898 4459 2641 1340
2007 16961 2240 3219 2895 4568 2681 1358
2008 17201 2270 3247 2909 4715 2690 1370
2009 17431 2301 3308 2923 4812 2694 1393
2010 17876 2346 3447 2962 5031 2695 1395
2011 19303 2459 3677 2978 5646 3108 1435
2012 19705 2503 3687 3029 5874 3081 1531
2013 19604 2557 3712 3075 5750 2978 1532
2014 19490 2818 3350 3111 5775 2890 1546
2015 19744 2896 3380 3101 5913 2882 1572
2016 20152 2997 3399 3118 6133 2867 1638
2017 20697 3102 3404 3245 6434 2871 1641
2018 20850 3146 3365 3222 6589 2804 1724
2019 21228 3215 3387 3222 6800 2793 1811
单位:人 (person)
注:九年一贯制学校小学部、十二年一贯制学校小学部的教职工数统计到普通中学,下同。Note: The number of staff and teachers of the primary departments in the nine-year and twelve-year education schools is
included in the regular secondary schools, the same below.

342
绍兴市统计年鉴2020
10-6 历年小学在校学生数Students Enrollment at Primary Schools over the Years
年 份Year
全 市Whole
Municipality
越城区Yuecheng
District
柯桥区Keqiao District
上虞区Shangyu District
诸暨市ZhujiCity
嵊州市Shengzhou
City
新昌县Xinchang County
1949 124426 23036 17388 45509 25474 13019
1952 217621 57197 26086 66867 43207 24264
1957 266084 70963 41969 78186 50184 24782
1962 302677 67823 44899 91370 67488 31097
1965 402389 96277 62474 120600 80750 42288
1970 476114 121996 83492 129904 87118 53604
1975 528175 147884 99904 140254 87940 52193
1980 469963 132478 87098 124464 80775 45148
1985 349260 16800 74728 60261 88855 69522 39094
1990 340081 21394 67532 60312 80752 66132 43959
1991 321510 21576 62749 54911 76097 62668 43509
1992 304254 21808 57879 49898 72813 58927 42929
1993 311236 23062 60467 51081 75331 58251 43044
1994 329398 24878 67622 55785 79056 57959 44098
1995 332475 25217 70983 56625 80624 56615 42411
1996 342547 25796 76332 59308 83550 57111 40450
1997 356930 26689 83105 64264 86904 57312 38656
1998 364897 27272 88974 67560 87724 57075 36292
1999 360126 27180 90247 67000 86160 56072 33467
2000 348065 48010 67480 63655 83960 54126 30834
2001 340757 47793 66910 62255 82700 52023 29076
2002 339127 48626 68864 62145 81847 49487 28158
2003 335356 51471 67917 60655 81219 47056 27038
2004 337854 52840 71280 59508 81659 45798 26769
2005 332803 53052 71722 57730 80196 43671 26432
2006 326260 52431 69490 55317 80497 42271 26254
2007 320069 52724 66781 52635 80367 41344 26218
2008 309825 53104 62481 49813 77791 40582 26054
2009 300169 52259 60185 47579 74266 40220 25660
2010 300355 52919 59677 46825 74724 40025 26185
2011 303803 54964 58413 47107 75915 40330 27074
2012 302445 53819 60880 46036 75331 39076 27303
2013 299636 53706 61789 44956 73941 37990 27254
2014 288645 55894 54068 43450 72186 36241 26806
2015 277329 55291 50361 41373 69317 35200 25787
2016 264102 53907 46990 38940 66259 33559 24447
2017 255803 52918 44768 37957 64981 32071 23108
2018 257921 53794 44277 37602 67075 32334 22839
2019 261869 54895 45370 38345 68796 32313 22150
单位:人 (person)

343
文化、教育、科技和卫生事业
10-7 历年小学专任教师Full-time Teachers at Primary Schools over the Years
年 份Year
全 市Whole
Municipality
越城区Yuecheng
District
柯桥区Keqiao District
上虞区Shangyu District
诸暨市ZhujiCity
嵊州市Shengzhou
City
新昌县Xinchang County
1949 4667 780 475 1858 698 856
1952 7097 1905 900 2015 1375 902
1957 7295 2186 1060 1855 1326 868
1962 8482 2025 1342 2301 1846 968
1965 11322 2775 1710 3090 2389 1358
1970 15733 4155 2669 4146 3056 1707
1975 17738 4748 3338 4502 3216 1934
1980 16546 4728 2826 4153 3115 1724
1985 13315 635 2623 2154 3799 2396 1708
1990 13026 744 2556 2302 3405 2516 1503
1991 13105 784 2722 2305 3332 2470 1492
1992 12908 791 2710 2280 3230 2449 1448
1993 12747 810 2560 2304 3184 2444 1445
1994 12848 828 2592 2308 3221 2445 1454
1995 13005 876 2656 2354 3226 2435 1458
1996 13310 937 2799 2388 3303 2458 1425
1997 13644 974 2895 2420 3388 2452 1515
1998 14353 996 3201 2574 3441 2478 1663
1999 14551 1035 3258 2685 3379 2436 1758
2000 14551 1879 2538 2709 3400 2357 1668
2001 14794 1969 2563 2798 3355 2345 1764
2002 14615 2015 2628 2775 3312 2340 1545
2003 14404 2075 2570 2701 3224 2277 1557
2004 14467 2077 2678 2745 3235 2193 1539
2005 14527 2086 2707 2779 3253 2162 1540
2006 14550 2124 2729 2737 3318 2110 1532
2007 14646 2157 2777 2720 3391 2104 1497
2008 14548 2189 2748 2631 3412 2103 1465
2009 14625 2255 2766 2623 3440 2091 1450
2010 14764 2281 2793 2584 3590 2077 1439
2011 14837 2350 2807 2515 3701 2051 1413
2012 15278 2384 2953 2487 3902 2063 1489
2013 15632 2384 3078 2452 4089 2138 1491
2014 15647 2617 2878 2463 4045 2154 1490
2015 15714 2657 2817 2464 4122 2177 1477
2016 15718 2662 2750 2464 4197 2185 1460
2017 15863 2682 2706 2490 4365 2182 1438
2018 16043 2721 2671 2522 4497 2188 1444
2019 16316 2822 2697 2570 4566 2200 1461
单位:人 (person)

344
绍兴市统计年鉴2020
10-8 全市各级各类学校情况(2019年)
指 标 Item
学校数 ( 所 ) Number of Schools
(unit)
班数 ( 班 )Number
of Classes(class)
一、高等教育 Higher Education 11
1. 普通高校 Regular Institutions of Higher Education 11
2. 成人高校 Institutions of Higher Education for Adults
3. 远程教育 Long Distance Learning
二、中等职业教育 Vocational Secondary Education 18
三、基础教育 Foundational Education 1119 17764
1. 普通中学 Regular Secondary Schools 189 5688
#高中 Senior Secondary Schools 51 2203
初中 Junior Secondary Schools 138 3485
2. 小学 Primary Schools 324 7126
3. 幼儿园 Kindergartens 599 4816
4. 特殊教育学校 Special Education Schools 7 134
四、成人教育 Adult Education 940 9900
成人技术培训学校 Technical Training Schools for Adults 940 9900
单位:人

345
文化、教育、科技和卫生事业
Basic Statistics on Schools of Different Levels and Types (2019)
毕业生数Graduates
招生数New Students
Enrollment
在校学生数Students
Enrollment
毕业班学生数Students in Graduate
Enrollment
教职工数Staff andTeachers
#专任教师Number ofFull-timeTeachers
32133 37401 138877 32668 6891 4964
27518 31364 104232 28839 6891 4964
2724 5248 9084 3829
1891 789 25561
15829 17106 47572 15726 3390 3174
167574 168095 632186 121184 55446 45877
77290 75539 228333 78672 22964 19871
30649 30826 91234 31230
38471
8126
46641 44713 137099 47442 11745
45252 47265 261869 42512 16316
44930 45074 140780 16779 9505
102 217 1204 196 185
724090 643462 4490 3714
724090 643462 4490 3714
(person)

346
绍兴市统计年鉴2020
10-9 普通高校教育情况(2019年)Basic Statistics on Education of Regular Higher Schools (2019)
指 标 Item
学校数( 所 )
Number of
Schools (unit)
毕业生数
Grad-uates
招生数 New
StudentEnroll-ment
在校学生数Student Enroll-ment
教职工总数
Staff and Teachers
#专任 教师
Number of
Full-time Teachers
普通高校教育 Regular Higher Schools 11 27518 37656 104232 7029 4964
绍兴文理学院 Shaoxing University 1 3877 3626 14202 1570 1036
绍兴文理学院元培学院
Yuanpei College of Shaoxing University 1 2331 2834 9539 459 403
绍兴越秀外国语职业学院
Shaoxing Yuexiu Foreign Language Vocational Institute 1 4501 4474 16543 1053 714
浙江工业大学之江学院
Zhijiang College of Zhejiang University of Technology 1 2043 2510 8650 595 419
浙江农林大学暨阳学院
Jiyang College of Zhejiang A&F University 1 1568 2067 6804 448 352
浙江工业职业技术学院
Zhejiang Industrial Vocational Technology Institute 1 4001 5924 13733 836 535
绍兴职业技术学院 Shaoxing Vocational & Technical College 1 4252 5291 12833 646 478
浙江邮电职业技术学院
Zhejiang Technical College of Posts & Telecom 1 1299 2269 5067 383 227
浙江农业商贸职业学院
Zhejiang Agricultural Business Vocational Institute 1 2158 2703 6583 365 293
浙江理工大学科技与艺术学院
Keyi College of Zhejiang Sci-Tech University 1 1488 2112 6432 394 289
浙江树人大学(杨汛桥校区)
Zhejiang Shuren University Yangxun Bridge Campus 1 - 3846 3846 280 218
单位:人 (person)
10-10 中等职业学校基本情况(2019年)Basic Statistics on Vocational Secondary Schools (2019)
指 标 Item全 市Whole
Municipality
越城区Yuecheng
District
柯桥区Keqiao District
上虞区Shangyu District
诸暨市Zhuji City
嵊州市Shengzhou
City
新昌县Xinchang County
学校数 ( 所 ) Number of Schools (unit) 18 6 2 2 4 3 1
毕业生数 Graduates 15829 4014 3113 2137 3323 1972 1270
招生数 New Student Enrollment 17106 3577 3280 2632 4021 2058 1538
在校学生数 Student Enrollment 47572 10663 8995 7335 10339 5776 4464
教职工总数 Staff and Teachers 3390 870 635 453 658 428 346
#专任教师 Number of Full-time 3174 798 604 433 602 403 334
单位:人 (person)

347
文化、教育、科技和卫生事业
10-11 普通中学基本情况(2019年)Regular Secondary Schools (2019)
指 标 Item全 市Whole
Municipality
越城区Yuecheng
District
柯桥区Keqiao District
上虞区Shangyu District
诸暨市Zhuji City
嵊州市Shengzhou
City
新昌县Xinchang County
高 中 Senior School
学校数 ( 所 ) Number of Schools (unit) 51 8 8 8 15 7 5
班级数 ( 班 ) Number of Classes (class) 2203 310 338 303 851 237 164
毕业生数 Graduates 30649 4274 4564 4050 12019 3415 2327
招生数 New Student Enrollment 30826 4394 4642 4085 11861 3433 2411
在校学生数 Student Enrollment 91234 13405 13669 12324 34632 10250 6954
#一年级 Grade One 30832 4394 4642 4085 11866 3433 2412
二年级 Grade Two 29172 4426 4149 4001 11017 3306 2273
三年级 Grade Three 31230 4585 4878 4238 11749 3511 2269
专任教师数 Number of Full-time Teachers 8126 1147 1376 1210 2845 951 597
初中 Junior School
学校数 ( 所 ) Number of Schools (unit) 138 18 19 24 34 26 17
班级数 ( 班 ) Number of Classes (class) 3485 610 594 534 985 451 311
毕业生数 Graduates 46641 8576 7635 6956 12907 5964 4603
招生数 New Student Enrollment 44713 8231 7842 6366 12944 5218 4112
在校学生数 Student Enrollment 137099 24328 23616 19707 39531 16835 13082
#一年级 Grade One 44713 8231 7842 6366 12944 5218 4112
二年级 Grade Two 44944 7713 7880 6732 13010 5385 4224
三年级 Grade Three 47442 8384 7894 6609 13577 6232 4746
专任教师数 Number of Full-time Teachers 11745 1992 2003 1846 3307 1558 1039
单位:人 (person)

348
绍兴市统计年鉴2020
10-12 小学教育基本情况(2019年)Basic Statistics on Primary Education (2019)
10-13 幼儿园基本情况(2019年)Basic Statistics on Kindergartens (2019)
指 标 Item全 市Whole
Municipality
越城区Yuecheng
District
柯桥区Keqiao District
上虞区Shangyu District
诸暨市Zhuji City
嵊州市Shengzhou
City
新昌县Xinchang County
学校数 ( 所 ) Number of Schools (unit) 324 48 53 50 102 49 22
班数 ( 班 ) Number of Classes (class) 7133 1359 1161 1104 1977 924 608
毕业生数 Graduates 45252 8799 8296 6472 12159 5462 4064
招生数 New Student Enrollment 47265 9980 9093 7079 12126 5617 3370
在校学生数 Student Enrollment 261869 54895 45370 38345 68796 32313 22150
教职工总数 Staff and Teachers 15507 2763 2740 2509 4032 2033 1430
#专任教师 Number of Full-time Teachers 14959 2746 2689 2404 3918 1916 1286
指 标 Item全 市Whole
Municipality
越城区Yuecheng
District
柯桥区Keqiao District
上虞区Shangyu District
诸暨市Zhuji City
嵊州市Shengzhou
City
新昌县Xinchang County
园数 ( 所 ) Number of Kindergartens (unit) 599 124 100 95 136 80 64
班数 ( 班 ) Number of Classes (class) 4816 1114 929 735 1065 552 421
在园幼儿数 Number of Children Enrollment 140780 33496 27589 21966 29270 16681 11778
教职工数 Staff and Teachers 16779 3904 3230 2666 3780 1958 1241
#园长 Leader 580 124 99 83 140 70 64
专任教师 Number of Full-time Teachers 9505 2274 1848 1484 2148 1020 731
保健员 Health-care Provider 398 88 33 93 97 49 38
保育员 Child-care Worker 3493 807 658 553 818 415 242
其他 Other 2803 611 592 453 577 404 166
单位:人
单位:人
(person)
(person)

349
文化、教育、科技和卫生事业
10-14 义务教育普及情况(2019年)Popularity of Compulsory Education (2019)
指 标 Item全 市Whole
Municipality
越城区Yuecheng
District
柯桥区Keqiao District
上虞区Shangyu District
诸暨市Zhuji City
嵊州市Shengzhou
City
新昌县Xinchang County
小学教育普及情况
Popularity of Primary Schools
学龄人口 ( 人 )
School-age Population (person) 257895 54035 44939 37703 67905 31671 21642
入学率 Enrollment Rate 100 100 100 100 100 100 100
巩固率 Consolidation Rate 100 100 100 100 100 100 100
小学升初中比例
Percentage of Graduates of Primary Schools Entering Junior Secondary Schools
100 100 100 100 100 100 100
初中教育普及情况
Popularity of Junior Secondary Schools
学龄人口( 人 )
School-age Population (person) 128088 23059 22245 18041 37140 15300 12303
入学率 Enrollment Rate 100 100 100 100 100 100 100
巩固率 Consolidation Rate 100 100 100 100 100 100 100
初中升高中比例
Percentage of Graduates of Junior Secondary Schools Entering Senior Secondary Schools
99.31 98.73 99.67 99.90 99.52 98.83 98.96
单位:% %
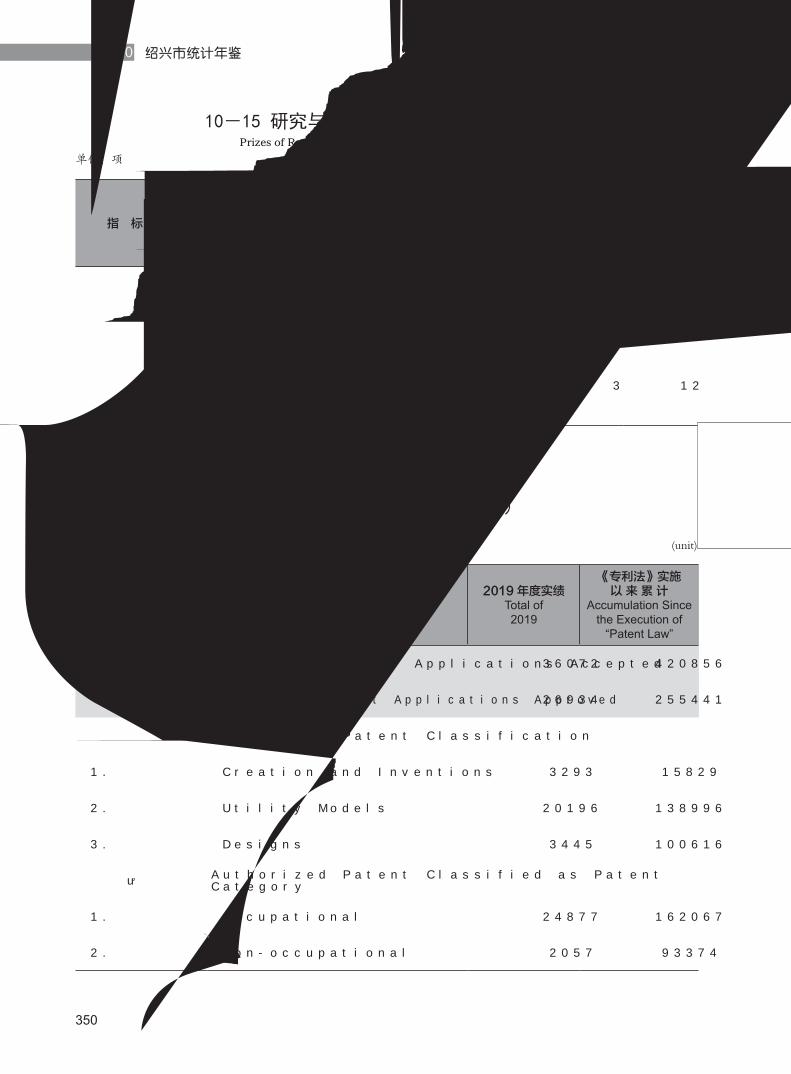
350
绍兴市统计年鉴2020
10-15 研究与开发成果获奖情况(2019年)Prizes of Research and Development Achievement (2019)
10-16 本地专利情况(2019年)Basic Statistics on Local Patents (2019)
指 标 Item
合 计 Whole Munici-pality
一等奖FirstPrize
二等奖Second
Prize
三等奖ThirdPrize
国家科学技术奖 Number of National Scientific and Technological Prizes Awarded 3 1 2 -
省级科学技术奖 Number of Province Level Scientific and Technological Prizes Awarded 17 2 3 12
指 标 Item2019 年度实绩
Total of2019
《专利法》实施以 来 累 计
Accumulation Since the Execution of
“Patent Law”
申请数 Number of Patent Applications Accepted 36072 420856
授权数 Number of Patent Applications Approved 26934 255441
授权专利分类 Authorized Patent Classification
1. 发明 Creation and Inventions 3293 15829
2. 实用新型 Utility Models 20196 138996
3. 外观设计 Designs 3445 100616
授权专利按权属分 Authorized Patent Classified as Patent Category
1. 职务 Occupational 24877 162067
2. 非职务 Non-occupational 2057 93374
单位:项
单位:项
(unit)
(unit)

351
文化、教育、科技和卫生事业
10-17 高新技术产业发展情况(2018-2019年)Statistics on High and New Technology Enterprises (2018-2019)
10-18 科技创新服务体系建设情况(2017-2019年)Construction of Science and Technology Innovation Service (2017-2019)
指 标 Item
2018 年 2019 年
累 计Accum-ulated
当年新增Current
Year
累 计Accum-ulated
当年新增Current
Year
高新技术企业 ( 家 ) Number of High & New Technological Enterprises (unit)
国家重点扶持高企 State Level 969 321 1345 416
省科技型中小企业 (家)Number of Scientific and Technical Type Small and Medium Enterprises at Provincial Level (unit)
5439 1360 6638 1199
省级新产品 (项)Number of New Products at Provincial Level (item) 1718 2798
高新技术企业主要经济指标 ( 亿元 )
Main Economic Indicators of High & New Technological Enterprises (100 million yuan)
1. 工业总产值 Gross Industrial Output Value 2769.89 3081.84
2. 营业收入 Business Income 2725.16 3008.98
3. 利税 Total Amount of Pre-tax 380.01 423.06
指 标 Item 2017 年末 Up to 2017
2018 年末 Up to 2018
2019 年末 Up to 2019
省级高新技术研究开发中心 Provincial Level High And Advanced Technology Research And Development Center 373 406 454
市级企业研发中心 Municipal Level Enterprise Research and Development Center 835 842 1113
市级以上科技企业孵化器 Science and Technology Business Incubators above Municipal Level 29 44 30
省级企业研究院 Provincial Level of Enterprise Research Institute 89 102 118
省级工程技术研究中心 Provincial Level of Engineering Technology Research Center 8 8 7
省级重点实验室 Provincial Level of Key Laboratory 6 7 9
单位:家 (unit)

352
绍兴市统计年鉴2020
10-19 规模以上工业企业科技活动及相关情况(2019年)
指 标 Item全 市Whole
Municipality
一、研发人员活动情况 (人)Statistics on Persons with R&D Activities (person)
R&D 人员 Number of Persons with R&D Activities 60610
#项目研究开发人员 Number of Persons with R&D Projects 56201
R&D 人员折合全时当量合计 (人年) Full-time Equivalent of R&D Personnel (person-year) 47427
二、研发经费情况 (万元)Statistics on Expenditure on R&D Activities (10 000 yuan)
R&D 经费内部支出合计 Internal Expenditure on R&D Activities 1439592
R&D 经费外部支出合计 External Expenditure on R&D Activities 35691
技术改造经费支出 Expenditure for Technology Transformation 80905
购买境内技术经费支出 Expenditure for Purchasing of Domestic Technology 3710
引进境外技术经费支出 Expenditure for Acquisition of Abroad Technology 2544
来自政府部门的研发资金 Government Appropriation Funds 13621
三、企业办研究机构情况 (个)Statistics on Institutions Founded by Enterprises (unit)
有 R&D 活动的企业数 Number of Enterprises with R&D Activities 2412
#企业办研发机构数 Number of Institutions 864
机构人员合计 (人) Number of Employed Persons (person) 29880

353
文化、教育、科技和卫生事业
Basic statistics on R&D Activities of Industrial Enterprisesabove Designated Size(2019)
越城区Yuecheng
District
柯桥区KeqiaoDistrict
上虞区ShangyuDistrict
诸暨市ZhujiCity
嵊州市Shengzhou
City
新昌县XinchangCounty
5311 18766 10778 10432 6654 8669
4823 17464 10092 9594 6107 8121
4177 13447 9143 8769 5156 6734
160222 416183 305256 225735 147209 184987
5343 9272 9174 3729 2719 5453
6445 5443 24151 9783 7396 27687
976 756 200 69 6 1703
27 531 40 1282 - 663
1430 1011 3038 2739 859 4543
158 621 355 710 378 190
61 137 292 170 79 125
2292 6315 10116 3646 1323 6188

354
绍兴市统计年鉴2020
10-20 历年分区、县(市)R&D经费支出R&D Expenditure by District and County (City) over the Years
年 份Year
全 市Whole
Municipality
越城区Yuecheng
District
柯桥区Keqiao District
上虞区Shangyu District
诸暨市ZhujiCity
嵊州市Shengzhou
City
新昌县Xinchang County
2005 17.70
2006 24.38
2007 30.10
2008 36.43
2009 44.84
2010 51.28 3.46 14.89 7.80 12.74 3.70 6.70
2011 62.01 2.70 17.85 9.92 15.70 4.78 8.34
2012 73.40 2.97 23.42 11.69 18.26 5.12 9.29
2013 82.81 1.54 22.80 14.07 22.26 6.34 11.76
2014 92.23 0.88 24.55 15.94 25.13 7.13 13.64
2015 101.20 2.29 26.70 19.07 27.35 7.51 14.53
2016 112.89 3.08 28.20 21.81 30.51 9.28 15.80
2017 121.70 3.34 31.24 24.87 31.03 10.90 15.74
2018 130.64 12.06 36.07 27.28 25.76 12.59 16.89
2019 152.98 17.97 42.67 33.17 24.71 14.94 18.58
单位:亿元 (100 million yuan)

355
文化、教育、科技和卫生事业
10-21 历年分区、县(市)R&D经费支出占GDP比重Proportion of R&D Expenditure in GDP by District and County (City) over the Years
年 份Year
全 市Whole
Municipality
越城区Yuecheng
District
柯桥区Keqiao District
上虞区Shangyu District
诸暨市ZhujiCity
嵊州市Shengzhou
City
新昌县Xinchang County
2005 1.23
2006 1.45
2007 1.53
2008 1.64
2009 1.89
2010 1.83 1.12 1.92 1.79 2.05 1.35 3.12
2011 1.86 0.96 1.94 1.91 2.12 1.49 3.36
2012 2.01 1.09 2.31 2.02 2.22 1.41 3.28
2013 2.09 0.54 2.07 2.25 2.47 1.60 3.84
2014 2.16 0.27 2.16 2.34 2.56 1.68 4.09
2015 2.27 0.68 2.22 2.63 2.66 1.69 4.21
2016 2.36 0.60 2.28 2.82 2.78 1.93 4.29
2017 2.40 0.58 2.31 2.96 2.63 2.05 4.00
2018 2.41 1.36 2.57 2.98 2.10 2.25 4.01
2019 2.65 1.90 2.84 3.39 1.88 2.54 4.12
单位:% %

356
绍兴市统计年鉴2020
10-22 历年医疗机构数Number of Health Institutions over the Years
年 份Year
全 市Whole
Municipality
越城区Yuecheng
District
柯桥区Keqiao District
上虞区Shangyu District
诸暨市ZhujiCity
嵊州市Shengzhou
City
新昌县Xinchang County
1949 20 11 1 1 6 1
1952 194 55 12 76 42 9
1957 382 131 57 75 61 58
1962 508 175 69 110 90 64
1965 560 223 77 106 90 64
1970 467 120 72 113 96 66
1975 571 171 84 130 112 74
1980 670 226 92 140 126 86
1985 804 176 115 95 162 150 106
1990 900 175 163 117 175 154 116
1991 896 157 173 115 177 155 119
1992 817 160 160 115 123 147 112
1993 815 160 160 115 122 147 111
1994 808 161 160 115 115 145 112
1995 809 163 160 115 115 144 112
1996 796 152 160 115 115 142 112
1997 804 152 160 115 115 143 119
1998 792 151 157 111 114 141 118
1999 670 155 101 71 114 120 109
2000 670 155 101 71 114 120 109
2001 1148 183 101 180 238 243 203
2002 1001 242 179 155 172 165 88
2003 990 233 181 148 173 164 91
2004 1039 262 194 150 174 167 92
2005 1087 275 213 149 175 169 106
2006 1378 283 228 201 342 190 134
2007 1400 284 233 192 364 190 137
2008 1400 236 240 199 392 198 135
2009 1486 241 263 225 421 208 128
2010 1453 248 262 227 373 219 124
2011 1515 256 266 235 400 232 126
2012 2635 273 438 371 803 442 308
2013 2559 281 415 360 791 413 299
2014 2499 329 376 361 746 407 280
2015 2520 337 390 366 743 410 274
2016 2531 349 389 370 740 405 278
2017 2502 356 391 372 711 398 274
2018 2559 361 395 394 739 401 269
2019 2698 359 417 408 825 412 277
单位:个 (unit)
注:①医疗机构包括卫生机构、诊所、卫生所、医务室、社区卫生服务站。② 2012 年起,在原口径基础上增加村卫生室。Note: a) The medical institutions include health agencies, clinics, health centers, dispensaries and community service health stations.
b) Since 2012, on the basis of the original diameter, increase the village clinics.

357
文化、教育、科技和卫生事业
10-23 历年卫生机构床位数Number of Health Beds over the Years
年 份Year
全 市Whole
Municipality
越城区Yuecheng
District
柯桥区Keqiao District
上虞区Shangyu District
诸暨市ZhujiCity
嵊州市Shengzhou
City
新昌县Xinchang County
1949 392 241 59 50 42
1952 2467 1423 50 900 69 25
1957 1694 1068 73 386 132 35
1962 3198 1944 252 544 343 115
1965 3171 1863 279 479 341 209
1970 3219 1228 434 567 664 326
1975 4929 2256 623 754 839 457
1980 6047 2604 747 1166 994 536
1985 6176 1343 1398 677 1238 941 579
1990 7767 1677 1623 961 1513 1236 757
1991 7807 1682 1614 961 1531 1236 783
1992 7994 1720 1688 961 1559 1219 847
1993 8516 1881 1915 1034 1586 1264 836
1994 8299 1743 1853 978 1589 1268 868
1995 8289 1713 1810 1096 1378 1422 870
1996 8656 1985 1810 1079 1544 1368 870
1997 8625 1910 2055 964 1586 1238 872
1998 9418 2062 2282 1079 1762 1348 885
1999 9265 1890 2226 1117 1751 1399 882
2000 9719 2150 2276 1249 1872 1290 882
2001 9968 2251 2026 1189 1932 1572 998
2002 10094 2480 1820 1180 2168 1413 1033
2003 11279 2873 2279 1327 2358 1382 1060
2004 11972 2947 2480 1419 2451 1583 1092
2005 12158 2962 2556 1281 2569 1686 1104
2006 12883 3132 2788 1301 2734 1788 1140
2007 13630 3409 2772 1688 2774 1836 1151
2008 14007 3517 2801 1688 2789 1850 1362
2009 14719 3838 2920 1864 2838 1883 1376
2010 15820 4168 3032 1997 3182 1886 1555
2011 16849 4537 3087 2268 3357 1956 1644
2012 18796 4814 3397 2468 4035 2201 1881
2013 20084 4950 3545 2678 4461 2311 2139
2014 21038 5183 3520 2790 4710 2628 2207
2015 23385 6042 3758 3177 5224 2820 2364
2016 25459 7029 4105 3155 5459 3267 2444
2017 27061 7665 4265 3313 5734 3435 2649
2018 27329 7470 4465 3331 5898 3515 2650
2019 28581 7373 4785 3336 6602 3716 2769
单位:张 (unit)

358
绍兴市统计年鉴2020
10-24 历年卫生技术人员数Number of Medical Technical Personnel over the Years
年 份Year
全 市Whole
Municipality
越城区Yuecheng
District
柯桥区Keqiao District
上虞区Shangyu District
诸暨市ZhujiCity
嵊州市Shengzhou
City
新昌县Xinchang County
1949 961 249 6 496 158 52
1952 2445 717 70 1239 264 155
1957 3244 1087 279 1068 505 305
1962 3707 1515 409 865 552 366
1965 3864 1578 516 796 564 410
1970 3723 1266 574 795 638 450
1975 5072 1867 713 1057 808 627
1980 7075 2623 994 1411 1220 827
1985 8345 1703 1520 1097 1764 1298 963
1990 9940 2021 1835 1274 2202 1509 1099
1991 10202 2052 1846 1335 2301 1578 1090
1992 10472 2104 1882 1367 2383 1626 1110
1993 10916 2196 2004 1469 2358 1698 1191
1994 11361 2330 2081 1458 2454 1832 1206
1995 11339 2346 2070 1509 2487 1773 1154
1996 10417 2108 2047 1383 2326 1579 974
1997 10807 2279 2107 1471 2366 1605 979
1998 11307 2414 2188 1545 2454 1656 1050
1999 11049 2324 2220 1487 2497 1491 1030
2000 11284 2338 2283 1509 2566 1558 1030
2001 11946 2821 2055 1545 2819 1656 1050
2002 13202 3327 2129 1775 2933 1893 1145
2003 14041 3427 2471 2018 3045 1845 1235
2004 15953 3870 3063 2131 3685 1946 1258
2005 16776 4094 3267 2146 3888 2021 1360
2006 18013 4196 3389 2539 4185 2226 1478
2007 18460 4161 3570 2553 4312 2335 1529
2008 19295 4351 3606 2605 4753 2365 1615
2009 20899 4698 3910 2881 5213 2520 1677
2010 22155 4883 4058 3115 5561 2627 1911
2011 23931 5292 4459 3197 5945 2862 2176
2012 25722 5793 4860 3496 6091 3178 2304
2013 27854 6183 5234 3770 6974 3329 2364
2014 29176 6733 5353 4026 7182 3512 2370
2015 31658 7359 5131 4459 7987 3813 2909
2016 34685 8280 5981 4643 8450 4021 3310
2017 36977 8723 6489 4984 8921 4202 3658
2018 38335 9031 6904 5064 9096 4422 3818
2019 40051 9565 7130 5203 9974 4650 3529
单位:人 (person)

359
文化、教育、科技和卫生事业
10-25 历年卫生技术人员中:医生人数Number of Doctors over the Years
年 份Year
全 市Whole
Municipality
越城区Yuecheng
District
柯桥区Keqiao District
上虞区Shangyu District
诸暨市ZhujiCity
嵊州市Shengzhou
City
新昌县Xinchang County
1965 2155 796 308 538 306 207
1970 1943 589 296 513 320 225
1975 2590 910 374 589 396 321
1980 2756 955 377 576 482 366
1985 3673 751 594 505 809 581 433
1986 3754 814 618 535 702 591 494
1987 3980 918 604 503 834 618 503
1988 5022 1056 871 636 1077 803 579
1989 5098 1081 863 649 1109 826 570
1990 5288 1073 892 690 1191 871 571
1991 5236 1039 873 692 1211 862 559
1992 5288 1071 833 701 1231 885 567
1993 5452 1061 941 734 1263 917 536
1994 5763 1124 1017 701 1370 942 609
1995 6113 1192 1106 802 1396 1004 613
1996 5391 963 1083 737 1219 885 504
1997 5618 1045 1122 768 1270 901 512
1998 5462 1070 1072 699 1266 830 525
1999 5515 982 1169 682 1245 906 531
2000 5707 984 1229 702 1294 967 531
2001 6248 1170 1126 986 1431 932 603
2002 6665 1538 1094 854 1575 1050 554
2003 6994 1478 1252 971 1724 975 594
2004 7846 1831 1470 1033 1892 1046 574
2005 8074 1858 1533 1025 1977 1058 623
2006 8459 1867 1566 1200 2057 1103 666
2007 8827 1917 1634 1229 2147 1203 697
2008 8901 1919 1612 1208 2227 1228 707
2009 9298 2048 1770 1236 2290 1224 730
2010 9593 2135 1793 1298 2339 1226 802
2011 10091 2157 2018 1340 2397 1291 888
2012 10638 2315 2190 1445 2363 1391 934
2013 11605 2483 2299 1555 2909 1415 944
2014 12012 2698 2320 1625 2998 1448 923
2015 12911 2918 2096 1834 3372 1549 1142
2016 14171 3174 2636 1909 3555 1583 1314
2017 15195 3388 2810 2088 3769 1679 1461
2018 15662 3513 2909 2101 3845 1743 1551
2019 16312 3764 2945 2133 4280 1882 1308
单位:人 (person)

360
绍兴市统计年鉴2020
10-26 卫生机构、床位情况(2019年)
指 标 Item全 市Whole
Municipality
一、卫生机构数 ( 个 ) Number of Health Care Institutions (unit) 267
1. 医院 Hospitals 89
#综合医院 General Hospitals 33
中医医院 Hospitals of Chinese Medicine 13
专科医院 Specialized Hospitals 37
#口腔医院 Hospitals for Mouth 15
眼科医院 Hospitals for Eye 5
精神病医院 Mental Hospitals 4
传染病医院 Hospitals for Infectious Diseases -
皮肤病医院 Hospitals for Skin Diseases -
康复医院 Healing Hospitals 7
麻风病医院 Leprosy Hospitals 1
美容院 Beauty Salon 2
妇产(科)医院 Maternity (branch) Hospitals 2
骨科医院 Orthopaedic Hospitals 1
护理院 Nursing Homes 6
2. 卫生院 Commune Hospitals 86
3. 门诊部 Clinics 49
4. 急救中心 Emergency Aid Center 5
5. 采供血机构 Blood and Supplying Blood 2
6. 妇幼保健院(所) Hospitals for Maternity and Child Care 8
7. 专科疾病防治院 Specialized Prevention and Treatment Centers 2
8. 疾病预防控制中心 Center for Disease Prevention and Control 7
9. 卫生监督所 Institution of Public Health Inspection 7
10. 医学在职培训机构 Medical On-the-job Training Institutions 4
11. 健康教育所 Health Education Center -
12. 其他卫生机构 Other Health Care Institutions 5
13. 疗养院 Sanatorium -
14. 计划生育技术服务机构 Technical Service Center for Birth Control 3
二、卫生机构床位数 ( 张 ) Number of Beds (unit) 28581
1. 医院 Hospitals 22001
2. 卫生院 Commune Hospitals 5150
3. 妇幼保健院 Hospitals for Maternity and Child Care 1326
4. 专科疾病防治院 Specialized Prevention and Treatment Centers 54
5. 其他卫生机构 Other Health Care Institutions 50
三、每万人拥有总床位 ( 张 ) Total Beds of Per 10 0000 Persons (unit) 63.82
每万人拥有医院床位 Beds of Hospitals Per 10 0000 Persons 49.12

361
文化、教育、科技和卫生事业
Basic Statistics on Healthcare Institutions and Beds (2019)
越城区Yuecheng
District
柯桥区KeqiaoDistrict
上虞区ShangyuDistrict
诸暨市ZhujiCity
嵊州市Shengzhou
City
新昌县XinchangCounty
48 33 36 55 57 38
22 13 11 17 16 10
7 3 4 6 7 6
1 2 2 3 2 3
10 8 5 7 7 -
5 6 3 1 - -
1 1 1 1 1 -
2 - 1 - 1 -
- - - - - -
- - - - - -
- - - 3 4 -
- 1 - - - -
1 - - 1 - -
1 - - 1 - -
- - - - 1 -
4 - - 1 - 1
5 9 14 28 17 13
8 5 4 4 19 9
1 - 1 1 1 1
1 - - 1 - -
2 2 1 1 1 1
- 1 1 - - -
2 1 1 1 1 1
2 1 1 1 1 1
- 1 1 1 - 1
- - - - - -
4 - 1 - - -
- - - - - -
1 - - - 1 1
7373 4785 3336 6602 3716 2769
6425 3315 2639 4208 2881 2533
398 1090 488 2228 710 236
520 350 185 166 105 -
- 30 24 - - -
30 - - - 20 -
95.87 69.55 42.80 60.89 51.32 63.84
83.54 48.18 33.86 38.81 39.79 58.40

362
绍兴市统计年鉴2020
10-27 卫生事业从业人员情况(2019年)
10-28 体育事业发展情况(2019年)
指 标 Item全 市Whole
Municipality
一、卫生技术人员 Medical Technical Personnel 40051
医生 Doctors 16312
#执业医师 Registered Doctor 14359
执业助理医师 Registered Assistant Doctor 1953
注册护士 Registered Nurse 16679
药剂人员 Assistant Pharmacists of Chinese Medicine 2321
检验人员 Assistant Laboratory Technicians 1927
其他 Others 2813
二、每万人拥有卫生技术人员 Number of Medical Technical Personnel per 10 000 Population 89.43
每万人拥有医生 Number of Doctors per 10 000 Population 36.42
指 标 Item全 市Whole
Municipality
县级以上运动会次数 ( 次 ) Number of Sports Meets at County Level (time) 6
参加的运动员人数 ( 人 ) Number of Athletes (person) 46400
举办全民健身活动次数 ( 次 ) Times of Civil Sports Activities (time) 2047
参加人数 (人) Number of Attendees (person) 1342600
等级运动员发展人数 ( 人 ) Number of Athletes in Grades (person) 225
#女 ( 人 ) Female (person) 78
等级裁判员发展人数 ( 人 ) Number of Referees in Grades (person) 108
#女 ( 人 ) Female (person) 32
社会体育指导员发展人数 ( 人 ) Number of Newly Developed Social Sports Instructors (person) 2429
省级及以上的比赛成绩 Achievement at Province and above Level
金牌 ( 枚 ) Number of Gold Medal (piece) 244
银牌 ( 枚 ) Number of Silver Medal (piece) 269
铜牌 ( 枚 ) Number of Copper Medal (piece) 242
体育场 ( 个 ) Stadiums (unit) 41
体育馆 ( 个 ) Gymnasiums (unit) 28
游泳池 ( 个 ) Swimming Pools (unit) 95
#室内 ( 个 ) Indoor (unit) 47
少体校 ( 个 ) Number of Sparetime Sports Schools for Children (unit) 7
在校学生数 ( 人 ) Number of Students Enrollment (person) 2904
专职教练员 ( 人 ) Full-Time Coaches (person) 86
单位:人

363
文化、教育、科技和卫生事业
Persons Engaged in Health Care Institutions (2019)
Basic Statistics on Sport Development (2019)
越城区Yuecheng
District
柯桥区KeqiaoDistrict
上虞区ShangyuDistrict
诸暨市ZhujiCity
嵊州市Shengzhou
City
新昌县XinchangCounty
9565 7130 5203 9974 4650 3529
3764 2945 2133 4280 1882 1308
3531 2657 1872 3561 1620 1118
233 288 261 719 262 190
4240 2931 2067 4054 1894 1493
509 444 313 529 292 234
526 341 243 391 252 174
526 469 447 721 330 320
124.37 103.63 66.76 91.98 64.22 81.37
48.94 42.81 27.37 39.47 25.99 30.16
越城区Yuecheng
District
柯桥区KeqiaoDistrict
上虞区ShangyuDistrict
诸暨市ZhujiCity
嵊州市Shengzhou
City
新昌县XinchangCounty
1 1 1 1 1 1
8100 8000 11000 5000 7800 6500
368 366 327 302 128 303
480000 290000 365000 62800 15800 129000
61 40 23 82 18 1
18 17 11 26 6 -
24 18 15 22 14 15
6 7 3 8 3 5
589 378 520 349 291 302
- - - - - -
- - - - - -
- - - - - -
13 9 6 6 4 3
10 7 3 5 2 1
20 21 16 31 4 3
13 9 9 14 1 1
2 1 1 1 1 1
540 709 880 320 335 120
28 5 13 9 18 13
(person)

364
绍兴市统计年鉴2020
主要统计指标解释
普通高等学校 指按照国家规定的设置标准和审批程序批准举办,通过国家统一招生考试,招收高中毕业
生为主要培养对象,实施高等教育的全日制大学、独立设置的学院和高等专科学校、短期职业大学。
成人高等学校 指按照国家有关规定审批,招收通过全国成人高教统一招生考试的具有高中毕业或同等学
历的在职从业人员利用脱产、半脱产、业余或函授等多种形式对其实施高等学历教育,培养高等教育专科或本科
毕业水平的专门人才,修业年限、课程设置和总学时数均按高等学历教育要求付诸实施的学校。包括广播电视
大学、职工高等学校、农民高等学校、管理干部学院、教育学院、独立设置的函授学院等。
专任教师数 指主要从事教育工作人员数。包括临时(一年以内)调出帮助做其它工作的教学人员。不包括
调离教学岗位、担任行政领导工作或其他工作的原教学人员。
发明 专利法及其实施细则所称的发明是指对有关产品、方法或其改进所提出的新的技术方案。
实用新型 专利法及其实施细则所称的实用新型是指对产品的形状、构造或者其结合所提出的适用实用的
新的技术方案。
外观设计 专利法及其实施细则所称的外观设计是指对产品形状、图案、色彩或者其结合所作出的富有美
感并适于工业上应用的新设计。
电影放映单位 指具有放映机器设备、固定或不固定的放映场所与专职或兼职的放映技术人员,经有关部
门登记批准,经常为一定的观众对象放映电影的机构。
等级运动员人数 指经考核正式批准授予等级运动员称号的人数。运动员等级分为国际级运动健将、运动
健将、一级运动员、二级运动员、三级运动员、少年级运动员。
等级裁判员人数 指经考核正式批准授予等级裁判员称号的人数。裁判员等级分为国际裁判、国家级裁判、
一级裁判、二级裁判、三级裁判。
医院 指名称为医院,设有固定床位能收容病人住院并能为病人提供医疗、护理服务的医疗机构。包括县及
以上医院、其他医院两部分。按所属性质分为卫生部门、工业及其他部门、集体所有制单位 3 类。其中县及以上
医院按业务性质分为综合医院和专科医院。

365
文化、教育、科技和卫生事业
Explanatory Notes on Main Statistical Indicators
Regular Institutions of Higher Learning refer to educational establishments set up
according to the government evaluation and approval procedures, enrolling graduates from senior secondary
schools and providing higher education courses and training for senior professionals. They include full-time
universities, colleges, high professional schools and short-term professional universities.
Institutions of Higher Learning for Adults refer to educational establishments, set up in
line with relevant rules approved by the government, enrolling staff and workers with senior secondary school
or equivalent education , and providing higher education courses in many forms of full time, part time, spare
time, or correspondence for adults. Professionals thus trained receive a qualification equivalent to graduates
studying regular courses at regular universities, colleges and professional colleges. Institutions of higher
learning for adults include Radio and TV universities, schools of high education for staff and workers and
peasants, colleges for management cadres, pedagogical colleges, independent correspondence colleges.
The number of Full-time Teachers refer to the staff mainly work at teaching involved the
staff in teaching fields, temporarily transferred (less than a year), to help doing the other works, exclude the
former teachers transferred from teaching, doing the administrative works or other works.
Inventions refer to the inventions as specified by the patent law and its detailed rules and
regulations for implementation. They refer to the new technical proposals to the products or methods or their
modifications.
Utility Models refer to the utility models as specified by the patent law and its detailed rules and
regulations for implementation. They refer to the practical and new technical proposals on the shape and
structure of the product or the combination of both.
Designs refer to the designs as specified by the patent law and its detailed rules and regulation for
implementation. They refer to the aesthetics and industry applicable new designs for the shape, pattern and
color of the product, or their combinations.
Film Projection Units refer to units with film projection equipment, full or part time
projectionists, permanent or non permanent places, approved by related administrative departments to show
films regularly for certain groups of audience, including those film projection units which have been approved
to give commercial shows and run business with independent accounting system as well as those film-renting
units of the military system.
Number of Athletes in Grades refers to the number of athletes who have been given titles
through examination. The titles of athletes include international masters of sports, masters of sports, first-
grade, second-grade and third-grade sportsmen and young athletes.
Number of Referees in Grades refers to the number of referees who have been given titles after
examination. They are classified as international referees, national referees and referees of the first, second
and third grades.

366
绍兴市统计年鉴2020
Hospitals refer to medical institutions with permanent hospital beds, which are able to take in patients
and provide them with medical and nursing services. Hospitals are classified into three categories: hospitals
at or above the county level, hospitals of rural townships, and other hospitals. According to their ownership,
hospitals can be classified into three categories: hospitals under the public health departments, hospitals under
industrial and other departments and collective-owned hospitals. Hospitals at or above county level are divided
into comprehensive and specialized hospitals.

11其 他CHAPTER 11 OTHERS


369
其 他
11-1 历年个体私营企业基本情况Basic Statistics on Self-Employed Individuals and Private Enterprises over the Years
年 份Year
个 体 工 商 户Self-employed Individuals
私 营 企 业Private Enterprises
户 数( 户 )
Number of Enterprises
(unit)
从业人员( 人 )
Employed Persons(person)
注册资金( 万元 )
Registered Funds
(10 000 yuan)
户 数( 户 )
Number of Enterprises
(unit)
投资者人数( 人 )
Investors(person)
雇工人数( 人 )
Employment Persons(person)
注册资金( 万元 )
Registered Funds
(10 000 yuan)
1993 111975 189401 1752 2817
1994 149969 250527 5227 8054
1995 168094 271978 7107 10971
1996 182241 295972 8502 12800
1997 164237 297482 7724 11507
1998 157279 316749 8295 13357
1999 161550 317823 329507 9385 16151 147673 623648
2000 128368 253816 342855 11246 21847 209255 911816
2001 140423 269295 383865 14561 31744 265444 1443284
2002 146699 282251 416547 18994 39874 342246 2057931
2003 152622 294858 443703 22957 46719 377634 2763774
2004 167708 317427 489694 27977 56220 354194 3436897
2005 177264 338138 534034 30449 61661 381387 4748216
2006 183330 329187 576449 35239 68845 369281 6134353
2007 183273 322538 640175 39955 78817 686031 8425092
2008 200182 340767 706121 44317 85165 848984 10912294
2009 200506 343833 773368 47723 93429 877508 12744532
2010 210921 382928 912896 54614 106949 983527 16702890
2011 222997 419705 1124809 62775 123030 1028793 20606341
2012 234594 455638 1349701 68399 135577 1088006 23658530
2013 236281 467427 1574363 83427 161018 1370299 28220178
2014 265398 606373 1997404 98704 186222 1439174 34239419
2015 306868 704022 2431084 111182 207347 1840101 42037891
2016 335757 802124 2839343 126264 233109 1906687 57608838
2017 368608 765022 3427957 141401 254356 1792522 74648000
2018 388606 826694 3991596 157469 279986 1621516 83140198
2019 424908 1022895 4571343 172756 330384 1857597 91529569

370
绍兴市统计年鉴2020
11-2 个体工商户数及人数(2019年)
指 标 Item全 市Whole
Municipality
一、工商业登记户数 ( 户 ) Number of Self-employed Industry and Commerce Enterprises and Personnel Registered (unit) 424908
#城镇 Urban Area 231013
农村 Rural Area 193895
1. 农林牧渔业 Farming, Forestry, Animal Husbandry and Fishery 7196
2. 采矿业 Mining Industry 19
3. 制造业 Manufacturing Industry 84740
4. 电力、燃气及水的生产和供应业 Production and Supply of Electric Power, Gas and Water 66
5. 建筑业 Construction Industry 3634
6. 交通运输、仓储和邮政业 Traffic, Storage and Mail Business 20228
7. 信息传输、计算机服务和软件业 Information Transfer, Computer Service and Software Industry 1264
8. 批发和零售业 Wholesale and Retail Trade Services 204303
9. 住宿和餐饮业 Accommodation and Food Industry 40293
10. 房地产业 Real Estate Trade 1775
11. 租赁和商务服务业 Leasehold and Business Service Industry 12081
12. 居民服务和其他服务业 Neighborhood Services and Other Service Industry 39995
13. 卫生、社会保障和社会福利业 Sanitation, Social Security and Social Welfare Industry 307
14. 文化、体育和娱乐业 Cultural, Physical and Entertainment Industry 2305
15. 其他行业 Others 6702
二、城乡个体工商从业人数 ( 人 ) Employment of Industry and Commerce Enterprises and Personnel Registered (person) 1022895
#城镇 Urban Area 514548
农村 Rural Area 508347
1. 农林牧渔业 Farming, Forestry, Animal Husbandry and Fishery 27468
2. 采矿业 Mining Industry 61
3. 制造业 Manufacturing Industry 394762
4. 电力、燃气及水的生产和供应业 Production and Supply of Electric Power, Gas and Water 139
5. 建 筑 业 Construction Industry 16499
6. 交通运输、仓储和邮政业 Traffic, Storage and Mail Business 24390
7. 信息传输、计算机服务和软件业 Information Transfer, Computer Service and Software Industry 1953
8. 批发和零售业 Wholesale and Retail Trade Services 310718
9. 住宿和餐饮业 Accommodation and Food Industry 104908
10. 房地产业 Real Estate Trade 2969
11. 租赁和商务服务业 Leasehold and Business Service Industry 25737
12. 居民服务和其他服务业 Neighborhood Services and Other Service Industry 90650
13. 卫生、社会保障和社会福利业 Sanitation, Social Security and Social Welfare Industry 838
14. 文化、体育和娱乐业 Cultural, Physical and Entertainment Industry 8282
15. 其他行业 Others 13521
三、注册资金 ( 万元 ) Registered Capital (10 000 yuan) 4571343

371
其 他
Number of Self-employed Industry and Commerce Enterprises and Personnel (2019)
越城区Yuecheng
District
柯桥区KeqiaoDistrict
上虞区ShangyuDistrict
诸暨市ZhujiCity
嵊州市Shengzhou
City
新昌县XinchangCounty
58626 81682 53393 141934 50178 39095
40912 56726 25984 53154 25527 28710
17714 24956 27409 88780 24651 10385
284 659 988 2305 2008 952
4 1 8 - 2 4
2657 8414 7218 49773 8025 8653
1 - 6 5 39 15
327 134 1108 174 1114 777
3982 7762 4843 1455 1266 920
228 310 166 234 150 176
32542 45032 26743 60751 22523 16712
6394 8225 4375 12573 5082 3644
545 360 522 64 178 106
2897 2070 1937 2076 976 2125
7544 7979 4782 11544 4564 3582
62 13 69 85 53 25
810 333 285 487 229 161
349 390 343 408 3969 1243
106897 152874 129744 425687 122680 85013
74377 104877 55586 159419 62589 57700
32520 47997 74158 266268 60091 27313
778 2026 3556 9076 8254 3778
4 2 29 - 12 14
7817 28798 35558 254978 39533 28078
1 - 19 17 60 42
581 415 5508 641 6040 3314
5239 9198 5349 1786 1654 1164
378 462 264 375 245 229
49616 65410 45827 90018 35649 24198
18697 20896 11876 33729 10914 8796
836 588 911 103 342 189
4066 4085 5098 5147 2137 5204
17298 18493 12509 26477 8895 6978
172 61 179 221 121 84
1006 1324 1030 1896 2075 951
408 1116 2031 1223 6749 1994
528939 782361 670300 1632482 625070 332191

372
绍兴市统计年鉴2020
11-3 私营企业基本情况(2019年)
指 标 Item全 市Whole
Municipality
一、私营企业单位数 ( 家 ) Number of Private Enterprises (unit) 172756
#城镇 Urban Area 105882
农村 Rural Area 66874
1. 农林牧渔业 Farming, Forestry, Animal Husbandry and Fishery 2447
2. 采矿业 Mining Industry 63
3. 制造业 Manufacturing Industry 50355
4. 电力、燃气及水的生产和供应业 Production and Supply of Electric Power, Gas and Water 358
5. 建 筑 业 Construction Industry 9536
6. 交通运输、仓储和邮政业 Traffic, Storage and Mail Business 2945
7. 信息传输、计算机服务和软件业 Information Transfer, Computer Service and Software Industry 3501
8. 批发和零售业 Wholesale and Retail Trade Services 65571
9. 住宿和餐饮业 Accommodation and Food Industry 1540
10. 房地产业 Real Estate Trade 3831
11. 租赁和商务服务业 Leasehold and Business Service Industry 13238
12. 居民服务和其他服务业 Neighborhood Services and Other Service Industry 3126
13. 卫生、社会保障和社会福利业 Sanitation, Social Security and Social Welfare Industry 254
14. 文化、体育和娱乐业 Cultural, Physical and Entertainment Industry 2560
15. 其他行业 Others 13431
二、私营企业投资者人数 ( 人 ) Number of investors in Private Enterprises (person) 330384
#城镇 Urban Area 217777
农村 Rural Area 112607
1. 农林牧渔业 Farming, Forestry, Animal Husbandry and Fishery 4644
2. 采矿业 Mining Industry 157
3. 制造业 Manufacturing Industry 97184
4. 电力、燃气及水的生产和供应业 Production and Supply of Electric Power, Gas and Water 682
5. 建 筑 业 Construction Industry 15441
6. 交通运输、仓储和邮政业 Traffic, Storage and Mail Business 4492
7. 信息传输、计算机服务和软件业 Information Transfer, Computer Service and Software Industry 6736
8. 批发和零售业 Wholesale and Retail Trade Services 120349
9. 住宿和餐饮业 Accommodation and Food Industry 2554
10. 房地产业 Real Estate Trade 6412
11. 租赁和商务服务业 Leasehold and Business Service Industry 31237
12. 居民服务和其他服务业 Neighborhood Services and Other Service Industry 5374
13. 卫生、社会保障和社会福利业 Sanitation, Social Security and Social Welfare Industry 405
14. 文化、体育和娱乐业 Cultural, Physical and Entertainment Industry 4667
15. 其他行业 Others 30050
三、私营企业雇工人数 ( 人 ) Employee of Private Enterprises (person) 1857597
#城镇 Urban Area 878517
农村 Rural Area 979080
四、注册资金 ( 万元 ) Registered Capital (10 000 yuan) 91529569

373
其 他
Number of Private Enterprises and Its Investors (2019)
越城区Yuecheng
District
柯桥区KeqiaoDistrict
上虞区ShangyuDistrict
诸暨市ZhujiCity
嵊州市Shengzhou
City
新昌县XinchangCounty
34113 46639 24164 42176 15747 9917
28428 28854 15588 15426 9324 8262
5685 17785 8576 26750 6423 1655
306 322 376 881 302 260
4 2 13 19 17 8
6077 11008 8200 14794 6826 3450
78 72 54 40 51 63
1848 1219 2267 2435 1177 590
725 639 543 606 259 173
1174 731 639 350 414 193
14299 26177 6812 12297 3602 2384
417 295 257 281 134 156
990 820 478 975 302 266
3476 1976 1885 3853 1147 901
756 514 469 660 408 319
41 47 22 62 60 22
759 526 423 456 184 212
3163 2291 1726 4467 864 920
69539 94200 43636 71535 30788 20686
59286 60135 29735 27964 21098 19559
10253 34065 13901 43571 9690 1127
551 726 725 1523 598 521
15 4 29 45 31 33
13457 22412 15133 25449 13709 7024
112 193 75 53 93 156
3164 2284 3654 3843 1581 915
1140 1025 818 844 372 293
2283 1521 1152 627 778 375
25938 51850 11826 18924 7082 4729
673 517 392 437 214 321
1735 1443 758 1407 586 483
7194 5241 4309 8489 3109 2895
1268 980 773 950 709 694
13 93 33 110 100 56
1336 1051 773 796 332 379
10660 4860 3186 8038 1494 1812
482579 408049 301980 447856 126999 90134
158098 189528 140052 238474 81125 71240
324481 218521 161928 209382 45874 18894
15283738 21005896 17277033 28154919 5368705 4439278

374
绍兴市统计年鉴2020
11-4 环境基本情况(2019年)
指 标 Item全 市Whole
Municipality
一、工业废水排放总量 ( 万吨 ) Volume of Industrial Waste Water Discharged (10 000 tons) 26851.50
直接排入污水处理厂的 Directly Discharged to Waste Treatment Plant 26750.25
二、工业废气排放总量 ( 亿标立方米 ) Volume of Industrial Waste Gas Discharged (100 million cu.m) 2801.84
三、工业二氧化硫排放量 ( 吨 ) Volume of Industrial SO2 Discharged (ton) 7261.85
工业烟(粉)尘排放量 Volume of Industrial Soot(Dust) Discharged 6513.01
工业烟(粉)尘去除量 Volume of Industrial Soot(Dust) Removed 1857552.71
四、一般工业固体废物产生量 ( 万吨 ) Volume of Industrial Solid Wastes Produced (10 000 tons) 389.01
一般工业固体废物综合利用量 Volume of Industrial Solid Wastes Utilized 369.12
一般工业固体废物贮存量 Volume of Industrial Solid Wastes Accumulated 3.88
一般工业固体废物处置量 Volume of Industrial Solid Wastes Treated 19.83
五、工业锅炉 ( 台 ) Industrial Boilers (set) 398
六、工业炉窑 ( 座 ) Industrial Furnaces & Kilns (unit) 428

375
其 他
Environment Protection (2019)
越城区Yuecheng
District
柯桥区KeqiaoDistrict
上虞区ShangyuDistrict
诸暨市ZhujiCity
嵊州市Shengzhou
City
新昌县XinchangCounty
3545.86 16337.81 3609.21 1195.69 1351.13 811.80
3506.54 16318.02 3604.21 1170.94 1339.55 811.00
620.07 916.00 796.00 310.06 84.45 75.25
1655.58 2839.98 1859.10 429.82 391.35 86.03
468.60 2490.07 1022.48 1059.30 719.33 753.22
162395.14 1043164.97 71963.11 520767.93 58229.46 1032.10
42.87 268.02 39.37 18.35 11.24 9.15
33.41 265.51 36.83 14.21 10.11 9.05
0.54 2.73 0.45 0.10 0.05 -
9.47 1.80 2.86 4.47 1.13 0.10
73 110 94 65 21 35
30 62 126 173 18 19
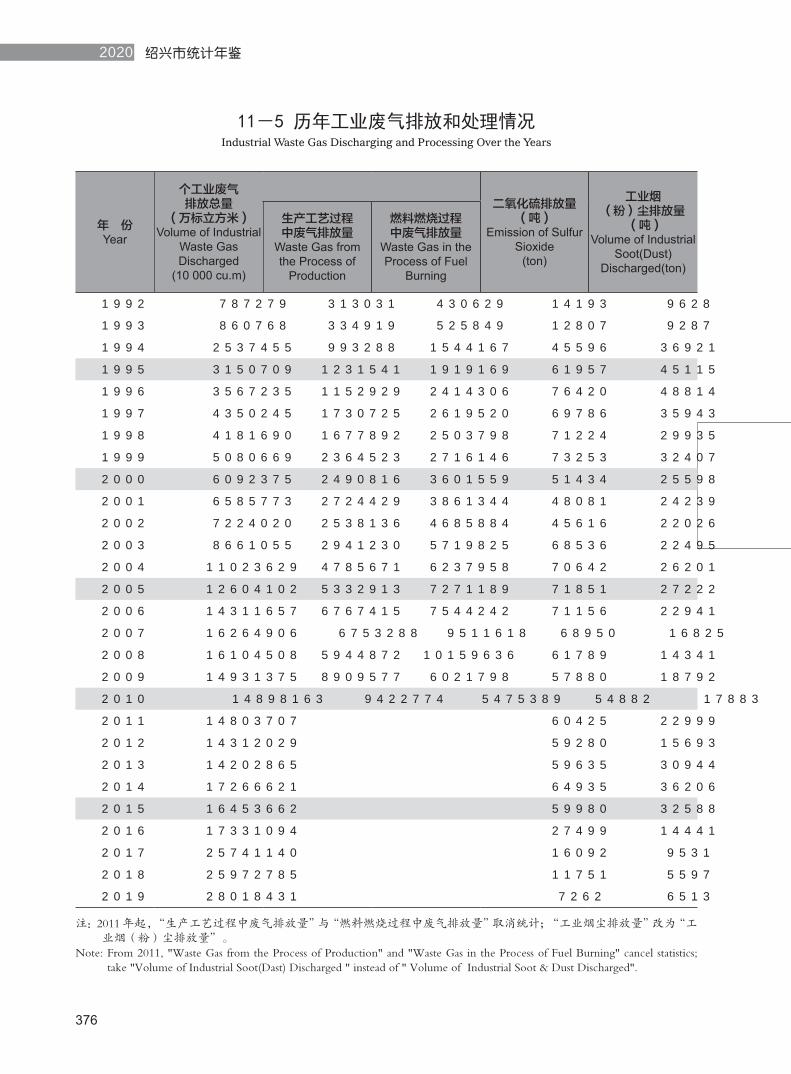
376
绍兴市统计年鉴2020
11-5 历年工业废气排放和处理情况Industrial Waste Gas Discharging and Processing Over the Years
年 份Year
个工业废气排放总量
( 万标立方米 )Volume of Industrial
Waste Gas Discharged
(10 000 cu.m)
二氧化硫排放量( 吨 )
Emission of Sulfur Sioxide
(ton)
工业烟(粉)尘排放量
( 吨 )Volume of Industrial
Soot(Dust)Discharged(ton)
生产工艺过程中废气排放量
Waste Gas from the Process of
Production
燃料燃烧过程中废气排放量
Waste Gas in the Process of Fuel
Burning
1992 787279 313031 430629 14193 9628
1993 860768 334919 525849 12807 9287
1994 2537455 993288 1544167 45596 36921
1995 3150709 1231541 1919169 61957 45115
1996 3567235 1152929 2414306 76420 48814
1997 4350245 1730725 2619520 69786 35943
1998 4181690 1677892 2503798 71224 29935
1999 5080669 2364523 2716146 73253 32407
2000 6092375 2490816 3601559 51434 25598
2001 6585773 2724429 3861344 48081 24239
2002 7224020 2538136 4685884 45616 22026
2003 8661055 2941230 5719825 68536 22495
2004 11023629 4785671 6237958 70642 26201
2005 12604102 5332913 7271189 71851 27222
2006 14311657 6767415 7544242 71156 22941
2007 16264906 6753288 9511618 68950 16825
2008 16104508 5944872 10159636 61789 14341
2009 14931375 8909577 6021798 57880 18792
2010 14898163 9422774 5475389 54882 17883
2011 14803707 - - 60425 22999
2012 14312029 - - 59280 15693
2013 14202865 - - 59635 30944
2014 17266621 - - 64935 36206
2015 16453662 - - 59980 32588
2016 17331094 - - 27499 14441
2017 25741140 - - 16092 9531
2018 25972785 - - 11751 5597
2019 28018431 - - 7262 6513
注:2011 年起,“生产工艺过程中废气排放量”与“燃料燃烧过程中废气排放量”取消统计;“工业烟尘排放量”改为“工业烟(粉)尘排放量”。
Note: From 2011, "Waste Gas from the Process of Production" and "Waste Gas in the Process of Fuel Burning" cancel statistics; take "Volume of Industrial Soot(Dast) Discharged " instead of " Volume of Industrial Soot & Dust Discharged".

377
其 他
11-6 历年工业固体废物排放和处理情况Emission and Treatment of Industrial Solid Wastes Over the Years
年 份Year
产生量 ( 万吨 )Produced Volume
(10 000 tons)
贮存量 ( 万吨 )Accumulated Volume
(10 000 tons)
综合利用量( 万吨 )
Utilized Volume in a Comprehensive Way
(10 000 tons)
综合利用率 (%)Utilized Percentage in a Comprehensive
Way(%)
1992 137.55 78.88 52.86 38.43
1993 141.78 89.17 44.38 31.30
1994 170.48 83.50 75.65 44.37
1995 191.55 75.66 104.42 54.51
1996 212.55 80.22 123.84 58.26
1997 208.53 79.88 118.53 56.84
1998 214.50 83.90 111.00 51.75
1999 203.69 79.15 118.14 58.00
2000 217.62 73.15 139.95 64.31
2001 235.25 77.24 151.76 64.51
2002 258.25 17.92 170.95 66.20
2003 252.18 0.58 174.06 69.02
2004 291.98 0.39 217.49 74.49
2005 285.02 3.09 280.81 98.52
2006 326.77 63.38 239.42 73.28
2007 326.28 2.81 264.36 80.84
2008 327.04 2.30 263.05 80.43
2009 335.22 2.65 271.12 80.88
2010 345.17 2.73 321.52 93.15
2011 352.57 1.20 321.15 91.09
2012 379.83 12.39 349.45 92.00
2013 360.15 3.86 333.84 92.69
2014 359.61 1.65 349.59 97.20
2015 368.62 1.73 357.32 96.90
2016 329.40 1.45 312.11 94.58
2017 383.30 6.46 352.51 91.11
2018 386.72 3.44 365.23 93.39
2019 389.01 3.88 369.12 94.26
注:1.1993 年及以前统计口径为县属及以上企事业单位,1993 年以后为全部企事业单位。2. 2011 年起,“工业粉尘排放和处理情况”取消统计。
Note: a) The statistics of 1993 and earlier were based on county level and higher enterprises, while that of after 1993 has been on the all enterprises. b) From 2011, "Emission and Treatment of Industrial Dust" cancel statistics.

378
绍兴市统计年鉴2020
11-7 历年废水排放和处理情况
年 份Year
废水排放总量( 万吨 )
Waste Water Discharged
(10 000 tons)
工业废水排放达标率(%)
Rate of Industrial Waste Water up to the Discharge Standards
(%)
工业废水排放量Industrial Waste
Water Discharged
符合排放标准的Qualified by
Emission Standard
1992 9729 6529 4357 66.74
1993 9459 6257 4572 73.07
1994 20304 17113 12771 74.63
1995 23418 20126 14522 72.15
1996 18850 14467 76.79
1997 18210 14401 8349 57.90
1998 17712 13212 10425 78.90
1999 17186 12422 10335 83.20
2000 19080 14189 12535 95.29
2001 21622 16582 16004 96.52
2002 22986 17779 17660 99.33
2003 23650 18864 18337 97.21
2004 24508 19678 19076 96.94
2005 26142 20520 20225 98.56
2006 34086 27867 27334 98.09
2007 37286 29043 28416 97.84
2008 38159 28554 28068 98.30
2009 40828 29862 29351 98.29
2010 41704 30230 29744 98.39
2011 53900 33124 - -
2012 51474 30418 - -
2013 48715 27245 - -
2014 48250 26341 - -
2015 49127 26069 - -
2016 46883 24383 - -
2017 46718 25057 - -
2018 46935 24758 - -
2019 49766 26852 - -

379
其 他
Waste Water Discharging and Processing Over the Years
工业废水中有害物质含量Harmful Substance Content in Industrial Waste
六价铬(千克)
Chromium( kg)
砷(千克)Arsenic
( kg)
铅(千克)Aluminum
( kg)
挥发酚(千克)
Volatile Phenol( kg)
氰化物(千克)Cyanide
( kg)
石油类( 吨)
Petroleum Class(ton)
化学需氧量(吨)
Chemical Oxygen Demand
(ton)
509 22 13 1882 5044 78 13981
1208 1 4 2297 1678 87 12510
9167 2 587 17257 4357 113 28945
14560 1 1135 1798 4129 124 34622
9265 6 1171 790 1812 496 39129
1730 22 850 800 1600 416 61628
1680 250 840 590 1920 288 44687
3560 230 840 520 1310 328 42521
1550 210 490 400 1500 263 43173
1190 20 100 460 1350 247 43094
1140 - 90 400 1260 173 44771
1090 - 40 290 1830 171 43910
1940 - 10 280 1740 167 46459
810 - 120 280 90 169 46166
470 - 43 972 789 91 45372
460 - 20 630 780 17 42862
220 - 40 240 190 12 37852
230 - 30 240 110 10 35195
130 - 10 60 30 7 33547
72 - 30 10 56 20 31831
110 11 8 1633 28 13 30881
63 14 35 1515 15 2 28486
234 12 35 1644 3 6 29814
100 12 12 1530 3 8 28561
35 13 26 519 26 3 18961
40 60 70 266 26 8 18800
27 53 75 311 30 13 15109
12 45 81 128 49 6 14758

380
绍兴市统计年鉴2020
11-8 环保税征收及企事业污染治理情况(2019年)
指 标 Item全 市Whole
Municipality
一、交纳环保税单位数 ( 个 ) Environmental Tax Paying Units (unit) 1927
环保税开征额 (万元) Imposition of Environmental Tax (10000 yuan) 3972
二、污染源治理本年完成投资总额 (万元)
Investment Completed in Anti-pollution Projects (10000 yuan) 80690
工业污染源治理投资额 Investment in Industrial Anti-pollution 14743
#治理废水 Treatment of waste water 3047
治理废气 Treatment of Waste Gas 11130
治理固体废物 Treatment of Waste Solid 66
治理噪声 Treatment of Noise Pollution -
治理其他 Treatment of Others 500
新改扩建“三同时”项目环保投资额(完成环保验收项目环保投资)
Environmental Protection Investment in the "Three Simultaneity" Project 65947
三、污染源治理施工项目数 ( 个 ) Projects under Construction Completed (unit) 39
注:交纳环保税单位数口径为 2019 年第四季度环保税申报企业户数。

381
其 他
Imposition and Utilization of Pollution Fees and Pollution Treatment (2019)
越城区Yuecheng
District
柯桥区KeqiaoDistrict
上虞区ShangyuDistrict
诸暨市ZhujiCity
嵊州市Shengzhou
City
新昌县XinchangCounty
184 340 223 712 237 231
358 2501 687 272 89 65
4851 37111 15616 3398 13431 6282
220 40 8154 570 579 5180
40 - 259 60 148 2540
180 40 7895 510 431 2074
- - - - - 66
- - - - - -
- - - - - 500
4631 37071 7463 2828 12852 1102
3 1 9 3 7 16
Note: Caliber of the environmental tax paying units is the enterprises declaring environmental protection tax in the final quarter of 2019.

382
绍兴市统计年鉴2020
11-9 城市公用事业基本情况(2019年)
指 标 Item全 市Whole
Municipality
城市建设 City Construction
建成区面积 ( 平方公里 ) Developed Areas (sq.km) 379.70
人口密度 ( 人 / 平方公里 ) Population Density of Districts (person/sq.km) 1740
城市现状建设用地面积 ( 平方公里 ) Areas of Urban Construction (sq.km) 375.78
供水、供气 Water Supply, Gas Supply
供水总量 ( 万立方米 ) Annual Supply of Water (10 000 cu.m) 54039
#居民家庭用水量 ( 万立方米 ) Water Consumption for Residential Use (10 000 cu.m) 15632
人均日生活用水量 ( 升 ) Daily Water Consumption for Residential Use Per Capita (litre) 226.83
供水普及率 (%) Proportion of Population with Access to Water (%) 100.00
天然气供气总量 ( 万立方米 ) Total Supply of Natural Gas (ton) 131097
#居民家庭 ( 天然气 ) ( 万立方米 ) Consumption of Natural Gas for Residential Use (10000 cu.m) 16990
液化石油气供气总量 (吨) Total Supply of LPG (ton) 93708
# 居民家庭(液化石油气) (吨) Consumption of LPG for Residential Use (ton) 68639
市政工程 Municipal Engineering
道路长度 ( 公里 ) Length of Roads (km) 3062.84
道路面积 ( 万平方米 ) Area of Roads (10 000 sq.m) 5415.06
人均城市道路面积 ( 平方米 ) Per Capita Areas of Paved Roads (sq.m) 21.70
公共交通 Public Traffic
公共汽车数量 ( 辆 ) Public Transportation Vehicles (unit) 3829
出租汽车数量 ( 辆 ) Taxi (unit) 2680
城市绿化 Afforestation in Cities
绿化覆盖面积 ( 公顷 ) Afforestation (hectare) 20701
建成区绿地面积 ( 公顷 ) Green Areas of City Building (hectare) 14120
公园绿地面积 ( 公顷 ) Green Areas of Park (hectare) 3645
人均公园绿地面积 ( 平方米 ) Per Capita Green Areas of Park (sq.m) 14.61
环境卫生 Environmental Sanitation
生活垃圾清运量 ( 万吨 ) Volume of Garbage Disposal (10 000 tons) 139.55
污水处理率 (%) Rate of Disposal of Waste Water (%) 96.58
生活垃圾无害化处理率 (%) Rate of Living Garbage Disposal (%) 100.00

383
其 他
Basic Statistics on Urban Public Utilities (2019)
越城区Yuecheng
District
柯桥区KeqiaoDistrict
上虞区ShangyuDistrict
诸暨市ZhujiCity
嵊州市Shengzhou
City
新昌县XinchangCounty
120.31 77.00 45.00 68.80 41.40 27.19
1877 3098 2339 1256 1469 1136
130.81 74.43 38.58 65.67 40.11 26.18
8704 24811 5989 6964 4104 3467
3654 4117 1800 3097 1560 1403
212.42 240.88 238.95 279.8 186.38 183.71
100.00 100.00 100.00 100.00 100.00 100.00
46863 33171 21066 19944 2311 7742
3657 2188 8521 1650 535 439
35421 18985 10837 11216 11025 6223
19435 13027 9150 10000 10804 6223
546.47 573.87 389.55 914.49 304.69 333.77
1265.71 1345.26 853.17 955.07 561.35 434.50
16.33 27.14 32.86 21.94 17.80 20.24
995 699 618 945 398 174
971 465 310 533 251 150
7157 3671 2025 4025 1816 2007
4434 2913 1698 2430 1494 1151
1259 719 365 576 398 327
16.25 14.51 14.06 13.24 12.64 15.24
41.48 36.06 11.19 12.80 27.86 10.16
98.80 96.56 96.90 95.25 93.71 95.57
100.00 100.00 100.00 100.00 100.00 100.00

384
绍兴市统计年鉴2020
11-10 历年全市档案事业机构、人员、设备情况
年 份Year
全市档案馆个数 ( 个 )Number of Archives (unit)
人员情况 ( 人 )
档案行政管理人员Personnel(person)
1991 7 84
1992 7 82
1993 7 79
1994 7 84
1995 7 87
1996 7 89
1997 7 93
1998 7 96
1999 7 103
2000 7 103
2001 7 105
2002 7 104
2003 7 104
2004 7 104
2005 7 100
2006 7 104
2007 7 109
2008 7 107
2009 7 106
2010 7 107
2011 7 126
2012 7 128
2013 7 120
2014 7 113
2015 6 109
2016 7 115
2017 7 117
2018 7 120
2019 9 128
注:①由于档案馆改扩建后,库房直接接进中央空调,因而空调数量变化较大,1998 年中央空调窗口达 87 只。②全市档案系统局馆合一,参照公务员,行政管理人员不复存在。

385
其 他
Institutions, Persons and Facility of Archives over the Years
设备情况 ( 台 )Facilities(unit)
缩微设备( 阅读器 )
Micro Scale Equipments (readers)
电子计算机Computer
复印机Copy Machine
集中式空调Central Air Conditioner
去湿机Dehumidifier
2 1 7 23
2 3 7 23
2 3 7 1 25
2 5 7 1 26
2 10 7 1 26
2 21 8 3 28
2 23 8 26 28
1 27 10 10 28
3 48 11 10 31
2 25 12 3 27
2 7 13 3 35
2 14 12 3 35
2 53 13 4 36
2 60 14 4 36
2 89 14 4 42
2 170 15 5 44
2 191 15 5 59
2 295 21 5 47
2 269 21 5 57
2 253 22 5 63
2 275 23 5 54
2 262 18 4 51
2 261 22 10 46
2 285 19 14 36
3 315 16 35 43
1 467 15 37 67
0 402 21 37 67
84 83 台服务器 9 套湿度控制系统
85 91 台服务器 9 套湿度控制系统
Note: a) After the expansion of the archive building, central air conditioning was directly connected to each rooms, therefore there is a considerable change in the number of air conditioners. In 1998, there were 87 central AC windows. b) The archive bureau was combined with the administration, referring to civil servant system. The administrative personnel do not exist any more.

386
绍兴市统计年鉴2020
11-11 历年档案馆档案资料馆藏和利用情况
年 份Year
馆藏档案Archives Stored
馆藏资料册数( 册 )
Number of Material Stored
(volume)
档案馆面积( 平方米 )Areas of Archives(sq.m)
全 宗( 个 )Whole Volume(unit)
案 卷( 卷 / 件 )
File(volume/roll)
录音、录像影片 ( 盘 )Records,Films on
Videotape(copy)
照 片( 张 )
Pictures(piece)
#库房面积Areas of
Storerooms
1992 1214 301982 152 15575 59787 7638 5133
1993 1279 324043 170 14025 62455 10211 6278
1994 1353 356392 206 16252 64296 10211 6278
1995 1403 382508 224 19391 65409 11282 6365
1996 1450 404428 233 21485 67281 10511 6687
1997 1492 432233 267 25734 72541 10511 6687
1998 1501 450215 312 25915 74397 10511 6687
1999 1521 455434 324 25949 75331 10573 6376
2000 1568 506767 390 30426 77490 10573 6135
2001 1566 564054 425 37470 90085 10573 6135
2002 1591 608570 578 43306 92175 10573 6135
2003 1634 643860 715 47338 94512 10763 6261
2004 1659 694972 751 69611 95953 10762 6261
2005 1680 765861 769 73213 97680 11117 6616
2006 1697 819712 858 101924 100466 23248 10727
2007 1715 1213516 873 111385 101749 23348 11237
2008 1735 1351583 892 122506 103392 42542 14803
2009 1802 1228677 951 175812 103715 42742 14848
2010 1861 1277006 966 178485 106000 43242 15003
2011 1881 1333874 996 186877 109357 43242 15003
2012 1894 1420906 2872 190677 110546 41180 14923
2013 1927 1550153 3121 197968 112494 55245 19454
2014 1950 1718511 3465 216127 115402 83190 25508
2015 1977 1732647 5088 214945 112029 89785 24715
2016 2058 2138962 5088 236435 113118 85791 27308
2017 2062 2231493 5814 242850 118758 86071 26908
2018 2103 2473463 6776 252824 121066 86071 25907
2019 2129 3224648/3093674 10203 198410 123806 104353 38281
注:2012 年起,馆藏档案口径发生变化,新增市直档案室的数据。

387
其 他
File-stored and Used in the Archives Over the Years
档案利用人次( 人次 )
Number of Persons Using
Archives(person-time)
档案利用数( 卷次 )
Number of Archives
(volume-time)
资料利用人次( 人次 )
Number of Persons
Using Material(person-time)
资料利用数( 册次 )
Number ofMaterial Used(volume-time)
复制档案资料( 页 )
Copies(page)
开放档案Opening Archives
全 宗( 个 )WholeVolume(unit)
案 卷( 卷 )Files
(volume)
10048 26730 1190 2499 88450 726 66621
5064 17024 896 2241 41950 719 66621
3087 7173 216 828 36153 762 77884
3252 8994 255 642 32609 810 93144
3611 10965 215 577 62699 878 98006
3259 6775 208 411 53494 887 129887
3464 7912 132 706 41761 985 133315
3835 8913 245 686 937 121334
4446 8286 177 598 15322 1042 106213
6349 13996 165 448 23836 1023 97223
6414 15153 178 795 27741 1071 107626
8327 16966 175 967 41191 1107 111850
8945 34105 588 2941 59605 1074 86478
11333 57050 368 3879 82248 1164 118163
11334 35654 316 1795 322519 1164 118163
15287 32096 920 3085 61266 1167 119612
17926 27515 737 2361 87841 1212 120416
25964 53946 1148 3188 122426 1138 121533
28160 33815 482 2006 155840 1151 127941
67697 128478 1015 3155 139132 1175 27678
69653 212852 3622 14468 - 1175 139572
82940 118816 3457 14057 31499 1175 82940
92070 150681 661 1903 132637 1290 177730
82481 220508 924 2469 149974 1291 199742
83920 85226 1836 24833 145625 1408 206419
80262 75801 642 1568 20204 1460 465031
62635 124722 509 1933 - 1460 202600
60297 130506 649 2618 - - 396208
Note: The caliber of collection archives has been changed and the data of municipal archives have been added since 2012.

388
绍兴市统计年鉴2020
11-12 历年计划生育率Rate of Birth under Control over the Years
年 份Year
全 市Whole
Municipality
越城区Yuecheng
District
柯桥区Keqiao District
上虞区Shangyu District
诸暨市ZhujiCity
嵊州市Shengzhou
City
新昌县Xinchang County
1983 82.08 96.33 94.76 89.39 80.67 73.89 60.99
1984 85.34 98.61 98.16 95.28 86.99 81.77 61.32
1985 89.65 97.37 98.43 95.95 93.38 88.95 66.14
1986 91.75 87.24 98.81 97.46 93.08 91.06 69.57
1987 93.84 95.54 99.16 98.39 94.68 92.58 68.28
1988 96.65 98.13 99.49 99.33 96.49 96.50 82.26
1989 97.45 99.15 99.56 99.52 95.84 97.18 90.07
1990 98.14 98.72 99.71 99.54 97.16 97.83 94.04
1991 97.33 98.77 98.86 96.02 97.35 97.05 95.21
1992 97.03 99.50 99.37 97.81 96.06 94.63 94.56
1993 97.26 99.67 98.54 97.15 96.09 96.13 96.65
1994 98.73 99.79 99.31 98.73 98.32 98.39 98.02
1995 98.88 99.63 99.49 98.23 98.94 98.23 98.73
1996 98.72 99.82 99.51 97.13 99.04 98.40 98.75
1997 99.47 99.64 99.74 99.50 99.52 99.09 98.93
1998 98.92 99.88 99.25 99.47 99.34 97.44 98.13
1999 99.50 98.83 99.75 99.54 99.40 99.48 98.82
2000 97.88 99.50 98.67 99.00 98.22 95.67 95.77
2001 99.06 99.82 99.62 99.10 99.03 98.38 98.00
2002 99.14 99.81 99.76 98.98 99.07 98.79 98.37
2003 98.97 99.89 99.81 99.02 98.58 98.50 98.20
2004 98.50 99.86 99.47 98.08 97.95 98.34 97.43
2005 98.31 99.55 99.58 98.25 97.71 98.07 96.64
2006 98.02 99.60 99.35 97.31 97.89 98.05 95.83
2007 97.54 98.87 98.86 96.86 97.11 97.78 95.83
2008 97.43 99.10 98.71 95.67 97.56 97.80 95.45
2009 97.49 99.12 98.86 96.97 96.98 96.81 96.11
2010 96.93 98.60 97.51 95.85 97.20 97.49 94.21
2011 97.20 98.25 98.62 96.89 96.49 97.30 95.64
2012 96.53 98.13 97.74 95.18 97.32 95.86 94.01
2013 96.35 97.85 98.08 95.87 96.36 95.09 94.17
2014 96.13 97.24 97.87 96.31 96.04 94.20 93.86
2015 95.66 97.76 96.66 97.41 94.9 93.99 92.43
2016 98.00 98.54 98.33 98.78 97.35 97.13 98.21
2017 98.21 98.48 98.75 99.10 97.42 97.71 98.04
2018 97.64 98.59 97.68 98.69 96.86 97.10 97.19
2019 97.69 98.84 98.12 98.86 96.35 97.10 97.21
单位:% %

389
其 他
11-13 历年已婚育龄妇女生育率Birth Rate of Married Woman at Child-bearing Age over the Years
年 份Year
全 市Whole
Municipality
越城区Yuecheng
District
柯桥区Keqiao District
上虞区Shangyu District
诸暨市ZhujiCity
嵊州市Shengzhou
City
新昌县Xinchang County
1983 8.02 9.51 7.09 7.27 7.63 8.11 11.50
1984 6.07 6.48 4.47 4.08 6.69 6.92 10.07
1985 6.07 7.12 5.28 5.04 5.89 6.29 9.16
1986 7.58 7.43 7.76 7.69 7.21 6.82 9.32
1987 9.01 8.68 9.68 10.96 8.09 7.51 8.87
1988 7.35 6.80 7.93 7.60 7.65 6.53 6.56
1989 7.37 7.44 8.12 7.50 7.18 7.03 6.30
1990 6.59 5.94 6.86 6.41 6.65 6.79 6.21
1991 5.99 5.87 6.62 6.42 5.57 5.58 5.51
1992 5.40 4.34 5.64 5.71 5.34 5.29 5.25
1993 5.80 5.43 6.87 6.26 5.18 5.29 5.02
1994 5.42 4.46 6.08 5.56 5.60 4.84 4.72
1995 5.94 5.49 6.84 6.22 5.99 5.00 4.95
1996 5.20 4.28 5.43 5.15 5.57 4.92 4.88
1997 5.01 5.44 5.50 4.89 5.08 4.33 4.69
1998 4.04 3.70 3.97 3.62 4.37 4.19 4.16
1999 4.18 4.42 4.52 3.97 4.08 3.88 4.42
2000 4.10 3.80 4.00 3.68 4.39 4.29 4.39
2001 4.02 4.24 4.32 3.76 4.06 3.87 3.85
2002 3.99 3.99 3.86 3.45 4.14 4.18 4.52
2003 3.37 3.36 3.23 3.28 3.16 3.40 4.30
2004 4.14 4.10 4.26 3.42 4.30 4.13 4.99
2005 3.86 3.82 4.03 3.27 3.96 3.89 4.44
2006 3.27 2.92 3.10 2.91 3.51 3.35 3.92
2007 3.46 3.50 3.21 2.97 3.73 3.42 4.06
2008 3.12 2.85 2.82 2.65 3.55 3.26 3.52
2009 3.18 3.48 3.19 2.68 3.34 3.09 3.45
2010 3.02 2.96 2.82 2.64 3.29 3.03 3.42
2011 3.34 3.50 3.23 2.78 3.45 3.30 3.98
2012 3.54 3.44 3.18 3.13 3.91 3.70 3.84
2013 3.35 3.70 3.32 2.93 3.54 3.24 3.33
2014 4.61 4.88 5.06 4.12 4.85 4.19 4.50
2015 3.65 3.57 3.82 3.44 3.56 3.75 3.77
2016 5.24 5.52 5.85 4.72 5.53 4.72 4.95
2017 5.17 5.57 5.85 4.70 5.41 4.42 5.00
2018 4.33 4.26 4.74 3.95 4.58 4.05 4.34
2019 4.56 4.64 5.47 4.29 4.68 3.88 4.40
单位:% %

390
绍兴市统计年鉴2020
11-14 社会福利事业单位基本情况(2019年)
11-15 城市最低生活保障及农村最低生活保障情况(2019年)
指 标 Item全 市Whole
Municipality
一、机构数 ( 个 ) Number of Institutions (unit)
1. 养老机构 Endowment Institutions 202
(1)公办养老机构 Public Endowment Institutions 10
(2)民办养老机构 Private Endowment Institutions 111
(3)乡镇(街道)敬老院 Geracomium in Town(Subdistrict) 81
2. 光荣院 Homes for the Disabled Veterans -
3. 儿童福利院 Children's Welfare Institute 1
二、收养人数 ( 人 ) Number of Persons Adopted (person)
1. 养老机构 Endowment Institutions 10146
2. 光荣院 Homes for the Disabled Veterans -
3. 儿童福利院 Children's Welfare Institute 45
三、床位数 ( 张 ) Number of Beds (unit)
1. 养老机构 Endowment Institutions 49135
(1)公办养老机构 Public Endowment Institutions 8328
(2)民办养老机构 Private Endowment Institutions 25672
(3)乡镇(街道)敬老院 Geracomium in Town(Subdistrict) 15135
2. 光荣院 Homes for the Disabled Veterans -
四、街道办事处个数 (个) Number of Subdistrict Offices (unit) 47
五、城市社区综合服务设施覆盖率 (%)
Coverage Rate of Urban Community Integrated Service Facilities (%) 100
指 标 Item全 市Whole
Municipality
一、城镇居民最低生活保障情况 Receiving Lowest Cost-of-living in Urban Area
保障对象期末人数 (人) Number of Persons Receiving Lowest Cost-of-living in Urban Area (person) 5267
保障资金投入总额 ( 万元 ) Funds for Persons Receiving Lowest Cost-of-living in Urban Area (10 000 yuan) 4817.60
二、农村居民最低生活保障情况 Receiving Lowest Cost-of-living in Rural Area
保障对象期末人数 ( 人 ) Number of Persons Receiving Lowest Cost-of-living in Rural Area (person) 34382
保障资金投入总额 ( 万元 ) Funds for Persons Receiving Lowest Cost-of-living in Rural Area (10 000 yuan) 28166.80

391
其 他
Basic Statistics on Social Welfare Units (2019)
Urban and Rural Lowest Living Ensure Insurance (2019)
越城区Yuecheng
District
柯桥区KeqiaoDistrict
上虞区ShangyuDistrict
诸暨市ZhujiCity
嵊州市Shengzhou
City
新昌县XinchangCounty
35 14 28 49 66 10
2 1 2 2 1 2
22 2 11 20 48 8
11 11 15 27 17 -
- - - - - -
- - - - - -
1100 682 1401 2388 2642 1933
- - - - - -
- - - - - -
7843 7342 8703 11790 8458 4999
2146 3008 450 600 583 1541
4575 240 5576 5885 5938 3458
1122 4094 2677 5305 1937 -
- - - - - -
15 11 8 5 4 4
100 100 100 100 100 100
越城区Yuecheng
District
柯桥区KeqiaoDistrict
上虞区ShangyuDistrict
诸暨市ZhujiCity
嵊州市Shengzhou
City
新昌县XinchangCounty
1585 1559 1189 334 386 214
1652.80 1406.20 958.60 286.40 357.80 155.80
1658 3135 6668 10517 7256 5148
1733.30 2842.80 5558.40 8896.70 5283.90 3851.70

392
绍兴市统计年鉴2020
11-16 享受国家优抚、补助及救济情况(2019年)
指 标 Item全 市Whole
Municipality
一、革命伤残军人员优抚人数 Number of Persons 2240
二、享受定期补助优抚对象 Number of persons Receiving Periodical and Fixed Subsidies 38291
#在乡复员军人 Demobilized Servicemen in Rural Area 1038
带病回乡退伍军人 Sick Veterans in Rural Area 1368
三、临时救济户数 Number of Households Receiving Temporary Almsgiving 4206
单位:人
11-17 婚姻登记情况(2019年)
指 标 Item全 市Whole
Municipality
一、内地准予登记结婚对数 (对) Registered Marriages of Mainland (couple) 22435
#初婚人数 (人) First Marriages (person) 33379
再婚人数 (人) Remarriages (person) 8014
再婚中:男性 ( 人 ) In Remarriages: Male (person) 3635
女性 ( 人 ) Female (person) 4379
二、登记离婚对数 ( 对 ) Registered Divorces (couple) 10099
三、涉外及华侨、港澳台胞婚姻 Registered Marriages with Foreigner Overseas Chinese and the Citizen of Hongkong, Macao, Taiwan
准予登记结婚对数 (对) Number of Registered Marriages Allowed (couple) 58
#内地居民 Domestic Residents 58
香港居民 Hong Kong Residents 3
澳门居民 Macao Residents -
台湾居民 Taiwan Residents 11
华侨 Overseas Chinese -
外国人 Foreigners 44

393
其 他
Enjoying Subsidy, Commiseration and Relief of Country (2019)
越城区Yuecheng
District
柯桥区KeqiaoDistrict
上虞区ShangyuDistrict
诸暨市ZhujiCity
嵊州市Shengzhou
City
新昌县XinchangCounty
470 246 341 586 354 243
5594 5850 6511 9466 7089 3781
107 140 182 282 181 146
200 119 240 452 239 118
218 951 938 399 989 711
(person)
Basic Statistics on Marriage Registration (2019)
越城区Yuecheng
District
柯桥区KeqiaoDistrict
上虞区ShangyuDistrict
诸暨市ZhujiCity
嵊州市Shengzhou
City
新昌县XinchangCounty
3256 2917 3629 5875 4105 2653
4673 4515 5295 9065 6017 3814
1193 851 1314 1955 1639 1062
600 426 598 917 688 406
593 425 716 1038 951 656
1644 1337 1605 2459 1943 1111
7 4 7 19 16 5
7 4 7 19 16 5
- - - - - -
- - - - - -
- - - - - -
- - - - - -
- - - - - -

394
绍兴市统计年鉴2020
11-18 广播、电视机构情况(2019年)
指 标 Item全 市Whole
Municipality
广播电视台 Number of Broadcasting and Television Stations 6
广播发射台及转播台 Number of Radio Broadcasting Stations and Relay Stations 10
调频广播发射台 Number of FM Broadcast Transmission Stations 6
乡 ( 镇 ) 广播站 Number of Broadcasting Stations by Township 97
卫星电视地面站 Number of Satellite-TV Stations 4
单位:座
11-19 广播、电视发射设备情况(2019年)
指 标 Item全 市Whole
Municipality
一、广播电视发射设备 ( 部 ) Transmission Facilities of Broadcasting and Television (unit)
调频广播 FM Broadcasting 14
电视广播 Television Broadcasting 24
二、广播电视发射功率 (千瓦) Power of Transmission (kilowatt)
调频广播 FM Broadcasting 18.6
电视广播 Television Broadcasting 16.4

395
其 他
Institutions of Broadcasting and Television (2019)
越城区Yuecheng
District
柯桥区KeqiaoDistrict
上虞区ShangyuDistrict
诸暨市ZhujiCity
嵊州市Shengzhou
City
新昌县XinchangCounty
1 1 1 1 1 1
- 1 1 6 1 1
1 1 1 1 1 1
6 14 21 23 21 12
- - 3 - 1 -
(person)
Transmission Facilities of Broadcasting and Television (2019)
越城区Yuecheng
District
柯桥区KeqiaoDistrict
上虞区ShangyuDistrict
诸暨市ZhujiCity
嵊州市Shengzhou
City
新昌县XinchangCounty
3 2 2 2 4 1
1 1 5 7 5 5
9.0 1.0 1.3 1.0 3.3 3.0
3.0 0.5 3.6 1.4 2.9 5.0

396
绍兴市统计年鉴2020
11-21 广播、电视制作情况(2019年)
指 标 Item全 市Whole
Municipality
广播电台全年播出时间 Broadcasting Hours Per Year 52453
广播节目全年制作量 Production of Broadcasting Programs Per Year 40629
电视台全年播出时间 Television Hours Per Year 49490
# 自办节目 Self-producing Programs 19710
电视节目全年制作量 Production of TV Programs Per Year 8681
广播节目播出套数 ( 套 ) Sets of Broadcasting Programs (set) 8
电视节目播出套数 ( 套 ) Sets of Television Programs (set) 8
单位:小时
11-20 有线广播基本情况(2019年)
指 标 Item全 市Whole
Municipality
通广播电视的乡 ( 镇 ) ( 个 ) Number of Township Having Broadcast and Television (unit) 62
通广播电视的街道 ( 个) Number of Subdistrict Having Broadcast and Television (unit) 46
通广播电视的村 ( 个 ) Number of Village Having Broadcast and Television (unit) 1707
有线数字电视用户数 (万户) Number of Digital Cable TV Users (10 000 units) 145.02

397
其 他
Production of Broadcasting, Television Programs (2019)
越城区Yuecheng
District
柯桥区KeqiaoDistrict
上虞区ShangyuDistrict
诸暨市ZhujiCity
嵊州市Shengzhou
City
新昌县XinchangCounty
20729 6753 6570 6500 6205 5696
17795 6570 5160 2780 5425 2899
19252 5686 5747 5840 6205 6760
9102 1806 1458 2780 1564 3000
5049 520 278 715 1564 555
3 1 1 1 1 1
3 1 1 1 1 1
(hour)
Basic Statistics on Wire-broadcasting (2019)
越城区Yuecheng
District
柯桥区KeqiaoDistrict
上虞区ShangyuDistrict
诸暨市ZhujiCity
嵊州市Shengzhou
City
新昌县XinchangCounty
1 5 15 18 15 8
16 11 6 5 4 4
235 214 335 398 241 284
23.45 36.93 21.07 24.90 23.82 14.85

398
绍兴市统计年鉴2020
11-22 质量技术监督基本情况(2019年)
指 标 Item全 市Whole
Municipality
质量技术监督行政部门和技术机构( 个 )
Number of Administrative Departments and Institutions Engaged in Quality Supervising (unit) 18
已建社会公用计量标准 ( 项 ) Social Public Measurement Standard Established at Province Level(kind) 319
已开展强制检定 ( 项 ) Has Developed Quantity Checked by Measurement (kind) 22
工作计量器具 ( 种 ) Implement Tested Compulsively (kind) 25
企业标准备案 ( 个 ) Enterprise Standard Documentation (unit) 3867
产品质量监督检验受检企业数 ( 个 ) Number of Enterprises Passed Quality Check (unit) 2459
查出不合格产品企业 ( 个 ) Enterprises with Products Unqualified (unit) 71
不合格产品企业所占比例 (%) Proportion of Enterprises with Products Unqualified (%) 2.89
产品质量监督检验批次 ( 批次 ) Inspection Batches (batch) 2947
产品质量监督检验合格批次 ( 批次 ) Batch up to Standard (batch) 2874
平均合格率 (%) Average Qualification Rate (%) 97.52
与上年平均合格率对比 (±) ( 百分点 ) Comparison with the Average Qualification Rate of Previous Year (one per-centage point) -0.01
年末职工总数 ( 人 ) Number of Year-end Staff and Workers (person) 1864
现有行政执法人员 ( 人 ) Administration Executive Personnel Currently in Service (person) 111
受理行政案件 ( 件 ) Administrative Cases Accepted (unit) 299
结案案件 ( 件 ) Number of Cases Settled (unit) 297
法院强制执行案件 ( 件 ) Court Coercive Execution Cases (unit) 3
罚没金额 ( 万元 ) Income of Fine (10 000 yuan) 498.24
情报资料 ( 册 ) Intelligence Document (volume) 261
1. 国内标准 ( 册 ) Domestic Standard (volume) 221
2. 国外标准 ( 册 ) Foreign Standard (volume) 40

399
其 他
Basic Statistics on Quality Technological Supervising (2019)
越城区Yuecheng
District
柯桥区KeqiaoDistrict
上虞区ShangyuDistrict
诸暨市ZhujiCity
嵊州市Shengzhou
City
新昌县XinchangCounty
1 4 2 1 2 2
- 22 40 18 32 27
- 7 8 8 8 5
- 8 9 9 9 6
457 852 1580 391 235 352
346 380 524 564 436 209
8 3 10 27 18 5
2.31 0.79 1.91 4.79 4.13 2.39
477 424 619 662 504 247
469 420 608 635 486 242
98.32 99.06 98.22 95.92 96.43 97.98
0.48 1.43 0.95 -0.82 -0.80 0.14
308 330 33 384 266 186
13 11 25 17 17 28
- 1 72 138 42 40
- 1 72 138 42 40
- - - 1 - 2
- 6.00 51.86 184.47 176.15 48.86
48 60 63 33 22 30
47 32 60 33 19 25
1 28 3 - 3 5

400
绍兴市统计年鉴2020
11-23 历年质量技术监督经费和固定资产总额Funds and Fix Asset Investment of Quality Technological Supervising over the Years
单位 : 万元 (10 000 yuan)
年 份Year
财政拨款Financial
Allocations
固定资产总额
Total Valueof Fixed Assets
市级机构City
Level
县级机构CountyLevel
市级固定资产
CityLevel
县级固定资产County Level
#仪器设备Instruments and
Equipments
#仪器设备Instruments and
Equipments
1992 80.30 37.64 42.66 609.50 399.05 89.23 210.45 80.04
1995 166.28 59.73 106.55 823.74 522.81 237.96 300.93 143.88
2000 329.16 130.70 198.46 2402.19 1237.14 741.60 1165.05 393.01
2001 748.49 248.26 500.23 2892.17 1350.93 571.75 1541.24 514.14
2002 1137.24 308.15 829.09 3469.77 1466.21 445.21 2003.56 696.92
2003 1286.63 423.42 863.21 3829.44 1655.89 787.85 2173.55 707.66
2004 2900 1069 1831 4323 2025 1042 2298 760
2005 3909 1192 2717 4938 2257 1300 2681 1085
2006 5046 2204 2842 11680 8397 2247 3283 1581
2007 4740 1721 3019 12714 9195 2872 3519 1868
2008 4993 1821 3172 18440 9781 2927 8659 2087
2009 4737 1750 2987 22398 12023 3935 10375 2594
2010 5841 2352 3489 23673 13062 4446 10611 2822
2011 10323 5420 4903 24857 13825 5151 11032 3305
2012 16748 9078 7670 28032 14792 6037 13239 4031
2013 17084 13386 3698 29236 21994 8525 7242 2465
2014 16710 13314 3396 29472 22293 8448 7179 2585
2015 24812 20251 4561 33510 25991 9904 7519 1580
2016 20038 9632 10406 35030 18574 9202 16457 4104
2017 23521 13944 9577 30057 19131 9670 10926 3284
2018 17202 5196 12006 33796 19402 9705 14394 1953
2019 870 13187 7729
注:因机构合并数据无法统计,2019 年全市及市级相关数据暂缺。Note: The data cannot be counted due to the merger of institutions, which leads to the temporary lack of relevant data of the
whole city and the municipal level in 2019.

401
其 他
11-24 历年绍兴市接待游客情况Basic Statistics on Reception of Tourists of Shaoxing Municipality over the Years
年 份Year
国际游客接待量( 万人 )
Number of International
Tourist(10 000 persons)
国内游客接待量
( 万人次 )Number of
Domestic Tourist(10 000 person-
times)
旅游外汇收入
( 万美元 )International
Tourism Receipt
(USD 10 000)
国内旅游收入
( 亿元 )Domestic Tourism Receipt
(100 million yuan)
#外国人Foreigner
#华侨、港、澳、台胞
Oversea Chinese,Compatriots from
Hong Kong, Macao and Taiwan
1980 0.42 0.36 0.05
1985 0.47 0.37 0.10
1986 0.54 0.43 0.11
1987 0.58 0.52 0.06
1988 0.50 0.42 0.08
1989 0.36 0.26 0.10
1990 0.80 0.51 0.29
1991 1.22 0.62 0.60
1992 1.49 1.07 0.42 150 295
1993 1.84 1.25 0.59 217 328
1994 2.21 1.68 0.53 250 732 1.30
1995 2.71 1.68 1.03 318 1232 15.75
1996 3.21 2.12 1.09 360 1540 17.99
1997 3.47 1.68 1.79 410 1495 23.32
1998 3.61 2.07 1.54 476 1557 35.25
1999 3.95 2.36 1.59 603 1721 45.23
2000 4.80 3.23 1.57 729 2108 54.65
2001 5.96 3.81 2.15 841 2360 63.26
2002 10.07 6.24 3.83 1007 3569 75.50
2003 8.68 5.86 2.82 1028 3458 77.05
2004 15.34 10.93 4.42 1121 5357 90.75
2005 20.19 14.32 5.87 1503 6679 110.58
2006 28.03 19.47 8.56 1808 8889 140.08
2007 36.09 24.19 11.90 2192 12063 177.36
2008 39.88 26.59 13.29 2435 13644 204.14
2009 43.17 27.02 16.15 2851 14818 242.25
2010 52.28 32.97 19.31 3436 18478 305.84
2011 60.35 37.56 22.79 4128 22010 399.60
2012 68.68 41.69 26.99 4866 24128 491.11
2013 69.63 43.33 26.30 5614 24386 569.25
2014 70.21 42.12 28.10 6255 24971 636.73
2015 73.48 43.31 30.17 7202 26327 746.12
2016 82.47 48.19 34.28 8288 29825 871.14
2017 89.13 51.52 37.61 9541 31934 1006.61
2018 14.72 11.21 3.52 10879 6798 1179.42
2019 15.25 12.94 2.31 11473 7360 1301.78
注:2018 年开始,接待国际游客统计口径调整为入境过夜游客,下同。Note: The caliber on reception of international tourists is changed to inbound overnight tourists from 2018, similarly hereinafter.

402
绍兴市统计年鉴2020
11-25 历年分区、县(市)国内游客人数Number of Domestic Tourists by Each District and County (City) over the years
年 份Year
全 市Whole
Municipality
越城区Yuecheng
District
柯桥区Keqiao District
上虞区Shangyu District
诸暨市ZhujiCity
嵊州市Shengzhou
City
新昌县Xinchang County
2000 729 286 162 56 110 33 80
2001 841 329 173 65 125 37 111
2002 1007 386 191 64 152 72 142
2003 1028 394 200 74 159 79 145
2004 1211 457 231 101 184 106 175
2005 1503 533 287 138 222 140 213
2006 1808 612 348 168 262 168 250
2007 2192 739 446 210 365 209 305
2008 2435 813 502 248 422 235 348
2009 2851 945 585 290 527 275 408
2010 3436 1135 702 356 648 330 493
2011 4128 1356 838 449 798 400 578
2012 4866 1566 965 564 991 461 675
2013 5614 1746 1285 720 1292 629 794
2014 6255 1939 1385 847 1490 756 899
2015 7202 2241 1490 1022 1724 870 1022
2016 8288 2290 1792 1199 1990 1036 1178
2017 9541 2318 2108 1478 2255 1194 1388
2018 10879 2372 2451 1796 2474 1383 1606
2019 11473 1824 2896 2086 2722 1592 1815
单位 : 万人次 (10 000 person-times)

403
其 他
11-26 历年分区、县(市)海外游客人数Number of Overseas Tourists by Each District and County (City) over the years
年 份Year
全 市Whole
Municipality
越城区Yuecheng
District
柯桥区Keqiao District
上虞区Shangyu District
诸暨市ZhujiCity
嵊州市Shengzhou
City
新昌县Xinchang County
2000 48038 19001 16577 778 7396 1427 2859
2001 59582 24902 19354 1219 9407 1499 3201
2002 100716 34014 29202 4757 20422 6221 6100
2003 86766 27139 30496 3846 14161 6580 4544
2004 153446 54987 50813 7180 20072 10293 10101
2005 201933 68490 64502 13010 26130 15021 14780
2006 280282 95381 88675 18018 36509 21013 20652
2007 360915 120559 112996 24500 47206 28053 27601
2008 398811 121387 129800 28931 54689 32200 31802
2009 431713 126212 139921 31260 64414 34935 34971
2010 522841 161256 162059 38562 75223 41046 44695
2011 603505 183092 181952 47996 85149 52404 52912
2012 686757 207281 202026 59000 97393 60270 60787
2013 696310 195428 207783 62000 102295 66081 62723
2014 702142 185695 205111 67000 108148 70645 65543
2015 734785 193515 215333 70400 113505 73594 68438
2016 824744 207564 261293 77500 123668 79076 75643
2017 891332 226584 275310 86233 136337 84027 82841
2018 147224 13104 60260 11446 13554 5763 7542
2019 152474 15091 61082 9698 12848 3790 7020
单位 : 人次 (person-times)

404
绍兴市统计年鉴2020
11-27 历年分区、县(市)国内旅游收入Domestic Tourism Revenue by Each District and County (City) over the years
年 份Year
全 市Whole
Municipality
越城区Yuecheng
District
柯桥区Keqiao District
上虞区Shangyu District
诸暨市ZhujiCity
嵊州市Shengzhou
City
新昌县Xinchang County
2000 54.65 20.95 12.00 3.20 9.40 3.00 6.10
2001 63.26 23.03 14.07 3.85 10.89 3.61 7.81
2002 75.50 28.70 15.25 4.12 13.30 4.20 9.93
2003 77.05 28.91 15.50 4.40 13.87 4.50 9.95
2004 90.75 33.50 17.50 6.13 16.06 6.60 11.86
2005 110.58 38.92 21.46 8.50 19.40 8.93 14.50
2006 140.08 48.60 27.44 11.37 22.87 11.55 18.25
2007 177.36 61.34 36.61 15.37 30.45 15.38 23.61
2008 204.14 68.27 45.78 18.10 35.59 17.61 27.27
2009 242.25 80.07 54.72 21.50 52.56 21.01 32.39
2010 305.84 101.00 67.71 27.22 64.62 26.51 40.88
2011 399.60 123.12 81.64 34.74 79.61 32.32 48.18
2012 491.11 158.55 95.14 44.18 99.02 37.30 56.91
2013 569.25 176.50 127.51 56.81 129.21 51.04 68.73
2014 636.73 195.43 136.62 67.47 149.05 61.44 75.32
2015 746.12 227.83 147.92 81.73 172.42 70.78 85.49
2016 871.14 238.36 180.27 96.18 201.01 84.38 99.95
2017 1006.61 240.32 212.46 119.12 233.82 99.43 118.90
2018 1179.42 264.53 251.21 150.40 257.60 116.12 140.15
2019 1301.78 212.55 299.14 175.27 283.37 133.71 158.80
单位 : 亿元 (100 million yuan)

405
其 他
11-28 历年分区、县(市)海外旅游收入Overseas Tourism Revenue by Each District and County (City) over the years
年 份Year
全 市Whole
Municipality
越城区Yuecheng
District
柯桥区Keqiao District
上虞区Shangyu District
诸暨市ZhujiCity
嵊州市Shengzhou
City
新昌县Xinchang County
2000 2108 812 879 38 212 71 96
2001 2360 950 943 44 227 72 125
2002 3569 1230 1372 161 463 167 175
2003 3458 1049 1427 133 356 349 143
2004 5357 1765 2004 254 516 361 456
2005 6679 2155 2347 447 720 466 543
2006 8889 2821 3265 605 917 597 683
2007 12063 3780 4442 836 1196 854 955
2008 13644 4070 5161 993 1376 980 1101
2009 14818 4288 5608 1097 1555 1071 1200
2010 18478 5754 6696 1363 1863 1296 1505
2011 22010 7393 7204 1732 2221 1596 1864
2012 24128 7607 8059 2162 2533 1716 2052
2013 24386 7288 8177 2303 2634 1843 2139
2014 24971 7456 7948 2537 2797 1968 2265
2015 26327 7722 8515 2690 2937 2048 2415
2016 29825 8313 10355 3069 3208 2194 2686
2017 31934 9056 10650 3489 3463 2348 2928
2018 6798 445 2914 381 495 295 363
2019 7360 580 2938 284 410 162 310
单位 : 万美元 (USD 10 000)

406
绍兴市统计年鉴2020
11-29 旅游部门接待能力(2019年)Reception of Tourism Departments (2019)
指 标 Item全 市Whole
Municipality
越城区Yuecheng
District
柯桥区Keqiao District
上虞区Shangyu District
诸暨市Zhuji City
嵊州市Shengzhou
City
新昌县Xinchang County
旅游星级酒店情况
Conditions of Tourist Star Hotels
星级酒店个数 ( 个 )
Total Number of Star Hotels (unit) 47 15 5 4 8 5 10
#五星级 Five-star 12 5 1 3 2 - 1
四星级 Four-star 14 5 1 - 4 2 2
三星级 Three-star 16 5 2 1 1 3 4
二星级 Tow-star 5 - 1 - 1 - 3
一星级 One-star - - - - - - -
房间数 ( 间 ) Number of Rooms (room) 8315 2627 865 1284 1565 678 1296
床位数 ( 张 ) Number of Beds (bed) 13026 4148 1404 1733 2472 1057 2212
旅行社情况 Statistics on Tourism Agencies
旅行社总数 ( 个 )
Total Number of Travel Agencies (unit) 154 48 16 17 29 20 24
# 具有出境组团业务的旅行社
Travel Agents with Outbound Travel Business
19 11 2 2 3 1 -
不具有出境组团业务的旅行社
Travel Agents with No Outbound Travel Business
135 37 14 15 26 19 24

407
其 他
11-30 绍兴市友城缔结情况(2019年末)Foreign Friendly Cities of Shaoxing (End of 2019)
序号No. 友城名称 Cities 结好时间
Time结好地点Signed in 备注 Relation
1 日本南砺市(福光町)
Nanto, Japan(Fukumitsu)
2005.4.19(1983.3.21)
绍兴市Shaoxing 友好城市 Friendship City
2 日本芦原市(芦原町)
Awara, Japan(Awara)
2004.9.24(1983.5.18)
绍兴市Shaoxing 友好城市 Friendship City
3 日本西宫市 Nishinomiya, Japan 1985.7.23 西宫市
Nishinomiya 友好城市 Friendship City
4 丹麦欧登塞市 Odense, Denmark 1991.5.17 欧登塞市
Odense 友好城市 Friendship City
5 法国鲁瓦扬市 Royan, France 1994.9.4 鲁瓦扬市Royan
友好交流关系城市
Cities of FriendlyExchange Relation
6 法国布鲁瓦市 Blois, France 1995.7.10 布鲁瓦市 Blois 友好交流关系城市
Cities of FriendlyExchange Relation
7 美国开普吉拉多市Cape Girardeau, USA
1996.10.14 开 市 Cape Girardeau
友好交流关系城市
Cities of FriendlyExchange Relation
8 韩国丽水市(丽川郡)
Yeosu, Korea(Yosu) 1997.5.21 丽川郡 Yosu 友好交流
关系城市Cities of FriendlyExchange Relation
9 日本富士宫市 Fujinomiya, Japan 1997.11.11 绍兴市
Shaoxing友好交流关系城市
Cities of FriendlyExchange Relation
10 意大利马切拉塔省 Macerata, Italy 1997.11.21 马 省Macerata
友好交流关系城市
Cities of FriendlyExchange Relation
11 英国安伯瓦利市 Amber Valley, UK 2001.10.17 绍兴市
Shaoxing友好交流关系城市
Cities of FriendlyExchange Relation
12 美国卡马里罗市 Camarillo, USA 2001.10.17 绍兴市Shaoxing
友好交流关系城市 Friendship City
13 美国新泽西州萨默塞特郡 Somerset, USA 2003.11.14 萨默塞特郡
Somerset 友好城市 Cities of FriendlyExchange Relation
14 美国杰克逊维尔市 Jacksonville, USA 2004.9.24 绍兴市
Shaoxing友好交流关系城市
Cities of FriendlyExchange Relation
15 韩国龙山区 Yongsan, Korea 2004.10.19 绍兴市
Shaoxing友好交流关系城市
Cities of FriendlyExchange Relation
16 德国拜罗伊特市 Bayreuth, Germany 2005.10.24 绍兴市
Shaoxing友好交流关系城市
Cities of FriendlyExchange Relation
17 俄罗斯莫斯科州列宁大区
Lenin District, Russia 2006.11.2 列宁大区
Lenin District友好交流关系城市
Cities of FriendlyExchange Relation

408
绍兴市统计年鉴2020
11-30 续表Continued
序号No. 友城名称 Cities 结好时间
Time结好地点Signed in 备注 Relation
18 巴西贝伦市 Belem, Brazil 2007.7.10 友好城市 Friendship City
19 澳大利亚白马市 Whitehorse, Australia 2007.9.21 白马市
Whitehorse友好交流关系城市
Cities of FriendlyExchange Relation
20 日本小山市 Oyama, Japan 2009.10.22 绍兴市Shaoxing
友好交流关系城市
Cities of FriendlyExchange Relation
21 法国艾克斯市 Aix, France 2011.3.10 艾克斯市Aix
友好交流关系城市
Cities of FriendlyExchange Relation
22 匈牙利佩奇市 Pecs, Hungary 2011.9.1 佩奇市Pecs
友好交流关系城市
Cities of FriendlyExchange Relation
23 坦桑尼亚达累斯萨拉姆
DaresSalaam, Tanzania 2013.4.5 达累斯萨拉姆
DaresSalaam友好交流关系城市
Cities of FriendlyExchange Relation
24 芬兰南塞沃地区 South-Savo, Finland 2014.1.7 绍兴市
Shaoxing 友好城市 Friendship City
25 斐济苏瓦 suva, Fiji 2014.7.28 苏瓦市Suva 友好城市 Friendship City
26 韩国大邱市 Daegu, Korea 2015.10.26 大邱市Daegu
友好交流关系城市
Cities of FriendlyExchange Relation
27 新西兰陶波市 Taupo, New Zealand 2016.5.25 绍兴市
Shaoxing友好交流关系城市
Cities of FriendlyExchange Relation
28 塞尔维亚苏博蒂察市
Subotica, Serbia 2016.5.25 绍兴市
Shaoxing友好交流关系城市
Cities of FriendlyExchange Relation
29 德国吕贝克市 Lubeck, Germany 2016.10.6 吕贝克市
Lubeck友好交流关系城市
Cities of FriendlyExchange Relation
30 保加利亚布尔加斯市
Burgas, Bulgaria 2017.3.3 布尔加斯市
Burgas友好交流关系城市
Cities of FriendlyExchange Relation
31 斯里兰卡康提市 Kandy, Sri Lanka 2018.11.06 绍兴市
Shaoxing友好交流关系城市
Cities of FriendlyExchange Relation
32 白俄罗斯博布鲁伊斯克市
Bobruisk, Belaru 2018.11.06 绍兴市
Shaoxing友好交流关系城市
Cities of FriendlyExchange Relation
33 意大利那不勒斯市 Naples, Italy 2019.06.25 那不勒斯市Naples
友好交流关系城市
Cities of FriendlyExchange Relation
34 韩国釜山东区 Dong-gu Busan, Korea 2019.08.27
釜山东区Dong-gu
Busan
友好交流关系城市
Cities of FriendlyExchange Relation

409
其 他
主要统计指标解释
社会福利事业单位 指集中收养社会孤老、残、幼的机构。包括由民政部门管理的社会福利院、儿童福利院、
精神病人福利院和城镇集体办的福利院,以及农村集体办的敬老院。
社会福利事业单位收养人数 指由民政部门管理的和城镇及农村集体举办的社会福利事业单位中收养的
老人、少年儿童、缺乏生活自理能力的残疾人员和精神病人。
废水排放总量 包括生产废水和生活污水。生产废水指企、事业单位在生产、科研过程中向外排放的所有
排放口的废水量总和。生活污水指城镇居民区和企、事业单位职工集中居住区排放的污水量。
工业废水排放总量 指经过工业企业厂区所有排放口排到企业外部的工业废水量。包括外排的直接冷却
水、超标排放的矿井地下水和与工业废水混排的厂区生活污水,不包括外排的间接冷却水 ( 清污不分流的间接
冷却水应计算在内 )。
工业废水排放达标量 指全面达到国家、地方排放标准的外排工业废水量,包括经过处理后达标外排的和
未经过处理达标外排的两部分工业废水。国家排放标准见国际 (GB8978-88)。
废气排放总量 指燃料燃烧和生产工艺过程中排放的各种废气总量,以标准状态下每年万标立方米表示。
工业粉尘排放量 指工业企业在生产工艺过程中排放的固体微粒总重量。如钢铁企业的耐火材料粉尘、焦
化企业的筛焦系统粉尘、烧结机的粉尘、石灰窑的粉尘、建材企业的水泥粉尘等。不包括电厂排入大气的烟尘。
工业粉尘产生量 =工业粉尘排放量 +工业粉尘回收量
工业固体废物综合利用量 指已用作农业肥料、造田、生产建筑材料、筑路以及其他方式综合利用的固体废
物量 ( 包括当年利用往年的工业固体废物堆存量 )。综合利用量由原产固体废物的单位统计。
“三废”综合利用产品产值 指工业企业回收利用“三废”作为主要原料生产的产品产值。按国发 (1985) l17
号文规定执行。
年底实有铺装道路长度 指除土路外,路面经过铺装宽度在 3.5 米以上的道路,包括高级、次高级道路和普
通道路。
年底实有公共汽车 指年底可参加营运的全部车辆数,包括年底营运车辆和库存查封未参加营运的车辆,
不包括非营运车辆,如架线车、油罐车、工程车、货车及其他专用车辆和借入的客运车辆。
生活用水量 指居民日常生活与公共福利设施的用水量。包括居民、饮食店、旅馆、医院、理发店、浴池、洗衣
店、游泳池、商店、学校、机关、部队等单位的用水量。
城市人口用水普及率 指城市用水的非农业人口数 ( 不包括临时人口和流动人口 ) 与城市非农业人口总数
之比,计算公式:
用水普及率=城市用水的非农业人口数 / 城市非农业人口数 ×100%

410
绍兴市统计年鉴2020
Explanatory Notes on Main Statistical Indicators
Social Welfare Institutions refers to institutions taking care of old people without children,
handicapped people and orphans. They include social welfare institutions run by civil affairs departments,
children welfare institutions, social welfare institutions for mental patients, and collective-owned old peoples
homes in rural areas.
Number of People Taken in by Social Welfare Institutions refers to the number of
old people, children, totally dependent handicapped people and mental patients taken in by social welfare
institutions run by civil affairs departments and those run by collective units in urban and rural areas.
Total Amount of Waste Water refers to the total amount of industrial waste water and resident
waste water. The industrial refers to the total of the waste water produced in the producing, studying period of
the enterprises and institutions. The resident waste water refers to the waste water produced in the residences.
Volume of Industrial Waste Water Discharged refers to the volume of industrial waste
water discharged, through all outlets, to the outside of industrial enterprises, including waste water produced,
direct-cooling water, underground water from mines that does not meet the standard of discharge, and the
domestic sewage mixed up with industrial waste water when discharged, but excluding discharged indirect-
cooling water.
Volume of Waste Water up to the Standard for Discharge refers to the volume
of discharged industrial waste water that, with or without treatment, has come up to the national or local
standards for discharge.
Total Amount of Waste Gas Discharged refers to the volume of various kings of waste gas
discharged to the air in the process of fuel burning or in the production process, and is measured by 10, 000
standard cubic meters each year under normal condition.
Industrial Dust Discharged refers to the total weight of solid dust discharged by industrial
enterprises in the production process, such as dust of refractory materials from iron plants, dust from coke-
screening system or from sintering machines of coking plants, dust from lime kilns, cement dust from
building material enterprises, etc., but excluding smoke and dust discharged by power plants.
Volume Industrial Dust Production = volume industrial dust discharged + volume industrial dust
recovery
Volume of Industrial Solid Wastes Utilized in a Comprehensive Way refers to the
volume of solid wastes from which useful materials can be extracted or which can be changed to be utilizable
resources, energy or other materials, including the volume of industrial solid wastes stored up in the previous
years and utilized in the current year, such as the solid wastes utilized as fertilizers, building materials, for
making roads or for other purpose. Statistical data on utilization of industrial solid wastes are collected by
solid wastes producing units.
Output Value of Products Made from Utilization of Waste Gas, Waste Water and Industrial Solid Wastes

411
其 他
refers to the value of products (calculated at current prices) made by industrial enterprises using recovered
waste water, waste gas or solid wastes as main raw materials. Only the value of the products that have been
sold or are ready to be sold should be included. The value of the products, which will be used in the production
of the enterprises, should not be included.
Length of Paved Roads at the Year-end refers to the length of roads with a paved surface,
and with a width of more than 3.5 meters, including high quality, medium quality and ordinary roads.
Number of Public Vehicles (Buses and Trolley buses) at the Year-end refers to
the total number of operational buses available at the year-end, including the year-end operational vehicles and
vehicles in stock. Non-operational vehicles such as stringing cars, tank cars, machine shop cars, trucks and
other special vehicles and the borrowed passenger vehicles are excluded.
Consumption of Water for Residential Use refers to the water consumption of households
for daily life and the water consumption of public welfare facilities, including the consumption of restaurants,
hotels, hospitals, barber shops, public bathhouses, laundries, swimming pools, shops, schools, institutions,
army units and other units.
Percentage of Urban Population with Access to Tap Water refers to the ratio of the
urban non-agricultural population (excluding temporary and mobile population) with access to tap water to the
total urban non-agricultural population. The formula is:
Percentage of Population with Access to Tap Water=(Urban Non-agricultural Population with Access to
Tap Water) / (Urban Non-agricultural Population)


浙江省及长江三角洲地区城市资料12CHAPTER 12 REFERENCE BY CITY AND PREFECTURE IN ZHEJIANG PROVINCE AND YANGTSE RIVER DELTA


415
浙江省及长江三角洲地区城市资料
主要统计指标Main Statistical Indicators
绍兴在全省的位次
Position in Zhejiang Province
绍兴在长江三角洲地区
的位次Position in Yangtse
River Delta
行政区划面积 Land Area No.8 No.6
#市区面积 Area of Urban District No.3 -
年末常住人口 Year-end Population No.6 No.9
地区生产总值 Gross Domestic Product No.4 No.10
人均生产总值 Per Captia Gross Domestic Product No.4 No.12
一般公共预算收入 General Public Budget Revenue No.5 No.10
社会消费品零售总额 Total Retail Sales of Consumer Goods No.6 No.10
进出口总额(海关数) Total Imports and Exports No.5 No.9
# 自营出口 Total Exports No.4 No.7
实际利用外资 Foreign Capital Actually Used No.6 No.14
非私营单位在岗职工年平均工资Average Annual Wage of Staff and Workers at Work in Non Private-Owned Units
No.11 -
城镇常住居民人均可支配收入 Per Capita Disposable Income of Urban Residents No.3 No.6
农村常住居民人均可支配收入 Per Capita Disposable Income of Rural Residents No.5 No.5

416
绍兴市统计年鉴2020
12-1 浙江省各地主要经济指标(2019年)
地 区 Region
土地面积( 平方公里 )
LandArea
(sq.km)
年末户籍人口( 万人 )
Year-end Population
(10 000 persons)
地区生产总值( 亿元 )
Gross Domestic Product
(100 mill-ion yuan)
建成区面积
Build-up Areas
第一产业增加值
Value -Added of Primary Industry
杭州市 Hangzhou Municipality 16853 698.45 795.37 15373.05 325.70
杭州市区 Urban District 8292 648.46 656.56 14348.92 226.99
江干区 Jianggan District 200 64.16 949.37 -
西湖区 Xihu District 309 76.85 1415.83 2.58
萧山区 Xiaoshan District 1418 116.05 134.84 2198.51 71.66
余杭区 Yuhang District 1228 80.32 116.18 2824.02 53.31
富阳区 Fuyang District 1821 29.55 68.81 820.47 49.31
临安区 Linan District 3119 36.80 53.95 572.94 45.86
桐庐县 Tonglu 1830 20.45 41.88 386.39 25.03
淳安县 Chunan 4417 18.94 45.87 254.50 38.14
建德市 Jiande 2314 10.60 51.07 383.24 35.54
宁波市 Ningbo Municipality 9816 525.68 608.47 11985.12 322.27
宁波市区 Urban District 3730 354.79 300.86 7670.55 95.32
海曙区 Haishu District 595 63.35 1170.11 15.40
江北区 Jiangbei District 208 26.28 639.63 7.69
北仑区 Beilun District 599 42.97 1961.45 8.26
镇海区 Zhenhai District 246 27.16 1021.60 6.32
鄞州区 Yinzhou District 814 93.05 2211.02 26.54
奉化区 Fenghua District 1268 48.06 645.25 31.11
余姚市 Yuyao 1501 50.54 83.59 1166.26 47.74
慈溪市 Cixi 1361 48.00 105.96 1898.64 55.72
象山县 Xiangshan 1382 31.65 54.66 548.59 77.22
宁海县 Ninghai 1843 40.70 63.39 701.08 46.27
温州市 Wengzhou Municipality 12110 370.18 832.36 6606.11 151.72
温州市区 Urban District 1332 268.04 174.41 2610.62 17.30
鹿城区 Lucheng District 293 78.55 1137.13 1.93
龙湾区 Longwan District 319 34.05 704.52 2.89
瓯海区 Ouhai District 466 46.32 661.12 6.62
洞头区 Dongtou District 254 15.49 107.84 5.86
瑞安市 Ruian 1350 23.00 125.82 1003.96 25.10
乐清市 Yueqing 1391 23.31 131.49 1209.93 20.36
永嘉县 Yongjia 2677 10.84 98.79 444.52 16.07
平阳县 Pingyang 1042 11.46 88.45 510.29 18.61
苍南县 Cangnan 1253 16.58 135.03 652.21 35.45
文成县 Wencheng 1296 5.10 41.08 104.91 9.34
泰顺县 Taishun 1768 11.85 37.30 110.60 9.48

417
浙江省及长江三角洲地区城市资料
Main Economic Indicators by City and Prefecture in Zhejiang Province (2019)
人均 GDP( 元 / 人 )
Per CaptiaGDP
(yuan/person)
规模以上工业总产值
( 亿元 )Gross
Industrial Output Value
(100 mill-ion yuan)
规模以上工业利润总额( 亿元 )
Total Industrial
Profits(100 mill-ion yuan)
社会消费品零售额( 亿元 )
Total Retail Sales of Consumer
Goods(100 mill-ion yuan)
进口总额( 亿元 )
TotalImports
(100 mill-ion yuan)
第二产业增加值
Value -Added of Secondary
Industry
第三产业增加值
Value -Added of Tertiary Industry
工业增加值Value-
Added of Industry
4875.07 10172.28 4288.42 152465 14585.45 1126.17 6187.60 1839.40
4434.99 9686.94 3943.45 162236 13595.24 1037.92 5842.96 1207.73
134.14 815.23 48.75 120098 137.22 16.27 575.10 84.47
124.06 1289.18 86.90 160161 271.76 22.80 711.73 89.27
1039.03 1087.82 945.99 124315 3678.94 208.64 771.77 198.32
652.25 2118.46 604.00 161650 1925.89 133.15 757.82 37.33
373.92 397.24 333.51 110426 1334.37 57.23 368.62 163.62
257.28 269.81 215.13 96374 886.85 70.50 205.23 45.20
177.60 183.76 149.95 89029 429.20 31.75 145.78 6.03
77.96 138.40 49.77 71088 109.90 12.62 83.99 2.52
184.53 163.18 145.25 85833 451.11 43.88 114.86 4.92
5782.92 5879.93 5164.64 143157 17852.10 1339.87 4268.56 3200.63
3371.40 4203.83 2991.67 172508 11124.70 788.71 2727.88
374.19 780.52 302.39 122976 1155.76 53.86 774.88 103.73
198.11 433.83 158.95 160710 851.61 48.01 370.23 201.25
1023.20 929.99 962.00 266682 4191.09 368.69 367.79 1609.88
725.31 289.97 681.06 235815 2513.84 170.52 155.10 246.37
630.06 1554.42 502.49 156502 1699.04 105.23 907.03 515.40
392.27 221.87 352.51 125170 713.38 42.40 152.86 28.86
664.08 454.44 623.76 100280 1834.23 150.49 407.05 344.10
1146.40 696.52 1066.16 122730 3317.72 291.72 658.55 104.10
237.43 233.94 166.12 103507 651.26 43.43 207.41 17.45
363.61 291.20 316.92 102273 924.19 65.52 267.68 26.70
2811.93 3642.46 2311.00 71225 5471.29 361.71 3655.87 216.89
981.70 1611.61 774.67 86114 1982.17 103.01 1647.55
285.40 849.79 208.99 90536 448.27 18.89 832.57 15.54
373.70 327.94 331.32 97667 871.46 52.77 438.30 122.33
278.06 376.44 208.33 69709 558.03 31.54 337.19 9.59
44.55 57.44 26.02 101883 104.41 -0.20 39.49 13.36
460.11 518.75 395.86 69985 897.79 115.86 525.37 30.99
557.41 632.16 516.69 84848 1435.88 83.53 535.41 5.16
191.73 236.72 141.96 53473 328.86 18.94 216.69 2.77
228.84 262.84 189.24 63529 404.28 17.89 229.01 3.51
267.79 348.98 213.22 52280 385.58 20.23 395.94 3.28
24.29 71.28 10.44 42829 20.87 1.13 50.63 0.03
37.10 64.02 9.62 43236 15.86 1.13 55.27 0.01

418
绍兴市统计年鉴2020
12-1 续表1
地 区 Region
出口总额( 亿元 )
Total Exports
(100 mill-ion yuan)
实际利用外资( 万美元 )Foreign Capital
Actually Used(USD 10000)
一般公共预算收入(亿元)General
Public Budget Revenues(100 mill-ion yuan)
一般公共预算支出( 亿元 )General
Public Budget Expenditures
(100 mill-ion yuan)
杭州市 Hangzhou Municipality 3352.76 612818 1965.97 1952.85
杭州市区 Urban District 1479.81 582208 1880.02 1779.64
江干区 Jianggan District 159.30 46554 103.68 76.29
西湖区 Xihu District 234.51 70232 150.64 93.01
萧山区 Xiaoshan District 638.73 83516 267.66 275.43
余杭区 Yuhang District 441.23 89560 391.45 376.73
富阳区 Fuyang District 132.30 29747 80.00 105.50
临安区 Linan District 124.58 16008 61.16 85.62
桐庐县 Tonglu 68.95 17000 33.77 50.20
淳安县 Chunan 10.85 2003 21.09 68.87
建德市 Jiande 62.50 11607 31.10 54.15
宁波市 Ningbo Municipality 5969.63 236341 1468.51 1767.89
宁波市区 Urban District 185486 1047.32 1260.50
海曙区 Haishu District 628.80 23000 112.48 94.66
江北区 Jiangbei District 363.10 17009 78.17 74.37
北仑区 Beilun District 1224.19 67656 315.70 305.92
镇海区 Zhenhai District 250.38 18059 84.23 97.29
鄞州区 Yinzhou District 1476.24 48759 269.33 233.53
奉化区 Fenghua District 182.49 11003 60.00 82.27
余姚市 Yuyao 598.74 31058 107.23 122.59
慈溪市 Cixi 781.01 15001 201.69 216.57
象山县 Xiangshan 184.45 11002 46.26 77.46
宁海县 Ninghai 276.25 12632 66.02 90.76
温州市 Wengzhou Municipality 1685.35 75842 578.97 1084.12
温州市区 Urban District 47966 259.90 363.26
鹿城区 Lucheng District 454.87 5911 34.39 68.19
龙湾区 Longwan District 283.94 33452 52.57 62.75
瓯海区 Ouhai District 173.43 8048 42.01 71.22
洞头区 Dongtou District 5.21 555 12.91 37.00
瑞安市 Ruian 274.41 10137 79.64 139.92
乐清市 Yueqing 180.50 5265 99.69 155.39
永嘉县 Yongjia 59.53 3604 39.53 109.23
平阳县 Pingyang 75.84 4104 38.03 90.88
苍南县 Cangnan 50.15 3428 42.46 113.75
文成县 Wencheng 3.60 621 9.63 56.14
泰顺县 Taishun 4.29 717 10.10 55.55

419
浙江省及长江三角洲地区城市资料
Continued 1
年末金融机构人民币存款余额( 亿元 )Deposits Balance
(Year-end)(100 mill-ion yuan)
年末金融机构人民币贷款余额( 亿元 )Loans
Balance(Year-end)(100 mill-ion yuan)
全社会用电量
( 亿千瓦时 )Electricity Consump-tion of the
Whole Society
(100 mill-ion kwh)
全社会从业人员数
( 万人 )Total
Number of Employed Persons(10 000 persons)
非私营单位在岗职工平均工资( 元 / 人 )Average
Annual Wage of Staff and
Workersat Work
(yuan/person)
农村常住居民人均可支配
收入 ( 元 )Per Capita Disposable
Income of Rural
Residents(yuan)
城镇常住居民人均可支配
收入 ( 元 )Per Capita Disposable
Income of Urban
Residents(yuan)
住户存款余额
Household Deposits
工业用电Electricity Consump-
tion of Industry
43644.17 11677.34 41237.43 816.70 433.04 720.00 120308 36255 66068
42181.20 10870.17 39918.95 637.92 121398
87.77 54.41 124942 68392
50.11 63.70 110045 70839
4778.58 1990.43 4402.44 259.29 104.01 91551 41132 70702
3765.86 1471.18 2616.67 112.93 50.72 117.06 108012 41347 68159
1324.88 585.33 1488.76 78.96 58.81 48.30 85102 35531 60576
972.40 396.64 802.96 39.26 25.22 40.40 104661 33536 57296
558.15 308.51 555.81 25.23 15.43 30.08 101062 31940 54279
377.81 195.26 311.86 15.44 7.14 24.56 95531 21074 47056
527.01 303.40 450.82 37.14 28.51 27.43 96438 28669 52899
20290.86 7475.47 21774.23 807.92 590.17 589.09 110878 36632 64886
14351.00 4323.99 16355.89 340.89 115763
56.10 30.37 61.98 124128 37199 68641
30.11 17.01 29.50 108951 39342 67738
154.76 132.54 63.58 103061 38668 67030
111.68 98.23 37.53 118221 37767 67351
93.30 45.17 108.71 128256 39953 70074
36.60 24.45 36.70 96177 33185 56551
1766.60 989.31 1361.05 106.36 82.81 76.94 93773 36811 61988
2728.19 1472.84 2237.91 119.04 89.72 84.90 111378 38081 63964
655.14 333.57 862.05 26.39 15.24 37.26 95327 33435 58747
789.93 355.75 957.34 37.17 24.29 49.10 104820 33864 61016
13156.44 7601.83 11529.55 441.08 257.44 575.90 90677 30211 60957
6969.69 3445.97 6148.42 236.28 107705
2469.76 1552.55 1873.80 45.15 15.46 67.87 89393 36255 68113
1050.48 651.57 1019.25 57.87 40.33 38.20 85127 37642 61248
1125.10 799.85 860.36 44.15 25.38 38.36 98413 36619 63022
105.02 56.81 113.82 3.72 1.45 5.40 123673 29962 49567
1722.53 1173.49 1351.83 76.71 49.33 73.73 96909 33497 64721
1634.51 1103.38 1384.77 65.27 36.30 73.58 79091 35478 64442
806.17 527.80 715.96 31.71 18.25 49.46 85398 24550 49489
659.03 456.74 642.54 38.83 23.95 45.98 73231 24957 50767
775.13 500.88 964.19 61.65 38.33 65.40 75514 24320 50803
344.11 239.47 170.75 5.06 1.54 14.49 96718 19128 42116
245.27 154.11 151.09 5.35 1.52 16.98 86842 18805 40622

420
绍兴市统计年鉴2020
12-1 续表2
地 区 Region
土地面积( 平方公里 )
LandArea
(sq.km)
年末户籍人口( 万人 )
Year-end Population
(10 000 persons)
地区生产总值( 亿元 )
Gross Domestic Product
(100 mill-ion yuan)
建成区面积
Build-up Areas
第一产业增加值
Value -Added of Primary Industry
嘉兴市 Jiaxing Municipality 4223 371.54 363.70 5370.32 120.89
嘉兴市区 Urban District 987 134.59 93.84 1444.52 26.10
南湖区 Nanhu District 439 52.66 765.37 12.90
秀洲区 Xiuzhou District 548 41.18 676.35 13.20
平湖市 Pinghu 554 63.64 50.32 765.77 12.55
海宁市 Haining 863 54.97 70.25 1026.57 18.27
桐乡市 Tongxiang 727 52.71 70.47 968.17 23.51
嘉善县 Jiashan 507 43.80 40.53 626.81 23.25
海盐县 Haiyan 585 21.83 38.29 539.65 17.21
湖州市 Huzhou Municipality 5820 248.61 267.57 3122.43 133.80
湖州市区 Urban District 1565 125.18 112.31 1422.56 47.62
吴兴区 Wuxing District 863 63.27 964.58 23.62
南浔区 Nanxun District 702 49.04 458.01 23.99
德清县 Deqing 938 36.91 44.31 537.01 23.43
长兴县 Changxing 1431 48.00 63.73 693.28 35.03
安吉县 Anji 1886 38.55 47.22 469.59 27.72
绍兴市 Shaoxing Municipality 8279 379.70 447.87 5780.74 208.40
绍兴市区 Urban District 2965 242.31 223.65 3426.46 99.41
越城区 Yuecheng District 493 120.31 76.91 944.08 12.50
柯桥区 Keqiao District 1066 77.00 68.80 1504.27 37.21
上虞区 Shangyu District 1406 45.00 77.94 978.11 49.70
诸暨市 Zhuji 2311 68.80 108.43 1312.36 47.70
嵊州市 Shengzhou 1789 41.40 72.41 589.15 39.19
新昌县 Xinchang 1214 27.19 43.37 451.46 22.10
金华市 Jinhua Municipality 10942 386.54 491.93 4559.91 145.82
金华市区 Urban District 2049 107.74 99.57 877.92 33.90
婺城区 Wucheng District 1391 65.49 629.88 20.08
金东区 Jindong District 658 34.08 248.04 13.82
兰溪市 Lanxi 1312 37.59 65.80 385.69 26.09
义乌市 Yiwu 1105 108.02 83.61 1421.14 22.58
东阳市 Dongyang 1747 44.33 85.06 638.45 17.54
永康市 Yongkang 1047 38.85 61.92 629.56 8.24
武义县 Wuyi 1568 19.93 34.55 261.53 15.49
浦江县 Pujing 918 24.98 40.18 230.16 10.26
磐安县 Panan 1195 5.10 21.24 115.44 11.73

421
浙江省及长江三角洲地区城市资料
Continued 2
人均 GDP( 元 / 人 )
Per CaptiaGDP
(yuan/person)
规模以上工业总产值
( 亿元 )Gross
Industrial Output Value
(100 mill-ion yuan)
规模以上工业利润总额( 亿元 )
Total Industrial
Profits(100 mill-ion yuan)
社会消费品零售额( 亿元 )
Total Retail Sales of Consumer
Goods(100 mill-ion yuan)
进口总额( 亿元 )
TotalImports
(100 mill-ion yuan)
第二产业增加值
Value -Added of Secondary
Industry
第三产业增加值
Value -Added of Tertiary Industry
工业增加值Value-
Added of Industry
2892.55 2356.88 2576.03 112751 10358.81 611.77 2102.54 725.69
679.02 739.41 589.13 111091 2308.85 125.87 571.57
338.47 414.00 283.40 113254 1248.44 42.45 399.99 29.32
338.21 324.94 304.38 108302 1060.41 83.42 171.59 28.33
468.53 284.70 434.18 109442 1978.82 131.69 235.15 145.15
581.06 427.23 515.23 118213 2046.71 91.90 477.48 52.60
510.50 434.15 443.37 113143 1810.68 94.64 424.76 101.44
330.96 272.59 295.84 106337 1203.68 59.64 234.10 56.69
324.97 197.48 300.37 120069 1010.06 108.02 159.49 32.67
1595.40 1393.23 1422.08 102593 4663.69 315.90 1429.27 101.59
717.74 657.19 625.62 104506 1918.99 108.77 726.91
444.30 496.66 370.16 119547 852.46 56.81 526.55 22.67
273.45 160.57 255.46 82621 923.62 49.44 200.35 13.42
310.18 203.39 284.46 103989 914.21 71.32 204.56 21.05
355.64 302.60 318.93 103180 1197.08 84.56 311.34 33.66
211.83 230.04 193.06 95065 633.40 51.24 186.47 6.81
2770.77 2801.56 2325.64 114561 6994.42 497.96 2352.56 207.90
1614.71 1712.34 1341.48 123420 4894.66 345.37 1420.67
354.36 577.23 274.31 95822 1257.88 64.63 621.69 61.03
755.38 711.67 639.99 151457 2075.45 121.00 362.10 43.95
504.96 423.45 427.18 122601 1561.34 159.74 436.87 24.22
646.85 617.81 541.09 110524 1120.84 63.39 475.44 71.22
283.67 266.28 243.43 84885 492.94 26.02 286.20 3.34
223.80 205.56 197.86 116281 485.99 63.19 170.25 4.13
1833.03 2581.06 1565.05 81224 4097.38 165.50 2722.88 184.68
314.23 529.79 250.99 75988 777.61 39.92 732.49 36.54
201.61 408.19 161.51 79823 514.54 30.39 488.76 5.43
112.62 121.60 89.48 67724 263.07 9.54 243.73 31.10
200.44 159.17 183.88 67951 666.35 15.58 154.16 19.54
418.03 980.53 361.52 108113 625.93 23.53 973.10 99.90
283.10 337.81 207.26 75364 490.82 32.71 302.17 18.50
341.96 279.37 319.35 82403 798.53 25.77 323.49 3.72
132.53 113.52 122.59 72163 495.61 17.84 98.40 2.30
97.69 122.20 85.39 54605 159.56 5.66 102.51 3.73
45.05 58.66 34.08 63603 82.97 4.50 36.56 0.46

422
绍兴市统计年鉴2020
12-1 续表3
地 区 Region
出口总额( 亿元 )
Total Exports
(100 mill-ion yuan)
实际利用外资( 万美元 )Foreign Capital
Actually Used(USD 10000)
一般公共预算收入(亿元)General
Public Budget Revenues(100 mill-ion yuan)
一般公共预算支出( 亿元 )General
Public Budget Expenditures
(100 mill-ion yuan)
嘉兴市 Jiaxing Municipality 2106.46 412541 565.69 766.89
嘉兴市区 Urban District 136114 180.50 256.80
南湖区 Nanhu District 156.31 57080 32.80 36.71
秀洲区 Xiuzhou District 204.15 38273 27.27 41.32
平湖市 Pinghu 267.02 81519 88.45 113.26
海宁市 Haining 510.54 51025 97.02 111.42
桐乡市 Tongxiang 317.42 50098 79.65 100.72
嘉善县 Jiashan 249.03 58683 67.79 97.49
海盐县 Haiyan 136.12 35102 52.28 87.21
湖州市 Huzhou Municipality 838.59 189881 316.07 466.87
湖州市区 Urban District 85924 131.02 214.55
吴兴区 Wuxing District 94.73 62763 76.99 47.45
南浔区 Nanxun District 81.16 12161 37.93 49.01
德清县 Deqing 148.93 36459 65.66 83.66
长兴县 Changxing 156.60 36459 65.83 81.10
安吉县 Anji 247.60 31039 53.56 87.57
绍兴市 Shaoxing Municipality 2251.07 65739 528.37 640.87
绍兴市区 Urban District 57522 349.13 390.07
越城区 Yuecheng District 466.54 2056 128.21 158.61
柯桥区 Keqiao District 865.76 20772 131.41 126.99
上虞区 Shangyu District 278.29 34694 89.52 104.48
诸暨市 Zhuji 416.86 6296 89.81 110.50
嵊州市 Shengzhou 82.63 921 45.76 75.95
新昌县 Xinchang 140.98 1000 43.66 64.35
金华市 Jinhua Municipality 4033.83 21657 411.30 664.33
金华市区 Urban District 241.78 2830 95.01 160.44
婺城区 Wucheng District 140.50 1503 72.07 128.89
金东区 Jindong District 101.28 1327 22.94 31.55
兰溪市 Lanxi 109.85 1230 28.28 58.10
义乌市 Yiwu 2867.93 16205 101.22 131.21
东阳市 Dongyang 197.78 13 69.90 98.97
永康市 Yongkang 319.16 124 59.93 87.28
武义县 Wuyi 204.64 103 27.03 48.99
浦江县 Pujing 61.15 1152 19.29 39.95
磐安县 Panan 31.54 10.64 39.39

423
浙江省及长江三角洲地区城市资料
Continued 3
年末金融机构人民币存款余额( 亿元 )Deposits Balance
(Year-end)(100 mill-ion yuan)
年末金融机构人民币贷款余额( 亿元 )Loans
Balance(Year-end)(100 mill-ion yuan)
全社会用电量
( 亿千瓦时 )Electricity Consump-tion of the
Whole Society
(100 mill-ion kwh)
全社会从业人员数
( 万人 )Total
Number of Employed Persons(10 000 persons)
非私营单位在岗职工平均工资( 元 / 人 )Average
Annual Wage of Staff and
Workersat Work
(yuan/person)
农村常住居民人均可支配
收入 ( 元 )Per Capita Disposable
Income of Rural
Residents(yuan)
城镇常住居民人均可支配
收入 ( 元 )Per Capita Disposable
Income of Urban
Residents(yuan)
住户存款余额
Household Deposits
工业用电Electricity Consump-
tion of Industry
9318.44 4313.44 8004.43 538.03 423.99 336.00 97767 37413 61940
3113.87 1239.42 2725.09 131.83 95.03 90.91 103773 35887 56059
75.73 48.46 47.36 115118 36192 56366
56.10 46.57 43.55 89364 35778 55586
1014.34 491.15 906.39 87.11 74.58 41.94 90096 37219 62943
1744.03 860.05 1443.27 99.65 77.12 65.25 101874 38739 65526
1565.06 818.63 1315.71 110.38 90.18 67.96 94492 38197 60880
1148.69 514.48 850.83 58.29 44.82 40.97 86411 38057 63287
732.45 389.71 763.15 49.32 40.82 28.97 108364 37801 63733
5163.75 2444.97 4818.46 295.02 215.51 193.90 89631 34803 59028
2711.79 1273.59 2384.25 91.08 89749
68.00 42.24 64.08 90424 35742 60768
50.11 38.85 27.00 87271 34489 57414
872.17 414.80 828.61 51.00 36.74 30.51 90714 36013 59431
916.61 428.98 845.12 87.58 72.87 39.27 89934 35274 59848
663.18 327.60 760.49 35.86 22.56 33.04 87563 33488 56954
9408.16 4723.28 8527.52 462.37 356.30 348.00 80842 36120 63935
6297.98 2900.15 5881.71 193.04 80174
2802.54 1042.01 2844.64 81.75 55.63 62.44 85934 36032 59446
2125.53 1098.93 1854.25 165.65 142.79 73.17 76385 40655 68948
1369.91 759.21 1182.83 64.88 49.42 57.43 76297 35443 65234
1644.24 998.68 1388.80 94.73 71.51 81.18 77545 39380 67862
841.24 532.43 672.29 30.15 19.18 47.38 96033 32131 61271
624.69 292.02 584.71 22.83 15.42 26.40 87264 30755 60167
9730.61 5348.64 8379.17 394.67 258.46 354.50 90635 28511 59348
2140.02 943.88 2218.65 76.79 43.13 73.13 101829
32.71 103202 25138 57062
23.36 95628 27619 49356
560.61 327.06 497.37 51.95 43.06 36.22 80368 21874 44711
3262.50 1780.80 2814.79 100.43 56.07 94.28 96864 39529 77150
1358.47 795.38 937.51 54.05 34.72 51.20 78546 31727 56245
1265.63 793.09 1014.21 53.42 39.31 50.53 98015 30831 58877
491.35 301.21 381.44 27.99 21.15 20.30 96329 19656 42813
420.34 294.29 340.48 24.19 17.60 31.01 102821 23306 48326
231.70 112.92 174.71 5.85 3.42 12.53 80710 19461 41736
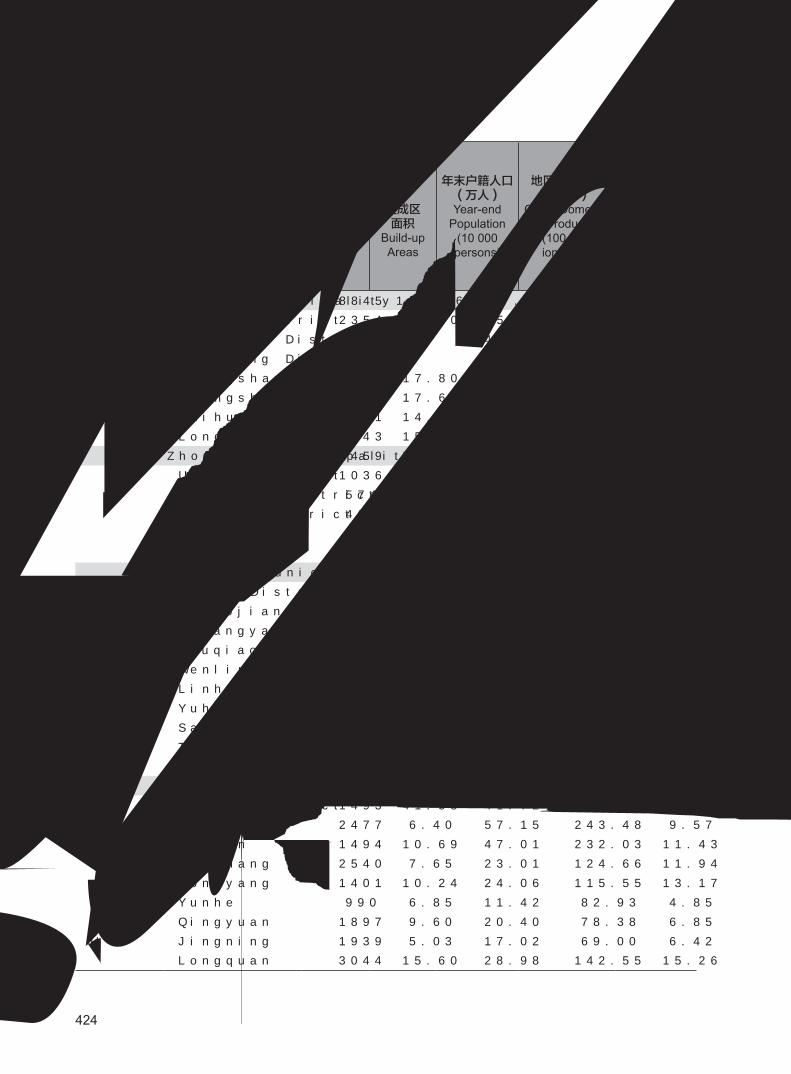
424
绍兴市统计年鉴2020
12-1 续表4
地 区 Region
土 地面 积( 平方公里 )
LandArea
(sq.km)
年末户籍人口( 万人 )
Year-end Population
(10 000 persons)
地区生产总值( 亿元 )
Gross Domestic Product
(100 mill-ion yuan)
建成区面积
Build-up Areas
第一产业增加值
Value -Added of Primary Industry
衢州市 Quzhou Municipality 8845 143.06 257.63 1573.51 86.51
衢州市区 Urban District 2354 77.70 85.34 739.70 28.53
柯城区 Kecheng District 607 44.12 225.55 7.99
衢江区 Qujiang District 1748 41.22 198.47 20.54
江山市 Jiangshan 2019 17.80 61.55 303.41 22.70
常山县 Changshan 1097 17.66 34.36 150.37 8.00
开化县 Kaihua 2231 14.59 36.18 146.80 13.65
龙游县 Longyou 1143 15.31 40.20 231.95 13.64
舟山市 Zhoushan Municipality 1459 77.51 96.60 1371.60 146.40
舟山市区 Urban District 1036 66.79 71.52 1008.95 72.93
定海区 Dinghai District 574 39.94 564.46 10.75
普陀区 Putuo District 462 31.58 444.49 62.18
岱山县 Daishan 326 8.44 17.64 248.30 39.52
嵊泗县 Shensi 97 2.28 7.44 114.03 33.95
台州市 Taizhou Municipality 10050 311.70 606.64 5134.05 282.08
台州市区 Urban District 1680 143.00 163.31 1894.10 55.44
椒江区 Jiaojiang District 364 57.73 55.56 674.26 22.33
黄岩区 Huangyan District 988 42.35 61.61 545.91 19.19
路桥区 Luqiao District 328 42.92 46.14 673.93 13.92
温岭市 Wenling 1074 38.81 122.21 1105.13 77.70
临海市 Linhai 2251 48.54 120.48 711.92 48.02
玉环市 Yuhuan 510 25.23 43.66 617.50 37.11
三门县 Sanmen 1105 18.32 44.72 265.74 33.43
天台县 Tiantai 1432 20.20 60.29 291.03 14.76
仙居县 Xianju 2000 17.60 51.96 249.20 15.62
丽水市 Lishui Municipality 17275 113.64 270.77 1476.61 100.04
丽水市区 Urban District 1493 41.58 41.72 389.63 20.57
青田县 Qingtian 2477 6.40 57.15 243.48 9.57
缙云县 Jinyun 1494 10.69 47.01 232.03 11.43
遂昌县 Suichang 2540 7.65 23.01 124.66 11.94
松阳县 Songyang 1401 10.24 24.06 115.55 13.17
云和县 Yunhe 990 6.85 11.42 82.93 4.85
庆元县 Qingyuan 1897 9.60 20.40 78.38 6.85
景宁县 Jingning 1939 5.03 17.02 69.00 6.42
龙泉市 Longquan 3044 15.60 28.98 142.55 15.26

425
浙江省及长江三角洲地区城市资料
Continued 4
人均 GDP( 元 / 人 )
Per CaptiaGDP
(yuan/person)
规模以上工业总产值
( 亿元 )Gross
Industrial Output Value
(100 mill-ion yuan)
规模以上工业利润总额( 亿元 )
Total Industrial
Profits(100 mill-ion yuan)
社会消费品零售额( 亿元 )
Total Retail Sales of Consumer
Goods(100 mill-ion yuan)
进口总额( 亿元 )
TotalImports
(100 mill-ion yuan)
第二产业增加值
Value -Added of Secondary
Industry
第三产业增加值
Value -Added of Tertiary Industry
工业增加值Value-
Added of Industry
651.12 835.88 528.99 71087 1823.27 133.66 757.08 346.64
299.36 411.81 261.90 87787 1066.03 71.49 284.83
42.55 175.01 22.28 111431 71.15 4.51 208.39 25.58
74.62 103.31 63.66 55611 182.24 16.95 76.43 67.65
136.12 144.59 109.37 62617 277.59 27.91 145.10 35.75
63.02 79.35 47.79 58933 130.51 13.55 72.57 20.93
52.42 80.73 27.76 57512 95.63 6.46 90.18 20.76
99.54 118.77 81.89 61712 253.52 14.25 164.40 44.00
475.53 749.67 374.41 116781 919.47 16.27 576.10 869.91
347.73 588.30 266.98 113308 630.83 20.96 450.27
220.62 333.09 156.84 113437 398.29 10.89 240.67 358.98
127.11 255.20 110.15 113145 232.54 10.07 209.60 199.32
120.31 88.47 102.82 116383 285.13 -4.92 86.13 26.28
19.55 60.53 8.94 161293 3.51 0.24 39.70 59.68
2339.90 2512.07 1966.42 83555 4992.92 331.54 2544.63 134.93
826.49 1012.17 715.65 95807 1763.39 98.36 1000.49 76.16
278.67 373.26 238.36 98289 703.60 48.38 312.55 13.17
264.52 262.20 241.93 82340 457.47 32.29 277.70 8.67
283.30 376.70 235.35 107313 602.31 17.70 410.23 45.27
503.56 523.87 393.46 80637 762.35 47.93 689.57 17.01
323.96 339.94 268.08 67513 916.31 79.25 278.49 18.77
339.85 240.54 315.85 98094 839.22 62.03 216.12 10.02
115.44 116.87 91.27 75816 305.94 4.40 110.91 8.11
119.66 156.61 97.42 71771 205.98 20.44 139.10 2.93
109.02 124.56 85.54 69804 199.74 19.13 109.95 1.94
571.34 805.23 448.72 66936 1411.90 91.80 737.95 27.56
123.40 245.66 91.21 80803 373.08 26.18 219.27
104.54 129.37 87.19 67409 254.87 13.03 122.22 5.16
106.21 114.38 84.95 62064 218.98 13.55 98.84 1.28
48.49 64.23 39.57 64959 169.15 17.21 62.75 1.11
46.97 55.42 38.26 60200 136.51 9.04 54.10 0.08
44.65 33.43 40.00 72078 121.94 4.39 34.83 0.69
29.55 41.98 21.24 56228 49.61 2.38 42.41 0.09
17.04 45.55 9.80 62306 13.89 1.78 36.88 15.86
52.05 75.24 37.73 59468 73.87 4.24 66.65 0.16

426
绍兴市统计年鉴2020
12-1 续表5
地 区 Region
出口总额( 亿元 )
Total Exports
(100 mill-ion yuan)
实际利用外资( 万美元 )Foreign Capital
Actually Used(USD 10000)
一般公共预算收入(亿元)General
Public Budget Revenues(100 mill-ion yuan)
一般公共预算支出( 亿元 )General
Public Budget Expenditures
(100 mill-ion yuan)
衢州市 Quzhou Municipality 238.42 7779 137.12 449.00
衢州市区 Urban District 4952 75.92 191.48
柯城区 Kecheng District 24.31 834 12.84 52.78
衢江区 Qujiang District 41.06 - 17.52 51.83
江山市 Jiangshan 35.25 1330 20.54 67.68
常山县 Changshan 15.16 11 11.79 55.65
开化县 Kaihua 18.87 - 9.95 65.98
龙游县 Longyou 34.42 1486 18.93 68.21
舟山市 Zhoushan Municipality 501.20 50093 154.86 323.36
舟山市区 Urban District 37696 129.46 242.17
定海区 Dinghai District 89.93 8035 19.51 48.45
普陀区 Putuo District 278.20 5982 25.93 66.21
岱山县 Daishan 70.09 9286 17.60 50.90
嵊泗县 Shensi 4.70 3111 7.80 30.29
台州市 Taizhou Municipality 1565.15 62272 438.50 770.33
台州市区 Urban District 558.98 27921 178.72 281.24
椒江区 Jiaojiang District 157.67 16999 49.61 50.50
黄岩区 Huangyan District 177.70 7592 43.08 66.05
路桥区 Luqiao District 124.77 484 47.06 43.38
温岭市 Wenling 343.25 5231 78.27 128.56
临海市 Linhai 234.68 5097 65.99 108.30
玉环市 Yuhuan 257.92 15294 53.92 80.21
三门县 Sanmen 61.85 4052 18.17 53.64
天台县 Tiantai 52.00 7415 22.33 61.06
仙居县 Xianju 56.46 108 21.09 57.33
丽水市 Lishui Municipality 267.37 12079 139.83 526.50
丽水市区 Urban District 5607 54.63 128.13
青田县 Qingtian 67.47 2080 21.02 66.30
缙云县 Jinyun 60.87 2264 16.65 62.97
遂昌县 Suichang 11.12 - 10.96 50.29
松阳县 Songyang 8.94 1060 7.89 46.30
云和县 Yunhe 16.84 409 6.43 30.40
庆元县 Qingyuan 13.68 582 5.48 37.25
景宁县 Jingning 17.97 - 6.98 47.54
龙泉市 Longquan 24.38 77 9.79 57.31

427
浙江省及长江三角洲地区城市资料
Continued 5
年末金融机构人民币存款余额( 亿元 )Deposits Balance
(Year-end)(100 mill-ion yuan)
年末金融机构人民币贷款余额( 亿元 )Loans
Balance(Year-end)(100 mill-ion yuan)
全社会用电量
( 亿千瓦时 )Electricity Consump-tion of the
Whole Society
(100 mill-ion kwh)
全社会从业人员数
( 万人 )Total
Number of Employed Persons(10 000 persons)
非私营单位在岗职工平均工资( 元 / 人 )Average
Annual Wage of Staff and
Workersat Work
(yuan/person)
农村常住居民人均可支配
收入 ( 元 )Per Capita Disposable
Income of Rural
Residents(yuan)
城镇常住居民人均可支配
收入 ( 元 )Per Capita Disposable
Income of Urban
Residents(yuan)
住户存款余额
Household Deposits
工业用电Electricity Consump-
tion of Industry
2765.13 1382.35 2554.75 184.25 141.51 135.00 118256 24426 46933
1372.55 549.27 1417.71 50.84 120959 22996 47407
45.24 32.90 27.11 129738 25810 50431
27.38 21.14 23.73 124633 21888 40018
539.86 341.01 412.32 27.63 19.35 26.95 109850 26391 49465
236.01 142.81 196.00 16.39 12.25 16.47 123836 22149 39654
232.32 137.27 206.09 8.99 4.89 16.04 123452 19001 37762
384.39 211.99 322.63 27.57 20.17 24.70 110836 24856 48242
2221.31 971.65 2425.93 65.50 25.95 75.60 106441 36784 61479
1870.39 786.05 2199.83 56.97
1381.94 492.05 1688.86 25.42 11.67 33.36 108735 36825 67352
488.45 294.01 510.97 16.25 6.60 23.61 97836 36310 60128
260.91 136.83 178.45 15.82 4.50 14.04 109911 36903 54562
90.02 48.77 47.65 5.36 0.54 4.59 109991 35492 54801
9345.45 5333.52 8504.65 331.22 212.87 408.30 85578 30221 60351
4263.50 2222.00 3840.50 122.53 77.31 128.83 87164 32374 67041
1007.70 585.19 781.26 32.95 21.37 44.93 89826 32007 66899
978.12 656.60 736.31 38.75 26.71 43.10 83489 30992 60963
1149.28 751.41 940.51 30.90 17.99 40.80 83845 34501 72982
1885.96 1162.33 1610.51 60.64 36.55 93.05 89052 33842 62948
1169.57 717.24 1055.00 51.03 33.90 66.85 79657 30131 55915
762.04 475.25 631.84 47.17 35.78 41.26 84285 35340 71344
323.54 194.27 503.98 18.12 11.70 22.36 83432 26601 48875
458.40 282.52 450.67 16.08 8.44 26.47 90166 24644 48984
482.43 279.91 412.14 13.05 6.59 22.50 82873 22962 43940
2954.97 1841.34 2232.85 112.40 71.20 144.30 110875 21931 46437
960.42 476.64 897.49 26.37 13.35 31.76 125342 28220 49730
690.01 555.35 289.88 16.33 9.77 20.71 88600 25222 47954
338.47 221.30 278.50 18.50 13.06 22.73 109750 21489 45586
192.93 111.91 144.32 10.26 7.28 13.61 99803 20749 48254
180.93 120.15 144.38 8.11 5.03 15.22 118672 19371 40432
122.67 69.54 97.31 15.84 13.70 8.48 102022 20467 44155
137.89 85.52 116.31 4.27 2.30 7.83 115429 18856 40496
120.63 59.93 93.28 2.34 0.62 6.48 107983 20005 40014
211.03 141.01 171.37 8.33 4.35 17.05 109766 23459 48439

428
绍兴市统计年鉴2020
12-2 长江三角洲地区城市主要经济指标(2019年)
地 区 Region
土地面积( 平方公里 )
LandArea
(sq.km)
年末常住人口( 万人 )
Year-end Population
(10 000 persons)
地区生产总值( 亿元 )
Gross Domestic Product
(100 mill-ion yuan)
建成区面积
Build-up Areas
第一产业增加值
Value -Added of Primary Industry
上海市 Shanghai Municipality 6341 2428.14 38155.32 103.88
南京市 Nanjing Municipality 6587 850.00 14030.15 289.82
无锡市 Wuxi Municipality 4627 659.15 11852.32 122.50
常州市 Changzhou Municipality 4372 473.60 7400.86 157.00
苏州市 Suzhou Municipality 8657 1074.99 19235.80 196.70
南通市 Nantong Municipality 10549 731.80 9383.39 428.80
扬州市 Yangzhou Municipality 6591 454.90 5850.08 292.80
镇江市 Zhenjiang Municipality 3840 320.35 4127.32 140.20
泰州市 Taizhou Municipality 5788 463.61 5133.36 292.50
杭州市 Hangzhou Municipality 16853 698.45 1036.00 15373.05 325.70
宁波市 Ningbo Municipality 9816 525.68 854.20 11985.12 322.27
嘉兴市 Jiaxing Municipality 4223 371.54 480.00 5370.32 120.89
湖州市 Huzhou Municipality 5820 248.61 306.00 3122.43 133.80
绍兴市 Shaoxing Municipality 8279 379.70 505.70 5780.74 208.40
舟山市 Zhoushan Municipality 1459 77.51 117.60 1371.60 146.40
台州市 Taizhou Municipality 10050 311.70 615.00 5134.05 282.08
绍兴位次 Position in Yangse River Delta 6 9 10 8
注:①表中城市为长三角地区部分具有代表性的城市。②数据为快报数。

429
浙江省及长江三角洲地区城市资料
Main Economic Indicators by City in the Yangtse River Delta (2019)
人均 GDP( 元 / 人 )
Per CaptiaGDP
(yuan/person)
规模以上工业总产值
( 亿元 )Gross Industrial
Output Value(100 mill-ion yuan)
规模以上工业利润总额
( 亿元 )Total Industrial
Profits(100 mill-ion yuan)
社会消费品零售额( 亿元 )
Total Retail Sales of Consumer Goods
(100 mill-ion yuan)
第二产业增加值
Value -Added of Secondary
Industry
第三产业增加值
Value -Added of Tertiary Industry
工业增加值Value-
Added of Industry
10299.16 27752.28 9670.68 15.73 34427.17 2906.25 13497.21
5040.86 8699.47 4215.77 16.57 623.01 6135.74
5627.88 6101.94 5034.41 18.00 17590.93 1212.75 3983.41
3529.17 3714.69 3156.05 15.64 11058.77 742.12 2815.71
9130.18 9908.92 8316.49 17.92 33592.11 1922.23 6088.84
4602.10 4352.49 12.83 456.17 3260.19
2778.21 2779.07 2261.96 12.89 208.37 1655.90
2004.79 1982.33 1799.32 12.90 3886.41 219.08 1433.72
2525.98 2314.88 1972.11 11.07 334.81 1348.94
4875.07 10172.28 4288.42 15.25 14585.45 1126.17 6187.60
5782.92 5879.93 5164.64 14.32 17852.10 1339.87 4268.56
2892.55 2356.88 2576.03 11.28 10358.81 611.77 2102.54
1595.40 1393.23 1422.08 10.26 4663.69 315.90 1429.27
2770.77 2801.56 2325.64 11.46 6994.42 497.96 2352.56
475.53 749.67 374.41 11.68 919.47 16.27 576.10
2339.90 2512.07 1966.42 8.36 4992.92 331.54 2544.63
11 9 12 9 10
Note: a) Cities in the table are some representative cities in the Yangtse River Delta. b) The data is preliminary.

430
绍兴市统计年鉴2020
12-2 续表1
地 区 Region
进口总额( 亿元 )
TotalImports
(100 mill-ion yuan)
出口总额( 亿元 )
TotalExports
(100 mill-ion yuan)
实际利用外资( 亿美元 )
Foreign Capital Actually Used
(USD 100 million)
一般公共预算收入(亿元)General
Public Budget Revenue(100 mill-ion yuan)
上海市 Shanghai Municipality 20325.91 13720.91 190.48 7165.10
南京市 Nanjing Municipality 1821.30 3006.85 41.01 1580.03
无锡市 Wuxi Municipality 2545.48 3821.15 36.20 1036.33
常州市 Changzhou Municipality 592.06 1738.76 25.02 590.03
苏州市 Suzhou Municipality 8754.46 13232.97 46.15 2221.81
南通市 Nantong Municipality 804.75 1715.11 26.65 619.26
扬州市 Yangzhou Municipality 202.59 576.00 13.90 328.80
镇江市 Zhenjiang Municipality 229.98 541.69 6.60 306.85
泰州市 Taizhou Municipality 340.33 656.37 14.86 374.58
杭州市 Hangzhou Municipality 1839.40 3352.76 61.28 1965.97
宁波市 Ningbo Municipality 3200.63 5969.63 23.63 1468.51
嘉兴市 Jiaxing Municipality 725.69 2106.46 41.25 565.69
湖州市 Huzhou Municipality 101.59 838.59 18.99 316.07
绍兴市 Shaoxing Municipality 207.90 2251.07 6.57 528.37
舟山市 Zhoushan Municipality 869.91 501.20 5.01 154.86
台州市 Taizhou Municipality 134.93 1565.15 6.23 438.50
绍兴位次 Position in Yangse River Delta 13 7 14 10

431
浙江省及长江三角洲地区城市资料
Continued 1
年末金融机构人民币存款余额( 亿元 )Deposits Balance
(Year-end)(100 mill-ion yuan)
年末金融机构人民币贷款余额( 亿元 )Loans
Balance(Year-end)(100 mill-ion yuan)
全社会用电量
( 亿千瓦时 )Electricity Consump-tion of the
Whole Society
(100 mill-ion kwh)
全社会从业人员数( 万人 )
Total Number of Employed
Persons(10 000 persons)
农村常住居民人均可支配
收入 ( 元 )Per Capita Disposable
Income of Rural
Residents(yuan)
城镇常住居民人均可支配
收入 ( 元 )Per Capita Disposable
Income of Urban
Residents(yuan)
住户存款余额
Household Deposits
# 工业 用电Electricity Consump-
tion of Industry
123330.06 31727.7 73823.66 1568.58 748.39 33195 73615
34671.17 8105.88 32991.93 621.53 327.26 27636 64372
17165.33 6226.51 13387.19 750.82 563.31 378.00 33574 61915
10892.19 4322.79 8563.59 505.85 385.20 30491 58345
31652.10 10466.66 30116.73 1544.48 1199.82 35152 68629
13530.76 7096.99 10150.09 451.55 307.45 452.0 24303 50217
6700.46 3217.51 5374.85 259.40 171.95 268.0 23333 45550
5546.64 2421.68 5256.00 264.39 190.10 194.9 26785 52713
6879.13 3263.96 5493.92 296.00 212.36 275.0 23116 47216
43644.17 11677.34 41237.43 816.70 433.04 720.00 36255 66068
20290.86 7475.47 21774.23 807.92 590.17 589.09 36632 64886
9318.44 4313.44 8004.43 538.03 423.99 336.00 37413 61940
5163.75 2444.97 4818.46 295.02 215.51 193.90 34803 59028
9408.16 4723.28 8527.52 462.37 356.30 348.00 36120 63935
2221.31 971.65 2425.93 65.50 25.95 75.60 36784 61479
9345.45 5333.52 8504.65 331.22 212.87 408.30 30221 60351
9 9 9 9 8 5 6

432
绍兴市统计年鉴2020
附录1 绍兴市第六次人口普查资料Basic information of the sixth census of Shaoxing
指 标 Item全 市Whole
Municipality
越城区Yuecheng
District
柯桥区Keqiao District
上虞区Shangyu District
诸暨市ZhujiCity
嵊州市Shengzhou
City
新昌县Xinchang County
总户数(户) Total Households 1830205 322767 386904 287340 419006 258593 155595
户规模(人 / 户) Households size 2.68 2.74 2.66 2.71 2.76 2.63 2.45
总人口(人) Total Population 4912239 883836 1030847 779412 1157938 679762 380444
按性别分 By Sex
男 Male 2469399 438052 526407 383307 580569 346692 194372
女 Female 2442840 445784 504440 396105 577369 333070 186072
按城乡分 By Urban and Rural
市镇人口 Urban Population 2877624 643199 690969 391558 606683 345674 199541
乡村人口 Rural Population 2034615 240637 339878 387854 551255 334088 180903
按年龄分 By Age
0-14 岁 0-14 years old 627880 108967 133343 96622 150220 86542 52186
15-59 岁 5-59 years old 3796217 699230 815306 593953 890824 513927 282977
65 岁及以上 Over 65 years old 488142 75639 82198 88837 116894 79293 45281
按受教育程度分 By Education
研究生 Gradate Student 5422 3271 440 545 619 267 280
大学 University 338269 137237 40991 44610 57970 33171 24290
高中 Senior Schools 674792 132297 108054 104048 167270 95453 67670
初中 Junior Schools 2013907 306607 452798 297674 529722 291452 135654
小学 Primary Schools 1453125 212849 340970 254783 322497 208339 113687
文盲、半文盲(15 岁及以上人口)
Iliterate and Semiliterate (15 years old and over)
156950 46347 12450 40478 21498 18191 17986
流动情况(人) Flow situation
市外外来人口Migrant population Outside the City
1018525 228068 398323 108680 222737 41754 18963
注:第六次人口普查时,柯桥区为绍兴县,上虞区为上虞市。Note: At the time of the sixth census, Keqiao District was Shaoxing County and Shangyu District was Shangyu City.

433
浙江省及长江三角洲地区城市资料
附录2 全市第四次经济普查法人单位数Number of units in the fourth economic census of Shaoxing
指标名称 Item法人单位数Number of
Corporation Unit
单产业法人单位Containing
Single Industial Activity
多产业法人单位Containing
Multiple Industial Activity
总计 Total 132729 131063 1666
按国民经济行业分组 Grouped by Sector
农、林、牧、渔服务业 Farming, Forestry, Animal Husbandry and Fishery 340 336 4
采矿业 Mining 66 65 1
制造业 Manufacturing 42057 41777 280
电力、热力、燃气及水生产和供应业
Production and Supply of Electric Power, Gas and Water 384 374 10
建筑业 Construction 4053 3809 244
批发和零售业 Wholesale and Retail Trade 49419 49031 388
交通运输、仓储和邮政业 Raffic, Storage and Mail Business 1725 1647 78
住宿和餐饮业 Accommodation and Food 1375 1319 56
信息传输、软件和信息技术服务业
Information Transfer, Computer Service and Software 2214 2188 26
金融业 Finance 597 511 86
房地产业 Realty Business 3332 3224 108
租赁和商务服务业 Leasehold and Business Service 9067 8922 145
科学研究和技术服务业
Scientific Research, Technical Service and Geologic Examination 4438 4362 76
水利、环境和公共设施管理业
Water Conservancy, Environment and Public Institution Management 686 670 16
居民服务、修理和其他服务业
Neighborhood Services and Other Service 1879 1852 27
教育 Education 2469 2424 45
卫生和社会工作 Sanitation, Social Security and Social Welfare 588 569 19
文化、体育和娱乐业 Cultural, Physical and Entertainment 1959 1940 19
公共管理、社会保障和社会组织
Public Administration and Social Organization 6081 6043 38
按机构类型分组 By Type of Organizatiao
企业 Enterprises
事业单位 Institutions 119197 117639 1558

434
绍兴市统计年鉴2020
附录2 续表1
指标名称 Item法人单位数Number of
Corporation Unit
单产业法人单位Containing
Single Industial Activity
多产业法人单位Containing
Multiple Industial Activity
机关 Office 562 542 20
社会团体 Social Group 1515 1514 1
民办非企业单位 Private Non-enterprise Unit 1664 1663 1
基金会 Foundation 25 25 0
居委会 Neighborhood Committees 510 510 0
村委会 Villages Committees 2152 2138 14
农民专业合作社 Farmer's Professional Cooperative 2557 2548 9
农村集体经济组织 Rural Collection Economic Organization 1598 1597 1
其他组织机构 Others 599 598 1
按登记注册类型分组 By Registered Type
内资企业 Domestic Funded Enterprises 130916 129282 1634
国有企业 Sate-owned Enterprises 3385 3288 97
集体企业 Collective Owned Enterprises 2427 2389 38
股份合作企业 Cooperative Enterprises 44 39 5
联营企业 Joint Ownership Enterprises 57 56 1
国有联营企业 Sate Jiont Ownership Enterprises 4 4 0
集体联营企业 Collective Jiont Ownership Enterprises 25 24 1
国有与集体联营企业
Sate-Collective Joint Enterprises 3 3 0
其他联营企业 Other Jiont Ownership Enterprises 25 25 0
有限责任公司 Limited Liability Corporations 4450 4224 226
国有独资公司 Sole State-funded Corporations 305 281 24
其他有限责任公司 Other Limited liability Corporations 4145 3943 202
股份有限公司 Share-holding Corporations Ltd 752 646 106
私营企业 Private Enterprises 112325 111188 1137
私营独资企业 Private-funded Enterprises 11549 11508 41

435
浙江省及长江三角洲地区城市资料
附录2 续表2
指标名称 Item法人单位数Number of
Corporation Unit
单产业法人单位Containing
Single Industial Activity
多产业法人单位Containing
Multiple Industial Activity
私营合伙企业 Private Partnership Enterprises 990 988 2
私营有限责任公司 Private Limited Liability Corporations 99056 97989 1067
私营股份有限公司 Private Shareholding Corporations Ltd 730 703 27
其他企业 Others 7476 7452 24
港、澳、台商投资企业 Enterprises with Investment from Hong Kong, Macao and Taiwan 777 761 16
合资经营企业 ( 港或澳、台资 )
Joint-venture Enterprises with Investment from Hong Kong, Macao and Taiwan 388 378 10
合作经营企业 ( 港或澳、台资 )
Cooperative Enterprises with Investment from Hong Kong, Macao and Taiwan 9 9 0
港、澳、台商独资经营企业
Sole Investment from Hong Kong, Macao and Taiwan 354 350 4
港、澳、台商投资股份有限公司
Share-holding Corporations Ltd. With Investment from Hong Kong, Macao and Taiwan
19 18 1
其他港澳台投资企业 Others 7 6 1
外商投资企业 Enterprises With Foreign Investment 1036 1020 16
中外合资经营企业 Joint-venture Enterprises With Foreign Investment 353 343 10
中外合作经营企业 Cooperative Enterprises With Foreign Investment 4 4 0
外资企业 Enterprises With Sole Foreign Investment 618 614 4
外商投资股份有限公司
Share-holding Corporations Ltd. With Foreign Investment 14 13 1
其他外商投资企业 Others 47 46 1
按地区分组(行政区划)
越城区 Yuecheng District 23117 22619 498
柯桥区 Keqiao District 41479 41183 296
上虞区 Shangyu District 18620 18421 199
诸暨市 Zhuji City 27845 27595 250
嵊州市 Shengzhou City 14033 13812 221
新昌县 Xinchang City 7625 7428 197
注:上表统计为二三产业的法人单位数,不包含第一产业农、林、牧、渔业法人单位。Note: The above table shows the number of legal entities of the secondary and tertiary industries, excluding the legal entities of
agriculture, forestry, animal husbandry and fishery of the primary industries.

中国统计年鉴 中国统计摘要 中国第三产业统计年鉴
中国第三次全国农业普查综合资料 国际统计年鉴 金砖国家联合统计手册
中国-东盟国家统计手册 中国农村统计年鉴 中国县域统计年鉴
中国农产品价格调查年鉴 中国城市统计年鉴 中国价格统计年鉴
中国贸易外经统计年鉴 中国零售和餐饮连锁企业统计年鉴 中国商品交易市场统计年鉴
大中型批发零售和住宿餐饮企业统计年鉴 中国住户调查年鉴 中国工业统计年鉴
中国环境统计年鉴 中国能源统计年鉴 中国建筑业统计年鉴
中国房地产统计年鉴 投资领域统计年鉴 中国对外直接投资统计公报
中国人口和就业统计年鉴 中国劳动统计年鉴 中国社会统计年鉴
中国科技统计年鉴 中国高技术产业统计年鉴 全国企业创新调查年鉴
中国文化及相关产业统计年鉴 2018年时间利用调查资料 中国妇女儿童状况统计资料
中国基本单位统计年鉴 中国教育统计年鉴 中国教育经费统计年鉴
中国民族统计年鉴 中国残疾人事业统计年鉴 长江经济带发展统计年鉴
Python数据分析基础(第二版) 非参数统计(第五版) 现代金融投资统计分析(第四版)
统计通俗读物/统计科普图书
中国农业统计资料1949-2019 第四次全国经济普查地图集 中国经济普查年鉴2018
新编英汉汉英统计大词典 中国国民经济核算体系2016 国民经济行业分类注释
挑大学选专业2020—考研择校指南
地址:北京市丰台区西三环南路甲6号 邮政编码:100073 网址:http://www.zgtjcbs.com
重点图书
发行部电话:(010)63376907 63376908 63376909 同楫行书店电话:(010)68783171 68783172
市(县)级综合统计年鉴系列
统计方法应用/实用手册
调查年鉴系列
潍坊 聊城 郑州 洛阳 平顶山 三门峡 南阳 商丘 信阳 济源 汝州 武汉 十堰 荆州 宜昌 荆门 咸宁 黄冈
长沙 鹰潭 广州 深圳 惠州 东莞 汕尾 湛江 肇庆 南宁 柳州 桂林 贵港 梧州 来宾 河池 防城港 海口 三亚
滨海新区 石家庄 唐山 邯郸 保定 沧州 邢台 廊坊 承德 衡水 秦皇岛 张家口 太原 大同 阳泉 长治 晋城
国民经济核算初级教程(第二版) 国民经济核算教程(第五版) 概率统计基础
朔州 晋中 运城 忻州 临汾 吕梁 呼和浩特 鄂尔多斯 包头 沈阳 大连 长春 延吉 四平 白山 通化 哈尔滨
齐齐哈尔 黑龙江垦区 上海浦东新区 南京 无锡 徐州 常州 苏州 南通 连云港 淮安 盐城 扬州 镇江 泰州
儋州 成都 内江 贵阳 黔南 毕节 昆明 文山 德宏 西安 延安 安康 铜川 汉中 商洛 银川 兰州 庆阳 乌鲁木齐
中国统计出版社有限公司最新图书简目
统计资料
省级综合统计年鉴系列
(仅供参考,以实际出版为准)
北京 天津 河北 山西 内蒙古 辽宁 吉林 黑龙江 上海 江苏 浙江 安徽 福建 江西 山东 河南 湖北 湖南
广东 广西 海南 重庆 四川 贵州 云南 西藏 陕西 甘肃 青海 宁夏 新疆 新疆生产建设兵团
宿迁 江阴 丹阳 海门 张家港 杭州 宁波 温州 嘉兴 湖州 绍兴 金华 衢州 舟山 台州 丽水 合肥 安庆 福州
厦门 宁德 漳州 龙岩 莆田 泉州 三明 南平 南昌 九江 上饶 新余 抚州 赣州 景德镇 济南 青岛 枣庄
挑大学选专业2020—高考志愿填报指南 中华医学统计百科全书
全国统计专业技术资格考试系列考试用书: 统计业务知识(第四版修订版) 统计业务知识学习指导与习题
全国统计专业技术资格考试系列考试用书: 统计相关知识(第四版) 统计相关知识学习指导与习题
昌吉 阿勒泰 兵团一师、二师、三师、四师、六师、七师、八师、十师、十三师、十四师
中国国民经济核算知识问答(修订版) 地区生产总值核算国际比较研究 新中国统计制度方法的发展与改革
天津 内蒙古 上海 河南 湖北 湖南 广东 广西 重庆 四川 云南 甘肃 宁夏 南宁 贵港 昆明
领导干部统计知识问答 统计公文写作及会议办理实用手册 大数据在统计工作中的应用案例汇编