2020 strategic report: our economic outlook · 2020 strategic report: our economic outlook 1 2020...
TRANSCRIPT
2020 Strategic Report: Our Economic Outlook
2020 Strategic Report: Our Economic Outlook 1
2020 Strategic Report: Our Economic Outlook Over the past decade, our “Template for Understanding What Is Going On” has been an important frame
of reference for making sense of things and anticipating what is likely to come next—from the deleveraging
that produced the financial crisis, to the ensuing weak response to monetary stimulation, then the beautiful deleveraging
and the slowest expansion on record despite zero to negative interest rates and $15 trillion of money printing, and most
recently the heightened response to what was a moderate tightening of monetary policies. As we apply this template
going forward, we see a confluence of forces producing what amounts to a paradigm shift.
Before getting into it, recall that through our template, we see four big forces driving economic growth:
• Productivity: the source of rising real incomes over time, but not of cycles.
• Long-term debt cycle: pertaining to the level of debts in relation to incomes, which reflects the potential for credit growth and the responsiveness of the economy to changes in interest rates.
• Short-term debt cycle: the business cycle, typically driven by the central bank through changes in interest rates.
• Politics: through the selection of leaders and the choices that they make.
2020 Strategic Report: Our Economic Outlook 2
The interaction of these forces produces cycles in the economy and markets, which oscillate around equilibriums pertaining to credit in relation to income, output in relation to capacity, and the pricing of assets in relation to acceptable risk premiums. Monetary policy and fiscal policy are the levers used to manage economies around these equilibriums.
These forces and the policy responses to them have stretched a number of conditions to their limits. One of our investment principles is to identify the current paradigm, examine if and how it is unsustainable, and visualize how the paradigm shift will transpire when that which is unsustainable stops. Looking back:
• Central banks have pushed monetary policy to the end of its useful life. They did this first by lowering interest rates until they hit zero, then by doing so much quantitative easing (i.e., printing money and buying financial assets) that its effects are diminishing.
• All this stimulus pushed up equities and other asset prices, producing great returns looking back, but it leaves future expected returns much lower. There has been a wave of stock buybacks, mergers, acquisitions, and private equity and venture capital investing that has been funded by both cheap money and credit as well as the enormous amount of cash that was pushed into the system.
• These policies contributed to widening wealth and income gaps, which are now at extremes not seen since the 1930s. QE disproportionately benefited those who held assets over those who didn’t, because only a fraction of the money injected into financial markets ultimately made its way into real economy spending and income. At the same time, outsourcing and automation competing with low- and middle-skill workers depressed wages, favoring capital over labor. Corporates also benefited from deregulatory policies and corporate tax cuts.
• This pro-corporate environment fueled a rapid expansion in corporate profit margins to historical highs—but it has also given rise to a social and political backlash, leading to increased talk of anti-corporate, pro-worker actions. It is unlikely that the past rate of profit margin growth will be sustained, and there is a good possibility that margins will shrink in the environment ahead.
As we enter a new paradigm, we see the following dynamics at work:
• Central banks will struggle to stimulate. Recognizing the asymmetric risks, central banks have already entered a new paradigm where they are no longer tightening proactively to prevent inflation or normalize interest rates. Over time, we expect to see a transition to more managed rates and yield-curve targeting, similar to what we saw in the US in the ’40s and early ’50s, or what Japan is doing today (with Japan once again exemplifying where the broader developed world may be headed).
• This is intended to sustain the expansion in an unprecedented way, and that is a big deal. While most cycles end because central banks tighten as they perceive inflation risks, this cycle will not be ended by central bank tightening, or at least it won’t until far into the future when inflationary pressures have exceeded the upper range of acceptable targets. And though the cycle is extended, it is weak, and when the next downturn comes, central banks will probably not have the ammunition they need.
• Over time, we’d expect to see a march toward expansionary fiscal policy nearly everywhere. We expect policy makers will need to shift to what we’ve been discussing for a long time—what we call “Monetary Policy 3”—which is essentially coordinated monetary and fiscal policy aimed directly at supporting spending, with central banks monetizing fiscal deficits. This is likely whether from the right (through higher military spending or lower taxes) or from the left (through more direct spending on infrastructure or social programs). So far, there has been a palpable shift in the policy conversation in favor of more fiscal easing, but much less action. While political obstacles may slow it down in the near term (in particular, the divided government in the US), the trajectory seems clear.
• The large wealth divide is likely to produce sustained political conflict and extremism, which implies the possibility of a wider range of policy options that can impact growth. So we expect political outcomes and policy choices to have larger impacts on markets and economies than we have seen in the past, compared to the “normal” business cycle drivers we are used to.
2020 Strategic Report: Our Economic Outlook 3
• Past policy shifts that benefited corporations/capital/the wealthy shouldn’t be extrapolated, and there is a good chance they will reverse. How extreme the changes are and how quickly they occur are political questions, but the pressures for such a shift are likely to continue to mount until the underlying disparities are addressed.
• With real yields at lows and risk premiums compressed, there is much less room to boost asset prices and generate required returns. In other words, expected asset returns are much lower than what we’ve experienced looking back, likely resulting in weaker income growth than is needed to service debt and other promises (pensions, entitlements, and so on) that will be increasingly coming due.
While we believe these are the key characteristics of this emerging new paradigm, what we don’t know about how it will play out is greater than what we do know. For example, the outcomes of populism from the left (which tends to be pro-labor) are different from the outcomes of populism from the right (which tends to be pro-corporate), which are different from the outcomes of continued political division and stalemate in the face of ongoing deflationary pressures. To us, this all points to approaching the next decade with humility and caution: not extrapolating the environment of the last decade, recognizing the wide range of potential paths from here, and taking steps to ensure acceptable outcomes across all of them.
That said, the past paradigm and the one we are entering apply much more to the developed world and the West than they do to the East.
With the rise of China and the coalescing of an Asia economic bloc, we are now in a tri-polar world, driven primarily by three monetary and credit systems: the US dollar, the euro, and the renminbi. These three monetary systems are the driving force of a global economy that is now roughly balanced between devel-oped and emerging, with increases in global output now coming more from emerging economies than from developed ones. With respect to those monetary systems, the US is still the biggest global economy, the dollar is still the world’s primary reserve currency, and dollars circulate globally. Euro monetary and credit conditions drive the European economy, the world’s second largest, and euros circulate globally about one-quarter as much as dollars. The renminbi still only circulates within China, but China’s monetary policy is now independent of the Fed, China’s domestic credit market is as large as that of the US, and China’s economy is the engine of growth across emerging Asia, an increasingly independent and inwardly focused economic bloc that has an output comparable to the US plus Europe and that has contributed more than twice as much to the increase in global output over the past three years as the US plus Europe. The expansion from two dominant monetary systems to three occurred as a consequence of the size of the emerging Asia bloc with China at its core, and China delinking its currency and monetary policy from the US dollar in late 2015.
For investors, the emergence of this tri-polar world is creating new geopolitical risks. But it is also a tremen-dous opportunity to increase deep, fundamentally based investment diversification, because the monetary and credit system is the ultimate driver of liquidity, risk premiums, and economic/market cycles. In addition, secular conditions between developed and emerging economies could not be more different, as seen in their prospects for future productivity growth and where they stand in their long-term debt cycles. At the end of the day, thinking in terms of a balanced exposure to these monetary/economic systems is an important question to consider.
With respect to how this plays out and what to do about it, we’d summarize it as follows. We then go into these topics more deeply.
• What we expect going forward is significantly impacted by how we got to where we are now, being at the tail end of the long-term and short-term debt cycles.
• The potential for above-potential growth is limited, given ongoing high debt burdens, already low unemployment, and little room to cut interest rates, but secular deflationary forces give central bankers the license to do all they can to keep the expansion going.
• The power of monetary policy to stimulate economies on its own is now substantially diminished, requiring what we refer to as Monetary Policy 3 (MP3), where the central bank engages directly in the economy by way of coordinated government and central bank actions.
2020 Strategic Report: Our Economic Outlook 4
• The economies of the emerging world, especially emerging Asia, are in a different stage of their long-term and short-term debt cycles and have greater potential for rising productivity, presenting unique and diversifying investment opportunities and challenges.
• Fundamentally based diversification to environments and to geographies will be key, and new alpha opportunities will arise from the box that central banks find themselves in.
Diving more deeply into how things will play out and what to do about it:
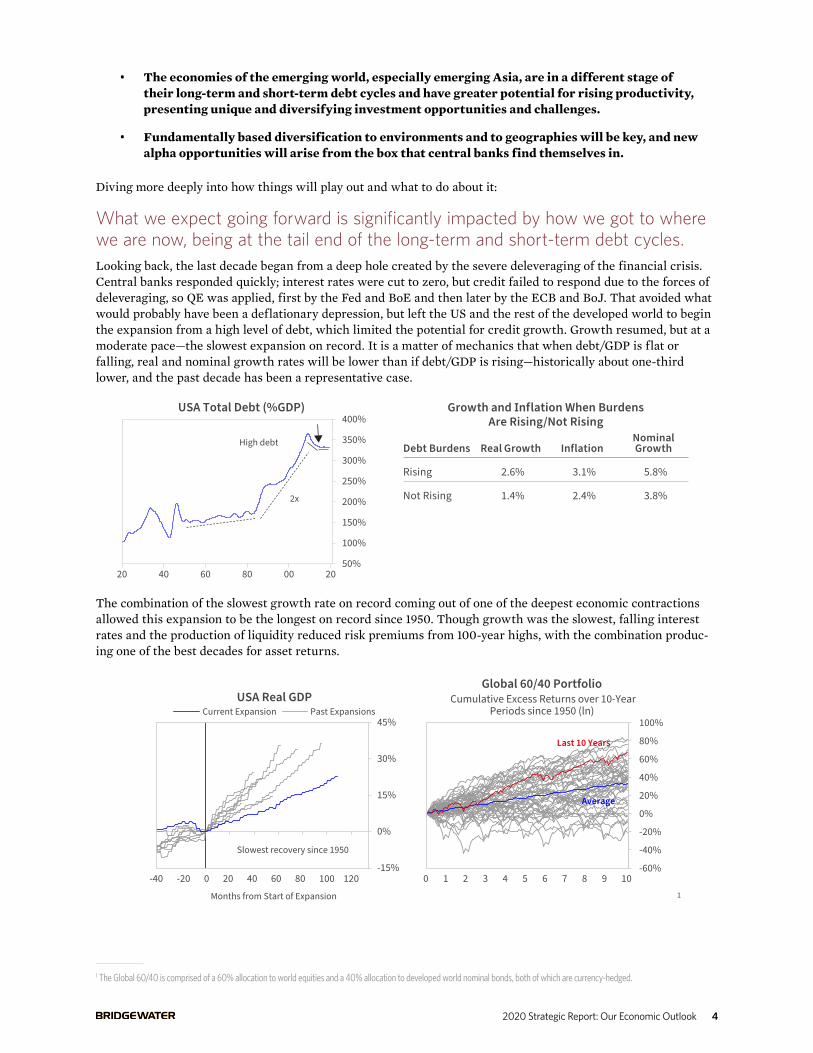
What we expect going forward is significantly impacted by how we got to where we are now, being at the tail end of the long-term and short-term debt cycles.Looking back, the last decade began from a deep hole created by the severe deleveraging of the financial crisis. Central banks responded quickly; interest rates were cut to zero, but credit failed to respond due to the forces of deleveraging, so QE was applied, first by the Fed and BoE and then later by the ECB and BoJ. That avoided what would probably have been a deflationary depression, but left the US and the rest of the developed world to begin the expansion from a high level of debt, which limited the potential for credit growth. Growth resumed, but at a moderate pace—the slowest expansion on record. It is a matter of mechanics that when debt/GDP is flat or falling, real and nominal growth rates will be lower than if debt/GDP is rising—historically about one-third lower, and the past decade has been a representative case.
Grow lation When BurdensAre Rising/Not Rising
Debt Burdens Real Growth InflationNominal Growth
Rising 2.6% 3.1% 5.8%
Not Rising 1.4% 2.4% 3.8%
USA Total Debt (%GDP)
50%
100%
150%
200%
250%
300%
350%
400%
20 40 60 80 00 20
High debt
2x
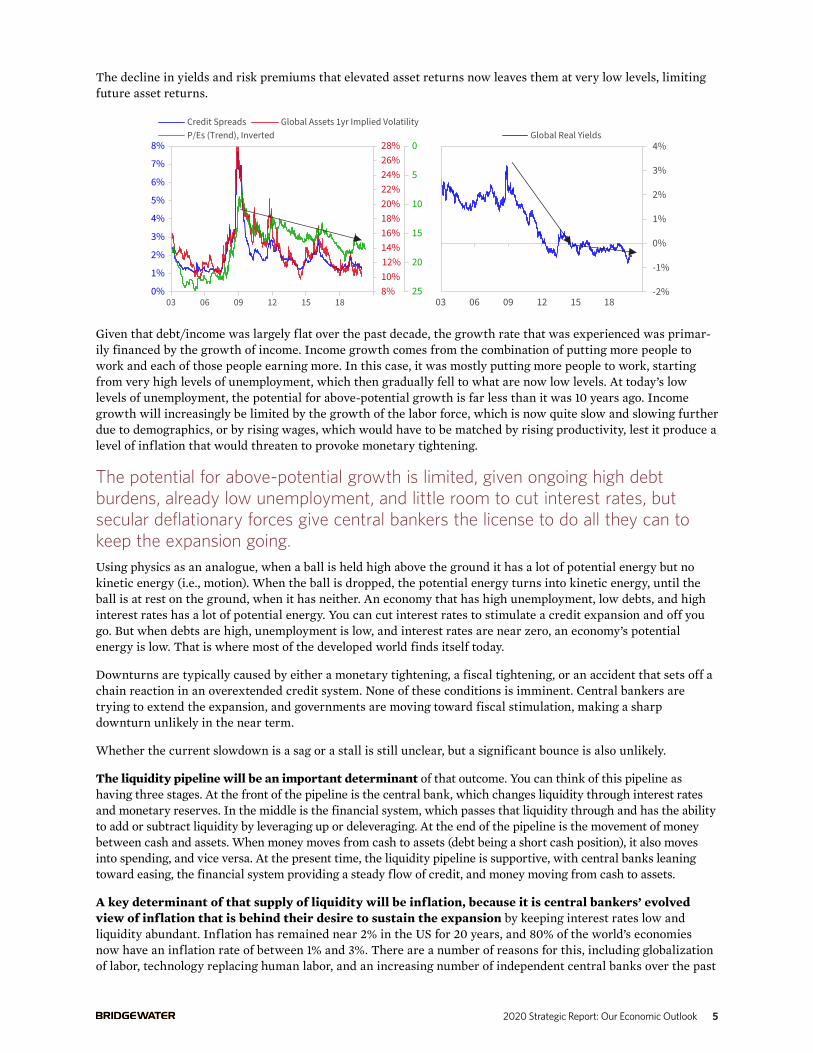
The combination of the slowest growth rate on record coming out of one of the deepest economic contractions allowed this expansion to be the longest on record since 1950. Though growth was the slowest, falling interest rates and the production of liquidity reduced risk premiums from 100-year highs, with the combination produc-ing one of the best decades for asset returns.
Global 60/40 Portfolio Cumulative Excess Returns over 10-Year
Periods since 1950 (ln)
-60%
-40%
-20%
0%
20%
40%
60%
80%
100%
0 1 2 3 4 5 6 7 8 9 10
Last 10 Years
Average
USA Real GDPCurrent Expansion Past Expansions
-15%
0%
15%
30%
45%
-40 -20 0 20 40 60 80 100 120
Slowest recovery since 1950
Months from Start of Expansion 1
1 The Global 60/40 is comprised of a 60% allocation to world equities and a 40% allocation to developed world nominal bonds, both of which are currency-hedged.
2020 Strategic Report: Our Economic Outlook 5
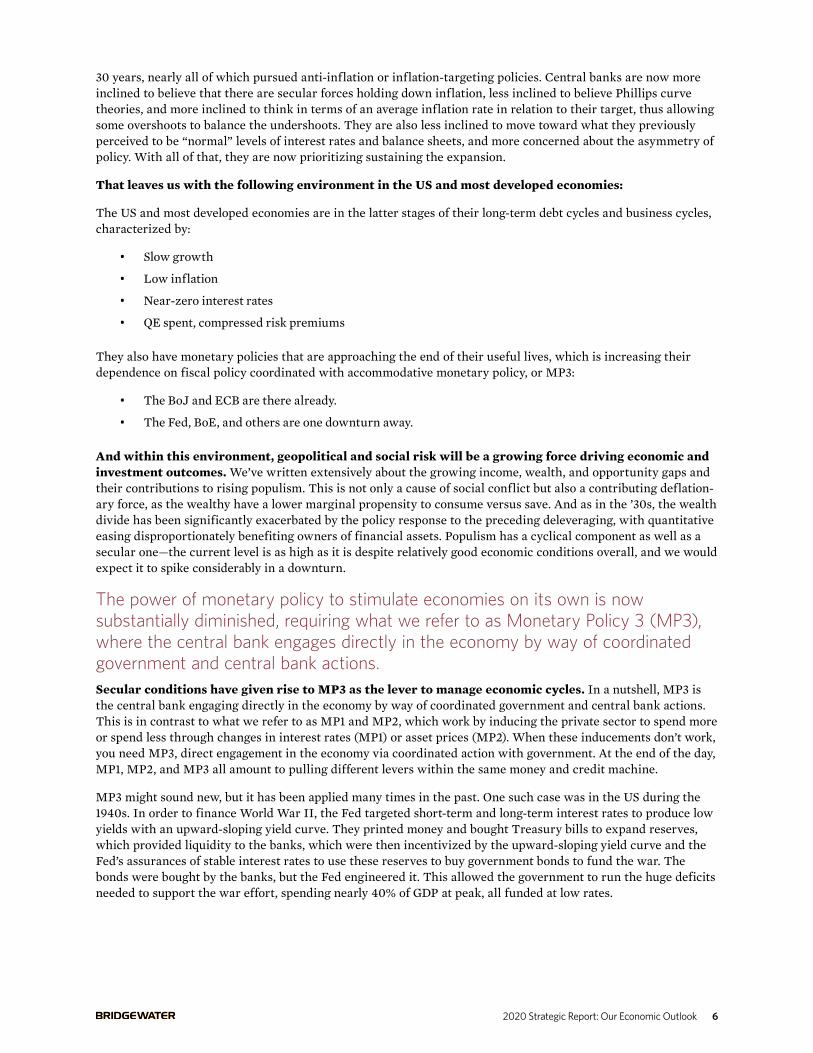
The decline in yields and risk premiums that elevated asset returns now leaves them at very low levels, limiting future asset returns.
Global Real Yields
-2%
-1%
0%
1%
2%
3%
4%
03 06 09 12 15 18
12%
8%10%
14%16%18%20%22%24%26%28%
0%
1%
2%
3%
4%
5%
6%
7%
8%
03 06 09 12 15 18
0
5
10
15
20
25
Credit Spreads Global Assets 1yr Implied VolatilityP/Es (Trend), Inverted
Given that debt/income was largely flat over the past decade, the growth rate that was experienced was primar-ily financed by the growth of income. Income growth comes from the combination of putting more people to work and each of those people earning more. In this case, it was mostly putting more people to work, starting from very high levels of unemployment, which then gradually fell to what are now low levels. At today’s low levels of unemployment, the potential for above-potential growth is far less than it was 10 years ago. Income growth will increasingly be limited by the growth of the labor force, which is now quite slow and slowing further due to demographics, or by rising wages, which would have to be matched by rising productivity, lest it produce a level of inflation that would threaten to provoke monetary tightening.
The potential for above-potential growth is limited, given ongoing high debt burdens, already low unemployment, and little room to cut interest rates, but secular deflationary forces give central bankers the license to do all they can to keep the expansion going.Using physics as an analogue, when a ball is held high above the ground it has a lot of potential energy but no kinetic energy (i.e., motion). When the ball is dropped, the potential energy turns into kinetic energy, until the ball is at rest on the ground, when it has neither. An economy that has high unemployment, low debts, and high interest rates has a lot of potential energy. You can cut interest rates to stimulate a credit expansion and off you go. But when debts are high, unemployment is low, and interest rates are near zero, an economy’s potential energy is low. That is where most of the developed world finds itself today.
Downturns are typically caused by either a monetary tightening, a fiscal tightening, or an accident that sets off a chain reaction in an overextended credit system. None of these conditions is imminent. Central bankers are trying to extend the expansion, and governments are moving toward fiscal stimulation, making a sharp downturn unlikely in the near term.
Whether the current slowdown is a sag or a stall is still unclear, but a significant bounce is also unlikely.
The liquidity pipeline will be an important determinant of that outcome. You can think of this pipeline as having three stages. At the front of the pipeline is the central bank, which changes liquidity through interest rates and monetary reserves. In the middle is the financial system, which passes that liquidity through and has the ability to add or subtract liquidity by leveraging up or deleveraging. At the end of the pipeline is the movement of money between cash and assets. When money moves from cash to assets (debt being a short cash position), it also moves into spending, and vice versa. At the present time, the liquidity pipeline is supportive, with central banks leaning toward easing, the financial system providing a steady flow of credit, and money moving from cash to assets.
A key determinant of that supply of liquidity will be inflation, because it is central bankers’ evolved view of inflation that is behind their desire to sustain the expansion by keeping interest rates low and liquidity abundant. Inflation has remained near 2% in the US for 20 years, and 80% of the world’s economies now have an inflation rate of between 1% and 3%. There are a number of reasons for this, including globalization of labor, technology replacing human labor, and an increasing number of independent central banks over the past
2020 Strategic Report: Our Economic Outlook 6
30 years, nearly all of which pursued anti-inflation or inflation-targeting policies. Central banks are now more inclined to believe that there are secular forces holding down inflation, less inclined to believe Phillips curve theories, and more inclined to think in terms of an average inflation rate in relation to their target, thus allowing some overshoots to balance the undershoots. They are also less inclined to move toward what they previously perceived to be “normal” levels of interest rates and balance sheets, and more concerned about the asymmetry of policy. With all of that, they are now prioritizing sustaining the expansion.
That leaves us with the following environment in the US and most developed economies:
The US and most developed economies are in the latter stages of their long-term debt cycles and business cycles, characterized by:
• Slow growth
• Low inflation
• Near-zero interest rates
• QE spent, compressed risk premiums
They also have monetary policies that are approaching the end of their useful lives, which is increasing their dependence on fiscal policy coordinated with accommodative monetary policy, or MP3:
• The BoJ and ECB are there already.
• The Fed, BoE, and others are one downturn away.
And within this environment, geopolitical and social risk will be a growing force driving economic and investment outcomes. We’ve written extensively about the growing income, wealth, and opportunity gaps and their contributions to rising populism. This is not only a cause of social conflict but also a contributing deflation-ary force, as the wealthy have a lower marginal propensity to consume versus save. And as in the ’30s, the wealth divide has been significantly exacerbated by the policy response to the preceding deleveraging, with quantitative easing disproportionately benefiting owners of financial assets. Populism has a cyclical component as well as a secular one—the current level is as high as it is despite relatively good economic conditions overall, and we would expect it to spike considerably in a downturn.
The power of monetary policy to stimulate economies on its own is now substantially diminished, requiring what we refer to as Monetary Policy 3 (MP3), where the central bank engages directly in the economy by way of coordinated government and central bank actions.Secular conditions have given rise to MP3 as the lever to manage economic cycles. In a nutshell, MP3 is the central bank engaging directly in the economy by way of coordinated government and central bank actions. This is in contrast to what we refer to as MP1 and MP2, which work by inducing the private sector to spend more or spend less through changes in interest rates (MP1) or asset prices (MP2). When these inducements don’t work, you need MP3, direct engagement in the economy via coordinated action with government. At the end of the day, MP1, MP2, and MP3 all amount to pulling different levers within the same money and credit machine.
MP3 might sound new, but it has been applied many times in the past. One such case was in the US during the 1940s. In order to finance World War II, the Fed targeted short-term and long-term interest rates to produce low yields with an upward-sloping yield curve. They printed money and bought Treasury bills to expand reserves, which provided liquidity to the banks, which were then incentivized by the upward-sloping yield curve and the Fed’s assurances of stable interest rates to use these reserves to buy government bonds to fund the war. The bonds were bought by the banks, but the Fed engineered it. This allowed the government to run the huge deficits needed to support the war effort, spending nearly 40% of GDP at peak, all funded at low rates.
2020 Strategic Report: Our Economic Outlook 7
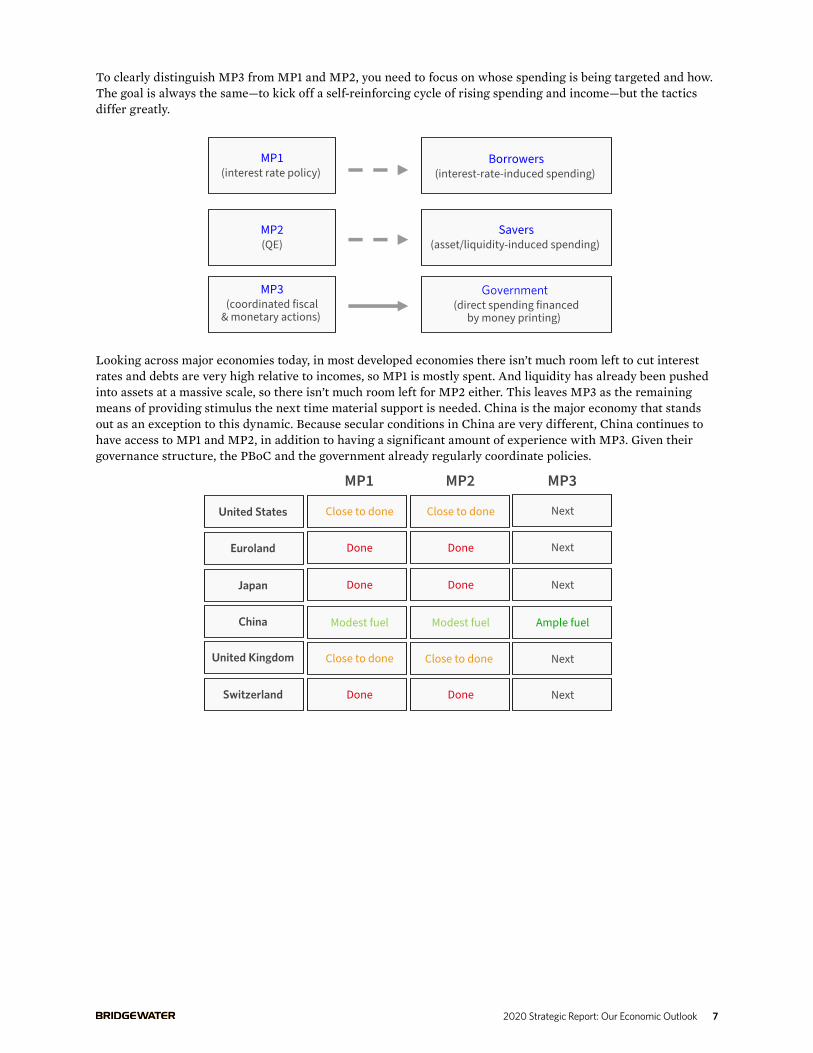
To clearly distinguish MP3 from MP1 and MP2, you need to focus on whose spending is being targeted and how. The goal is always the same—to kick off a self-reinforcing cycle of rising spending and income—but the tactics differ greatly.
MP1(interest rate policy)
Borrowers(interest-rate-induced spending)
MP2(QE)
Savers(asset/liquidity-induced spending)
MP3(coordinated fiscal
& monetary actions)
Government (direct spending financed
by money printing)
Looking across major economies today, in most developed economies there isn’t much room left to cut interest rates and debts are very high relative to incomes, so MP1 is mostly spent. And liquidity has already been pushed into assets at a massive scale, so there isn’t much room left for MP2 either. This leaves MP3 as the remaining means of providing stimulus the next time material support is needed. China is the major economy that stands out as an exception to this dynamic. Because secular conditions in China are very different, China continues to have access to MP1 and MP2, in addition to having a significant amount of experience with MP3. Given their governance structure, the PBoC and the government already regularly coordinate policies.
United States
Euroland
Japan
China
United Kingdom
Switzerland
Close to done
Done
Done
Modest fuel
Close to done
Done
MP1
Close to done
Done
Done
Modest fuel
Close to done
Done
MP2 MP3
Next
Next
Next
Ample fuel
Next
Next
2020 Strategic Report: Our Economic Outlook 8
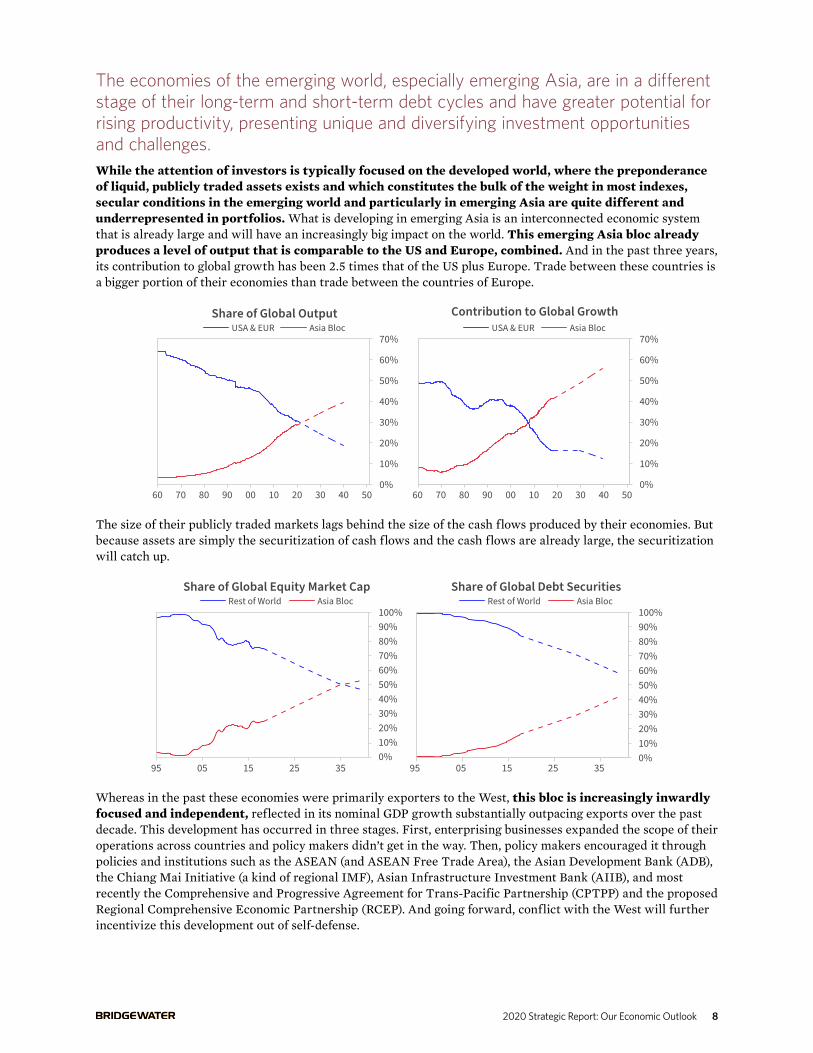
The economies of the emerging world, especially emerging Asia, are in a different stage of their long-term and short-term debt cycles and have greater potential for rising productivity, presenting unique and diversifying investment opportunities and challenges.While the attention of investors is typically focused on the developed world, where the preponderance of liquid, publicly traded assets exists and which constitutes the bulk of the weight in most indexes, secular conditions in the emerging world and particularly in emerging Asia are quite different and underrepresented in portfolios. What is developing in emerging Asia is an interconnected economic system that is already large and will have an increasingly big impact on the world. This emerging Asia bloc already produces a level of output that is comparable to the US and Europe, combined. And in the past three years, its contribution to global growth has been 2.5 times that of the US plus Europe. Trade between these countries is a bigger portion of their economies than trade between the countries of Europe.
0%
10%
20%
30%
40%
50%
60%
70%
60 70 80 90 00 10 20 30 40 50
Share of Global OutputUSA & EUR Asia Bloc
60 70 80 90 00 10 20 30 40 500%
10%
20%
30%
40%
50%
60%
70%
Contribution to Global GrowthUSA & EUR Asia Bloc
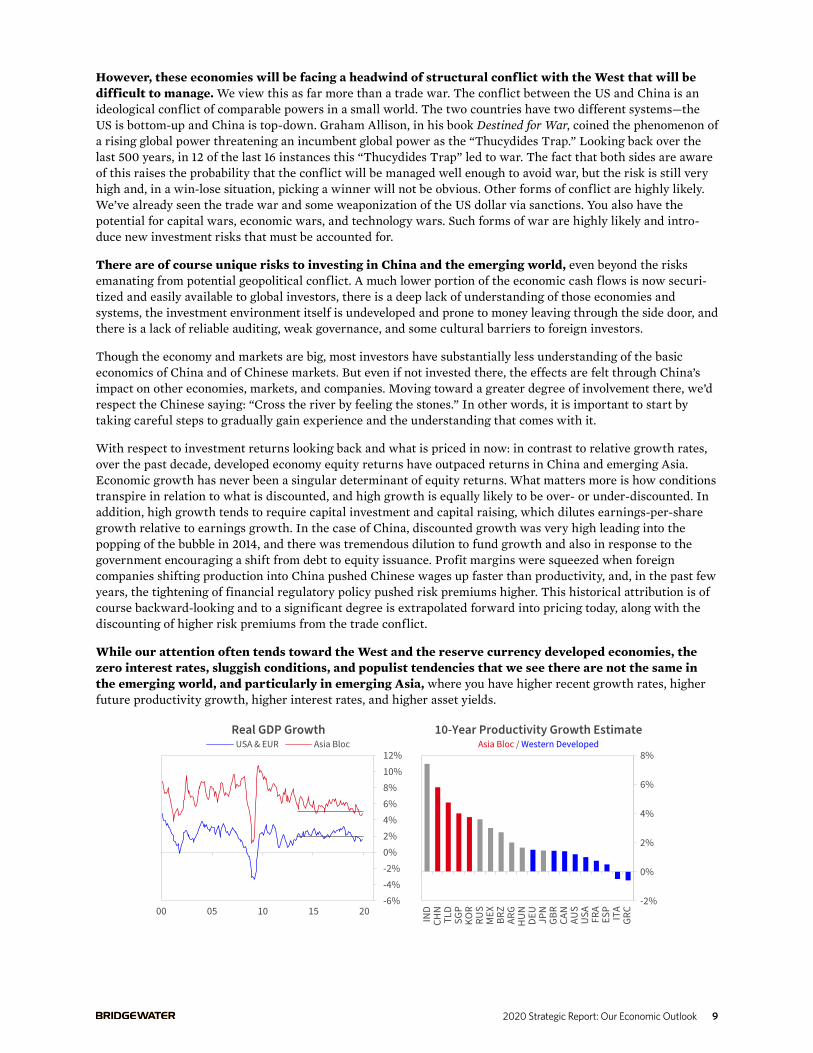
The size of their publicly traded markets lags behind the size of the cash flows produced by their economies. But because assets are simply the securitization of cash flows and the cash flows are already large, the securitization will catch up.
0%10%20%30%40%50%60%70%80%90%100%
95 05 15 25 35
Share of Global Equity Market CapRest of World Asia Bloc
95 05 15 25 350%10%20%30%40%50%60%70%80%90%100%
Share of Global Debt SecuritiesRest of World Asia Bloc
Whereas in the past these economies were primarily exporters to the West, this bloc is increasingly inwardly focused and independent, reflected in its nominal GDP growth substantially outpacing exports over the past decade. This development has occurred in three stages. First, enterprising businesses expanded the scope of their operations across countries and policy makers didn’t get in the way. Then, policy makers encouraged it through policies and institutions such as the ASEAN (and ASEAN Free Trade Area), the Asian Development Bank (ADB), the Chiang Mai Initiative (a kind of regional IMF), Asian Infrastructure Investment Bank (AIIB), and most recently the Comprehensive and Progressive Agreement for Trans-Pacific Partnership (CPTPP) and the proposed Regional Comprehensive Economic Partnership (RCEP). And going forward, conflict with the West will further incentivize this development out of self-defense.
2020 Strategic Report: Our Economic Outlook 9
However, these economies will be facing a headwind of structural conflict with the West that will be difficult to manage. We view this as far more than a trade war. The conflict between the US and China is an ideological conflict of comparable powers in a small world. The two countries have two different systems—the US is bottom-up and China is top-down. Graham Allison, in his book Destined for War, coined the phenomenon of a rising global power threatening an incumbent global power as the “Thucydides Trap.” Looking back over the last 500 years, in 12 of the last 16 instances this “Thucydides Trap” led to war. The fact that both sides are aware of this raises the probability that the conflict will be managed well enough to avoid war, but the risk is still very high and, in a win-lose situation, picking a winner will not be obvious. Other forms of conflict are highly likely. We’ve already seen the trade war and some weaponization of the US dollar via sanctions. You also have the potential for capital wars, economic wars, and technology wars. Such forms of war are highly likely and intro-duce new investment risks that must be accounted for.
There are of course unique risks to investing in China and the emerging world, even beyond the risks emanating from potential geopolitical conflict. A much lower portion of the economic cash flows is now securi-tized and easily available to global investors, there is a deep lack of understanding of those economies and systems, the investment environment itself is undeveloped and prone to money leaving through the side door, and there is a lack of reliable auditing, weak governance, and some cultural barriers to foreign investors.
Though the economy and markets are big, most investors have substantially less understanding of the basic economics of China and of Chinese markets. But even if not invested there, the effects are felt through China’s impact on other economies, markets, and companies. Moving toward a greater degree of involvement there, we’d respect the Chinese saying: “Cross the river by feeling the stones.” In other words, it is important to start by taking careful steps to gradually gain experience and the understanding that comes with it.
With respect to investment returns looking back and what is priced in now: in contrast to relative growth rates, over the past decade, developed economy equity returns have outpaced returns in China and emerging Asia. Economic growth has never been a singular determinant of equity returns. What matters more is how conditions transpire in relation to what is discounted, and high growth is equally likely to be over- or under-discounted. In addition, high growth tends to require capital investment and capital raising, which dilutes earnings-per-share growth relative to earnings growth. In the case of China, discounted growth was very high leading into the popping of the bubble in 2014, and there was tremendous dilution to fund growth and also in response to the government encouraging a shift from debt to equity issuance. Profit margins were squeezed when foreign companies shifting production into China pushed Chinese wages up faster than productivity, and, in the past few years, the tightening of financial regulatory policy pushed risk premiums higher. This historical attribution is of course backward-looking and to a significant degree is extrapolated forward into pricing today, along with the discounting of higher risk premiums from the trade conflict.
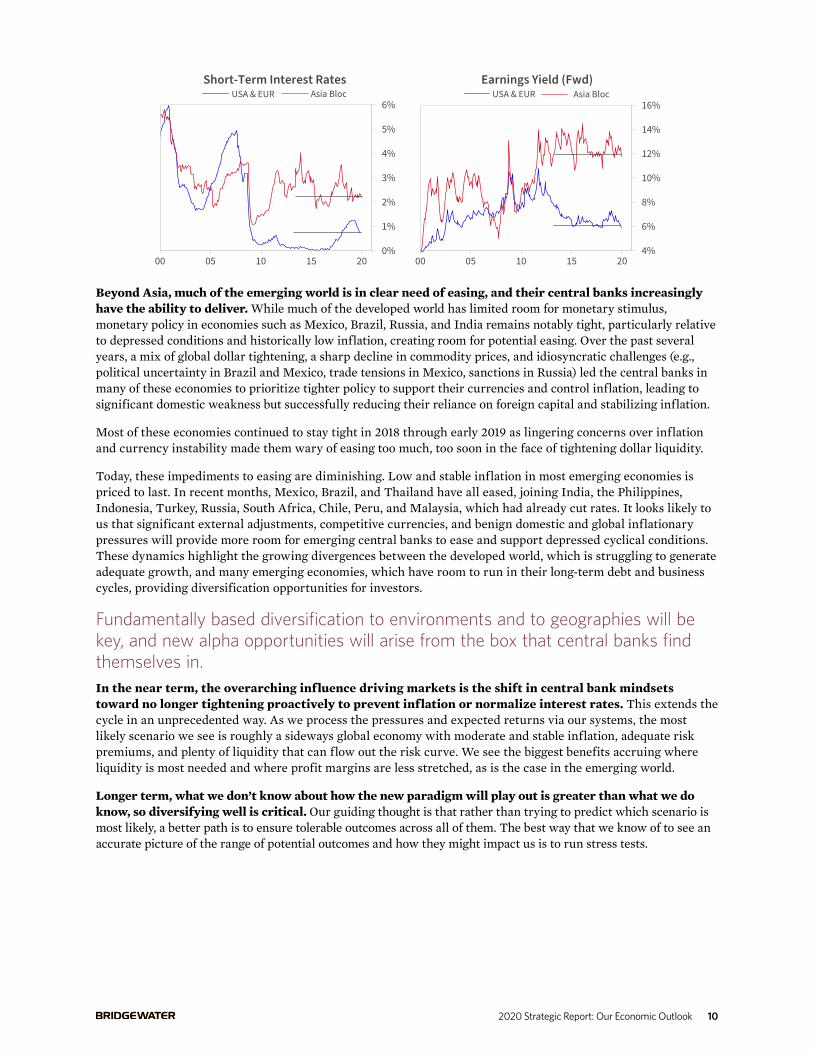
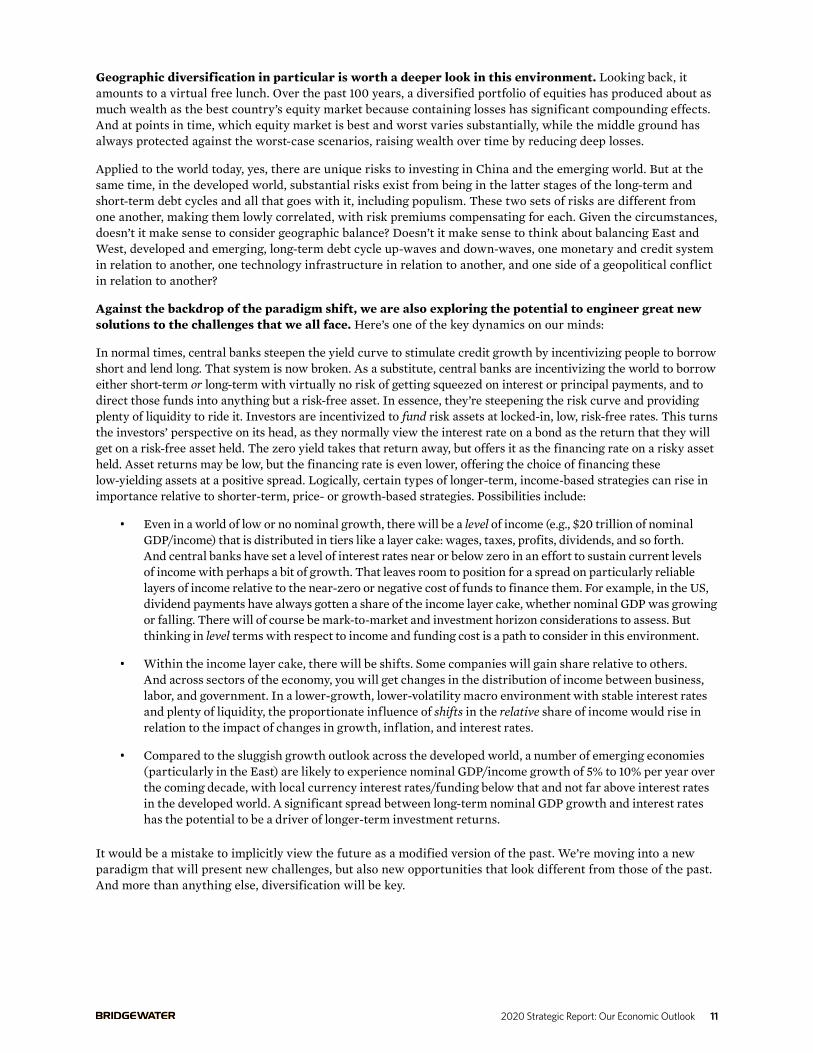
While our attention often tends toward the West and the reserve currency developed economies, the zero interest rates, sluggish conditions, and populist tendencies that we see there are not the same in the emerging world, and particularly in emerging Asia, where you have higher recent growth rates, higher future productivity growth, higher interest rates, and higher asset yields.
Real GDP GrowthUSA & EUR Asia Bloc
-6%-4%-2%0%2%4%6%8%10%12%
00 05 10 15 20-2%
0%
2%
4%
6%
8%
IND
CHN
TLD
SGP
KOR
RUS
MEX BR
ZAR
GHU
NDE
UJP
NGB
RCA
NAU
SUS
AFR
AES
PIT
AGR
C
Asia Bloc / Western Developed10-Year Productivity Growth Estimate
2020 Strategic Report: Our Economic Outlook 10
Short-Term Interest RatesUSA & EUR Asia Bloc
0%
1%
2%
3%
4%
5%
6%
00 05 10 15 20
Earnings Yield (Fwd)USA & EUR Asia Bloc
00 05 10 15 204%
6%
8%
10%
12%
14%
16%
Beyond Asia, much of the emerging world is in clear need of easing, and their central banks increasingly have the ability to deliver. While much of the developed world has limited room for monetary stimulus, monetary policy in economies such as Mexico, Brazil, Russia, and India remains notably tight, particularly relative to depressed conditions and historically low inflation, creating room for potential easing. Over the past several years, a mix of global dollar tightening, a sharp decline in commodity prices, and idiosyncratic challenges (e.g., political uncertainty in Brazil and Mexico, trade tensions in Mexico, sanctions in Russia) led the central banks in many of these economies to prioritize tighter policy to support their currencies and control inflation, leading to significant domestic weakness but successfully reducing their reliance on foreign capital and stabilizing inflation.
Most of these economies continued to stay tight in 2018 through early 2019 as lingering concerns over inflation and currency instability made them wary of easing too much, too soon in the face of tightening dollar liquidity.
Today, these impediments to easing are diminishing. Low and stable inflation in most emerging economies is priced to last. In recent months, Mexico, Brazil, and Thailand have all eased, joining India, the Philippines, Indonesia, Turkey, Russia, South Africa, Chile, Peru, and Malaysia, which had already cut rates. It looks likely to us that significant external adjustments, competitive currencies, and benign domestic and global inflationary pressures will provide more room for emerging central banks to ease and support depressed cyclical conditions. These dynamics highlight the growing divergences between the developed world, which is struggling to generate adequate growth, and many emerging economies, which have room to run in their long-term debt and business cycles, providing diversification opportunities for investors.
Fundamentally based diversification to environments and to geographies will be key, and new alpha opportunities will arise from the box that central banks find themselves in.In the near term, the overarching influence driving markets is the shift in central bank mindsets toward no longer tightening proactively to prevent inflation or normalize interest rates. This extends the cycle in an unprecedented way. As we process the pressures and expected returns via our systems, the most likely scenario we see is roughly a sideways global economy with moderate and stable inflation, adequate risk premiums, and plenty of liquidity that can flow out the risk curve. We see the biggest benefits accruing where liquidity is most needed and where profit margins are less stretched, as is the case in the emerging world.
Longer term, what we don’t know about how the new paradigm will play out is greater than what we do know, so diversifying well is critical. Our guiding thought is that rather than trying to predict which scenario is most likely, a better path is to ensure tolerable outcomes across all of them. The best way that we know of to see an accurate picture of the range of potential outcomes and how they might impact us is to run stress tests.
2020 Strategic Report: Our Economic Outlook 11
Geographic diversification in particular is worth a deeper look in this environment. Looking back, it amounts to a virtual free lunch. Over the past 100 years, a diversified portfolio of equities has produced about as much wealth as the best country’s equity market because containing losses has significant compounding effects. And at points in time, which equity market is best and worst varies substantially, while the middle ground has always protected against the worst-case scenarios, raising wealth over time by reducing deep losses.
Applied to the world today, yes, there are unique risks to investing in China and the emerging world. But at the same time, in the developed world, substantial risks exist from being in the latter stages of the long-term and short-term debt cycles and all that goes with it, including populism. These two sets of risks are different from one another, making them lowly correlated, with risk premiums compensating for each. Given the circumstances, doesn’t it make sense to consider geographic balance? Doesn’t it make sense to think about balancing East and West, developed and emerging, long-term debt cycle up-waves and down-waves, one monetary and credit system in relation to another, one technology infrastructure in relation to another, and one side of a geopolitical conflict in relation to another?
Against the backdrop of the paradigm shift, we are also exploring the potential to engineer great new solutions to the challenges that we all face. Here’s one of the key dynamics on our minds:
In normal times, central banks steepen the yield curve to stimulate credit growth by incentivizing people to borrow short and lend long. That system is now broken. As a substitute, central banks are incentivizing the world to borrow either short-term or long-term with virtually no risk of getting squeezed on interest or principal payments, and to direct those funds into anything but a risk-free asset. In essence, they’re steepening the risk curve and providing plenty of liquidity to ride it. Investors are incentivized to fund risk assets at locked-in, low, risk-free rates. This turns the investors’ perspective on its head, as they normally view the interest rate on a bond as the return that they will get on a risk-free asset held. The zero yield takes that return away, but offers it as the financing rate on a risky asset held. Asset returns may be low, but the financing rate is even lower, offering the choice of financing these low-yielding assets at a positive spread. Logically, certain types of longer-term, income-based strategies can rise in importance relative to shorter-term, price- or growth-based strategies. Possibilities include:
• Even in a world of low or no nominal growth, there will be a level of income (e.g., $20 trillion of nominal GDP/income) that is distributed in tiers like a layer cake: wages, taxes, profits, dividends, and so forth. And central banks have set a level of interest rates near or below zero in an effort to sustain current levels of income with perhaps a bit of growth. That leaves room to position for a spread on particularly reliable layers of income relative to the near-zero or negative cost of funds to finance them. For example, in the US, dividend payments have always gotten a share of the income layer cake, whether nominal GDP was growing or falling. There will of course be mark-to-market and investment horizon considerations to assess. But thinking in level terms with respect to income and funding cost is a path to consider in this environment.
• Within the income layer cake, there will be shifts. Some companies will gain share relative to others. And across sectors of the economy, you will get changes in the distribution of income between business, labor, and government. In a lower-growth, lower-volatility macro environment with stable interest rates and plenty of liquidity, the proportionate influence of shifts in the relative share of income would rise in relation to the impact of changes in growth, inflation, and interest rates.
• Compared to the sluggish growth outlook across the developed world, a number of emerging economies (particularly in the East) are likely to experience nominal GDP/income growth of 5% to 10% per year over the coming decade, with local currency interest rates/funding below that and not far above interest rates in the developed world. A significant spread between long-term nominal GDP growth and interest rates has the potential to be a driver of longer-term investment returns.
It would be a mistake to implicitly view the future as a modified version of the past. We’re moving into a new paradigm that will present new challenges, but also new opportunities that look different from those of the past. And more than anything else, diversification will be key.
2020 Strategic Report: Our Economic Outlook 12
Important DisclosuresInformation contained herein is only current as of the printing date and is intended only to provide the observations and views of Bridgewater Associates, L.P. (“Bridgewater”) as of the date of writing unless otherwise indicated. Bridgewater has no obligation to provide recipients hereof with updates or changes to the information contained herein. Performance and markets may be higher or lower than what is shown herein and the information, assumptions and analysis that may be time sensitive in nature may have changed materially and may no longer represent the views of Bridgewater. Statements containing forward-looking views or expectations (or comparable language) are subject to a number of risks and uncertainties and are informational in nature. Actual performance could, and may have, differed materially from the information presented herein. Past performance is not indicative of future results.
Bridgewater research utilizes data and information from public, private and internal sources, including data from actual Bridgewater trades. Sources include, the Australian Bureau of Statistics, Barclays Capital Inc., Bloomberg Finance L.P., CBRE, Inc., CEIC Data Company Ltd., Consensus Economics Inc., Corelogic, Inc., CoStar Realty Information, Inc., CreditSights, Inc., Credit Market Analysis Ltd., Dealogic LLC, DTCC Data Repository (U.S.), LLC, Ecoanalitica, EPFR Global, Eurasia Group Ltd., European Money Markets Institute – EMMI, Factset Research Systems, Inc., The Financial Times Limited, GaveKal Research Ltd., Global Financial Data, Inc., Haver Analytics, Inc., The Investment Funds Institute of Canada, Intercontinental Exchange (ICE), International Energy Agency, Lombard Street Research, Markit Economics Limited, Mergent, Inc., Metals Focus Ltd, Moody’s Analytics, Inc., MSCI, Inc., National Bureau of Economic Research, Organisation for Economic Cooperation and Development, Pensions & Investments Research Center, Refinitiv, Renwood Realtytrac, LLC, RP Data Ltd, Rystad Energy, Inc., S&P Global Market Intelligence Inc., Sentix Gmbh, Spears & Associates, Inc., State Street Bank and Trust Company, Sun Hung Kai Financial (UK), Tokyo Stock Exchange, United Nations, US Department of Commerce, Wind Information (Shanghai) Co Ltd, Wood Mackenzie Limited, World Bureau of Metal Statistics, and World Economic Forum. While we consider information from external sources to be reliable, we do not assume responsibility for its accuracy.
The views expressed herein are solely those of Bridgewater and are subject to change without notice. In some circumstances Bridgewater submits performance information to indices, such as Dow Jones Credit Suisse Hedge Fund index, which may be included in this material. You should assume that Bridgewater has a significant financial interest in one or more of the positions and/or securities or derivatives discussed. Bridgewater’s employees may have long or short positions in and buy or sell securities or derivatives referred to in this material. Those responsible for preparing this material receive compensation based upon various factors, including, among other things, the quality of their work and firm revenues.
This material is for informational and educational purposes only and is not an offer to sell or the solicitation of an offer to buy the securities or other instruments mentioned. Any such offering will be made pursuant to a definitive offering memorandum. This material does not constitute a personal recommendation or take into account the particular investment objectives, financial situations, or needs of individual investors which are necessary considerations before making any investment decision. Investors should consider whether any advice or recommendation in this research is suitable for their particular circumstances and, where appropriate, seek professional advice, including legal, tax, accounting, investment or other advice.
The information provided herein is not intended to provide a sufficient basis on which to make an investment decision and investment decisions should not be based on simulated, hypothetical or illustrative information that have inherent limitations. Unlike an actual performance record, simulated or hypothetical results do not represent actual trading or the actual costs of management and may have under or over compensated for the impact of certain market risk factors. Bridgewater makes no representation that any account will or is likely to achieve returns similar to those shown. The price and value of the investments referred to in this research and the income therefrom may fluctuate.
Every investment involves risk and in volatile or uncertain market conditions, significant variations in the value or return on that investment may occur. Investments in hedge funds are complex, speculative and carry a high degree of risk, including the risk of a complete loss of an investor’s entire investment. Past performance is not a guide to future performance, future returns are not guaranteed, and a complete loss of original capital may occur. Certain transactions, including those involving leverage, futures, options, and other derivatives, give rise to substantial risk and are not suitable for all investors. Fluctuations in exchange rates could have material adverse effects on the value or price of, or income derived from, certain investments.
This information is not directed at or intended for distribution to or use by any person or entity located in any jurisdiction where such distribution, publication, availability or use would be contrary to applicable law or regulation or which would subject Bridgewater to any registration or licensing requirements within such jurisdiction.
No part of this material may be (i) copied, photocopied or duplicated in any form by any means or (ii) redistributed without the prior written consent of Bridgewater ® Associates, LP.
©2020 Bridgewater Associates, LP. All rights reserved