2020 rn renewal demographic report - alabama
TRANSCRIPT

2020 RN RENEWAL
Demographic Report
1

Data Source
The Alabama Board of Nursing (ABN) collected demographic data at
the time of the Registered Nurse (RN) license renewal in 2020. The data
were used to determine demographics for RNs licensed in Alabama at
the time of the survey and when applicable, to make comparisons to
available RN data collected in previous license renewal cycles.
2
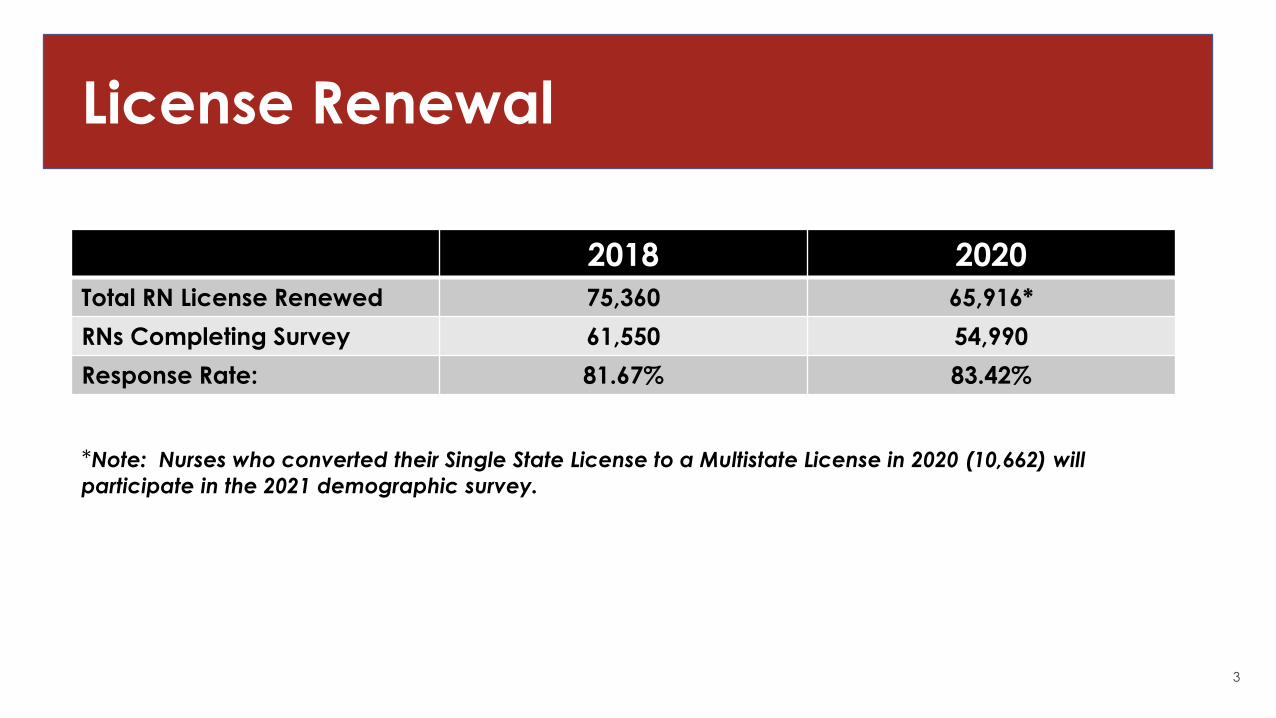
License Renewal
2018 2020
Total RN License Renewed 75,360 65,916*
RNs Completing Survey 61,550 54,990
Response Rate: 81.67% 83.42%
*Note: Nurses who converted their Single State License to a Multistate License in 2020 (10,662) will
participate in the 2021 demographic survey.
3

(5,176)
9.51%
(49,241)
90.49%
GENDERn = 54,417
Gender & Ethnicity
81.77%
(44,708)
12.47%
(6,816)1.91%
(1,047)
1.85%
(1,012)0.99%
(543)0.64%
(349)0.32%
(176)0.05%
(26)
Wh
ite
/Ca
uc
asi
an
Bla
ck
/Afr
ica
n A
me
ric
an
Mu
ltir
ac
ial
His
pa
nic
/La
tin
o
Asi
an
Oth
er
Am
eri
ca
n I
nd
ian
or
Ala
ska
Na
tiv
e
Na
tive
Ha
wa
iia
n o
r O
the
r P
ac
ific
Isla
nd
er
0.00%
10.00%
20.00%
30.00%
40.00%
50.00%
60.00%
70.00%
80.00%
90.00%
n = 54,677
4

0.01%
3.99%
10.03%
11.68%11.41%
10.37%
11.43%
10.06%
11.45%
10.30%
6.21%
2.23%
0.64%0.15% 0.04%
0.00%
2.00%
4.00%
6.00%
8.00%
10.00%
12.00%
14.00%
15-19
Years
20-24
Years
25-29
Years
30-34
Years
35-39
Years
40-44
Years
45-49
Years
50-54
Years
55-59
Years
60-64
Years
65-69
Years
70-74
Years
75-79
Years
80-84
Years
85 Years
and
Older
n = 52,834
21,700 or 41.07% Reach or exceed
retirement age in 10 years
Age
5

0.11% (59)
0.38% (200)
3.37% (1,780)
3.86% (2,041)
4.79% (2,532)
38.15% (20,157)
49.33% (26,063)
0.00% 10.00% 20.00% 30.00% 40.00% 50.00% 60.00%
Doctoral degree-nursing (PhD)
Doctoral degree-nursing (DNP)
Vocational/practical certificate-nursing
Diploma-nursing
Master’s degree-nursing
Baccalaureate degree-nursing
Associate degree-nursing
n = 52,832
Entry Level Education
6

42.47%
(23,113)
36.41%
(19,815)
16.22%
(8,825)
2.68%
(1,458)1.69%
(918)0.54%
(295)0.00%
5.00%
10.00%
15.00%
20.00%
25.00%
30.00%
35.00%
40.00%
45.00%
Associate degree Baccalaureate
degree
Master’s degree Diploma Doctoral degree-
(DNP)
Doctoral degree-
(PhD)
n = 54,424
Highest Level of Nursing Education
7

65.36%
(34,208)
16.19%
(8.475) 13.67%
(7,155)
4.04%
(2,112) 0.74%
(388)
0.00%
10.00%
20.00%
30.00%
40.00%
50.00%
60.00%
70.00%
Not applicable Associate degree
Non-nursing
Baccalaureate degree
Non-nursing
Master’s degree
Non-nursing
Doctoral degree
Non-nursing
n = 52,338
Highest Non-Nursing Education
8

88.22%
(47,963)
10.86%
(5,905)0.89%
(484)
0.03%
(16)
0.00%
10.00%
20.00%
30.00%
40.00%
50.00%
60.00%
70.00%
80.00%
90.00%
100.00%
RN RN/APRN RN/LPN RN/LPN/APRN
n = 54,368
License Types (RN Renewal)
9

2.54%
(1,347)
17.23%
(9,122) 16.47%
(8,723)
14.07%
(7,451)
9.13%
(4,836)
11.21%
(5,936)
9.30%
(4,927)
6.85%
(3,627)6.53%
(3,456)
4.25%
(2,252)
1.72%
(909) 0.49%
(259)0.14%
(76)0.04%
(23)0.01%
(5)
0.02%
(8)0.00%
2.00%
4.00%
6.00%
8.00%
10.00%
12.00%
14.00%
16.00%
18.00%
20.00%
<1 1-5 6-10 11-15 16-20 21-25 26-30 31-35 36-40 41-45 46-50 51-55 56-60 61-65 66-70 71-84
Years
n = 52,957
Number of Years Licensed
10

United States
99.14%
(53,271)
n = 53,731
Other Countries, 0.86% (460)
Philippines Puerto Rico
US Minor Islands Georgia
Canada Algeria
Afghanistan South Korea
Albania Australia
United Kingdom Nepal
Jamaica Pakistan
India China
Nigeria Jordan
Germany Angola
Kenya Columbia
Country of Initial Licensure
11

Active
99.54%
(54,293)
Retired
0.46%
(251)
n = 54,544
License Status
12

APRN’s
Yes
12.45%
(6,429)
No
87.85%
(45,220)
n = 5164975.84%
(4,876)
21.11%
(1,357)
2.26%
(145)0.37%
(24)
0.31%
(20)0.08%
(5)
0.02%
(1)
0.02%
(1)0.00%
10.00%
20.00%
30.00%
40.00%
50.00%
60.00%
70.00%
80.00%
CRNP CRNA CNS CNM CRNP
CNS
CRNP
CNM
CRNP
CRNA
CNS
CRNA
n = 6429
13
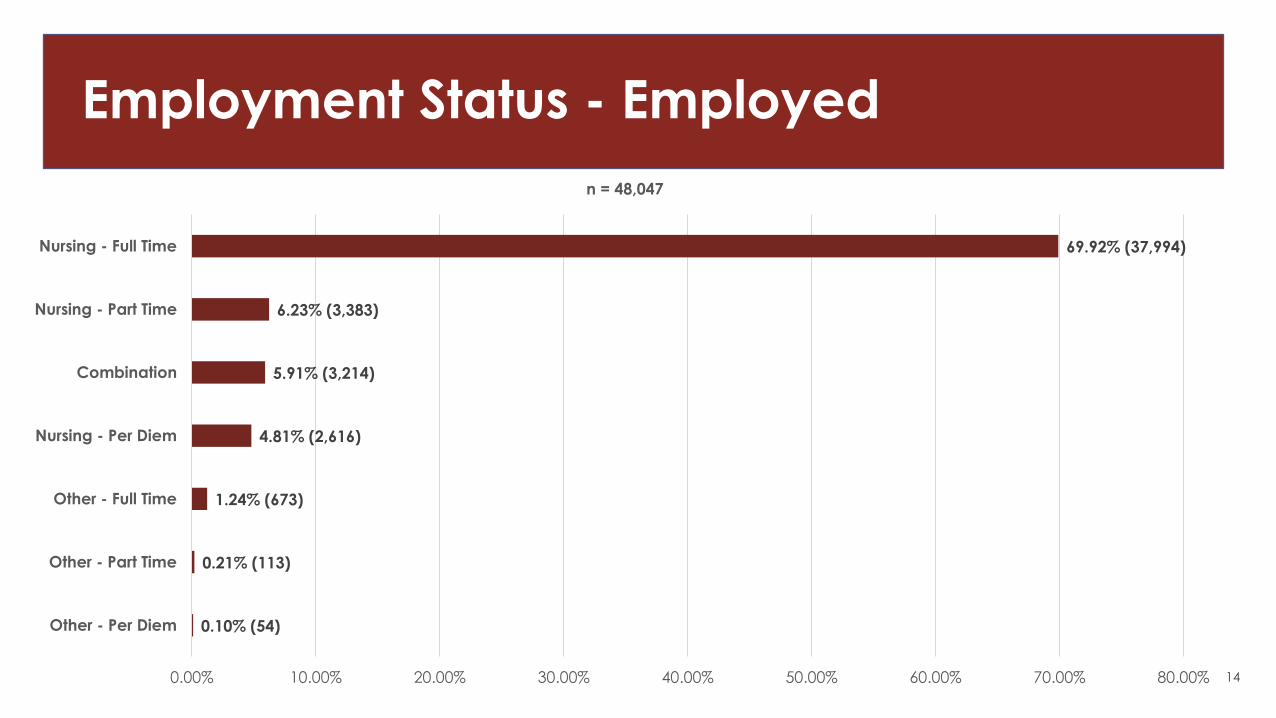
Employment Status - Employed
0.10% (54)
0.21% (113)
1.24% (673)
4.81% (2,616)
5.91% (3,214)
6.23% (3,383)
69.92% (37,994)
0.00% 10.00% 20.00% 30.00% 40.00% 50.00% 60.00% 70.00% 80.00%
Other - Per Diem
Other - Part Time
Other - Full Time
Nursing - Per Diem
Combination
Nursing - Part Time
Nursing - Full Time
n = 48,047
14

Employment Status - Unemployed
15
12.32%
(6,777)
0
1000
2000
3000
4000
5000
6000
7000
8000
UNEMPLOYED
n = 6777
10
20
30
40
50
60
70
80
90
100
73.0
%
10
20
30
40
50
60
70
80
90
100
3.51%
VOLUNTEER
10
20
30
40
50
60
70
80
90
100
88.5%
RETIRED
37.80%
UNEMPLOYED - SEEKING
10
20
30
40
50
60
70
80
90
100
17.03% 45.74%
UNEMPLOYED NOT SEEKING

Unemployed Reasons
16
0.90% (36)
3.65% (146)
4.15% (166)
8.50% (340)
17.23% (689)
65.56% (2,621)
0.00% 10.00% 20.00% 30.00% 40.00% 50.00% 60.00% 70.00% 80.00%
Inadequate salary
Difficulty finding nursing position
School
Disabled
Other
Taking care of home and family
n = 3,998
“Other” reasons cited:
• Working in another field
• COVID-19
• Taking a break/personal choice
• Moved/Relocated
• Military
• Health/Injury/Recovery
• Laid Off

1.48% (712)
3.41% (1,645)
9.74% (4,692)
85.37% (41,136)
3 or more
None
2
1
n = 48,185
Number of Positions Held
17

6.81% (3,090)
8.19% (3,718)
9.46% (4,296)
75.54% (34,297)
1 HR - 20 HRS
MORE THAN 48 HRS
21 HRS - 32 HRS
33 HRS - 48 HRS
0.00% 10.00% 20.00% 30.00% 40.00% 50.00% 60.00% 70.00% 80.00% 90.00% 100.00%
n = 45401
Hours Worked Per Week
18

Yes
91.47%
(43,655)
No
8.53%
(4,072)
0.00%
10.00%
20.00%
30.00%
40.00%
50.00%
60.00%
70.00%
80.00%
90.00%
100.00%
n = 47,727
Primary Employer in Alabama
19

Primary Employer – Other States
GEORGIA 19.15%
FLORIDA 10.77%
OHIO 8.67%
ILLINOIS 7.22%
NEW YORK 6.65%
CALIFORNIA 6.50%
TENNESSEE 4.79%
MISSISSIPPI 4.58%
PENNSYLVANIA 4.43%
TEXAS 3.49%
MINNESOTA 3.23%
LOUISIANA 1.53%
NORTH CAROLINA 1.48%
CONNECTICUT 1.37%
MICHIGAN 1.35%
WASHINGTON 1.24%20
n =4,072

2.33% (880)
2.44% (921)
2.53% (956)
3.45% (1,304)
3.54% (1,338)
5.11% (1,929)
6.01% (2,271)
8.88% (3,355)
10.41% (3,933)
28.71% (10,849,)
0.00% 5.00% 10.00% 15.00% 20.00% 25.00% 30.00% 35.00%
Lee
Etowah
Shelby
Houston
Baldwin
Tuscaloosa
Montgomery
Mobile
Madison
Jefferson
n = 37,786
57 Counties = <2%
Alabama County of Primary Practice
21

1.14% (532)
1.22% (570)
1.32% (617)
1.41% (658)
1.69% (788)
2.24% (1,047)
2.35% (1,099)
2.99% (1,396)
3.74%, (1,744)
3.94%, (1,837)
4.73%, (2,209)
4.78% (2,233)
14.55% (6,791)
53.89% (21,151)
0.00% 10.00% 20.00% 30.00% 40.00% 50.00% 60.00% 70.00%
Military/VA
Telehealth
Public Health
Dialysis Center
Mental Health/Psych/Addiction
College/University/Secondary
School Health Service
Hospice Services
Home Health Service
Case Management/Utilization Review/Insurance
Nursing Home/Extended Care/Memory Care
Other - Health-Related
Ambulatory Care/Physician Office/Clinic
Hospital
n = 46,672
Primary Employer Setting
22

1.77% (825)
2.20%, (1,022)
2.59% (1,204)
6.77%, (3,146)
7.27% (3,379)
8.10% (3,768)
9.00% (4,185)
11.58% (5,382)
50.69% (23,566)
0.00% 10.00% 20.00% 30.00% 40.00% 50.00% 60.00%
Nurse Executive/Administrator
Nurse Faculty
Nurse Educator
Case Manager/Utilization Review
Other - Health Related
Team Leader/Charge Nurse
Nurse Manager/Director/Coordinator
Advanced Practice Registered Nurse
Staff Nurse
n = 46,477
Primary Nursing Position
23

1.10% (513)
1.46% (678)
1.46% (681)
734, 1.58% (734)
897, 1.93% (897)
1.95% (907)
1.96% (910)
2.07% (965)
2.22% (1,034)
2.45% (1,140)
2.69% (1,254)
2.84% (1,322)
3.02% (1,405)
3.43%, (1,595)
3.47% (1,615)
3.47% (1,616)
3.60% (1,677)
3.69% (1,719)
3.89% (1,810)
4.17% (1,941)
4.53% (2,108)
5.47% (2,545)
7.65% (3,560)
7.66% (3,563)
11.10% (5,165)
11.13% (5,181)
-1.00% 1.00% 3.00% 5.00% 7.00% 9.00% 11.00% 13.00%
Public Health
Orthopedic
Rehabilitation
Gastroenterology
Oncology
Nephrology / Dialysis
Long-Term Care
School Health
Womens Health
Hospice / Palliative Care
Anesthesiology
Neonatal
Adult Health
Geriatric/Gerontology
Maternal-Child Health/Obstetrics
Family Health
Case Management / Util Review / Insurance
Psychiatric/Mental Health/Substance Abuse
Home Health
Pediatrics
Cardiology
Emergency/Trauma
Surgical Services/Transplant
Medical Surgical
Other - Health Related
Acute Care/Critical Care
n = 46,533
Primary Position - Specialty
24

1.11% (94)
1.18% (100)
1.21% (102)
1.25% (106)
1.38% (117)
1.40% (118)
1.57% (133)
2.49% (210)
, 2.96% (250)
3.87% (327)
4.90% (414)
5.12% (433)
6.69% (565)
6.76% (571)
12.46% (1,053)
45.64% (3,857)
0.00% 10.00% 20.00% 30.00% 40.00% 50.00% 60.00%
Public Health
Dialysis Center
Correctional Facility
Assisted Living/Group Home Facility
Community Health
Military/VA
Case Management/Utilization Review/Insurance
Mental Health/Psych/Addiction
School Health Service
Hospice Services
Home Health Service
Other - Health Related
College/University/Secondary
Nursing Home/Extended Care/Memory Care
Ambulatory Care/Physician Office/Clinic
Hospital
n = 8,450
Secondary Position - Setting
25
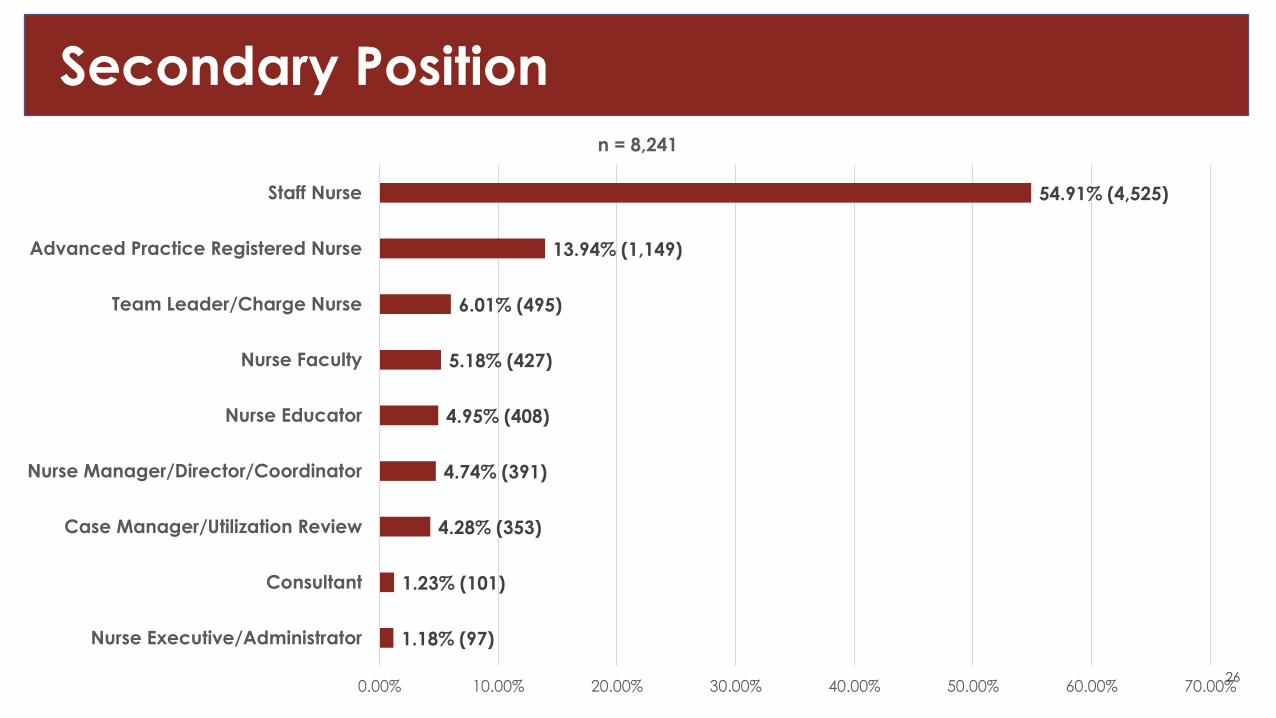
1.18% (97)
1.23% (101)
4.28% (353)
4.74% (391)
4.95% (408)
5.18% (427)
6.01% (495)
13.94% (1,149)
54.91% (4,525)
0.00% 10.00% 20.00% 30.00% 40.00% 50.00% 60.00% 70.00%
Nurse Executive/Administrator
Consultant
Case Manager/Utilization Review
Nurse Manager/Director/Coordinator
Nurse Educator
Nurse Faculty
Team Leader/Charge Nurse
Advanced Practice Registered Nurse
Staff Nurse
n = 8,241
Secondary Position
26

1.01% (84)1.18% (98)1.23% (102)1.27% (105)1.35% (112)1.40% (116)1.41% (117)1.45% (120)
1.77% (147)2.07% (172)
2.56% (212)2.62% (217)
2.83% (235)3.05% (253)3.09% (256)
3.24% (269)3.25% (270)
3.40% (282)3.47% (288)
4.62% (383)4.83% (401)405, 4.88% (405)4.95% (411)
7.59% (630)8.65% (718)
10.66% (952)11.35% (942)
-1.00% 1.00% 3.00% 5.00% 7.00% 9.00% 11.00% 13.00%
Public Health
Oncology
Insurance/Benefits/Case Mgmt/Util Review
Gastroenterology
Surgical Services / Transplant
Education
Nephrology
Rehabilitation
Womens Health
Neonatal
Maternal-Child Health/Obstetrics
School Health
Palliative Care/Hospice
Long-Term Care
Cardiology
Anesthesiology
Perioperative
Family Health
Pediatrics
Geriatric/Gerontology
Adult Health
Psychiatric/Mental Health/Substance Abuse
Home Health
Emergency/Trauma
Medical Surgical
Other - Health Related
Acute Care/Critical Care
n = 8,927
Secondary Position - Specialty
27

Greater than 20 years
38.42%
(19,726)
Within next 20 years
16.57%
(8,507)
Within next 10 years
16.13%
8,282
Within next 5 years
15.85%
(8,137)
Within next 15 years
13.03%
(6,688)
n = 51,340
Years to Retirement
28

Key Findings
• GENDER: Female = 90.4%
• RACE: Caucasian = 81.77%
• AGE: Between the ages of 30-59 years = 56.34%
• HIGHEST LEVEL EDUCATION: ADN = 42.47%
compared to BSN = 36.41%
• EMPLOYMENT: Employed full-time = 69.9%.
• NUMBER OF POSITIONS HELD: Holds one
position = 85.37%
• LOCATION OF PRACTICE: Employed in Alabama
= 91.47%, of these, 59.11% are employed within
five counties
• PRIMARY PRACTICE Site: Hospital = 53.89%
• RETIREMENT: Within 5 years (15.85%) within 10
years (16.13%) = 31.98%
29
Summary: 2020 Workforce Demographics Survey
.