2020 pan-pacific business research conference (ppbrc)
TRANSCRIPT
1
2020 Pan-Pacific Business Research
Conference (PPBRC)
February 27 – February 29, 2020
at
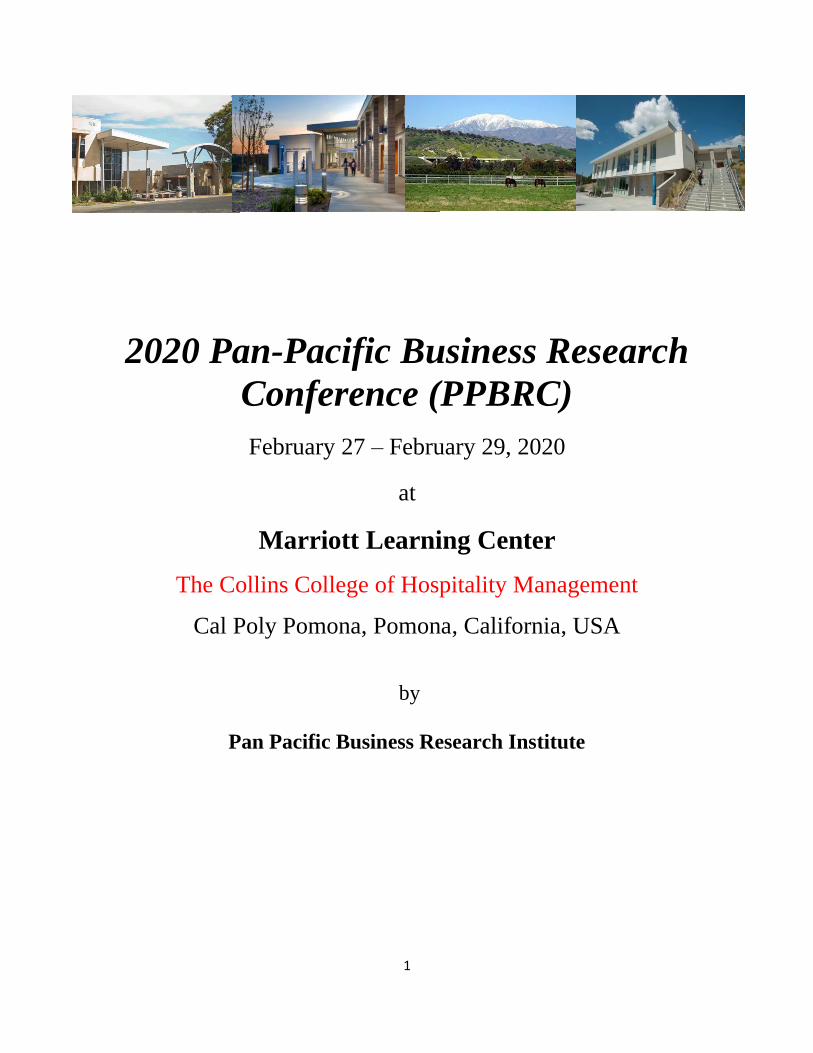
Marriott Learning Center
The Collins College of Hospitality Management
Cal Poly Pomona, Pomona, California, USA
by
Pan Pacific Business Research Institute

2
Pan-Pacific Business Research Institute
2020 Pan-Pacific Business Research Conference
February 27− February 29, 2020
The conference chair
John Jin
Professor of Accounting
California State University, San Bernardino
Area committees
• Accounting: Ilwoon Kim*, Sungkyoo Huh, K. J. Lee, John Jin,
Byunghwan Lee, Steve Lim, Daniel Paik
• Finance: Liang Guo*, Heungjoo Cha, Jim Estes, Yu Liu
• Hospitality / Tourism Management: Myong Jae Lee*, Joong-won Lee
• Marketing: Haakon Brown*, Hongbum Kim, Chanho Song
• Management: Yongseok Jang*, Joon Son
*Area chairs.

3
Conference Schedule
Program schedule on February 27, 2020
17:00 - 18:00 Registration
18:00 - 20:00 Review board meeting
Program Schedule on February 28, 2020
09:00 - 16:00 Registration
09:30 - 10:00 Coffee Break
10:00 - 11:30 Session 1
11:30 - 11:50 Keynote speaker
12:00 - 13:30 Lunch
13:40 - 15:10 Session 2
15:20 - 17:00 Session 3
17:00 - 18:00 Wine Reception
18:00 - 20:00 PPBRC Award Dinner
Welcome Lunch, Wine Reception, and PPRBC Award Dinner at the
Restaurant at Kellogg Ranch in the Collins College of Hospitality
Management
Program Schedule on February 29, 2020
10:00 - 12:00 Research Interaction Forum
17:00 - 20:00 Executive committee meeting
4
The Aim and Scope of the Conference
The PPBRC is a highly interactive business conference that provides the opportunity for
participants to share their research in an interdisciplinary setting and to disseminate research
findings with others in the academic and business community. The conference will consider
both conceptual and empirical papers in all areas of business and economics, including
Accounting, Economics, Finance, Hospitality Management, Marketing, Management, Operation
Management, and Information Systems:
• New theories, paradigmatic design and applications.
• New regulations and policies.
• Application of Accounting, Economics, Finance, Hospitality Management, Marketing,
Management, Operation Management, and Information Systems in industrial or
international settings.
• Case studies exploring current issues.
• Pedagogical issues in business education.
The conference considers all topical areas but papers that focus on business issues in pan-pacific
countries are particularly encouraged and welcomed.
Publication Opportunities in Proceedings
All the papers accepted for presentation will appear in the conference proceedings. Authors
should indicate if they want the full or extended abstract (no more than 1,000 words) to be
printed in the conference proceedings. PPBRI has a copyright for all the printed articles and
manuscripts that appear in the proceedings.
Distinguished Paper Awards and Publication Opportunities PPJBR
All complete full papers submitted and presented at the Conference will be considered for a
Distinguished Paper Award on a competitive basis. Distinguished paper winners will receive a
certificate of recognition at the conferences closing dinner. Further, the authors of all the
distinguished papers will be further invited to revise and resubmit their papers for potential
publication in the Pan-Pacific Journal of Business Research (PPJBR), which has a plan in place

5
to be a premier multi-disciplinary journal aiming to be indexed in the Web of Knowledge’s SSCI
(Social Science Citation Index) in the future.
Guideline for Paper Preparation and Style
Before submission, the paper should not have been published in any other journals. The paper
should be in MS Office Word format. It should be written in a double space, one inch margin in
all sides, and 12 font size with times new roman font. The cover page should include the title of
the paper and author information—the name(s), affiliation(s), address(es), phone number(s), and
email(s) as well as contact author of the paper. On the second page, the paper title should repeat
along with an abstract, and key words. The title should appear in the center of the first line. Next
provide two blank lines by hitting enter three times right after the end of the title. The abstract
should be no more than 250 words. Give another blank line and then provide key words up to six
words. PPJBR generally follows the American Psychological Association (APA) guidelines.
Reference should be presented in a separate sheet at the end of the paper. Tables and figures and
their numbering should appear on the appropriate page within the text. Please do not use
footnotes; instead explain it within the text or use appendix. The appendix should be located
between the end of the text and reference.
Paper Submission and Registration
All papers or abstracts need to submit to [email protected]. Participants need to register at
http://www.ppbri.org/payment-fee.

6
Paper Presentation Schedule
On February 28, 2020
Room: 80 - 12
The 1st Paper Presentation Session, 10:00 am – 11:30 am
Session Chair: Dong Man Kim, PhD.
1) Why do firms use non-GAAP earnings? Evidence from investors’ reaction
to Non-GAAP earnings
Seunghan Nam*, New York Institute of Technology, [email protected]
J. K. Yun, New York Institute of Technology, [email protected]
2) Re-examination of the reason why firms issue management forecast of
earnings and consequences
Seunghan Nam, New York Institute of Technology, [email protected]
3) The Association between Audit Report Lag and Managerial Entrenchment
Ebenezer Lamptey*, California State University, San Bernardino,
Alex Tang, Morgan State University, [email protected]
Isaac Bonaparte, Towson University, [email protected]
The 2nd Paper Presentation Session, 1:40 pm – 3:10 pm
Session Chair: John Jin, PhD.
1) Effect of GASB Statement 68 on Information Content of Accounting
Information about Pension Programs California
Jiwoo Seo, University of Texas-El Paso, [email protected]
John Jin*, California State University, San Bernardino, [email protected]
K. J. Lee, University of Maryland-Eastern Shore, [email protected]
Jinwoong Lee, Kent State University, [email protected]

7
2) Characteristics of Directors Serving on Multiple Audit Committees
Meghna Singhvi, California State University Dominguez Hills, [email protected]
Vishal Munsif*, California State University, San Bernardino, [email protected]
Nicole Conrad, Central European University, [email protected]
3) The Feasibility and Quality of Yahoo Finance Stock Data
Hang Pei*, California State University, San Bernardino, [email protected]
Haoming Tang, George Mason University
The 3rd Paper Presentation Session, 3:20 pm – 5:00 pm
1) Financial Analysts’ Role in the 1996-2000 Internet Bubble
Patricia C. O’Brien, University of Waterloo, [email protected]
Yao Tian*, San Jose State University, [email protected]
2) Is There Any Business Value Capitalized in The Real Estate Transaction
Price? Evidence from Commercial Real Estate Markets
Yu Liu, California State University, San Bernadino, [email protected]
3) Real Earnings Management in US Mergers and Acquisitions
Taewon Yang*, California State University, San Bernardino, [email protected]
Joon Son, California State University, San Bernardino, [email protected]
Sung Wook Yoon, California State University, Northridge, [email protected]
Meghna Singhvi, California State University Dominguez Hills, [email protected]

8
Room: 80 -13
The 1st Paper Presentation Session, 10:00 am – 11:30 am
1) Consumer Product Recalls: An Examination of Stakeholder Trade-offs
Philip Keunho Chung, Christopher Newport University, [email protected]
Brandon Lee*, Indiana University Northwest, [email protected]
Daniel Paik, University of Richmond, [email protected] Joyce Van Der Laan Smith, University of Richmond, [email protected]
2) Investment Inefficiency and Financial Constraints
Taewoo Kim*, California State University, San Bernardino, [email protected]
Brandon Lee, Indiana University Northwest, [email protected]
Daniel Paik, University of Richmond, [email protected]
The 2nd Paper Presentation Session, 1:40 pm – 3:10 pm
1) Effectiveness of Perceived Social Support at Supermarkets in Korea
Chanho Song*, California State University, San Bernardino, [email protected]
Haakon T. Brown, California State University, San Bernardino, [email protected]
Ramatullah Tameez, California State University, San Bernardino, [email protected]
2) A Longitudinal Analysis of Perceptions and Behavior Change: Evidence
from Altamont Pass Commuters
Orestis Panagopoulos, California State University, Stanislaus,
Gökçe Soydemir*, California State University, Stanislaus, [email protected]
Xun Xu, California State University, Stanislaus, [email protected]
3) Data Dissemination and Policy Enforcement in a Multi-Level Secure
Multi-Domain Environment
Joon Son*, California State University, San Bernardino, [email protected]
Essia Hamouda, California State University, San Bernardino, [email protected]
Garo Panossian, California State University, San Bernardino,

9
The 3rd Paper Presentation Session, 3:20 pm – 5:00 pm
Session Chair: Jing Zhang, PhD.
1) Moderating Effect of Task Characteristics On Workplace Incivility for
Entrepreneurial Ventures
Yongseok Jang*, California State University, San Bernardino, [email protected]
Jing Zhang, California State University, San Bernardino, [email protected]
Dianhan Zheng, Kennesaw State University, [email protected]
2) The Effect of Congruity Between Crowdfunding Message and The
Product Features
Ying Cheng*, California State University San Bernardino, [email protected]
Yongseok Jang, California State University, San Bernardino, [email protected]
3) Exploring challenges of organizational culture assimilation over time in a
subsidiary of an international organization over time
Maggie Boyraz, California State University, San Bernardino, [email protected]

10
ABSTRACTS
1. Why do firms use non-GAAP earnings? Evidence from investors’ reaction to
Non-GAAP earnings
Seunghan Nam*, New York Institute of Technology, [email protected]
J. K. Yun, New York Institute of Technology, [email protected]
* Corresponding author
Abstract: This study investigates whether firms with poor performance in terms of GAAP
earnings use non-GAAP earnings to change the benchmark to improve their stock returns. To
investigate this issue, we take two steps. First, we investigate investors are more responsive to
non-GAAP earnings surprises than to GAAP earnings surprises. Second, we form portfolios
based on non-GAAP earnings surprise and analyze top decile firms’ GAAP earnings surprise and
abnormal stock returns and compare with other firms. Our result shows that non-GAAP earnings
are at least four times price-responsive than GAAP earnings surprises. The excluded items in
GAAP earnings, the difference between GAAP earnings surprise and non-GAAP surprise,
represents the portion that management considers value irrelevant because they are transitory or
nonrecurring. We show that non-GAAP earnings surprise is nine times more price responsive
than the surprise in excluded items. Thus, firms have incentives to break down GAAP earnings
into two parts, non-GAAP earnings and transitory earnings and report. Then analysts would also
be induced to forecast them separately. We suspect that the firms that have the most positive
non-GAAP earnings surprise have lackluster GAAP earnings surprises. These firms use non-
GAAP earnings surprises to maximize the stock price when GAAP earnings struggle to meet
analysts' forecast. A portfolio based on non-GAAP earnings surprise shows that the firms in the
highest decile in the portfolio have GAAP earnings surprise comparable to the lowest decile
firms based on GAAP earnings surprise. On average, however, they have the biggest returns.
This suggests that firms use non-GAAP earnings opportunistically to hide their poor
performance but achieve the most positive returns. This calls for change in regulation on non-
GAAP reporting.
Keywords: Non-GAAP earnings, Earnings surprise, value relevance, analysts’ forecast
JEL Classification: M41

11
2. Re-examination of the reason why firms issue management forecast of
earnings and consequences
Seunghan Nam, New York Institute of Technology, [email protected]
Abstract: In this study, I examine the conjecture that firms that issue management forecast of
earnings (MFE) increase their stock price. Prior research argues that by issuing earnings
guidance, the manager can create a more favorable environment to exhibit their managerial
ability than others, thereby increasing their stock returns more. I find that, in the year when firms
issue MFE, their abnormal return is not significantly different from the abnormal return of firms
that did not issue MFE. I find that MFE issuing firms’ abnormal return one year prior to issuing
MFE is significantly positive but significantly lower than the abnormal return of firms that do
not issue MFE. This result goes against many studies that document the benefit of issuing MFE,
in terms of positive stock returns. To find out the motivation to issue MFE, I further divide the
sample into three cases 1. start or restart, 2. repeat and 3. stop issuing MFE. The result shows
that firms that start or restart to issue MFE tends to be undervalued in the year prior to issuing
MFE, but past year’s abnormal return is significantly positive. Logit regression shows that firm
size, book-to-market, and discretionary accruals are significant factors to start or restart to issue
MFE. In other words, these firms can be characterized as large, but undervalued firms who
possibly engage in accruals management. These firms possibly try to create a more favorable
environment for their managerial ability. Once firms repeat issuing MFE, they achieve higher
profitability, fewer losses with lower discretionary accruals and real earnings management.
However, the repeaters’ stock returns are not significantly different from firms that do not issue
MFE. Finally, logit regression for the firms stops issuing MFE, past stock returns, past
accounting profitability, loss, and financial statement’s predictability are positively associated
with the decision to stop issuing MFE. This suggests that firms stop issuing MFE when
accounting and stock performance declines and financial statement shows such decline.
Keywords: Management forecast of earnings, stock returns
JEL Classification: M41
12
3. The Association between Audit Report Lag and Managerial Entrenchment
Ebenezer Lamptey*, California State University, San Bernardino,
Alex Tang, Morgan State University, [email protected]
Isaac Bonaparte, Towson University, [email protected]
* Corresponding author
Abstract: We examine the relationship between audit report lag and managerial entrenchment.
Using the entrenchment index (E-index) as constructed by Bebchuk, Cohen, and Farrell, (2009)
as our proxy for managerial entrenchment, and independent variable, we find a positive
association between audit report lag and the E-index. This result suggests that entrenched
managers are more likely to engage in opportunistic managerial behaviors inimical to
shareholders, which results in extended audit report lags. Consistent with the research, we
bifurcate antitakeover provisions in the E-index into two categories. Those that provide monetary
benefits to inside directors and managers when a takeover is successful (MP), and those that do
not provide pecuniary benefits (PB). We find a positive relationship between the audit report lag
and MB, suggesting that when firms adopt antitakeover provisions that provide monetary
benefits to inside directors and managers, the entrenched managers will have a high propensity to
engage in opportunistic managerial behaviors that will result in longer audit report lags. We also
find a negative association between audit report lag and PB. This result indicates that
antitakeover provisions that do not provide pecuniary benefits reduce the likelihood that
entrenched managers will engage in egregious opportunistic behavior and cause audit report lag
to be shorter. Our study provides empirical evidence to support the association between
managerial entrenchment and audit report lag.

13
4. Effect of GASB Statement 68 on Information Content of Accounting
Information about Pension Programs California
Jiwoo Seo, University of Texas-El Paso, [email protected]
John Jin*, California State University, San Bernardino, [email protected]
K. J. Lee, University of Maryland-Eastern Shore, [email protected]
Jinwoong Lee, Kent State University, [email protected]
* Corresponding author
Abstract: the objective of this study is to investigate whether the adoption of GASB statement
68 (the statement hereafter) improves information content of accounting information about the
defined pension programs offered by local and statement governments in California. Since the
statement requires more detailed and reporting entity specific information about the pension
programs, it may be safe to hypothesize that the information content of the pension related
information increase with the adoption of the statement. To operationalize this investigation, we
compare the effect of two new major information required by the statement, entity specific net
pension liability and entity specific pension expense, on bond borrowing costs after the adoption
with the effect of entity specific contribution on bond borrowing costs before the adoption of the
statement. The samples are municipal bonds issued by governmental entities providing defined
benefits pensions through cost sharing plans in the state of California from 2013 through 2016.
The final sample consists of 408 municipal bonds issued by 98 governmental entities in
California. The results from this study suggest that information content of accounting
information about pension programs by the cost-sharing employers in California improves with
the adoption of the statement.
Keywords: GASB statement 68, information content, bond borrowing costs, entity specific net
pension liabilities, entity specific pension expenses, and entity specific contribution.

14
5. Characteristics of Directors Serving on Multiple Audit Committees
Meghna Singhvi, California State University Dominguez Hills, [email protected]
Vishal Munsif*, California State University, San Bernardino, [email protected]
Nicole Conrad, Central European University, [email protected]
* Corresponding author
Abstract: In the wake of major accounting scandals of the early 2000s and the subsequent
legislative requirements imposed by the Sarbanes-Oxley Act of 2002 (“SOX”), the role of the
audit committee director in the financial reporting process is more important than ever. Recently,
concerns have grown over the presence of “multi-audit committee” (or “multi-AC”) directors,
who sit on the audit committees of more than one corporation. In this paper, we study the
characteristics of multi-AC directors during three periods (pre-SOX years of 2000-2001, SOX
implementation years of 2002-2003, and post-SOX years of 2008-2010) based on a sample of
S&P 500 companies (n=288). We explore the characteristics of firms with multi-AC directors,
the characteristics of multi-AC directors and the backgrounds of multi-AC directors. We will
also present arguments that demonstrate the positive and negative effects of “multi-audit
committee directors.”
Keywords: busy audit committee directors, multiple directorships, over boarded members
JEL classifications: G34, M14, M40, M42, M41

15
6. The Feasibility and Quality of Yahoo Finance Stock Data
Hang Pei*, California State University, San Bernardino, [email protected]
Haoming Tang, George Mason University
* Corresponding author
Introduction
In this paper, we retrieve and evaluate daily stock price and volume data from Yahoo Finance for
the purpose of finance and accounting research. While daily security variables are available from
popular data aggregators such as Center for Research in Security Prices (CRSP), such data
usually carries a hefty subscription fee. In addition, researchers with interest in current events
may be disappointed to find that security prices available from data aggregators are not updated
daily, which can result in delay in the research project. For example, although CRSP has
unparalleled collection of security data, the database is updated either monthly, quarterly, or even
annually depending on the subscription tier. When time is of essence, it becomes necessary to
supplement CRSP data with up-to-date stock prices available from open sources such as Yahoo
Finance.
One of the goals of this study is to provide guidelines to researchers who are interested in
retrieving up-to-date security prices from open source websites. In this paper, we outline the
basic procedures in building a customer perl program to retrieve stock prices from Yahoo
Finance. We believe these steps are easy to follow and could be easily adopted by other
researchers. More importantly, we evaluate the feasibility and quality of Yahoo Finance’s stock
price data and compare it with the CRSP stock prices. We identify two types of discrepancies: 1)
stock price differences because the different update frequencies on Yahoo Finance versus CRSP,
and 2) discrepancies that are due to error in datasets. We offer suggestions on how to address the
two types of discrepancies which are important for combining Yahoo Finance and CRSP data.
Although a quick Google search may yield quite a few how-to articles on scraping the internet
for stock prices, we believe this study is very necessary. Internet tutorials in general focus on the
technique steps on how to retrieve data, but they usually target a very different audience than
researchers. To retrieve the data may not be very difficult but downloaded data must be verified
before it can be used for academic research. We investigate the quality of stock prices obtained
from Yahoo Finance and provide guidelines on how to incorporate the data with security prices
from CRSP. The combined Yahoo Finance and CRSP data provides researchers the ability to
examine current events since Yahoo Finance provides current stock prices whereas CRSP is only
updated periodically depending on the subscription type.1
1 CRSP-annually is updated every year in February, whereas CRSP-monthly and CRSP-quarterly updates every
month and every quarter, respectively.

16
Motivation and Literature Review
Relatively few studies have investigated and compared quality of open-source stock data and
data from aggregator such as CRSP (Center for Research in Security Prices). Rosenberg &
Houglet (1974) made an error rate comparison study and examined the data quality from CRSP
and Compustat data bases. They find that there are few large errors in both data bases, and these
few errors are significant enough to change the nature of the data. The erroneous data pollute
statistical analyses of the individual securities. In greater detail, Compustat was found to be less
accurate than CRSP.
Compustat has since released Price Earnings Dividend (PDE) Tape. Bennin (1980) provides an
update on the literature after the release of PDE Tape. Bennin documents that the overall error
rate is only 1/3 the rate reported in Rosenberg & Houglet (1974). While Compustat errors drop
significantly, CRSP remains to be a more reliable source.
Boritz & No (2013) examines the interactive data available from SEC’s EDGAR database with
Compustat, Yahoo Finance, and Google Finance and find that up to 4.8% mismatches between
interactive data and aggregator (Compustat) data. In addition, 56% of the differences are larger
than the conventional materiality threshold.
To the best of our knowledge, no study has looked at the quality and frequency of stock data
from open sources such as Yahoo Finance with that from CRSP. Yahoo Finance obtains real-
time stock quotes from NASDAQ Last Sale for NASDAQ, NYSE, and NYSE American stocks
and historical stock data from the Intercontinental Exchange (ICE) data services. The biggest
advantage of Yahoo Finance data is that its historical stock variables are updated daily. On the
other hand, while CRSP has an unparalleled collection of stock data from a series of exchanges
from as early as 1925, CRSP provides a tiered subscription of stock data that were updated either
monthly, quarterly, or annually. It is therefore interesting to investigate the quality of Yahoo
Finance data to see whether it could be used to supplement CRSP for studies that are time-
sensitive and require the most up-to-date security prices. In addition, it is interesting to evaluate
whether Yahoo Finance data could serve as a free alternative to CRSP.
Research Question
Our first research question pertains to a technique issue facing researchers using financial data:
how to merge data from different sources. In fact, this task is more complicated since data
aggregators use different identifiers to mark the observations. For instance, the CRSP security
data has two unique identifiers: PERMNO and PERMCO. PERMNO is the identifier offered for
each unique security issue whereas PERMCO is used to identify a unique firm. In addition,
CRSP offers a series of other identifiers including the Committee on Uniform Securities
Identification Procedures number (CUSIP), stock ticker symbols (TICKER), the International
Securities Identification Number (ISIN). Many of the additional identifiers are useful to help
merge CRSP data with other commonly used datasets such as Compustat. However, the

17
complicating issue is these additional identifiers are often not unique or permanent. For example,
an exchange ticker symbol could be retired from the market once a stock is delisted and may be
reassigned to a different stock later. A CUSIP number are updated or changed especially during
mergers and acquisitions. When a CUSIP number is changed, CRSP keeps both the historical
and current CUSIP number in its database. However, many other datasets such as Compustat
only keeps the current one. Furthermore, identifiers are “current” only to the extent that a dataset
is recently updated. Since CRSP and Compustat datasets have different update schedule, merging
on CUSIP and other similar identifiers can introduce errors into the merged dataset. As a matter
of fact, merging CRSP and Compustat can be a daunting task, the CRSP/Compustat Merged
(CCM) dataset is offered as a separate subscription. Since Yahoo Finance uses ticker symbols to
identify stocks and CRSP’s ticker list is only updated periodically, we also expect mismatches
when trying to converge the two datasets. In addition, Yahoo Finance removes delisted stocks
from its coverage after a period of time of delisting. CRSP, however, includes delisted stocks in
its database. Therefore, stock coverage in the two datasets could also differ because of delisting.
The impact of delisting could be minimalized if the researcher re-download and maintains the
Yahoo Finance stock data periodically. We state our first research question below:
Research Question 1: How does stock coverage of Yahoo Finance differ from that of CRSP?
As stated in the previous section, one of the advantages of Yahoo Finance data is that it is
updated daily, whereas CRSP offers a tiered subscription of monthly, quarter, or annually
updated stock prices. As a result, CRSP subscribers do not have access to up-to-date security
data. For instant, the CRSP-annual dataset is released each year in February. Supplementing
CRSP with Yahoo Finance data could therefore provide the most benefit for CRSP-annual
subscribers with a maximum of a full year’s security prices. With CRSP-monthly and CRSP-
quarterly subscribers, the benefit of merging datasets is smaller but could still be significant.
Having most up-to-date data is critical for many finance and accounting studies focusing on
contemporary events. Here we state our second research question:
Research Question 2: When supplementing CRSP with Yahoo Finance from Feb 1, 2019 to Jan
31, 2020, how many observations could be added back to CRSP-monthly, CRSP-quarterly, and
CRSP-annually datasets after merging?
It is also important to evaluate the quality of Yahoo Finance data against that of CRSP. Here, we
focus on the price differences of the same stock on the same trading day. There are a few reasons
why security prices may differ on Yahoo Finance data and CRSP. First, CRSP is only updated
monthly, quarterly, or annually, any stock split events after the update date is not adjusted in the
CRSP dataset. Meanwhile, the prices listed on Yahoo Finance is adjusted daily for splits. This
could potentially introduce a large amount of discrepancies in the stock prices. In addition, errors
in datasets do occur. We need to distinguish discrepancies that could be addressed by manually
adjusting for stock splits and those are due to errors. When there are discrepancies due to errors,
18
we could evaluate the quality of datasets from referring to a third data provider such as
NASDAQ.com, WSJ, or MarketWatch.com. Here we state our third research question:
Research Question 3: What is the magnitude of discrepancies between stock prices from Yahoo
Finance and CRSP for stocks covered by both datasets and to what extent can such discrepancies
be addressed by adjusting CRSP data for stock split events after CRSP update date?
Sample Selection and Research Method
Sample Selection
To evaluate the data quality of information from open sources, we obtain daily stock price and
trading volume from the CRSP dataset from January 1, 2019 to January 31, 2020. We use a perl
program to obtain the stock prices from Yahoo Finance.
Perl programming language
Perl is a programming language commonly used for text manipulation. It has been introduced to
accounting and finance literature fairly recently but has seen increased adoptions ever since (Li,
2008; Loughran & McDonald, 2016). One of the biggest advantages of the perl language is its
large number of readily available add-on modules, which are maintained in the library of
Comprehensive Perl Archive Network. The modules can be downloaded to modify any perl base
program to provide advanced functions. Perl is also cross-platform which can run on PC, Mac,
and Linux machines, making it truly a universal program that can be easily adopted for most
finance and accounting researchers.
Stock data from Yahoo Finance
We use a custom-built perl program to retrieve daily stock prices from Yahoo Finance. Yahoo
Finance tabulates seven stock variables by trading dates on its historical data website: the
opening price (OPEN), the highest (HIGH) and lowest (LOW) price, the closing price (CLOSE),
the adjusted closing price (ADJCLOSE), dividend (DIVIDEND), and the trading volume
(VOLUME).2 Although other websites such as NASDQA.com, MarketWatch.com, etc. also
provide historical stock prices, we found Yahoo Finance to be the most user-friendly. It is easier
to download stock prices from Yahoo Finance and the website provide advanced features such as
a date filter where a user could select the date range of historical data to download for a given
stock.
Perl program for stock price retrieval
Our perl program is simple and easy to replicate. It utilizes only a handful of basic perl packages,
which we discuss below. In general, there are three steps to retrieve stock prices from Yahoo
Finance.
2 Close price is the price at the end of trading day adjusted for stock splits. Adjusted close adjusts for stock splits and
dividends.

19
First, we compile a complete list of ticker symbols for all active stocks traded on NASDAQ,
NYSE, and NYSE American exchanges on January 31, 2020. A ticker is a unique series of
letters assigned to identify a stock on a given exchange market. We obtain a complete ticker list
for active stocks from multiple sources. First, we construct a list of valid tickers with an
exhausting approach. Since a stock ticker on NASDAQ is a four- or five-letter string while
NYSE and AMEX tickers have three or fewer letters, we exhaust all letter combinations with up
to five characters and plug each combination into Yahoo Finance. If the search returns a valid
stock, the letter combination is added to the valid ticker list. A failed combination is either
invalid or was used for a delisted stock. We then plug in all failed combinations into SEC’s
EDGAR web search to identify delisted stocks. We obtain a full list of active stocks and delisted
stocks on January 31, 2020 from the above steps. In addition, to verify our list, we compare our
results with the NASDAQ’s symbol screener search. Finally, we obtain other identifiers such as
company name, industry SIC code, and CIK code from the SEC’s EDGAR database.
Next, we use perl’s WWW∷Mechanize package to download stock prices on Yahoo Finance.
WWW::Mechanize mimics the behavior of an internet browser and can access or download any
webpage if a URL is provided. The package also returns an error code if a download attempt
fails for further analysis. We use WWW::Mechanize to access Yahoo Finance’s historical stock
quotes at https://finance.yahoo.com/quote/TICKER/history?p=TICKER, where ‘TICKER’ is the
ticker symbol of the stock of interest.3 In specific, we feed each ticker symbol in our verified
ticker list to WWW::Mechanize and request the package to download the webpage to a local
drive. To prevent extreme web traffic and disruption to the Yahoo Finance service, our program
sets a randomized sleep timer after each download. Using this method, we obtain the full time
series of stock prices for stocks included in the ticker list from January 1, 2019 to January 31,
2020.4
Lastly, we process the downloaded webpage to retrieve stock prices. The stock historical data
webpage downloaded from Yahoo Finance is in the original html format and is not usable
directly. We extract the stock prices on the downloaded webpages with the help of the
HTML∷TableExtract perl package. The stock prices are then saved in a comma-separated-values
(CSV) spreadsheet, which can then be read into statistic software such as SAS or Stata.
Statistical Analysis
Coverage Comparison
We compare the coverage of all NASDAQ, NYSE, and NYSE-American exchange stocks on
Yahoo Finance with that of CRSP.
3 For example, Apple Inc.’s stock prices are stored at https://finance.yahoo.com/quote/AAPL/history?p=AAPL. 4 Because Yahoo Finance removes stock prices of delisted stocks after a short period, we can only retrieve prices for
stocks that are active on the download date, January 31, 2020. However, the delisting problem can be minimalized
going forward following a maintained download schedule. To mitigate the delisting problem, the stock prices should
be updated at least once per month.

20
Stock price accuracy
We compare the prices listed on Yahoo Finance and that obtained from CRSP for stocks covered
by both datasets.
References
Bennin, R. (1980). Error rates in CRSP and COMPUSTAT: A second look. The Journal of
Finance, 35(5), 1267-1271.
Boritz, E., & No, W. G. (2013). The Quality of Interactive Data: XBRL Versus Compustat,
Yahoo Finance, and Google Finance. Working paper.
Casey, R. J., Gao, F., Kirschenheiter, M. T., Li, S., & Pandit, S. (2016). Do Compustat financial
statement data articulate? Journal of Financial Reporting, 1(1), 37-59.
Li, F. (2008). Annual report readability, current earnings, and earnings persistence. Journal of
Accounting and economics, 45(2-3), 221-247.
Loughran, T., & McDonald, B. (2016). Textual analysis in accounting and finance: A survey.
Journal of Accounting Research, 54(4), 1187-1230.
Rosenberg, B., & Houglet, M. (1974). Error rates in CRSP and Compustat data bases and their
implications. The Journal of finance, 29(4), 1303-1310.

21
7. Financial Analysts’ Role in the 1996-2000 Internet Bubble
Patricia C. O’Brien, University of Waterloo, [email protected]
Yao Tian*, San Jose State University, [email protected]
* Corresponding author
Abstract: We investigate financial analysts’ role during the 1996-2000 “Internet Bubble”
period, comparing their recommendations in this sector to those for other new companies over
the same time period. Our research addresses the following two questions: (1) were financial
analysts relatively more optimistic about Internet stocks than about other new issues during the
1996-2000 period? and (2) did their relative optimism for Internet stocks (if it existed) inflate the
prices of these stocks, creating or fueling the Internet Bubble? By using other new issues in this
time period as our comparison group, we control for analysts’ documented optimism when
initiating coverage and around equity issues. We find some evidence that analysts made higher
recommendations for Internet stocks beginning in 1998, but this evidence is primarily for stocks
beyond the IPO year. We fail to find a positive relation between analyst optimism in the Internet
sector and subsequent market-adjusted stock returns, after we control for Fama-French (1993)
risk factors. Based on these results, we conclude that analysts exhibited more optimism about
Internet stocks than they did about new issues in other sectors, but that investors appear to have
discounted this optimism.

22
8. Is There Any Business Value Capitalized in The Real Estate Transaction
Price? Evidence from Commercial Real Estate Markets
Yu Liu, California State University, San Bernardino, [email protected]
Abstract: This study examines the real estate transactions made by owner-users and investors
to see if there is any business value capitalized in the transaction price. By examining a
propensity-score matched sample of industrial property transactions, I find that owner-users
overpay on the purchase by an estimated 6.5% but sell at no premium. The preliminary results
indicate that the owner-users would like to pay a higher price when purchasing a real property to
secure the deal. The higher price paid in the transaction might suggest the consideration of the
business value and reveal the strategy been used by owner-users.

23
9. Real Earnings Management in US Mergers and Acquisitions
Taewon Yang*, California State University, San Bernardino, [email protected]
Joon Son, California State University, San Bernardino, [email protected]
Sung Wook Yoon, California State University, Northridge, [email protected]
Meghna Singhvi, California State University Dominguez Hills, [email protected]
* Corresponding author
Abstract: Using completed mergers and acquisitions during a period of 1987 to 2015, we
explore how Sarbanes Oxley (SOX) and Dodd Frank (DF) associate with three types of real
earnings management (Cash Flow from Operations, Discretionary Expenses and Total
Production Cost). Our test results reveal that 1) acquirers tend to engage real earnings
management during the period of Sarbanes Oxley (SOX). On the other hand, we do not notice a
consistent pattern of real earnings management in targets. 2) Stock prices of targets, instead of
acquirers, are found to relate to real earnings management, especially in Discretionary Expenses
and Total Production Cost around Sarbanes Oxley (SOX) Act and Dodd Frank (DF) Act. These
findings imply that the market may be more sensitive to targets’ real earnings management than
to acquirers’ real earnings management.

24
10. Consumer Product Recalls: An Examination of Stakeholder Trade-offs
Philip Keunho Chung, Christopher Newport University, [email protected]
Brandon Lee*, Indiana University Northwest, [email protected]
Daniel Paik, University of Richmond, [email protected] Joyce Van Der Laan Smith, University of Richmond, [email protected]
* Corresponding author
Abstract: Consumer product recalls represent a product-harm crisis that requires firms to make
strategic choices which may harm one stakeholder group to the benefit of another. Research
provides evidence that the timing, proactive versus passive, and cost of the recall influences
recall strategy (Chen, Ganesan and Liu 2009; Liu, Liu and Luo 2016). Examining firms’
responses to product-harm crises provides insight into how companies manage the competing
interests of stakeholder groups. Using seven years (2008 – 2014) of manufacturer product recalls
issued by the U.S. Consumer Product Safety Commission (CPSC) we find that firms with strong
stakeholder relationships trade-off the interests of consumers for those of shareholders in a
product-harm crisis when determining when to initiate a recall even when a recall is due to the
possibility of severe consumer harm. Once a recall is initiated firms with weaker stakeholder
relationships are more likely to provide a full remedy to consumers. These results imply that
firms with strong stakeholder relationships rely on their reputation to mitigate the financial
impact of a product recall favoring shareholders over consumers highlighting the complexity of
managing stakeholder relationships.
Keywords: consumer product recall, recall strategy, stakeholder trade-off, corporate social
performance (CSP), corporate social responsibility (CSR).

25
11. Investment Inefficiency and Financial Constraints
Taewoo Kim*, California State University, San Bernardino, [email protected]
Brandon Lee, Indiana University Northwest, [email protected]
Daniel Paik, University of Richmond, [email protected]
* Corresponding author
Abstract: Prior research finds that firms that have low levels of debt tend to over-invest
(Myers 1977; Jensen 1986). In contrast, firms with high levels of debt may not have available
funds for investment resulting in under-investment. We follow the procedure used by Whited and
Wu (2006), Kaplan and Zingales (1997), and Cleary (1999), to identify financially constrained
and unconstrained firms. We conduct separate regressions including the financing constraints
measures (FinConstraint-WW; FinConstraint-KZ; and, FinConstraint-CL) consistent with
Christensen and Nikolaev (2012). These results are consistent with prior research and indicate
that financially unconstrained firms are more likely to engage in over-investment, compared to
financially constrained firms.

26
12. Effectiveness of Perceived Social Support at Supermarkets in Korea
Chanho Song*, California State University, San Bernardino, [email protected]
Haakon T. Brown, California State University, San Bernardino, [email protected]
Ramatullah Tameez, California State University, San Bernardino, [email protected]
* Corresponding author
Abstract: The purpose of this study is to bridge the gap in literature to examine social support
that customers receive from their relationships with supermarket salespeople. A total of 409 valid
responses were obtained from large supermarket customers in South Korea. The authors use the
Structural Equation Model technique to test the proposed hypotheses. Perceived social support
(emotional and instrumental) significantly influence customer satisfaction. However, supervisor
support showed an insignificant relationship with customer satisfaction. In addition, customer
satisfaction significantly influences Word-of-Mouth (WOM) and purchase intention. Very few
studies have addressed the relationship between social support and consumer satisfaction in the
supermarket industry. This research helps to understand that social support is basic consideration
for large supermarket customers when they are shopping.
Keywords: Social support, Customer satisfaction, Word-Of-Mouth, Purchase Intention,
Supermarket

27
13. A Longitudinal Analysis of Perceptions and Behavior Change: Evidence
from Altamont Pass Commuters
Orestis Panagopoulos, California State University, Stanislaus, [email protected]
Gökçe Soydemir*, California State University, Stanislaus, [email protected]
Xun Xu, California State University, Stanislaus, [email protected]
* Corresponding author
Abstract: This study examines the Altamont pass commuters using the data collated in 2019 to
compare the results from 2000 and 2006 to compare the perceptions and behavior change of the
commuters. We focus on the commuters with the origin of places from three counties: San
Joaquin, Stanislaus, and Merced. The scope of this study includes the demographics,
employment, salary, distance, working years, point of origin and destination, perceptions of
carpooling and ACE train riding, and commuters’ suggestions about the commuting over
Altamont pass. We found commuters’ demographics, employment, and commuting situations
gradually change over the past decade. To solve the heavy traffic issues and improve road
conditions of Altamont pass, offering better service of public transportation, encouraging
carpooling, and restricting trucks during rush hours can be beneficial. The public transportation
includes ACE trains, BART, and buses. Enhancing the flexibility of operating hours of ACE
trains and buses and offering more bike spaces, wifi services, and vending machines in BART
can encourage commuters to take public transportations. Building HOV lanes and extending
expressways motivates commuters to have carpooling. Restricting truck on freeways during the
rush hours can reduce the accidents and traffic in the Altamont pass. We discuss the implications
to improve the road condition and commuter perception and experience.

28
14. Data Dissemination and Policy Enforcement in a Multi-Level Secure Multi-
Domain Environment
Joon Son*, California State University, San Bernardino, [email protected]
Essia Hamouda, California State University, San Bernardino, [email protected]
Garo Panossian, California State University, San Bernardino, [email protected]
* Corresponding author
Abstract: In a Multi-Level Secure (MLS) system, security labels are assigned to all resource
objects and subjects on the system. These security labels contain two pieces of information - a
classification/clearance and a category. Objects are labeled with a certain level of security
classification and a set of categories. Similarly, each subject on the system is labeled with a
clearance level and a set of categories and only those individuals with an appropriate security
label should have access to such objects.
There are a few challenges associated with disseminating MLS data in a multi-domain
environment: 1) The security domains participating in data dissemination may not use the same
MLS labels and lattice structures. 2) When Multi-Level Secure (MLS) data object is to be passed
between different security domains, the domains should agree on a security policy to be properly
applied and correctly enforced for that data object. However, pre-established security agreements
may not exist between all the domains as the data sender in one domain cannot always
predetermine the data recipients of other domains located beyond its trusted boundary. Thus,
what is needed is a framework supporting the dissemination of the data along with the policies
that govern the accesses. In addition, the recipients must enforce the access policies as intended
by the data owner.
The objective of this research project is to propose a solution or framework that would allow
domains to securely disseminate data without the need to repackage the data for each domain.
Our proposed framework leverages Simple Public Key Infrastructure (SPKI) and Active Bundle
(AB). In this paper, we show that how these two technologies, when combined together, can
overcome the above challenges.
Keywords: Multi-Level Security (MLS), MLS data dissemination, multi-domain, Simple
Public key Infrastructure (SPKI) and Active Bundle (AB).

29
15. Moderating Effect of Task Characteristics On Workplace Incivility for
Entrepreneurial Ventures
Yongseok Jang*, California State University, San Bernardino, [email protected]
Jing Zhang, California State University, San Bernardino, [email protected]
Dianhan Zheng, Kennesaw State University, [email protected]
* Corresponding author
Abstract: This study revisits a research gap about the linkage between firm strategy and firm
ethics by examining how entrepreneurship might be related to workplace incivility. Our data
revealed a significant positive effect of EO on the ethical climate. We also found that an ethical
climate can partially explain why entrepreneurship is likely to be seen as a driver of unethical
behavior among individuals. Our finding reinforces that EO may not be the key source of
creating a negative ethical climate as it is widely alleged. In addition, we found key task
characteristics moderated the mediational relationship that the linkage among EO-ethical
climate-incivility became weaker at the presence of some task characteristics.
Keywords: Entrepreneurial Orientation; Workplace Incivility; Task Characteristics;
Institutionalism; Ethical Climate

30
16. The Effect of Congruity Between Crowdfunding Message and The Product
Features
Ying Cheng*, California State University San Bernardino, [email protected]
Yongseok Jang, California State University, San Bernardino, [email protected]
* Corresponding author
Abstract: Crowdfunding becomes a popular way of financing early stage ventures. Yet, many
entrepreneurs fail because they struggle with how to craft campaign messages. We focus on
message appeals (emotional vs. rational) of fund-raising pitch to examine how they interact with
product feature (hedonic vs. utilitarian). Based on the congruity effect, this study predicted that a
fundraising campaign message will be more effective when its message appeals and product
features are matched. That is, when people perceive a product to be utilitarian, they are more
likely to fund its campaign if they also believe the campaign message relies on rational appeals.
In contrast, when a product was perceived hedonic, the campaign, the fundraising campaign is
more effective if its message is rated as more emotional. To test our hypotheses on how
message and product features impact fundraising decisions, we drew upon a sample of 250
messages from Kickstarter and conducted a crowdsourcing online survey using Amazon
Mechanic Turk. Our preliminary suggest that product features affect the purchase decision and
message features enhance such effect.
Keywords: Entrepreneurial communication, persuasive message, congruity effect,
crowdfunding, product features

31
17. Exploring challenges of organizational culture assimilation over time in a
subsidiary of an international organization over time
Maggie Boyraz, California State University, San Bernardino, [email protected]
Abstract: The process of integrating new hires into their role and organization is crucial for
employee performance and retention (Myers & Oetzel, 2003). While newcomers in co-located
organizations can rely on face-to-face interaction to effectively gain tacit knowledge from co-
workers, newcomers of global organizations may have to assimilate over distance and may face
severe challenges. Considering that there is little knowledge on employee assimilation in a global
work context (Picherit-Duthler, Long, & Kohut, 2004), we conduct an inductive longitudinal
case study of newcomer assimilation processes in a global organization over a two-year period.
We observed and interviewed 48 newcomers and insiders (in total 92 interviews), to gain a
nuanced understanding of the challenges faced by newcomers. Our results show how small
expectation gaps at the entry point, may quickly escalate in a virtual assimilation environment
where visibility of actions is low. More specifically, newcomers’ and insiders’ different
perceptions on 1) the expected rate of assimilation (i.e. temporality dimension) and 2) the
expected ways of working (i.e. reality dimension) created this assimilation expectation gap.
Given the scarcity of face-to-face interaction among newcomers and insiders, this assimilation
expectation gap grew larger over time, resulting in a negative spiral of dissatisfaction, conflicts
and turnover, among a large proportion of newcomers.