2020 business tax burden study - cost
TRANSCRIPT

Total state and local business taxesState-by-state estimates for FY19October 2020

Total state and local business taxes | 1
Businesses paid more than $833 billion in state and local taxes in FY19, an increase of 5.7% from FY18. State business taxes increased by 6.3%, and local business taxes grew by 5.2%. In FY19, business tax revenue accounted for approximately 44.0% of all state and local tax revenue.
The state and local business tax estimates presented in this study reflect tax collections from July 2018 through June 2019 in most states.1 As such, this report provides estimates of state and local business taxes prior to the start of the COVID-19 pandemic, which has created serious disruptions in revenue for state and local governments. Impacts of COVID-19 on tax collections vary by state, but most states estimate a 5–10% decrease in state tax revenues in FY20 as a result of the pandemic. Next year’s study, which will report FY20 state and local business taxes, will reflect the initial impacts of the COVID-19 pandemic on state and local business taxes.
The business taxes included in this analysis include business property taxes, sales and excise taxes paid by businesses on their input purchases and capital expenditures, gross receipts taxes, corporate income and franchise taxes, business and corporate license taxes, unemployment insurance taxes, individual income taxes paid by owners of noncorporate (pass-through) businesses, and other state and local taxes that are the statutory liability of business taxpayers.
Key findings of the study:
• Business property tax revenue increased by 4.9% in FY19, a gain of $14.8 billion. Property taxes remain by far the largest state and local tax paid by businesses, accounting for 37.9% of the total state and local taxes they paid. Property taxes are also by far the largest local tax paid by businesses, representing 76.1% of all local taxes.
• General sales taxes on business inputs and capital investment totaled $177.3 billion, or 21.3% of state and local business taxes. These sales taxes paid by businesses increased by 6.2% in FY19.2 Sales taxes on business inputs are the largest state tax paid by businesses (31.3% of all state taxes paid by businesses).
• Corporate income taxes increased for the second consecutive year after two consecutive years of decline. The increase in state corporate income taxes in FY19 largely reflects the expansion of state corporate income tax bases following the enactment of federal tax reform (the Tax Cuts and Jobs Act, or TCJA) in December 2017.3 In FY19, state and local corporate income taxes totaled $77.1 billion, or 9.3% of all state and local business taxes — an increase of 17.0% from FY18. The increase in revenue represented the first full year of state conformity with federal tax reform. Certain statewide gross receipts taxes levied in lieu of corporate income taxes are included in this measure.
• Individual income taxes on pass-through business income accounted for 6.5% of total state and local business taxes. State and local individual income taxes on business income increased by 4.5% from FY18. While the increase in individual income taxes was less significant than the prior fiscal year’s increase, 39 states experienced an increase, with New York and California accounting for 28% of the $2.3 billion increase.
• Severance taxes increased from $12.7 billion in FY18 to $15.0 billion in FY19, an increase of 18.0%. Almost 85% of the increase in severance taxes was concentrated in four states: New Mexico, North Dakota, Oklahoma and Texas.
• FY19 state and local business taxes were equal to 4.5% of the total US private-sector gross state product (GSP), which measures the total value of a state’s annual private-sector production of goods and services. There was substantial variation across states, with taxes ranging from 3.3% to 10.0% of private-sector GSP.
• On average, businesses paid more in state and local taxes than they received in benefits in FY19. For FY19, businesses paid $3.34 of taxes for every dollar of government spending benefiting businesses, on average, assuming that in-state education spending does not benefit in-state businesses. Under an alternate assumption, that half of in-state education spending benefits in-state businesses, businesses paid $1.19 for every dollar of government spending benefiting businesses.
Executive summaryThis study presents detailed state-by-state estimates of the state and local taxes paid by businesses in fiscal year 2019 (FY19). It is the 18th annual report prepared by Ernst & Young LLP in conjunction with the Council On State Taxation (COST) and the State Tax Research Institute (STRI).
2
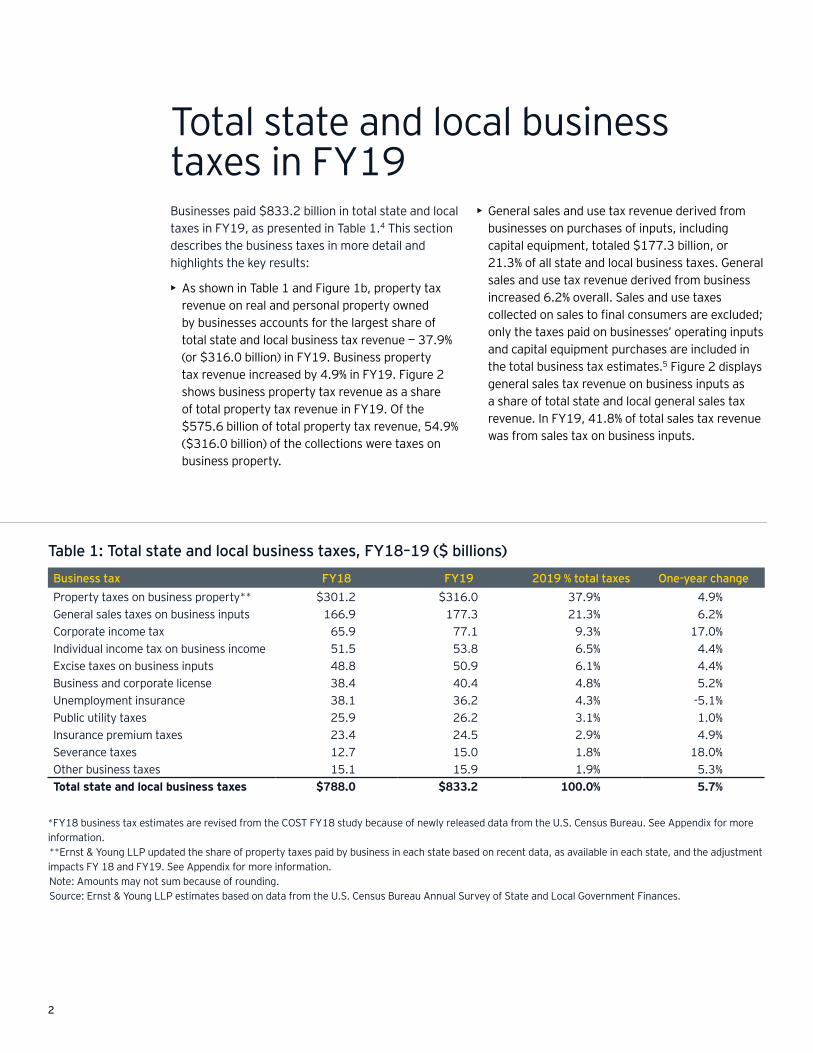
Businesses paid $833.2 billion in total state and local taxes in FY19, as presented in Table 1.4 This section describes the business taxes in more detail and highlights the key results:
• As shown in Table 1 and Figure 1b, property tax revenue on real and personal property owned by businesses accounts for the largest share of total state and local business tax revenue — 37.9% (or $316.0 billion) in FY19. Business property tax revenue increased by 4.9% in FY19. Figure 2 shows business property tax revenue as a share of total property tax revenue in FY19. Of the $575.6 billion of total property tax revenue, 54.9% ($316.0 billion) of the collections were taxes on business property.
• General sales and use tax revenue derived from businesses on purchases of inputs, including capital equipment, totaled $177.3 billion, or 21.3% of all state and local business taxes. General sales and use tax revenue derived from business increased 6.2% overall. Sales and use taxes collected on sales to final consumers are excluded; only the taxes paid on businesses’ operating inputs and capital equipment purchases are included in the total business tax estimates.5 Figure 2 displays general sales tax revenue on business inputs as a share of total state and local general sales tax revenue. In FY19, 41.8% of total sales tax revenue was from sales tax on business inputs.
Total state and local business taxes in FY19
Table 1: Total state and local business taxes, FY18–19 ($ billions)
Business tax FY18 FY19 2019 % total taxes One-year changeProperty taxes on business property** $301.2 $316.0 37.9% 4.9%General sales taxes on business inputs 166.9 177.3 21.3% 6.2%Corporate income tax 65.9 77.1 9.3% 17.0%Individual income tax on business income 51.5 53.8 6.5% 4.4%Excise taxes on business inputs 48.8 50.9 6.1% 4.4%Business and corporate license 38.4 40.4 4.8% 5.2%Unemployment insurance 38.1 36.2 4.3% -5.1%Public utility taxes 25.9 26.2 3.1% 1.0%Insurance premium taxes 23.4 24.5 2.9% 4.9%Severance taxes 12.7 15.0 1.8% 18.0%Other business taxes 15.1 15.9 1.9% 5.3%Total state and local business taxes $788.0 $833.2 100.0% 5.7%
*FY18 business tax estimates are revised from the COST FY18 study because of newly released data from the U.S. Census Bureau. See Appendix for more information.**Ernst & Young LLP updated the share of property taxes paid by business in each state based on recent data, as available in each state, and the adjustment impacts FY 18 and FY19. See Appendix for more information.Note: Amounts may not sum because of rounding.Source: Ernst & Young LLP estimates based on data from the U.S. Census Bureau Annual Survey of State and Local Government Finances.

Total state and local business taxes | 3
• State and local corporate income tax revenue was $77.1 billion in FY19, an increase of 17.0% from FY18. Federal tax reform significantly impacted state corporate income tax collections due to the federal TCJA, which was signed into law in December 2017 and impacted state corporate income tax collections starting in FY18. The TCJA’s provisions expanded taxable corporate income at the federal level, which broadened the tax base in many states and is expected to increase corporate income tax collections for several years. Most of the TCJA provisions that states conformed to took effect in tax years beginning on or after January 1, 2018, which was halfway through FY18 for most states. Thus, the impact of the expanded corporate tax base was only partially reflected in FY18 revenues and fully reflected in FY19.6 Corporate income taxes remain a relatively small percentage of total state and local tax collections, from both businesses and households (see Figure 1a and Appendix Table A4). Also note that Ohio’s commercial activity tax, Texas’ margin tax, New Hampshire’s business enterprise tax, Nevada’s commerce tax, and Washington’s business and occupation tax are included in corporate income tax revenue. These taxes are based on gross receipts or modified gross receipts and constitute the primary business entity tax in each state.
• Individual income taxes paid by owners of pass-through entities (e.g., partnerships, sole proprietorships, limited liability companies and corporations) totaled an estimated $53.8 billion in FY19, an increase of 4.4% from FY18. More than a quarter of the increase was concentrated in California and New York. Individual income taxes from pass-through business income represent 6.5% of total state and local business taxes. At the federal level, taxpayers reporting pass-through entity income are entitled to a deduction equal to 20% of their pass-through income, but most states do not conform to this provision.
• Excise taxes paid by businesses totaled an estimated $50.9 billion in FY19. Excise taxes attributed to businesses include a portion of motor fuel taxes and other excise taxes, such as taxes on hotel and rental car expenditures by businesses, as well as health care provider taxes on the revenue of hospitals and other providers of health services.
• Business and corporate license tax revenue totaled $40.4 billion, an increase of 5.2% from FY18. In FY19, business and corporate license tax revenue contributed to 4.8% of total state and local business tax collections.
Figure 1a: Composition of total state and local taxes on business and households, FY19
Figure 1b: Composition of total state and local business taxes, FY19
Note: Amounts may not sum because of rounding.Source: Ernst & Young LLP estimates based on data from the U.S. Census Bureau Annual Survey of State and Local Government Finances.
n Taxes on business propertyn Sales taxes on business inputsn Excise, utility and insurance taxesn Corporate income taxn Unemployment insurance taxn Individual income tax on business
incomen Business license, severance and
other business taxes37.9+21.3+12.2+9.3+6.5+4.3+8.5+D
37.9%
21.3%
12.2%
9.3%
4.3%
6.5%
8.5%n Property taxesn Sales taxesn Excise, utility and insurance taxesn Corporate income taxn Unemployment insurance taxn Individual income taxn License, severance and other taxes30.4+22.4+10.8+4.1+1.9+23.6+6.8+D
30.4%
22.4%10.8%4.1%
1.9%
23.6%
6.8%

4
• Employer contributions to unemployment insurance (unemployment taxes) were $36.2 billion in FY19, a decrease of $1.9 billion, or 5.1%, from FY19. FY19 is the sixth year that unemployment tax collections have declined since FY08, a result of most states having replenished their unemployment insurance funds and paid outstanding debts to the federal government from the financial crisis.
• Public utility tax revenue declined for five years (from FY12 to FY17) but has since increased the past two fiscal years. Revenue increased by 1.0% to $26.2 billion in FY19 because of significant increases in Utah and Washington. These taxes are generally based on business gross receipts, and because they are often levied in lieu of property or corporate income taxes, they are allocated solely to businesses.
• Taxes on insurance premiums totaled $24.5 billion in FY19, an increase of 4.9% from FY18.
• State and local severance taxes increased by $2.3 billion, or 18.0%, in FY19 to $15.0 billion. Texas, North Dakota, Oklahoma and New Mexico account for most of the increase, providing $1.9 billion of the increase. Severance taxes declined in eight states.
• Other state and local business taxes, including motor vehicle license tax and documentary and stock transfer tax, totaled $15.9 billion in FY19, a 5.3% increase from the previous year.
Figure 2: Total state and local taxes ($ billions) and business and household taxes as a share of total tax collections, FY19
55+45+DProperty taxes (total: $575.6)
$259.745%
$316.055%42+58+D
Sales taxes (total: $424.1)
$247.258%
$177.342%44+56+D
All taxes (total: $1,892.2)
$1,059.456%
$833.244%
n Household share n Business share
Note: Figures may not sum due to rounding.Source: Ernst & Young LLP estimates based on data from the U.S. Census Bureau Annual Survey of State and Local Government Finances

Total state and local business taxes | 5
Classifying business taxesThis study generally defines business taxes as those that are the legal liability of businesses. Certain taxes collected by businesses, such as excise taxes on tobacco and alcohol, and sales taxes on household purchases are not included. In addition, individual income tax on pass-through business income is included as a legal tax liability of business owners. The business taxes included in this analysis are:
• Property taxes paid by businesses on real and personal property, including taxes on income-generating residential rental property
• General sales taxes paid by businesses on purchases of goods and services used in production, excluding sales taxes on final goods paid by consumers
• A portion of excise taxes, such as businesses’ share of motor fuel taxes and other selective sales taxes
• Corporate income taxes
• Taxes on insurance premiums and utility gross receipts, which are in some cases levied in lieu of other business entity taxes
• Individual income taxes on pass-through business income, except for taxes withheld on employee earnings, which are not considered business taxes
• Unemployment insurance (UI) taxes paid by employers
• Business licenses, including general business licenses, specific industry and occupational licenses, and commercial motor vehicle licenses
• Severance taxes on mining, natural gas, oil and other natural resources
In most states, the corporate income tax is the primary tax levied specifically on business entities, but other types of taxes are used in several states. Nevada, Ohio, Texas and Washington levy a tax based on gross receipts in place of a traditional corporate income tax. In addition, New Hampshire’s business enterprise tax is levied on a value-added base rather than income. This analysis considers gross receipts and value-added business entity taxes as corporate income tax revenue since the taxes act as an alternative to the corporate income tax in these states. Many states also levy franchise taxes based on the capital stock or net worth of a business. As shown in Table 1 and Figures 1a and 1b, businesses pay more in property and sales taxes than they do in specific corporate income, franchise or gross receipts taxes.

State vs. local business taxes in FY19
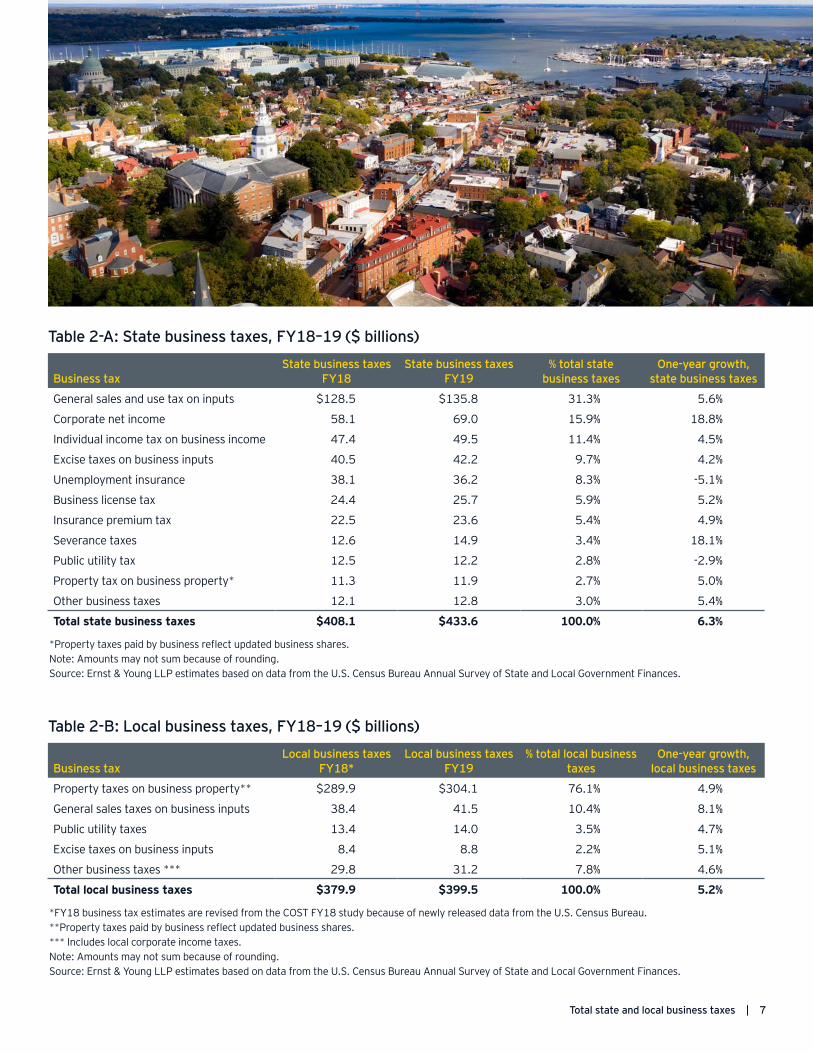
State business tax revenue grew by a higher percentage than local business tax revenue between FY18 and FY19, driven primarily by increases in corporate net income tax and individual income tax on pass-through business income. Tables 2a and 2b provide dollar amounts, percentage distributions and growth rates in FY19 for total business taxes at the state and local levels of government. Total state and local business tax revenues increased by $45.3 billion in FY19, after growing by $42.4 billion in FY17 from the prior fiscal year (see Appendix Table A2). In FY19, state business tax revenue grew by 6.3%, and local business tax revenue grew by 5.2%.
At the state level, business tax revenue increased by 6.3%, or $25.5 billion, from FY18 to FY19. Sales taxes on business inputs, which made up 31.3% of state business tax revenue in FY19, increased by 5.6%, or $7.2 billion, from FY18. Severance taxes increased by $2.3 billion, an increase of 18.1% in FY19. Corporate income taxes increased 18.8%, while individual income taxes on pass-through business income increased 4.5% in FY19. Unemployment insurance tax revenue decreased by $1.9 billion in FY19.
The largest local tax that businesses pay, business property taxes, increased by about $14.2 billion, or 4.9%, from FY18 to FY19. Local sales taxes on business inputs increased by 8.1%, while excise taxes increased by 5.1% and public utility taxes by 4.7%. Local business taxes grew by a total of $19.7 billion in FY19.
Tables 2-A and 2-B demonstrate that the composition of state business taxes differs significantly from business taxes at the local level. Table 2-A shows the percentage distribution of state business taxes by tax type; Table 2-B shows the distribution of local business taxes by tax type. While state business tax revenues draw on a relatively broad set of sources, local governments rely heavily on property tax revenue, which made up 76.1% of local business taxes in FY19. The largest business tax at the state level — the sales and use tax — accounted for 31.3% of state business tax revenue in FY19.
6
Total state and local business taxes | 7
Table 2-A: State business taxes, FY18–19 ($ billions)
Business taxState business taxes
FY18State business taxes
FY19% total state
business taxesOne-year growth,
state business taxes
General sales and use tax on inputs $128.5 $135.8 31.3% 5.6%
Corporate net income 58.1 69.0 15.9% 18.8%
Individual income tax on business income 47.4 49.5 11.4% 4.5%
Excise taxes on business inputs 40.5 42.2 9.7% 4.2%
Unemployment insurance 38.1 36.2 8.3% -5.1%
Business license tax 24.4 25.7 5.9% 5.2%
Insurance premium tax 22.5 23.6 5.4% 4.9%
Severance taxes 12.6 14.9 3.4% 18.1%
Public utility tax 12.5 12.2 2.8% -2.9%
Property tax on business property* 11.3 11.9 2.7% 5.0%
Other business taxes 12.1 12.8 3.0% 5.4%
Total state business taxes $408.1 $433.6 100.0% 6.3%
*Property taxes paid by business reflect updated business shares. Note: Amounts may not sum because of rounding.Source: Ernst & Young LLP estimates based on data from the U.S. Census Bureau Annual Survey of State and Local Government Finances.
Table 2-B: Local business taxes, FY18–19 ($ billions)
Business taxLocal business taxes
FY18*Local business taxes
FY19% total local business
taxesOne-year growth,
local business taxes
Property taxes on business property** $289.9 $304.1 76.1% 4.9%
General sales taxes on business inputs 38.4 41.5 10.4% 8.1%
Public utility taxes 13.4 14.0 3.5% 4.7%
Excise taxes on business inputs 8.4 8.8 2.2% 5.1%
Other business taxes *** 29.8 31.2 7.8% 4.6%
Total local business taxes $379.9 $399.5 100.0% 5.2%
*FY18 business tax estimates are revised from the COST FY18 study because of newly released data from the U.S. Census Bureau.**Property taxes paid by business reflect updated business shares. *** Includes local corporate income taxes.Note: Amounts may not sum because of rounding.Source: Ernst & Young LLP estimates based on data from the U.S. Census Bureau Annual Survey of State and Local Government Finances.
8
State-by-state business tax collections
Figure 3 shows the state-by-state change in total state and local business taxes between FY18 and FY19. States with significant tax changes in FY19 and trends in business tax collections are described below:
• ►Louisiana and Connecticut were the only two states that experienced a decline in business taxes, with a 0.6% and a 0.1% decline, respectively, in FY19. Sales tax decreased by 16% in Louisiana due to a state sales tax rate reduction from 5.0% to 4.45% on July 1, 2018. In Connecticut, individual income taxes on business income declined by nearly $1.3 billion, or 13%, between FY18 and FY19.
• ►On the other end of the spectrum, New Mexico had the largest increase in state and local business tax collections, with a 3.0% increase, followed by Utah, with a 18.9% increase. In New Mexico, the increase was primarily due to severance tax and Gross Receipts Tax (similar to a sales tax) revenues.
• ►In 2019, business property taxes increased for the ninth year in a row since 2010. Almost half of the $14.8 billion in increased property tax revenue came from gains in four large states: Texas ($2.3 billion), California ($2.0 billion), New York ($1.4 billion) and Florida ($1.0 billion). Nationally, business property tax revenue increased by an average of 4.9%, but for 33 states, this revenue grew at a slower rate. Texas had the largest dollar increase in business property tax revenue, collecting $2.3 billion more than in 2018. Washington had the highest growth rate for business property tax revenue, increasing by 15.4%.
• ►Nationally, state and local business tax revenue derived from individual income tax on pass-through income increased by 4.4% in FY19.
• ►The state with the largest gain in sales tax collections on business inputs was California, which saw an increase of over $3.6 billion. Of the 45 states with a state sales tax, 42 experienced an increase in sales tax collections on business inputs. DC also experienced an increase in sales tax collections on business inputs.
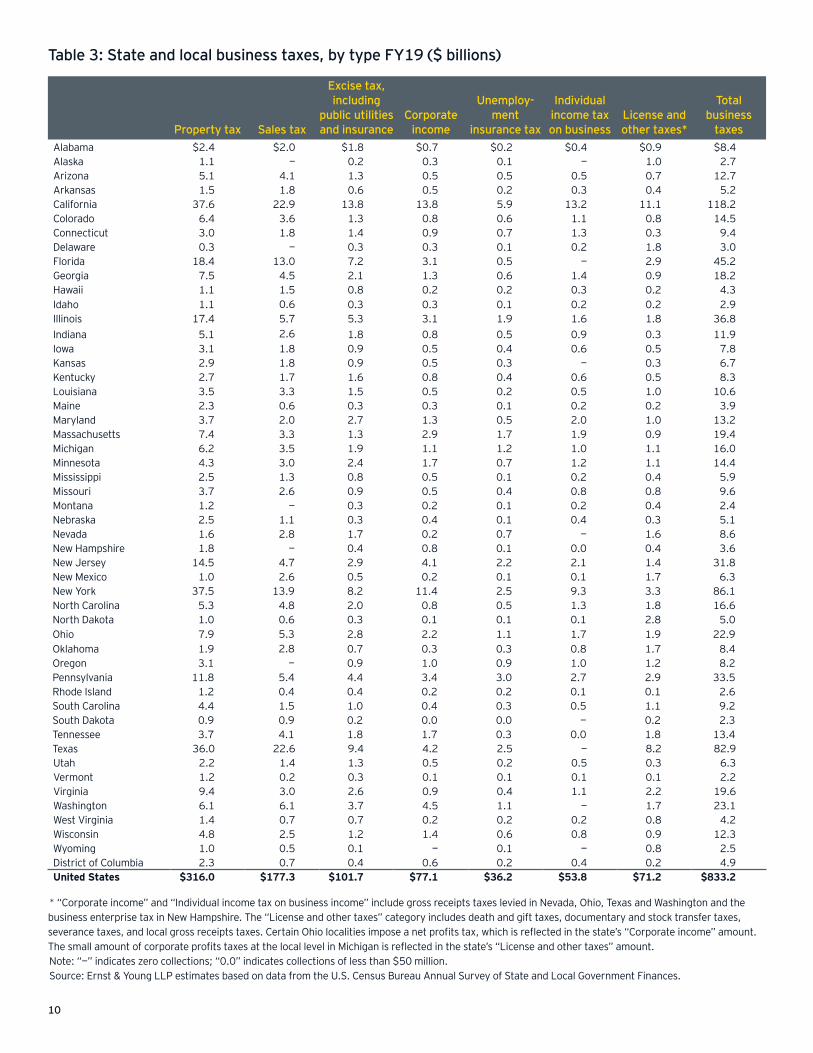
Table 3 presents state and local business tax collections by tax type and state. The results show that states vary widely in the composition of their business tax structures, which has implications for revenue growth and stability in each state. Appendix Table A3 presents the percentage composition by tax type for each of the 50 states and the District of Columbia.

-5% 0% 5% 10% 15% 20% 25% 30%
Louisiana, -0.6%Connecticut, -0.1%
Florida, 0.3%Michigan, 1.0%
South Dakota, 1.7%Ohio, 1.9%
North Carolina, 2.7%Missouri, 2.8%
Idaho, 3.3%New York, 3.6%
Indiana, 3.6%Arkansas, 3.6%
Tennessee, 3.8%New Hampshire, 3.9%
Georgia, 4.1%Kentucky, 4.2%Vermont, 4.4%
Kansas, 4.6%Mississippi, 4.7%
South Carolina, 4.7%Illinois, 5.0%
Alabama, 5.1%Nebraska, 5.1%Maryland, 5.3%
Maine, 5.6%Oregon, 5.8%
Pennsylvania, 5.8%Montana, 6.0%
Texas, 6.0%Alaska, 6.0%
Wisconsin, 6.3%Minnesota, 6.5%
Nevada, 6.6%Washington, 6.6%
Iowa, 6.7%Hawaii, 7.4%
District of Columbia, 7.7%California, 7.8%Colorado, 8.0%
West Virginia, 8.2%Massachusetts, 8.3%
Rhode Island, 9.1%Wyoming, 9.1%
Arizona, 9.3%Delaware, 9.5%Virginia, 10.1%
New Jersey, 10.1%North Dakota, 15.1%
Oklahoma, 16.1%Utah, 18.9%
New Mexico, 30.0%
US state and local business tax growth: 5.7%
Total state and local business taxes | 9
Figure 3. Change in state and local business taxes by state, FY18–19
(percentage change in total state and local business taxes)
Source: Ernst & Young LLP estimates based on data from the U.S. Census Bureau Annual Survey of State and Local Government Finances.
10
Property tax Sales tax
Excise tax, including
public utilities and insurance
Corporate income
Unemploy-ment
insurance tax
Individual income tax on business
License and other taxes*
Total business
taxesAlabama $2.4 $2.0 $1.8 $0.7 $0.2 $0.4 $0.9 $8.4Alaska 1.1 — 0.2 0.3 0.1 — 1.0 2.7Arizona 5.1 4.1 1.3 0.5 0.5 0.5 0.7 12.7Arkansas 1.5 1.8 0.6 0.5 0.2 0.3 0.4 5.2California 37.6 22.9 13.8 13.8 5.9 13.2 11.1 118.2Colorado 6.4 3.6 1.3 0.8 0.6 1.1 0.8 14.5Connecticut 3.0 1.8 1.4 0.9 0.7 1.3 0.3 9.4Delaware 0.3 — 0.3 0.3 0.1 0.2 1.8 3.0Florida 18.4 13.0 7.2 3.1 0.5 — 2.9 45.2Georgia 7.5 4.5 2.1 1.3 0.6 1.4 0.9 18.2Hawaii 1.1 1.5 0.8 0.2 0.2 0.3 0.2 4.3Idaho 1.1 0.6 0.3 0.3 0.1 0.2 0.2 2.9Illinois 17.4 5.7 5.3 3.1 1.9 1.6 1.8 36.8Indiana 5.1 2.6 1.8 0.8 0.5 0.9 0.3 11.9Iowa 3.1 1.8 0.9 0.5 0.4 0.6 0.5 7.8Kansas 2.9 1.8 0.9 0.5 0.3 — 0.3 6.7Kentucky 2.7 1.7 1.6 0.8 0.4 0.6 0.5 8.3Louisiana 3.5 3.3 1.5 0.5 0.2 0.5 1.0 10.6Maine 2.3 0.6 0.3 0.3 0.1 0.2 0.2 3.9Maryland 3.7 2.0 2.7 1.3 0.5 2.0 1.0 13.2Massachusetts 7.4 3.3 1.3 2.9 1.7 1.9 0.9 19.4Michigan 6.2 3.5 1.9 1.1 1.2 1.0 1.1 16.0Minnesota 4.3 3.0 2.4 1.7 0.7 1.2 1.1 14.4Mississippi 2.5 1.3 0.8 0.5 0.1 0.2 0.4 5.9Missouri 3.7 2.6 0.9 0.5 0.4 0.8 0.8 9.6Montana 1.2 — 0.3 0.2 0.1 0.2 0.4 2.4Nebraska 2.5 1.1 0.3 0.4 0.1 0.4 0.3 5.1Nevada 1.6 2.8 1.7 0.2 0.7 — 1.6 8.6New Hampshire 1.8 — 0.4 0.8 0.1 0.0 0.4 3.6New Jersey 14.5 4.7 2.9 4.1 2.2 2.1 1.4 31.8New Mexico 1.0 2.6 0.5 0.2 0.1 0.1 1.7 6.3New York 37.5 13.9 8.2 11.4 2.5 9.3 3.3 86.1North Carolina 5.3 4.8 2.0 0.8 0.5 1.3 1.8 16.6North Dakota 1.0 0.6 0.3 0.1 0.1 0.1 2.8 5.0Ohio 7.9 5.3 2.8 2.2 1.1 1.7 1.9 22.9Oklahoma 1.9 2.8 0.7 0.3 0.3 0.8 1.7 8.4Oregon 3.1 — 0.9 1.0 0.9 1.0 1.2 8.2Pennsylvania 11.8 5.4 4.4 3.4 3.0 2.7 2.9 33.5Rhode Island 1.2 0.4 0.4 0.2 0.2 0.1 0.1 2.6South Carolina 4.4 1.5 1.0 0.4 0.3 0.5 1.1 9.2South Dakota 0.9 0.9 0.2 0.0 0.0 — 0.2 2.3Tennessee 3.7 4.1 1.8 1.7 0.3 0.0 1.8 13.4Texas 36.0 22.6 9.4 4.2 2.5 — 8.2 82.9Utah 2.2 1.4 1.3 0.5 0.2 0.5 0.3 6.3Vermont 1.2 0.2 0.3 0.1 0.1 0.1 0.1 2.2Virginia 9.4 3.0 2.6 0.9 0.4 1.1 2.2 19.6Washington 6.1 6.1 3.7 4.5 1.1 — 1.7 23.1West Virginia 1.4 0.7 0.7 0.2 0.2 0.2 0.8 4.2Wisconsin 4.8 2.5 1.2 1.4 0.6 0.8 0.9 12.3Wyoming 1.0 0.5 0.1 — 0.1 — 0.8 2.5District of Columbia 2.3 0.7 0.4 0.6 0.2 0.4 0.2 4.9United States $316.0 $177.3 $101.7 $77.1 $36.2 $53.8 $71.2 $833.2
Table 3: State and local business taxes, by type FY19 ($ billions)
* “Corporate income” and “Individual income tax on business income” include gross receipts taxes levied in Nevada, Ohio, Texas and Washington and the business enterprise tax in New Hampshire. The “License and other taxes” category includes death and gift taxes, documentary and stock transfer taxes, severance taxes, and local gross receipts taxes. Certain Ohio localities impose a net profits tax, which is reflected in the state’s “Corporate income” amount. The small amount of corporate profits taxes at the local level in Michigan is reflected in the state’s “License and other taxes” amount.Note: “—” indicates zero collections; “0.0” indicates collections of less than $50 million.Source: Ernst & Young LLP estimates based on data from the U.S. Census Bureau Annual Survey of State and Local Government Finances.

Total state and local business taxes | 11
Comparing state business tax levelsA state’s business tax burden can be measured in many ways. One approach is to compare the level of business taxes to the level of economic activity that is subject to taxation (private sector gross domestic product). State and local business taxes are imposed on a variety of tax bases, including net income, input purchases, payroll and property. Therefore, a broad measure of a state’s overall economic activity should be used to determine the measure of aggregate business tax burden that can be compared across states.
Table 4 and Figure 4 present state-by-state estimates of state and local business taxes and total taxes, as well as the total effective business tax rate (TEBTR) imposed on business activity by state and local governments, in FY19. The TEBTR is measured as the ratio of state and local business taxes to private-sector gross state product, the total value of a state’s annual production of goods and services by the private sector. The average TEBTR across all states was 4.5%.
North Carolina, Missouri and Michigan had the lowest TEBTRs — 3.3% — meaning that as a share of economic activity, the state’s corporate income, excise and license taxes were lower than those of other states. These states rely less on business taxes, instead generating a greater share of tax revenue from households. Georgia had 3.4%, the next-lowest TEBTR.
Connecticut also has a low TEBTR, explained in part by several high-output industries, such as insurance, financial services and aerospace, which generate a large amount of GSP for the state. Connecticut’s business taxes per dollar of GSP are significantly below the national average for this reason. Additionally, Connecticut relies on individual income taxes for a significant share of its total state and local taxes, which are mostly paid by households.
Another state with a low TEBTR for FY19 is Oregon (3.8%), which is due to its lack of a sales tax and its lower-than-average business share of property taxes at 46%, compared with 55% nationally. However, Oregon enacted a commercial activity tax on gross receipts, which will be imposed for tax years beginning on January 1, 2020, and this tax will increase the state’s TEBTR in future years.
North Dakota had the highest TEBTR, at 10.0%, because of its heavy reliance on severance taxes paid by extractive industry firms operating in the state.
TEBTRs provide a starting point for comparing burdens across states, but they do not provide sufficient information to evaluate a state’s competitiveness. States with relatively low TEBTRs that derive most of their business taxes from origin-based taxes such as property taxes and sales taxes are likely not as competitive in attracting investment and jobs as states with higher TEBTRs that rely on taxes paid disproportionately on out-of-state businesses. TEBTRs also do not indicate the economic incidence of a tax. When a tax can be passed on to consumers, it does not cause the same effects on investment and job creation as an origin-based tax. In certain states with sales-factor apportionment and market-based sourcing of sales, a large portion of the business entity tax may be paid by out-of-state companies on in-state sales.7
Furthermore, two states with similar TEBTRs may vary in the way they tax certain industries — a difference that is not considered in this analysis. It is also important to note that the TEBTR is a measure of the average tax burden on existing businesses in a state rather than a measure of the marginal tax that would be borne by a company investing in a new or expanded facility. For this reason, the TEBTR is one metric that can be used to evaluate a state’s business tax structure but is not a clear indicator of the competitiveness of a state’s business tax system in terms of attracting new investment.

12
State
State taxes Local taxes State and local taxes
TEBTR*
Business taxes per employee
($ thousands)** Business Total Business Total Business Total
Alabama $4.7 $11.8 $3.8 $6.6 $8.4 $18.4 4.5% $5.0Alaska 1.6 1.9 1.0 2.0 2.7 3.9 6.1% $10.6Arizona 6.2 18.7 6.5 12.3 12.7 30.9 4.1% $5.1Arkansas 4.0 10.4 1.3 2.5 5.2 12.9 4.6% $5.0California 66.8 194.2 51.5 99.2 118.2 293.4 4.3% $7.7Colorado 5.5 16.4 9.0 15.8 14.5 32.2 4.3% $6.2Connecticut 6.3 18.7 3.1 11.5 9.4 30.2 3.7% $6.3Delaware 2.6 4.7 0.4 1.1 3.0 5.8 4.5% $7.5Florida 21.0 45.3 24.1 39.8 45.2 85.1 4.8% $5.7Georgia 8.4 25.3 9.8 17.6 18.2 42.9 3.4% $4.6Hawaii 2.9 8.4 1.4 2.7 4.3 11.1 5.6% $7.9Idaho 1.7 5.0 1.2 2.1 2.9 7.1 4.3% $4.7Illinois 16.0 44.4 20.8 38.2 36.8 82.6 4.6% $6.8Indiana 6.6 20.7 5.3 8.5 11.9 29.1 3.5% $4.3Iowa 4.1 11.0 3.7 6.4 7.8 17.4 4.6% $5.8Kansas 3.5 10.3 3.3 5.6 6.7 16.0 4.5% $5.7Kentucky 5.0 13.3 3.3 5.8 8.3 19.1 4.6% $5.0Louisiana 4.9 12.0 5.7 9.6 10.6 21.6 4.6% $6.3Maine 1.6 4.8 2.3 3.1 3.9 7.9 6.8% $7.2Maryland 8.0 24.1 5.1 17.6 13.2 41.7 3.9% $5.8Massachusetts 11.6 33.5 7.9 19.2 19.4 52.7 3.7% $5.9Michigan 10.4 31.5 5.6 14.0 16.0 45.5 3.3% $4.1Minnesota 10.0 28.9 4.4 9.5 14.4 38.4 4.3% $5.6Mississippi 3.3 8.4 2.6 3.5 5.9 11.9 6.1% $6.3Missouri 4.0 13.6 5.5 11.2 9.6 24.7 3.3% $3.8Montana 1.4 3.3 1.0 1.6 2.4 4.9 5.4% $6.0Nebraska 2.1 5.8 3.0 5.0 5.1 10.8 4.7% $6.0Nevada 5.5 10.4 3.1 5.7 8.6 16.1 5.5% $6.9New Hampshire 1.9 3.0 1.7 4.5 3.6 7.5 4.6% $6.0New Jersey 17.1 41.1 14.8 31.8 31.8 72.9 5.6% $8.8New Mexico 4.3 7.6 1.9 3.3 6.3 10.9 8.0% $9.4New York 29.5 94.1 56.6 105.4 86.1 199.5 5.7% $10.4North Carolina 9.5 29.8 7.1 15.1 16.6 44.9 3.3% $4.3North Dakota 3.8 5.1 1.2 1.7 5.0 6.8 10.0% $14.0Ohio 12.7 31.3 10.1 26.1 22.9 57.4 3.7% $4.7Oklahoma 5.0 11.0 3.4 6.3 8.4 17.2 4.9% $6.3Oregon 4.3 14.9 4.0 8.2 8.2 23.1 3.8% $4.9Pennsylvania 18.8 46.1 14.7 30.5 33.5 76.6 4.6% $6.2Rhode Island 1.4 3.9 1.2 2.8 2.6 6.7 4.8% $5.9South Carolina 3.7 11.6 5.5 8.6 9.2 20.2 4.5% $5.0South Dakota 1.1 2.0 1.2 2.0 2.3 4.0 5.0% $6.4Tennessee 8.3 15.1 5.1 9.8 13.4 24.9 4.1% $5.0Texas 39.6 65.8 43.4 73.5 82.9 139.3 5.0% $7.7Utah 3.0 10.1 3.3 5.6 6.3 15.8 3.9% $4.8Vermont 1.8 3.6 0.5 0.7 2.2 4.2 7.7% $8.4Virginia 7.3 26.7 12.3 20.2 19.6 47.0 4.4% $5.9Washington 14.9 29.1 8.2 18.0 23.1 47.1 4.5% $8.0West Virginia 2.4 6.2 1.7 2.3 4.2 8.4 6.4% $7.2Wisconsin 7.2 20.6 5.1 10.9 12.3 31.6 4.0% $4.8Wyoming 1.6 2.2 0.9 1.3 2.5 3.5 7.5% $11.5District of Columbia 4.9 8.8 0.0 0.0 4.9 8.8 5.1% $8.8United States $433.6 $1,126.4 $399.6 $766.2 $833.2 $1,892.6 4.5% $6.5
Table 4: Business Taxes as a share of state, local, and total taxes and private sector GSP, FY19 ($ billions)
*Average of calendar-year 2018 and calendar-year 2019 private-industry GSP. This is the TEBTR on economic activity occurring within the state.**“Business taxes per employee” calculated using 2018 private-sector employment from Bureau of Labor Statistics Quarterly Census of Employment and Wages and FY19 total state and local business tax collections.Note: Amounts may not sum because of rounding. TEBTR equals taxes as a percent of private-sector gross state product.Source: Ernst & Young LLP estimates based on data from the U.S. Census Bureau Annual Survey of State and Local Government Finances.

Total state and local business taxes | 13
Table 5 summarizes the share of taxes paid by businesses in each state. Business taxes accounted for 44.0% of total state and local taxes in FY19. Business taxes accounted for a smaller share of state taxes (38.5%) than local taxes (52.2%). The share of local taxes paid by businesses is higher than the state share because businesses pay 54.9% of local property taxes, which account for 72.4% of total (business and household) local tax collections, while state governments rely most heavily on sales taxes, of which the majority are paid by households.
The business share of total state and local taxes has remained relatively stable at close to 44% over the past five years, as shown in Appendix Table A1. Although some individual income taxes are imposed on business income, the vast majority falls on households. Individual income taxes on nonbusiness income (i.e., households) accounted for 20.7% of total state and local tax revenue in FY19.
The share of total state and local taxes paid by businesses varies significantly by state for a number of reasons. The states with the highest business share in FY19 include North Dakota (73.2%), Wyoming (71.1%), Alaska (68.4%), Texas (59.6%) and South Dakota (58.8%). All these states have significant severance taxes paid by businesses. Additionally, South Dakota, Texas and Wyoming do not have an individual income tax, which is predominantly paid by households, creating a greater reliance on business taxes in these states.
The states with the lowest business tax share include Connecticut (31.2%), Maryland (31.6%), Michigan (35.2%), Oregon (35.6%), Massachusetts (36.8%) and North Carolina (37.0%). Connecticut and Maryland generate the smallest share of their overall tax receipts from business taxes. The structure of both states’ economies plays a significant role in generating this result.
In Connecticut, significant income earned by high-income taxpayers contributes to individual income tax receipts that outweigh business collections. In Maryland, the state receives a low share of its total tax revenue from business taxes because the state relies heavily on the individual income tax to generate tax revenue from employment related to the significant nontaxable federal government and nonprofit activity in the state. In FY19, 38.0% of total state and local taxes came from the individual income tax in Maryland, compared with 23.6% nationally. This greater reliance on the individual income tax increases business income taxes on pass-through income but reduces the overall business share and TEBTR. Oregon’s low business share is explained by its lack of a sales tax, of which businesses paid 41.8% nationally, and a lower property tax share paid by business (46% in Oregon, compared with 55% nationally).
A high share of total state and local taxes paid by business does not necessarily translate into a high effective business tax rate on economic activity. States without individual income taxes generally derive a larger share of their total tax revenue from business taxes, even though business taxes in these states may not be significantly higher than the national average. The business tax burden would not increase if household taxes were cut and no new taxes were imposed on businesses, but the business share of total taxes would increase. For instance, 51.4% of taxes in Delaware are paid by businesses (7.4% above the average), but the TEBTR is 4.5% (equal to the average). In this case, the high business share is largely attributable to the corporation license tax, which generates substantial revenue due to the significant number of businesses incorporated in Delaware.
Lower TEBTR Higher TEBTR
Hawaii
Alaska
3.3% 10.0%
Figure 4: Total effective business tax rate (TEBTR) by state, FY19 (state and local business taxes divided by private sector gross state product in each state)
Source: Ernst & Young LLP estimates based on data from the Bureau of Economic Analysis and the U.S. Census Bureau Annual Survey of State and Local Government Finances.

14
Table 5. Business share of total state and local taxes, FY19
Note: District of Columbia taxes are treated as state taxes in this analysis.Source: Ernst & Young LLP estimates based on data from the U.S. Census Bureau Annual Survey of State and Local Government Finances.
StateBusiness share of
state taxesBusiness share of
local taxes
Business share of total state and
local taxesAlabama 39.6% 57.1% 45.9%Alaska 85.6% 52.1% 68.4%Arizona 33.2% 52.8% 41.0%Arkansas 38.2% 50.7% 40.6%California 34.4% 51.9% 40.3%Colorado 33.5% 56.8% 44.9%Connecticut 33.7% 27.1% 31.2%Delaware 55.3% 35.4% 51.4%Florida 46.4% 60.6% 53.0%Georgia 33.0% 56.0% 42.4%Hawaii 34.4% 53.3% 39.0%Idaho 34.9% 56.3% 41.1%Illinois 36.0% 54.4% 44.5%Indiana 31.8% 62.8% 40.8%Iowa 36.8% 58.2% 44.7%Kansas 33.5% 57.8% 42.1%Kentucky 37.6% 57.9% 43.7%Louisiana 40.9% 59.2% 49.0%Maine 33.4% 73.7% 49.1%Maryland 33.3% 29.2% 31.6%Massachusetts 34.5% 40.9% 36.8%Michigan 33.0% 40.3% 35.2%Minnesota 34.7% 46.3% 37.5%Mississippi 39.2% 75.7% 49.8%Missouri 29.7% 49.6% 38.7%Montana 41.4% 61.7% 48.1%Nebraska 36.6% 59.9% 47.3%Nevada 53.0% 53.7% 53.3%New Hampshire 62.4% 37.9% 47.8%New Jersey 41.5% 46.5% 43.7%New Mexico 57.5% 57.2% 57.4%New York 31.3% 53.6% 43.1%North Carolina 31.8% 47.3% 37.0%North Dakota 75.4% 66.6% 73.2%Ohio 40.7% 38.8% 39.8%Oklahoma 45.5% 54.9% 48.9%Oregon 28.6% 48.2% 35.6%Pennsylvania 40.8% 48.2% 43.8%Rhode Island 35.4% 43.1% 38.6%South Carolina 32.0% 63.3% 45.4%South Dakota 57.8% 59.9% 58.8%Tennessee 55.0% 52.6% 54.0%Texas 60.1% 59.0% 59.6%Utah 29.5% 59.2% 40.1%Vermont 49.6% 70.4% 53.0%Virginia 27.2% 60.9% 41.7%Washington 51.3% 45.6% 49.1%West Virginia 39.6% 76.1% 49.5%Wisconsin 34.6% 46.9% 38.9%Wyoming 71.7% 70.1% 71.1%District of Columbia 55.2% n/a 55.2%United States 38.5% 52.2% 44.0%

Total state and local business taxes | 15
55%
18% 18%
8% 6% 4%
-9%
Education Public safety Social and veterans’ services
Transportation Health Naturalresources
Administrativeand insurance
Governmental benefits received by businesses vs. taxes paidIn addition to the TEBTR, the business tax burden can be evaluated by comparing business taxes paid with benefits received by businesses due to government spending. Because government spending can reduce businesses’ nontax costs, if two businesses pay the same amount of taxes but one receives larger benefits from government spending, the true burden of taxes is not the same for both businesses. Calculating the business tax-to-benefit ratio estimates the extent to which businesses are “getting what they paid for” from their tax dollars.
Figure 5 shows FY19 total estimated state and local government spending by category (net of user charges and other nontax revenue) for both households and businesses. A methodology developed by economists at the Federal Reserve Bank of Chicago was used to allocate expenditures in major categories (see Figure 5) between households and businesses to reflect the extent to which each group benefits from each type of expenditure.8 Certain expenditures, such as health and human services, were assigned entirely to households, while other categories, such as public safety and highway infrastructure costs (in the transportation category), were split evenly between businesses and households. The tax-to-benefit ratio was calculated by dividing business taxes in each state by estimated government expenditures benefiting businesses.
Since education spending is by far the largest category of net state and local expenditures, estimates of the tax-benefit ratio for businesses are sensitive to the allocation of education expenditures between businesses and households. While economic theory suggests that individuals are the primary beneficiaries of education because they can earn higher wages, business owners can benefit if an educated workforce generates higher returns to capital. Returns to capital would increase if workers do not completely capture productivity gains through higher wages or if an educated workforce improves the productivity of capital (e.g., an educated or trained worker may know how to use machines in production more efficiently, resulting in fewer breakdowns or work stoppages). A review of the literature on this topic finds that a 1% increase in the share of workers with a college education in a city increases output by 0.5 to 0.6 percentage points.9 If businesses are able to capture some or all of the additional productivity from increased education, they are deriving benefits from this type of government spending.
Figure 5: Net state and local government expenditures by category, FY19 (for both households and businesses)12
Source: Ernst & Young LLP estimates of tax-funded revenue based on data from the U.S. Census Bureau Annual Survey of State and Local Government Finances and the National Association of State Budget Officers.

16
Education can increase profits through indirect channels as well. For example, a more educated populace may result in reduced property crime, which may lower business costs and increase the return to capital. One estimate of the social returns of an educated workforce is that social benefits, in the form of lower government spending for police services and incarceration costs, are equal to 14% to 26% of the private return of education (higher wages) that accrues to individuals.10
Since the benefit of education to households and businesses is unknown, and the tax-to-benefit ratio is sensitive to this assumption, this analysis presents a range of estimates for the share of educational expenditures that benefit local businesses. The ratio is estimated assuming that 0%, 25% and 50% of in-state education spending benefits in-state businesses.11
Figure 6 and Table 6 summarize the results using the three educational share assumptions for FY19. Assuming that education spending does not directly benefit local business, the ratio of business taxes paid to government services received by businesses is 3.34, indicating that businesses are taxed $3.34 per dollar of government services they receive. The ratio drops to 1.75 when one-quarter of education spending is assumed to benefit business and 1.19 when half of education spending is assumed to benefit local business.
Using net government spending rather than gross spending to calculate tax-to-benefit ratios yields different results. Net government spending subtracts nontax revenue and estimates tax-funded state and local government spending. While tax revenue is the largest individual source of state and local government revenue, 58% of total revenue was derived from other sources in 2017, the last year for which complete data on state and local government finances is available from the U.S. Census Bureau. A state could maintain the same level of business taxation and gross spending from one year to the next, but its tax-to-benefit ratio would still differ if its level of nontax revenue changed.
Wyoming has the highest tax-benefit ratio as it has a high share of taxes paid by business and a lower level of expenditures benefiting business. Fourteen additional states have tax-benefit ratios above 4.0, assuming educational expenditures do not benefit business. If educational expenditures are split evenly between households and businesses, the tax-benefit ratios are fairly similar across states, with all but one state having tax-benefit ratios between 0.8 and 2.0. North Dakota is the outlier with a tax-benefit ratio of 2.2.

Total state and local business taxes | 17
Table 6: Ratio of business taxes to government expenditures benefiting businesses, FY19 ($ billions)
Note: Amounts may not sum because of rounding. Source: Ernst & Young LLP estimates based on data from the U.S. Census Bureau Annual Survey of State and Local Government Finances and the National Association of State Budget Officers.
0% of education spending benefiting business
25% of education spending benefiting business
50% of education spending benefiting business
StateState and local business taxes
Total state and local spending
benefiting business
Tax-benefit ratio
Total state and local spending
benefiting business
Tax-benefit ratio
Total state and local spending
benefiting business
Tax-benefit ratio
Alabama $8.4 $2.4 3.6 $4.8 1.7 $7.3 1.2Alaska 2.7 1.0 2.7 1.6 1.7 2.1 1.3Arizona 12.7 4.3 2.9 7.0 1.8 9.7 1.3Arkansas 5.2 1.7 3.2 3.2 1.6 4.8 1.1California 118.2 43.1 2.7 76.3 1.6 109.4 1.1Colorado 14.5 4.6 3.2 8.4 1.7 12.2 1.2Connecticut 9.4 3.3 2.8 7.0 1.3 10.7 0.9Delaware 3.0 0.6 4.7 1.4 2.2 2.1 1.4Florida 45.2 17.4 2.6 26.3 1.7 35.2 1.3Georgia 18.2 5.5 3.3 11.6 1.6 17.8 1.0Hawaii 4.3 1.0 4.3 1.7 2.5 2.5 1.8Idaho 2.9 1.2 2.4 2.0 1.5 2.8 1.1Illinois 36.8 11.8 3.1 21.1 1.7 30.4 1.2Indiana 11.9 2.9 4.1 6.5 1.8 10.1 1.2Iowa 7.8 1.7 4.5 3.4 2.3 5.0 1.5Kansas 6.7 2.0 3.4 4.0 1.7 6.0 1.1Kentucky 8.3 2.6 3.2 5.4 1.6 8.1 1.0Louisiana 10.6 4.6 2.3 7.7 1.4 10.7 1.0Maine 3.9 1.0 3.9 1.8 2.1 2.7 1.5Maryland 13.2 6.1 2.2 10.9 1.2 15.8 0.8Massachusetts 19.4 5.1 3.8 10.9 1.8 16.8 1.2Michigan 16.0 5.8 2.8 11.2 1.4 16.7 1.0Minnesota 14.4 5.6 2.6 10.2 1.4 14.8 1.0Mississippi 5.9 1.7 3.4 3.4 1.7 5.1 1.2Missouri 9.6 3.2 3.0 6.2 1.6 9.1 1.0Montana 2.4 0.9 2.7 1.4 1.7 1.9 1.2Nebraska 5.1 1.4 3.6 2.9 1.8 4.4 1.2Nevada 8.6 2.4 3.6 3.8 2.2 5.3 1.6New Hampshire 3.6 0.8 4.7 1.7 2.1 2.6 1.4New Jersey 31.8 5.7 5.5 15.2 2.1 24.7 1.3New Mexico 6.3 1.4 4.5 2.6 2.4 3.9 1.6New York 86.1 21.8 3.9 48.2 1.8 74.5 1.2North Carolina 16.6 5.9 2.8 11.3 1.5 16.6 1.0North Dakota 5.0 1.2 4.2 1.8 2.9 2.3 2.2Ohio 22.9 7.2 3.2 14.1 1.6 21.0 1.1Oklahoma 8.4 1.9 4.4 3.5 2.4 5.1 1.7Oregon 8.2 3.2 2.6 5.9 1.4 8.6 1.0Pennsylvania 33.5 9.3 3.6 18.7 1.8 28.1 1.2Rhode Island 2.6 0.8 3.4 1.5 1.7 2.3 1.1South Carolina 9.2 2.3 4.0 4.9 1.9 7.5 1.2South Dakota 2.3 0.8 3.1 1.2 2.0 1.6 1.4Tennessee 13.4 3.6 3.7 6.6 2.0 9.7 1.4Texas 82.9 15.6 5.3 34.0 2.4 52.4 1.6Utah 6.3 2.2 2.9 4.3 1.5 6.4 1.0Vermont 2.2 0.5 4.1 1.1 2.1 1.6 1.4Virginia 19.6 6.4 3.1 11.9 1.6 17.5 1.1Washington 23.1 5.7 4.0 11.1 2.1 16.4 1.4West Virginia 4.2 0.9 4.5 1.9 2.2 2.9 1.4Wisconsin 12.3 5.3 2.3 8.9 1.4 12.4 1.0Wyoming 2.5 0.4 5.6 0.8 3.0 1.2 2.0District of Columbia 4.9 1.2 3.9 2.2 2.2 3.2 1.5United States $833.2 $249.1 3.34 $475.5 1.75 $702.0 1.19

0.81.01.0
1.11.01.0
1.31.3
1.21.1
1.01.0
0.91.0
1.31.0
1.11.4
1.21.11.1
1.21.01.0
1.11.11.21.21.2
1.61.2
1.41.2
1.51.5
1.21.2
1.41.2
1.42.2
1.81.7
1.61.4
1.51.41.4
1.61.3
2.0
1.2
2.22.32.3
2.42.62.62.6
2.72.72.72.82.82.82.9
2.93.0
3.13.13.13.23.23.23.2
3.33.43.43.4
3.63.63.63.6
3.73.8
3.93.93.94.0
4.04.14.14.2
4.34.4
4.54.54.5
4.74.7
5.35.55.6
3.34
0.0 1.0 2.0 3.0 4.0 5.0 6.0
MarylandLouisianaWisconsin
IdahoOregon
MinnesotaFloridaAlaska
MontanaCaliforniaMichigan
North CarolinaConnecticut
UtahArizona
MissouriVirginia
South DakotaIllinois
ArkansasOhio
ColoradoKentucky
GeorgiaKansas
Rhode IslandMississippi
AlabamaPennsylvania
NevadaNebraska
TennesseeMassachusetts
MaineDistrict of Columbia
New YorkSouth Carolina
WashingtonIndiana
VermontNorth Dakota
HawaiiOklahoma
New MexicoWest Virginia
IowaNew Hampshire
DelawareTexas
New JerseyWyoming
United States
With 50% of educational expenses allocated to business With 0% of educational expenses allocated to business
Figure 6: Business taxes per dollar of net government spending that benefits businesses, FY19 (values shown are equal to business taxes divided by government spending that benefits businesses)
18
Source: Ernst & Young LLP estimates based on data from the U.S. Census Bureau Annual Survey of State and Local Government Finances and the National Association of State Budget Officers. Wyoming’s state and local expenditures benefiting business were estimated using state financial reports.

Total state and local business taxes | 19
ConclusionBusinesses paid more than $833 billion in state and local taxes in FY19, representing a 5.7% increase from the previous year. Growth in state and local tax revenue from business was spread across a number of tax types, with the largest increases in corporate income taxes, severance taxes and sales taxes on business inputs. While corporate income taxes continue to represent a relatively small share of total state and local business taxes, federal tax reform has resulted in an increase in corporate tax collections and the significance of the state corporate income tax. The share of state and local taxes increased from 43.5% in FY18 to 44.0% in FY19, but the overall total effective business tax rate declined from 4.7% to 4.5% in FY19.
The COVID-19 pandemic has impacted state and local tax revenues for FY20 and beyond, but such impacts are not reflected in the FY19 tax collection data described in this analysis. However, a reduction in the level of tax paid by businesses and households are expected, which is likely to impact the overall share of taxes paid by business as well as the composition of the business tax burden.

20
Appendix

Total state and local business taxes | 21
Appendix Table A1: Total state and local taxes, FY15–19 ($ billions)
State and local taxes 2015 2016 2017 2018 2019Total business taxes $716.3 $725.5 $745.6 $788.0 $833.2
Individual income taxes on nonbusiness income 327.7 331.4 337.5 372.9 392.2
Other taxes 565.6 585.7 606.8 636.1 667.2
Total state and local taxes $1,609.7 $1,642.5 $1,689.8 $1,797.0 $1,892.6
Composition of state and local taxes 2015 2016 2017 2018 2019Total business taxes 44.5% 44.2% 44.1% 43.9% 44.0%
Individual income taxes on nonbusiness income 20.4% 20.2% 20.0% 20.7% 20.7%
Other taxes 35.1% 35.7% 35.9% 35.4% 35.3%
Total state and local taxes 100% 100% 100% 100% 100%
Note: Amounts may not sum because of rounding. FY18 tax estimates are revised from the COST FY18 study because of newly released data from the U.S. Census Bureau. Ernst & Young LLP also updated state property tax shares paid by business in FY18 and FY19.Source: Ernst & Young LLP estimates based on data from the U.S. Census Bureau Annual Survey of State and Local Government Finances.
Appendix Table A2: Composition of state and local business taxes, FY15–19 ($ billions)
Business tax 2015 2016 2017 2018 2019Property tax on business property $262.8 $273.1 $285.9 $301.2 $316.0
General sales and use tax on inputs 151.3 153.9 158.6 166.9 177.3
Corporate net income 67.0 63.6 61.8 65.9 77.1
Unemployment compensation 45.9 43.1 40.1 38.1 36.2
Business license tax 34.5 33.9 37.3 38.4 40.4
Excise taxes on business inputs 40.8 42.7 43.7 48.8 50.9
Public utility tax 28.0 27.6 27.2 25.9 26.2
Individual income tax on business income 40.2 44.9 46.4 51.5 53.8
Severance taxes 12.7 7.7 8.9 12.7 15.0
Insurance premium tax 20.0 21.3 21.9 23.4 24.5
Other business taxes 13.2 13.7 13.8 15.1 15.9
Total business taxes $716.3 $725.5 $745.6 $788.0 $833.2
Note: Amounts may not sum because of rounding. FY18 tax estimates are revised from the COST FY18 study because of newly released data from the U.S. Census Bureau. FY18 and FY19 property tax on business property reflects updated business-share estimates based on recent data.Source: Ernst & Young LLP estimates based on the most recent data from the U.S. Census Bureau Annual Survey of State and Local Government Finances.

22
Appendix Table A3: Composition of state and local business taxes by type, FY19
State Property tax Sales tax Excise taxCorporate income tax
Unemployment insurance tax
Individual income tax on pass-through
incomeLicense and other taxes*
Total business taxes
Alabama 28.3% 23.2% 21.7% 8.1% 2.6% 5.0% 11.1% 100.0%Alaska 39.7% — 6.1% 12.4% 4.2% — 37.5% 100.0%Arizona 40.1% 32.2% 10.1% 4.1% 3.9% 3.9% 5.8% 100.0%Arkansas 29.3% 34.3% 10.9% 10.2% 3.5% 4.9% 6.9% 100.0%California 31.8% 19.3% 11.6% 11.7% 5.0% 11.2% 9.4% 100.0%Colorado 44.0% 24.6% 9.1% 5.5% 3.9% 7.6% 5.2% 100.0%Connecticut 32.2% 18.9% 14.7% 9.6% 7.9% 13.8% 3.0% 100.0%Delaware 11.6% — 10.0% 9.7% 3.1% 6.0% 59.6% 100.0%Florida 40.9% 28.7% 15.8% 6.9% 1.1% — 6.5% 100.0%Georgia 41.0% 24.5% 11.7% 7.0% 3.4% 7.5% 5.0% 100.0%Hawaii 24.9% 34.3% 19.5% 4.4% 4.2% 7.1% 5.6% 100.0%Idaho 37.0% 21.2% 11.2% 9.8% 4.6% 8.4% 7.9% 100.0%Illinois 47.3% 15.4% 14.5% 8.4% 5.1% 4.4% 4.9% 100.0%Indiana 42.6% 21.6% 15.4% 6.3% 4.2% 7.3% 2.5% 100.0%Iowa 40.0% 22.7% 11.0% 6.9% 5.3% 7.5% 6.5% 100.0%Kansas 43.6% 27.3% 12.7% 7.2% 4.4% — 4.8% 100.0%Kentucky 32.5% 20.8% 19.1% 9.3% 4.7% 7.2% 6.4% 100.0%Louisiana 33.2% 31.5% 13.7% 4.7% 2.0% 5.0% 9.8% 100.0%Maine 58.9% 14.6% 7.2% 6.5% 3.0% 4.8% 5.0% 100.0%Maryland 27.9% 15.4% 20.3% 9.9% 3.8% 14.8% 7.9% 100.0%Massachusetts 38.1% 16.9% 6.8% 15.2% 8.7% 9.7% 4.6% 100.0%Michigan 38.4% 21.9% 11.7% 7.1% 7.5% 6.2% 7.1% 100.0%Minnesota 29.9% 20.8% 16.4% 11.9% 5.1% 8.5% 7.3% 100.0%Mississippi 42.5% 22.7% 13.3% 8.4% 1.8% 3.9% 7.5% 100.0%Missouri 38.7% 27.2% 9.0% 4.7% 3.9% 7.9% 8.6% 100.0%Montana 49.1% — 12.2% 7.9% 5.2% 8.0% 17.7% 100.0%Nebraska 49.0% 20.6% 6.6% 8.3% 1.5% 8.5% 5.5% 100.0%Nevada 18.2% 32.9% 19.5% 2.6% 7.8% — 19.0% 100.0%New Hampshire 50.6% — 12.4% 23.3% 1.6% 0.4% 11.8% 100.0%New Jersey 45.4% 14.8% 9.1% 12.7% 7.0% 6.5% 4.4% 100.0%New Mexico 15.8% 41.1% 7.9% 3.2% 2.2% 2.3% 27.5% 100.0%New York 43.6% 16.1% 9.5% 13.3% 2.9% 10.8% 3.8% 100.0%North Carolina 32.2% 28.8% 11.9% 5.0% 3.2% 8.1% 10.8% 100.0%North Dakota 19.1% 13.0% 5.7% 2.9% 2.7% 1.2% 55.5% 100.0%Ohio 34.6% 23.2% 12.1% 9.5% 4.9% 7.4% 8.4% 100.0%Oklahoma 22.4% 32.7% 8.8% 3.6% 3.0% 9.0% 20.6% 100.0%Oregon 38.2% — 11.2% 12.2% 11.2% 12.2% 14.9% 100.0%Pennsylvania 35.1% 16.0% 13.0% 10.2% 8.9% 8.0% 8.8% 100.0%Rhode Island 44.6% 15.7% 15.1% 6.8% 8.7% 4.8% 4.4% 100.0%South Carolina 47.5% 16.2% 10.9% 4.3% 3.6% 5.1% 12.4% 100.0%South Dakota 39.1% 38.6% 10.2% 2.0% 1.3% — 8.9% 100.0%Tennessee 27.9% 30.5% 13.6% 12.6% 2.0% 0.3% 13.2% 100.0%Texas 43.5% 27.3% 11.4% 5.1% 3.0% — 9.8% 100.0%Utah 34.5% 21.8% 20.2% 8.3% 2.7% 8.0% 4.4% 100.0%Vermont 55.6% 9.7% 14.9% 6.7% 5.6% 4.5% 3.1% 100.0%Virginia 47.8% 15.3% 13.1% 4.7% 2.2% 5.8% 11.0% 100.0%Washington 26.5% 26.4% 15.8% 19.3% 4.7% — 7.3% 100.0%West Virginia 34.0% 16.4% 17.2% 4.8% 5.2% 4.5% 18.0% 100.0%Wisconsin 39.0% 20.7% 10.1% 11.1% 5.0% 6.4% 7.7% 100.0%Wyoming 39.6% 21.1% 4.1% — 3.0% — 32.2% 100.0%District of Columbia 47.8% 13.6% 8.0% 13.2% 3.3% 9.2% 4.9% 100.0%United States 37.9% 21.3% 12.2% 9.3% 4.3% 6.5% 8.5% 100.0%
*“Corporate income tax” and “Individual income tax on pass-through income” include gross receipts taxes levied in Nevada, Ohio, Texas and Washington and the business enterprise tax in New Hampshire. “Excise tax” includes insurance premiums and public utilities. The “License and other taxes” category includes death and gift taxes, documentary and stock transfer taxes, severance taxes, and local gross receipts taxes. Certain Ohio localities impose a net profits tax, which is included in the “Corporate income tax” column. The small amount of corporate profits taxes at the local level in Michigan is included in “License and other taxes.”Note: Amounts may not sum because of rounding. “—” indicates 0; “0.0%” indicates less than 0.05%.Source: Ernst & Young LLP estimates based on data from the U.S. Census Bureau Annual Survey of State and Local Government Finances.

Total state and local business taxes | 23
Appendix Table A4: Composition of total state and local taxes by type, FY19
State Property tax Sales tax Excise taxCorporate income tax
Unemployment insurance tax
Individual income tax
License and other taxes*
Total business taxes
Alabama 16.8% 30.2% 17.1% 3.7% 1.2% 23.6% 7.4% 100.0%Alaska 43.6% 6.6% 10.5% 8.5% 2.9% — 28.0% 100.0%Arizona 27.9% 39.8% 7.8% 1.7% 1.6% 17.3% 4.0% 100.0%Arkansas 18.4% 37.2% 11.0% 4.1% 1.4% 23.3% 4.6% 100.0%California 24.1% 20.0% 8.6% 4.7% 2.0% 34.1% 6.4% 100.0%Colorado 30.1% 26.5% 9.1% 2.5% 1.8% 25.4% 4.7% 100.0%Connecticut 37.5% 15.2% 10.6% 3.0% 2.4% 28.0% 3.4% 100.0%Delaware 15.9% — 10.6% 5.0% 1.6% 29.8% 37.0% 100.0%Florida 36.2% 36.0% 14.5% 3.7% 0.6% — 9.0% 100.0%Georgia 30.2% 23.6% 10.0% 3.0% 1.4% 28.4% 3.4% 100.0%Hawaii 17.4% 36.8% 13.3% 1.7% 1.6% 23.2% 5.9% 100.0%Idaho 27.4% 27.0% 9.5% 4.0% 1.9% 23.5% 6.7% 100.0%Illinois 37.2% 18.4% 13.1% 3.7% 2.3% 20.0% 5.2% 100.0%Indiana 25.5% 27.8% 15.9% 2.6% 1.7% 23.1% 3.4% 100.0%Iowa 31.1% 21.6% 10.8% 3.1% 2.4% 24.1% 6.9% 100.0%Kansas 30.1% 28.0% 9.2% 3.0% 1.8% 23.7% 4.0% 100.0%Kentucky 20.1% 20.9% 16.1% 4.1% 2.1% 32.5% 4.3% 100.0%Louisiana 21.8% 37.8% 14.0% 2.3% 1.0% 17.7% 5.4% 100.0%Maine 39.2% 20.5% 9.2% 3.2% 1.5% 21.7% 4.7% 100.0%Maryland 25.2% 11.7% 14.5% 3.1% 1.2% 38.0% 6.4% 100.0%Massachusetts 34.7% 13.0% 6.0% 5.6% 3.2% 32.5% 5.0% 100.0%Michigan 32.8% 21.2% 11.1% 2.5% 2.7% 23.6% 6.2% 100.0%Minnesota 24.7% 16.8% 13.5% 4.5% 1.9% 32.3% 6.3% 100.0%Mississippi 27.6% 31.5% 13.7% 4.2% 0.9% 16.6% 5.6% 100.0%Missouri 27.7% 26.8% 8.4% 1.8% 1.5% 28.4% 5.4% 100.0%Montana 37.9% — 13.9% 3.8% 2.5% 28.9% 13.1% 100.0%Nebraska 36.6% 22.2% 6.5% 3.9% 0.7% 23.6% 6.5% 100.0%Nevada 20.9% 38.0% 22.9% 1.4% 4.1% — 12.7% 100.0%New Hampshire 64.3% — 13.3% 11.1% 0.7% 1.6% 8.9% 100.0%New Jersey 42.8% 14.9% 7.4% 5.6% 3.1% 21.8% 4.5% 100.0%New Mexico 16.9% 39.1% 8.6% 1.9% 1.3% 14.6% 17.7% 100.0%New York 30.5% 16.6% 7.3% 5.7% 1.2% 33.6% 5.1% 100.0%North Carolina 24.2% 25.9% 10.8% 1.9% 1.2% 29.5% 6.6% 100.0%North Dakota 19.9% 19.7% 7.9% 2.1% 2.0% 6.1% 42.4% 100.0%Ohio 28.8% 22.8% 10.6% 3.8% 2.0% 27.0% 5.1% 100.0%Oklahoma 18.5% 33.7% 10.1% 1.8% 1.5% 20.7% 13.8% 100.0%Oregon 29.6% — 9.5% 4.3% 4.0% 42.6% 10.0% 100.0%Pennsylvania 27.6% 16.7% 14.3% 4.5% 3.9% 24.8% 8.3% 100.0%Rhode Island 40.2% 16.7% 11.0% 2.6% 3.4% 20.5% 5.7% 100.0%South Carolina 32.9% 19.9% 10.5% 2.0% 1.6% 23.6% 9.4% 100.0%South Dakota 37.7% 38.8% 12.6% 1.2% 0.8% — 8.9% 100.0%Tennessee 25.8% 40.7% 14.4% 6.8% 1.1% 0.8% 10.4% 100.0%Texas 43.5% 30.9% 13.1% 3.0% 1.8% — 7.7% 100.0%Utah 23.0% 23.6% 13.9% 3.3% 1.1% 31.6% 3.6% 100.0%Vermont 41.5% 10.1% 17.0% 3.5% 3.0% 20.3% 4.6% 100.0%Virginia 32.2% 15.9% 10.1% 2.0% 0.9% 31.7% 7.3% 100.0%Washington 29.1% 35.3% 13.8% 9.5% 2.3% — 9.9% 100.0%West Virginia 22.2% 18.3% 18.0% 2.4% 2.6% 24.8% 11.8% 100.0%Wisconsin 32.4% 19.4% 9.1% 4.3% 1.9% 27.7% 5.1% 100.0%Wyoming 38.8% 25.6% 6.2% — 2.1% — 27.2% 100.0%District of Columbia 31.5% 18.1% 5.7% 7.3% 1.8% 26.0% 9.6% 100.0%United States 30.4% 22.4% 10.8% 4.1% 1.9% 23.6% 6.8% 100.0%
**Taxes in the ”License and other taxes” column include death and gift taxes, documentary and stock transfer taxes, severance taxes, and local gross receipts taxes.Note: Amounts may not sum because of rounding. “—” indicates 0; “0.0%” indicates less than 0.05%.Source: Ernst & Young LLP estimates based on data from the U.S. Census Bureau Annual Survey of State and Local Government Finances.

24
Endnotes1 States that follow a different fiscal year are Alabama (ends September 30), Michigan (ends September 30), New York
(ends March 31) and Texas (ends August 31). The data presented in this study is for each state’s fiscal year.
2 The Ernst & Young LLP sales tax model used to estimate business share was updated for all 50 states in FY17. Certain prior year estimates from FY14 to FY17 were restated to reflect updated business sales tax estimates. Prior year estimates for sales taxes paid by businesses were updated and are shown in the historical appendix tables. See Andrew Phillips and Muath Ibaid, The Impact of Imposing Sales Taxes on Business Inputs, prepared for the State Tax Research Institute and Council On State Taxation, Ernst & Young LLP, May 2019.
3 Andrew Phillips and Steve Wlodychak, The impact of federal tax reform on state corporate income taxes, prepared for the State Tax Research Institute, Ernst & Young LLP, March 2018.
4 The general methodology used to estimate state and local business taxes is described in detail in the Appendix of the EY/COST FY05 50-state business tax study published in March 2006 (available at cost.org). Note that business tax estimates for prior years have been revised from those published in earlier editions of this study because of the use of newly released U.S. Census Bureau data and refinements to the estimation of individual income taxes. All references to business taxes in prior fiscal years refer to the updated estimates included in this study, rather than the previously published estimates.
5 Andrew Phillips and Muath Ibaid, The Impact of Imposing Sales Taxes on Business Inputs, prepared for the State Tax Research Institute and Council On State Taxation, Ernst & Young LLP, May 2019.
6 Andrew Phillips and Steve Wlodychak, The impact of federal tax reform on state corporate income taxes, prepared for the State Tax Research Institute, Ernst & Young LLP, March 2018.
7 Robert Cline, Andrew Phillips, Joo Mi Kim and Tom Neubig, “The Economic Incidence of Additional State Business Taxes,” State Tax Notes, January 11, 2010.
8 Richard H. Mattoon and William A. Testa, “How Closely Do Business Taxes Conform to the Benefits Principle?” presentation at the Future State Business Tax Reforms: Perspectives from the Business, Government and Academic Communities conference, Federal Reserve Bank of Chicago (September 17, 2007). The authors distributed state and local government expenditures between businesses and households. Services benefiting businesses included shares of expenditures for transportation, water and sewer infrastructure, police and fire protection, general government “overhead” (e.g., legislative, administrative and judicial services), interest, and regulatory activities. The methodology used is described in detail in William H. Oakland and William A. Testa, “State-local business taxation and the benefits principle,” Economic Perspectives, January/February 1996. The authors also note that selective excise taxes, such as the severance tax, impact a small portion of businesses and could be removed from the business tax numerator to provide a measure of the tax-to-benefit ratio generally applicable to most firms. Ernst & Young LLP added in expenditure categories to the analysis not included in the 2007 data.
9 Enrico Moretti, “Workers’ Education, Spillovers, and Productivity: Evidence from Plant-Level Production Functions,” American Economic Review, June 2004.
10 An example of work related to the social benefits of education is Lance Lochner and Enrico Moretti, “The Effect of Education on Crime: Evidence from Prison Inmates, Arrests, and Self-Reports,” National Bureau of Economic Research Working Paper 8605, November 2001.
11 The tax-benefit ratios shown in this study were constructed in line with the general methodology used by Mattoon and Testa that allocates expenditures, net of user charges and federal transfers, to businesses and households. Like Mattoon and Testa, Ernst & Young LLP identified major categories of state and local spending. Using data from the U.S. Census Bureau’s 2017 Annual Survey of State and Local Government Finances, expenditures, charges, federal transfers and other category-specific nontax revenue were assigned to each category. These items were used to calculate the net expenditures for each category. The net expenditures were then allocated to businesses and households in an identical manner to the Mattoon and Testa allocation for all categories included in their analysis. For new categories, Ernst & Young LLP followed Mattoon and Testa’s general principles in allocating net expenditures.
12 Administration and insurance share is negative because nontax revenue from investments, interest and other sources exceeds total outlays.

The authorsAndrew Phillips is the Global Tax Government and Public Sector Leader and is a principal in the Quantitative Economics and Statistics (QUEST) practice of Ernst & Young LLP. He has an MA in Economics from Johns Hopkins University and a BA in Economics from Emory University.
Caroline Sallee is a senior manager in the QUEST practice of Ernst & Young LLP. She has an MPP from the University of Michigan and a BA in Economics from Augustana College.
Special thanks to Evan Wladis and Nahla Almbaid for their contributions to the analysis.
This study was prepared by the Quantitative Economics and Statistics (QUEST) practice of Ernst & Young LLP in conjunction with the Council On State Taxation (COST) and the State Tax Research Institute (STRI).
QUEST is a group of economists, statisticians, survey specialists and tax policy researchers within Ernst & Young LLP’s National Tax practice, located in Washington, DC. QUEST provides quantitative advisory services and products to private- and public-sector clients that can enhance business processes, support regulatory compliance, analyze proposed policy issues and provide litigation support.
COST is a nonprofit trade association based in Washington, DC. Formed in 1969 as an advisory committee to the Council of State Chambers of Commerce, today COST has an independent membership of about 550 major corporations engaged in interstate and international business. COST’s objective is to preserve and promote the equitable and nondiscriminatory state and local taxation of multijurisdictional business entities.
STRI is a nonprofit organization established in 2014 to provide educational programs and conduct research designed to enhance public dialogue relating to state and local tax policy. STRI is affiliated with COST.

EY | Assurance | Tax | Strategy and Transactions | Consulting
About EYEY is a global leader in assurance, tax, strategy, transaction and consulting services. The insights and quality services we deliver help build trust and confidence in the capital markets and in economies the world over. We develop outstanding leaders who team to deliver on our promises to all of our stakeholders. In so doing, we play a critical role in building a better working world for our people, for our clients and for our communities.
EY refers to the global organization, and may refer to one or more, of the member firms of Ernst & Young Global Limited, each of which is a separate legal entity. Ernst & Young Global Limited, a UK company limited by guarantee, does not provide services to clients. Information about how EY collects and uses personal data and a description of the rights individuals have under data protection legislation are available via ey.com/privacy. For more information about our organization, please visit ey.com.
Ernst & Young LLP is a client-serving member firm of Ernst & Young Global Limited operating in the US.
Quantitative Economics and Statistics (QUEST) QUEST is a group of economists, statisticians, professionals with extensive survey experience and tax policy analysts within Ernst & Young LLP’s National Tax practice, located in Washington, DC. QUEST provides quantitative advisory services to clients, including tax policy economic studies, statistical sampling and surveys.
© 2020 Ernst & Young LLP All Rights Reserved.
US SCORE no. 10847-201US BSC No. 2009-3583585
ED None
This material has been prepared for general informational purposes only and is not intended to be relied upon as accounting, tax or other professional advice. Please refer to your advisors for specific advice.
ey.com