2020 british columbia financial and economic review
TRANSCRIPT

2020 BRITISH COLUMBIAFINANCIAL AND
ECONOMIC REVIEW
80TH EDITION APRIL 2019 – MARCH 2020

This page intentionally left blank

2020British Columbia
Financial and EconomicReview
80th Edition(September 2020)

This page intentionally left blank

2020 Financial and Economic Review – September 2020
Table of Contents

This page intentionally left blank

Table of Contents
2020 Financial and Economic Review – September 2020 | i
Part 1 — Economic Review ........................................................................................................................... 1 2019 Overview ............................................................................................................................................. 3 British Columbia Economy .......................................................................................................................... 4 External Trade and Commodity Prices ................................................................................................... 5 Population .............................................................................................................................................. 7 Labour Market ....................................................................................................................................... 8 Inflation and Wages ................................................................................................................................. 8 Consumer Spending and Housing .......................................................................................................... 9 Tourism ................................................................................................................................................. 10 Global Economy ........................................................................................................................................... 11 United States .......................................................................................................................................... 11 Canada ................................................................................................................................................... 12 Asia ........................................................................................................................................................ 13 Europe .................................................................................................................................................... 13 Financial Markets ................................................................................................................................... 14
Charts 1.1 Provincial Economic Growth ..................................................................................................... 3 1.2 Composition of British Columbia GDP by Industry .................................................................. 4 1.3 British Columbia Real GDP Growth by Industry ....................................................................... 5 1.4 International Export Shares by Market ....................................................................................... 6 1.5 Lumber and Natural Gas Prices .................................................................................................. 7 1.6 Housing Starts ............................................................................................................................ 9 1.7 Home Sales and Price ................................................................................................................. 10 1.8 Visitor Entries to British Columbia ............................................................................................ 11 1.9 Global Economic Growth .......................................................................................................... 13 1.10 Canadian Dollar ......................................................................................................................... 14
Map 1.1 Net Interprovincial and International Migration in B.C., 2019 .................................................. 7
Tables 1.1 British Columbia Population and Labour Market Statistics ........................................................ 8 1.2 British Columbia Price and Earnings Indicators ......................................................................... 9
Topic Box Historical Data Volatility .................................................................................................................... 16
Part 2 — Financial Review ............................................................................................................................ 19 2019/20 Overview ........................................................................................................................................ 21 Revenue ........................................................................................................................................................ 23 Expense ........................................................................................................................................................ 33 Provincial Capital Spending .......................................................................................................................... 36 Provincial Debt ............................................................................................................................................. 44 Pension Plans ................................................................................................................................................ 48 Contractual Rights ........................................................................................................................................ 49 Contractual Obligations ............................................................................................................................... 50 Subsequent Events ........................................................................................................................................ 51 2019/20 Public Accounts Audit Qualification ................................................................................................ 52

Table of Contents
ii | 2020 Financial and Economic Review – September 2020
Charts 2.1 2019/20 Surplus (Deficit) – Major Changes from Budget 2019 .................................................. 22 2.2 Revenue Changes from Budget 2019 .......................................................................................... 23 2.3 Expense Changes from Budget 2019 ............................................................................................ 33 2.4 Components of Total Capital Spending – 2019/20 .................................................................... 36 2.5 Capital Spending Changes from Budget 2019 ............................................................................. 38 2.6 Financing Taxpayer-Supported Capital Spending ....................................................................... 40 2.7 Components of Total Provincial Debt – 2019/20 ........................................................................ 45 2.8 Changes in Ending Debt Level from Updated Budget 2019 ........................................................ 45 2.9 Reconciliation of Surplus/Deficit to Change In Debt ................................................................. 46
Tables 2.1 2019/20 Fiscal Summary ............................................................................................................ 21 2.2.1 Personal Income Tax Revenue Changes from Budget 2019 ......................................................... 23 2.2.2 Corporate Income Tax Revenue Changes from Budget 2019 ....................................................... 24 2.2.3 Consumption and Other Tax Revenue Changes from Budget 2019 ............................................ 24 2.2.4 Property Tax Revenue Changes from Budget 2019 ...................................................................... 25 2.2.5 Energy and Mineral Revenue Changes from Budget 2019 .......................................................... 26 2.2.6 Forest Revenue Changes from Budget 2019 ................................................................................ 27 2.2.7 Other Revenue Changes from Budget 2019 ................................................................................ 27 2.2.8 Federal Government Transfer Changes from Budget 2019 ........................................................... 28 2.3 Revenue by Source ..................................................................................................................... 30 2.4 Expense by Ministry, Program and Agency ................................................................................. 31 2.5 2019/20 Financial Forecast Changes ........................................................................................... 32 2.6 Capital Spending ........................................................................................................................ 37 2.7 Capital Expenditure Projects Greater Than $50 Million ............................................................. 41 2.8 Provincial Debt Summary .......................................................................................................... 44 2.9 Key Debt Indicators ................................................................................................................... 47 2.10 Interprovincial Comparison of Credit Ratings, June 2020 .......................................................... 48 2.11 Pension Plan Balances ................................................................................................................ 49 2.12 Taxpayer-Supported Contractual Obligations ............................................................................. 50
Part 3 — Supplementary Information ........................................................................................................ 53 General Description of the Province ............................................................................................................. 55 Constitutional Framework ............................................................................................................................ 56 Provincial Government ................................................................................................................................. 57 Annual Financial Cycle ................................................................................................................................. 59 Government’s Financial Statements ............................................................................................................... 61
Charts 3.1 Financial Planning and Reporting Cycle Overview ..................................................................... 60
Tables 3.1 Provincial Taxes (as of July 2020) ............................................................................................... 63 3.2 Interprovincial Comparisons of Tax Rates – 2020 ...................................................................... 69

Table of Contents
2020 Financial and Economic Review – September 2020 | iii
Appendix 1 — Economic Review Supplementary Tables ........................................................................ 71
Tables A1.1A Aggregate and Labour Market Indicators ................................................................................... 72 A1.1B Prices, Earnings and Financial Indicators ................................................................................... 74 A1.1C Other Indicators ........................................................................................................................ 76 A1.1D Commodity Production Indicators ............................................................................................ 78 A1.2 British Columbia Real GDP at Market Prices, Expenditure Based ............................................. 80 A1.3 British Columbia GDP at Basic Prices, by Industry ................................................................... 82 A1.4 British Columbia GDP, Income Based ...................................................................................... 84 A1.5 Employment by Industry in British Columbia .......................................................................... 86 A1.6 Capital Investment by Industry ................................................................................................. 87 A1.7 British Columbia International Goods Exports by Major Market and Selected Commodities, 2019 ..................................................................................................... 88 A1.8 British Columbia International Goods Exports by Market Area ................................................ 89 A1.9 Historical Commodity Prices (in US Dollars) ........................................................................... 90 A1.10 British Columbia Forest Sector Economic Activity Indicators ................................................... 91 A1.11 Historical Value of Mineral, Petroleum and Natural Gas Shipments .......................................... 92 A1.12 Petroleum and Natural Gas Activity Indicators .......................................................................... 92 A1.13 Supply and Consumption of Electrical Energy in British Columbia .......................................... 93 A1.14 Components of British Columbia Population Change .............................................................. 94
Appendix 2 — Financial Review Supplementary Tables ......................................................................... 95
Tables A2.1 Operating Statement – 2008/09 to 2019/20 ............................................................................. 97 A2.2 Statement of Financial Position – 2008/09 to 2019/20 ............................................................. 98 A2.3 Changes in Financial Position – 2008/09 to 2019/20 ................................................................ 99 A2.4 Revenue by Source – 2008/09 to 2019/20 ................................................................................ 100 A2.5 Revenue by Source Supplementary Information – 2008/09 to 2019/20 .................................... 101 A2.6 Expense by Function – 2008/09 to 2019/20 ............................................................................. 102 A2.7 Expense by Function Supplementary Information – 2008/09 to 2019/20 ................................. 103 A2.8 Full-Time Equivalents (FTEs) – 2008/09 to 2019/20 ............................................................... 104 A2.9 Capital Spending – 2008/09 to 2019/20 ................................................................................... 105 A2.10 Provincial Debt – 2008/09 to 2019/20 ..................................................................................... 106 A2.11 Provincial Debt Supplementary Information – 2008/09 to 2019/20 ......................................... 107 A2.12 Key Provincial Debt Indicators – 2008/09 to 2019/20 .............................................................. 108 A2.13 Historical Operating Statement Surplus (Deficit) ...................................................................... 109 A2.14 Historical Provincial Debt Summary ......................................................................................... 110

This page intentionally left blank

2020 Financial and Economic Review – September 2020
Part 1Economic Review 1
1 Reflects information available as of June 26, 2020.

This page intentionally left blank

2020 Financial and Economic Review – September 2020 | 3
Part 1 – Economic Review
2019 Overview
British Columbia’s economy experienced strong growth in 2019, with its annual performance outpacing the Canadian average for a sixth consecutive year.
Similar to previous years, Statistics Canada published only real dollar GDP by industry at basic prices in the preliminary release of its Provincial Economic Accounts in June 2020. As a result, the following analysis refers to these real GDP figures, as opposed to the commonly reported income and expenditure market prices data released late in the year.2
In 2019, B.C.’s real GDP growth of 2.8 per cent ranked third among provinces (behind Prince Edward Island and Newfoundland and Labrador), following similar growth of 2.7 per cent in 2018.
Employment in B.C. increased by a solid 2.6 per cent in 2019. Labour market conditions remained tight, and growth in wages and salaries remained strong at 5.6 per cent. Consumer prices rose by 2.3 per cent in 2019. Domestic economic activity was supported by business activity, highlighted by robust output growth in non-residential construction subsectors, partly related to activity in the oil and gas industry. Although the forestry sector faced significant challenges in 2019, liquefied natural gas (LNG) development provided some support for economic growth and job creation in the province. Residential construction activity was also strong, with housing starts at an all-time high. In contrast, home sales and prices moderated, and consumer spending slowed somewhat, reflected by modest growth of 0.6 per cent in retail sales in 2019. Meanwhile, slower global economic growth, global trade policy uncertainty and lower commodity prices weighed on B.C.’s international merchandise exports.
2.7
1.91.6 1.5
2.42.7
0.7
1.5
2.8
-3.3
2.22.8
-0.6 -0.8
1.0
1.9
2.7
1.0
2.1
4.54.0
1.7
-4.0
-2.0
0.0
2.0
4.0
6.0
BC AB SK MB ON QC NB NS PE NL CA
2018 2019
Sources: Statistics Canada (Tables 36-10-0402-01 and 36-10-0434-03 – June 2020 Preliminary Industry Accounts)
Per cent change, real GDP at basic prices
Chart 1.1 Provincial Economic Growth
2 Provincial and national real GDP by industry estimates are based on Statistics Canada’s preliminary industry accounts, released in June 2020. Further information on British Columbia’s economic performance is expected to be available in November 2020, when Statistics Canada releases revised GDP by industry data for 2019 and previous years, together with the full income and expenditure accounts for 2019.

Part 1 – Economic Review
4 | 2020 Financial and Economic Review – September 2020
British Columbia Economy
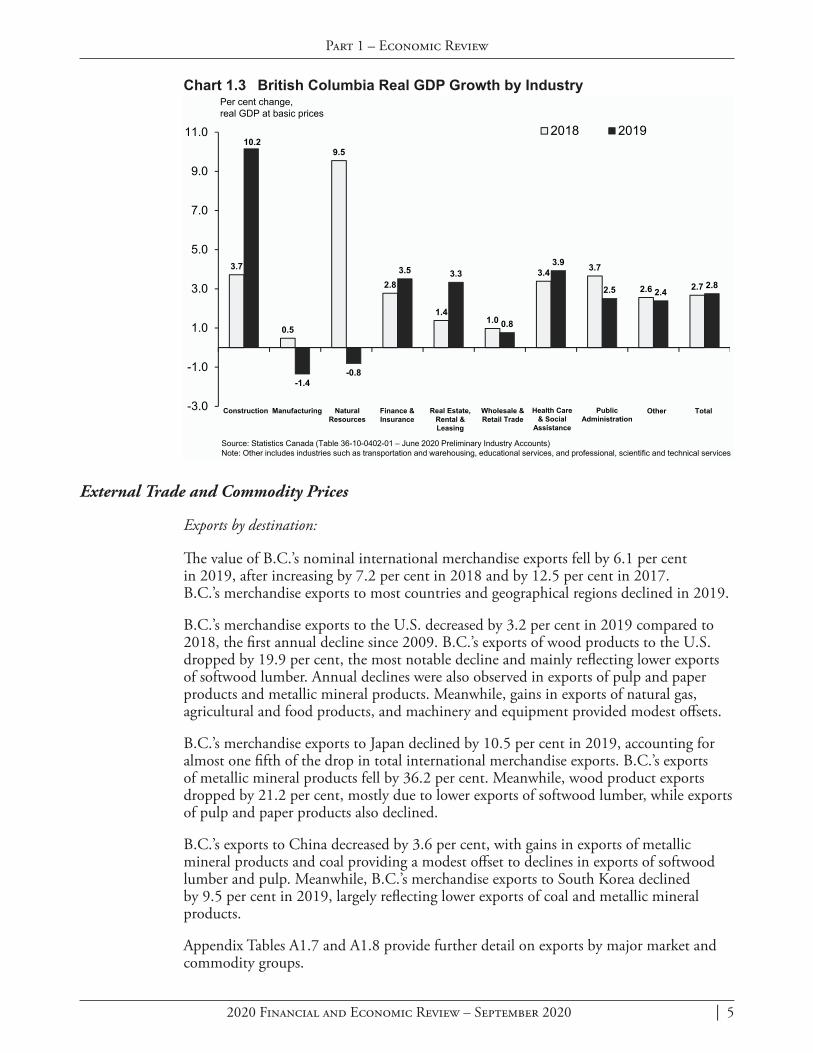
In 2019, service-producing industries represented 76 per cent of B.C.’s GDP and goods-producing industries accounted for 24 per cent. The real estate and rental and leasing service sector formed the largest share of the service-producing industries, followed by the retail trade and wholesale trade service sectors combined. At the same time, the construction sector made up the largest share of the goods-producing industries, followed by the manufacturing sector, and the natural resources sector.
B.C.’s real GDP increased by 2.8 per cent in 2019, similar to the 2.7 per cent growth in 2018. Growth in goods-producing industries slowed somewhat further in 2019, while growth in service-producing industries improved.
B.C.’s goods-producing industries grew by 3.0 per cent in 2019, following 3.4 per cent growth in 2018. Output in the construction sector increased by a robust 10.2 per cent in 2019, outpacing the 3.7 per cent growth in 2018. This was driven by large gains in the engineering construction subsector, mainly related to activity in the oil and gas industry. Construction in the non-residential buildings subsector contributed positively. In contrast, output in the mining, quarrying, and oil and gas extraction sector rose by a modest 0.7 per cent, while output in the manufacturing sector declined and activity in some natural resource subsectors such as forestry and logging recorded significant losses.
Meanwhile, service-producing industries grew by 2.7 per cent in 2019, stronger than the 2.4 per cent growth in 2018. Output in the real estate and rental and leasing sector increased by 3.3 per cent in 2019, following moderate growth of 1.4 per cent in 2018. Output in the professional, scientific and technical services sector (+4.6 per cent) and in the health care and social assistance sector (+3.9 per cent) also contributed strongly.
Chart 1.2 Composition of British Columbia GDP by Industry
Other 14.5%
Finance & Insurance 5.8%
Real Estate, Rental & Leasing17.6%
Transportation & Warehousing
6.4%
Construction8.9%
Natural Resources 5.7%
Manufacturing6.8%
Wholesale & Retail Trade9.5%
Public Administration5.7%
Health Care & Social Assistance
7.4%
Educational Services5.2%
Professional, Scientific & Technical Services
6.5%
Source: Statistics Canada (Table 36-10-0400-01 – June 2020 Preliminary Industry Accounts)(numbers may not add to 100 per cent due to rounding)
Shares of B.C. GDP at basic prices by major industry, 2019
2020 Financial and Economic Review – September 2020 | 5
Part 1 – Economic Review
External Trade and Commodity Prices
Exports by destination:
The value of B.C.’s nominal international merchandise exports fell by 6.1 per cent in 2019, after increasing by 7.2 per cent in 2018 and by 12.5 per cent in 2017. B.C.’s merchandise exports to most countries and geographical regions declined in 2019.
B.C.’s merchandise exports to the U.S. decreased by 3.2 per cent in 2019 compared to 2018, the first annual decline since 2009. B.C.’s exports of wood products to the U.S. dropped by 19.9 per cent, the most notable decline and mainly reflecting lower exports of softwood lumber. Annual declines were also observed in exports of pulp and paper products and metallic mineral products. Meanwhile, gains in exports of natural gas, agricultural and food products, and machinery and equipment provided modest offsets.
B.C.’s merchandise exports to Japan declined by 10.5 per cent in 2019, accounting for almost one fifth of the drop in total international merchandise exports. B.C.’s exports of metallic mineral products fell by 36.2 per cent. Meanwhile, wood product exports dropped by 21.2 per cent, mostly due to lower exports of softwood lumber, while exports of pulp and paper products also declined.
B.C.’s exports to China decreased by 3.6 per cent, with gains in exports of metallic mineral products and coal providing a modest offset to declines in exports of softwood lumber and pulp. Meanwhile, B.C.’s merchandise exports to South Korea declined by 9.5 per cent in 2019, largely reflecting lower exports of coal and metallic mineral products.
Appendix Tables A1.7 and A1.8 provide further detail on exports by major market and commodity groups.
Chart 1.3 British Columbia Real GDP Growth by Industry
3.7
0.5
9.5
2.8
1.41.0
3.4 3.7
2.6 2.7
10.2
-1.4-0.8
3.5 3.3
0.8
3.9
2.5 2.42.8
-3.0
-1.0
1.0
3.0
5.0
7.0
9.0
11.0 2018 2019
Source: Statistics Canada (Table 36-10-0402-01 – June 2020 Preliminary Industry Accounts)Note: Other includes industries such as transportation and warehousing, educational services, and professional, scientific and technical services
Per cent change,real GDP at basic prices
Finance & Insurance
Construction Manufacturing Wholesale & Retail Trade
Other TotalPublic Administration
Real Estate, Rental & Leasing
Health Care & Social
Assistance
Natural Resources

Part 1 – Economic Review
6 | 2020 Financial and Economic Review – September 2020
The share of B.C.’s international merchandise exports destined to the U.S. averaged 50.6 per cent in 2019, up from 49.0 per cent in 2018. Exports to China accounted for 14.9 per cent, up from 14.5 per cent. Exports to Japan represented 10.5 per cent, down from 11.0 per cent. Meanwhile, exports to South Korea represented 6.1 per cent, down slightly from 6.3 per cent.
Exports by commodity and prices:
In 2019, the value of B.C.’s nominal wood product exports declined significantly by 20.0 per cent, accounting for just over two-thirds of the decline in total international merchandise exports. Pulp and paper product exports also fell by 20.0 per cent, and metallic mineral product exports fell by 9.9 per cent, while coal exports declined by 9.2 per cent. Meanwhile, provincial exports of natural gas, machinery and equipment, and agricultural food products all increased.
After reaching record high levels in 2018, forestry product prices fell in 2019, particularly prices of lumber (-25.1 per cent) and pulp (-19.4 per cent). Meanwhile, most industrial metal prices declined, with copper down by 8.0 per cent and zinc down by a larger 12.9 per cent. In contrast, precious metal prices increased, with gold up by 9.6 per cent.
After rising sharply in 2017 and 2018, global crude oil price benchmarks retreated in 2019, with the West Texas Intermediate (WTI) price averaging $56.99 US/barrel for the year, a decline of 12.6 per cent from 2018. Metallurgical coal prices also declined significantly, while natural gas prices remained depressed.
Manufacturing shipments:
The nominal value of B.C.’s manufacturing shipments declined by 2.4 per cent in 2019, the first annual decline since 2009. Lower shipments of wood products (-24.9 per cent) and, to a lesser extent, paper products (-15.1 per cent) were largely responsible. These declines offset gains in shipments of food products (+6.3 per cent), fabricated metal products (+18.4 per cent) and electrical equipment and appliances (+9.0 per cent).
Chart 1.4 International Export Shares by Market
Source: BC Stats – accessed June 2020Note: Other Asia includes Hong Kong, Taiwan, South Korea and India(numbers may not add to 100 per cent due to rounding)
U.S.50.6%
China14.9%
Japan10.5%
Other Asia12.1%
Other12.0%
U.S.49.0%
China14.5%
Japan11.0%
Other Asia12.4%
Other13.1%
B.C. origin merchandise exports 2018 = $46.3 billion
B.C. origin merchandise exports 2019 = $43.5 billion

2020 Financial and Economic Review – September 2020 | 7
Part 1 – Economic Review
Population
B.C.’s population on July 1, 2019 was 5.071 million people, an increase of 1.4 per cent from the same date in 2018. In 2019, B.C. welcomed a net total of 64,441 persons through international migration, a record high number of newcomers. Meanwhile, interprovincial migration contributed a net total of 9,551 persons, slightly more than in 2018. A natural increase of 5,032 persons (births minus deaths) also added to the province’s population count in 2019.
Chart 1.5 Lumber and Natural Gas Prices
0
100
200
300
400
500
600
700
0
3
6
9
12
15
Natural gasPlant Inlet ($C/GJ)
Sources: Ministry of Forests, Lands, Natural Resource Operations & Rural Development; Ministry of Energy, Mines & Petroleum Resources.
Spruce-pine-fir (SPF) lumber($US/000 bd feet)
SPF
Natural gas
annual averages
2016 2017
$0.79
$496
2018
$1.37
$281
2019
$308
$411
$1.14$0.99
$3.12
$0.79
$353 $372
2014 2015
Map 1.1 Net Interprovincial and International Migration in B.C., 2019
International
,
Territories
Atlantic
2,
Net Population Movement For British ColumbiaJan 201 to Dec 201
Net Inflow : Persons
Table 1Provincial Migration Flow
Jan 201 to Dec 201
Source: BC Stats

Part 1 – Economic Review
8 | 2020 Financial and Economic Review – September 2020
Labour Market
Total employment grew by a solid 2.6 per cent in 2019, following moderate growth of 1.1 per cent in 2018. The labour force also grew by 2.6 per cent in 2019, partly reflecting an increase in the participation rate to 65.5 per cent, up from 64.9 per cent in 2018. Meanwhile, the unemployment rate remained at 4.7 per cent in 2019, the lowest provincial jobless rate in the country.
Total employment increased by 65,400 net new jobs in 2019. The distribution of these job gains was spread across the private sector (+45,700), the public sector (+10,000) and the self-employed (+9,700). The breakdown also showed increases in full-time employment (around +39,300) and part-time employment (around +26,200).
Service-producing industries in B.C. accounted for almost all of the net gain in total employment in 2019. The largest gains were in the wholesale and retail trade sector (+20,800) and the professional, scientific and technical services sector (+15,200). While employment rose across most other service sectors, goods-producing industries recorded a net loss of 14,400. The most notable employment losses were observed in the manufacturing sector (-8,600), mining, quarrying and oil and gas extraction sector (-2,100), and the forestry, logging and support activities subsectors (-1,700).
Appendix Table A1.5 provides more details on employment by sector and subsectors.
Inflation and Wages
B.C.’s annual Consumer Price Index (CPI) inflation rate was 2.3 per cent in 2019, following 2.7 per cent in 2018. Price increases were broad-based across all major categories of the CPI in 2019, led by food (+3.9 per cent), transportation (+2.6 per cent) and shelter (+2.4 per cent).
The disinflation (i.e. the decrease in the rate of inflation) observed last year was mainly due to volatile energy prices, most notably gasoline prices, which fell by 1.3 per cent in 2019. The annual CPI inflation rate excluding energy was 2.5 per cent in 2019, the same rate recorded in 2018.
Meanwhile, wages and salaries grew by 5.6 per cent in 2019, following growth of 6.0 per cent in 2018, still well above the long-term historical average of 4.7 per cent.
Table 1.1 British Columbia Population and Labour Market StatisticsUnits 2015 2016 2017 2018 2019
Population (as of July 1) …… (thousands) 4,776 4,859 4,924 5,001 5,071 (% change) 1.5 1.7 1.3 1.6 1.4
Net MigrationInternational ……… (persons) 14,059 36,365 50,901 57,506 64,441 Interprovincial ……… (persons) 22,827 23,586 15,293 9,471 9,551
Labour Force …………………(thousands) 2,458 2,532 2,601 2,617 2,685 (% change) 1.3 3.0 2.7 0.6 2.6
Employment ………………… (thousands) 2,306 2,380 2,467 2,494 2,559 (% change) 1.2 3.2 3.7 1.1 2.6
Unemployment Rate ……… (%) 6.2 6.0 5.1 4.7 4.7
Sources: Statistics Canada (Tables 17-10-0005-01, 17-10-0040-01, 17-10-0020-01, 14-10-0023-01 – accessed June 2020)

2020 Financial and Economic Review – September 2020 | 9
Part 1 – Economic Review
Chart 1.6 Housing Starts
20,000
30,000
40,000
50,000
60,000
70,000
Sources: Canada Mortgage and Housing Corporation; Haver Analytics
B.C. housing starts (annualized units, sa)
2017 2018 201920162015
Dec 2019: 42,908
2014
Consumer Spending and Housing
B.C.’s nominal retail sales increased by a modest 0.6 per cent in 2019, following growth of 2.0 per cent in 2018. In 2019, increases were led by sales at general merchandise stores (+4.8 per cent), health and personal care stores (+5.2 per cent), and food and beverage stores (+1.3 per cent). Meanwhile, declines were mostly observed at motor vehicle and parts dealers (-2.7 per cent), building material and garden equipment and supplies dealers (-4.3 per cent), and sporting goods, hobby, book and music stores (-0.9 per cent).
Housing starts in B.C. totalled 44,932 units in 2019 (the highest annual level going back to 1955), up by 10.0 per cent from 40,857 units in 2018. Meanwhile, the value of residential building permits (a leading indicator of potential new housing activity) fell by 5.2 per cent in 2019, after increases of 18.5 per cent in 2018 and 16.6 per cent in 2017.
Table 1.2 British Columbia Price and Earnings IndicatorsUnits 2015 2016 2017 2018 2019
Consumer Price Index ……………………(2002=100) 120.2 122.4 125.0 128.4 131.4 (% change) 1.1 1.8 2.1 2.7 2.3
Average Weekly Wage Rate …………… ($) 914.0 920.9 936.4 974.8 999.3 (% change) 3.6 0.8 1.7 4.1 2.5
Compensation of Employees 1, 2…………($ millions) 123,805 127,866 135,921 143,959 151,883 (% change) 4.5 3.3 6.3 5.9 5.5
Primary Household Income 1…………… ($ millions) 181,683 187,000 199,008 207,418 n/a(% change) 5.1 2.9 6.4 4.2 n/a
Net Operating Surplus (Corporations) 1.…($ millions) 23,835 28,372 33,474 33,341 n/a(% change) (11.5) 19.0 18.0 (0.4) n/a
1 As of November 2019 Provincial Economic Accounts2 Component of income-based GDP, including wages, salaries and employers' social contributions earned in B.C. by residents and non-residents of the province. 2019 value for compensation of employees is from Statistics Canada Table 36-10-0205-01. Sources: Statistics Canada (Tables 18-10-0005-01, 14-10-0064-01, 36-10-0221-01, 36-10-0205-01, 36-10-0224-01 – accessed June 2020)
Part 1 – Economic Review
10 | 2020 Financial and Economic Review – September 2020
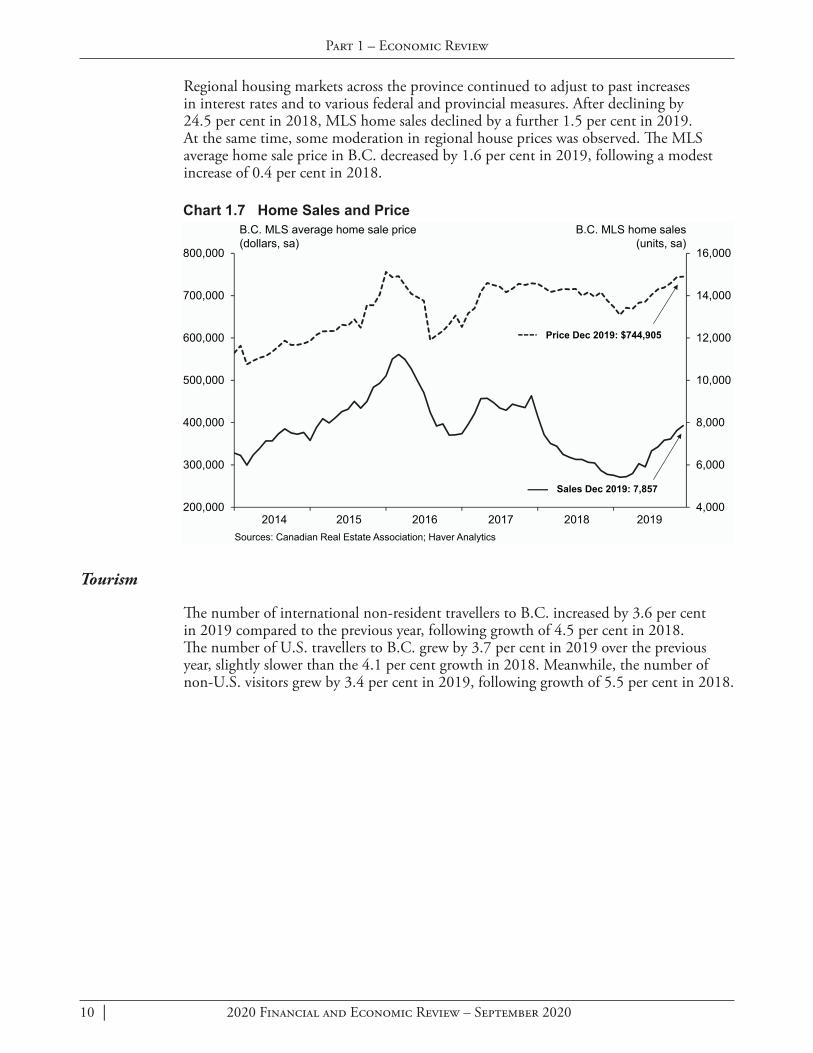
Regional housing markets across the province continued to adjust to past increases in interest rates and to various federal and provincial measures. After declining by 24.5 per cent in 2018, MLS home sales declined by a further 1.5 per cent in 2019. At the same time, some moderation in regional house prices was observed. The MLS average home sale price in B.C. decreased by 1.6 per cent in 2019, following a modest increase of 0.4 per cent in 2018.
Tourism
The number of international non-resident travellers to B.C. increased by 3.6 per cent in 2019 compared to the previous year, following growth of 4.5 per cent in 2018. The number of U.S. travellers to B.C. grew by 3.7 per cent in 2019 over the previous year, slightly slower than the 4.1 per cent growth in 2018. Meanwhile, the number of non-U.S. visitors grew by 3.4 per cent in 2019, following growth of 5.5 per cent in 2018.
Chart 1.7 Home Sales and Price
4,000
6,000
8,000
10,000
12,000
14,000
16,000
200,000
300,000
400,000
500,000
600,000
700,000
800,000
Sources: Canadian Real Estate Association; Haver Analytics
B.C. MLS average home sale price (dollars, sa)
B.C. MLS home sales (units, sa)
Sales Dec 2019: 7,857
Price Dec 2019: $744,905
2014 2015 2016 2017 2018 2019

2020 Financial and Economic Review – September 2020 | 11
Part 1 – Economic Review
Global Economy
Overall, the International Monetary Fund estimates that global real GDP grew by 2.9 per cent in 2019, down from 3.6 per cent growth in 2018. This slowdown was observed across advanced economies and emerging markets. With the exception of the Japanese economy, B.C.’s major trading partners generally saw their pace of growth slow in 2019 compared to the previous year. The U.S. economy expanded by 2.3 per cent in 2019, down from 2.9 per cent growth in 2018. Canadian economic output increased by a more moderate 1.7 per cent in 2019, down from 2.0 per cent in 2018. Overseas, while Japan’s economy grew by 0.7 per cent in 2019, up from 0.3 per cent in 2018, China’s growth slowed noticeably compared to the past few years, achieving 6.1 per cent growth in 2019 after growing by 6.8 per cent in 2018. The euro area grew by 1.2 per cent in 2019, down from 1.9 per cent growth in 2018.
United States
U.S. real GDP grew by 2.3 per cent in 2019, down from 2.9 per cent growth in 2018. Personal consumption, government spending and government investment made notable positive contributions to economic growth partly reflecting fiscal stimulus, while business fixed investment and exports were less supportive due to slower growth abroad and uncertainty regarding global trade policies.
The U.S. labour market tightened somewhat further in 2019, with the unemployment rate averaging 3.7 per cent, the lowest rate on record since 1969. The economy added over 169,000 jobs each month on average (down from approximately 192,000 jobs
Chart 1.8 Visitor Entries to British Columbia
120
160
200
240
300
400
500
600
Source: Statistics Canada (Table 24-10-0005-01 – accessed June 2020)2014 2015 2016
U.S. Travellers to B.C. (sa, 000s)
Non-U.S. Travellers to B.C. (sa, 000s)
U.S. travellers
Non-U.S. travellers
2017 2018 2019

Part 1 – Economic Review
12 | 2020 Financial and Economic Review – September 2020
added in 2018), resulting in a 1.4 per cent increase in employment in 2019. The labour force participation rate rose in 2019 with 63.1 per cent of Americans eligible to work participating in the labour market, up slightly from 62.9 per cent in 2018.
New housing construction activity increased last year overall. The level of housing starts averaged 1.29 million units in 2019, up 3.2 per cent compared to 2018. Sales of new single-family homes in the U.S. increased by 10.7 per cent in 2019, while the median sale price decreased by 1.5 per cent. Sales of existing single-family homes increased by 0.5 per cent in 2019 and the median sale price of existing homes sold rose by 5.0 per cent.
The U.S. current account deficit (the combined balances of trade in goods and services income, and net unilateral current transfers) increased from $US449.7 billion in 2018 to $US480.2 billion in 2019. As a share of nominal U.S. GDP, the current account deficit averaged -2.2 per cent in 2019, largely unchanged from 2018.
Canada
The Canadian economy grew by 1.7 per cent in 2019, slower than the 2.0 per cent growth in 2018. Growth in household consumption and government spending moderated in 2019 compared to 2018, while business investment declined. Construction of residential structures edged lower for the second consecutive year, and investment in intellectual property products declined by a larger margin. Reflecting the economic slowdown abroad, growth in exports and imports slowed markedly, with net exports contributing marginally to annual economic growth.
Canadian labour market conditions improved somewhat further in 2019. Employment increased by a total of 398,200 jobs (or 2.1 per cent growth), stronger than the 241,100 jobs (or 1.3 per cent growth) in 2018. The unemployment rate averaged 5.7 per cent in 2019, down slightly from 5.8 per cent in 2018.
The number of Canadian housing starts declined by 2.0 per cent in 2019 to around 208,685 units, following a 3.1 per cent drop in 2018. The value of residential building permits decreased by 1.2 per cent, following a large increase of 5.3 per cent in 2018. MLS home sales (units) rebounded by 6.5 per cent in 2019, after dropping by 15.0 per cent over the previous two year period. The MLS average home sale price rose by 2.4 per cent to $500,779 in 2019.
Canadian retail sales increased by 1.6 per cent in 2019, down from 2.9 per cent in 2018. Adjusted for price movements, retail sales volumes rose by a modest 0.4 per cent in 2019, the weakest display in several years. The Canadian consumer price index rose by 1.9 per cent in 2019. The consumer price index excluding often volatile food and energy prices increased by a slightly higher 2.1 per cent.
Canada’s current account deficit narrowed to $47.0 billion in 2019 from $55.5 billion in 2018. As a share of nominal Canadian GDP, the current account deficit averaged -2.0 per cent in 2019 compared to -2.5 per cent in 2018.
The value of Canada’s exports of goods and services increased by 2.2 per cent in 2019, while imports of goods and services increased by a more moderate 1.5 per cent. The stronger increase in exports was partly driven by a 6.9 per cent gain in exports of crude oil. There were also broad-based increases in exports of services, which increased by 4.4 per cent in 2019.

2020 Financial and Economic Review – September 2020 | 13
Part 1 – Economic Review
Asia
China’s real GDP expanded by 6.1 per cent in 2019, following 6.8 per cent growth in 2018, broadly continuing the trend of steadily lower annual growth rates. While net exports rebounded and contributed positively to economic growth in 2019, this was outweighed by markedly slower growth in consumption and investment.
Japan’s real GDP increased by 0.7 per cent in 2019, better than the 0.3 per cent growth posted in 2018. Stronger growth in domestic demand led by government spending and public sector investment helped to bolster overall economic growth in 2019, despite a small decline in net exports.
Europe
The euro area’s real GDP grew by 1.2 per cent in 2019, notably slower than the 1.9 per cent growth in 2018 and 2.5 per cent growth in 2017. With the exception of two smaller euro area economies, 17 of the 19 euro member countries saw their economies expand more slowly in 2019 compared to 2018. After growing by 1.5 per cent in 2018, Germany’s large economy grew by 0.6 per cent in 2019, well below the euro area average of 1.2 per cent. France’s economy grew by 1.5 per cent in 2019, down from 1.8 per cent growth in 2018. Italy’s economy grew by 0.3 per cent in 2019, after 0.8 per cent growth in 2018. Meanwhile, Spain’s economy expanded by 2.0 per cent, still slower than the 2.4 per cent growth it achieved in 2018.
Outside the euro area, the U.K. economy expanded by 1.4 per cent in 2019, slightly better than the 1.3 per cent growth posted in 2018 but still below growth rates over the previous few years. Economic uncertainty related to Britain’s departure from the European Union likely contributed to the underperformance of the U.K. economy over the past two years.
Chart 1.9 Global Economic Growth
0.4
1.2
0.5
2.2
0.30.7
1.4
2.1 1.92.5
1.9
1.2
2.5 2.9
1.62.4
2.9
2.3
3.6 3.5 3.43.9
3.6
2.9
7.47.0
6.8 6.9 6.8
6.1
-2.0
0.0
2.0
4.0
6.0
8.0
10.0
2014 2015 2016 2017 2018 2019
Japan Euro Area U.S. World China
Per cent change in real GDP
Sources: International Monetary Fund (April 2020); Haver Analytics

Part 1 – Economic Review
14 | 2020 Financial and Economic Review – September 2020
Financial Markets
Some major central banks implemented more accommodative monetary policies in 2019 to cushion their economies against a global economic growth slowdown amplified by U.S.-China trade tensions. The US Federal Reserve (Fed) lowered its federal funds target rate three times in 2019, from the 2.25 to 2.50 per cent range to the 1.50 to 1.75 per cent range. The Fed also restarted quantitative easing policies to support its policy stance on interest rates and the stronger demand for liquidity in money markets.
In contrast, the Bank of Canada maintained its target for the overnight interest rate at 1.75 per cent throughout 2019. Nevertheless, short and longer-term Government of Canada bond yields declined largely in tandem with US Treasury benchmark bond yields.
After averaging 77.2 US cents in 2018, the value of the Canadian dollar depreciated to 75.4 US cents in 2019, despite some narrowing of Canadian-U.S. interest rate differentials throughout most of last year. The lower value of the Canadian dollar primarily reflected the broad-based appreciation of the US dollar alongside slowing global economic growth and trade policy concerns.
Chart 1.10 Canadian Dollar
60
70
80
90
100
2016 2017
US cents/$Canadian
Source: Bank of Canada – accessed June 2020 Note: Reflects the Bank of Canada’s new calculation methodology starting January 1, 2017.
2018
77.0 cents (December 31, 2019)
94.0 cents (January 2, 2014)
201920152014

This page intentionally left blank

Part 1 - Economic Review
16 | 2020 Financial and Economic Review – September 2020
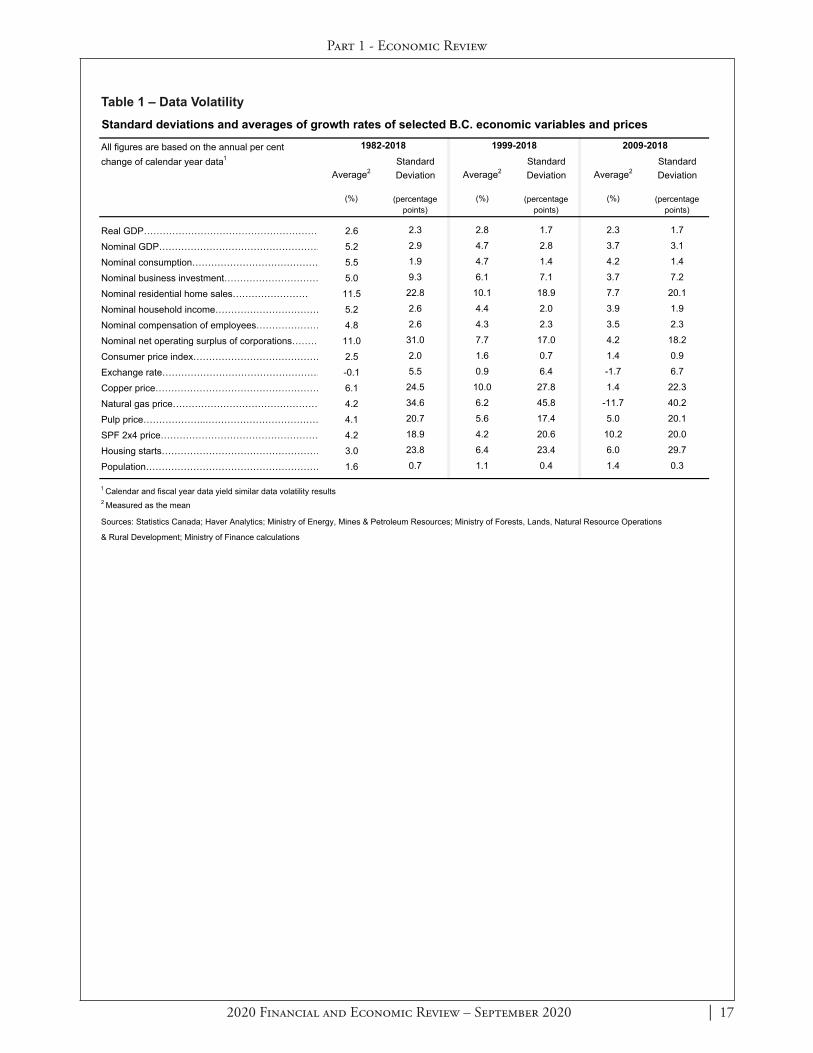
B.C. real GDP growth had a standard deviation of 1.7 percentage points and an average of 2.3 per cent from 2009 to 2018. This means that, on average, real GDP growth rates were 1.7 percentage points away from the average annual real GDP growth rate of 2.3 per cent over this period.
Standard deviations can vary widely across indicators and time. Variables such as the natural gas price and housing starts were relatively volatile from 2009 to 2018, while variables such as population and the consumer price index were relatively stable (see Chart 3). Meanwhile, some variables like the exchange rate and housing starts have become more volatile over time, whereas other variables like population have become more stable (see Table 1).
The Ministry of Finance manages the uncertainty associated with data volatility by incorporating prudence in the Province’s budget and fiscal plan.
Historical Data Volatility
Individual economic variables have unique characteristics. An important characteristic from a budgeting and planning perspective is the historical data volatility of a variable. Typically, variables that are more volatile over history are more difficult to forecast than variables that are more stable.
One of the most common measurements of data volatility is the standard deviation, which is frequently reported by agencies such as Statistics Canada and the Bank of Canada. Roughly speaking, the standard deviation of a variable measures how far the individual data points are from the average (mean) of all the data points in the series on an absolute basis (that is, without regard to whether each data point is above or below the average).
If a variable’s data points are generally close to the average, then the standard deviation will be relatively low (meaning that the variable is relatively stable). An example of a relatively stable variable is presented in Chart 1, which displays the annual growth rate of B.C.’s population.
Conversely, if a variable’s data points are generally spread out from the average, then the variable will have a relatively high standard deviation (meaning that the variable is relatively volatile). The annual growth rate of the natural gas price in Chart 2 is an example of a relatively volatile variable.
The standard deviations and averages of selected key economic variables’ growth rates over different time periods are presented in Table 1. For instance,
Annual growth rate of B.C.’s population(per cent change)
*Percentage pointsSources: Statistics Canada; Haver Analytics; Ministry of Finance calculations
1.4 1.20.8
1.4 1.41.7 1.5 1.7
1.31.6
-2
-1
0
1
2
3
4
20182010 2011 2012 2013 2014 2015 2016 20172009
Average = 1.4(Standard deviation = 0.3 pp*)
Chart 1 – An Example of Historical Data Stability
0.3 0.9 3.16.7
18.2
29.7
40.2
0
10
20
30
40
50
Standard deviations of selected B.C. economic variables and prices*(percentage points)
*Based on the annual per cent change of calendar year data from 2009 to 2018Sources: Statistics Canada; Haver Analytics; Ministry of Energy, Mines & Petroleum Resources; Ministry of Finance calculations
Population Consumer price index
Nominal GDP
Exchange rate
Nominal net operating surplus of
corporations
Housing starts
Natural gas price
Chart 3 – Recent Data Volatility
Annual growth rate of the natural gas price(per cent change)
*Percentage pointsSources: Ministry of Energy, Mines & Petroleum Resources; Ministry of Finance calculations
-56.2
-2.6-16.6
-44.9
50.6 52.8
-55.9
-27.7
15.0
-31.1
-60
-40
-20
0
20
40
60
20182009 2010 2011 2012 2013 2014 2015 2016 2017
Average = -11.7(Standard deviation = 40.2 pp*)
Chart 2 – An Example of Historical Data Volatility
Part 1 - Economic Review
2020 Financial and Economic Review – September 2020 | 17
Table 1 – Data VolatilityStandard deviations and averages of growth rates of selected B.C. economic variables and prices
All figures are based on the annual per cent change of calendar year data1
Average2
(%)
Standard Deviation
(percentage points)
Average2
(%)
Standard Deviation
(percentage points)
Average2
(%)
Standard Deviation
(percentage points)
Real GDP………………………………………………… 2.6 2.3 2.8 1.7 2.3 1.7
Nominal GDP…………………………………………… 5.2 2.9 4.7 2.8 3.7 3.1
Nominal consumption…………………………………… 5.5 1.9 4.7 1.4 4.2 1.4
Nominal business investment………………………… 5.0 9.3 6.1 7.1 3.7 7.2
Nominal residential home sales…………………… 11.5 22.8 10.1 18.9 7.7 20.1
Nominal household income…………………………… 5.2 2.6 4.4 2.0 3.9 1.9
Nominal compensation of employees………………… 4.8 2.6 4.3 2.3 3.5 2.3
Nominal net operating surplus of corporations……… 11.0 31.0 7.7 17.0 4.2 18.2
Consumer price index…………………………………… 2.5 2.0 1.6 0.7 1.4 0.9
Exchange rate…………………………………………… -0.1 5.5 0.9 6.4 -1.7 6.7
Copper price……………………………………………… 6.1 24.5 10.0 27.8 1.4 22.3
Natural gas price………………………………………… 4.2 34.6 6.2 45.8 -11.7 40.2
Pulp price………………..……………………………… 4.1 20.7 5.6 17.4 5.0 20.1
SPF 2x4 price…………………………………………… 4.2 18.9 4.2 20.6 10.2 20.0
Housing starts…………………………………………… 3.0 23.8 6.4 23.4 6.0 29.7
Population………………………………………………… 1.6 0.7 1.1 0.4 1.4 0.3
1 Calendar and fiscal year data yield similar data volatility results2 Measured as the mean
Sources: Statistics Canada; Haver Analytics; Ministry of Energy, Mines & Petroleum Resources; Ministry of Forests, Lands, Natural Resource Operations
& Rural Development; Ministry of Finance calculations
1982-2018 1999-2018 2009-2018

This page intentionally left blank

2020 Financial and Economic Review – September 2020
Part 2Financial Review

This page intentionally left blank

2020 Financial and Economic Review – September 2020 | 21
Part 2 – Financial Review
2019/20 Overview
During the first three quarters of the year, government managed the 2019/20 fiscal plan through changes to the contingencies allocation and changes to the forecast allowance as the revenue outlook was revised. The forecast of the operating surplus ranged between $148 million and $203 million in the three quarterly reports, down slightly from the $274 million surplus estimated in Budget 2019 (see Tables 2.1 and 2.5). However, the impacts of the COVID-19 global pandemic and government’s response measures resulted in significant impacts to government’s finances in the last quarter of the fiscal year.
The Province ended the 2019/20 fiscal year with a $321 million deficit, a decline of $524 million from the $203 million surplus forecast in the Third Quarterly Report (see Table 2.1). This reflected a $666 million reduction in revenue, a $158 million increase in expense, partly offset by the $300 million forecast allowance incorporated in the Third Quarterly Report projection. Revenue losses in the last quarter included over $800 million in personal income tax, non-residential property tax and net income of commercial Crown corporations. This was mainly due to the negative impacts of the global pandemic on employment income in the 2020 calendar year (lower personal income tax revenue); reduced equity market valuations at March 31, 2020 (higher ICBC losses); and an average 25 per cent reduction in 2020 commercial property tax rates that government announced as part of the suite of response measures.
Revenue was $387 million lower than Budget 2019 due to decline in revenues from taxation, natural resources and lower commercial Crown corporation net income, partially offset by higher fees and miscellaneous revenue, investment earnings, and contributions from the federal government. (See Revenue section for further details.)
Table 2.1 2019/20 Fiscal SummaryActual
($ millions) Budget Q1 Q2 Q3 Actual 2018/19 1
Revenue …………………………………………… 59,047 58,894 58,864 59,326 58,660 57,128 Expense …………….....…....………………..…… (56,970) (57,242) (57,143) (57,590) (57,856) (55,155) Contingencies …................................................ (1,303) (973) (1,073) (1,233) (1,125) (442) Forecast allowance ……………………………… (500) (500) (500) (300) - -
Surplus (Deficit) …………………………………… 274 179 148 203 (321) 1,531
Capital spending:Taxpayer-supported capital spending ………… 6,340 5,776 5,538 5,248 4,772 4,452 Self-supported capital spending ………………… 4,274 4,282 4,279 4,301 4,386 4,106
10,614 10,058 9,817 9,549 9,158 8,558 Provincial Debt:
Taxpayer-supported debt ………………………… 46,384 45,466 44,773 44,569 46,229 42,681 Self-supported debt ……………………………… 25,664 25,354 25,220 25,769 25,932 23,281 Total debt (including forecast allowance) … 72,548 71,320 70,493 70,638 72,161 65,962
Key debt affordability metrics:Taxpayer-supported debt-to-GDP ratio ……… 15.0% 14.8% 14.6% 14.6% 15.1% 14.4%Taxpayer-supported debt-to-revenue ratio … 81.5% 80.0% 78.9% 77.9% 80.6% 75.0%
1
2019/20
Figures have been restated to reflect government accounting policies in effect at March 31, 2020, and the impact of Statistics Canada's historical data revisions of economic growth.

Part 2 – Financial Review
22 | 2020 Financial and Economic Review – September 2020
Total government expenses were $708 million higher than Budget 2019, mainly due to higher spending through statutory appropriations; higher spending on programs that are cost-recovered from third parties; and higher net spending by service delivery agencies. These increases were partially offset by lower ministry spending and favourable prior-year liability adjustments. (See Expense section for further details.)
The changes in revenue and expense are partly offset by the Budget 2019 forecast allowance of $500 million.
Taxpayer-supported capital spending on hospitals, schools, post-secondary institutions, transportation infrastructure, and social housing totalled $4.8 billion. This is $1.6 billion less than Budget 2019 mainly due to scheduling delays across health and transportation sectors.
Self-supported capital spending of $4.4 billion was $112 million higher than budget. (See Capital section for further details.)
Government’s total debt balance ended the fiscal year $387 million lower than forecast in Budget 2019. The variance is primarily due to lower opening debt balance and lower than expected capital spending. (See Debt section for further details.)
Financial information in this publication, including this chapter and Appendix 2, is sourced from the government’s 2019/20 Public Accounts.
Chart 2.1 2019/20 Surplus (Deficit) – Major Changes from Budget 2019
Chart 2.1 2019/20 Surplus (Deficit) – Major Changes from Budget 2019
274
(466)
(355)715
112 (393)
(720)480
(138)
(330)500
(321)
Lowertaxationrevenue
Lowernatural
resourcerevenue
Higherfees and
miscellaneousrevenue
Higherfederalgov't
transfers
LowercommercialCrown net
income
Higherstatutoryspending
Lower netCRF and
otherspending
Highernet agencyspending
Higherspendingrecovered
fromthird parties
Forecastallowance
$ millionsDecline of $595 million, resulted in a $321 million deficit
Budget 2019
2019/20Public
Accounts

2020 Financial and Economic Review – September 2020 | 23
Part 2 – Financial Review
Revenue
Revenue totaled $58.7 billion in 2019/20, $387 million lower than the Budget 2019 projection and up 2.7 per cent from 2018/19. Compared to budget, lower revenues from taxation, natural resources and commercial Crown corporation net income were partially offset by higher revenues from fees, investment earnings, miscellaneous sources and federal government transfers.
Changes of the major revenue components from Budget 2019 are outlined as follows.
Income Tax Revenue
Personal income tax revenue was down $398 million mainly reflecting the expected decline in employment and household incomes in 2020 due to the impacts of the COVID-19 pandemic. During the year, other influencing factors on personal income tax revenue included weaker tax assessments for the 2018 calendar year resulting in a lower tax base. These declines were offset by the impacts of stronger household income growth in 2019 and effective January 2020, the introduction of a new personal income tax rate of 20.5 per cent on taxable income over $220,000.
Chart 2.2 Revenue changes from Budget 2019
59,047 421
(301)
(388)
(198)
(355)
715
112 (393)
58,660
Incometaxes
Propertytransfer tax
Propertytaxes
Othertaxes
Naturalresources
Fees,investment
earnings, andmiscellaneous
Federalgovernment
transfers
CommercialCrown
net income
Total revenue decreased by $387 million
$ millions
Budget 2019
2019/20Public
Accounts
Chart 2.2 Revenue Changes from Budget 2019
Table 2.2.1 Personal Income Tax Revenue Changes from Budget 2019Revenue 2019/20changes Budget Public
($ millions) Indicators (annual percent change) 2019 Accounts
Impacts of COVID-19 pandemic …........................... (397) Prior years adjustment - weaker 2018 tax results .... (57) Household income ........... 2019 4.0% 4.4% 1
Carry-forward impacts of the lower 2018 tax base ... (88) 2020 3.9% -7.0%Higher 2019 household income …........................... 90 New personal income tax rate of 20.5 per cent on B.C. taxable income ......... 2019 3.9% 4.8% 1
taxable income over $220,000 ….......................... 54 2020 4.0% -9.0%
(398) 1 Budget 2020 forecast
Part 2 – Financial Review
24 | 2020 Financial and Economic Review – September 2020
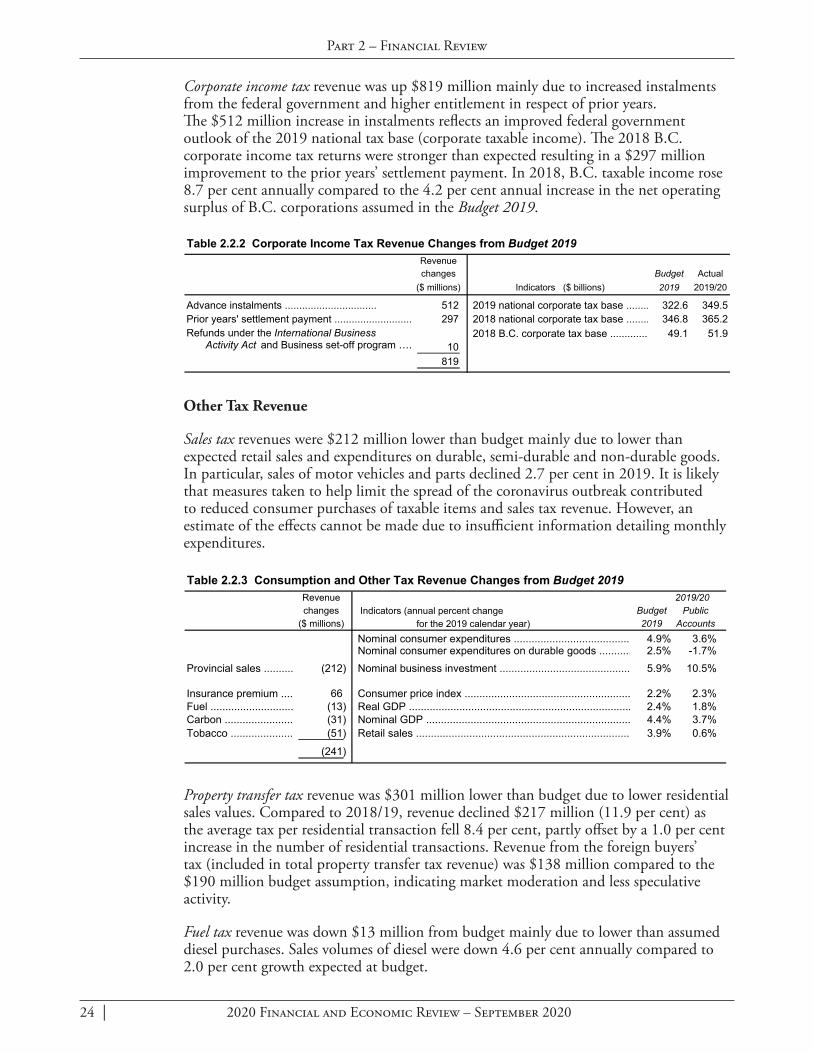
Corporate income tax revenue was up $819 million mainly due to increased instalments from the federal government and higher entitlement in respect of prior years. The $512 million increase in instalments reflects an improved federal government outlook of the 2019 national tax base (corporate taxable income). The 2018 B.C. corporate income tax returns were stronger than expected resulting in a $297 million improvement to the prior years’ settlement payment. In 2018, B.C. taxable income rose 8.7 per cent annually compared to the 4.2 per cent annual increase in the net operating surplus of B.C. corporations assumed in the Budget 2019.
Other Tax Revenue
Sales tax revenues were $212 million lower than budget mainly due to lower than expected retail sales and expenditures on durable, semi-durable and non-durable goods. In particular, sales of motor vehicles and parts declined 2.7 per cent in 2019. It is likely that measures taken to help limit the spread of the coronavirus outbreak contributed to reduced consumer purchases of taxable items and sales tax revenue. However, an estimate of the effects cannot be made due to insufficient information detailing monthly expenditures.
Property transfer tax revenue was $301 million lower than budget due to lower residential sales values. Compared to 2018/19, revenue declined $217 million (11.9 per cent) as the average tax per residential transaction fell 8.4 per cent, partly offset by a 1.0 per cent increase in the number of residential transactions. Revenue from the foreign buyers’ tax (included in total property transfer tax revenue) was $138 million compared to the $190 million budget assumption, indicating market moderation and less speculative activity.
Fuel tax revenue was down $13 million from budget mainly due to lower than assumed diesel purchases. Sales volumes of diesel were down 4.6 per cent annually compared to 2.0 per cent growth expected at budget.
Table 2.2.2 Corporate Income Tax Revenue Changes from Budget 2019Revenuechanges Budget Actual
($ millions) Indicators ($ billions) 2019 2019/20
Advance instalments ................................ 512 2019 national corporate tax base ........ 322.6 349.5Prior years' settlement payment ........................... 297 2018 national corporate tax base ........ 346.8 365.2Refunds under the International Business 2018 B.C. corporate tax base ............. 49.1 51.9
Activity Act and Business set-off program …. 10 819
j:\FEP\ECB\Budget\Budget_06\Budget and 3-Year Fiscal Plan Document\Fiscal Tables\part 1 - 3 year fiscal plan\Table 2.2.2 Corporate Revenue Changes 7/24/2020 11:48 AM
Table 2.2.3 Consumption and Other Tax Revenue Changes from Budget 2019Revenue 2019/20changes Indicators (annual percent change Budget Public
($ millions) for the 2019 calendar year) 2019 AccountsNominal consumer expenditures ....................................... 4.9% 3.6%Nominal consumer expenditures on durable goods ........... 2.5% -1.7%
Provincial sales .......... (212) Nominal business investment ............................................ 5.9% 10.5%
Insurance premium .... 66 Consumer price index ........................................................ 2.2% 2.3%Fuel ............................ (13) Real GDP ........................................................................... 2.4% 1.8%Carbon ....................... (31) Nominal GDP ..................................................................... 4.4% 3.7%Tobacco ..................... (51) Retail sales ........................................................................ 3.9% 0.6%
(241)

2020 Financial and Economic Review – September 2020 | 25
Part 2 – Financial Review
Carbon tax revenue was down $31 million from budget mainly due to lower consumption of natural gas, diesel and gasoline. As planned, on April 1 2019, carbon tax rates rose to $40 per tonne of carbon dioxide equivalent emissions, an increase of $5 per tonne from the previous year.
Tobacco tax revenue was down $51 million from budget reflecting a decline in consumption volumes due in part to consumer lifestyle changes including purchases of alternatives such as vaping products.
Property tax revenue was $388 million lower than budget mainly due to lower revenues from non-residential school taxes and the speculation and vacancy tax. Lower non-residential school tax revenue mainly reflects the reduction in school property tax rates for commercial properties by an average of 25 per cent in the 2020 calendar year announced as part of government’s response to the COVID-19 pandemic. The speculation and vacancy tax revenue was $54 million in 2019/20, $131 million below the budget estimate ($185 million), based on declarations by property owners for the 2019 calendar year.
Insurance premium tax revenue was $66 million higher than budget due to higher than expected activity and higher premiums charged by industry reflecting increased assessments of risks including earthquakes and floods.
Employer health tax revenue was $43 million higher than budget mainly reflecting higher growth in wages and salaries in 2019 than assumed at budget.
Table 2.2.4 Property Tax Revenue Changes from Budget 2019Revenuechanges
($ millions)Non-residential tax …................................................................................................................. (231)Speculation and vacancy tax …................................................................................................. (131)Other …...................................................................................................................................... (26)
Total changes (388)

Part 2 – Financial Review
26 | 2020 Financial and Economic Review – September 2020
Natural Resources Revenue
Natural gas royalties were $157 million lower than budget due to lower prices for natural gas and byproducts and increased utilization of the royalty and infrastructure credit programs. Byproducts include pentane, condensate and butane whose prices are more closely aligned to oil rather than natural gas. Natural gas prices averaged $0.63 ($Cdn/gigajoule, plant inlet) in 2019/20, 12.5 per cent below budget. Prices for the byproducts were also lower than expected, ranging from down 12.8 per cent for pentane to down 82.9 per cent for butane.
Coal, metals and other minerals revenue was $58 million higher than budget mainly due to higher coal production volumes, lower operating costs and capital expenditures in coal mine operations as well as the impacts of higher copper production reflecting improved copper grades and a more efficient extraction process.
Revenue from other energy sources was $62 million lower than budget mainly due to the impacts of lower petroleum prices and production volumes as well as the effects of lower Mid-Columbia (Mid-C) electricity prices. In 2019/20, petroleum prices averaged $54.72 per barrel, down 15.2 per cent from budget ($64.50) and Mid-C electricity prices averaged $26.48 ($US per mega-watt hour), down 18 per cent from the budget assumption ($32.48). Lower average electricity prices during the year were a result of weak natural gas prices, high snowpack accumulation in Northern California and mild temperatures throughout the Pacific North West.
Forests revenue was $167 million lower than budget mainly due to lower than expected stumpage revenue from timber tenures resulting from reduced Crown harvest volumes, partially offset by a higher average stumpage rate. The total Crown harvest volumes for 2019/20 were 42.2 million cubic metres, 26 per cent below budget mainly reflecting more than two dozen permanent and temporary mill closures in the Interior and on the Coast. Mill closures were a result of tightening provincial timber supply resulting from the cumulative effects of the mountain pine infestation, wildfires, labour relations disputes and the continuing US duties on softwood lumber exports. Lumber prices for SPF 2x4 averaged $372 ($US/1000 bf ) in 2019, down 2 percent from the budget assumption ($380). Logging tax revenue was lower than budget due to increases in losses carried back and higher refunds related to overpayments of instalments during the year.
Table 2.2.5 Energy and Mineral Revenue Changes from Budget 2019Revenuechanges Budget Actual
($ millions) Indicators 2019 2019/20
Natural gas royalties ............................................... (157) Natural gas price ($Cdn/GJ, plant inlet) ...... $0.72 $0.63Natural gas production (annual change) ..... -1.2% 1.8%Pentane price ($C/bbl) ................................ $66.75 $58.20Condensates price ($C/bbl) ........................ $68.88 $58.78
Petroleum royalties …........................................... (32) Oil price ($US/bbl) ....................................... $64.50 $54.72
Coal, metals and other minerals ............................. 58 Metallurgical coal price ($US/tonne) ........... $158 $164Copper price ($US/lb) ................................. $3.02 $2.66
Electricity sales under the Columbia River Treaty .. (28) Electricity price ($US/Mwh) ......................... $32.48 $26.48
Other sources1 ........................................................ (2) (161)
1 Includes Crown land tenures and fees and levies collected by the BC Oil and Gas Commission.
j:\FEP\ECB\Budget\Budget_06\Budget and 3-Year Fiscal Plan Document\Fiscal Tables\part 1 - 3 year fiscal plan\Table 2.2.5 Energy revenue and assumptions 7/23/2020 2:33 PM

2020 Financial and Economic Review – September 2020 | 27
Part 2 – Financial Review
Other natural resource revenues, comprised of revenue from water rentals and hunting and fishing licenses, were $27 million lower than budget mainly due to lower water rentals revenue.
Other Taxpayer-Supported Sources
Revenue from fees, investment earnings and other miscellaneous sources totaled $10.7 billion, up $715 million from budget. Fee revenue totaled $5.6 billion, up $185 million from budget mainly due to improved revenues from post-secondary institutions and health authorities, higher MSP premium revenue, partly offset by lower revenues from the K-12 school districts. Miscellaneous revenue totaled $3.8 billion, $463 million above budget mainly due to higher vote recoveries related to the PharmaCare program, improved results for taxpayer-supported Crown corporation and agencies and increased income tax penalties collected by the Canada Revenue Agency. The higher vote recovery funding had an equal and offsetting expense increase. Revenue from investment earnings was $1.3 billion, up $67 million from budget due to prudence adopted at budget and the timing of cash flows during the year.
Table 2.2.7 Other Revenue Changes from Budget 2019Revenuechanges
($ millions)
Fees ............................................... 185 Higher revenues in taxpayer-supported SUCH sector agencies and MSP premiums
Miscellaneous sources .................. 463
Mainly higher PharmaCare vote recoveries, higher revenues in taxpayer-supported SUCH sector agencies and income tax penalties collected by Canada Revenue Agency
Investment earnings ....................... 67 Prudence adopted at budget and the timing of cash flows during the year
715
Table 2.2.6 Forest Revenue Changes from Budget 2019Revenuechanges Actual
($ millions) Indicators 2019/20
Stumpage from timber tenures ............. (174) SPF 2x4 ($US/1000 bf, calendar year) .. $380 $372BC Timber Sales ................................... 29 Total stumpage rate ($/m3 )................. $18.25 $21.46Logging Tax .......................................... (22) Harvest volumes (million m3) .............. 57.0 42.2Other receipts ....................................... -
(167)
Budget 2019
j:\FEP\ECB\Budget\Budget_06\Budget and 3-Year Fiscal Plan Document\Fiscal Tables\part 1 - 3 year fiscal plan\Table 2.2.6 Forest Revenue Changes 8/5/2020 1:49 PM

Part 2 – Financial Review
28 | 2020 Financial and Economic Review – September 2020
Federal Government Transfers
Contributions from the federal government totaled $9.5 billion, $112 million above budget.
Canada Health Transfer and Canada Social Transfer entitlements were $90 million higher than budget mainly due to one-time Canada Health Transfer funding of $68 million. This one-time contribution was B.C.’s share of the federal government’s $500 million response to the COVID-19 pandemic to provide critical health care system needs and to support mitigation efforts as needed. In addition, increased entitlement resulted from a higher B.C. share of the national population than assumed at budget (13.49 per cent compared to 13.47 per cent forecast at budget).
Other federal government contributions were up $22 million from budget. SUCH1 sector entities received $50 million higher contributions, mainly by post-secondary institutions. Ministries received $48 million higher vote recovery funding in support of local government services and transfers, disability assistance and other program spending, partially offset by lower vote recoveries in support of public transit and labour market development. The increased vote recovery funding had an equal and offsetting expense increase. These increases were partially offset by $29 million lower entitlement of B.C.’s share of the federal cannabis excise tax reflecting fewer than expected licensed retail establishments and $50 million lower transfers to taxpayer-supported Crown corporations mainly due to changes in the timing of contributions to the BC Housing Management Commission.
Table 2.2.8 Federal Government Transfer Changes from Budget 2019Revenuechanges
($ millions)
B.C. health and social transfers revenue ........... 90 One-time $68 million COVID-19 funding and higher B.C. population share of the national total
SUCH sector ...................................................... 50 Higher transfers to taxpayer-supported SUCH sector agencies (mainly post-secondary institutions)
Vote recoveries .................................................. 48
Higher funding in support of local government services and transfers and other program spending, partially offset by lower funding for labour market and public transit
B.C. share of federal duty on cannabis .............. (29) Fewer than expected licensed retail establishments
Crown corporations and agencies ..................... (50) Mainly reduced transfers to BC Housing Management Commission
Other receipts .................................................... 3
Higher funding in support of Indigenous student education partially offset by lower Labour Market Agreement for Persons with Disabilities funding.
112
j:\FEP\ECB\Budget\Budget_06\Budget and 3-Year Fiscal Plan Docume \
1 SUCH: School districts, universities, colleges and institutes, and health organizations.

2020 Financial and Economic Review – September 2020 | 29
Part 2 – Financial Review
Commercial Crown Corporations
The net income of commercial Crown corporations (government business enterprises) was $2.9 billion in 2019/20, $393 million lower than Budget 2019, and $913 million higher than 2018/19. The variance from budget in overall earnings is mainly due to lower ICBC operating results.
British Columbia Hydro and Power Authority
BC Hydro’s net income of $705 million was $7 million lower than the amount included in Budget 2019. The lower net income was mainly the result of higher capital project write-offs and a provision for potential non-compliance penalties under the Mandatory Reliability Standards.
Provincial regulation was previously implemented to improve BC Hydro’s capital structure, which required the corporation’s annual dividend payment to the Province to be reduced by $100 million per year until it reaches zero. The corporation’s dividend payment in respect of 2019/20 was zero, down from the 2018/19 payment of $59 million.
British Columbia Liquor Distribution Branch
BC Liquor Distribution Branch (LDB) net income of $1.1 billion was $13 million lower than Budget 2019, and $3 million higher than 2018/19. Net income is the contribution made to the Province by the LDB from beverage alcohol and non-medical cannabis sales in the province. The decrease in net income was mainly due to higher administration expenses and lower than planned cannabis revenues.
British Columbia Lottery Corporation
BC Lottery Corporation’s net income of $1.3 billion (net of payments to the federal government) was $60 million lower than Budget 2019, and a decrease of $69 million over the prior year. The 2019/20 change was mainly due to the measures put in place to respond to the COVID-19 pandemic.
Insurance Corporation of British Columbia
The Insurance Corporation of British Columbia’s (ICBC) net loss of $376 million was $326 million higher than the $50 million loss projected in Budget 2019, and a $777 million improvement from the 2018/19 loss. The COVID-19 global pandemic had a significant negative impact on ICBC’s bottom line. The sudden and significant negative impact to the economy and global investment markets resulted in a large investment impairment charge. Further, the market downturn caused a reduction in market yields, which resulted in a lower rate to discount claims liabilities, increasing claim costs.
More information about commercial Crown corporations’ financial results and performance measures is provided in each corporation’s Annual Service Plan Report available at its respective website.

Part 2 – Financial Review
30 | 2020 Financial and Economic Review – September 2020
Table 2.3 Revenue by SourceBudget Actual Actual
($ millions) 2019 2019/20 2018/19
TaxationPersonal income ……………………………………………………………………………………………… 11,055 10,657 11,364 Corporate income ……………………………………………………………………………………………… 4,192 5,011 5,180 Employer health ………………………………………………………………………………………………… 1,854 1,897 464 Sales 1 ……………………………………………………………………………………………… 7,586 7,374 7,369 Fuel ……………………………………………………………………………………………………………… 1,021 1,008 1,015 Carbon ………………………………………………………………………………………………………… 1,713 1,682 1,465 Tobacco ………………………………………………………………………………………………………… 780 729 781 Property ………………………………………………………………………………………………………… 2,996 2,608 2,617 Property transfer ……………………………………………………………………………………………… 1,910 1,609 1,826 Insurance premium …………………………………………………………………………………………… 625 691 633
33,732 33,266 32,714 Natural resources
Natural gas royalties ……..…………………...……………………………………………………………… 275 118 199 Forests ………………………………………………………………………………………………………… 1,155 988 1,406 Other natural resources 2 …………………………………………………………………………… 1,193 1,162 1,503
2,623 2,268 3,108 Other revenue
Medical Services Plan premiums …………………………………………………………………………… 1,015 1,063 1,360 Other fees and licences 3 …………………………………………………………………………… 4,372 4,509 4,233 Investment earnings …………………………………………………………………………………………… 1,196 1,263 1,243 Miscellaneous 4 ……………………………………………………………………………………… 3,375 3,838 3,413
9,958 10,673 10,249 Contributions from the federal government
Health and social transfers ………………………………………………………………..………………… 7,404 7,494 7,090 Other federal contributions 5 ………………………………………………………………………… 2,019 2,041 1,962
9,423 9,535 9,052 Commercial Crown corporation net income
BC Hydro 6 ……………………………………………………………………………………………………… 712 705 (428) Adjustment for regulatory accounts 6 ………………………………………………………………………… - - 950 Liquor Distribution Branch …………………………………………………………………………………… 1,120 1,107 1,104 BC Lottery Corporation (net of payments to the federal government) …………………………………… 1,396 1,336 1,405 ICBC ………………………………….……………………………………………………………… (50) (376) (1,153) Other 7 ……………………………………………………………………………………………… 133 146 127
3,311 2,918 2,005
Total revenue ………………………………………………………………………………………… 59,047 58,660 57,128
1
2 Columbia River Treaty, Crown land tenures, other energy and minerals, water rental and other resources. 3 Post-secondary, healthcare-related, motor vehicle, and other fees. 4
5
6
7
Includes contributions for health, education, community development, housing and social service programs, and transportation projects.
Includes Columbia Power Corporation, BC Railway Company, Columbia Basin power projects, and post-secondary institutions' self-supported subsidiaries.
BC Hydro's net loss for 2018/19 includes a write-off of a regulatory account. At the summary level, the Province recognized $950 million adjustment in fiscal 2017/18 with respect to BC Hydro's deferred regulatory accounts.
Includes provincial sales tax, HST/PST housing transition tax and harmonized sales tax related to prior years.
Includes reimbursements for health care and other services provided to external agencies, and other recoveries.
\quarterly\2005_06\q2\fiscal\tables\Table 2.3 Revenue by source 8/5/2020 1:51 PM

2020 Financial and Economic Review – September 2020 | 31
Part 2 – Financial Review
Table 2.4 Expense by Ministry, Program and Agency 1
($ millions)Budget 2019 2
Contin-gencies
allocation
Statutoryauthor-ization 3
Totalauthor-izations
Actual2019/20
Actual 2018/19 2
Office of the Premier …………………………………………… 11 1 - 12 12 11 Advanced Education, Skills and Training .............................. 2,330 1 - 2,331 2,331 2,218 Agriculture ………………………………………………………… 98 14 - 112 112 98 Attorney General ................................................................... 606 57 56 719 718 623 Children and Family Development ……………………………… 2,068 83 - 2,151 2,149 1,832 Citizens' Services .................................................................. 561 35 - 596 596 609 Education ………………………………………………………… 6,569 71 8 6,648 6,647 6,382 Energy, Mines and Petroleum Resources ………….………… 180 71 - 251 251 106 Environment and Climate Change Strategy …………...……… 249 - - 249 244 194 Finance …………………………………………………………… 870 28 481 1,379 1,366 825 Forests, Lands, Natural Resource Operations and
Rural Development …………………………………………… 816 56 86 958 958 1,401 Health ……………………………………………………………… 20,846 - - 20,846 20,825 19,843 Indigenous Relations and Reconciliation ……………………… 108 245 - 353 353 231 Jobs, Economic Development and Competitiveness ………… 97 1 - 98 98 103 Labour …………………………………………………………… 16 - - 16 16 12 Mental Health and Addictions …………………………………… 10 13 - 23 23 14 Municipal Affairs and Housing ………………………………… 828 355 - 1,183 1,182 817 Public Safety and Solicitor General ....................................... 801 73 89 963 963 1,090 Social Development and Poverty Reduction ......................... 3,568 1 - 3,569 3,569 3,359 Tourism, Arts and Culture ……………………………………… 164 20 - 184 184 164 Transportation and Infrastructure ……………………………… 926 - - 926 919 902
Total ministries and Office of the Premier ……………… 41,722 1,125 720 43,567 43,516 40,834 Management of public funds and debt ………………………… 1,278 - - 1,278 1,234 1,258 Contingencies ……………………………………………...…… 1,303 (1,125) - 178 - 21 Funding for capital expenditures ……………………………… 2,134 - - 2,134 1,653 1,435 Refundable tax credit transfers ………………………………… 1,489 - - 1,489 1,413 1,618 Legislative Assembly and other appropriations ……………… 159 - - 159 150 160
Total appropriations ………………………………………… 48,085 - 720 48,805 47,966 45,326 Elimination of transactions between appropriations 4 ………… (24) - - (24) (20) (18) Prior year liability adjustments ………………………………… - - - - (126) (151)
Consolidated revenue fund expense ………………..………… 48,061 - 720 48,781 47,820 45,157 Expenses recovered from external entities …………………… 3,520 - - 3,520 3,850 3,471 Funding provided to service delivery agencies ..................... (28,631) - - (28,631) (28,928) (26,928)
Total direct program spending ………………………………… 22,950 - 720 23,670 22,742 21,700 Service delivery agency expense
School districts …………………………………………………… 6,912 - - 6,912 6,995 6,671 Universities ...................................……………………………… 5,128 - - 5,128 5,252 4,898 Colleges and institutes …………………………………………… 1,373 - - 1,373 1,465 1,352 Health authorities and hospital societies ……………………… 16,292 - - 16,292 17,038 15,918 Other service delivery agencies ………………………………… 5,618 - - 5,618 5,489 5,058
Total service delivery agency expense ……………………… 35,323 - - 35,323 36,239 33,897
Total expense ……………………………………………………… 58,273 - 720 58,993 58,981 55,597
1
2
3
4
Amounts have been restated to reflect government accounting policies and organization in effect at March 31, 2020.Statutory authorizations are appropriations permitted by an Act other than a Supply Act .Reflects payments made under an agreement where an expense from a voted appropriation is recorded as revenue by a special account (Housing Endowment Fund and British Columbia Training and Education Savings Program).
Amounts may not add due to rounding.

Part 2 – Financial Review
32 | 2020 Financial and Economic Review – September 2020
Table 2.5 2019/20 Financial Forecast Changes
2019/20 surplus at Budget 2019 (February 19, 2019) ................................................................... 274 274
2019/20 surplus at the First Quarterly Report (September 10, 2019) ......................................... 179
2019/20 surplus at the Second Quarterly Report (November 26, 2019) …………………………… - 148
2019/20 surplus at the Third Quarterly Report (February 19, 2020) ……………………………… - 203
Q1 Update
Q2 Update
Q3 Update
Q4 Update
TotalChanges
Revenue changes:Personal income tax – lower 2018 tax assessment results and expected decline
in 2020 household income ........................................................................................……… (85) (57) 109 (365) (398) Corporate income tax – increase in instalments and prior-year settlement payment,
reflecting stronger 2018 tax assessment results ………………………………………………… 300 342 174 3 819 Property transfer tax – lower year-to-date sales resulting from moderation in
residential housing market …................................................................................................ (475) 35 75 64 (301) Provincial sales tax – lower retail sales and consumer expenditures ....................................... 30 (49) 2 (195) (212) Property taxes – lower 2020 tax rates, reflecting tax relief to commercial property owners
and reduced 2020 assessment values ….......................................................................... (43) (13) (23) (309) (388) Other taxation sources – year-to-date results …………………………………........................... (4) (55) 6 67 14 Natural gas royalties – changes in natural gas prices and production volumes,
increased utilization of royalty and infrastructure programs/credits, changesin natural gas liquids royalties and byproduct prices.............................................................. (105) (30) 13 (35) (157)
Coal, metals and minerals – changes in coal prices and costs as well as increased copper production volumes ................................................................................. 94 (37) - 1 58
Forests – lower harvest volumes partly offset by higher stumpage rates …............................. 23 (133) (54) (3) (167) Other natural resources – lower petroleum prices and production volumes, lower
electricity prices and decreased revenue from water rentals …........................................... (31) (35) (2) (21) (89) Post-secondary education fees …............................................................................................. 41 36 47 (2) 122 Other revenue – mainly higher revenue from other fees, income tax penalties
and changes in the revenues from Crown and SUCH sector entities …............................... 143 61 98 291 593 Health and social transfers – changes in B.C. population share of national
total and COVID-19 funding.................................................................................................. (5) 28 - 67 90 Other federal government transfers – lower transfers to BC Housing
Management Commission and B.C.'s share of lower federal excise tax revenue oncannabis (the latter reflecting fewer than expected licensed retail establishments), partly offset by higher transfers to post-secondary institutions ….......................................... (10) (35) 17 50 22
Commercial Crown corporation net income ….......................................................................... (26) (88) - (279) (393) Total revenue changes …………………………………………………………………………... (153) (30) 462 (666) (387)
Less : expense increases (decreases): Consolidated Revenue Fund changes:
Change in contingencies spending allocation …………………………………………………… (330) 100 150 (98) (178) Ministry and Legislative Assembly savings ……………………………………………………… - (14) - (46) (60) Statutory spending:
Fire management costs ................................................................................................... 92 (19) 61 (53) 81 Emergency Program Act ................................................................................................. 117 (24) 38 (44) 87 Signed agreements under the Sustainable Services Negotiating Mandate ..................... - - 383 3 386 Housing Priority Initiatives Special Account - various housing intitiatives …................... - (49) - 149 100 Crown Proceeding Act .................................................................................................... - - - 54 54 Other statutory spending ................................................................................................. 11 (48) 5 44 12 Refundable tax credits – mainly the impact of 2018 tax assessment results .................. - 89 (155) (10) (76)
Prior year liability and other adjustments - mainly due to the liability reduction for - - - - the Public Sector Pension Plan & Insurance Risk Management Account ....................... 3 - (12) (113) (122)
Management of public debt (net) .......................................................................................... (44) (9) - 9 (44) Spending funded by third party recoveries ............................................................................... (9) (12) 23 328 330 Changes in spending profile of service delivery agencies:
School districts ...................................................................................................................... - 37 31 15 83 Universities ............................................................................................................................ 75 44 32 (27) 124 Colleges ................................................................................................................................ 55 16 8 13 92 Health authorities and hospital societies ............................................................................... 16 344 157 229 746 Other service delivery agencies 1 .......................................................................................... (38) (128) 72 (35) (129)
(Increase) decrease in transfers to service delivery agencies (elimination) ……………………… (6) (326) (186) (260) (778) Total expense changes …………………………………………………………………………… (58) 1 607 158 708
Subtotal ........................................................................................................................................ (95) (31) (145) (824) (1,095) (Increase) / Reduction in forecast allowance ………………………..............................…………… - - 200 300 500
Total changes …….............................................................................………………………………… (95) (31) 55 (524) (595) 2019/20 surplus at the First Quarterly Report ………………………………………………………… 179 2019/20 surplus at the Second Quarterly Report …………………………………………………… 148 2019/20 surplus at the Third Quarterly Report ……………………………………………………… 203 2019/20 deficit at the Public Accounts ………………………………………………………………… (321) (321)
1
($ millions)
Includes BC Transportation Financing Authority, BC Transit, BC Housing Management Commission, Community Living BC, and other entities.

2020 Financial and Economic Review – September 2020 | 33
Part 2 – Financial Review
Expense
In 2019/20, government expenses totalled $59.0 billion, $708 million higher than Budget 2019 and $3.3 billion (6.0 per cent) higher than the previous year.
Consolidated Revenue Fund
Consolidated Revenue Fund (CRF) direct program spending2 (expenses other than grants paid to government agencies) was $208 million lower than Budget 2019. This was mainly due to higher statutory spending and higher spending funded by third parties, partially offset by lower ministry spending and interest costs as well as favourable prior year liability adjustments.
Statutory spending by government during the year totalled $720 million in the following areas:• $386 million for the signed agreements under the Sustainable Services Negotiating
Mandate. Utilizing statutory appropriation for these expenses resulted in additional capacity in the contingencies vote, which was applied to accelerate payments to local governments for infrastructure projects under the Investing in Canada Infrastructure Program, for the Capital Regional District Wastewater Project, and payments for existing agreements with First Nations (Ministry of Finance);
• $100 million net increase in spending to support various housing and shelter initiatives under the Housing Priority Initiatives Special Account (Ministry of Finance);
• $81 million in fire management costs (Ministry of Forests, Lands, Natural Resource Operations and Rural Development);
• $87 million in emergency response, recovery, prevention, and preparedness costs under the Emergency Program Act (Ministry of Public Safety and Solicitor General); and
• $66 million in other areas.
Chart 2.3 Expense Changes from Budget 2019
Chart 2.3 Expense Changes from Budget 2019
58,273
386
334
(76)
(278)
(126)330
138 58,981
Statutoryspending for
SSNM
Higherother
statutoryspending
Lowerrefundabletax credits
Lowerother CRFspending
Favourableprior year
liabilityadjustments
Higherspending
recovered fromthird parties
Highernet service-
delivery agencyspending
$ millions
Total expense increased by $708 million
Budget 2019
2019/20Public
Accounts
2 See Table 2.4 – Total direct program spending.

Part 2 – Financial Review
34 | 2020 Financial and Economic Review – September 2020
Other CRF spending was $354 million lower than Budget 2019 due to lower refundable tax credits ($76 million), unused portion of the Contingencies Vote ($178 million), ministry and other savings ($56 million) and lower interest costs ($44 million).
Government used the Contingencies Vote as a prudent budgeting tool to fund priority initiatives and manage budget pressures. In 2019/20, $1.1 billion of the $1.3 billion Contingencies Vote was spent on a number of priority initiatives and pressures, including:
• $355 million in grants to support local governments for various infrastructure projects (Ministry of Municipal Affairs and Housing);
• $245 million for various treaty and non-treaty agreements with First Nations, including various costs under the Indigenous Funding Envelope and the LNG benefits agreement (Ministry of Indigenous Relations and Reconciliation);
• $83 million to create additional child care spaces and provide support to various child care related programs (Ministry of Children and Family Development);
• $73 million to support various programs and initiatives including road safety initiatives, emergency management, support services to those affected by crime, and cannabis legalization (Ministry of Public Safety and Solicitor General);
• $71 million to support K-12 education including funding for the Classroom Enhancement Fund and grants to public libraries (Ministry of Education);
• $71 million to support CleanBC initiatives and improving mining regulatory framework (Ministry of Energy, Mines and Petroleum Resources);
• $57 million to support various programs and initiatives including the Civil Resolution Tribunal, Federal Legal Aid Agreement, cannabis legalization, digital evidence storage, court-related costs and the anti-money laundering report (Ministry of Attorney General);
• $56 million to support various programs and initiatives including the Big Bar Landslide, economic diversification and rural resiliency funding and timber license settlement compensation (Ministry of Forests, Lands, Natural Resource Operations and Rural Development);
• $20 million in grants to support various initiatives including the Creative BC Amplify BC Fund and the Chinese Canadian Museum (Ministry of Tourism, Arts and Culture); and
• $94 million in other areas.
Prior year liability adjustments resulted in $126 million lower expenses than Budget 2019 due to:
• $97 million in the Ministry of Finance, mainly due to the reduction in accrued obligations for the Teachers’ Pension Plan ($64 million), and the Insurance and Risk Management Account ($32 million);
• $10 million in the Ministry of Education, to reflect lower than estimated program intake for the BC Training and Education Savings Program; and
• $19 million in other favourable adjustments.

2020 Financial and Economic Review – September 2020 | 35
Part 2 – Financial Review
Third party recovered spending relates to program spending funded or co-funded by parties outside of government. Cost-recovered spending was $330 million higher than Budget 2019 due to:• $164 million higher recoverable health care costs mainly due to PharmaCare costs and
health services provided to non-resident patients; • $79 million higher recoveries from the federal government for local government
infrastructure projects;• $81 million higher recoveries from natural resources sector;• $12 million increase in recoverable interest;• $17 million higher recoveries for fire management; • $122 million net increases in other program areas; offset by• $145 million in lower recoverable costs in the transportation sector mainly due to
timing of public transportation projects.
The above spending changes are offset by an equal net increase in revenue and as a result have no net impact on government’s financial results.
Operating transfers paid to service delivery agencies may change during the fiscal year as ministries make budget allocations, Contingencies Vote access is approved, and government invokes statutory authority. In 2019/20, operating grants to agencies increased by $778 million compared to Budget 2019 primarily due to higher grants to health authorities ($700 million) and various other service delivery agencies ($78 million).
Service Delivery Agency Spending
Service delivery agency spending was $916 million higher than Budget 2019, made up of the following:
School districts’ spending was $83 million higher than Budget 2019 due to higher staffing and operating costs including inflationary pressures and increased amortization costs in line with self-funded capital investments.
Post-secondary institutions spending was $216 million higher than Budget 2019 mainly due to higher staffing and wages resulting from collective agreement settlements. The higher spending is partly offset by increased tuition revenues and federal research grants.
Health authority and hospital society spending was $746 million higher than Budget 2019 mainly due to increased staffing and operating costs to meet the volume growth in health care services delivered by these organizations as well as initial costs associated with COVID-19.
Spending in other service delivery agencies was $129 million lower than Budget 2019 reflecting lower spending by the BC Transportation and Financing Authority ($107 million) due mainly to lower debt servicing costs and amortization expense partly offset by other operating costs, and the BC Housing Management Commission ($153 million) due to grants reprofiled to future years to reflect the change in timing of housing projects. These decreases are offset by a net increase in spending by other service delivery agencies ($131 million).
A detailed review of the above changes by quarter is available in Table 2.5. Further information on 2019/20 spending by function is provided in Appendix Table A2.6.

Part 2 – Financial Review
36 | 2020 Financial and Economic Review – September 2020
Provincial Capital Spending
In 2019/20, capital spending totalled $9.2 billion, which was comprised of $4.8 billion on taxpayer-supported infrastructure and $4.4 billion on the self-supported infrastructure of commercial Crown corporations and agencies.
Direct spending on health and education facilities, social housing, and government capital projects (i.e. government ministry infrastructure, including IT systems, courthouses and correctional institutions) represented 40 per cent of total capital spending in 2019/20.
Spending on highways and public transportation is also taxpayer-supported and reflects government’s transportation and transit investment plans. Transportation investments comprised about 11 per cent of total capital spending in 2019/20. While this spending is predominantly taxpayer financed, a portion is funded from the federal government and other external sources.
Spending on power generation and transmission projects is the largest single category of capital spending and is entirely self-supported. The spending primarily reflects BC Hydro’s refurbishment and expansion of its generating and transmission assets.
Chart 2.4 Components of Total Capital Spending – 2019/20Chart 2.4 – Components of total capital spending – 2019/20
44.5%
19.8%
11.0%
11.2%
3.9%5.7%
3.9%Social Housing
Power generation & transmission
Education facilities
Other
Health facilities
Highways & public transit
Governmentdirect
Total: $9,158 million
Per Cent of Total
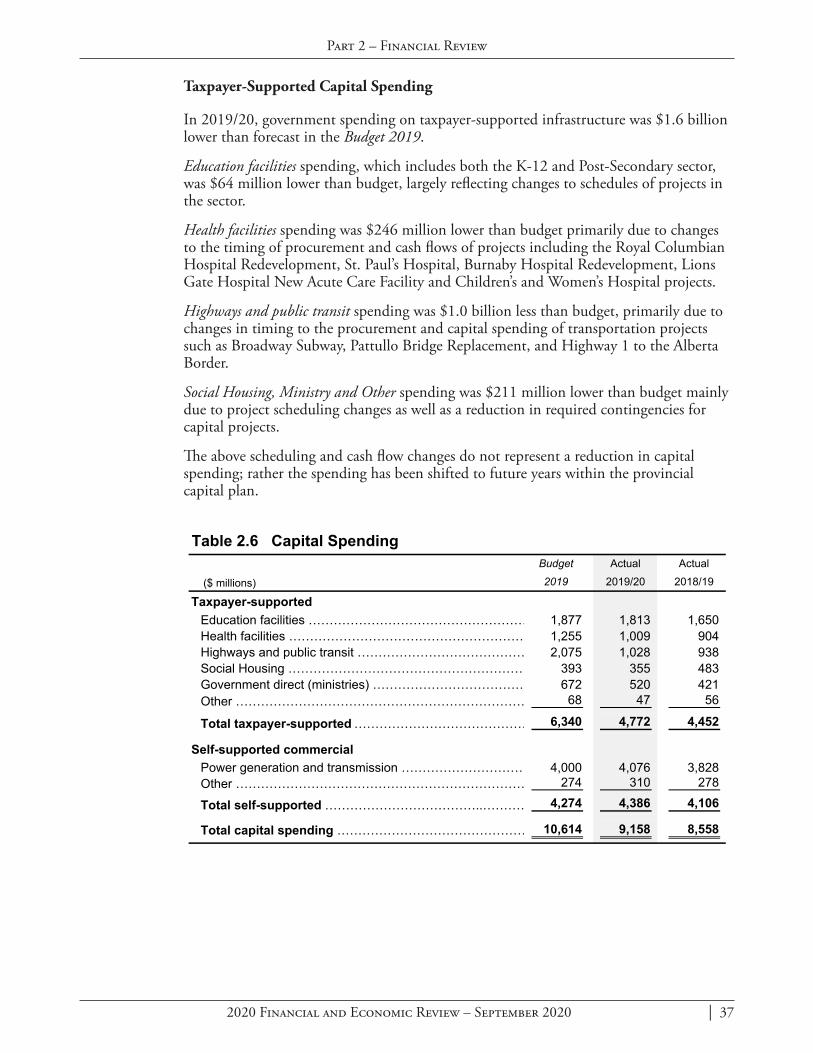
2020 Financial and Economic Review – September 2020 | 37
Part 2 – Financial Review
Taxpayer-Supported Capital Spending
In 2019/20, government spending on taxpayer-supported infrastructure was $1.6 billion lower than forecast in the Budget 2019.
Education facilities spending, which includes both the K-12 and Post-Secondary sector, was $64 million lower than budget, largely reflecting changes to schedules of projects in the sector.
Health facilities spending was $246 million lower than budget primarily due to changes to the timing of procurement and cash flows of projects including the Royal Columbian Hospital Redevelopment, St. Paul’s Hospital, Burnaby Hospital Redevelopment, Lions Gate Hospital New Acute Care Facility and Children’s and Women’s Hospital projects.
Highways and public transit spending was $1.0 billion less than budget, primarily due to changes in timing to the procurement and capital spending of transportation projects such as Broadway Subway, Pattullo Bridge Replacement, and Highway 1 to the Alberta Border.
Social Housing, Ministry and Other spending was $211 million lower than budget mainly due to project scheduling changes as well as a reduction in required contingencies for capital projects.
The above scheduling and cash flow changes do not represent a reduction in capital spending; rather the spending has been shifted to future years within the provincial capital plan.
Table 2.6 Capital SpendingBudget Actual Actual
($ millions) 2019 2019/20 2018/19
Taxpayer-supported Education facilities ……………………………………………… 1,877 1,813 1,650 Health facilities ………………………………………………… 1,255 1,009 904 Highways and public transit …………………………………… 2,075 1,028 938 Social Housing ………………………………………………… 393 355 483 Government direct (ministries) ……………………………… 672 520 421 Other …………………………………………………………… 68 47 56
Total taxpayer-supported …………………………………… 6,340 4,772 4,452
Self-supported commercialPower generation and transmission ………………………… 4,000 4,076 3,828 Other …………………………………………………………… 274 310 278
Total self-supported ………………………………..………… 4,274 4,386 4,106
Total capital spending ……………………………………… 10,614 9,158 8,558

Part 2 – Financial Review
38 | 2020 Financial and Economic Review – September 2020
Self-Supported Capital Spending
Self-supported commercial Crown corporation and agency spending on capital projects in 2019/20 was $112 million higher than the Budget 2019 plan.
Power generation and transmission sector spending was $76 million higher than budget primarily due to the timing of Site C project activities. Site C expenditures may be higher or lower than planned in a given period based on many factors.
Other self-supported capital spending was $36 million higher than budget, partially because of the introduction of the Insurance Corporation of British Columbia’s Enhanced Care Coverage Program and higher than expected residential and commercial building investments on the UBC campus, while capital spending of the Liquor Distribution Branch was lower than expected.
Further details on capital spending are provided in Appendix Table A2.9.
Chart 2.5 Capital Spending Changes from Budget 2019Chart 2.5 Capital spending changes from Budget 2019
10,614
(64) (246)
(1,047)
(173) (38) 76 36 9,158
Educationfacilities
Healthfacilities
Highwaysand public
transit
SocialHousing
Ministriesand Other
Powergeneration &transmission
OtherBudget 2019
2019/20Public
Accounts
$ millionsTotal spending lower by $1,456 million
Taxpayer-supported: $1,568 million decrease
Self-supported:$112 million increase

2020 Financial and Economic Review – September 2020 | 39
Part 2 – Financial Review
Major Capital Projects
Significant capital projects (those with multi-year budgets totaling $50 million or more) are shown in Table 2.7. Investments in these larger projects will provide long-term social and economic benefits for the province.
As projects are completed, or new ones receive approval, the projects are removed from or added to the $50 million table.
During the 2019/20 fiscal year, the following projects were removed:• Salish Secondary;• Camosun College – Centre for Health Sciences;• Surrey Emergency/Critical Care Tower;• Royal Inland Hospital Clinical Services Building;• Highway 97 widening from Highway 33 to Edwards Road;• Natural Resource Permitting Project;• Maples Adolescent Treatment Centre and Provincial Assessment Centre;• Columbia River Power projects – Waneta Dam Power Expansion and Waneta Dam
Power Expansion purchase of 51 per cent interest; and• BC Hydro projects including: Hugh Keenleyside spillway gate reliability upgrade,
Upper Columbia capacity additions at Mica units 5 and 6, Dawson Creek/Chetwynd area transmission, Surrey area substation, Big Bend substation, W.A.C. Bennett Dam riprap upgrade and Waneta 2/3 interest acquisition.
The following projects were added to the $50 million table during the fiscal year:• Victoria High School ($80 million);• Quesnel Junior School ($52 million);• Cowichan Secondary ($82 million);• Simon Fraser University – Student Housing ($104 million);• Burnaby Hospital Redevelopment – Phase 1 ($547 million);• Cariboo Memorial Hospital ($218 million);• Stuart Lake Hospital ($116 million);• West Fraser Road Realignment ($103 million);• Clark & 1st Avenue (Affordable Rental Housing) ($109 million);• ICBC project – Enhanced Care Coverage Program ($93 million); and• BC Hydro projects including: Wahleach generator refurbishment ($51 million),
Mount Lehman substation expansion ($59 million), street light replacement program ($80 million), Capilano substation upgrade ($87 million) and Sperling substation (SPG) metalclad switchgear replacement ($54 million).

Part 2 – Financial Review
40 | 2020 Financial and Economic Review – September 2020
Financing Capital Spending
Provincial capital infrastructure spending is financed through a combination of sources:• operating cash flows (i.e. cash derived from the operating surplus and management of
operating accounts);• partnerships with the private sector (public-private partnerships or P3s);• cost-sharing with partners; and• borrowing (debt financing).
Chart 2.6 shows that 74 per cent of 2019/20 taxpayer-supported capital spending was financed from direct net borrowing, 13 per cent from operating cash flows, and 6 per cent from federal contributions. Other contributions accounted for 7 per cent of the financing.
Self supported commercial Crown and agency capital spending of $4.3 billion was financed 63 per cent from direct net borrowing ($2.7 billion), and 37 per cent from operating cash flows ($1.6 billion).
Chart 2.6 Financing Taxpayer-Supported Capital Spending
$3,548
$567
$266
$355
$320
$1,028
$1,009
$638 $1,813
Sources offinancing
Capitalspending
components
$ millionsOperating cash flows
Federal contributions
Direct net borrowing
Other contributions
Total taxpayer-supported capital spending: $4,772 million
Chart 2.6 – Financing Taxpayer-supported Capital Spending
Health facilities
Social housing
Highway infrastructure and public transit
Education facilities
Ministry direct and others

2020 Financial and Economic Review – September 2020 | 41
Part 2 – Financial Review
Table 2.7 Capital Expenditure Projects Greater Than $50 million 1Project Estimated Anticipated Project Financing
Year of Cost to Cost to Total Internal/ P3 Federal Other($ millions) Completion Mar. 31, 2020 Complete Cost Borrowing Liability Gov't Contrib'ns
Taxpayer-supportedSchools
Kitsilano Secondary 2 ………………………………………… 2020 65 - 65 61 - - 4 Centennial Secondary 2 ……………………………………… 2020 53 8 61 61 - - - R.E. Mountain Secondary (Willoughby Slope) 2 ………… 2020 58 1 59 38 - - 21 Argyle Secondary …………………………………………… 2020 46 16 62 50 - - 12 Grandview Heights Secondary ……………………………… 2021 33 50 83 63 - - 20 Handsworth Secondary ……………………………………… 2021 6 63 69 69 - - - New Westminster Secondary ……………………………… 2021 63 44 107 107 - - - Burnaby North Secondary …………………………………… 2022 4 104 108 99 - - 9 Eric Hamber Secondary …………………………………… 2023 2 107 109 97 - - 12 South Side Area Elementary Middle ……………………… 2022 9 45 54 49 5 Sheffield Elementary ………………………………………… 2021 1 51 52 47 - - 5 West Langford Elementary and Middle …………………… 2022 5 84 89 89 - - - Victoria High School ………………………………………… 2022 2 78 80 77 - - 3 Quesnel Junior School ……………………………………… 2022 1 51 52 52 - - - Cowichan Secondary….................................................... 2024 - 82 82 80 2 Seismic Mitigation Program 3 ……………………………… 2030 477 1,067 1,544 1,544 - - -
Total schools ……………………………………………… 825 1,851 2,676 2,583 - - 93 Post-secondary institutions
University of British Columbia –Undergraduate Life Science Teaching Laboratories Redevelopment 2 ……………………….... 2019 97 - 97 12 - 32 53
Simon Fraser University –Energy Systems Engineering Building 2,4 ……………… 2019 123 3 126 45 - 45 36
British Columbia Institute of Technology – Health Sciences Centre for Advanced Simulation ……… 2022 11 77 88 66 - - 22
Simon Fraser University –Student Housing ……………….….……….…..………… 2022 13 91 104 73 - - 31
University of Victoria – Student Housing ……………….….……….…..………… 2023 16 216 232 128 - - 104 Total post-secondary institutions …………..…………… 260 387 647 324 - 77 246
Health facilitiesQueen Charlotte/Haida Gwaii Hospital 2 ………………… 2016 48 - 48 30 - - 18 Royal Inland Hospital Patient Care Tower
– Direct procurement ……………………………………… 2024 12 117 129 39 - - 90 – P3 contract ……………………………………………… 2022 101 187 288 - 164 - 124
Vancouver General Hospital – Jim Pattison Pavilion Operating Rooms …………………………….... 2021 54 48 102 35 - - 67
North Island Hospitals 2 – Direct procurement ………………………………………… 2017 119 - 119 69 - - 50 – P3 contract ………………………………………………… 2017 480 - 480 60 232 - 188 Interior Heart and Surgical Centre 2
– Direct procurement ………………………………………… 2018 176 72 248 213 - - 35 – P3 contract ………………………………………………… 2015 133 - 133 4 79 - 50 Vancouver General Hospital – Joseph and
2017 74 - 74 49 - - 25 Children's and Women's Hospital – Direct procurement ………………………………………… 2020 281 27 308 178 - - 130 – P3 contract ………………………………………………… 2018 368 - 368 167 187 - 14 Penticton Regional Hospital – Patient Care Tower – Direct procurement ………………………………………… 2022 34 46 80 22 - - 58 – P3 contract ………………………………………………… 2019 231 1 232 - 139 - 93 Royal Columbian Hospital – Phase 1 …………..………… 2020 219 40 259 250 - - 9 Royal Columbian Hospital – Phases 2 & 3 …….………… 2026 32 1,204 1,236 1,174 - - 62 Peace Arch Hospital Renewal ……………………………… 2022 25 59 84 8 - - 76
Health facilities continued on the next page
Rosalie Segal Family Health Centre 2 ……………………

Part 2 – Financial Review
42 | 2020 Financial and Economic Review – September 2020
Table 2.7 Capital Expenditure Projects Greater Than $50 million 1Project Estimated Anticipated Project Financing
Year of Cost to Cost to Total Internal/ P3 Federal Other($ millions) Completion Mar. 31, 2020 Complete Cost Borrowing Liability Gov't Contrib'ns
Health facilities continuedCentre for Mental Health and Addictions ………………… 2021 59 72 131 131 - - - Dogwood Complex Residential Care ………..…………… 2022 4 54 58 - - - 58 Lions Gate Hospital – New Acute Care Facility …………… 2024 2 253 255 89 - - 166 St Paul's Hospital …………………………………………… 2026 8 2,075 2,083 1,158 - - 925 Mills Memorial Hospital …………………………………….. 2026 2 445 447 337 - - 110 Burnaby Hospital Redevelopment - Phase 1 5…………… 2025 2 545 547 513 - - 34 Cariboo Memorial Hospital ………………………………… 2026 - 218 218 131 - - 87 Stuart Lake Hospital…...................................................... 2024 - 116 116 98 - - 18 Clinical and systems transformation 6 …………………… 2023 452 28 480 480 - - - iHealth Project – Vancouver Island Health
Authority 6…………………………………...……………. 2020 98 2 100 - - - 100
Total health facilities ……………………………………… 3,014 5,609 8,623 5,235 801 - 2,587 Transportation
Highway 91 Alex Fraser Bridge Capacity Improvements 2…………………………..………………… 2019 65 5 70 37 - 33 -
Highway 97 Stone Creek to Williams Road 2 …………… 2019 56 - 56 56 - - - Highway 97 Williams Lake Indian Reserve to
Lexington Road 2 …………………………..……………… 2019 56 1 57 57 - - - Highway 1 widening and 216th Street
Interchange …………………………..…………………… 2020 50 12 62 28 - 22 12 Highway 1 – Admirals Road/McKenzie Avenue
Interchange ………………………………………………… 2020 88 8 96 63 - 33 - Highway 7 Corridor improvements ………………………… 2020 55 15 70 48 - 22 - Highway 99 10-Mile Slide …………………………………… 2020 28 32 60 60 - - - Highway 1 Lower Lynn Corridor
improvements ……………………………..……………… 2021 141 57 198 77 - 66 55 Highway 1 Illecillewaet 4-laning and Brake Check
improvements ……………………………..……………… 2022 19 66 85 69 - 16 - Highway 14 Corridor improvements ……………………... 2022 11 75 86 56 - 30 - West Fraser Road Realignment …................................... 2023 3 100 103 103 - - - Highway 1 Chase 4-laning 7 ……………………. 2023 25 235 260 248 - 12 - Highway 91 to Highway 17 and Deltaport Way
Corridor improvements ………………………………….. 2023 60 200 260 87 - 82 91 Highway 1 Salmon Arm West 7……………………………… 2023 41 144 185 154 - 31 - Highway 1 RW Bruhn Bridge ……………………………… 2023 15 210 225 134 - 91 - Pattullo Bridge Replacement 8……………………………… 2023 129 1,248 1,377 1,076 301 - - Highway 1 Quartz Creek Bridge Replacement…………… 2023 8 113 121 71 - 50 - Kootenay Lake ferry service upgrade……………………… 2023 2 53 55 38 - 17 - Highway 1 216th - 264th Street widening………………..… 2024 5 230 235 99 - 109 27 Highway 1 Kicking Horse Canyon Phase 4 9
……………… 2024 20 581 601 386 - 215 - Broadway Subway …………………………………………… 2025 67 2,760 2,827 1,830 - 897 100
Total transportation ………………………………………… 944 6,145 7,089 4,777 301 1,726 285
Other taxpayer-supportedAbbotsford courthouse
– Direct procurement ……………………………………… 2020 11 7 18 18 - - - – P3 contract ……………………………………………… 2020 109 25 134 48 80 - 6
Nanaimo Correctional Centre Replacement ……………… 2023 4 153 157 157 - - - Stanley New Fountain Hotel(Affordable Rental Housing)….......................................... 2022 13 50 63 20 - - 43 6585 Sussex Ave(Affordable Rental Housing)….......................................... 2022 14 61 75 43 - - 32 Clark & 1st Ave(Affordable Rental Housing)….......................................... 2023 3 106 109 75 - - 34
Total other ………………………………………………… 154 402 556 361 80 - 115
Total taxpayer-supported ................... 5,197 14,394 19,591 13,280 1,182 1,803 3,326
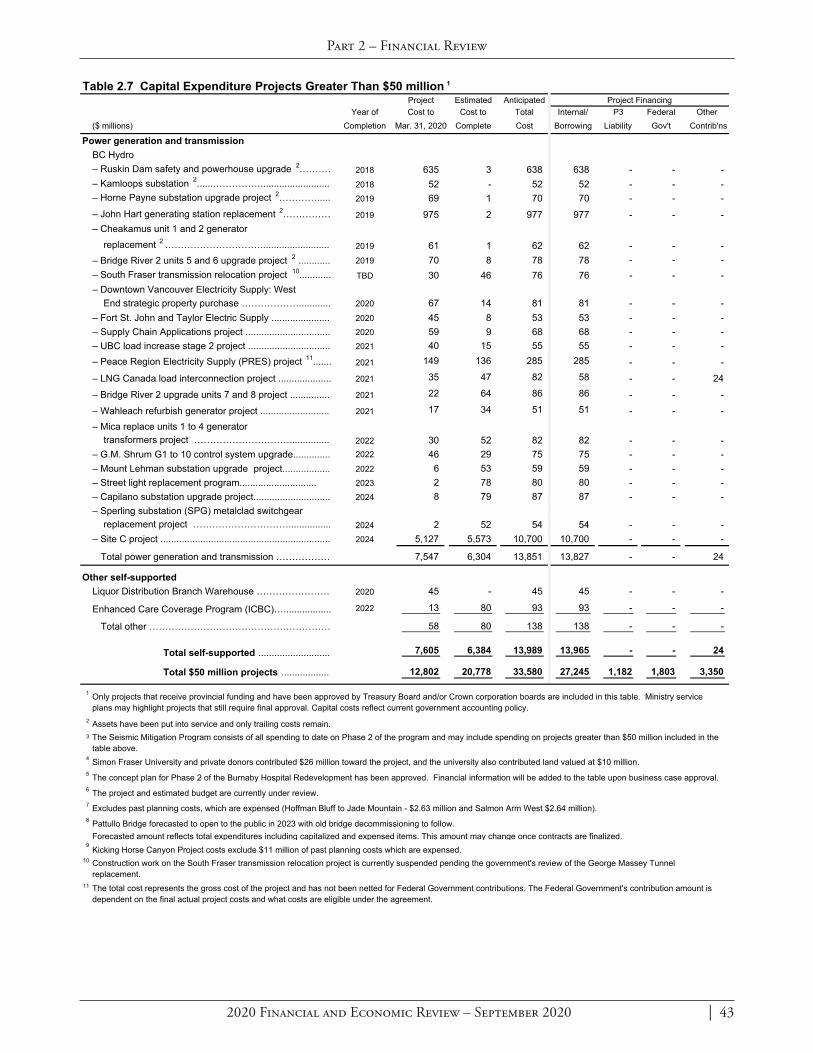
2020 Financial and Economic Review – September 2020 | 43
Part 2 – Financial Review
Table 2.7 Capital Expenditure Projects Greater Than $50 million 1Project Estimated Anticipated Project Financing
Year of Cost to Cost to Total Internal/ P3 Federal Other($ millions) Completion Mar. 31, 2020 Complete Cost Borrowing Liability Gov't Contrib'ns
Power generation and transmissionBC Hydro– Ruskin Dam safety and powerhouse upgrade 2.……… 2018 635 3 638 638 - - - – Kamloops substation 2......……………........................... 2018 52 - 52 52 - - - – Horne Payne substation upgrade project 2…………..... 2019 69 1 70 70 - - - – John Hart generating station replacement 2…………… 2019 975 2 977 977 - - - – Cheakamus unit 1 and 2 generator
replacement 2 …………………………........................... 2019 61 1 62 62 - - - – Bridge River 2 units 5 and 6 upgrade project 2 ............ 2019 70 8 78 78 - - - – South Fraser transmission relocation project 10............ TBD 30 46 76 76 - - - – Downtown Vancouver Electricity Supply: West
End strategic property purchase ………………............ 2020 67 14 81 81 - - - – Fort St. John and Taylor Electric Supply ....................... 2020 45 8 53 53 - - - – Supply Chain Applications project ................................ 2020 59 9 68 68 - - - – UBC load increase stage 2 project ............................... 2021 40 15 55 55 - - - – Peace Region Electricity Supply (PRES) project 11....... 2021 149 136 285 285 - - - – LNG Canada load interconnection project .................... 2021 35 47 82 58 - - 24 – Bridge River 2 upgrade units 7 and 8 project ................ 2021 22 64 86 86 - - - – Wahleach refurbish generator project ........................... 2021 17 34 51 51 - - - – Mica replace units 1 to 4 generator
transformers project …………………………................ 2022 30 52 82 82 - - - – G.M. Shrum G1 to 10 control system upgrade.............. 2022 46 29 75 75 - - - – Mount Lehman substation upgrade project.................. 2022 6 53 59 59 - - - – Street light replacement program............................. 2023 2 78 80 80 - - - – Capilano substation upgrade project............................. 2024 8 79 87 87 - - - – Sperling substation (SPG) metalclad switchgear
replacement project …………………………................ 2024 2 52 54 54 - - - – Site C project ................................................................ 2024 5,127 5,573 10,700 10,700 - - -
Total power generation and transmission ……………… 7,547 6,304 13,851 13,827 - - 24
Other self-supportedLiquor Distribution Branch Warehouse …………………… 2020 45 - 45 45 - - -
Enhanced Care Coverage Program (ICBC)….................. 2022 13 80 93 93 - - -
Total other ………………………………………………… 58 80 138 138 - - -
Total self-supported ........................... 7,605 6,384 13,989 13,965 - - 24
Total $50 million projects ................... 12,802 20,778 33,580 27,245 1,182 1,803 3,350
1
2
3
4 Simon Fraser University and private donors contributed $26 million toward the project, and the university also contributed land valued at $10 million.5 The concept plan for Phase 2 of the Burnaby Hospital Redevelopment has been approved. Financial information will be added to the table upon business case approval.6 The project and estimated budget are currently under review.7 Excludes past planning costs, which are expensed (Hoffman Bluff to Jade Mountain - $2.63 million and Salmon Arm West $2.64 million).8 Pattullo Bridge forecasted to open to the public in 2023 with old bridge decommissioning to follow.
Forecasted amount reflects total expenditures including capitalized and expensed items. This amount may change once contracts are finalized. 9 Kicking Horse Canyon Project costs exclude $11 million of past planning costs which are expensed.
10
11 The total cost represents the gross cost of the project and has not been netted for Federal Government contributions. The Federal Government's contribution amount is dependent on the final actual project costs and what costs are eligible under the agreement.
Only projects that receive provincial funding and have been approved by Treasury Board and/or Crown corporation boards are included in this table. Ministry service plans may highlight projects that still require final approval. Capital costs reflect current government accounting policy.
Assets have been put into service and only trailing costs remain.
Construction work on the South Fraser transmission relocation project is currently suspended pending the government's review of the George Massey Tunnel replacement.
The Seismic Mitigation Program consists of all spending to date on Phase 2 of the program and may include spending on projects greater than $50 million included in the table above.

Part 2 – Financial Review
44 | 2020 Financial and Economic Review – September 2020
Provincial Debt
As at March 31, 2020, total provincial debt totalled $72.2 billion — 23.6 per cent of B.C.’s nominal GDP. The driver for borrowing is capital spending, with almost all debt incurred to finance infrastructure. About 36 per cent of the total debt is self-supported through the activities of commercial Crown corporations.
The taxpayer-supported debt-to-GDP ratio, a measure often used by investors and credit rating agencies to analyze a government’s ability to manage its debt load, stood at 15.1 per cent. This is higher by 0.7 percentage points from 2018/19 and is practically unchanged from Budget 2019. British Columbia’s taxpayer-supported debt-to-GDP is one of the lowest in Canada, translating into a strong credit rating and lower debt servicing costs. The debt-to-revenue ratio stood at 80.6 per cent, 0.9 percentage points lower than Budget 2019 and an increase of 5.6 percentage points from 2018/19.
Debt for schools, post-secondary institutions and health facilities was largely incurred by government to issue capital grants to SUCH sector organizations for funding their infrastructure. Highways and public transit debt primarily reflects direct borrowing by government-controlled agencies, such as the BC Transportation Financing Authority. Power generation and transmission debt is entirely commercial in nature and is predominantly the debt of BC Hydro. A portion of this debt reflects borrowing for the Columbia Basin power projects managed by Columbia Power Corporation and Columbia Basin Trust.
Table 2.8 Provincial Debt Summary 1
Opening Balance
Adjustment 2
Updated Budget 2019
Taxpayer-supported debtEducation facilities ………………………………… 14,228 (162) 14,066 15,445 14,274 Health facilities ……………………………………… 7,918 (22) 7,896 8,507 7,968 Highways and public transit ……………………… 18,947 (330) 18,617 17,659 16,767 Other ………………………………………………… 5,291 (762) 4,529 4,618 3,672
Total other taxpayer-supported debt …………… 46,384 (1,276) 45,108 46,229 42,681 Total taxpayer-supported debt ……………………… 46,384 (1,276) 45,108 46,229 42,681
Self-supported debtPower generation and transmission .................... 25,053 (111) 24,942 24,901 22,763 Other ………………………………………………… 611 (67) 544 1,031 518
Total self-supported debt …………………………… 25,664 (178) 25,486 25,932 23,281
Forecast allowance …………………………………… 500 - 500 - - Total provincial debt ………………………………… 72,548 (1,454) 71,094 72,161 65,962
Debt to GDPTaxpayer-supported ............................................ 15.0% 14.7% 3 15.1% 14.4%Total .................................................................... 23.5% 23.2% 3 23.6% 22.3%
1
2
3
The opening balance adjustment reflects actual balances at March 31, 2019 (the Budget 2019 projection was based on a forecast for 2018/19).Revised to reflect Statistics Canada's Provincial Economic Accounts update released on November 7, 2019.
Provincial debt is prepared in accordance with Generally Accepted Accounting Principles and presented consistent with the Debt Summary Report included in the Public Accounts . Debt is shown net of sinking funds and unamortized discounts, excludes accrued interest, and includes non-guaranteed debt directly incurred by commercial Crown corporations and debt guaranteed by the Province.
Actual 2018/19
Actual 2019/20 ($ millions)
Budget2019

2020 Financial and Economic Review – September 2020 | 45
Part 2 – Financial Review
Other debt includes taxpayer-supported borrowing to finance social housing, the reconstruction of the BC Place stadium roof, and other government borrowing for direct capital projects such as courthouses. Other debt also includes the self-supported borrowing of the BC Lottery Corporation for gaming equipment and gaming management software, the debt of post-secondary institutions’ commercial subsidiaries, and lease liabilities related to right-of-use3 assets.
Chart 2.8 Changes in Ending Debt Level from Updated Budget 2019Chart 2.8 Change in ending debt level from Updated Budget 2019
71,094
1,095
1,095
(1,568)
499
(53) 112387 (500)
72,161
Operatingresults and
forecastallowance
Changes incash and
other workingcapital
balances
Lowercapital
spending
Lowerexternalcapitalfunding
Operatingcash flows
Higher capitalspending
Leaseliabilities forright-of-use
assets
Forecastallowance
$ millions Total debt higher than budget by $1,067 millionTaxpayer-supported:
$1,121 million increaseSelf-supported:
$446 million increase
Updated Budget
2019
2019/20Public
Accounts
Chart 2.7 Components of Total Provincial Debt – 2019/20Chart 2.7 – Components of total provincial debt – 2019/20
21.4%
11.8%
24.5%
7.8%
34.5%
Total: $72,161 million
Education facilities
Health facilities
Highways & public transit
Other
Per Cent of Total
Power generation & transmission
3 In 2019/20 all commercial Crown corporations implemented IFRS 16 Leases. Due to the change in accounting standards, lease liabilities related to right-of-use assets are included as debt.

Part 2 – Financial Review
46 | 2020 Financial and Economic Review – September 2020
Total debt was higher by $1.1 billion at year-end compared to the updated Budget 2019 forecast (see Chart 2.8).
The variance consists of:• $1.1 billion higher taxpayer-supported debt, primarily due to lower operating results
of $1.1 billion excluding the forecast allowance, changes in cash and other working capital balances of $1.1 billion, and $0.5 billion lower external capital funding offset by $1.6 billion lower capital spending;
• $446 million increase in self-supported debt primarily due to $387 million for implementing accounting standards for lease liabilities related to right-of-use assets which are now included as debt, and $112 million in higher capital spending, partially offset by $53 million of higher operating cash flows; and
• $500 million forecast allowance.
Surplus/Deficit Versus Change In Debt
For the 2019/20 fiscal year, government posted a deficit of $321 million, and the non-cash items were $2.3 billion (primarily amortization and the adjustment for commercial Crown corporations net income and dividends). Working capital balances increased by $802 million, including higher cash balances at year end to ensure liquidity during the COVID-19 pandemic. Taxpayer-supported capital spending was $4.8 billion. As a result, taxpayer-supported debt increased by $3.5 billion during the fiscal year.
The $2.7 billion increase in self-supported debt primarily reflects $4.4 billion capital spending (mainly for BC Hydro and BCLC, which is financed through the fiscal agency loan program), offset by $1.7 billion in net operating cash flows.
Chart 2.9 Reconciliation of Surplus/Deficit to Change In DebtChart 2.9 Reconciliation of Surplus/Deficit to Change In Debt
65,962 321
(2,347)802
4,772
(1,735)
4,386
72,161
Debtas at
March 31,2019
2019/20operating
deficit
Non-cash items(eg. amortization
& commercialcrown losses)
Changes in cashand other
working capitalbalances
Taxpayersupported capital
spending
Netoperating
cashflows
Commercialcrowncapital
spending
Debtas at
March 31,2020
$ millions
Year over year increase in debt: $6,199 million
Taxpayer-supported debt: $3,548 million increase
Self-supported debt:$2,651 million increase
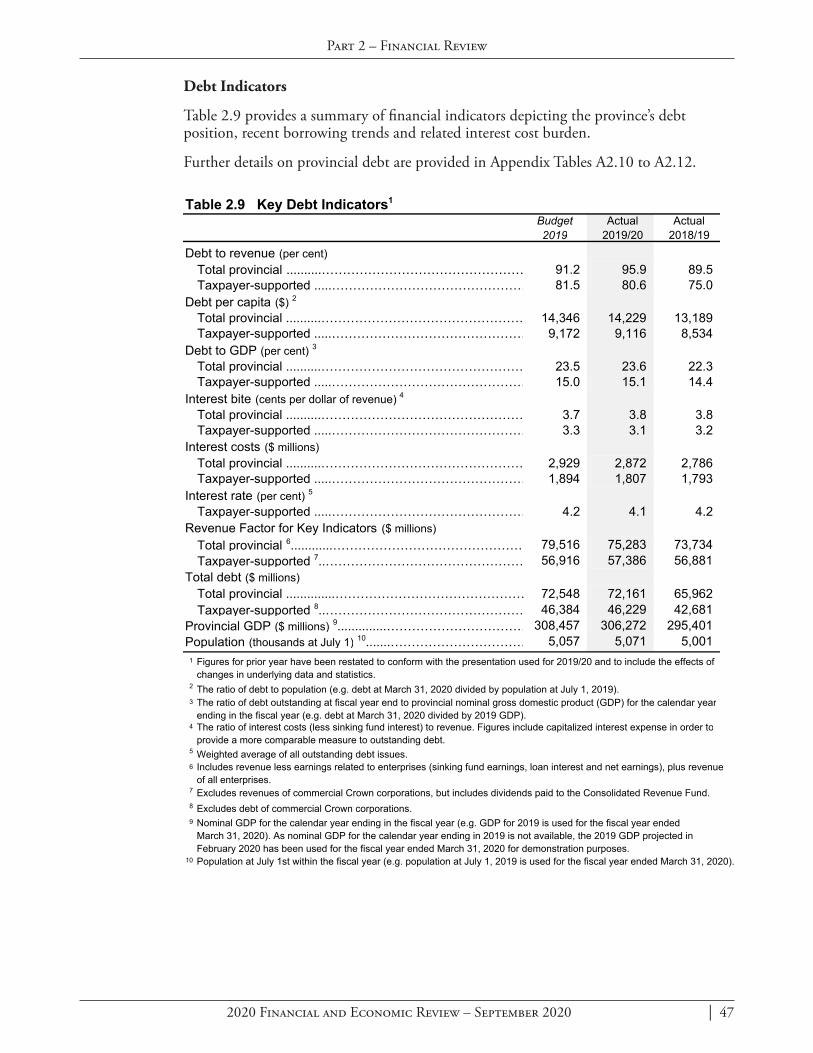
2020 Financial and Economic Review – September 2020 | 47
Part 2 – Financial Review
Debt Indicators
Table 2.9 provides a summary of financial indicators depicting the province’s debt position, recent borrowing trends and related interest cost burden.
Further details on provincial debt are provided in Appendix Tables A2.10 to A2.12.
Table 2.9 Key Debt Indicators1
Budget 2019
Actual 2019/20
Actual 2018/19
Debt to revenue (per cent)Total provincial ..........………………………………………… 91.2 95.9 89.5Taxpayer-supported .....………………………………………… 81.5 80.6 75.0
Debt per capita ($) 2
Total provincial ..........………………………………………… 14,346 14,229 13,189Taxpayer-supported .....………………………………………… 9,172 9,116 8,534
Debt to GDP (per cent) 3
Total provincial ..........………………………………………… 23.5 23.6 22.3Taxpayer-supported .....………………………………………… 15.0 15.1 14.4
Interest bite (cents per dollar of revenue) 4
Total provincial ..........………………………………………… 3.7 3.8 3.8Taxpayer-supported .....………………………………………… 3.3 3.1 3.2
Interest costs ($ millions)Total provincial ..........………………………………………… 2,929 2,872 2,786Taxpayer-supported .....………………………………………… 1,894 1,807 1,793
Interest rate (per cent) 5
Taxpayer-supported .....………………………………………… 4.2 4.1 4.2 Revenue Factor for Key Indicators ($ millions)
Total provincial 6............……………………………………… 79,516 75,283 73,734Taxpayer-supported 7..………………………………………… 56,916 57,386 56,881
Total debt ($ millions)Total provincial ..............……………………………………… 72,548 72,161 65,962Taxpayer-supported 8..………………………………………… 46,384 46,229 42,681
Provincial GDP ($ millions) 9..............…………………………… 308,457 306,272 295,401Population (thousands at July 1) 10.......…………………………… 5,057 5,071 5,001
1
2 The ratio of debt to population (e.g. debt at March 31, 2020 divided by population at July 1, 2019).3
4
5 Weighted average of all outstanding debt issues.6
7
8
9
10
Nominal GDP for the calendar year ending in the fiscal year (e.g. GDP for 2019 is used for the fiscal year ended March 31, 2020). As nominal GDP for the calendar year ending in 2019 is not available, the 2019 GDP projected in February 2020 has been used for the fiscal year ended March 31, 2020 for demonstration purposes.Population at July 1st within the fiscal year (e.g. population at July 1, 2019 is used for the fiscal year ended March 31, 2020).
Figures for prior year have been restated to conform with the presentation used for 2019/20 and to include the effects of changes in underlying data and statistics.
The ratio of debt outstanding at fiscal year end to provincial nominal gross domestic product (GDP) for the calendar yearending in the fiscal year (e.g. debt at March 31, 2020 divided by 2019 GDP). The ratio of interest costs (less sinking fund interest) to revenue. Figures include capitalized interest expense in order toprovide a more comparable measure to outstanding debt.
Includes revenue less earnings related to enterprises (sinking fund earnings, loan interest and net earnings), plus revenueof all enterprises.Excludes revenues of commercial Crown corporations, but includes dividends paid to the Consolidated Revenue Fund.Excludes debt of commercial Crown corporations.
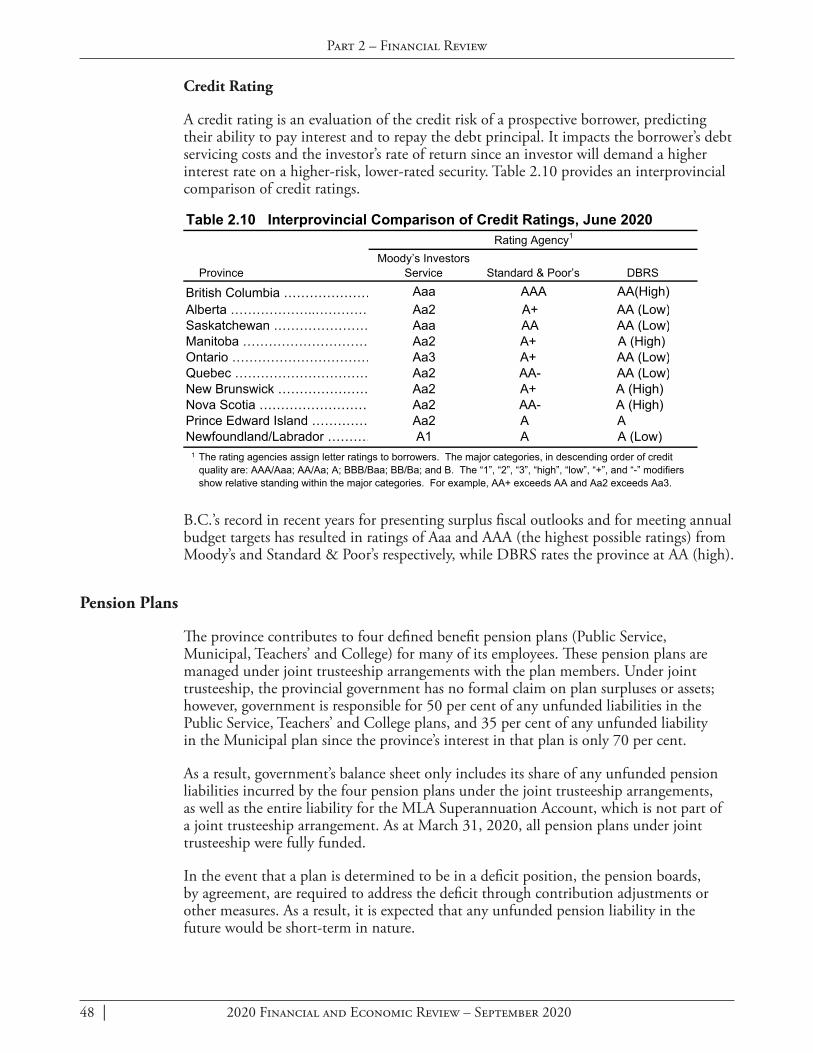
Part 2 – Financial Review
48 | 2020 Financial and Economic Review – September 2020
Credit Rating
A credit rating is an evaluation of the credit risk of a prospective borrower, predicting their ability to pay interest and to repay the debt principal. It impacts the borrower’s debt servicing costs and the investor’s rate of return since an investor will demand a higher interest rate on a higher-risk, lower-rated security. Table 2.10 provides an interprovincial comparison of credit ratings.
B.C.’s record in recent years for presenting surplus fiscal outlooks and for meeting annual budget targets has resulted in ratings of Aaa and AAA (the highest possible ratings) from Moody’s and Standard & Poor’s respectively, while DBRS rates the province at AA (high).
Pension Plans
The province contributes to four defined benefit pension plans (Public Service, Municipal, Teachers’ and College) for many of its employees. These pension plans are managed under joint trusteeship arrangements with the plan members. Under joint trusteeship, the provincial government has no formal claim on plan surpluses or assets; however, government is responsible for 50 per cent of any unfunded liabilities in the Public Service, Teachers’ and College plans, and 35 per cent of any unfunded liability in the Municipal plan since the province’s interest in that plan is only 70 per cent.
As a result, government’s balance sheet only includes its share of any unfunded pension liabilities incurred by the four pension plans under the joint trusteeship arrangements, as well as the entire liability for the MLA Superannuation Account, which is not part of a joint trusteeship arrangement. As at March 31, 2020, all pension plans under joint trusteeship were fully funded.
In the event that a plan is determined to be in a deficit position, the pension boards, by agreement, are required to address the deficit through contribution adjustments or other measures. As a result, it is expected that any unfunded pension liability in the future would be short-term in nature.
Rating Agency1
British Columbia ………………… Aaa AAA AA(High)Alberta ………………..………… Aa2 A+ AA (Low)Saskatchewan …………………… Aaa AA AA (Low)Manitoba ………………………… Aa2 A+ A (High) Ontario …………………………… Aa3 A+ AA (Low)Quebec …………………………… Aa2 AA- AA (Low)New Brunswick ………………… Aa2 A+ A (High) Nova Scotia ……………………… Aa2 AA- A (High) Prince Edward Island …………… Aa2 A A Newfoundland/Labrador ………… A1 A A (Low)
1
Table 2.10 Interprovincial Comparison of Credit Ratings, June 2020
The rating agencies assign letter ratings to borrowers. The major categories, in descending order of credit quality are: AAA/Aaa; AA/Aa; A; BBB/Baa; BB/Ba; and B. The “1”, “2”, “3”, “high”, “low”, “+”, and “-” modifiers show relative standing within the major categories. For example, AA+ exceeds AA and Aa2 exceeds Aa3.
Moody’s Investors Service Standard & Poor’s DBRSProvince

2020 Financial and Economic Review – September 2020 | 49
Part 2 – Financial Review
The pension valuations do not include future indexing of pensions, as this is a non-guaranteed supplemental benefit to the plans that is determined by the amount of available assets in separate inflation accounts. The estimated financial positions of each plan (based on extrapolations of the most recent actuarial valuations) as at March 31, 2020 are shown in Table 2.11.
Actuarial valuations are performed on the pension plans every three years with the resulting reports released nine months after the valuation date. The pension plans and the dates of their last actuarial valuation are:• Public Service Pension Plan, March 31, 2017;• Municipal Pension Plan, December 31, 2018;• Teachers’ Pension Plan, December 31, 2017; and• College Pension Plan, August 31, 2018.
Key actuarial assumptions used for valuation purposes include a long-term annual rate of return on fund assets (currently 6.00 per cent for the Teachers’ Pension Plan and 6.25 per cent for the other three plans) and the rate of annual salary increases (currently 3.50 per cent).
The pension plans are administered by the BC Pension Corporation in accordance with direction received from the various pension boards. The audited financial statements of each pension plan, along with full descriptions, benefit formulas, inflation assumptions and funding polices may be found on the corporation’s website at www.pensionsbc.ca.
Contractual Rights
Contractual rights represent the annual nominal future cash receipts for multi-year contracts. As at March 31, 2020, taxpayer-supported entities have $10.0 billion in contractual rights, and self-supported Crown corporations and subsidiaries have $6.2 billion in contractual rights, for a total of $16.1 billion in contract receipts over the future years, depending on the terms of the contract.
Contractual rights represent future receipts where the projected revenue has been quantified in an agreement. They are not off-balance sheet assets, nor are they deferred revenues.
Total
($ millions) Public Service Municipal Teachers' 1 College Other 2 2019/20 2018/19
Accrued benefit obligation ……………… (21,122) (29,030) (21,547) (3,970) (767) (76,436) (72,120) Pension fund assets …………….....….. 23,343 32,973 23,105 4,431 896 84,748 78,693
Subtotal ……………………………… 2,221 3,943 1,558 461 129 8,312 6,573 Unamortized actuarial (gain) loss ……… (158) (2,209) (1,436) (314) (43) (4,160) (3,337) Accrued net asset (obligation) ……… 2,063 1,734 122 147 86 4,152 3,236
1
2
Table 2.11 Pension Plan Balances
The government is responsible for 50 per cent of the unfunded pension liability incurred under the Teachers' Pension Plan and has accrued this liability in its 2019/20 accounts. The liability will be settled in future periods through increased employer contributions.Represents other defined benefit plans, outside of the four main pension plans, which are funded by entities within the government reporting entity. Includes the Retirement Plan for Non-Teaching Employees of the Board of School Trustees of School District No. 43 (Coquitlam), the University of Victoria's pension plan for employees other than faculty and professional staff, Simon Fraser University's Academic Pension Plan and Administrative/Union Pension Plan, and the province's 14.67% interest in the Canadian Blood Services pension plan.
Pension Plan

Part 2 – Financial Review
50 | 2020 Financial and Economic Review – September 2020
Contractual Obligations
Contractual obligations represent the annual nominal future cash payments for multi-year contracts for the delivery of services and construction of assets — except in the case of P3 contracts, where the obligations related to construction of assets are recognized as liabilities as the assets are constructed.
As at March 31, 2020, taxpayer-supported entities have incurred $42.4 billion in contractual obligations, and self-supported Crown corporations and subsidiaries have incurred $52.2 billion in contractual obligations, for a total of $94.6 billion in contract payments that will be made over the future years, depending on the terms of the contract.
Contractual obligations represent ongoing program costs where the projected expense has been quantified in an agreement. They are not off-balance sheet debt, nor are they unfunded costs. Rather, these annual costs have been incorporated into the overall program budgets of the contracting ministries and other entities similar to other future-oriented government program costs such as legislated entitlements and capital asset amortization. In the case of self-supported Crown corporations and subsidiaries, the payments will be made from future revenue streams.
The 2019/20 Public Accounts Contractual Obligations schedule presents a detailed listing of obligations by function. Taxpayer-supported contractual obligations can also be grouped into eight categories (see Table 2.12) as follows:• Coastal ferry services agreement – annual operating subsidy provided by the Ministry
of Transportation and Infrastructure to BC Ferry Services Inc. in support of its smaller routes.
• Capital construction and maintenance P3s – reflect the annual service payments that will be made to maintain the asset and retire the liabilities.
• Provincial policing contracts – annual operating cost of the policing contract with the RCMP (aside from major cities such as Vancouver, which have their own police forces, policing in British Columbia is provided by the RCMP under contract).
• Housing subsidy agreements – annual operating cost of the subsidy agreements between BC Housing Management Commission and cooperative subsidized housing associations.
Table 2.12 Taxpayer-Supported Contractual Obligations
($ millions) 2020/21 2021/22 2022/23 2023/24 2024/25 2025/26+ Total
Coastal ferry services agreement ............................. 231 231 231 231 231 8,782 9,937 Capital construction and maintenance P3s .............. 366 381 350 365 269 3,860 5,591 Provincial policing contracts ..................................... 381 384 384 384 385 2,670 4,588 Housing subsidy agreements ................................... 484 318 244 199 169 4,213 5,627 Program delivery agreements ................................... 1,917 332 271 222 214 1,700 4,656 Operating and maintenance agreements ................. 820 668 559 499 453 1,167 4,166 Service delivery agreements .................................... 699 520 508 507 455 2,374 5,063 Capital and economic development agreements ..... 1,462 624 235 71 45 347 2,784
6,360 3,458 2,782 2,478 2,221 25,113 42,412
2020 Financial and Economic Review – September 2020 | 51
Part 2 – Financial Review
• Program delivery agreements – annual operating cost of agreements with third-party entities that provide services to the public on behalf of government, such as care homes. Some agreements are for one year only.
• Operating and maintenance agreements – annual operating cost of agreements with third-party entities that operate and maintain government infrastructure on behalf of government. A majority of these agreements relate to health sector facilities.
• Service delivery agreements – annual operating cost of agreements with third-party entities that provide services directly to government, such as the Telecommunications Service Master Agreement with Telus.
• Capital and economic development agreements – annual cost of agreements to build infrastructure, such as school district, universities, and British Columbia Transportation Financing Authority’s commitments for future projects.
Almost all (92 per cent or $52.2 billion) of the contractual obligations for self-supported Crown corporations and subsidiaries are for BC Hydro power purchase agreements with independent power producers (IPPs). This ongoing cost of energy is factored into BC Hydro’s financial statement projections in the fiscal plan, although any contractual increases to the tariffs paid to the IPPs will have to be recovered from future electricity rate increases.
The remaining contractual obligations for self-supported Crown corporations and subsidiaries relate to maintenance and service agreements, whose costs also are factored into government fiscal plan projections.
Subsequent Events
COVID-19 Global Pandemic
On March 18, 2020, the Government of British Columbia declared a state of emergency in response to the COVID-19 global pandemic that continued to be in force at the time the 2019/20 Public Accounts were completed. To minimize the transmission of the virus, the Provincial Health Officer issued orders directed to all British Columbians and organizations operating in the province. Some actions taken will have an impact on future financial statements.
On March 23, 2020, the Legislative Assembly authorized $5 billion in government spending for fiscal 2020/21 through Supplementary Estimates to support the pandemic response and economic recovery. The future financial impacts of the pandemic on the province can not be determined at this time.

Part 2 – Financial Review
52 | 2020 Financial and Economic Review – September 2020
2019/20 Public Accounts Audit Qualification
The Audit Opinion on the 2019/20 Public Accounts includes one qualification on the longstanding issue on the recognition of restricted contributions.
Deferral of Revenues
The Auditor General recommends reporting restricted contributions as revenue in the period the transfers are received, unless the transfer establishes a financial liability on the part of the recipient. The government has maintained its longstanding recognition of deferring restricted contributions and recognizing revenue in the same period that programs and services are provided to the public. Under the Auditor General’s approach to restricted contributions, liabilities would have been reduced by $5.7 billion and current year revenue and surplus would have been increased by $5.7 billion.
The full text of the Auditor General’s opinion and the comments of the Comptroller General of British Columbia can be found in the 2019/20 Public Accounts.

2020 Financial and Economic Review – September 2020
Part 3 Supplementary Information
– General Description of the Province – Constitutional Framework – Provincial Government – Annual Financial Cycle – Government’s Financial Statements – Provincial Taxes

This page intentionally left blank

2020 Financial and Economic Review – September 2020 | 55
Part 3 – Supplementary Information
General Description of the Province
British Columbia is located on Canada’s Pacific coast, and has a land and freshwater area of 95 million hectares. It is Canada’s third largest province and comprises 9.5 per cent of the country’s total land area.
Geography
The province is nearly four times the size of Great Britain, 2.5 times larger than Japan and larger than any American state except Alaska. B.C.’s 7,022-kilometre coastline supports a large shipping industry through ice-free, deep-water ports. The province has about 8.5 million hectares of grazing land, 1.8 million hectares of lakes and rivers, and 950,000 hectares of agricultural land that is capable of supporting a wide range of crops.
Physiography
B.C. is characterized by mountainous topography, but also has substantial areas of lowland and plateau country. The province has four basic regions, a northwesterly trending mountain system on the coast, a similar mountain system on the east, and an extensive area of plateau country between the two. The northeastern corner of the province is lowland, a segment of the continent’s Great Plains.
The western system of mountains averages about 300 kilometres in width and extends along the entire B.C. coast and the Alaska panhandle. The Coast Mountains contain some of the tallest peaks in the province. The western system includes the Insular Mountains that form the basis of Vancouver Island and Haida Gwaii (previously known as the Queen Charlotte Islands). These islands help to shelter the waters off the mainland coast of B.C., which form an important transportation route for people and products.
The Interior of the province is a plateau of rolling forest and grassland, 600 to 1,200 metres in average elevation, incised deeply by rivers. North of Prince George the interior becomes mountainous, but plateau terrain returns just south of the Yukon boundary in the area drained by the Liard River. The southern Interior’s water system is dominated by the Fraser River, which has a drainage area covering about one-quarter of the province. The Rocky Mountains, in the eastern mountain system, rise abruptly on the southern B.C.-Alberta boundary and are cut by passes that provide dramatic overland transportation routes into the province. The Rocky Mountain Trench lies immediately to the west of the Rockies. This extensive valley, the longest in North America, is a geological fault zone separating different earth plates. It is the source of many of B.C.’s major rivers, including the Peace, Columbia and Fraser.
Climate and Vegetation
Coastal B.C. has abundant rainfall and mild temperatures associated with a maritime climate. The Pacific coast has an average annual rainfall of between 155 and 440 centimetres, while the more sheltered coasts of eastern Vancouver Island and the mainland along the Strait of Georgia average between 65 and 150 centimetres. Canada’s longest frost-free periods of over 180 days per year are enjoyed along the edges of the coastal zone and inland along the Fraser River valley. Temperatures fall quickly up the steep slopes of the Coast Mountains. The predominant trees in this coastal region are the western hemlock, western red cedar and balsam in the wetter parts, and Douglas fir and grand fir in the drier areas.

Part 3 – Supplementary Information
56 | 2020 Financial and Economic Review – September 2020
B.C.’s Interior region has a mainly continental type of climate, although not as severe as that of the Canadian Prairies. Considerable variation in climate occurs, especially in winter and across the Coast Mountains, as mild Pacific storms bring relief from cold spells. The southern Interior has the driest and warmest climate of the province. In the valleys, annual precipitation ranges from less than 30 centimetres to 50 centimetres, while daily temperatures can average over 20°C in July and just under freezing in January. The climate becomes more extreme further north and precipitation increases. The frost-free period in the North is short and variable. Spruce and lodgepole pine are the dominant trees of commercial value in the Interior.
The northeast region of the province is an extension of the western prairie region of Alberta. It has a continental climate that is more extreme than that of the northern interior region. However, it does have long hot summers and a frost-free period long enough to grow grain, forage and other crops.
Population
B.C. is the third largest province in terms of population, which was estimated at 5.071 million people, accounting for 13.5 per cent of Canada’s population on July 1, 2019. B.C.’s population grew at an average annual rate of 1.4 per cent between 2009 and 2019, slightly higher than the growth rate of the overall Canadian population for the same period.
The Vancouver census metropolitan area, a major Canadian shipping, manufacturing and services centre, had the largest urban population in B.C. with 2,691,351 persons in 2019. Meanwhile, the census metropolitan area for Victoria, the provincial capital, had a population of 402,271 persons in 2019.
Constitutional Framework
The structure of the British Columbia government is based on British parliamentary tradition and precedent. Prior to 1866, B.C. was composed of two British-controlled colonies — the Colony of Vancouver Island was established in 1849, and the Colony of British Columbia was established in 1858 on the mainland. In the Union Proclamation of 1866, the two colonies were joined to form the single united Crown Colony of British Columbia. On July 20, 1871, B.C. entered into Confederation with Canada. Although the Colony of Vancouver Island had a parliamentary form of government as far back as 1856, the first fully elected government was not instituted in B.C. until the autumn after Confederation with Canada. Responsible government was achieved in late 1872, when the lieutenant governor acquiesced to an executive council that was responsible to the legislative assembly.
Upon entering Confederation, B.C. came under the authority of the British North America Act, 1867 (BNA Act), a statute of the British parliament. Until 1982, the BNA Act defined the major national institutions and established the division of authority between the federal and provincial governments. In 1982, the British Parliament ended its legal right to legislate for Canada with the passage of the Canada Act, 1982 and its companion legislation, the Constitution Act, 1982, which also includes the Canadian Charter of Rights and Freedoms. The BNA Act was renamed the Constitution Act, 1867, which continues to be the foundation for the division of legislative powers between Canada, as a federal state, and provincial governments.

2020 Financial and Economic Review – September 2020 | 57
Part 3 – Supplementary Information
Indigenous Peoples
British Columbia is home to more than 270,000 Indigenous1 people, representing one in six Indigenous people in Canada. There are 203 First Nations in B.C. (of 600 in Canada), and they represent 34 distinct languages. At more than 89,000, the Métis population in B.C. is the fourth-largest in Canada.
Each Indigenous community has a unique history and experience and different ways of life, social organization, governance systems, and approaches to economic development.
As the original occupants of the land, Indigenous peoples have a special constitutional relationship with the Crown. This relationship, including existing Aboriginal2 and treaty rights, is recognized and affirmed in section 35 of the Constitution Act, 1982, and includes recognizing that Indigenous self-government is part of Canada’s evolving system of cooperative federalism and distinct orders of government.
Provincial Government
B.C.’s government is modeled after the British system. Functionally there are three main branches: the legislature, the executive and the judiciary.
Legislature
Legislative powers in British Columbia are exercised by a single legislative chamber, which is elected for a term of four years. B.C. was the first jurisdiction in Canada to establish set general election dates, in 2001. Provincial general elections are scheduled to take place on the third Saturday in October every four years.
The legislature consists of the lieutenant governor and 87 elected members of the legislative assembly. The legislative assembly represents the people of B.C. in the conduct of the province’s affairs. The assembly is required by law to meet at least once a year with a normal session lasting several months. However, special sessions can last just a few days or many months, depending on the nature of the government’s business.
The legislature operates on a fixed schedule — the second Tuesday in February each year is usually reserved for the Throne Speech and the fourth Tuesday in February each year is reserved for the Budget Speech.
Executive
The executive is composed of the lieutenant governor and the executive council. The executive council, or cabinet, is headed by the premier and is composed of selected members of the ruling party. The lieutenant governor, the Queen’s representative in British Columbia, holds a largely ceremonial place in the modern provincial government. By constitutional custom, the lieutenant governor is appointed by the Governor General of Canada for a term usually lasting five years.
Following a general election, the lieutenant governor calls upon the leader of the political party with the majority of elected members to serve as premier and to form the provincial government.
1 The term ‘Indigenous’ includes all people of Indigenous ancestry, including First Nations (status and non-status), Métis and Inuit.2 The federal Constitution Act recognizes the Aboriginal peoples of Canada as the Indian, Inuit and Métis peoples of Canada; however, First Nations is the
generally preferred term for Indian peoples of Canada, and Indigenous is preferred to Aboriginal.

Part 3 – Supplementary Information
58 | 2020 Financial and Economic Review – September 2020
Where the general election does not result in a single political party having the majority of elected members, a minority government may be formed by the party that is able to form a coalition or enter into a confidence and supply agreement with another party, to ensure it has the majority required for all confidence motions and budgetary legislation. A minority government was most recently formed in British Columbia following the 2017 general election.
The lieutenant governor, on the advice of the premier, appoints members of the executive council and is guided by the executive council’s advice as long as it holds the confidence of the legislative assembly.
The lieutenant governor, on recommendation of the premier, convenes, prorogues and dissolves the legislative assembly and gives Royal Assent to all measures and bills passed by the assembly before they become law.
Ministers are the executives responsible for government ministries, and are usually members of cabinet. Cabinet determines government policy and is held responsible by the legislative assembly for the operation of the provincial government.
Deputy ministers are the senior civil servants in their ministries and have responsibility for all operational matters including budget, human resources and program development. Deputy ministers are required to manage a complex set of multiple accountabilities which arise out of various powers, authorities and responsibilities attached to the position. The deputy minister is the principal source of support for a minister in fulfilling his or her collective and individual responsibilities and respecting his or her accountability. In providing this support, the deputy minister is responsible for: • sound public service advice on policy development and implementation, both within
the minister’s portfolio and with respect to the government’s overall policy and legislative agenda;
• effective ministry management, as well as advice on management of the minister’s entire portfolio; and
• fulfillment of authorities that have been assigned to the deputy minister or other officials either by the minister directly or by virtue of legislation.
Judiciary
The judiciary performs functions that are central to the orderly operation of society. Judges hear and give judgment in criminal prosecutions and in actions arising from disputes between private citizens or between the government and private citizens. Judges apply both judge-made law, known as ‘‘common law,’’ and laws made by the Parliament of Canada and provincial legislatures. The judiciary is sometimes called on to determine whether laws passed by governments conform to the values expressed in the Canadian Charter of Rights and Freedoms.
B.C.’s judicial system is made up of the Provincial Court of British Columbia, the Supreme Court of British Columbia and the Court of Appeal of British Columbia. The Provincial Court hears cases that fall into five main categories: criminal cases, family cases, youth court cases, small claims, and traffic & bylaw cases. The provincial government appoints Provincial Court judges, and the federal government appoints Court of Appeal and Supreme Court judges.

2020 Financial and Economic Review – September 2020 | 59
Part 3 – Supplementary Information
The federal judicial system includes the Tax Court of Canada, the Federal Court of Canada (Appeals division and Trial division) and the Supreme Court of Canada. The Federal Court of Canada hears cases in limited areas of exclusively federal jurisdiction — for example, reviewing decisions made by federal tribunals such as the Canada Labour Relations Board. The Supreme Court of Canada is the court of final resort and hears selected appeals from the Federal Court of Appeal and provincial Courts of Appeal.
Provincial Government Jurisdiction
Under Canada’s constitutional framework, B.C. has ownership and jurisdiction over natural resources and is responsible for education, health and social services, municipal institutions, property and civil rights, the administration of justice and other matters of purely provincial or local concern.
Annual Financial Cycle
British Columbia’s Budget Transparency and Accountability Act (BTAA) outlines the Province’s reporting requirements during the financial cycle and imposes specific reporting deadlines or release dates for these publications. In particular, fixed dates for presentation of the budget, as well as dates for quarterly and annual reports, are set by law.
Under the BTAA, the provincial government focuses its budgeting and reporting on a summary accounts basis. The BTAA requirements include reporting on the advice of the Economic Forecast Council; presentation of the annual Estimates, Budget and Fiscal Plan, Quarterly Reports, and Public Accounts; publication of Quarterly Reports with revised forecasts; annual three-year service plans and service plan reports for each ministry and government organization; and an annual three-year government strategic plan and report.
Chart 3.1 summarizes the annual financial process of the Province. This process consists of four main stages.
Planning and Budget Preparation
Treasury Board, a committee of the executive council, reviews longer-term estimates of revenue, expense, capital and debt, and establishes a preliminary fiscal plan within the framework of the government’s overall strategic plan. Ministries, service delivery agencies, and Crown corporations prepare three-year service plans, including performance measures and targets, and operating and capital budgets, for review by government. Treasury Board makes recommendations to Cabinet on budget allocations for ministries and agencies, and assesses commercial Crown corporation net income benchmarks, within the context of the fiscal plan. Included as inputs into this process are a consultation paper published by September 15th that invites public comment on issues for consideration as government develops its fiscal and service plans, and provincewide public hearings held by a committee of the legislature. A report outlining the results of the budget consultation process is made public by November 15th of each year.
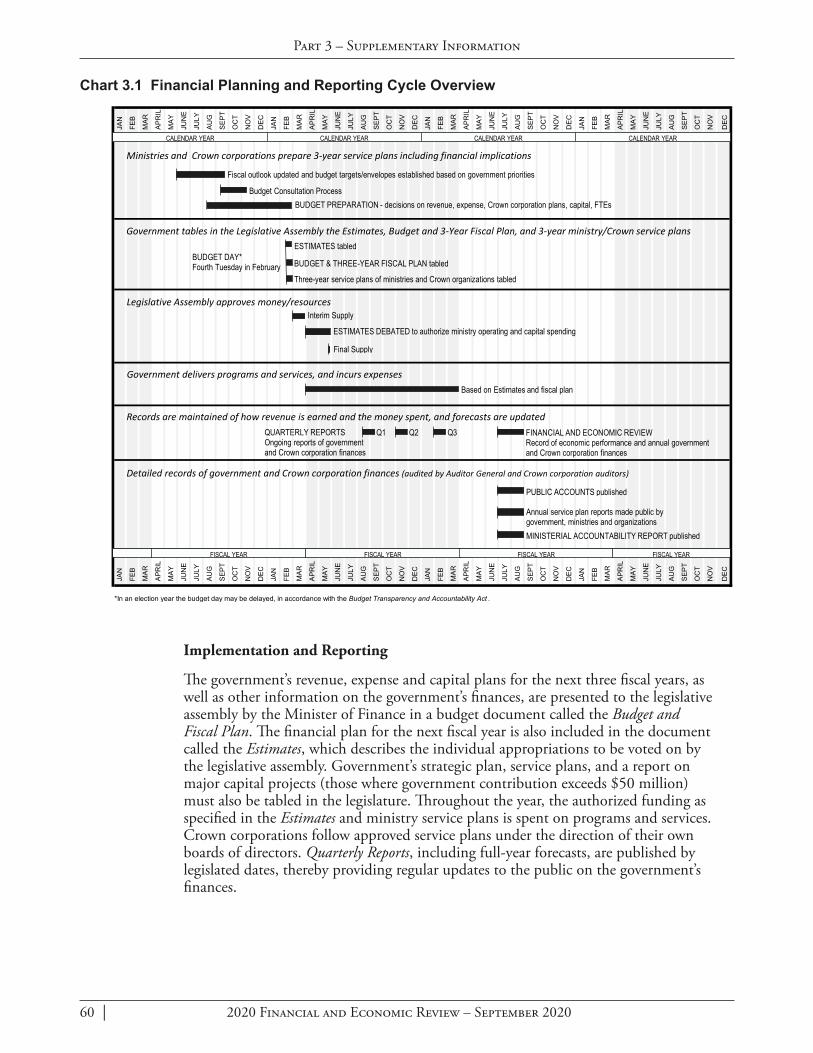
Part 3 – Supplementary Information
60 | 2020 Financial and Economic Review – September 2020
Implementation and Reporting
The government’s revenue, expense and capital plans for the next three fiscal years, as well as other information on the government’s finances, are presented to the legislative assembly by the Minister of Finance in a budget document called the Budget and Fiscal Plan. The financial plan for the next fiscal year is also included in the document called the Estimates, which describes the individual appropriations to be voted on by the legislative assembly. Government’s strategic plan, service plans, and a report on major capital projects (those where government contribution exceeds $50 million) must also be tabled in the legislature. Throughout the year, the authorized funding as specified in the Estimates and ministry service plans is spent on programs and services. Crown corporations follow approved service plans under the direction of their own boards of directors. Quarterly Reports, including full-year forecasts, are published by legislated dates, thereby providing regular updates to the public on the government’s finances.
JAN
FEB
MAR
APR
IL
MAY
JUN
E
JULY
AUG
SEPT
OC
T
NO
V
DEC
JAN
FEB
MAR
APR
IL
MAY
JUN
E
JULY
AUG
SEPT
OC
T
NO
V
DEC
JAN
FEB
MAR
APR
IL
MAY
JUN
E
JULY
AUG
SEPT
OC
T
NO
V
DEC
JAN
FEB
MAR
APR
IL
MAY
JUN
E
JULY
AUG
SEPT
OC
T
NO
V
DEC
JAN
FEB
MAR
APR
IL
MAY
JUN
E
JULY
AUG
SEPT
OC
T
NO
V
DEC
JAN
FEB
MAR
APR
IL
MAY
JUN
E
JULY
AUG
SEPT
OC
T
NO
V
DEC
JAN
FEB
MAR
APR
IL
MAY
JUN
E
JULY
AUG
SEPT
OC
T
NO
V
DEC
JAN
FEB
MAR
APR
IL
MAY
JUN
E
JULY
AUG
SEPT
OC
T
NO
V
DEC
*In an election year the budget day may be delayed, in accordance with the Budget Transparency and Accountability Act .
BUDGET PREPARATION - decisions on revenue, expense, Crown corporation plans, capital, FTEs
Fiscal outlook updated and budget targets/envelopes established based on government priorities
Interim Supply
CALENDAR YEAR CALENDAR YEAR CALENDAR YEAR CALENDAR YEAR
FISCAL YEAR FISCAL YEAR FISCAL YEAR FISCAL YEAR
Based on Estimates and fiscal plan
FINANCIAL AND ECONOMIC REVIEWRecord of economic performance and annual government and Crown corporation finances
PUBLIC ACCOUNTS published
Annual service plan reports made public by government, ministries and organizations
Three-year service plans of ministries and Crown organizations tabled
ESTIMATES DEBATED to authorize ministry operating and capital spending
Final Supply
Budget Consultation Process
BUDGET & THREE-YEAR FISCAL PLAN tabled
ESTIMATES tabled
MINISTERIAL ACCOUNTABILITY REPORT published
Government delivers programs and services, and incurs expenses
Ministries and Crown corporations prepare 3-year service plans including financial implications
Government tables in the Legislative Assembly the Estimates, Budget and 3-Year Fiscal Plan, and 3-year ministry/Crown service plans
Legislative Assembly approves money/resources
Records are maintained of how revenue is earned and the money spent, and forecasts are updated
Detailed records of government and Crown corporation finances (audited by Auditor General and Crown corporation auditors)
QUARTERLY REPORTSOngoing reports of government and Crown corporation finances
Q1 Q2 Q3
BUDGET DAY*Fourth Tuesday in February
Chart 3.1 Financial Planning and Reporting Cycle Overview

2020 Financial and Economic Review – September 2020 | 61
Part 3 – Supplementary Information
Evaluation
At the end of the fiscal year, the Public Accounts are prepared by the Office of the Comptroller General and examined by the Auditor General to ensure that the financial statements fairly present the government’s financial position. The Public Accounts are augmented by the British Columbia Financial and Economic Review, which provides an overview of annual and historical financial and economic results. In addition, annual service plan reports are made public that compare actual results with ministry and Crown corporation performance targets.
Accountability
The Public Accounts are presented to the legislative assembly and are reviewed by two committees of the legislative assembly (the Select Standing Committee on Public Accounts, and the Select Standing Committee on Crown Corporations). At the same time, the Ministerial Accountability Report is published detailing the individual and collective financial performance of cabinet ministers, and the performance achieved by the Ministers of State on non-financial targets.
Government’s Financial Statements
Government Reporting Entity
The provincial government conducts its activities through:• ministries;• the SUCH sector (school districts, universities, colleges, institutes, and health
organizations); • other taxpayer-supported service delivery agencies; and• commercial Crown corporations.
The accounts relating to the ministries and other direct activities of government are contained in the Consolidated Revenue Fund (CRF), whose financial results are reported as a separate entity in the Public Accounts. The CRF comprises all money over which the legislature has direct power of appropriation. The operations of public sector organizations, including the SUCH sector entities, service delivery agencies, and Crown corporations, are recorded in their own financial statements, which are subject to audit by the Auditor General or by private-sector auditors.
The relationships between the legislature and government’s public sector organizations are guided by legislation, governance agreements, and/or mandate letters to ensure effective oversight, alignment with government’s priorities, and preservation of public confidence in the management of public-sector programs and services for the citizens of British Columbia.
The Province consolidates the financial results of all these entities into a single set of financial statements, published annually in the Public Accounts.
Part 3 – Supplementary Information
62 | 2020 Financial and Economic Review – September 2020
Compliance with GAAP
British Columbia’s Budget Transparency and Accountability Act (BTAA) requires government’s financial statements to conform to generally accepted accounting principles (GAAP) for senior governments in Canada. In practice this means compliance with the Public Sector Accounting Standards (PSAS), which are set by the Canadian Public Sector Accounting Board (PSAB).
Under PSAS, service delivery agencies are consolidated with the CRF on a line-by-line basis. Commercial Crown corporations3 (government business enterprises) and commercial subsidiaries owned by service delivery agencies are consolidated on a modified equity basis — i.e. their net income is reported as revenue of the Province and their retained earnings as an investment.
Where the accounting policies of service delivery agencies differ from those used by the central government, the service delivery agency financial statements are adjusted to conform to government’s accounting policies. No adjustments for accounting differences are made for commercial Crown corporations, which prepare their statements in accordance with International Financial Reporting Standards (IFRS).
The BTAA authorizes Treasury Board to adopt different standards than those promoted by PSAB in order to ensure that British Columbia’s financial reporting reflects the policy framework within which the Crown corporations and agencies operate. Any alternative standard adopted by Treasury Board must come from other areas of Canadian GAAP or from a recognized standard setting body in another jurisdiction (e.g. the US Financial Accounting Standards Board). Treasury Board has issued one such regulation, mandating BC Hydro to follow the US FASB standard for rate-regulated accounting.
The full text of government’s significant accounting policies can be found in Note 1 to the Consolidated Summary Financial Statements in the 2018/19 Public Accounts.
3 Crown corporations are considered commercial if the majority of their operating revenue comes from non-government sources, and their operating revenue is sufficient to cover operating and debt service costs without the need for government grants or other forms of assistance. Otherwise they are included with the service delivery agencies.
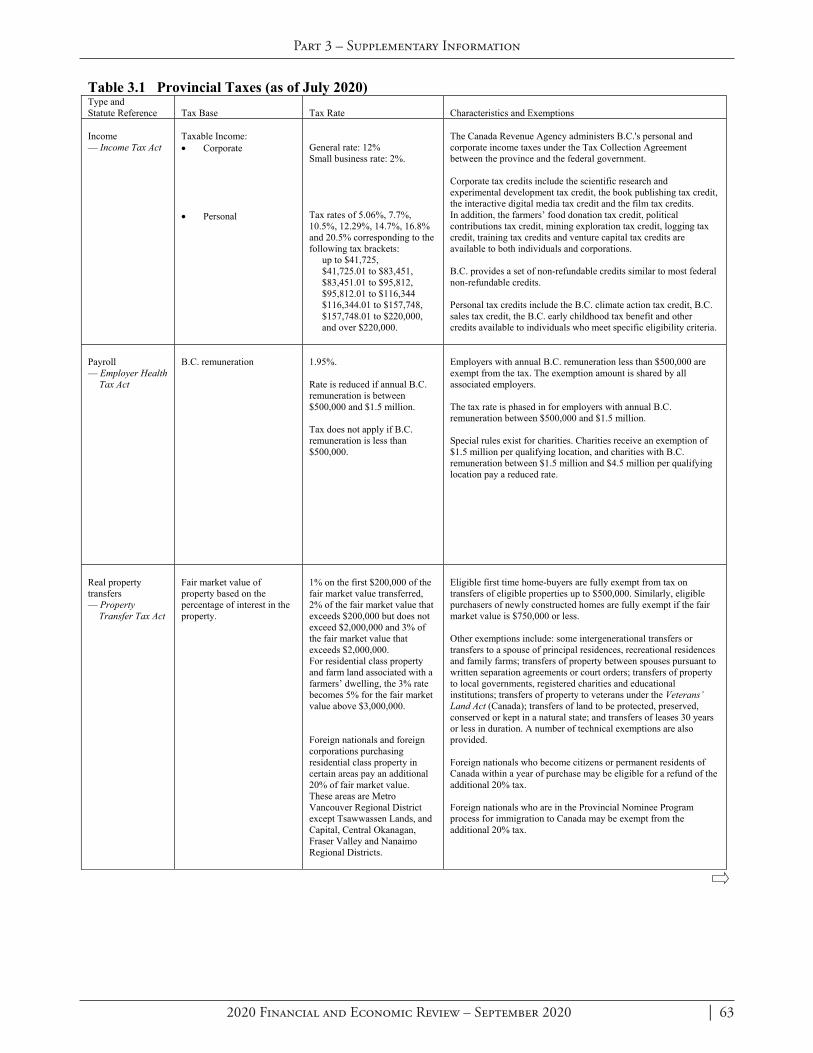
2020 Financial and Economic Review – September 2020 | 63
Part 3 – Supplementary Information
Table 3.1 Provincial Taxes (as of July 2020) Type and Statute Reference
Tax Base
Tax Rate
Characteristics and Exemptions
Income — Income Tax Act
Taxable Income: • Corporate • Personal
General rate: 12% Small business rate: 2%. Tax rates of 5.06%, 7.7%, 10.5%, 12.29%, 14.7%, 16.8% and 20.5% corresponding to the following tax brackets:
up to $41,725, $41,725.01 to $83,451, $83,451.01 to $95,812, $95,812.01 to $116,344 $116,344.01 to $157,748, $157,748.01 to $220,000, and over $220,000.
The Canada Revenue Agency administers B.C.'s personal and corporate income taxes under the Tax Collection Agreement between the province and the federal government. Corporate tax credits include the scientific research and experimental development tax credit, the book publishing tax credit, the interactive digital media tax credit and the film tax credits. In addition, the farmers’ food donation tax credit, political contributions tax credit, mining exploration tax credit, logging tax credit, training tax credits and venture capital tax credits are available to both individuals and corporations. B.C. provides a set of non-refundable credits similar to most federal non-refundable credits. Personal tax credits include the B.C. climate action tax credit, B.C. sales tax credit, the B.C. early childhood tax benefit and other credits available to individuals who meet specific eligibility criteria.
Payroll — Employer Health
Tax Act
B.C. remuneration
1.95%. Rate is reduced if annual B.C. remuneration is between $500,000 and $1.5 million. Tax does not apply if B.C. remuneration is less than $500,000.
Employers with annual B.C. remuneration less than $500,000 are exempt from the tax. The exemption amount is shared by all associated employers. The tax rate is phased in for employers with annual B.C. remuneration between $500,000 and $1.5 million. Special rules exist for charities. Charities receive an exemption of $1.5 million per qualifying location, and charities with B.C. remuneration between $1.5 million and $4.5 million per qualifying location pay a reduced rate.
Real property transfers — Property
Transfer Tax Act
Fair market value of property based on the percentage of interest in the property.
1% on the first $200,000 of the fair market value transferred, 2% of the fair market value that exceeds $200,000 but does not exceed $2,000,000 and 3% of the fair market value that exceeds $2,000,000. For residential class property and farm land associated with a farmers’ dwelling, the 3% rate becomes 5% for the fair market value above $3,000,000. Foreign nationals and foreign corporations purchasing residential class property in certain areas pay an additional 20% of fair market value. These areas are Metro Vancouver Regional District except Tsawwassen Lands, and Capital, Central Okanagan, Fraser Valley and Nanaimo Regional Districts.
Eligible first time home-buyers are fully exempt from tax on transfers of eligible properties up to $500,000. Similarly, eligible purchasers of newly constructed homes are fully exempt if the fair market value is $750,000 or less. Other exemptions include: some intergenerational transfers or transfers to a spouse of principal residences, recreational residences and family farms; transfers of property between spouses pursuant to written separation agreements or court orders; transfers of property to local governments, registered charities and educational institutions; transfers of property to veterans under the Veterans’ Land Act (Canada); transfers of land to be protected, preserved, conserved or kept in a natural state; and transfers of leases 30 years or less in duration. A number of technical exemptions are also provided. Foreign nationals who become citizens or permanent residents of Canada within a year of purchase may be eligible for a refund of the additional 20% tax. Foreign nationals who are in the Provincial Nominee Program process for immigration to Canada may be exempt from the additional 20% tax.

Part 3 – Supplementary Information
64 | 2020 Financial and Economic Review – September 2020
Table 3.1 Provincial Taxes (as of July 2020) – Continued Type and Statute Reference
Tax Base
Tax Rate
Characteristics and Exemptions
Retail sales tax — Provincial Sales
Tax Act
Purchase and lease of tangible personal property. Purchase of software, accommodation, related services, telecommunication services and legal services. Gifts of vehicles, boats and aircraft.
General rate: 7% Liquor: 10% Vapour products: 20% Accommodation: 8% Vehicles: 7% to 20% Boats and aircraft: 7% or 12% Manufactured buildings: reduced rate of tax.
Paid by purchasers and lessees and primarily collected through businesses required to be registered under the Act. Major consumer exemptions include, but are not limited to: • food for human consumption
(all food including prepared food), • residential energy, • children’s clothing and footwear (child-sized clothing and
adult-sized clothing for children under 15 years of age), • basic cable and residential land-line telephone services, and • vitamins, drugs and household medical aids. Major business exemptions include, but are not limited to: • goods acquired solely for re-sale or re-lease, • goods purchased to be incorporated into goods for sale or lease, • certain production machinery and equipment purchased by
major industries (manufacturers, logging, mining, oil and gas) for qualifying activities at qualifying locations, and
• electricity.
Tobacco — Tobacco Tax Act
By cigarette, cigar retail price, and weight on other tobacco products.
29.5 cents per cigarette or tobacco stick and 39.5 cents per gram of loose tobacco; 90.5% of taxable price on cigars to a maximum tax of $7 per cigar.
Tax is payable on tobacco by purchasers at the time of retail purchase. Tobacco is subject to a security scheme. Security is payable by wholesale dealers registered under the Act when tobacco is delivered to them.
Carbon dioxide equivalent emissions from combustion of fuels and combustibles — Carbon Tax Act
Purchase, use, or, in certain circumstances, transfer or importation of: • Aviation Fuel • Gasoline • Heavy Fuel Oil • Jet Fuel • Kerosene • Light Fuel Oil • Methanol
(not produced from biomass)
• Naphtha • Butane • Coke Oven Gas • Ethane • Propane • Natural Gas • Refinery Gas • High Heat Value Coal • Low Heat Value Coal • Coke • Petroleum Coke • Gas Liquids • Pentanes Plus • Also combustion of
peat and tires (whole or shredded) to produce heat or energy (combustibles).
Tax rates vary by type of fuel or combustible based on carbon dioxide equivalent emitted by each fuel or combustible. Tax rates are equivalent to $40 per tonne of carbon dioxide equivalent.
Tax is payable on fuels by purchasers at the time of retail purchase. Fuels, other than natural gas, are subject to a security scheme similar to the security scheme under the Motor Fuel Tax Act. Security is payable by collectors registered under the Act when fuel is sold in British Columbia for the first time after manufacture or importation. Tax on the purchase of natural gas is collected and remitted at the retail level. Tax on use, transfer and import is self-assessed. Tax on the burning of combustibles is self-assessed. Exemptions include: • fuels which are exported for use outside of British Columbia, • fuel used for certain non-energy purposes, • fuel used for eligible inter-jurisdictional transportation, • coloured gasoline and coloured diesel purchased by farmers
solely for listed farm purposes, and • minor exemptions similar to exemptions in other consumption
tax acts for administrative and technical reasons. Tax rates were scheduled to reach $45 per tonne of carbon dioxide equivalent on April 1, 2020 but are temporarily held at $40 per tonne under the COVID-19 Action Plan. This pause also temporarily relieves additional forms of combustible waste, added in Budget 2020, from carbon tax.

2020 Financial and Economic Review – September 2020 | 65
Part 3 – Supplementary Information
Table 3.1 Provincial Taxes (as of July 2020) – Continued Type and Statute Reference
Tax Base
Tax Rate
Characteristics and Exemptions
Motor fuel — Motor Fuel Tax
Act
Purchase, use, or in certain circumstances, transfer or importation of fuels:
Tax generally applies to all fuels purchased for use, or used in internal combustion engines. Tax is payable on fuels by purchasers at the time of retail purchase. Most fuels are subject to a security scheme similar to the security scheme under the Carbon Tax Act. Security is payable by collectors registered under the Act when fuel is sold in British Columbia for the first time after manufacture or importation. The additional tax collected in the South Coast BC Transportation Service Region, on behalf of TransLink, helps fund regional transportation costs. The additional tax collected in the Victoria Regional Transit Service Area, on behalf of BC Transit, helps fund the public transit system.
• Clear gasoline
General rate: 14.5 cents per litre (includes 6.75 cents per litre collected on behalf of the BC Transportation Financing Authority). South Coast BC Transportation Service Region: 27 cents per litre (includes 6.75 cents per litre collected on behalf of the BC Transportation Financing Authority and 18.5 cents per litre collected on behalf of TransLink). Victoria Regional Transit Service Area: 20 cents per litre (includes 6.75 cents per litre collected on behalf of the BC Transportation Financing Authority and 5.5 cents per litre collected on behalf of BC Transit).
• Motive fuel
General rate: 15 cents per litre (includes 6.75 cents per litre collected on behalf of the BC Transportation Financing Authority). South Coast BC Transportation Service Region: 27.5 cents per litre (includes 6.75 cents per litre collected on behalf of the BC Transportation Financing Authority and 18.5 cents per litre collected on behalf of TransLink). Victoria Regional Transit Service Area: 20.5 cents per litre (includes 6.75 cents per litre collected on behalf of the BC Transportation Financing Authority and 5.5 cents per litre collected on behalf of BC Transit).
Tax applies to diesel fuel but does not include alternative motor fuels or coloured fuels.
• Alternative motor fuels (natural gas, hydrogen and methanol (M85+))
Exempt. Natural gas, when used as a motor fuel, is exempt from tax. Certain hydrogen is exempt from tax. Fuels comprised of at least 85% methanol are also exempt from tax.

Part 3 – Supplementary Information
66 | 2020 Financial and Economic Review – September 2020
Table 3.1 Provincial Taxes (as of July 2020) – Continued Type and Statute Reference
Tax Base
Tax Rate
Characteristics and Exemptions
Motor fuel — Motor Fuel
Tax Act (continued)
• Coloured fuel, marine
diesel fuel
3 cents per litre.
Coloured fuel may be used in all vehicles not licensed to operate on a highway and in specific industrial vehicles. Farmers are exempt from paying the tax when fuel is used solely for listed farm purposes. Farm trucks are allowed to use tax-exempt coloured fuel for farming purposes on a highway. Marine diesel fuel used in interjurisdictional cruise ships and ships prohibited from coasting trade under the Coasting Trade Act is exempt from tax.
• Locomotive fuel
3 cents per litre. Tax applies to fuel specifically for use in locomotives.
• Propane • Aviation fuel • Jet fuel
2.7 cents per litre. 2 cents per litre. 2 cents per litre.
Propane tax applies to all uses of propane. There are exemptions for propane used as residential energy in a residential dwelling, for propane used by qualifying farmers solely for a farm purpose, and for small containers of propane. Aviation fuel tax applies to fuel produced specifically for use in a non-turbine aircraft engine. Jet fuel tax applies to fuel produced specifically for use in a turbine aircraft engine. Jet fuel used for international flights is exempt.
• Natural gas used in stationary engines, other than listed below.
1.1 cents per 810.32 litres.
• Natural gas used in
pipeline compressors to transmit marketable gas.
• Natural gas used in
pipeline compressors to extract and transmit raw gas from wells to processing plants.
• Natural gas used in
compressors to re-inject sour gas into depleted wells.
1.9 cents per 810.32 litres. Exempt. Exempt.
• Marine bunker fuel • Marine gas oil
Exempt. Exempt.
Exemption applies to bunker fuel used as fuel in a ship. Exemption applies to marine gas oil when used in primary gas turbine engines to propel passenger and cargo vessels.
Natural resources — Logging Tax
Act
Net income from logging in B.C.
10% (fully recoverable against federal and provincial corporation and personal income tax).
Tax is calculated as net income from logging after deducting a processing allowance.
— Mineral Land
Tax Act
Assessed value of freehold mineral land and production areas.
Undesignated mineral land — $1.25 to $4.94 per hectare. Designated production areas — $4.94 per hectare.
Rates of tax set on sliding scale, dependent on size and designation of land. No tax is payable if the mineral land is less than 16.2 hectares, owned by a registered charity or if the administrator has classified the mineral lands as agricultural.
— Mineral Tax
Act
Cash flow from individual metal and coal mines (other than placer gold mines). Volume of production of limestone, dolomite, marble, shale, clay, volcanic ash, diatomaceous earth, sandstone, quartzite and dimension stone. Value of minerals sold by placer gold mines.
2% of net current proceeds (NCP). 13% of net revenue (NR). $0.15 per tonne removed from all quarries operated. 0.5% of value of minerals sold.
Tax calculated for each operator on a mine-by-mine basis. NCP tax paid on current operating cash flow until all current and capital costs, plus any investment allowance, are recovered. Then NR tax paid on cumulative cash flow. NCP tax creditable against NR tax. An operator may deduct 25,000 tonnes from the total number of tonnes removed from all quarries operated by that operator. However, the amount deducted from any one quarry by all operators of that quarry must not exceed 25,000 tonnes.

2020 Financial and Economic Review – September 2020 | 67
Part 3 – Supplementary Information
Table 3.1 Provincial Taxes (as of July 2020) – Continued Type and Statute Reference
Tax Base
Tax Rate
Characteristics and Exemptions
Insurance — Insurance
Premium Tax Act
B.C. premiums.
4.4% for vehicle and property insurance, 2% for life, sickness, personal accident and loss of salary and wages insurance, 4% for other insurance and 7% for all contracts with unlicensed insurers.
Exemptions: fraternal benefit societies; mutual corporations with 50% of income from farm or 100% from religious, educational or charitable institutions; marine, except pleasure craft; approved medical or hospitalization plans; professional liability insurance from the Law Society of B.C.; liability insurance with the Real Estate Errors and Omissions Insurance Corporation; and assessments for the Real Estate Special Compensation Fund.
Real property — Taxation
(Rural Area) Act
Assessed value of land and improvements in rural areas (outside municipalities). Assessment determined under the Assessment Act.
Rates are set annually expressed as $/$1000 of taxable assessed value. For residential properties the rates are set to increase average residential rural taxes by the rate of inflation. For non-residential property classes, the rates are set so that total non-residential rural tax revenues increase by inflation plus tax on new construction. Class Rate $/$1000 1 residential: 0.47 2 utilities: 3.83 3 supportive housing: 0.10 4 major industry: 6.77 5 light industry: 2.72 6 business and other: 2.72 7 managed forest land: 0.46 8 recreation/non-profit: 0.89 9 farm land: 0.55 In Peace River Regional District, tax rates are the same as above except 2 utilities: 4.20 4 major industry: 7.14 5 light industry: 3.09
Some exemptions apply under various statutes.
Basic residential class school property tax — School Act section 119 Additional school tax on homes over $3 million. — School Act section 120.1
Assessed value of class 1 residential land and improvements. Assessment determined under the Assessment Act. Assessed value of “dwelling property”. Tax began in 2019.
Rates are set annually to increase average residential taxes by the rate of inflation. The rates vary by school district. For 2020, rates range from about $0.87/$1000 to $4.5/$1000. Tax is 0.2% on the value of the dwelling property between $3,000,000 and $4,000,000 and 0.4% on the value above $4,000,000.
Basic rates are calculated using a formula to moderate effects of varying average assessments on school district taxes. Amendments to the School Act in 2002 allow the Minister of Finance to apply different tax rates within a school district. Tofino is the only municipality with a rate that differs from the rest of the school district. School districts may levy additional tax on residential class property if authorized by local referendum. None do. The Home Owner Grant Program and the Land Tax Deferment Program can reduce or postpone the tax liability for Canadian citizens and permanent residents of Canada who live in their own home as a principal residence. Dwelling property is most residential class property where there is between one and three dwelling units. Properties with four or more units, such as apartment buildings, are not taxed. Vacant land in residential class is taxed unless it is in the Agricultural Land Reserve.
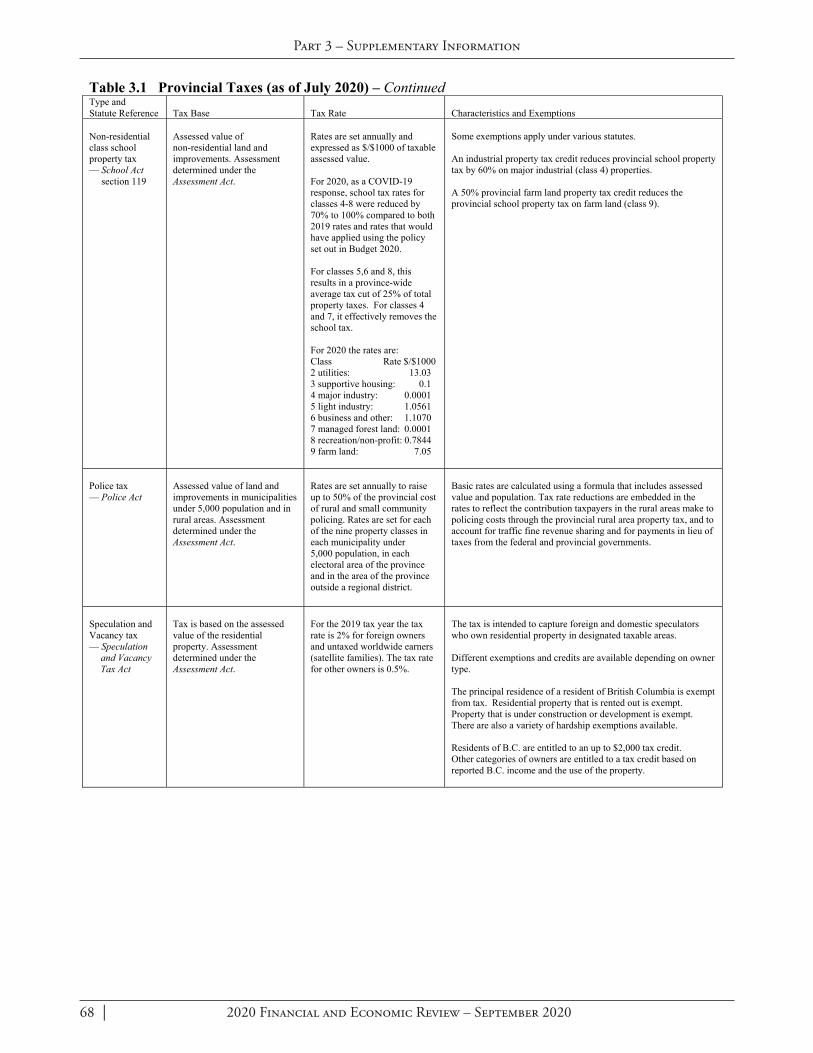
Part 3 – Supplementary Information
68 | 2020 Financial and Economic Review – September 2020
Table 3.1 Provincial Taxes (as of July 2020) – Continued Type and Statute Reference
Tax Base
Tax Rate
Characteristics and Exemptions
Non-residential class school property tax — School Act section 119
Assessed value of non-residential land and improvements. Assessment determined under the Assessment Act.
Rates are set annually and expressed as $/$1000 of taxable assessed value. For 2020, as a COVID-19 response, school tax rates for classes 4-8 were reduced by 70% to 100% compared to both 2019 rates and rates that would have applied using the policy set out in Budget 2020. For classes 5,6 and 8, this results in a province-wide average tax cut of 25% of total property taxes. For classes 4 and 7, it effectively removes the school tax. For 2020 the rates are: Class Rate $/$1000 2 utilities: 13.03 3 supportive housing: 0.1 4 major industry: 0.0001 5 light industry: 1.0561 6 business and other: 1.1070 7 managed forest land: 0.0001 8 recreation/non-profit: 0.7844 9 farm land: 7.05
Some exemptions apply under various statutes. An industrial property tax credit reduces provincial school property tax by 60% on major industrial (class 4) properties. A 50% provincial farm land property tax credit reduces the provincial school property tax on farm land (class 9).
Police tax — Police Act
Assessed value of land and improvements in municipalities under 5,000 population and in rural areas. Assessment determined under the Assessment Act.
Rates are set annually to raise up to 50% of the provincial cost of rural and small community policing. Rates are set for each of the nine property classes in each municipality under 5,000 population, in each electoral area of the province and in the area of the province outside a regional district.
Basic rates are calculated using a formula that includes assessed value and population. Tax rate reductions are embedded in the rates to reflect the contribution taxpayers in the rural areas make to policing costs through the provincial rural area property tax, and to account for traffic fine revenue sharing and for payments in lieu of taxes from the federal and provincial governments.
Speculation and Vacancy tax — Speculation
and Vacancy Tax Act
Tax is based on the assessed value of the residential property. Assessment determined under the Assessment Act.
For the 2019 tax year the tax rate is 2% for foreign owners and untaxed worldwide earners (satellite families). The tax rate for other owners is 0.5%.
The tax is intended to capture foreign and domestic speculators who own residential property in designated taxable areas. Different exemptions and credits are available depending on owner type. The principal residence of a resident of British Columbia is exempt from tax. Residential property that is rented out is exempt. Property that is under construction or development is exempt. There are also a variety of hardship exemptions available. Residents of B.C. are entitled to an up to $2,000 tax credit. Other categories of owners are entitled to a tax credit based on reported B.C. income and the use of the property.
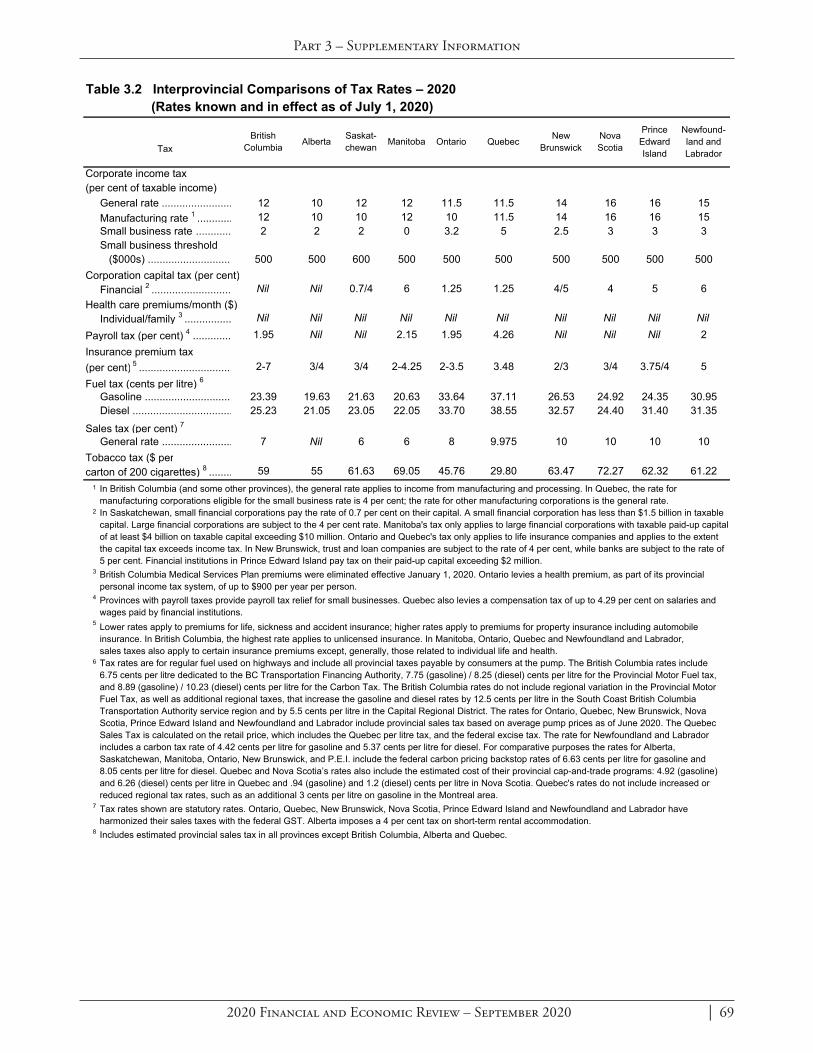
2020 Financial and Economic Review – September 2020 | 69
Part 3 – Supplementary Information
Table 3.2 Interprovincial Comparisons of Tax Rates – 2020 (Rates known and in effect as of July 1, 2020)
Corporate income tax (per cent of taxable income)
General rate ........................ 12 10 12 12 11.5 11.5 14 16 16 15Manufacturing rate 1 ............ 12 10 10 12 10 11.5 14 16 16 15Small business rate ............ 2 2 2 0 3.2 5 2.5 3 3 3Small business threshold ($000s) ............................. 500 500 600 500 500 500 500 500 500 500
Corporation capital tax (per cent)Financial 2 ........................... Nil Nil 0.7/4 6 1.25 1.25 4/5 4 5 6
Health care premiums/month ($)Individual/family 3 ................ Nil Nil Nil Nil Nil Nil Nil Nil Nil Nil
Payroll tax (per cent) 4 ............. 1.95 Nil Nil 2.15 1.95 4.26 Nil Nil Nil 2Insurance premium tax(per cent) 5 ................................ 2-7 3/4 3/4 2-4.25 2-3.5 3.48 2/3 3/4 3.75/4 5Fuel tax (cents per litre) 6
Gasoline .............................. 23.39 19.63 21.63 20.63 33.64 37.11 26.53 24.92 24.35 30.95Diesel .................................. 25.23 21.05 23.05 22.05 33.70 38.55 32.57 24.40 31.40 31.35
Sales tax (per cent) 7
General rate ........................ 7 Nil 6 6 8 9.975 10 10 10 10Tobacco tax ($ percarton of 200 cigarettes) 8 ........ 59 55 61.63 69.05 45.76 29.80 63.47 72.27 62.32 61.22
1
2
3
4
5
6
7
8
Ontario Quebec New Brunswick
Includes estimated provincial sales tax in all provinces except British Columbia, Alberta and Quebec.
TaxNova Scotia
Newfound-land and Labrador
Prince Edward Island
Tax rates are for regular fuel used on highways and include all provincial taxes payable by consumers at the pump. The British Columbia rates include 6.75 cents per litre dedicated to the BC Transportation Financing Authority, 7.75 (gasoline) / 8.25 (diesel) cents per litre for the Provincial Motor Fuel tax, and 8.89 (gasoline) / 10.23 (diesel) cents per litre for the Carbon Tax. The British Columbia rates do not include regional variation in the Provincial Motor Fuel Tax, as well as additional regional taxes, that increase the gasoline and diesel rates by 12.5 cents per litre in the South Coast British Columbia Transportation Authority service region and by 5.5 cents per litre in the Capital Regional District. The rates for Ontario, Quebec, New Brunswick, Nova Scotia, Prince Edward Island and Newfoundland and Labrador include provincial sales tax based on average pump prices as of June 2020. The Quebec Sales Tax is calculated on the retail price, which includes the Quebec per litre tax, and the federal excise tax. The rate for Newfoundland and Labrador includes a carbon tax rate of 4.42 cents per litre for gasoline and 5.37 cents per litre for diesel. For comparative purposes the rates for Alberta, Saskatchewan, Manitoba, Ontario, New Brunswick, and P.E.I. include the federal carbon pricing backstop rates of 6.63 cents per litre for gasoline and 8.05 cents per litre for diesel. Quebec and Nova Scotia’s rates also include the estimated cost of their provincial cap-and-trade programs: 4.92 (gasoline) and 6.26 (diesel) cents per litre in Quebec and .94 (gasoline) and 1.2 (diesel) cents per litre in Nova Scotia. Quebec's rates do not include increased or reduced regional tax rates, such as an additional 3 cents per litre on gasoline in the Montreal area.
British Columbia Medical Services Plan premiums were eliminated effective January 1, 2020. Ontario levies a health premium, as part of its provincial personal income tax system, of up to $900 per year per person. Provinces with payroll taxes provide payroll tax relief for small businesses. Quebec also levies a compensation tax of up to 4.29 per cent on salaries and wages paid by financial institutions. Lower rates apply to premiums for life, sickness and accident insurance; higher rates apply to premiums for property insurance including automobile insurance. In British Columbia, the highest rate applies to unlicensed insurance. In Manitoba, Ontario, Quebec and Newfoundland and Labrador, sales taxes also apply to certain insurance premiums except, generally, those related to individual life and health.
British Columbia Alberta Saskat-
chewan
In British Columbia (and some other provinces), the general rate applies to income from manufacturing and processing. In Quebec, the rate for manufacturing corporations eligible for the small business rate is 4 per cent; the rate for other manufacturing corporations is the general rate.
Tax rates shown are statutory rates. Ontario, Quebec, New Brunswick, Nova Scotia, Prince Edward Island and Newfoundland and Labrador have harmonized their sales taxes with the federal GST. Alberta imposes a 4 per cent tax on short-term rental accommodation.
In Saskatchewan, small financial corporations pay the rate of 0.7 per cent on their capital. A small financial corporation has less than $1.5 billion in taxable capital. Large financial corporations are subject to the 4 per cent rate. Manitoba's tax only applies to large financial corporations with taxable paid-up capital of at least $4 billion on taxable capital exceeding $10 million. Ontario and Quebec's tax only applies to life insurance companies and applies to the extent the capital tax exceeds income tax. In New Brunswick, trust and loan companies are subject to the rate of 4 per cent, while banks are subject to the rate of 5 per cent. Financial institutions in Prince Edward Island pay tax on their paid-up capital exceeding $2 million.
Manitoba

This page intentionally left blank

2020 Financial and Economic Review – September 2020
Appendix 1 Economic Review Supplementary Tables
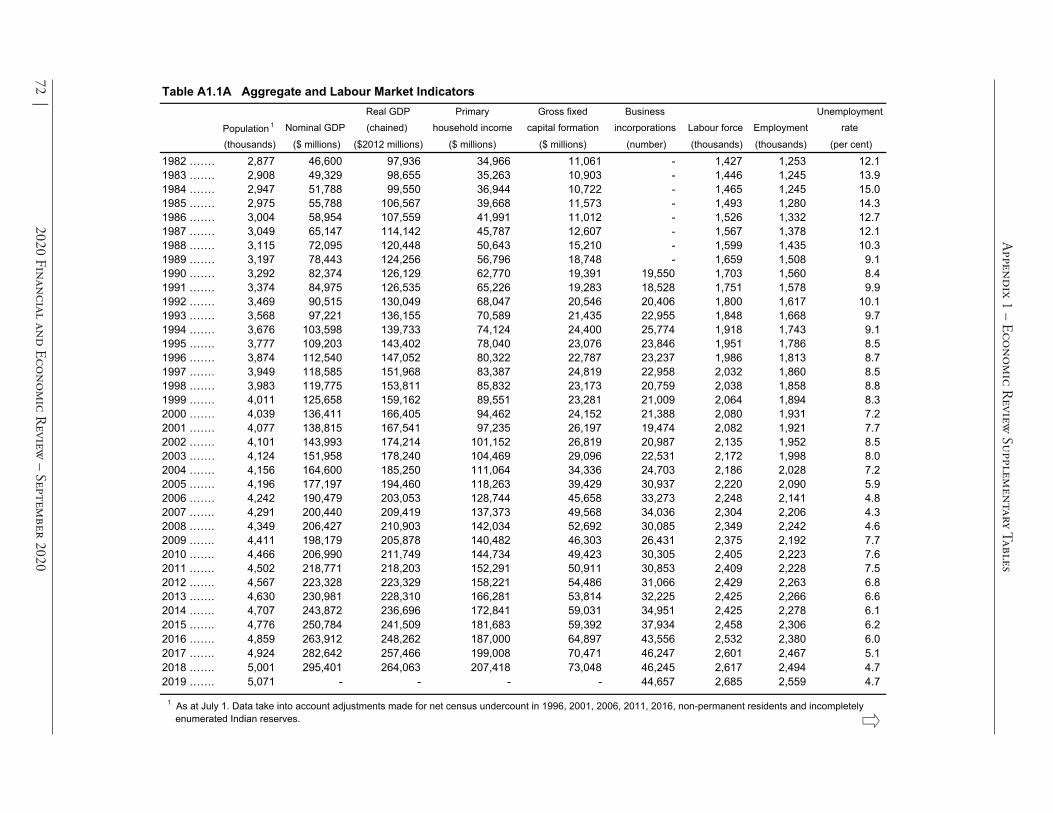
Appendix 1 – Economic R
eview Supplem
entary Tables
72 | 2020 Financial and Econom
ic Review
– September 2020
Table A1.1A Aggregate and Labour Market IndicatorsReal GDP Primary Gross fixed Business Unemployment
Population 1 Nominal GDP (chained) household income capital formation incorporations Labour force Employment rate (thousands) ($ millions) ($2012 millions) ($ millions) ($ millions) (number) (thousands) (thousands) (per cent)
1982 ……… 2,877 46,600 97,936 34,966 11,061 - 1,427 1,253 12.1 1983 ……… 2,908 49,329 98,655 35,263 10,903 - 1,446 1,245 13.9 1984 ……… 2,947 51,788 99,550 36,944 10,722 - 1,465 1,245 15.0 1985 ……… 2,975 55,788 106,567 39,668 11,573 - 1,493 1,280 14.3 1986 ……… 3,004 58,954 107,559 41,991 11,012 - 1,526 1,332 12.7 1987 ……… 3,049 65,147 114,142 45,787 12,607 - 1,567 1,378 12.1 1988 ……… 3,115 72,095 120,448 50,643 15,210 - 1,599 1,435 10.3 1989 ……… 3,197 78,443 124,256 56,796 18,748 - 1,659 1,508 9.1 1990 ……… 3,292 82,374 126,129 62,770 19,391 19,550 1,703 1,560 8.4 1991 ……… 3,374 84,975 126,535 65,226 19,283 18,528 1,751 1,578 9.9 1992 ……… 3,469 90,515 130,049 68,047 20,546 20,406 1,800 1,617 10.1 1993 ……… 3,568 97,221 136,155 70,589 21,435 22,955 1,848 1,668 9.7 1994 ……… 3,676 103,598 139,733 74,124 24,400 25,774 1,918 1,743 9.1 1995 ……… 3,777 109,203 143,402 78,040 23,076 23,846 1,951 1,786 8.5 1996 ……… 3,874 112,540 147,052 80,322 22,787 23,237 1,986 1,813 8.7 1997 ……… 3,949 118,585 151,968 83,387 24,819 22,958 2,032 1,860 8.5 1998 ……… 3,983 119,775 153,811 85,832 23,173 20,759 2,038 1,858 8.8 1999 ……… 4,011 125,658 159,162 89,551 23,281 21,009 2,064 1,894 8.3 2000 ……… 4,039 136,411 166,405 94,462 24,152 21,388 2,080 1,931 7.2 2001 ……… 4,077 138,815 167,541 97,235 26,197 19,474 2,082 1,921 7.7 2002 ……… 4,101 143,993 174,214 101,152 26,819 20,987 2,135 1,952 8.5 2003 ……… 4,124 151,958 178,240 104,469 29,096 22,531 2,172 1,998 8.0 2004 ……… 4,156 164,600 185,250 111,064 34,336 24,703 2,186 2,028 7.2 2005 ……… 4,196 177,197 194,460 118,263 39,429 30,937 2,220 2,090 5.9 2006 ……… 4,242 190,479 203,053 128,744 45,658 33,273 2,248 2,141 4.8 2007 ……. 4,291 200,440 209,419 137,373 49,568 34,036 2,304 2,206 4.3 2008 ……. 4,349 206,427 210,903 142,034 52,692 30,085 2,349 2,242 4.6 2009 ……. 4,411 198,179 205,878 140,482 46,303 26,431 2,375 2,192 7.7 2010 ……. 4,466 206,990 211,749 144,734 49,423 30,305 2,405 2,223 7.6 2011 ……. 4,502 218,771 218,203 152,291 50,911 30,853 2,409 2,228 7.5 2012 ……. 4,567 223,328 223,329 158,221 54,486 31,066 2,429 2,263 6.8 2013 ……. 4,630 230,981 228,310 166,281 53,814 32,225 2,425 2,266 6.6 2014 ……. 4,707 243,872 236,696 172,841 59,031 34,951 2,425 2,278 6.1 2015 ……. 4,776 250,784 241,509 181,683 59,392 37,934 2,458 2,306 6.2 2016 ……. 4,859 263,912 248,262 187,000 64,897 43,556 2,532 2,380 6.0 2017 ……. 4,924 282,642 257,466 199,008 70,471 46,247 2,601 2,467 5.1 2018 ……. 5,001 295,401 264,063 207,418 73,048 46,245 2,617 2,494 4.7 2019 ……. 5,071 - - - - 44,657 2,685 2,559 4.7
1 As at July 1. Data take into account adjustments made for net census undercount in 1996, 2001, 2006, 2011, 2016, non-permanent residents and incompletely enumerated Indian reserves.

2020 Financial and Econom
ic Review
– September 2020
| 73
Appendix 1 – Economic R
eview Supplem
entary Tables
Table A1.1A Aggregate and Labour Market Indicators (continued )Real GDP Primary Gross fixed Business Unemployment
Population1 Nominal GDP (chained) household income capital formation incorporations Labour force Employment rate
1983 ……… 1.1 5.9 0.7 0.8 (1.4) - 1.3 (0.7) 1.8 1984 ……… 1.4 5.0 0.9 4.8 (1.7) - 1.3 0.0 1.1 1985 ……… 0.9 7.7 7.0 7.4 7.9 - 1.9 2.8 (0.7) 1986 ……… 1.0 5.7 0.9 5.9 (4.8) - 2.2 4.1 (1.6) 1987 ……… 1.5 10.5 6.1 9.0 14.5 - 2.7 3.4 (0.6) 1988 ……… 2.2 10.7 5.5 10.6 20.6 - 2.0 4.1 (1.8) 1989 ……… 2.6 8.8 3.2 12.1 23.3 - 3.8 5.1 (1.2) 1990 ……… 3.0 5.0 1.5 10.5 3.4 - 2.6 3.4 (0.7) 1991 ……… 2.5 3.2 0.3 3.9 (0.6) (5.2) 2.8 1.1 1.5 1992 ……… 2.8 6.5 2.8 4.3 6.5 10.1 2.8 2.5 0.2 1993 ……… 2.9 7.4 4.7 3.7 4.3 12.5 2.7 3.1 (0.4) 1994 ……… 3.0 6.6 2.6 5.0 13.8 12.3 3.8 4.5 (0.6) 1995 ……… 2.8 5.4 2.6 5.3 (5.4) (7.5) 1.7 2.4 (0.6) 1996 ……… 2.6 3.1 2.5 2.9 (1.3) (2.6) 1.8 1.6 0.2 1997 ……… 1.9 5.4 3.3 3.8 8.9 (1.2) 2.3 2.6 (0.2) 1998 ……… 0.9 1.0 1.2 2.9 (6.6) (9.6) 0.3 (0.1) 0.3 1999 ……… 0.7 4.9 3.5 4.3 0.5 1.2 1.3 1.9 (0.5) 2000 ……… 0.7 8.6 4.6 5.5 3.7 1.8 0.8 2.0 (1.1) 2001 ……… 0.9 1.8 0.7 2.9 8.5 (8.9) 0.1 (0.5) 0.5 2002 ……… 0.6 3.7 4.0 4.0 2.4 7.8 2.5 1.6 0.8 2003 ……… 0.6 5.5 2.3 3.3 8.5 7.4 1.7 2.3 (0.5) 2004 ……… 0.8 8.3 3.9 6.3 18.0 9.6 0.7 1.5 (0.8) 2005 ……… 1.0 7.7 5.0 6.5 14.8 25.2 1.5 3.0 (1.3) 2006 ……… 1.1 7.5 4.4 8.9 15.8 7.6 1.3 2.4 (1.1) 2007 ……… 1.2 5.2 3.1 6.7 8.6 2.3 2.5 3.0 (0.5) 2008 ……… 1.4 3.0 0.7 3.4 6.3 (11.6) 2.0 1.6 0.3 2009 ……… 1.4 (4.0) (2.4) (1.1) (12.1) (12.1) 1.1 (2.2) 3.1 2010 ……… 1.2 4.4 2.9 3.0 6.7 14.7 1.3 1.4 (0.1) 2011 ……… 0.8 5.7 3.0 5.2 3.0 1.8 0.2 0.2 (0.1) 2012 ……… 1.4 2.1 2.3 3.9 7.0 0.7 0.8 1.6 (0.7) 2013 ……… 1.4 3.4 2.2 5.1 (1.2) 3.7 (0.1) 0.1 (0.2) 2014 ……… 1.7 5.6 3.7 3.9 9.7 8.5 0.0 0.6 (0.5) 2015 ……… 1.5 2.8 2.0 5.1 0.6 8.5 1.3 1.2 0.1 2016 ……… 1.7 5.2 2.8 2.9 9.3 14.8 3.0 3.2 (0.2) 2017 ……… 1.3 7.1 3.7 6.4 8.6 6.2 2.7 3.7 (0.9) 2018 ……… 1.6 4.5 2.6 4.2 3.7 (0.0) 0.6 1.1 (0.4) 2019 ……… 1.4 - - - - (3.4) 2.6 2.6 0.0
2 Annual unemployment rate expressed as percentage point difference.
(annual percentage change)2
Sources: Statistics Canada (Tables: 17-10-0005-01, 36-10-0222-01, 36-10-0224-01, 14-10-0327-01 - accessed June 2020) and BC Stats.
1 As at July 1. Data take into account adjustments made for net census undercount in 1996, 2001, 2006, 2011, 2016, non-permanent residents and incompletely enumerated Indian reserves.
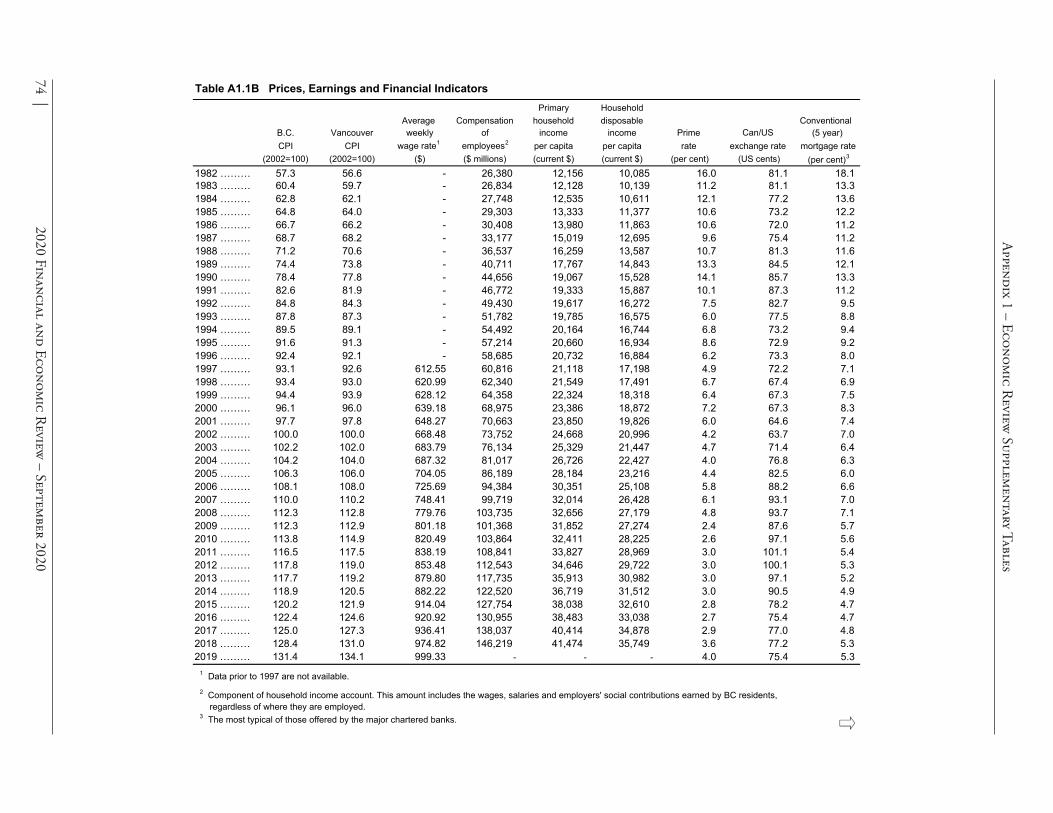
Appendix 1 – Economic R
eview Supplem
entary Tables
74 | 2020 Financial and Econom
ic Review
– September 2020
Table A1.1B Prices, Earnings and Financial IndicatorsPrimary Household
Average Compensation household disposable Conventional B.C. Vancouver weekly of income income Prime Can/US (5 year)CPI CPI wage rate1 employees2 per capita per capita rate exchange rate mortgage rate
(2002=100) (2002=100) ($) ($ millions) (current $) (current $) (per cent) (US cents) (per cent)3
1982 ……… 57.3 56.6 - 26,380 12,156 10,085 16.0 81.1 18.1 1983 ……… 60.4 59.7 - 26,834 12,128 10,139 11.2 81.1 13.3 1984 ……… 62.8 62.1 - 27,748 12,535 10,611 12.1 77.2 13.6 1985 ……… 64.8 64.0 - 29,303 13,333 11,377 10.6 73.2 12.2 1986 ……… 66.7 66.2 - 30,408 13,980 11,863 10.6 72.0 11.2 1987 ……… 68.7 68.2 - 33,177 15,019 12,695 9.6 75.4 11.2 1988 ……… 71.2 70.6 - 36,537 16,259 13,587 10.7 81.3 11.6 1989 ……… 74.4 73.8 - 40,711 17,767 14,843 13.3 84.5 12.1 1990 ……… 78.4 77.8 - 44,656 19,067 15,528 14.1 85.7 13.3 1991 ……… 82.6 81.9 - 46,772 19,333 15,887 10.1 87.3 11.2 1992 ……… 84.8 84.3 - 49,430 19,617 16,272 7.5 82.7 9.5 1993 ……… 87.8 87.3 - 51,782 19,785 16,575 6.0 77.5 8.8 1994 ……… 89.5 89.1 - 54,492 20,164 16,744 6.8 73.2 9.4 1995 ……… 91.6 91.3 - 57,214 20,660 16,934 8.6 72.9 9.2 1996 ……… 92.4 92.1 - 58,685 20,732 16,884 6.2 73.3 8.0 1997 ……… 93.1 92.6 612.55 60,816 21,118 17,198 4.9 72.2 7.1 1998 ……… 93.4 93.0 620.99 62,340 21,549 17,491 6.7 67.4 6.9 1999 ……… 94.4 93.9 628.12 64,358 22,324 18,318 6.4 67.3 7.5 2000 ……… 96.1 96.0 639.18 68,975 23,386 18,872 7.2 67.3 8.3 2001 ……… 97.7 97.8 648.27 70,663 23,850 19,826 6.0 64.6 7.4 2002 ……… 100.0 100.0 668.48 73,752 24,668 20,996 4.2 63.7 7.0 2003 ……… 102.2 102.0 683.79 76,134 25,329 21,447 4.7 71.4 6.4 2004 ……… 104.2 104.0 687.32 81,017 26,726 22,427 4.0 76.8 6.3 2005 ……… 106.3 106.0 704.05 86,189 28,184 23,216 4.4 82.5 6.0 2006 ……… 108.1 108.0 725.69 94,384 30,351 25,108 5.8 88.2 6.6 2007 ……… 110.0 110.2 748.41 99,719 32,014 26,428 6.1 93.1 7.0 2008 ……… 112.3 112.8 779.76 103,735 32,656 27,179 4.8 93.7 7.1 2009 ……… 112.3 112.9 801.18 101,368 31,852 27,274 2.4 87.6 5.7 2010 ……… 113.8 114.9 820.49 103,864 32,411 28,225 2.6 97.1 5.6 2011 ……… 116.5 117.5 838.19 108,841 33,827 28,969 3.0 101.1 5.4 2012 ……… 117.8 119.0 853.48 112,543 34,646 29,722 3.0 100.1 5.3 2013 ……… 117.7 119.2 879.80 117,735 35,913 30,982 3.0 97.1 5.2 2014 ……… 118.9 120.5 882.22 122,520 36,719 31,512 3.0 90.5 4.9 2015 ……… 120.2 121.9 914.04 127,754 38,038 32,610 2.8 78.2 4.7 2016 ……… 122.4 124.6 920.92 130,955 38,483 33,038 2.7 75.4 4.7 2017 ……… 125.0 127.3 936.41 138,037 40,414 34,878 2.9 77.0 4.8 2018 ……… 128.4 131.0 974.82 146,219 41,474 35,749 3.6 77.2 5.3 2019 ……… 131.4 134.1 999.33 - - - 4.0 75.4 5.3 1 Data prior to 1997 are not available.
2 Component of household income account. This amount includes the wages, salaries and employers' social contributions earned by BC residents, regardless of where they are employed. 3 The most typical of those offered by the major chartered banks.

2020 Financial and Econom
ic Review
– September 2020
| 75
Appendix 1 – Economic R
eview Supplem
entary Tables
Table A1.1B Prices, Earnings and Financial Indicators (continued )Primary Household
Average Compensation household disposable Conventional B.C. Vancouver weekly of income income Prime Can/US (5 year)
CPI CPI wage rate1 employees2 per capita per capita rate exchange rate mortgage rate3
1983 ……… 5.4 5.5 - 1.7 (0.2) 0.5 (4.8) 0.1 (4.9) 1984 ……… 4.0 4.0 - 3.4 3.4 4.7 0.9 (3.9) 0.3 1985 ……… 3.2 3.1 - 5.6 6.4 7.2 (1.5) (4.0) (1.4) 1986 ……… 2.9 3.4 - 3.8 4.9 4.3 (0.1) (1.3) (1.0) 1987 ……… 3.0 3.0 - 9.1 7.4 7.0 (1.0) 3.4 (0.1) 1988 ……… 3.6 3.5 - 10.1 8.3 7.0 1.2 5.8 0.5 1989 ……… 4.5 4.5 - 11.4 9.3 9.2 2.5 3.2 0.4 1990 ……… 5.4 5.4 - 9.7 7.3 4.6 0.9 1.2 1.3 1991 ……… 5.4 5.3 - 4.7 1.4 2.3 (4.0) 1.6 (2.1) 1992 ……… 2.7 2.9 - 5.7 1.5 2.4 (2.6) (4.5) (1.7) 1993 ……… 3.5 3.6 - 4.8 0.9 1.9 (1.6) (5.2) (0.8) 1994 ……… 1.9 2.1 - 5.2 1.9 1.0 0.8 (4.3) 0.6 1995 ……… 2.3 2.5 - 5.0 2.5 1.1 1.9 (0.4) (0.2) 1996 ……… 0.9 0.9 - 2.6 0.3 (0.3) (2.4) 0.5 (1.2) 1997 ……… 0.8 0.5 - 3.6 1.9 1.9 (1.3) (1.1) (0.9) 1998 ……… 0.3 0.4 1.4 2.5 2.0 1.7 1.7 (4.8) (0.1) 1999 ……… 1.1 1.0 1.1 3.2 3.6 4.7 (0.2) (0.1) 0.6 2000 ……… 1.8 2.2 1.8 7.2 4.8 3.0 0.8 0.0 0.8 2001 ……… 1.7 1.9 1.4 2.4 2.0 5.1 (1.3) (2.8) (0.9) 2002 ……… 2.4 2.2 3.1 4.4 3.4 5.9 (1.8) (0.9) (0.4) 2003 ……… 2.2 2.0 2.3 3.2 2.7 2.2 0.5 7.7 (0.6) 2004 ……… 2.0 2.0 0.5 6.4 5.5 4.6 (0.7) 5.5 (0.2) 2005 ……… 2.0 1.9 2.4 6.4 5.5 3.5 0.4 5.7 (0.3) 2006 ……… 1.7 1.9 3.1 9.5 7.7 8.1 1.4 5.6 0.7 2007 ……… 1.8 2.0 3.1 5.7 5.5 5.3 0.3 5.0 0.4 2008 ……… 2.1 2.4 4.2 4.0 2.0 2.8 (1.3) 0.6 0.1 2009 ……… - 0.1 2.7 (2.3) (2.5) 0.4 (2.4) (6.1) (1.4) 2010 ……… 1.3 1.8 2.4 2.5 1.8 3.5 0.2 9.5 (0.1) 2011 ……… 2.4 2.3 2.2 4.8 4.4 2.6 0.4 4.0 (0.2) 2012 ……… 1.1 1.3 1.8 3.4 2.4 2.6 0.0 (1.0) (0.1) 2013 ……… (0.1) 0.2 3.1 4.6 3.7 4.2 0.0 (3.0) (0.0) 2014 ……… 1.0 1.1 0.3 4.1 2.2 1.7 0.0 (6.6) (0.3) 2015 ……… 1.1 1.2 3.6 4.3 3.6 3.5 (0.2) (12.3) (0.2) 2016 ……… 1.8 2.2 0.8 2.5 1.2 1.3 (0.1) (2.8) (0.0) 2017 ……… 2.1 2.2 1.7 5.4 5.0 5.6 0.2 1.6 0.1 2018 ……… 2.7 2.9 4.1 5.9 2.6 2.5 0.7 0.1 0.5 2019 ……… 2.3 2.4 2.5 - - - 0.4 (1.8) 0.0 1 Data prior to 1997 are not available.
3 The most typical of those offered by the major chartered banks. 4 Prime rate, exchange rate and conventional (5 year) mortgage rates expressed as percentage point difference.
Sources: Statistics Canada (Tables: 18-10-0005-01, 14-10-0064-01, 36-10-0224-01, 10-10-0122-01, 10-10-0009-01, 10-10-0145-01 - accessed June 2020), Bank of Canada and BC Stats.
(annual percentage change) 4
2 Component of household income account. This amount includes the wages, salaries and employers' social contributions earned by BC residents, regardless of where they are employed.
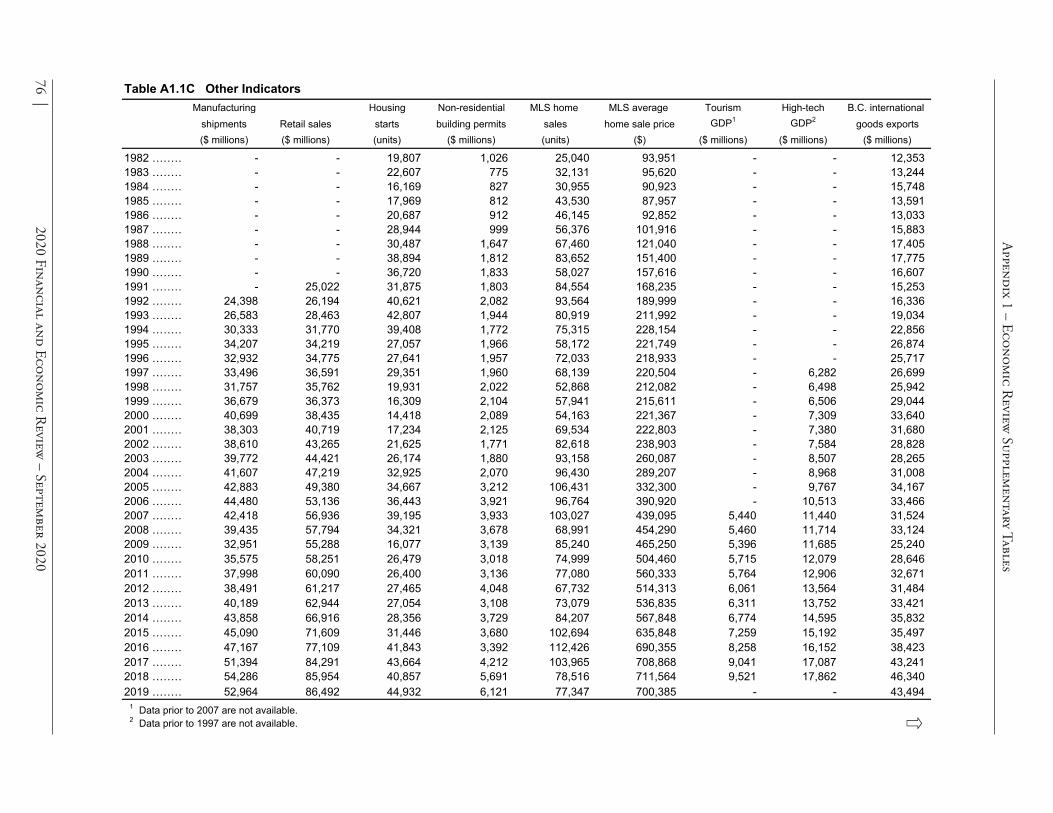
Appendix 1 – Economic R
eview Supplem
entary Tables
76 | 2020 Financial and Econom
ic Review
– September 2020
Table A1.1C Other IndicatorsManufacturing Housing Non-residential MLS home MLS average Tourism High-tech B.C. international
shipments Retail sales starts building permits sales home sale price GDP1 GDP2 goods exports($ millions) ($ millions) (units) ($ millions) (units) ($) ($ millions) ($ millions) ($ millions)
1982 ……… - - 19,807 1,026 25,040 93,951 - - 12,353 1983 ……… - - 22,607 775 32,131 95,620 - - 13,244 1984 ……… - - 16,169 827 30,955 90,923 - - 15,748 1985 ……… - - 17,969 812 43,530 87,957 - - 13,591 1986 ……… - - 20,687 912 46,145 92,852 - - 13,033 1987 ……… - - 28,944 999 56,376 101,916 - - 15,883 1988 ……… - - 30,487 1,647 67,460 121,040 - - 17,405 1989 ……… - - 38,894 1,812 83,652 151,400 - - 17,775 1990 ……… - - 36,720 1,833 58,027 157,616 - - 16,607 1991 ……… - 25,022 31,875 1,803 84,554 168,235 - - 15,253 1992 ……… 24,398 26,194 40,621 2,082 93,564 189,999 - - 16,336 1993 ……… 26,583 28,463 42,807 1,944 80,919 211,992 - - 19,034 1994 ……… 30,333 31,770 39,408 1,772 75,315 228,154 - - 22,856 1995 ……… 34,207 34,219 27,057 1,966 58,172 221,749 - - 26,874 1996 ……… 32,932 34,775 27,641 1,957 72,033 218,933 - - 25,717 1997 ……… 33,496 36,591 29,351 1,960 68,139 220,504 - 6,282 26,699 1998 ……… 31,757 35,762 19,931 2,022 52,868 212,082 - 6,498 25,942 1999 ……… 36,679 36,373 16,309 2,104 57,941 215,611 - 6,506 29,044 2000 ……… 40,699 38,435 14,418 2,089 54,163 221,367 - 7,309 33,640 2001 ……… 38,303 40,719 17,234 2,125 69,534 222,803 - 7,380 31,680 2002 ……… 38,610 43,265 21,625 1,771 82,618 238,903 - 7,584 28,828 2003 ……… 39,772 44,421 26,174 1,880 93,158 260,087 - 8,507 28,265 2004 ……… 41,607 47,219 32,925 2,070 96,430 289,207 - 8,968 31,008 2005 ……… 42,883 49,380 34,667 3,212 106,431 332,300 - 9,767 34,167 2006 ……… 44,480 53,136 36,443 3,921 96,764 390,920 - 10,513 33,466 2007 ……… 42,418 56,936 39,195 3,933 103,027 439,095 5,440 11,440 31,524 2008 ……… 39,435 57,794 34,321 3,678 68,991 454,290 5,460 11,714 33,124 2009 ……… 32,951 55,288 16,077 3,139 85,240 465,250 5,396 11,685 25,240 2010 ……… 35,575 58,251 26,479 3,018 74,999 504,460 5,715 12,079 28,646 2011 ……… 37,998 60,090 26,400 3,136 77,080 560,333 5,764 12,906 32,671 2012 ……… 38,491 61,217 27,465 4,048 67,732 514,313 6,061 13,564 31,484 2013 ……… 40,189 62,944 27,054 3,108 73,079 536,835 6,311 13,752 33,421 2014 ……… 43,858 66,916 28,356 3,729 84,207 567,848 6,774 14,595 35,832 2015 ……… 45,090 71,609 31,446 3,680 102,694 635,848 7,259 15,192 35,497 2016 ……… 47,167 77,109 41,843 3,392 112,426 690,355 8,258 16,152 38,423 2017 ……… 51,394 84,291 43,664 4,212 103,965 708,868 9,041 17,087 43,241 2018 ……… 54,286 85,954 40,857 5,691 78,516 711,564 9,521 17,862 46,340 2019 ……… 52,964 86,492 44,932 6,121 77,347 700,385 - - 43,494 1 Data prior to 2007 are not available. 2 Data prior to 1997 are not available.

2020 Financial and Econom
ic Review
– September 2020
| 77
Appendix 1 – Economic R
eview Supplem
entary Tables
Table A1.1C Other Indicators (continued )Manufacturing Housing Non-residential MLS Home MLS Average Tourism High-tech B.C. international
shipments Retail sales starts building permits Sales Home Sale Price GDP1 GDP2 goods exports
1983 ……… - - 14.1 (24.5) 28.3 1.8 - - 7.2 1984 ……… - - (28.5) 6.7 (3.7) (4.9) - - 18.9 1985 ……… - - 11.1 (1.7) 40.6 (3.3) - - (13.7) 1986 ……… - - 15.1 12.3 6.0 5.6 - - (4.1) 1987 ……… - - 39.9 9.6 22.2 9.8 - - 21.9 1988 ……… - - 5.3 64.9 19.7 18.8 - - 9.6 1989 ……… - - 27.6 10.0 24.0 25.1 - - 2.1 1990 ……… - - (5.6) 1.2 (30.6) 4.1 - - (6.6) 1991 ……… - - (13.2) (1.6) 45.7 6.7 - - (8.2) 1992 ……… - 4.7 27.4 15.5 10.7 12.9 - - 7.1 1993 ……… 9.0 8.7 5.4 (6.7) (13.5) 11.6 - - 16.5 1994 ……… 14.1 11.6 (7.9) (8.9) (6.9) 7.6 - - 20.1 1995 ……… 12.8 7.7 (31.3) 11.0 (22.8) (2.8) - - 17.6 1996 ……… (3.7) 1.6 2.2 (0.4) 23.8 (1.3) - - (4.3) 1997 ……… 1.7 5.2 6.2 0.1 (5.4) 0.7 - - 3.8 1998 ……… (5.2) (2.3) (32.1) 3.2 (22.4) (3.8) - 3.4 (2.8) 1999 ……… 15.5 1.7 (18.2) 4.0 9.6 1.7 - 0.1 12.0 2000 ……… 11.0 5.7 (11.6) (0.7) (6.5) 2.7 - 12.3 15.8 2001 ……… (5.9) 5.9 19.5 1.7 28.4 0.6 - 1.0 (5.8) 2002 ……… 0.8 6.3 25.5 (16.6) 18.8 7.2 - 2.8 (9.0) 2003 ……… 3.0 2.7 21.0 6.1 12.8 8.9 - 12.2 (2.0) 2004 ……… 4.6 6.3 25.8 10.1 3.5 11.2 - 5.4 9.7 2005 ……… 3.1 4.6 5.3 55.2 10.4 14.9 - 8.9 10.2 2006 ……… 3.7 7.6 5.1 22.1 (9.1) 17.6 - 7.6 (2.1) 2007 ……… (4.6) 7.2 7.6 0.3 6.5 12.3 - 8.8 (5.8) 2008 ……… (7.0) 1.5 (12.4) (6.5) (33.0) 3.5 0.4 2.4 5.1 2009 ……… (16.4) (4.3) (53.2) (14.7) 23.6 2.4 (1.2) (0.2) (23.8) 2010 ……… 8.0 5.4 64.7 (3.9) (12.0) 8.4 5.9 3.4 13.5 2011 ……… 6.8 3.2 (0.3) 3.9 2.8 11.1 0.9 6.8 14.1 2012 ……… 1.3 1.9 4.0 29.1 (12.1) (8.2) 5.2 5.1 (3.6) 2013 ……… 4.4 2.8 (1.5) (23.2) 7.9 4.4 4.1 1.4 6.2 2014 ……… 9.1 6.3 4.8 20.0 15.2 5.8 7.3 6.1 7.2 2015 ……… 2.8 7.0 10.9 (1.3) 22.0 12.0 7.2 4.1 (0.9) 2016 ……… 4.6 7.7 33.1 (7.8) 9.5 8.6 13.8 6.3 8.2 2017 ……… 9.0 9.3 4.4 24.2 (7.5) 2.7 9.5 5.8 12.5 2018 ……… 5.6 2.0 (6.4) 35.1 (24.5) 0.4 5.3 4.5 7.2 2019 ……… (2.4) 0.6 10.0 7.5 (1.5) (1.6) - - (6.1)
1 Data prior to 2007 are not available. 2 Data prior to 1997 are not available.
(annual percentage change)
Sources: Statistics Canada (Tables: 16-10-0048-01, 20-10-0008-01, 34-10-0135-01, 34-10-0066-01, 34-10-0003-01 - accessed June 2020); Canadian Real Estate Association; Haver Analytics and BC Stats.

Appendix 1 – Economic R
eview Supplem
entary Tables
78 | 2020 Financial and Econom
ic Review
– September 2020
Table A1.1D Commodity Production IndicatorsLumber 1 Timber scale Pulp Newsprint, etc Oil & natural Coal Solid mineral Electric pwr Farm cash Landed value ofproduction data production production gas production production shipments generated receipts seafood products
(thousand m3) (thousand m3) (000 tonnes) (000 tonnes) ($ millions) (000 tonnes) ($ millions) (GW.h) ($ millions) ($ millions)
1982 …… 23,855 - 2,823 1,872 - 11,769 2,769 48,238 962 241 1983 …… 30,773 - 3,267 2,148 - 11,717 2,903 47,213 917 210 1984 …… 30,884 - 3,051 2,084 - 20,771 3,346 52,369 1,005 243 1985 …… 32,994 76,869 3,442 2,470 - 22,993 3,541 59,126 1,061 378 1986 …… 31,468 77,503 3,727 2,628 - 20,361 3,160 50,759 1,106 405 1987 …… 37,336 90,592 4,291 2,759 - 21,990 3,615 63,066 1,122 455 1988 …… 36,736 86,808 4,354 2,878 - 24,942 3,943 60,943 1,206 573 1989 …… 35,952 86,793 4,281 2,862 585 24,800 4,123 57,655 1,255 513 1990 …… 33,514 78,045 3,709 3,002 902 24,557 3,954 60,662 1,299 559 1991 …… 31,406 73,449 3,957 2,721 858 24,965 3,840 62,981 1,342 492 1992 …… 33,396 73,937 3,954 2,692 890 17,173 3,500 64,058 1,404 533 1993 …… 33,935 79,232 3,981 3,067 1,089 20,633 3,538 58,774 1,446 605 1994 …… 33,671 75,639 4,670 2,947 1,270 22,583 4,066 61,015 1,538 728 1995 …… 32,611 75,430 4,773 2,836 1,040 24,350 4,501 58,006 1,586 604 1996 …… 32,671 73,099 4,473 2,842 1,333 25,420 4,340 71,765 1,706 590 1997 …… 31,562 69,155 4,532 2,260 1,588 27,830 4,681 66,961 1,738 604 1998 …… 30,238 65,451 4,296 2,781 1,574 24,800 4,466 67,710 1,780 547 1999 …… 32,397 75,878 4,921 3,047 2,091 24,845 4,536 68,045 1,885 613 2000 …… 34,346 76,009 5,324 3,106 4,783 25,681 7,901 68,241 2,024 667 2001 …… 32,606 69,796 4,512 2,901 5,666 27,006 8,623 57,332 2,201 647 2002 …… 35,501 75,208 4,465 2,894 4,251 24,397 2,864 64,945 2,174 664 2003 …… 36,052 74,899 4,785 2,894 6,230 23,073 2,887 63,051 2,248 645 2004 …… 39,951 81,679 4,777 3,035 6,784 27,314 3,740 60,496 2,360 635 2005 …… 41,129 83,590 4,937 2,977 8,967 26,715 5,384 67,774 2,389 706 2006 …… 41,198 80,350 4,742 3,007 7,148 23,057 5,991 61,598 2,346 788 2007 …… 36,811 72,675 4,730 2,761 6,934 25,725 5,611 71,830 2,381 727 2008 …… 28,263 61,137 4,115 2,519 9,264 26,163 7,403 66,072 2,522 718 2009 …… 22,935 48,822 3,547 2,092 4,120 21,193 5,622 65,057 2,525 700 2010 …… 26,831 63,336 4,262 1,618 4,528 26,040 7,166 64,224 2,547 873 2011 …… 28,414 69,580 4,502 1,552 4,945 27,431 8,982 69,257 2,688 813 2012 …… 29,164 68,133 4,444 1,444 3,415 28,777 7,826 73,584 2,845 713 2013 …… 30,023 71,053 4,296 1,419 4,676 31,132 7,112 67,851 2,883 775 2014 …… 29,635 66,382 4,294 1,432 6,996 29,392 6,815 67,008 3,037 862 2015 …… 30,612 68,661 4,320 1,251 3,543 25,551 6,186 71,771 3,188 885 2016 …… 31,448 66,234 4,223 1,143 3,079 26,027 6,704 69,703 3,119 1,180 2017 …… 30,337 64,495 4,215 1,119 3,964 26,005 9,178 74,476 3,255 1,168 2018 …… 29,200 67,639 4,089 1,040 4,755 x 9,783 69,080 3,462 1,291 2019 …… 22,839 53,705 4,091 838 4,303 x 8,800 - 3,924 -
x Suppressed to meet the confidentiality requirements of the Statistics Act.
1 Total lumber production is total softwood production.

2020 Financial and Econom
ic Review
– September 2020
| 79
Appendix 1 – Economic R
eview Supplem
entary Tables
Table A1.1D Commodity Production Indicators (continued )Lumber 1 Timber scale Pulp Newsprint, etc Oil & natural Coal Solid mineral Electric pwr Farm cash Landed value ofproduction data production production gas production production shipments generated receipts seafood products
1983 …… 29.0 - 15.7 14.7 - (0.4) 4.8 (2.1) (4.7) (12.9) 1984 …… 0.4 - (6.6) (3.0) - 77.3 15.3 10.9 9.6 15.7 1985 …… 6.8 - 12.8 18.5 - 10.7 5.8 12.9 5.7 55.6 1986 …… (4.6) 0.8 8.3 6.4 - (11.4) (10.8) (14.2) 4.2 7.1 1987 …… 18.6 16.9 15.1 5.0 - 8.0 14.4 24.2 1.4 12.3 1988 …… (1.6) (4.2) 1.5 4.3 - 13.4 9.1 (3.4) 7.6 25.9 1989 …… (2.1) (0.0) (1.7) (0.6) - (0.6) 4.6 (5.4) 4.0 (10.5) 1990 …… (6.8) (10.1) (13.4) 4.9 54.0 (1.0) (4.1) 5.2 3.5 9.0 1991 …… (6.3) (5.9) 6.7 (9.4) (4.8) 1.7 (2.9) 3.8 3.3 (12.0) 1992 …… 6.3 0.7 (0.1) (1.1) 3.7 (31.2) (8.9) 1.7 4.7 8.3 1993 …… 1.6 7.2 0.7 13.9 22.4 20.1 1.1 (8.2) 3.0 13.5 1994 …… (0.8) (4.5) 17.3 (3.9) 16.6 9.5 14.9 3.8 6.4 20.3 1995 …… (3.1) (0.3) 2.2 (3.8) (18.1) 7.8 10.7 (4.9) 3.1 (17.0) 1996 …… 0.2 (3.1) (6.3) 0.2 28.2 4.4 (3.6) 23.7 7.6 (2.3) 1997 …… (3.4) (5.4) 1.3 (20.5) 19.1 9.5 7.9 (6.7) 1.9 2.4 1998 …… (4.2) (5.4) (5.2) 23.1 (0.9) (10.9) (4.6) 1.1 2.4 (9.4) 1999 …… 7.1 15.9 14.5 9.6 32.8 0.2 1.6 0.5 5.9 12.1 2000 …… 6.0 0.2 8.2 1.9 128.7 3.4 74.2 0.3 7.4 8.8 2001 …… (5.1) (8.2) (15.3) (6.6) 18.5 5.2 9.1 (16.0) 8.7 (3.0) 2002 …… 8.9 7.8 (1.0) (0.2) (25.0) (9.7) (66.8) 13.3 (1.2) 2.6 2003 …… 1.6 (0.4) 7.2 - 46.6 (5.4) 0.8 (2.9) 3.4 (2.9) 2004 …… 10.8 9.1 (0.2) 4.9 8.9 18.4 29.5 (4.1) 5.0 (1.6) 2005 …… 2.9 2.3 3.3 (1.9) 32.2 (2.2) 44.0 12.0 1.3 11.2 2006 …… 0.2 (3.9) (3.9) 1.0 (20.3) (13.7) 11.3 (9.1) (1.8) 11.6 2007 …… (10.6) (9.6) (0.3) (8.2) (3.0) 11.6 (6.3) 16.6 1.5 (7.7) 2008 …… (23.2) (15.9) (13.0) (8.8) 33.6 1.7 31.9 (8.0) 5.9 (1.2) 2009 …… (18.9) (20.1) (13.8) (17.0) (55.5) (19.0) (24.1) (1.5) 0.1 (2.5) 2010 …… 17.0 29.7 20.2 (22.7) 9.9 22.9 27.5 (1.3) 0.9 24.8 2011 …… 5.9 9.9 5.6 (4.1) 9.2 5.3 25.3 7.8 5.5 (7.0) 2012 …… 2.6 (2.1) (1.3) (7.0) (30.9) 4.9 (12.9) 6.2 5.8 (12.3) 2013 …… 2.9 4.3 (3.3) (1.7) 36.9 8.2 (9.1) (7.8) 1.3 8.8 2014 …… (1.3) (6.6) (0.0) 0.9 49.6 (5.6) (4.2) (1.2) 5.4 11.2 2015 …… 3.3 3.4 0.6 (12.6) (49.4) (13.1) (9.2) 7.1 5.0 2.7 2016 …… 2.7 (3.5) (2.2) (8.6) (13.1) 1.9 8.4 (2.9) (2.2) 33.3 2017 …… (3.5) (2.6) (0.2) (2.1) 28.7 (0.1) 36.9 6.8 4.4 (1.0) 2018 …… (3.7) 4.9 (3.0) (7.1) 20.0 - 6.6 (7.2) 6.4 10.5 2019 …… (21.8) (20.6) 0.0 (19.4) (9.5) - (10.1) - 13.3 - 1 Total lumber production is total softwood production.
(annual percentage change)
Sources: Statistics Canada (Table: 16-10-0017-01, 16-10-0045-01, 25-10-0046-01, 25-10-0021-01, 32-10-0046-01 - accessed June 2020); Ministry of Agriculture; Ministry of Forests, Lands and Natural Resource Operations, and Rural Development; Ministry of Energy, Mines and Petroleum Resources; Natural Resources Canada and BC Stats.

Appendix 1 – Economic R
eview Supplem
entary Tables
80 | 2020 Financial and Econom
ic Review
– September 2020
Table A1.2 British Columbia Real GDP at Market Prices, Expenditure BasedGeneral General
Household Governments Business GovernmentsFinal Final Non- Machinery Intellectual Gross Fixed Gross Fixed
Consumption Consumption Residential residential and Property Capital Capital Expenditure Expenditure Structures Structures Equipment Products Formation Formation Exports Imports Real GDP
1982…… 54,284 25,819 6,252 8,136 1,816 477 15,312 2,623 29,217 28,134 97,936 1983…… 54,543 25,571 6,633 8,661 1,353 509 14,745 2,878 30,779 30,165 98,655 1984…… 55,969 25,561 6,305 7,504 1,452 610 14,082 2,945 32,978 32,694 99,550 1985…… 58,030 26,191 6,817 7,055 1,642 645 14,661 3,593 36,256 33,754 106,567 1986…… 59,253 26,429 7,509 5,489 1,564 628 13,838 3,249 38,048 35,006 107,559 1987…… 62,383 26,740 8,934 5,753 1,913 681 15,979 3,467 41,273 37,988 114,142 1988…… 65,379 28,017 9,955 6,896 2,567 879 19,300 3,200 43,541 41,126 120,448 1989…… 69,152 28,373 11,457 7,674 3,081 983 22,273 4,089 42,822 45,022 124,256 1990…… 72,042 29,403 11,655 7,464 3,113 1,227 22,583 4,080 42,344 46,941 126,129 1991…… 72,471 31,073 11,010 7,890 3,191 1,231 22,520 4,626 43,018 47,386 126,535 1992…… 74,713 32,140 13,535 6,166 3,185 1,229 23,455 4,638 45,157 49,588 130,049 1993…… 77,151 32,588 13,875 5,649 3,091 1,603 23,560 4,728 46,950 49,290 136,155 1994…… 80,289 32,870 13,955 6,879 3,510 2,315 25,912 5,438 50,039 57,258 139,733 1995…… 82,775 32,306 12,270 7,541 3,587 1,825 24,600 5,053 53,082 57,974 143,402 1996…… 85,806 32,946 12,459 6,661 3,675 1,841 24,294 5,434 53,351 57,506 147,052 1997…… 89,016 32,876 13,071 8,876 4,066 1,946 27,333 4,729 55,463 61,586 151,968 1998…… 90,175 33,385 11,314 6,781 4,496 2,408 25,452 4,532 56,944 60,891 153,811 1999…… 92,443 33,624 10,499 7,527 4,517 2,077 25,097 5,332 61,911 64,595 159,162 2000…… 95,344 34,897 10,563 7,289 4,897 2,513 26,065 5,403 67,308 69,598 166,405 2001…… 97,251 36,032 11,629 8,404 4,811 3,164 28,386 5,458 66,794 69,764 167,541 2002…… 100,887 36,560 13,554 7,875 4,681 2,704 28,868 5,212 67,270 69,848 174,214 2003…… 104,235 36,720 14,601 8,599 4,693 3,238 30,948 5,443 69,226 73,588 178,240 2004…… 108,952 36,511 17,112 9,487 5,274 3,697 35,317 6,299 72,828 79,354 185,250 2005…… 113,429 36,946 18,352 9,974 6,342 3,941 38,637 7,517 76,457 84,079 194,460 2006…… 120,181 37,399 19,671 11,813 7,355 4,181 43,107 7,778 79,417 90,710 203,053 2007…… 126,699 39,404 20,099 11,191 8,044 4,863 44,436 8,093 81,168 95,697 209,419 2008…… 129,782 40,961 19,096 12,832 8,067 5,102 45,183 8,551 78,546 96,459 210,903 2009…… 130,162 41,455 17,460 11,376 6,129 4,188 39,098 8,571 73,286 89,411 205,878 2010…… 135,142 41,761 17,494 12,170 7,237 4,611 41,533 9,222 79,025 97,377 211,749 2011…… 137,998 42,612 17,987 13,734 7,500 4,657 43,876 7,334 82,874 100,829 218,203 2012…… 140,749 43,344 19,282 14,937 7,812 4,134 46,165 8,041 85,442 104,682 223,329 2013…… 144,336 43,347 19,396 14,618 7,182 4,243 45,442 7,339 88,297 105,680 228,310 2014…… 149,395 42,520 20,558 16,070 7,814 4,030 48,478 7,817 94,851 111,054 236,696 2015…… 155,326 43,451 22,528 14,103 6,832 3,367 46,833 7,694 94,041 109,916 241,509 2016…… 160,338 44,179 25,916 12,661 7,744 3,420 49,843 7,859 97,054 115,448 248,262 2017…… 167,702 45,468 25,877 14,577 8,002 3,452 51,923 8,977 99,666 121,912 257,466 2018…… 171,502 46,821 25,242 14,818 8,443 3,694 52,144 9,547 103,871 125,445 264,063 2019…… n/a n/a n/a n/a n/a n/a n/a n/a n/a n/a n/a
(millions of 2012 $, chained)

2020 Financial and Econom
ic Review
– September 2020
| 81
Appendix 1 – Economic R
eview Supplem
entary Tables
Table A1.2 British Columbia Real GDP at Market Prices, Expenditure Based (continued )General General
Household Governments Business GovernmentsFinal Final Non- Machinery Intellectual Gross Fixed Gross Fixed
Consumption Consumption Residential residential and Property Capital Capital Expenditure Expenditure Structures Structures Equipment Products Formation Formation Exports Imports Real GDP
1983…… 0.5 (1.0) 6.1 6.5 (25.5) 6.7 (3.7) 9.7 5.3 7.2 0.7 1984…… 2.6 (0.0) (4.9) (13.4) 7.3 19.8 (4.5) 2.3 7.1 8.4 0.9 1985…… 3.7 2.5 8.1 (6.0) 13.1 5.7 4.1 22.0 9.9 3.2 7.0 1986…… 2.1 0.9 10.2 (22.2) (4.8) (2.6) (5.6) (9.6) 4.9 3.7 0.9 1987…… 5.3 1.2 19.0 4.8 22.3 8.4 15.5 6.7 8.5 8.5 6.1 1988…… 4.8 4.8 11.4 19.9 34.2 29.1 20.8 (7.7) 5.5 8.3 5.5 1989…… 5.8 1.3 15.1 11.3 20.0 11.8 15.4 27.8 (1.7) 9.5 3.2 1990…… 4.2 3.6 1.7 (2.7) 1.0 24.8 1.4 (0.2) (1.1) 4.3 1.5 1991…… 0.6 5.7 (5.5) 5.7 2.5 0.3 (0.3) 13.4 1.6 0.9 0.3 1992…… 3.1 3.4 22.9 (21.9) (0.2) (0.2) 4.2 0.3 5.0 4.6 2.8 1993…… 3.3 1.4 2.5 (8.4) (3.0) 30.4 0.4 1.9 4.0 (0.6) 4.7 1994…… 4.1 0.9 0.6 21.8 13.6 44.4 10.0 15.0 6.6 16.2 2.6 1995…… 3.1 (1.7) (12.1) 9.6 2.2 (21.2) (5.1) (7.1) 6.1 1.3 2.6 1996…… 3.7 2.0 1.5 (11.7) 2.5 0.9 (1.2) 7.5 0.5 (0.8) 2.5 1997…… 3.7 (0.2) 4.9 33.3 10.6 5.7 12.5 (13.0) 4.0 7.1 3.3 1998…… 1.3 1.5 (13.4) (23.6) 10.6 23.7 (6.9) (4.2) 2.7 (1.1) 1.2 1999…… 2.5 0.7 (7.2) 11.0 0.5 (13.7) (1.4) 17.7 8.7 6.1 3.5 2000…… 3.1 3.8 0.6 (3.2) 8.4 21.0 3.9 1.3 8.7 7.7 4.6 2001…… 2.0 3.3 10.1 15.3 (1.8) 25.9 8.9 1.0 (0.8) 0.2 0.7 2002…… 3.7 1.5 16.6 (6.3) (2.7) (14.5) 1.7 (4.5) 0.7 0.1 4.0 2003…… 3.3 0.4 7.7 9.2 0.3 19.7 7.2 4.4 2.9 5.4 2.3 2004…… 4.5 (0.6) 17.2 10.3 12.4 14.2 14.1 15.7 5.2 7.8 3.9 2005…… 4.1 1.2 7.2 5.1 20.3 6.6 9.4 19.3 5.0 6.0 5.0 2006…… 6.0 1.2 7.2 18.4 16.0 6.1 11.6 3.5 3.9 7.9 4.4 2007…… 5.4 5.4 2.2 (5.3) 9.4 16.3 3.1 4.0 2.2 5.5 3.1 2008…… 2.4 4.0 (5.0) 14.7 0.3 4.9 1.7 5.7 (3.2) 0.8 0.7 2009…… 0.3 1.2 (8.6) (11.3) (24.0) (17.9) (13.5) 0.2 (6.7) (7.3) (2.4) 2010…… 3.8 0.7 0.2 7.0 18.1 10.1 6.2 7.6 7.8 8.9 2.9 2011…… 2.1 2.0 2.8 12.9 3.6 1.0 5.6 (20.5) 4.9 3.5 3.0 2012…… 2.0 1.7 7.2 8.8 4.2 (11.2) 5.2 9.6 3.1 3.8 2.3 2013…… 2.5 0.0 0.6 (2.1) (8.1) 2.6 (1.6) (8.7) 3.3 1.0 2.2 2014…… 3.5 (1.9) 6.0 9.9 8.8 (5.0) 6.7 6.5 7.4 5.1 3.7 2015…… 4.0 2.2 9.6 (12.2) (12.6) (16.5) (3.4) (1.6) (0.9) (1.0) 2.0 2016…… 3.2 1.7 15.0 (10.2) 13.3 1.6 6.4 2.1 3.2 5.0 2.8 2017…… 4.6 2.9 (0.2) 15.1 3.3 0.9 4.2 14.2 2.7 5.6 3.7 2018…… 2.3 3.0 (2.5) 1.7 5.5 7.0 0.4 6.3 4.2 2.9 2.6 2019…… n/a n/a n/a n/a n/a n/a n/a n/a n/a n/a n/a
(annual percentage change)
Source: Statistics Canada (Table 36-10-0222-01 – accessed June 2020).

Appendix 1 – Economic R
eview Supplem
entary Tables
82 | 2020 Financial and Econom
ic Review
– September 2020
Table A1.3 British Columbia GDP at Basic Prices, by Industry Crop and Fishing, Forestry Support Activities Mining, Quarrying Transportation Wholesale Finance Real Estate Real GDP
Animal Hunting and and for Agriculture Oil and Gas and and Retail and and Rental Other Public at Basic
Production Trapping Logging and Forestry Extraction Manufacturing Construction Utilities Warehousing Trade Insurance and Leasing Services1 Administration Prices
1997…… 1,548 317 2,299 708 7,146 11,247 10,208 3,277 8,152 12,424 8,554 21,233 45,749 9,304 141,853 1998 …… 1,609 212 2,334 737 7,024 11,101 9,125 3,422 8,203 13,027 8,103 21,783 47,359 9,320 143,234 1999 …… 1,722 165 2,195 695 7,163 12,603 8,993 3,647 8,460 13,287 8,682 22,453 47,952 9,641 147,986 2000 …… 1,677 182 2,039 783 7,897 14,789 8,823 4,252 9,019 13,874 8,468 23,086 49,409 9,836 154,966 2001 …… 1,978 151 2,013 723 8,856 13,713 8,971 3,038 8,997 14,356 8,371 23,815 50,472 10,038 155,831 2002 …… 1,950 187 2,057 659 8,158 13,748 9,566 3,706 9,126 15,111 8,545 25,241 52,793 10,473 161,762 2003 …… 2,086 184 2,036 706 8,015 13,934 10,337 3,642 9,166 15,690 8,848 26,011 54,213 10,421 165,800 2004 …… 2,217 205 2,306 671 8,392 15,050 11,639 3,659 9,461 16,341 9,349 26,909 55,273 10,464 172,580 2005 …… 2,292 196 2,290 693 9,382 15,719 12,582 4,139 10,257 17,084 9,650 28,230 57,119 10,467 180,855 2006 …… 2,375 218 2,188 678 9,410 16,602 13,777 3,511 10,357 18,284 10,604 29,385 60,086 10,986 189,186 2007 …… 2,503 174 2,055 694 8,196 16,438 14,616 4,384 10,414 19,389 11,112 30,979 62,279 11,291 194,683 2008 …… 2,411 149 1,813 599 8,429 15,122 15,384 4,373 10,197 19,324 10,863 31,654 63,339 11,925 195,789 2009 …… 2,529 156 1,248 604 7,548 13,029 14,532 4,282 10,196 18,413 10,683 32,807 62,136 12,619 190,709 2010 …… 2,581 181 1,533 621 8,587 13,798 14,895 4,143 10,433 19,032 11,170 33,943 62,064 12,779 195,819 2011 …… 2,656 172 1,814 694 9,218 14,272 14,987 4,529 10,749 19,375 11,470 34,980 63,356 13,015 201,413 2012 …… 2,655 150 1,860 678 8,942 14,693 16,797 4,587 10,983 20,058 11,404 36,365 64,681 12,736 206,591 2013 …… 2,810 172 2,011 670 9,188 14,623 16,699 4,507 11,534 21,065 11,821 37,657 66,167 12,666 211,555 2014 …… 2,792 196 1,977 702 9,729 15,427 18,167 4,554 12,154 21,480 12,110 39,164 68,203 12,473 219,061 2015 …… 2,973 195 1,970 733 9,423 15,845 18,108 4,805 12,624 21,627 12,569 40,757 69,803 12,607 224,153 2016 …… 2,921 174 1,807 721 9,668 16,517 18,322 5,023 12,847 22,551 13,010 42,387 71,929 12,754 230,764 2017 …… 2,881 157 1,755 730 9,683 17,538 19,825 5,002 13,774 23,891 13,566 43,671 74,095 13,135 239,852 2018 …… 3,066 153 1,844 755 10,848 17,621 20,562 4,833 14,374 24,124 13,942 44,275 76,173 13,615 246,260 2019 …… 3,306 119 1,488 759 10,920 17,383 22,650 4,868 14,729 24,310 14,432 45,753 78,322 13,958 253,049
(millions of 2012 $, chained)
1 Other Services includes health care and social assistance, professional, scientific and technical services, educational services, information and cultural industries, accommodation and food services, administrative and support, waste management and remediation services, arts, entertainment and recreation, and management of companies and enterprises.

2020 Financial and Econom
ic Review
– September 2020
| 83
Appendix 1 – Economic R
eview Supplem
entary Tables
Table A1.3 British Columbia GDP at Basic Prices, by Industry (continued )Crop and Fishing, Forestry Support Activities Mining, Quarrying Transportation Wholesale Finance Real Estate Real GDP
Animal Hunting and and for Agriculture Oil and Gas and and Retail and and Rental Other Public at Basic
Production Trapping Logging and Forestry Extraction Manufacturing Construction Utilities Warehousing Trade Insurance and Leasing Services1Administration Prices
1998 …… 4.0 (33.2) 1.5 4.1 (1.7) (1.3) (10.6) 4.4 0.6 4.9 (5.3) 2.6 3.5 0.2 1.0 1999 …… 7.0 (22.2) (6.0) (5.7) 2.0 13.5 (1.4) 6.6 3.1 2.0 7.1 3.1 1.3 3.4 3.3 2000 …… (2.6) 10.5 (7.1) 12.7 10.3 17.3 (1.9) 16.6 6.6 4.4 (2.5) 2.8 3.0 2.0 4.7 2001 …… 18.0 (17.1) (1.3) (7.6) 12.1 (7.3) 1.7 (28.5) (0.2) 3.5 (1.1) 3.2 2.2 2.0 0.6 2002 …… (1.4) 24.0 2.2 (8.8) (7.9) 0.3 6.6 22.0 1.4 5.3 2.1 6.0 4.6 4.3 3.8 2003 …… 7.0 (1.7) (1.0) 7.1 (1.8) 1.4 8.1 (1.7) 0.4 3.8 3.5 3.1 2.7 (0.5) 2.5 2004 …… 6.3 11.4 13.3 (5.1) 4.7 8.0 12.6 0.5 3.2 4.1 5.7 3.5 2.0 0.4 4.1 2005 …… 3.4 (4.6) (0.7) 3.3 11.8 4.4 8.1 13.1 8.4 4.5 3.2 4.9 3.3 0.0 4.8 2006 …… 3.6 11.6 (4.5) (2.2) 0.3 5.6 9.5 (15.2) 1.0 7.0 9.9 4.1 5.2 5.0 4.6 2007 …… 5.4 (20.1) (6.1) 2.4 (12.9) (1.0) 6.1 24.9 0.5 6.0 4.8 5.4 3.7 2.8 2.9 2008 …… (3.7) (14.3) (11.8) (13.7) 2.8 (8.0) 5.3 (0.3) (2.1) (0.3) (2.2) 2.2 1.7 5.6 0.6 2009 …… 4.9 4.4 (31.2) 0.9 (10.5) (13.8) (5.5) (2.1) (0.0) (4.7) (1.6) 3.6 (1.9) 5.8 (2.6) 2010 …… 2.1 15.9 22.9 2.7 13.8 5.9 2.5 (3.3) 2.3 3.4 4.6 3.5 (0.1) 1.3 2.7 2011 …… 2.9 (5.1) 18.3 11.8 7.3 3.4 0.6 9.3 3.0 1.8 2.7 3.1 2.1 1.8 2.9 2012 …… (0.0) (12.8) 2.6 (2.3) (3.0) 3.0 12.1 1.3 2.2 3.5 (0.6) 4.0 2.1 (2.1) 2.6 2013 …… 5.8 15.2 8.1 (1.2) 2.8 (0.5) (0.6) (1.7) 5.0 5.0 3.7 3.6 2.3 (0.5) 2.4 2014 …… (0.6) 13.5 (1.7) 4.7 5.9 5.5 8.8 1.0 5.4 2.0 2.4 4.0 3.1 (1.5) 3.5 2015…… 6.5 (0.1) (0.4) 4.5 (3.1) 2.7 (0.3) 5.5 3.9 0.7 3.8 4.1 2.3 1.1 2.3 2016…… (1.7) (11.0) (8.3) (1.7) 2.6 4.2 1.2 4.5 1.8 4.3 3.5 4.0 3.0 1.2 2.9 2017…… (1.4) (9.5) (2.9) 1.2 0.2 6.2 8.2 (0.4) 7.2 5.9 4.3 3.0 3.0 3.0 3.9 2018…… 6.4 (2.9) 5.1 3.5 12.0 0.5 3.7 (3.4) 4.4 1.0 2.8 1.4 2.8 3.7 2.7 2019…… 7.8 (21.9) (19.3) 0.5 0.7 (1.4) 10.2 0.7 2.5 0.8 3.5 3.3 2.8 2.5 2.8
Source: Statistics Canada (Table: 36-10-0402-01 – accessed June 2020).
(annual percentage change)
food services, administrative and support, waste management and remediation services, arts, entertainment and recreation, and management of companies and enterprises. 1 Other Services includes health care and social assistance, professional, scientific and technical services, educational services, information and cultural industries, accommodation and

Appendix 1 – Economic R
eview Supplem
entary Tables
84 | 2020 Financial and Econom
ic Review
– September 2020
Table A1.4 British Columbia GDP, Income Based Net Consumption of Consumption of Taxes less
Gross Operating Consumption of Fixed Capital: Gross Net Fixed Capital: Taxes less subsidies on GDPCompensation Operating Surplus: Fixed Capital: Government & Mixed Mixed Unincorporated subsidies on Products & Statistical at Marketof Employees* Surplus Corporations Corporations NPISH Income Income Businesses Production Imports Discrepancy Prices
1982…… 26,496 7,620 1,089 5,227 1,304 6,990 5,354 1,637 2,395 2,893 206 46,600 1983…… 27,018 9,080 2,334 5,374 1,372 7,446 5,732 1,714 2,847 2,884 54 49,329 1984…… 27,811 10,459 3,563 5,480 1,416 8,010 6,145 1,865 2,509 3,258 (260) 51,788 1985…… 29,101 11,850 4,746 5,636 1,468 8,824 6,843 1,981 2,531 3,699 (217) 55,788 1986…… 30,339 12,298 4,927 5,788 1,583 9,581 7,543 2,038 2,532 4,506 (302) 58,954 1987…… 32,837 14,358 6,902 5,858 1,598 10,290 8,103 2,187 2,607 5,152 (97) 65,147 1988…… 36,110 15,750 7,807 6,161 1,782 11,259 8,903 2,356 2,726 5,568 682 72,095 1989…… 40,296 16,007 7,385 6,694 1,928 12,432 9,827 2,605 2,888 6,697 123 78,443 1990…… 44,216 14,530 5,152 7,231 2,147 13,549 10,718 2,831 3,035 6,800 244 82,374 1991…… 46,296 13,330 3,871 7,304 2,155 14,555 11,560 2,995 2,964 7,593 237 84,975 1992…… 48,924 13,342 3,411 7,622 2,309 15,450 12,274 3,176 3,472 8,389 938 90,515 1993…… 51,312 15,377 5,079 7,926 2,372 16,133 12,698 3,435 3,952 9,112 1,335 97,221 1994…… 53,972 19,431 8,420 8,483 2,528 17,118 13,463 3,655 4,234 8,830 13 103,598 1995…… 56,768 21,649 9,975 9,011 2,663 17,851 14,052 3,799 4,268 9,242 (575) 109,203 1996…… 58,517 21,917 9,715 9,409 2,793 18,321 14,394 3,927 4,377 9,476 (68) 112,540 1997…… 60,781 24,129 11,400 9,759 2,970 18,704 14,700 4,004 4,665 10,211 96 118,585 1998…… 62,120 23,496 9,822 10,617 3,057 19,467 15,302 4,166 4,786 10,346 (441) 119,775 1999…… 64,216 25,733 11,594 10,972 3,167 20,272 16,061 4,211 4,919 10,676 (158) 125,658 2000…… 68,591 30,979 16,192 11,403 3,384 20,843 16,470 4,373 4,974 11,063 (39) 136,411 2001…… 70,309 30,003 14,546 11,966 3,491 22,099 17,467 4,633 5,076 11,312 16 138,815 2002…… 72,951 30,307 14,491 12,229 3,587 23,426 18,541 4,885 5,009 12,408 (108) 143,993 2003…… 75,268 33,813 17,612 12,514 3,687 24,741 19,781 4,960 5,122 13,108 (93) 151,958 2004…… 80,071 39,402 22,503 13,004 3,895 26,253 21,053 5,199 5,388 13,491 (5) 164,600 2005…… 85,336 43,994 25,971 13,824 4,199 27,827 22,337 5,490 5,679 14,219 142 177,197 2006…… 93,392 46,643 26,833 15,187 4,623 29,526 23,736 5,790 5,959 14,881 78 190,479 2007…… 98,459 47,607 25,901 16,597 5,109 31,784 25,438 6,345 6,505 15,799 287 200,440 2008…… 102,318 49,897 25,892 18,259 5,746 32,435 25,604 6,830 6,812 14,756 210 206,427 2009…… 100,375 41,901 17,293 18,789 5,819 33,771 26,845 6,925 7,038 14,969 125 198,179 2010…… 102,621 45,534 20,992 18,561 5,981 35,494 28,408 7,086 7,338 15,870 134 206,990 2011…… 106,845 51,238 25,450 19,437 6,351 36,872 29,536 7,336 7,216 16,493 107 218,771 2012…… 110,128 50,606 23,422 20,589 6,595 38,645 31,069 7,576 7,332 16,611 6 223,328 2013…… 114,300 51,647 23,263 21,550 6,834 40,286 32,361 7,925 8,129 16,784 (165) 230,981 2014…… 118,452 56,480 26,944 22,450 7,086 42,286 34,193 8,093 8,603 18,012 39 243,872 2015…… 123,805 55,116 23,835 23,883 7,398 43,935 35,527 8,408 8,736 19,057 135 250,784 2016…… 127,866 60,562 28,372 24,554 7,636 46,030 37,237 8,793 9,073 20,593 (212) 263,912 2017…… 135,921 66,526 33,474 25,056 7,996 48,928 39,485 9,443 9,648 21,863 (244) 282,642 2018…… 143,959 68,080 33,341 26,178 8,561 51,183 41,140 10,043 10,001 22,334 (156) 295,401 2019…… - - - - - - - - - - - -
($ millions)
*Component of income-based GDP, including wages, salaries and employers' social contributions earned in B.C. by residents and non-residents of the province.

2020 Financial and Econom
ic Review
– September 2020
| 85
Appendix 1 – Economic R
eview Supplem
entary Tables
Table A1.4 British Columbia GDP, Income Based (continued )Net Consumption of Consumption of Taxes less
Gross Operating Consumption of Fixed Capital: Gross Net Fixed Capital: Taxes less subsidies on GDPCompensation Operating Surplus: Fixed Capital: Government & Mixed Mixed Unincorporated subsidies on Products & Statistical at Marketof Employees* Surplus Corporations Corporations NPISH Income Income Businesses Production Imports Discrepancy Prices
1983…… 2.0 19.2 114.3 2.8 5.2 6.5 7.1 4.7 18.9 (0.3) (73.8) 5.9 1984…… 2.9 15.2 52.7 2.0 3.2 7.6 7.2 8.8 (11.9) 13.0 (581.5) 5.0 1985…… 4.6 13.3 33.2 2.8 3.7 10.2 11.4 6.2 0.9 13.5 (16.5) 7.7 1986…… 4.3 3.8 3.8 2.7 7.8 8.6 10.2 2.9 0.0 21.8 39.2 5.7 1987…… 8.2 16.8 40.1 1.2 0.9 7.4 7.4 7.3 3.0 14.3 (67.9) 10.5 1988…… 10.0 9.7 13.1 5.2 11.5 9.4 9.9 7.7 4.6 8.1 (803.1) 10.7 1989…… 11.6 1.6 (5.4) 8.7 8.2 10.4 10.4 10.6 5.9 20.3 (82.0) 8.8 1990…… 9.7 (9.2) (30.2) 8.0 11.4 9.0 9.1 8.7 5.1 1.5 98.4 5.0 1991…… 4.7 (8.3) (24.9) 1.0 0.4 7.4 7.9 5.8 (2.3) 11.7 (2.9) 3.2 1992…… 5.7 0.1 (11.9) 4.4 7.1 6.1 6.2 6.0 17.1 10.5 295.8 6.5 1993…… 4.9 15.3 48.9 4.0 2.7 4.4 3.5 8.2 13.8 8.6 42.3 7.4 1994…… 5.2 26.4 65.8 7.0 6.6 6.1 6.0 6.4 7.1 (3.1) (99.0) 6.6 1995…… 5.2 11.4 18.5 6.2 5.3 4.3 4.4 3.9 0.8 4.7 (4,523.1) 5.4 1996…… 3.1 1.2 (2.6) 4.4 4.9 2.6 2.4 3.4 2.6 2.5 (88.2) 3.1 1997…… 3.9 10.1 17.3 3.7 6.3 2.1 2.1 2.0 6.6 7.8 (241.2) 5.4 1998…… 2.2 (2.6) (13.8) 8.8 2.9 4.1 4.1 4.0 2.6 1.3 (559.4) 1.0 1999…… 3.4 9.5 18.0 3.3 3.6 4.1 5.0 1.1 2.8 3.2 (64.2) 4.9 2000…… 6.8 20.4 39.7 3.9 6.9 2.8 2.5 3.8 1.1 3.6 (75.3) 8.6 2001…… 2.5 (3.2) (10.2) 4.9 3.2 6.0 6.1 5.9 2.1 2.3 (141.0) 1.8 2002…… 3.8 1.0 (0.4) 2.2 2.7 6.0 6.1 5.4 (1.3) 9.7 (775.0) 3.7 2003…… 3.2 11.6 21.5 2.3 2.8 5.6 6.7 1.5 2.3 5.6 (13.9) 5.5 2004…… 6.4 16.5 27.8 3.9 5.6 6.1 6.4 4.8 5.2 2.9 (94.6) 8.3 2005…… 6.6 11.7 15.4 6.3 7.8 6.0 6.1 5.6 5.4 5.4 (2,940.0) 7.7 2006…… 9.4 6.0 3.3 9.9 10.1 6.1 6.3 5.5 4.9 4.7 (45.1) 7.5 2007…… 5.4 2.1 (3.5) 9.3 10.5 7.6 7.2 9.6 9.2 6.2 267.9 5.2 2008…… 3.9 4.8 (0.0) 10.0 12.5 2.0 0.7 7.6 4.7 (6.6) (26.8) 3.0 2009…… (1.9) (16.0) (33.2) 2.9 1.3 4.1 4.8 1.4 3.3 1.4 (40.5) (4.0) 2010…… 2.2 8.7 21.4 (1.2) 2.8 5.1 5.8 2.3 4.3 6.0 7.2 4.4 2011…… 4.1 12.5 21.2 4.7 6.2 3.9 4.0 3.5 (1.7) 3.9 (20.1) 5.7 2012…… 3.1 (1.2) (8.0) 5.9 3.8 4.8 5.2 3.3 1.6 0.7 (94.4) 2.1 2013…… 3.8 2.1 (0.7) 4.7 3.6 4.2 4.2 4.6 10.9 1.0 (2,850.0) 3.4 2014…… 3.6 9.4 15.8 4.2 3.7 5.0 5.7 2.1 5.8 7.3 (123.6) 5.6 2015…… 4.5 (2.4) (11.5) 6.4 4.4 3.9 3.9 3.9 1.5 5.8 246.2 2.8 2016…… 3.3 9.9 19.0 2.8 3.2 4.8 4.8 4.6 3.9 8.1 (257.0) 5.2 2017…… 6.3 9.8 18.0 2.0 4.7 6.3 6.0 7.4 6.3 6.2 15.1 7.1 2018…… 5.9 2.3 (0.4) 4.5 7.1 4.6 4.2 6.4 3.7 2.2 (36.1) 4.5 2019…… - - - - - - - - - - - -
* Component of income-based GDP, including wages, salaries and employers' social contributions earned in B.C. by residents and non-residents of the province. Source: Statistics Canada (Table: 36-10-0221-01 – accessed June 2020).
(annual percentage change)
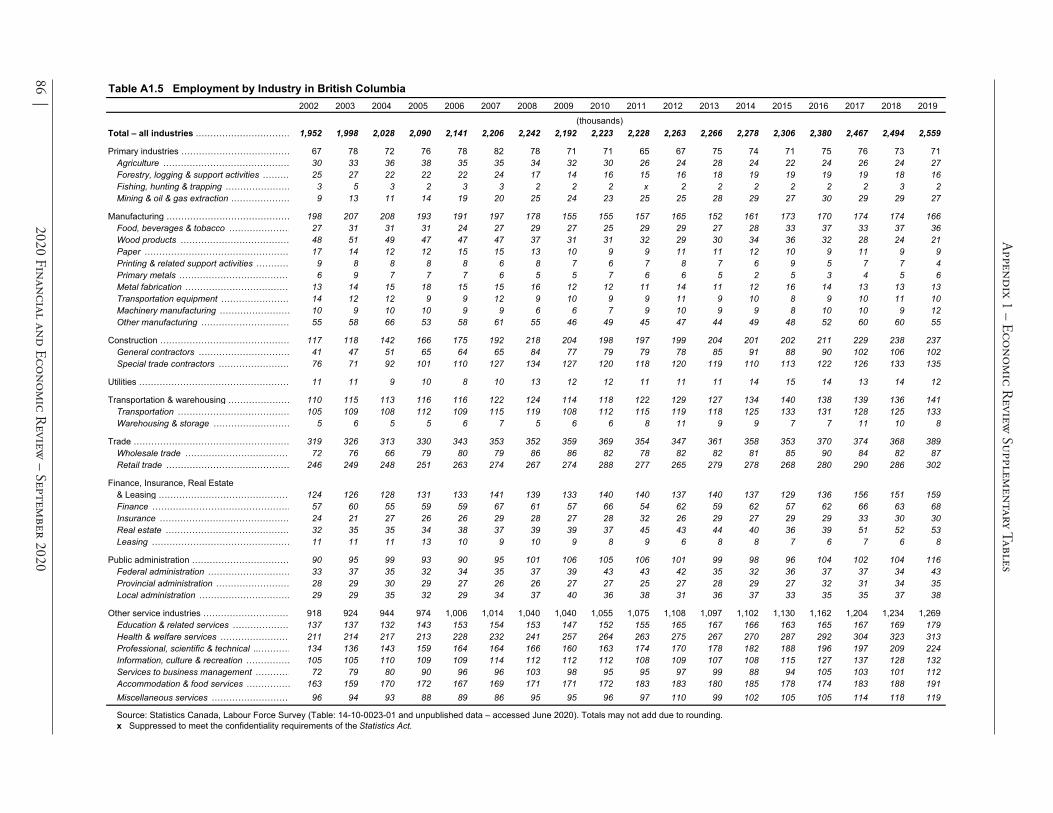
Appendix 1 – Economic R
eview Supplem
entary Tables
86 | 2020 Financial and Econom
ic Review
– September 2020
Table A1.5 Employment by Industry in British Columbia 2002 2003 2004 2005 2006 2007 2008 2009 2010 2011 2012 2013 2014 2015 2016 2017 2018 2019
Total – all industries …………………………… 1,952 1,998 2,028 2,090 2,141 2,206 2,242 2,192 2,223 2,228 2,263 2,266 2,278 2,306 2,380 2,467 2,494 2,559
Primary industries ………………………………… 67 78 72 76 78 82 78 71 71 65 67 75 74 71 75 76 73 71 Agriculture ……………………………………… 30 33 36 38 35 35 34 32 30 26 24 28 24 22 24 26 24 27 Forestry, logging & support activities ……… 25 27 22 22 22 24 17 14 16 15 16 18 19 19 19 19 18 16 Fishing, hunting & trapping …………………… 3 5 3 2 3 3 2 2 2 x 2 2 2 2 2 2 3 2 Mining & oil & gas extraction .………………… 9 13 11 14 19 20 25 24 23 25 25 28 29 27 30 29 29 27
Manufacturing …………………………………… 198 207 208 193 191 197 178 155 155 157 165 152 161 173 170 174 174 166 Food, beverages & tobacco ………………… 27 31 31 31 24 27 29 27 25 29 29 27 28 33 37 33 37 36 Wood products ………………………………… 48 51 49 47 47 47 37 31 31 32 29 30 34 36 32 28 24 21 Paper …………………………………………… 17 14 12 12 15 15 13 10 9 9 11 11 12 10 9 11 9 9 Printing & related support activities ………… 9 8 8 8 8 6 8 7 6 7 8 7 6 9 5 7 7 4 Primary metals ………………………………… 6 9 7 7 7 6 5 5 7 6 6 5 2 5 3 4 5 6 Metal fabrication ……………………………… 13 14 15 18 15 15 16 12 12 11 14 11 12 16 14 13 13 13 Transportation equipment …………………… 14 12 12 9 9 12 9 10 9 9 11 9 10 8 9 10 11 10 Machinery manufacturing …………………… 10 9 10 10 9 9 6 6 7 9 10 9 9 8 10 10 9 12 Other manufacturing ………………………… 55 58 66 53 58 61 55 46 49 45 47 44 49 48 52 60 60 55
Construction ……………………………………… 117 118 142 166 175 192 218 204 198 197 199 204 201 202 211 229 238 237 General contractors …………………………… 41 47 51 65 64 65 84 77 79 79 78 85 91 88 90 102 106 102 Special trade contractors …………………… 76 71 92 101 110 127 134 127 120 118 120 119 110 113 122 126 133 135
Utilities …………………………………………… 11 11 9 10 8 10 13 12 12 11 11 11 14 15 14 13 14 12
Transportation & warehousing ………………… 110 115 113 116 116 122 124 114 118 122 129 127 134 140 138 139 136 141 Transportation ………………………………… 105 109 108 112 109 115 119 108 112 115 119 118 125 133 131 128 125 133 Warehousing & storage ……………………… 5 6 5 5 6 7 5 6 6 8 11 9 9 7 7 11 10 8
Trade ……………………………………………… 319 326 313 330 343 353 352 359 369 354 347 361 358 353 370 374 368 389 Wholesale trade ……………………………… 72 76 66 79 80 79 86 86 82 78 82 82 81 85 90 84 82 87 Retail trade …………………………………… 246 249 248 251 263 274 267 274 288 277 265 279 278 268 280 290 286 302
Finance, Insurance, Real Estate & Leasing ……………………………………… 124 126 128 131 133 141 139 133 140 140 137 140 137 129 136 156 151 159 Finance ………………………………………… 57 60 55 59 59 67 61 57 66 54 62 59 62 57 62 66 63 68 Insurance ……………………………………… 24 21 27 26 26 29 28 27 28 32 26 29 27 29 29 33 30 30 Real estate …………………………………… 32 35 35 34 38 37 39 39 37 45 43 44 40 36 39 51 52 53 Leasing ………………………………………… 11 11 11 13 10 9 10 9 8 9 6 8 8 7 6 7 6 8
Public administration …………………………… 90 95 99 93 90 95 101 106 105 106 101 99 98 96 104 102 104 116 Federal administration ………………………… 33 37 35 32 34 35 37 39 43 43 42 35 32 36 37 37 34 43 Provincial administration ……………………… 28 29 30 29 27 26 26 27 27 25 27 28 29 27 32 31 34 35 Local administration …………………………… 29 29 35 32 29 34 37 40 36 38 31 36 37 33 35 35 37 38
Other service industries ………………………… 918 924 944 974 1,006 1,014 1,040 1,040 1,055 1,075 1,108 1,097 1,102 1,130 1,162 1,204 1,234 1,269 Education & related services ………………… 137 137 132 143 153 154 153 147 152 155 165 167 166 163 165 167 169 179 Health & welfare services …………………… 211 214 217 213 228 232 241 257 264 263 275 267 270 287 292 304 323 313 Professional, scientific & technical ..………… 134 136 143 159 164 164 166 160 163 174 170 178 182 188 196 197 209 224 Information, culture & recreation …………… 105 105 110 109 109 114 112 112 112 108 109 107 108 115 127 137 128 132 Services to business management ………… 72 79 80 90 96 96 103 98 95 95 97 99 88 94 105 103 101 112 Accommodation & food services …………… 163 159 170 172 167 169 171 171 172 183 183 180 185 178 174 183 188 191 Miscellaneous services ……………………… 96 94 93 88 89 86 95 95 96 97 110 99 102 105 105 114 118 119
(thousands)
Source: Statistics Canada, Labour Force Survey (Table: 14-10-0023-01 and unpublished data – accessed June 2020). Totals may not add due to rounding.x Suppressed to meet the confidentiality requirements of the Statistics Act.

2020 Financial and Economic Review – September 2020 | 87
Appendix 1 – Economic Review Supplementary Tables
Table A1.6 Capital Investment by Industry Preliminary 2018 2019
Actual Actual Actual Actual Actual Intentions to to2015 2016 2017 2018 2019 2020 2019 2020
(per cent)Agriculture, forestry, fishing and hunting ……………… 454.3 511.3 696.8 979.9 1,036.9 852.3 5.8 (17.8)
5,147.4 4,573.3 6,250.8 4,449.5 4,085.9 3,976.9 (8.2) (2.7) 2,629.0 x 1,370.5 1,831.4 1,872.9 2,003.7 2.3 7.0
717.0 832.9 978.2 1,063.1 1,158.8 1,237.4 9.0 6.8 Transportation and warehousing ………………………… 3,928.9 4,215.0 4,822.1 6,251.5 11,363.7 13,222.5 81.8 16.4 Utilities ……………………………………………………… 3,369.0 3,698.0 3,535.0 4,203.6 5,062.6 5,923.7 20.4 17.0
422.1 x 421.4 514.5 x 452.8 - -F 809.7 713.9 x 855.0 841.3 - (1.6)
309.1 341.9 250.6 318.6 399.7 370.3 25.5 (7.4)
1,171.4 1,638.5 1,629.1 1,953.4 2,185.5 2,140.9 11.9 (2.0) 1,205.1 1,579.9 1,631.0 1,617.1 1,590.4 F (1.7) -
316.1 318.8 307.5 424.1 457.3 471.6 7.8 3.1 29.1 x F x 74.1 72.6 - (2.0)
F 194.2 200.8 220.5 x 252.2 - -268.0 275.6 305.8 338.7 356.0 325.0 5.1 (8.7)
Accommodation and food services ……………………… 688.6 665.9 581.3 721.2 724.3 F 0.4 -976.2 980.1 1,087.3 1,499.2 1,359.5 1,541.0 (9.3) 13.4
Health care and social assistance ……………………… 1,154.1 1,198.1 1,050.7 1,158.5 1,233.1 F 6.4 -Public administration ……………………………………… 2,446.9 2,172.2 2,965.5 3,407.2 4,008.5 4,294.9 17.6 7.1 Other services ……………………………………………… F x 171.2 249.4 x F - -Total ………………………………………………………… 26,344.3 26,357.8 28,999.9 32,037.9 38,797.9 41,822.8 21.1 7.8
Public ……………………………………………………… 8,011.9 8,423.1 9,173.3 10,350.2 12,062.1 14,343.1 16.5 18.9 Private ……………………………………………………… 18,332.4 17,934.7 19,826.6 21,687.8 26,735.8 27,479.7 23.3 2.8 Total ……………………………………………………… 26,344.3 26,357.8 28,999.9 32,037.9 38,797.9 41,822.8 21.1 7.8
Machinery and equipment ……………………………… 8,488.6 10,180.1 10,183.1 11,714.3 12,261.3 11,745.9 4.7 (4.2) Construction ……………………………………………… 17,855.7 16,177.7 18,816.8 20,323.6 26,536.6 30,076.9 30.6 13.3 Total ………………………………………………………… 26,344.3 26,357.8 28,999.9 32,037.9 38,797.9 41,822.8 21.1 7.8
Housing …………………………………………………… 16,123.3 18,802.3 19,557.1 22,701.5 22,916.5 n/a 0.9 n/a
Source: Statistics Canada (Tables: 34-10-0035-01, 34-10-0038-01, 34-10-0175-01 – accessed June 2020).x Suppressed to meet the confidentiality requirements of the Statistics Act.F Too unreliable to be published.Note: Totals may not add due to rounding or due to some data not being disclosed for confidentiality reasons.
($ millions)
Real estate, rental and leasing ……………………………Information and cultural industries ………………………
Educational services ………………………………………
Professional, scientific and technical services…………Management of companies and enterprises ……………Admin, waste and remediation services …………………Arts, entertainment and recreation ………………………
Finance and insurance ……………………………………
Mining, quarrying, and oil and gas extraction …………Manufacturing ………………………………………………Construction ………………………………………………
Wholesale trade……………………………………………Retail trade …………………………………………………
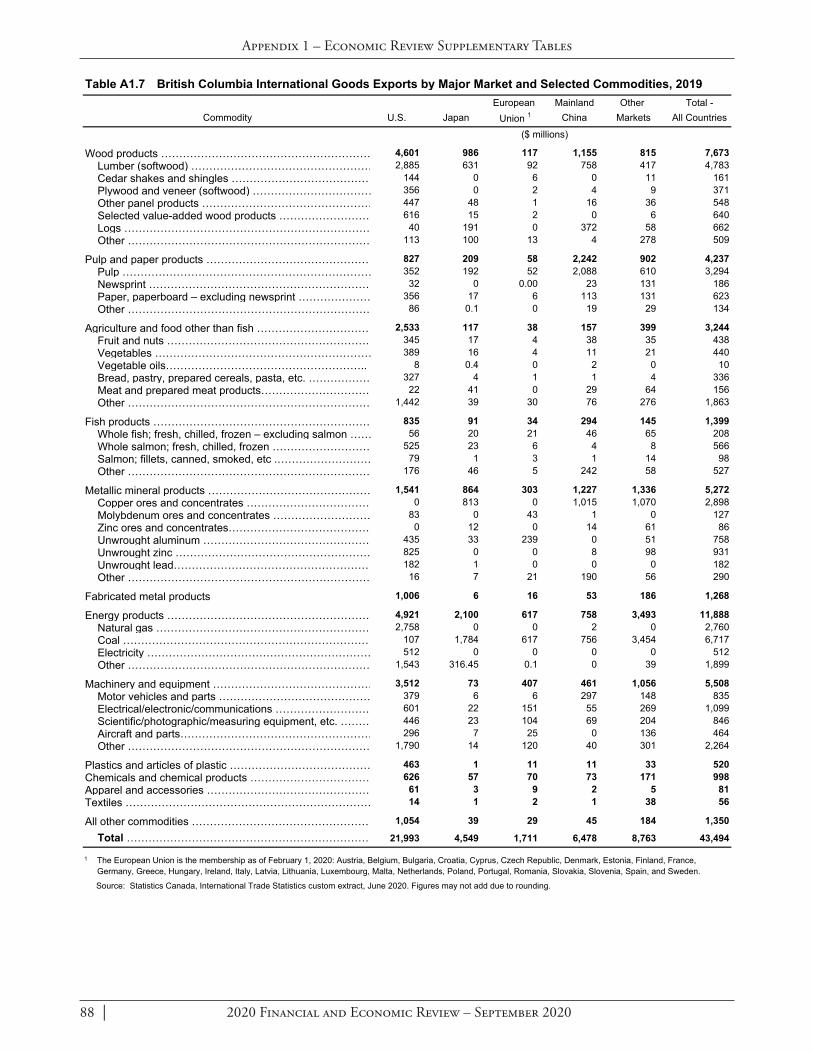
Appendix 1 – Economic Review Supplementary Tables
88 | 2020 Financial and Economic Review – September 2020
Table A1.7 British Columbia International Goods Exports by Major Market and Selected Commodities, 2019European Mainland Other Total -
Commodity U.S. Japan Union 1 China Markets All Countries
($ millions)
Wood products …………………………………………………… 4,601 986 117 1,155 815 7,673Lumber (softwood) …………………………………………… 2,885 631 92 758 417 4,783Cedar shakes and shingles ………………………………… 144 0 6 0 11 161Plywood and veneer (softwood) …………………………… 356 0 2 4 9 371Other panel products ………………………………………… 447 48 1 16 36 548Selected value-added wood products ……………………… 616 15 2 0 6 640Logs …………………………………………………………… 40 191 0 372 58 662Other …………………………………………………………… 113 100 13 4 278 509
Pulp and paper products ………………………………………… 827 209 58 2,242 902 4,237Pulp …………………………………………………………… 352 192 52 2,088 610 3,294Newsprint ……………………………………………………… 32 0 0.00 23 131 186Paper, paperboard – excluding newsprint ………………… 356 17 6 113 131 623Other …………………………………………………………… 86 0.1 0 19 29 134
Agriculture and food other than fish …………………………… 2,533 117 38 157 399 3,244Fruit and nuts ………………………………………………… 345 17 4 38 35 438Vegetables …………………………………………………… 389 16 4 11 21 440Vegetable oils……………………………………………….. 8 0.4 0 2 0 10Bread, pastry, prepared cereals, pasta, etc. ……………… 327 4 1 1 4 336Meat and prepared meat products………………………… 22 41 0 29 64 156Other …………………………………………………………… 1,442 39 30 76 276 1,863
Fish products …………………………………………………… 835 91 34 294 145 1,399Whole fish; fresh, chilled, frozen – excluding salmon …… 56 20 21 46 65 208Whole salmon; fresh, chilled, frozen ……………………… 525 23 6 4 8 566Salmon; fillets, canned, smoked, etc .……………………… 79 1 3 1 14 98Other …………………………………………………………… 176 46 5 242 58 527
Metallic mineral products ……………………………………… 1,541 864 303 1,227 1,336 5,272Copper ores and concentrates ……………………………… 0 813 0 1,015 1,070 2,898Molybdenum ores and concentrates ……………………… 83 0 43 1 0 127Zinc ores and concentrates………………………………… 0 12 0 14 61 86Unwrought aluminum ………………………………………… 435 33 239 0 51 758Unwrought zinc ……………………………………………… 825 0 0 8 98 931Unwrought lead………………………………………………… 182 1 0 0 0 182Other …………………………………………………………… 16 7 21 190 56 290
Fabricated metal products 1,006 6 16 53 186 1,268
Energy products ………………………………………………… 4,921 2,100 617 758 3,493 11,888Natural gas …………………………………………………… 2,758 0 0 2 0 2,760Coal …………………………………………………………… 107 1,784 617 756 3,454 6,717Electricity ……………………………………………………… 512 0 0 0 0 512Other …………………………………………………………… 1,543 316.45 0.1 0 39 1,899
Machinery and equipment ……………………………………… 3,512 73 407 461 1,056 5,508Motor vehicles and parts …………………………………… 379 6 6 297 148 835Electrical/electronic/communications ……………………… 601 22 151 55 269 1,099Scientific/photographic/measuring equipment, etc. ……… 446 23 104 69 204 846Aircraft and parts……………………………………………… 296 7 25 0 136 464Other …………………………………………………………… 1,790 14 120 40 301 2,264
Plastics and articles of plastic ………………………………… 463 1 11 11 33 520Chemicals and chemical products …………………………… 626 57 70 73 171 998Apparel and accessories ……………………………………… 61 3 9 2 5 81Textiles …………………………………………………………… 14 1 2 1 38 56
All other commodities …………………………………………… 1,054 39 29 45 184 1,350
Total …………………………………………………………… 21,993 4,549 1,711 6,478 8,763 43,494
1
Source: Statistics Canada, International Trade Statistics custom extract, June 2020. Figures may not add due to rounding.
The European Union is the membership as of February 1, 2020: Austria, Belgium, Bulgaria, Croatia, Cyprus, Czech Republic, Denmark, Estonia, Finland, France, Germany, Greece, Hungary, Ireland, Italy, Latvia, Lithuania, Luxembourg, Malta, Netherlands, Poland, Portugal, Romania, Slovakia, Slovenia, Spain, and Sweden.

2020 Financial and Economic Review – September 2020 | 89
Appendix 1 – Economic Review Supplementary Tables
Table A1.8 British Columbia International Goods Exports by Market Area% Change Percent of Total
2017 2018 2019 2018-2019 2018 2019($ millions) (per cent)
United Kingdom………………………………… 412 501 468 (6.7) 1.1 1.1 Germany………………………………………… 366 339 365 7.8 0.7 0.8 Mainland China………………………………… 6,374 6,723 6,478 (3.6) 14.5 14.9 Hong Kong……………………………………… 221 247 190 (23.1) 0.5 0.4 Taiwan…………………………………………… 690 956 826 (13.7) 2.1 1.9 Japan…………………………………………… 4,503 5,081 4,549 (10.5) 11.0 10.5 South Korea…………………………………… 2,879 2,941 2,663 (9.5) 6.3 6.1 India……………………………………………… 1,010 1,583 1,581 (0.1) 3.4 3.6 Australia………………………………………… 273 252 246 (2.5) 0.5 0.6 Mexico…………………………………………… 252 198 180 (9.2) 0.4 0.4 United States…………………………………… 22,289 22,726 21,993 (3.2) 49.0 50.6 Other…………………………………………… 3,971 4,792 3,956 (17.4) 10.3 9.1
Total………………………………… 43,241 46,340 43,494 (6.1) 100.0 100.0
Market Areas:Western Europe 1……………………………… 1,959 2,313 2,098 (9.3) 5.0 4.8 Pacific Rim 2…………………………………… 15,989 17,824 16,178 (9.2) 38.5 37.2 1
2
Source: Statistics Canada, International Trade Statistics custom extract, June 2020. Figures may not add due to rounding.
Austria, Belgium, Denmark, Finland, France, Germany, Greece, Iceland, Ireland, Italy, Luxembourg, Netherlands, Norway, Portugal, Spain, Sweden, Switzerland and the United Kingdom. Australia, Brunei Darussalam, China, Fiji, Hong Kong, Indonesia, Japan, Laos, Macau, Malaysia, Mongolia, New Zealand, North Korea, Philippines, Singapore, South Korea, Taiwan, Thailand and Vietnam.

Appendix 1 – Economic Review Supplementary Tables
90 | 2020 Financial and Economic Review – September 2020
Table A1.9 Historical Commodity Prices (in US Dollars)2009 2010 2011 2012 2013 2014 2015 2016 2017 2018 2019
MetalsCopper (London; $/lb) …………….. 2.35 3.42 4.00 3.61 3.32 3.11 2.49 2.21 2.80 2.96 2.73 Lead (London; $/lb) ………….…..… 0.78 0.97 1.09 0.93 0.97 0.95 0.81 0.85 1.05 1.02 0.91 Zinc (London; $/lb) ……………...… 0.75 0.98 0.99 0.88 0.86 0.98 0.87 0.95 1.31 1.33 1.16 Gold (London; $/troy oz) …….…… 973 1,225 1,572 1,667 1,407 1,266 1,159 1,251 1,257 1,269 1,391 Silver (London; $/troy oz) ………… 14.68 20.17 35.12 31.12 23.72 19.07 15.68 17.16 17.05 15.71 16.19 Molybdenum ($/lb) …………....…… 11.05 15.68 15.47 12.80 10.33 11.40 6.74 6.56 7.21 10.52 11.34 Aluminum (London; $/lb) ………..… 0.76 0.99 1.09 0.92 0.84 0.85 0.75 0.73 0.89 0.96 0.81
Forest ProductsLumber (Madison's
Lumber Reporter; WSPF, 2x4, $/1000 bd ft) ……… 182 255 254 299 358 353 281 308 411 496 372
Pulp (Northern Europe; $/tonne; transaction price) …………………….....……… 665 937 955 813 864 928 849 803 898 1,184 955
Newsprint (US Eastcoast; $/tonne) ………….…………….… 549 596 637 637 593 583 517 540 557 669 667
Cedar (Madison'sLumber Reporter2x4, $/1000 bd ft) ……….…….… 623 650 636 769 895 957 986 1,004 1,299 1,396 1,386
OtherOil (West Texas
Intermediate;$/barrel) ……………….…………… 62 79 95 94 98 93 49 43 51 65 57
Natural Gas (Plant Inlet; $C/GJ) ……………....…………… 3.03 2.95 2.46 1.35 2.04 3.12 1.37 0.99 1.14 0.79 0.79
Coal (Japan-AustraliaFOB $/t)Metallurgical ............................... 125 204 282 204 155 124 101 112 201 207 183 Low Volatile PCl ........................ 90 170 222 153 125 104 84 88 142 146 131 Thermal ................................... 70 98 130 114 95 82 68 62 85 110 99
Sources: Ministry of Finance; Ministry of Energy, Mines and Petroleum Resources; Ministry of Forests, Lands, Natural Resource Operations and Rural Development; US Department of Energy.

2020 Financial and Economic Review – September 2020 | 91
Appendix 1 – Economic Review Supplementary Tables
Table A1.10 British Columbia Forest Sector Economic Activity IndicatorsChange1
Indicator 2010 2011 2012 2013 2014 2015 2016 2017 2018 2019 2018-2019Wood production (per cent)
Lumber ………………………………………… 26.8 28.4 29.2 30.0 29.6 30.6 31.4 30.3 29.2 22.8 (21.8) Timber Scaled by species
Lodgepole pine …………………………… 29.1 29.8 27.7 26.7 23.4 24.1 20.3 15.9 15.1 10.9 (27.6) Spruce ……………………………………… 8.9 10.5 11.5 12.6 11.6 13.3 13.1 15.8 15.3 12.2 (20.5) Hemlock …………………………………… 6.8 8.6 7.7 8.5 8.1 7.2 7.6 7.1 8.0 6.6 (17.3) Douglas fir ………………………………… 7.6 9.2 8.9 9.8 10.1 9.7 10.7 10.9 13.3 10.9 (18.2) Balsam ……………………………………… 4.2 5.1 5.5 6.1 6.1 6.3 6.8 7.7 8.6 7.2 (16.0) Cedar ……………………………………… 4.1 3.7 4.3 4.6 4.4 4.8 4.9 4.2 4.3 3.7 (15.3) All others …………………………………… 2.7 2.7 2.6 2.7 2.7 3.2 2.8 2.9 3.0 2.2 (26.4)
Total 2………………………………………… 63.3 69.6 68.1 71.1 66.4 68.7 66.2 64.5 67.6 53.7 (20.6)
Pulp and paper production …………………… 5.9 6.1 5.9 5.7 5.7 5.6 5.4 5.3 5.1 4.9 (3.9) Market pulp …………………………………… 4.3 4.5 4.4 4.3 4.3 4.3 4.2 4.2 4.1 4.1 0.0 Newsprint, paper and paperboard ………… 1.6 1.6 1.4 1.4 1.4 1.3 1.1 1.1 1.0 0.8 (19.4)
Industrial product price indicesSoftwood lumber (Canada) ………………… 100.0 96.5 106.6 125.6 133.7 135.5 141.7 162.6 179.1 152.1 (15.0) Spruce-Pine-Fir lumber (BC) ……………… 100.0 96.1 104.8 123.1 130.5 131.7 139.9 155.6 171.2 148.6 (13.2) Hemlock lumber (BC) ……………………… 100.0 98.8 112.0 139.7 150.0 149.4 161.1 202.1 220.7 183.5 (16.9) Douglas fir and Western larch (BC) ………… 100.0 100.0 103.8 115.8 125.7 130.0 136.0 150.9 161.7 148.4 (8.3) Veneer and plywood (Canada) …………… 100.0 95.8 104.0 104.9 112.5 115.0 116.5 128.2 134.9 126.2 (6.5) Wood pulp (Canada) ………………………… 100.0 95.8 94.7 98.5 97.9 97.9 96.9 111.2 136.4 129.2 (5.2) Newsprint for export (Canada) ……………… 100.0 101.0 101.8 102.4 105.4 117.1 119.8 120.5 129.9 139.6 7.5
1 Percentage change based on unrounded numbers.2 Totals may not add due to rounding.
Sources: Wood Production: Lumber and Timber scaled by species – Ministry of Forests, Lands, Natural Resource Operations, and Rural Development. Pulp and paper production – Pulp and Paper Products Council.
Industrial product price indices – Statistics Canada (Tables: 18-10-0030-01 and 18-10-0031-01 – accessed June 2020).
Timber scaled data includes all logs, special forest products, species and grades billed to crown, private and federal land. Waste, reject, and Christmas trees are excluded.
For all scale invoiced as of date of reporting – June 1, 2020
(million cubic meters)
(million tonnes)
(2010=100)

Appendix 1 – Economic Review Supplementary Tables
92 | 2020 Financial and Economic Review – September 2020
Table A1.11 Historical Value of Mineral, Petroleum and Natural Gas ShipmentsIndustrial Construction Natural Gas Other oil
Year Metals Minerals 1 Aggregates 2 Coal Crude Oil 3 to Pipeline and Gas 4 Total
1991 …………………… 1,511 290 159 990 260 562 36 3,808 1992 …………………… 1,502 212 157 706 260 592 38 3,467 1993 …………………… 1,198 229 166 822 233 814 42 3,504 1994 …………………… 1,354 237 180 861 235 991 44 3,902 1995 …………………… 2,016 249 204 968 272 710 58 4,478 1996 …………………… 1,537 251 189 1,027 441 817 75 4,337 1997 …………………… 1,495 249 195 1,107 403 1,087 98 4,635 1998 …………………… 1,484 245 208 956 373 1,154 47 4,467 1999 …………………… 1,183 246 219 797 461 1,577 53 4,536 2000 …………………… 1,571 284 224 812 843 3,826 114 7,674 2001 …………………… 1,394 296 217 959 729 4,834 103 8,533 2002 …………………… 1,288 310 231 1,035 714 3,458 79 7,115 2003 …………………… 1,353 336 226 972 718 5,396 116 9,117 2004 .…………………… 1,956 355 239 1,191 824 5,827 133 10,524 2005 …………………… 2,442 364 278 2,300 973 7,821 173 14,351 2006 …………………… 3,248 363 274 2,105 1,013 5,956 179 13,139 2007 …………………… 2,887 424 351 1,949 989 5,745 200 12,546 2008 …………………… 2,590 696 379 3,738 1,215 7,525 524 16,667 2009 …………………… 1,837 278 303 3,204 720 3,284 115 9,742 2010 …………………… 2,191 349 373 4,253 930 3,437 161 11,694 2011…………………… 2,131 454 325 6,073 1,194 3,444 307 13,926 2012 …………………… 2,360 461 370 4,635 1,208 1,934 273 11,241 2013…………………… 2,578 450 388 3,696 1,295 3,129 251 11,787 2014 …………………… 3,302 x 312 x 1,516 5,170 310 13,812 2015 …………………… 3,250 x 338 x 959 2,445 139 9,729 2016 …………………… 2,942 x 339 x 1,056 1,919 105 9,783 2017 …………………… 3,351 x 464 x 1,521 2,207 237 13,481 2018 …………………… 3,694 x 537 x 2,545 1,726 485 14,539 2019 …………………… 3,416 x 543 x 2,465 1,661 177 13,102 1 Shipments of gypsum and silica to Canadian cement, lime and clay plants are not included in this table. 2 Sand and gravel; stone. 3 Includes pentanes and condensate. 4 Liquefied petroleum gases and sulphur. x Suppressed to meet the confidentiality requirements of the Statistics Act.
Sources: Natural Resources Canada; Ministry of Energy, Mines and Petroleum Resources.
($ millions)
Table A1.12 Petroleum and Natural Gas Activity IndicatorsProvincial
Natural gas Crude oil and Raw gas Oil Government
production wellhead condensate (remaining (remaining petroleum and
(wellhead) production Wells Authorized Wells Drilled reserves) reserves) natural gas revenue 1
(billion cubic m) (million cubic m) (number) (number) (billion cubic m) (million cubic m) ($ millions)
2004……………… 32.0 2.2 1,700 1,282 389.7 21.9 1,794.4 2005……………… 32.8 2.0 1,790 1,429 444.6 20.9 2,559.0 2006……………… 32.8 1.9 1,730 1,435 462.4 18.2 2,139.1 2007……………… 31.9 1.8 1,207 909 482.9 19.7 2,352.8 2008……………… 33.5 1.6 1,408 929 605.3 18.5 4,093.9 2009……………… 32.9 1.5 829 626 657.9 19.3 1,464.2 2010……………… 35.0 1.6 871 714 932.0 18.7 1,384.0 2011……………… 41.4 1.5 1,133 661 974.9 18.2 735.0 2012……………… 41.0 1.6 647 484 1,138.5 19.1 440.0 2013……………… 44.6 1.5 907 571 1,197.2 19.3 723.0 2014…………….... 47.2 1.8 1,253 706 1,443.9 18.1 1,230.4 2015…………….... 49.0 1.9 913 546 1,504.7 17.6 345.9 2016…………….... 50.7 2.3 479 356 1,485.1 16.5 282.4 2017…………….... 51.5 2.5 870 621 1,354.8 18.2 486.4 2018…………….... 58.9 3.6 897 446 1,434.1 18.3 424.0 2019…………….... 58.8 3.7 673 365 n/a n/a 334.7 per cent change2018-2019………… (0.1) 2.2 (25.0) (18.2) - - (21.1) 1 Includes Crown royalties, Crown reserve disposition bonuses, fees and rentals.
Sources: Ministry of Energy, Mines and Petroleum Resources and BC Oil and Gas Commission.
Provincial Reserves

2020 Financial and Economic Review – September 2020 | 93
Appendix 1 – Economic Review Supplementary Tables
Table A1.13 Supply and Consumption of Electrical Energy in British ColumbiaNet Exports
All Other Receipts DeliveredTypes Of Total From Other To Other TotalElectricity Provincial Provinces Total Provinces Provincial Total
Year Hydro Generation2 Generation and Imports Supply and Exports Consumption Demand
1989 ………… 51,082 6,573 57,655 4,500 62,155 6,583 55,572 62,155 2,083 1990 ………… 57,245 3,417 60,662 3,233 63,895 6,689 57,206 63,895 3,456 1991 ………… 60,149 2,832 62,981 2,272 65,253 7,725 57,528 65,253 5,454 1992 ………… 60,555 3,503 64,058 2,685 66,743 9,473 57,270 66,743 6,788 1993 ………… 53,057 5,716 58,774 5,691 64,465 5,605 58,860 64,465 (86) 1994 ………… 53,979 7,036 61,015 7,836 68,851 9,541 59,311 68,851 1,705 1995 ………… 49,814 8,192 58,006 6,385 64,391 3,972 60,419 64,391 (2,413) 1996 ………… 67,329 4,436 71,765 3,289 75,053 10,390 64,664 75,053 7,101 1997 ………… 61,772 5,189 66,961 4,316 71,278 12,114 59,163 71,278 7,798 1998 ………… 60,849 6,861 67,710 5,056 72,766 10,619 62,147 72,766 5,563 1999 ………… 61,588 6,457 68,045 6,807 74,852 12,529 62,323 74,852 5,722 2000 ………… 59,754 8,487 68,241 6,039 74,280 10,698 63,582 74,280 4,659 2001 ………… 48,338 8,994 57,332 10,154 67,486 6,408 61,079 67,486 (3,747) 2002 ………… 58,627 6,318 64,945 5,769 70,714 8,078 62,636 70,714 2,309 2003 ………… 56,689 6,362 63,051 7,084 70,135 9,599 60,535 70,135 2,515 2004 ………… 53,281 7,214 60,496 8,261 68,757 6,791 61,966 68,757 (1,470) 2005* ………… 60,327 7,447 67,774 7,206 74,980 9,247 65,732 74,980 2,042 2006 ………… 54,247 7,350 61,598 12,687 74,284 6,133 68,151 74,284 (6,554) 2007 ………… 64,287 7,543 71,830 8,390 80,220 11,198 69,022 80,220 2,808 2008 ………… 58,699 7,373 66,072 12,431 78,503 9,956 68,546 78,503 (2,474) 2009 ………… 56,462 8,594 65,057 12,075 77,132 8,304 68,827 77,132 (3,771) 2010 ………… 54,152 10,072 64,224 10,767 74,991 7,566 67,425 74,991 (3,201) 2011 ………… 61,037 8,220 69,257 10,973 80,230 15,552 64,679 80,230 4,579 2012 ………… 65,141 8,444 73,584 9,738 83,323 16,929 66,394 83,323 7,191 2013 ………… 59,223 8,628 67,851 10,466 78,317 13,576 64,741 78,317 3,110 2014 ………… 57,573 9,435 67,008 10,941 77,949 13,734 64,215 77,949 2,793 2015 ………… 64,999 6,772 71,771 9,591 81,361 14,123 67,238 81,361 4,533 2016 ………… 61,840 7,863 69,703 8,758 78,461 14,476 63,986 78,461 5,718 2017 ………… 66,503 7,972 74,476 8,943 83,419 15,139 68,281 83,419 6,195 2018 ………… 61,791 7,289 69,080 10,531 79,612 10,703 68,909 79,612 172 2019 ………… n/a n/a n/a n/a n/a n/a n/a n/a n/a 1 Gigawatt-hour = one million kilowatt-hours
Source: Statistics Canada (Tables: 25-10-0001-01, 25-10-0015-01, 25-10-0016-01, 25-10-0020-01 and 25-10-0021-01 – accessed June 2020) and BC Stats.
ConsumptionSupplyNet Generation
(gigawatt-hours)1
* Note: Starting from 2005, annual survey values (25-10-0020-01 and 25-10-0021-01) are used since more extensive information is available from companies' annual performance reviews.
2 All other types of electricity generation includes steam, nuclear, combustion turbine, tidal, wind and solar.

Appendix 1 – Economic Review Supplementary Tables
94 | 2020 Financial and Economic Review – September 2020
Table A1.14 Components of British Columbia Population ChangeNet Migration Total Total
Inter- Inter- Population PopulationYear provincial national Total Births Deaths Total Increase 1 at July 1
1975 .............. (2,864) 25,342 22,478 36,281 19,151 17,130 39,608 2,499,564 1976 .............. (464) 16,288 15,824 35,848 18,788 17,060 32,884 2,533,899 1977 .............. 12,452 11,224 23,676 36,691 18,596 18,095 41,771 2,570,315 1978 .............. 20,106 7,699 27,805 37,231 19,058 18,173 45,978 2,615,162 1979 .............. 32,541 14,012 46,553 38,432 19,204 19,228 65,781 2,665,238 1980 .............. 38,773 23,522 62,295 40,104 19,371 20,733 83,028 2,745,861 1981 .............. 23,270 22,143 45,413 41,474 19,857 21,617 67,030 2,826,558 1982 .............. (1,129) 14,175 13,046 42,747 20,707 22,040 35,086 2,876,513 1983 .............. 3,000 10,639 13,639 42,919 19,827 23,092 36,731 2,907,502 1984 .............. 3,867 8,674 12,541 43,911 20,686 23,225 35,766 2,947,181 1985 .............. (3,430) 9,374 5,944 43,127 21,302 21,825 27,769 2,975,131 1986 .............. (772) 12,290 11,518 41,967 21,213 20,754 32,272 3,003,621 1987 .............. 16,588 21,078 37,666 41,814 21,814 20,000 57,666 3,048,651 1988 .............. 25,829 28,704 54,533 42,930 22,546 20,384 74,917 3,114,761 1989 .............. 35,711 31,042 66,753 43,769 22,997 20,772 87,525 3,196,725 1990 .............. 40,088 28,585 68,673 45,617 23,577 22,040 90,713 3,292,111 1991 .............. 34,600 21,274 55,874 45,612 23,977 21,635 77,509 3,373,787 1992 .............. 39,578 29,477 69,055 46,156 24,615 21,541 90,596 3,468,802 1993 .............. 37,595 34,679 72,274 46,026 25,764 20,262 92,536 3,567,772 1994 .............. 34,449 42,667 77,116 46,998 25,939 21,059 98,175 3,676,075 1995 .............. 23,414 43,644 67,058 46,820 26,375 20,445 87,503 3,777,390 1996 .............. 17,798 47,617 65,415 46,138 27,538 18,600 84,015 3,874,317 1997 .............. 1,980 38,318 40,298 44,577 27,412 17,165 57,463 3,948,583 1998 .............. (17,521) 24,380 6,859 43,072 27,978 15,094 21,953 3,983,113 1999 .............. (12,413) 28,644 16,231 41,939 28,017 13,922 30,153 4,011,375 2000 .............. (14,783) 29,266 14,483 40,672 27,461 13,211 27,694 4,039,230 2001 .............. (7,028) 34,217 27,189 40,575 28,362 12,213 39,402 4,076,950 2002 .............. (4,445) 28,575 24,130 40,065 28,884 11,181 35,311 4,100,564 2003 .............. 3,025 27,762 30,787 40,497 29,320 11,177 41,964 4,124,482 2004 .............. 7,785 28,015 35,800 40,490 29,924 10,566 46,366 4,155,651 2005 .............. 7,212 38,399 45,611 40,827 30,235 10,592 56,203 4,196,062 2006 .............. 12,799 34,670 47,469 41,729 30,688 11,041 58,510 4,241,794 2007 .............. 16,776 35,714 52,490 43,649 31,308 12,341 64,831 4,290,984 2008 .............. 10,849 49,678 60,527 44,276 32,097 12,179 72,706 4,349,336 2009 .............. 9,672 46,775 56,447 44,993 31,440 13,553 70,000 4,410,506 2010 .............. 6,212 32,717 38,929 43,826 31,324 12,502 51,431 4,465,546 2011 .............. 711 31,692 32,403 44,129 31,966 12,163 44,566 4,502,104 2012 .............. (4,322) 34,895 30,573 44,008 32,524 11,484 42,057 4,566,769 2013 .............. 2,514 35,381 37,895 43,779 33,200 10,579 48,474 4,630,077 2014 .............. 15,859 32,178 48,037 44,376 33,791 10,585 58,622 4,707,103 2015 .............. 22,827 14,059 36,886 44,298 35,246 9,052 45,938 4,776,388 2016 .............. 23,586 36,365 59,951 45,268 36,627 8,641 68,592 4,859,250 2017 .............. 15,293 50,901 66,194 44,521 38,300 6,221 72,415 4,924,233 2018 .............. 9,471 57,506 66,977 43,567 38,267 5,300 72,277 5,001,170 2019 .............. 9,551 64,441 73,992 43,308 38,276 5,032 79,024 5,071,336
Natural Increase
subsequent census years. The revisions are not distributed back to relevant components due to insufficient data.
1 Components may not add to totals due to the revision of population statistics based on information collected during
Sources: Statistics Canada (Tables: 17-10-0020-01, 17-10-0040-01 and 17-10-0059-01 – accessed June 2020) and BC Stats.
2020 Financial and Economic Review – September 2020
Appendix 2 Financial Review Supplementary Tables

This page intentionally left blank
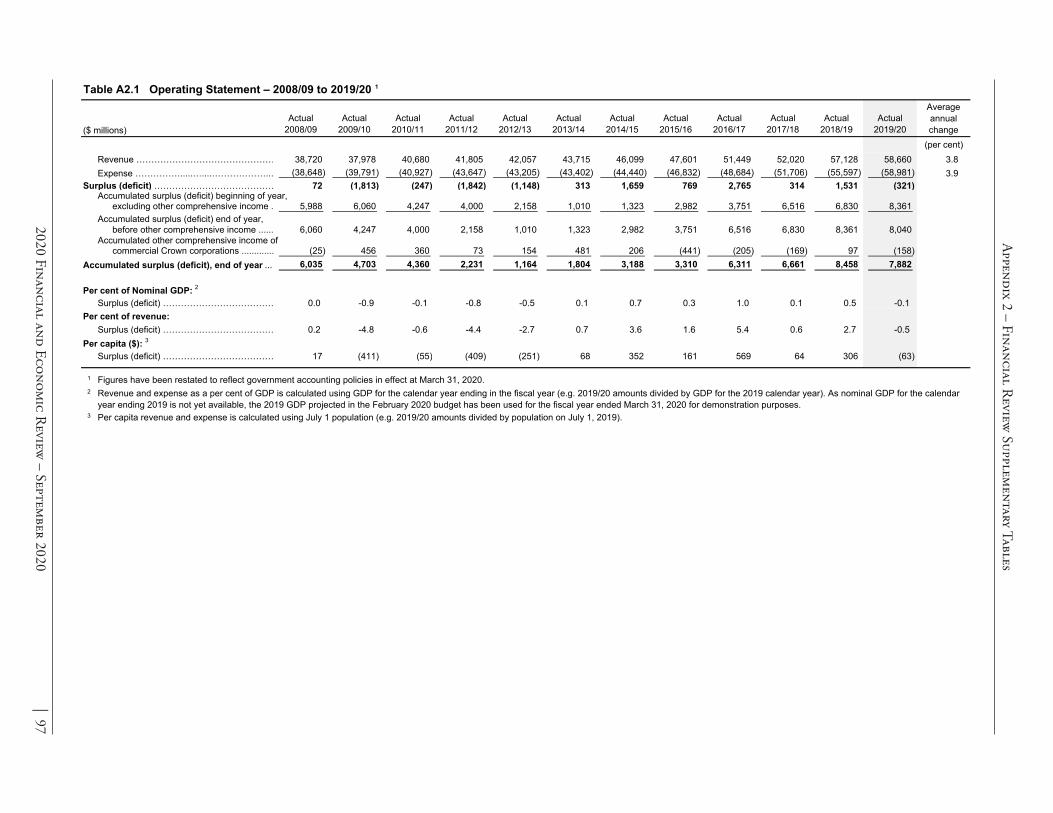
2020 Financial and Econom
ic Review
– September 2020
| 97
Appendix 2 – Financial Review
Supplementary Tables
Table A2.1 Operating Statement – 2008/09 to 2019/20 1
($ millions)Actual
2008/09Actual
2009/10Actual
2010/11Actual
2011/12Actual
2012/13Actual
2013/14Actual
2014/15Actual
2015/16Actual
2016/17Actual
2017/18Actual
2018/19Actual
2019/20
Average annual change
(per cent)Revenue ………………………………………… 38,720 37,978 40,680 41,805 42,057 43,715 46,099 47,601 51,449 52,020 57,128 58,660 3.8Expense …………….....…....………………..… (38,648) (39,791) (40,927) (43,647) (43,205) (43,402) (44,440) (46,832) (48,684) (51,706) (55,597) (58,981) 3.9
Surplus (deficit) …………………………………… 72 (1,813) (247) (1,842) (1,148) 313 1,659 769 2,765 314 1,531 (321) Accumulated surplus (deficit) beginning of year,
excluding other comprehensive income . 5,988 6,060 4,247 4,000 2,158 1,010 1,323 2,982 3,751 6,516 6,830 8,361 Accumulated surplus (deficit) end of year,
before other comprehensive income ...... 6,060 4,247 4,000 2,158 1,010 1,323 2,982 3,751 6,516 6,830 8,361 8,040 Accumulated other comprehensive income of
commercial Crown corporations ............. (25) 456 360 73 154 481 206 (441) (205) (169) 97 (158) Accumulated surplus (deficit), end of year .... 6,035 4,703 4,360 2,231 1,164 1,804 3,188 3,310 6,311 6,661 8,458 7,882
Per cent of Nominal GDP: 2
Surplus (deficit) ………………………………… 0.0 -0.9 -0.1 -0.8 -0.5 0.1 0.7 0.3 1.0 0.1 0.5 -0.1Per cent of revenue:
Surplus (deficit) ………………………………… 0.2 -4.8 -0.6 -4.4 -2.7 0.7 3.6 1.6 5.4 0.6 2.7 -0.5Per capita ($): 3
Surplus (deficit) ………………………………… 17 (411) (55) (409) (251) 68 352 161 569 64 306 (63)
1
2
3
Revenue and expense as a per cent of GDP is calculated using GDP for the calendar year ending in the fiscal year (e.g. 2019/20 amounts divided by GDP for the 2019 calendar year). As nominal GDP for the calendar year ending 2019 is not yet available, the 2019 GDP projected in the February 2020 budget has been used for the fiscal year ended March 31, 2020 for demonstration purposes.Per capita revenue and expense is calculated using July 1 population (e.g. 2019/20 amounts divided by population on July 1, 2019).
Figures have been restated to reflect government accounting policies in effect at March 31, 2020.

Appendix 2 – Financial Review
Supplementary Tables
98 | 2020 Financial and Econom
ic Review
– September 2020
Table A2.2 Statement of Financial Position – 2008/09 to 2019/20 1
($ millions)Actual
2008/09Actual
2009/10Actual
2010/11Actual
2011/12Actual
2012/13Actual
2013/14Actual
2014/15Actual
2015/16Actual
2016/17Actual
2017/18Actual
2018/19Actual
2019/20
Average annual change
Financial assets: (per cent) 5,185Cash and temporary investments ………………… 2,911 3,060 3,235 3,173 2,801 3,675 3,892 4,232 3,440 3,029 3,985 -2.4
Other financial assets ……………………………… 5,875 7,171 7,990 7,938 8,186 9,334 9,115 9,636 10,143 11,650 12,524 12,278 6.9Sinking funds ....................................................... 2,134 1,329 1,410 1,491 1,778 835 977 1,580 1,087 1,348 752 692Investments in commercial Crown corporations:
5,967Retained earnings ……………………………… 7,473 7,107 7,013 7,556 7,854 8,269 7,529 7,509 6,126 5,732 6,515Recoverable capital loans ……………………… 9,280 11,596 13,142 15,167 17,208 19,255 20,624 22,041 23,809 20,534 22,547 24,768
15,247 19,069 20,249 22,180 24,764 27,109 28,893 29,570 31,318 26,660 28,279 31,283 2,081Warehouse borrowing program assets …………… - - - - - - - - - - -
Total financial assets….......................................... 30,522 30,480 32,709 34,844 37,901 40,079 42,660 44,678 46,780 43,098 48,238 44,584
-9.7
0.89.36.8n/a4.2
Liabilities: 7,820Accounts payable & accrued liabilities …………… 7,412 8,046 9,247 9,278 8,428 8,443 8,618 9,031 9,751 10,573 11,497 3.6 9,461Deferred revenue …………………………………… 10,030 10,777 10,477 9,892 9,725 9,835 9,807 9,589 9,992 10,467 10,576 1.0
Debt:Taxpayer-supported debt ……………… 26,402 29,968 31,821 34,659 38,182 41,068 41,880 42,719 41,499 43,607 42,681 46,229 5.2Self-supported debt ……………………… 11,612 11,917 13,333 15,534 17,634 19,625 21,040 22,532 24,338 21,312 25,932 23,281 7.6
Total provincial debt …………………………… 38,014 41,885 45,154 50,193 55,816 60,693 62,920 65,251 65,837 64,919 65,962 72,161 6.0Add: debt offset by sinking funds …………… 2,134 1,329 1,410 1,491 1,778 835 977 1,580 1,087 1,348 752 692Less: guarantees and
non-guaranteed debt …………………… (496) (546) (455) (730) (755) (726) (739) (820) (835) (896) (850) (1,337)Financial statement debt ...................................... 39,652 42,668 46,109 50,954 56,839 60,802 63,158 66,011 66,089 65,371 71,516 65,864
Total liabilities…..................................................... 56,933 60,110 64,932 70,678 76,009 78,955 81,436 84,436 84,709 85,114 93,589 86,904 (26,411) (29,630) (32,223) (35,834) (38,108) (38,876) (38,776) (39,758) (37,929) (42,016) (42,320) (45,351)
-9.7
9.45.54.65.0Net liabilities ……………………………………………
Capital and other assets: 30,539Tangible capital assets ……………………………… 32,219 34,278 35,692 36,762 37,778 39,028 40,282 41,303 45,837 47,830 50,025 4.6
1,178Restricted assets …………………………………… 1,241 1,312 1,377 1,442 1,493 1,553 1,631 1,695 1,768 1,834 1,931 4.6Other assets ………………………………………… 729 873 993 996 1,068 1,409 1,383 1,155 1,242 1,072 1,277 1,114 5.2
Total capital and other assets ............................... 32,446 34,333 36,583 38,065 39,272 40,680 41,964 43,068 44,240 48,677 50,778 53,233 4.6
Accumulated surplus (deficit) ……………………… 6,035 4,703 4,360 2,231 1,164 1,804 3,188 3,310 6,311 6,661 8,458 7,882 2.5
Per cent of Nominal GDP: 2
Net liabilities ………………………………………… 12.8 15.0 15.6 16.4 17.1 16.8 15.9 15.9 14.4 14.9 14.3 14.8 1.3Capital and other assets …………………………… 15.7 17.3 17.7 17.4 17.6 17.6 17.2 17.2 16.8 17.2 17.2 17.4 0.9
Growth rates:Net liabilities ………………………………………… 9.8 12.2 8.8 11.2 6.3 2.0 2.5 10.8 0.7 7.2 n/a Capital and other assets …………………………… 6.5 5.8 6.6 4.1 3.2 3.6
-0.33.2 2.6
-4.62.7 10.0 4.3 4.8 n/a
Per capita: 3
Net liabilities ………………………………………… 6,072 6,718 7,216 7,959 8,345 8,396 8,238 8,324 7,806 8,532 8,462 8,943 3.6 7,460Capital and other assets …………………………… 7,784 8,192 8,455 8,600 8,786 8,915 9,017 9,104 9,885 10,153 10,497 3.2
1
2
3
Figures have been restated to reflect government accounting policies in effect at March 31, 2020.Net liabilities as a per cent of GDP is calculated using GDP for the calendar year ending in the fiscal year (e.g. 2019/20 amount divided by GDP for the 2019 calendar year). As nominal GDP for the calendar year ending 2019 is not available, the 2019 GDP projected in the February 2020 budget has been used for the fiscal year ended March 31, 2020 for demonstration purposes.Per capita net liabilities is calculated using July 1 population (e.g. 2019/20 amount divided by population on July 1, 2019).

2020 Financial and Economic R
eview – Septem
ber 2020 | 99
Appendix 2 – Financial Review
Supplementary Tables
Table A2.3 Changes in Financial Position – 2008/09 to 2019/20
($ millions)Actual
2008/09Actual
2009/10Actual
2010/11Actual
2011/12Actual
2012/13Actual
2013/14Actual
2014/15Actual
2015/16Actual
2016/17Actual
2017/18Actual
2018/19Actual
2019/2012-Year
Total
(Surplus) deficit for the year ……………………… (72) 1,813 247 1,842 1,148 (313) (314) (1,531) 321 (2,052)Comprehensive income (increase) decrease …… 437 (481) 96 287 (81) (327)
(1,659)275
(769) (2,765)647 (236) (36) (266) 255 570
Change in accumulated (surplus) deficit ………… 365 1,332 343 2,129 1,067 (640) (1,384) (122) (3,001) (350) (1,797) 576 (1,482)
Capital and other asset changes: 3,743Taxpayer-supported capital investments ………… 3,719 4,110 3,565 3,279 3,151 3,407 3,459 3,659 3,908 4,452 4,772 45,224
Less: amortization and otheraccounting changes …………………… (1,856) (2,039) (2,051) (2,151) (2,209) (2,135) (2,157) (2,205) (2,638) 626 (2,459) (2,577) (23,851)
Increase in net capital assets .......................... 1,887 1,680 2,059 1,414 1,070 1,016 1,250 1,254 1,021 4,534 1,993 2,195 21,373Increase (decrease) in restricted assets .............. 48 63 71 65 65 51 60 78 64 73 66 97 801Increase (decrease) in other assets ..................... 57 144 120 3 72 341 (26) (228) 87 (170) 42 605 163
1,992 1,887 2,250 1,482 1,207 1,408 1,284 1,104 1,172 4,437 2,101 22,779 2,455 Increase (decrease) in net liabilities .................... 2,357 3,219 2,593 3,611 2,274 768 (100) 982 (1,829) 4,087 304 3,031 21,297
Investment and working capital changes:Increase (reduction) in cash and
temporary investments ………………………… (769) 149 175 (62) (372) 874 217 340 (792) (411) 956 (1,969)Increase (decrease) in warehouse
borrowing investments ………………………… 2,081 - - - - - - - - - - -Investment in commercial Crown corporations:
Increase (decrease) in retained earnings ....... 623 543 298 415 (1,383) 1,171Self-supported capital investments …………… 1,810
(2,274)
(2,081)
1,506 3,362
(366) (94) 2,470 2,744 2,765 2,519 2,488
(740) (20) 2,573 2,725 2,729
(394) 783 4,106 4,386 34,677
Less: loan repayments andother accounting changes ……………… (387) (1,046) (924) (719) (724) (472) (1,119) (1,156) (957) (6,004) (2,093) (2,165) (17,766)
2,046 3,822 1,180 1,931 2,584 2,345 1,784 677 1,748 (4,658) 1,619 3,004 18,082Other working capital changes 1…………………… (2,857) 330 (481) (872) 1,089 1,222 (202) 977 (181) 645 (1,019) (1,339) (2,688)
501 (203) 848 1,234 3,611 3,195 2,456 1,871 1,907 (4,805) 189 2,621 13,425Increase (decrease) in financial statement
2,858debt …………………………………………………… 3,016 3,441 4,845 5,885 3,963 2,356 2,853 78 (718) 493 5,652 34,722 515(Increase) decrease in sinking fund debt ………… 805 (81) (81) (287) 943 (142) (603) 493 (261) 596 60 1,957
Increase (decrease) in guarantees ………………. (16) (20) 39 99 (34) 27 (33) (2) 57 (88)Increase (decrease) in non-guaranteed debt …… 20 70 (130) 176 59 (56) 46
675
(23) (188)38 249 (44) 430 933
Increase (decrease) in total provincial debt …… 3,377 3,871 3,269 5,039 5,623 4,877 2,227 2,331 586 (918) 1,043 37,524 6,199 Represented by increase (decrease) in:
Taxpayer-supported debt …………… 1,853 2,838 3,523 2,886 812 839 (1,220) 2,108 19,680Self-supported debt ……………………
(147) 3,5663,524 305 1,416 2,201 2,100 1,991 1,415 1,492 1,806 (3,026)
(926) 3,5481,969 2,651 17,844
Total provincial debt …………………… 3,377 3,871 3,269 5,039 5,623 4,877 2,227 2,331 586 (918) 1,043 6,199 37,5241 Includes changes in other financial assets, sinking funds, accounts payable, and deferred revenue.

Appendix 2 – Financial Review
Supplementary Tables
100 | 2020 Financial and Econom
ic Review
– September 2020
Table A2.4 Revenue by Source – 2008/09 to 2019/20
($ millions)Actual
2008/09Actual
2009/10Actual
2010/11Actual
2011/12Actual
2012/13Actual
2013/14Actual
2014/15Actual
2015/16Actual
2016/17Actual
2017/18Actual
2018/19Actual
2019/20
Average annual change
Taxation revenue: (per cent)Personal income ………………………………………… 6,309 5,769 5,805 6,427 6,977 6,862 8,076 8,380 9,704 8,923 11,364 10,657 4.9Corporate income ………………………………………. 2,294 1,625 2,026 2,002 2,204 2,427 2,635 2,787 3,003 4,165 5,180 5,011 7.4Employer health ……………………………………….... - - - - - - - - - - 464 1,897 n/a Harmonized sales ………………………………………… - - 4,176 5,779 5,950 (226) (91) (55) 6 13 7 - n/a Other sales 1 ……………………………………………. 5,137 4,945 1,438 151 118 5,529 5,853 6,045 6,600 7,118 7,362 7,374 3.3Fuel ……………………………………………………… 891 884 940 928 890 917 932 973 969 1,010 1,015 1,008 1.1Carbon …………………………………………………… 306 541 741 959 1,120 1,222 1,198 1,190 1,220 1,255 1,465 1,682 16.8Tobacco …………………………………………………… 709 683 735 636 614 724 752 734 737 727 781 729 0.3Property …………………………………………………. 1,850 1,887 1,920 1,913 1,985 2,080 2,154 2,219 2,279 2,367 2,617 2,608 3.2Property transfer ………………………………………… 715 887 855 944 758 937 1,065 1,533 2,026 2,141 1,826 1,609 7.7Corporation capital ……………………………………… 108 95 (3) (5) 1 - (1) - - - - - n/a Insurance premium ……………………………………… 389 389 399 411 433 458 483 520 549 602 633 691 5.4
18,708 17,705 19,032 20,145 21,050 20,930 23,056 24,326 27,093 28,321 32,714 33,266 5.4Natural resource revenue:
Natural gas royalties …………………………………… 1,314 406 313 339 169 445 493 139 152 161 199 118 -19.7Crown land tenures ……………………………………… 814 867 923 928 868 859 834 765 633 276 279 225 -11.0Columbia River Treaty …………………………………… 231 168 136 110 89 170 130 116 111 111 202 119 -5.9Other energy and minerals ……………………………… 479 421 514 529 306 269 267 226 403 619 557 386 -1.9Forests …………………………………………………… 557 387 436 482 562 719 754 865 913 1,065 1,406 988 5.3Other resources ………………………………………… 413 398 406 424 479 493 459 460 499 463 465 432 0.4
3,808 2,647 2,728 2,812 2,473 2,955 2,937 2,571 2,711 2,695 3,108 2,268 -4.6Other revenue:
Medical Services Plan premiums ……………………… 1,595 1,666 1,787 1,919 2,047 2,158 2,254 2,434 2,558 2,266 1,360 1,063 -3.6Post-secondary education fees ………………………… 1,036 1,123 1,235 1,291 1,345 1,445 1,544 1,666 1,828 2,034 2,275 2,451 8.1Other healthcare related fees …………………………… 257 267 308 324 327 333 358 374 404 429 441 475 5.7Motor vehicle licences and permits …………………… 450 449 467 479 489 504 499 521 529 557 568 579 2.3Other fees and licences ………………………………… 670 616 643 722 699 770 770 841 894 963 949 1,004 3.7Investment earnings ……………………………………… 818 930 843 1,022 1,189 1,203 1,171 1,213 1,232 1,101 1,243 1,263 4.0Sales of goods and services …………………………… 694 728 759 930 942 946 967 1,011 1,131 1,133 1,164 1,162 4.8Miscellaneous …………………………………………… 1,809 1,887 1,929 1,746 1,673 2,256 1,893 2,287 2,377 2,410 2,249 2,676 3.6
7,329 7,666 7,971 8,433 8,711 9,615 9,456 10,347 10,953 10,893 10,249 10,673 3.5Contributions from the federal government:
Canada Health Transfer ………………………………… 3,343 3,450 3,689 3,858 3,887 4,280 4,186 4,454 4,744 4,994 5,182 5,523 4.7Canada Social Transfer ………………………………… 1,400 1,433 1,487 1,526 1,555 1,589 1,641 1,695 1,751 1,854 1,908 1,971 3.2Harmonized sales tax transition payments …………… - 250 769 580 - - - - - - - - n/a Other cost shared agreements ………………………… 1,252 1,794 2,064 1,760 1,605 1,645 1,452 1,498 1,672 2,207 1,962 2,041 4.5
5,995 6,927 8,009 7,724 7,047 7,514 7,279 7,647 8,167 9,055 9,052 9,535 4.3Commercial Crown corporation net income:
BC Hydro 2 ………………………………………………… 365 447 591 558 509 549 581 655 684 683 (428) 705 6.2Liquor Distribution Branch ……………………………… 891 877 891 909 930 877 935 1,031 1,083 1,119 1,104 1,107 2.0BC Lottery Corp (net of payments to federal gov't) …… 1,082 1,070 1,097 1,102 1,116 1,165 1,245 1,304 1,329 1,391 1,405 1,336 1.9BC Railway Company …………………………….……… 36 2 15 14 6 13 5 6 7 53 10 13 -8.8ICBC ………………………..……………………………… 512 601 315 84 231 136 657 (293) (612) (1,327) (1,153) (376) -197.2Transportation Investment Corp. .……………………… (47) (4) (7) (17) (60) (88) (89) (80) (81) (29) - - n/a Other ……………………………………………………… 41 40 38 41 44 49 37 87 115 116 117 133 11.3Accounting adjustments 2 ……………………………… - - - - - - - - - (950) 950 - n/a
2,880 3,033 2,940 2,691 2,776 2,701 3,371 2,710 2,525 1,056 2,005 2,918 0.1Total revenue ……………………………………… 38,720 37,978 40,680 41,805 42,057 43,715 46,099 47,601 51,449 52,020 57,128 58,660 3.8
1 Includes social service tax, hotel room tax, provincial sales tax, tax on designated properties and housing transition tax.2 BC Hydro's loss for 2018/19 includes a write-off of a regulatory account. At the summary level, the Province recognized a $950 million adjustment in fiscal 2017/18 with respect to BC Hydro's deferred regulatory accounts.

2020 Financial and Econom
ic Review
– September 2020
| 101
Appendix 2 – Financial Review
Supplementary Tables
Table A2.5 Revenue by Source Supplementary Information – 2008/09 to 2019/20
Actual 2008/09
Actual 2009/10
Actual 2010/11
Actual 2011/12
Actual 2012/13
Actual 2013/14
Actual 2014/15
Actual 2015/16
Actual 2016/17
Actual 2017/18
Actual 2018/19
Actual 2019/20
Average annual change
Per cent of Nominal GDP: 1 (per cent)Taxation …………………………………………………… 9.1 8.9 9.2 9.2 9.4 9.1 9.5 9.7 10.3 10.0 11.1 10.9 1.7Natural resources ………………………………………… 1.8 1.3 1.3 1.3 1.1 1.3 1.2 1.0 1.0 1.0 1.1 0.7 -8.0Other ……………………………………………………… 3.6 3.9 3.9 3.9 3.9 4.2 3.9 4.1 4.2 3.9 3.5 3.5 -0.2Contributions from the federal government …………… 2.9 3.5 3.9 3.5 3.2 3.3 3.0 3.0 3.1 3.2 3.1 3.1 0.6Commercial Crown corporation net income …………… 1.4 1.5 1.4 1.2 1.2 1.2 1.4 1.1 1.0 0.4 0.7 1.0 -3.4
Total revenue ……………………………………… 18.8 19.2 19.7 19.1 18.8 18.9 18.9 19.0 19.5 18.4 19.3 19.2 0.2
Growth rates (per cent):Taxation …………………………………………………… -5.4 -5.4 7.5 5.8 4.5 -0.6 10.2 5.5 11.4 4.5 15.5 1.7 n/aNatural resources ………………………………………… 1.8 -30.5 3.1 3.1 -12.1 19.5 -0.6 -12.5 5.4 -0.6 15.3 -27.0 n/aOther ……………………………………………………… -3.1 4.6 4.0 5.8 3.3 10.4 -1.7 9.4 5.9 -0.5 -5.9 4.1 n/aContributions from the federal government …………… 0.9 15.5 15.6 -3.6 -8.8 6.6 -3.1 5.1 6.8 10.9 0.0 5.3 n/aCommercial Crown corporation net income …………… -3.8 5.3 -3.1 -8.5 3.2 -2.7 24.8 -19.6 -6.8 -58.2 89.9 45.5 n/a
Total revenue ……………………………………… -3.3 -1.9 7.1 2.8 0.6 3.9 5.5 3.3 8.1 1.1 9.8 2.7 n/a
Per capita ($): 2
Taxation …………………………………………………… 4,301 4,014 4,262 4,475 4,609 4,520 4,898 5,093 5,576 5,751 6,541 6,560 3.9Natural resources ………………………………………… 876 600 611 625 542 638 624 538 558 547 621 447 -5.9Other ……………………………………………………… 1,685 1,738 1,785 1,873 1,907 2,077 2,009 2,166 2,254 2,212 2,049 2,105 2.0Contributions from the federal government …………… 1,378 1,571 1,794 1,716 1,543 1,623 1,546 1,601 1,681 1,839 1,810 1,880 2.9Commercial Crown corporation net income …………… 662 688 658 598 608 583 716 567 520 214 401 575 -1.3
Total revenue ……………………………………… 8,903 8,611 9,110 9,286 9,209 9,442 9,793 9,966 10,588 10,564 11,423 11,567 2.4
Real Per Capita Revenue (2019 $) 3 ……………………… 10,417 10,075 10,519 10,473 10,273 10,540 10,823 10,895 11,366 11,105 11,690 11,567 1.0Growth rate (per cent) …………………………………… -6.5 -3.3 4.4 -0.4 -1.9 2.6 2.7 0.7 4.3 -2.3 5.3 4.2 n/a
1
2
3
Per capita revenue is calculated using July 1 population (e.g. 2019/20 revenue divided by population on July 1, 2019). Totals may not add due to rounding.Revenue is converted to real (inflation-adjusted) terms using the consumer price index (CPI) for the corresponding calendar year (e.g. 2019 CPI for 2019/20 revenue).
Revenue as a per cent of GDP is calculated using GDP for the calendar year ending in the fiscal year (e.g. 2019/20 revenue divided by GDP for the 2019 calendar year). As nominal GDP for the calendar year ending 2019 is not available, the 2019 GDP projected in the February 2020 budget has been used for the fiscal year ended March 31, 2020 for demonstration purposes. Totals may not add due to rounding.

Appendix 2 – Financial Review
Supplementary Tables
102 | 2020 Financial and Econom
ic Review
– September 2020
Table A2.6 Expense by Function – 2008/09 to 2019/20 1
($ millions)Actual
2008/09Actual
2009/10Actual
2010/11Actual
2011/12Actual
2012/13Actual
2013/14Actual
2014/15Actual
2015/16Actual
2016/17Actual
2017/18Actual
2018/19Actual
2019/20
Average annual change
Function: (per cent)Health:
Medical Services Plan ………………………… 3,282 3,407 3,641 3,873 3,906 4,114 4,136 4,345 4,573 4,623 4,861 5,013 3.9Pharmacare ……………………………………… 1,010 1,053 1,129 1,147 1,122 1,130 1,120 1,335 1,284 1,400 1,494 1,517 3.8Regional services ……………………………… 10,030 10,273 10,597 11,255 11,784 11,960 12,410 12,811 13,079 14,094 14,996 16,047 4.4Other healthcare expenses …………………… 601 597 625 642 690 658 704 712 753 810 800 872 3.4
14,923 15,330 15,992 16,917 17,502 17,862 18,370 19,203 19,689 20,927 22,151 23,449 4.2Education:
Elementary and secondary …………………… 5,740 5,778 5,802 5,885 6,002 6,133 6,064 6,303 6,422 6,917 7,253 7,582 2.6Post-secondary ………………………………… 4,574 4,733 4,860 4,908 5,104 5,285 5,350 5,503 5,673 5,998 6,394 6,842 3.7Other education expenses …………………… 158 528 504 436 423 410 414 407 374 176 442 310 6.3
10,472 11,039 11,166 11,229 11,529 11,828 11,828 12,213 12,469 13,091 14,089 14,734 3.2Social services:
Social assistance ……………………………… 1,339 1,454 1,506 1,550 1,552 1,572 1,589 1,641 1,692 1,988 2,202 2,342 5.2Child welfare …………………………………… 1,073 1,077 1,118 1,112 1,098 1,097 1,129 1,301 1,358 1,507 1,652 1,940 5.5Low income tax credit transfers ……………… 188 216 408 509 534 279 248 247 244 239 414 435 7.9Community living and other services ………… 723 729 754 769 806 857 881 917 949 1,003 1,075 1,170 4.5
3,323 3,476 3,786 3,940 3,990 3,805 3,847 4,106 4,243 4,737 5,343 5,887 5.3Protection of persons and property …………...… 1,429 1,380 1,448 1,512 1,539 1,520 1,451 1,572 1,655 1,930 2,004 2,126 3.7Transportation …………………………………… 1,401 1,453 1,580 1,545 1,555 1,580 1,608 1,670 1,784 1,931 2,021 2,126 3.9Natural resources & economic development … 1,886 2,159 2,349 1,873 2,092 1,755 2,191 2,477 2,465 3,374 3,825 3,778 6.5Other ……………………………………………… 1,649 1,382 1,208 1,414 1,346 1,184 1,288 1,264 2,260 1,553 1,810 2,501 3.9General government ……………………………… 1,425 1,375 1,146 1,235 1,262 1,386 1,359 1,501 1,532 1,540 1,670 1,653 1.4Debt servicing …………………………………… 2,158 2,197 2,252 2,383 2,390 2,482 2,498 2,826 2,587 2,623 2,684 2,727 2.2
Operating expense …………………………… 38,666 39,791 40,927 42,048 43,205 43,402 44,440 46,832 48,684 51,706 55,597 58,981 3.9Unusual items:Negotiating Framework incentive payments …… 2 - - - - - - - - - - - n/aClimate Action Dividend ………………………… (20) - - - - - - - - - - - n/aHST transition funding repayment ……………… - - - 1,599 - - - - - - - - n/a
Total expense ………………………………… 38,648 39,791 40,927 43,647 43,205 43,402 44,440 46,832 48,684 51,706 55,597 58,981 3.9Per cent of operating expense:
Health ……………………………………………… 38.6 38.5 39.1 40.2 40.5 41.2 41.3 41.0 40.4 40.5 39.8 39.8 0.3Education ………………………………………… 27.1 27.7 27.3 26.7 26.7 27.3 26.6 26.1 25.6 25.3 25.3 25.0 -0.7Social services and housing …………………… 8.6 8.7 9.3 9.4 9.2 8.8 8.7 8.8 8.7 9.2 9.6 10.0 1.4Protection of persons and property …………...… 3.7 3.5 3.5 3.6 3.6 3.5 3.3 3.4 3.4 3.7 3.6 3.6 -0.2Transportation …………………………………… 3.6 3.7 3.9 3.7 3.6 3.6 3.6 3.6 3.7 3.7 3.6 3.6 0.0Natural resources & economic development … 4.9 5.4 5.7 4.5 4.8 4.0 4.9 5.3 5.1 6.5 6.9 6.4 2.5Other ……………………………………………… 4.3 3.5 3.0 3.4 3.1 2.7 2.9 2.7 4.6 3.0 3.3 4.2 -0.1General government ………………………. 3.7 3.5 2.8 2.9 2.9 3.2 3.1 3.2 3.1 3.0 3.0 2.8 -2.5Debt servicing …………………………………… 5.6 5.5 5.5 5.7 5.5 5.7 5.6 6.0 5.3 5.1 4.8 4.6 -1.7
100.0 100.0 100.0 100.0 100.0 100.0 100.0 100.0 100.0 100.0 100.0 100.0
1 Figures have been restated to reflect government accounting policies in effect at March 31, 2020.

2020 Financial and Econom
ic Review
– September 2020
| 103
Appendix 2 – Financial Review
Supplementary Tables
Table A2.7 Expense by Function Supplementary Information – 2008/09 to 2019/20 1
Actual 2008/09
Actual 2009/10
Actual 2010/11
Actual 2011/12
Actual 2012/13
Actual 2013/14
Actual 2014/15
Actual 2015/16
Actual 2016/17
Actual2017/18
Actual2018/19
Actual2019/20
Average annual change
Per cent of nominal GDP: 2 (per cent)Health ……………………………………………… 7.2 7.7 7.7 7.7 7.8 7.7 7.5 7.7 7.5 7.4 7.5 7.7 0.5Education ………………………………………… 5.1 5.6 5.4 5.1 5.2 5.1 4.9 4.9 4.7 4.6 4.8 4.8 -0.5Social services …………………………………… 1.6 1.8 1.8 1.8 1.8 1.6 1.6 1.6 1.6 1.7 1.8 1.9 1.6Protection of persons and property …………...… 0.7 0.7 0.7 0.7 0.7 0.7 0.6 0.6 0.6 0.7 0.7 0.7 0.0Transportation …………………………………… 0.7 0.7 0.8 0.7 0.7 0.7 0.7 0.7 0.7 0.7 0.7 0.7 0.2Natural resources & economic development … 0.9 1.1 1.1 0.9 0.9 0.8 0.9 1.0 0.9 1.2 1.3 1.2 2.8Other ……………………………………………… 0.8 0.7 0.6 0.6 0.6 0.5 0.5 0.5 0.9 0.5 0.6 0.8 0.2General government ……………………………… 0.7 0.7 0.6 0.6 0.6 0.6 0.6 0.6 0.6 0.5 0.6 0.5 -2.2Debt servicing …………………………………… 1.0 1.1 1.1 1.1 1.1 1.1 1.0 1.1 1.0 0.9 0.9 0.9 -1.4
Operating expense …………………………… 18.7 20.1 19.8 19.2 19.3 18.8 18.2 18.7 18.4 18.3 18.8 19.3 0.3
Growth rates (per cent):Health ……………………………………………… 5.8 2.7 4.3 5.8 3.5 2.1 2.8 4.5 2.5 6.3 5.8 5.9 n/a Education ………………………………………… 4.9 5.4 1.2 0.6 2.7 2.6 0.0 3.3 2.1 5.0 7.6 4.6 n/a Social services …………………………………… 10.0 4.6 8.9 4.1 1.3 -4.6 1.1 6.7 3.3 11.6 12.8 10.2 n/a Protection of persons and property …………...… 0.0 -3.4 4.9 4.4 1.8 -1.2 -4.5 8.3 5.3 16.6 3.8 6.1 n/a Transportation …………………………………… 1.7 3.7 8.7 -2.2 0.6 1.6 1.8 3.9 6.8 8.2 4.7 5.2 n/a Natural resources & economic development … -9.0 14.5 8.8 -20.3 11.7 -16.1 24.8 13.1 -0.5 36.9 13.4 -1.2 n/a Other ……………………………………………… 19.0 -16.2 -12.6 17.1 -4.8 -12.0 8.8 -1.9 78.8 -31.3 16.5 38.2 n/a General government ……………………………… 17.0 -3.5 -16.7 7.8 2.2 9.8 -1.9 10.4 2.1 0.5 8.4 -1.0 n/a Debt servicing …………………………………… -3.5 1.8 2.5 5.8 0.3 3.8 0.6 13.1 -8.5 1.4 2.3 1.6 n/a
Operating expense …………………………… 5.0 2.9 2.9 2.7 2.8 0.5 2.4 5.4 4.0 6.2 7.5 6.1 n/a
Per capita ($): 3
Health ……………………………………………… 3,431 3,476 3,581 3,758 3,832 3,858 3,903 4,020 4,052 4,250 4,429 4,624 2.7Education ………………………………………… 2,408 2,503 2,500 2,494 2,525 2,555 2,513 2,557 2,566 2,658 2,817 2,905 1.7Social services …………………………………… 764 788 848 875 874 822 817 860 873 962 1,068 1,161 3.9Protection of persons and property …………...… 329 313 324 336 337 328 308 329 341 392 401 419 2.2Transportation …………………………………… 322 329 354 343 341 341 342 350 367 392 404 419 2.4Natural resources & economic development … 434 490 526 416 458 379 465 519 507 685 765 745 5.0Other ……………………………………………… 379 313 271 314 295 256 274 265 465 315 362 493 2.4General government ……………………………… 328 312 257 274 276 299 289 314 315 313 334 326 -0.1Debt servicing …………………………………… 496 498 504 529 523 536 531 592 532 533 537 538 0.7
Operating expense …………………………… 8,891 9,022 9,165 9,339 9,461 9,374 9,442 9,806 10,018 10,500 11,117 11,630 2.5
Real Per Capita Operating Expense (2019 $) 4 … 10,402 10,556 10,583 10,534 10,553 10,465 10,434 10,718 10,756 11,038 11,377 11,630 1.0Growth rate (per cent) …………………………… 1.4 1.5 0.2 -0.5 0.2 -0.8 -0.3 2.7 0.3 2.6 3.1 2.2 4.0
1
2
3
4
Numbers may not add due to rounding.Expense as a per cent of GDP is calculated using nominal GDP for the calendar year ending in the fiscal year (e.g. 2019/20 expense divided by nominal GDP for the 2019 calendar year). Per capita expense is calculated using July 1 population (e.g. 2019/20 expense divided by population on July 1, 2019).Expense is converted to real (inflation-adjusted) terms using the consumer price index (CPI) for the corresponding calendar year (e.g. 2019 CPI for 2019/20 expense).

Appendix 2 – Financial Review
Supplementary Tables
104 | 2020 Financial and Econom
ic Review
– September 2020
Table A2.8 Full-Time Equivalents (FTEs) – 2008/09 to 2019/20
Actual 2008/09
Actual 2009/10
Actual 2010/11
Actual 2011/12
Actual 2012/13
Actual 2013/14
Actual 2014/15
Actual 2015/16
Actual 2016/17
Actual 2017/18
Actual 2018/19
Actual 2019/20
Average annual change
Taxpayer-supported programs and agencies: (per cent)Ministries and special offices (CRF) ………… 31,874 31,353 30,221 27,228 27,326 26,526 26,679 27,192 27,940 29,291 30,891 31,774 0.0Service delivery agencies 1 …………….....… 4,403 4,508 4,295 4,346 4,508 4,640 4,798 4,803 4,850 5,076 5,258 5,985 2.8
Total FTEs ………………………………… 36,277 35,861 34,516 31,574 31,834 31,166 31,477 31,995 32,790 34,367 36,149 37,759 0.4
Growth rates:Ministries and special offices (CRF) ………… 5.5 -1.6 -3.6 -9.9 0.4 -2.9 0.6 1.9 2.8 4.8 5.5 2.9 0.5Service delivery agencies …………….....….. 6.7 2.4 -4.7 1.2 3.7 2.9 3.4 0.1 1.0 4.7 3.6 13.8 3.2
Population per FTE: 2
Total FTEs ……………………………………… 119.9 123.0 129.4 142.6 143.5 148.6 149.5 149.3 148.2 143.3 138.3 134.3 1.0
1 Service delivery agency FTE figures do not include SUCH sector staff employment.2 Population per FTE is calculated using July 1 population (e.g. population on July 1, 2019 divided by 2019/20 FTEs).
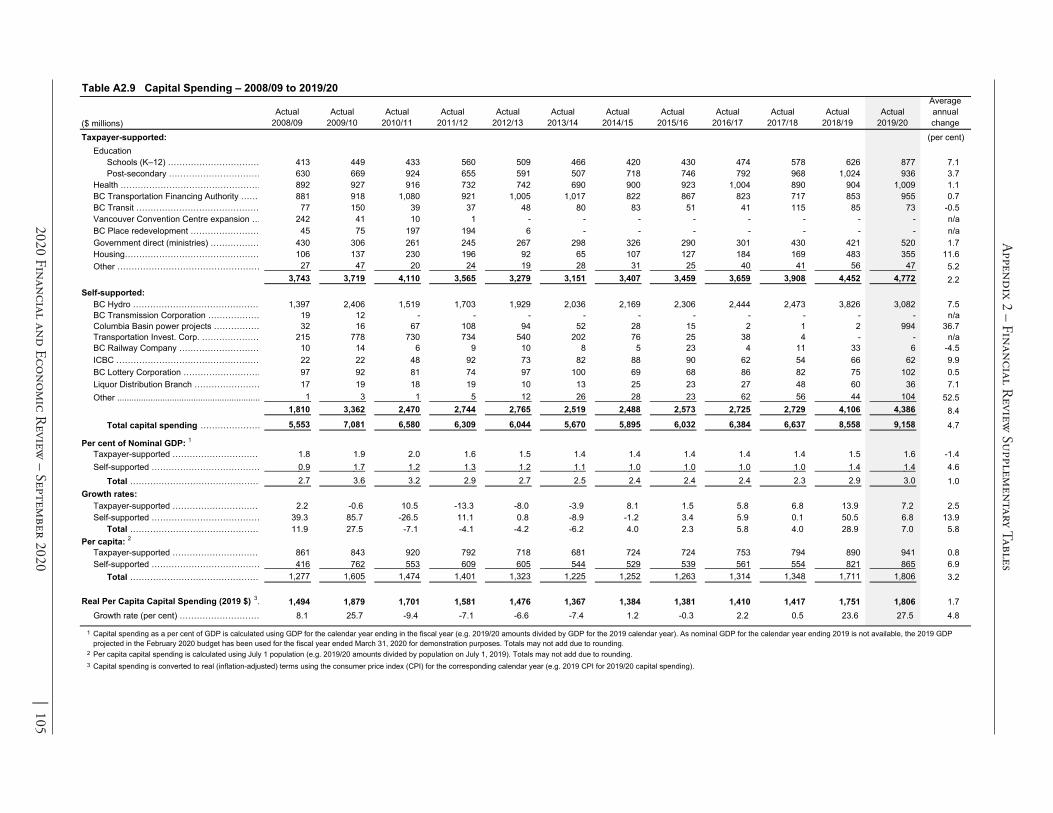
2020 Financial and Econom
ic Review
– September 2020
| 105
Appendix 2 – Financial Review
Supplementary Tables
Table A2.9 Capital Spending – 2008/09 to 2019/20
($ millions)Actual
2008/09Actual
2009/10Actual
2010/11Actual
2011/12Actual
2012/13Actual
2013/14Actual
2014/15Actual
2015/16Actual
2016/17Actual
2017/18Actual
2018/19Actual
2019/20
Average annual change
Taxpayer-supported: (per cent)Education
Schools (K–12) …………………………… 413 449 433 560 509 466 420 430 474 578 626 877 7.1Post-secondary …………………………… 630 669 924 655 591 507 718 746 792 968 1,024 936 3.7
Health …………………………………………… 892 927 916 732 742 690 900 923 1,004 890 904 1,009 1.1BC Transportation Financing Authority ……… 881 918 1,080 921 1,005 1,017 822 867 823 717 853 955 0.7BC Transit ……………………………………… 77 150 39 37 48 80 83 51 41 115 85 73 -0.5Vancouver Convention Centre expansion … 242 41 10 1 - - - - - - - - n/a BC Place redevelopment …………………… 45 75 197 194 6 - - - - - - - n/a Government direct (ministries) ……………… 430 306 261 245 267 298 326 290 301 430 421 520 1.7Housing………………………………………… 106 137 230 196 92 65 107 127 184 169 483 355 11.6Other …………………………………………… 27 47 20 24 19 28 31 25 40 41 56 47 5.2
3,743 3,719 4,110 3,565 3,279 3,151 3,407 3,459 3,659 3,908 4,452 4,772 2.2Self-supported:
BC Hydro ……………………………………… 1,397 2,406 1,519 1,703 1,929 2,036 2,169 2,306 2,444 2,473 3,826 3,082 7.5BC Transmission Corporation ……………… 19 12 - - - - - - - - - - n/a Columbia Basin power projects ……………… 32 16 67 108 94 52 28 15 2 1 2 994 36.7Transportation Invest. Corp. ………………… 215 778 730 734 540 202 76 25 38 4 - - n/a BC Railway Company ………………………… 10 14 6 9 10 8 5 23 4 11 33 6 -4.5ICBC …………………………………………… 22 22 48 92 73 82 88 90 62 54 66 62 9.9BC Lottery Corporation ……………………… 97 92 81 74 97 100 69 68 86 82 75 102 0.5Liquor Distribution Branch …………………… 17 19 18 19 10 13 25 23 27 48 60 36 7.1Other ............................................................ 1 3 1 5 12 26 28 23 62 56 44 104 52.5
1,810 3,362 2,470 2,744 2,765 2,519 2,488 2,573 2,725 2,729 4,106 4,386 8.4Total capital spending ………………… 5,553 7,081 6,580 6,309 6,044 5,670 5,895 6,032 6,384 6,637 8,558 9,158 4.7
Per cent of Nominal GDP: 1Taxpayer-supported …………………………… 1.8 1.9 2.0 1.6 1.5 1.4 1.4 1.4 1.4 1.4 1.5 1.6 -1.4Self-supported ………………………………… 0.9 1.7 1.2 1.3 1.2 1.1 1.0 1.0 1.0 1.0 1.4 1.4 4.6
Total ……………………………………… 2.7 3.6 3.2 2.9 2.7 2.5 2.4 2.4 2.4 2.3 2.9 3.0 1.0Growth rates:
Taxpayer-supported …………………………… 2.2 -0.6 10.5 -13.3 -8.0 -3.9 8.1 1.5 5.8 6.8 13.9 7.2 2.5Self-supported ………………………………… 39.3 85.7 -26.5 11.1 0.8 -8.9 -1.2 3.4 5.9 0.1 50.5 6.8 13.9
Total ……………………………………… 11.9 27.5 -7.1 -4.1 -4.2 -6.2 4.0 2.3 5.8 4.0 28.9 7.0 5.8Per capita: 2
Taxpayer-supported …………………………… 861 843 920 792 718 681 724 724 753 794 890 941 0.8Self-supported ………………………………… 416 762 553 609 605 544 529 539 561 554 821 865 6.9
Total ……………………………………… 1,277 1,605 1,474 1,401 1,323 1,225 1,252 1,263 1,314 1,348 1,711 1,806 3.2
Real Per Capita Capital Spending (2019 $) 3… 1,494 1,879 1,701 1,581 1,476 1,367 1,384 1,381 1,410 1,417 1,751 1,806 1.7Growth rate (per cent) ………………………… 8.1 25.7 -9.4 -7.1 -6.6 -7.4 1.2 -0.3 2.2 0.5 23.6 27.5 4.8
1
2
3
Per capita capital spending is calculated using July 1 population (e.g. 2019/20 amounts divided by population on July 1, 2019). Totals may not add due to rounding. Capital spending is converted to real (inflation-adjusted) terms using the consumer price index (CPI) for the corresponding calendar year (e.g. 2019 CPI for 2019/20 capital spending).
Capital spending as a per cent of GDP is calculated using GDP for the calendar year ending in the fiscal year (e.g. 2019/20 amounts divided by GDP for the 2019 calendar year). As nominal GDP for the calendar year ending 2019 is not available, the 2019 GDP projected in the February 2020 budget has been used for the fiscal year ended March 31, 2020 for demonstration purposes. Totals may not add due to rounding.

Appendix 2 – Financial Review
Supplementary Tables
106 | 2020 Financial and Econom
ic Review
– September 2020
Table A2.10 Provincial Debt – 2008/09 to 2019/20
($ millions)Actual
2008/09Actual
2009/10Actual
2010/11Actual
2011/12Actual
2012/13Actual
2013/14Actual
2014/15Actual
2015/16Actual
2016/17Actual
2017/18Actual
2018/19Actual
2019/20
Average annual change
Taxpayer-supported debt: (per cent)Provincial government direct operating …… 5,744 7,359 6,964 7,813 9,408 10,223 9,280 8,034 4,644 1,156 - - n/a
Other taxpayer-supported debt (mainly capital):Education facilities
Post-secondary institutions ……………… 3,611 3,824 4,092 4,185 4,315 4,386 4,518 4,731 4,984 5,328 5,370 5,670 4.2Schools ……………………………………… 5,522 5,777 6,016 6,407 6,830 7,245 7,600 8,033 8,473 8,908 8,904 9,775 5.3
9,133 9,601 10,108 10,592 11,145 11,631 12,118 12,764 13,457 14,236 14,274 15,445 4.9Health facilities ………………………………… 3,936 4,389 4,895 5,293 5,691 6,038 6,522 6,998 7,552 7,903 7,968 8,507 7.3Highways, ferries and public transit
BC Transit ……………………................... 94 140 158 183 163 143 123 106 94 84 73 65 -3.3BC Transportation Financing Authority … 4,586 5,211 5,785 6,287 7,084 7,912 8,428 9,177 9,974 10,388 11,293 12,193 9.3Port Mann Bridge …………………………… - - - - - - - - - 3,508 3,510 3,510 n/a Public transit ………………………………… 997 997 997 1,000 1,000 1,000 1,000 1,000 1,000 1,000 870 870 -1.2SkyTrain extension ………………………… 1,154 1,154 1,155 1,174 1,174 1,174 1,174 1,174 1,174 1,174 1,021 1,021 -1.1
6,831 7,502 8,095 8,644 9,421 10,229 10,725 11,457 12,242 16,154 16,767 17,659 9.0Other
BC Immigration Investment Fund ………… 287 289 347 398 363 440 414 304 217 161 70 45 -15.5BC Pavilion Corporation …………………… - 49 250 383 383 382 381 389 376 374 371 378 n/a Homeowner Protection Office …………… 150 144 - - - - - - - - - - n/a Provincial government general capital …… - 294 570 808 1,073 1,372 1,698 1,987 2,288 2,718 2,363 3,133 n/a Social Housing ……………………………… 286 305 511 674 658 719 715 760 695 878 844 1,027 12.3Other ………………………………………… 35 36 81 54 40 34 27 26 28 27 24 35 0.0
758 1,117 1,759 2,317 2,517 2,947 3,235 3,466 3,604 4,158 3,672 4,618 17.9Total other taxpayer-supported debt ……… 20,658 22,609 24,857 26,846 28,774 30,845 32,600 34,685 36,855 42,451 42,681 46,229 7.6
Total taxpayer-supported debt ………………… 26,402 29,968 31,821 34,659 38,182 41,068 41,880 42,719 41,499 43,607 42,681 46,229 5.2
Self-supported debt:Commercial Crown corporations and agencies
BC Hydro …………………………………… 9,054 10,792 11,710 12,978 14,167 15,559 16,544 17,929 19,685 19,990 22,064 23,238 8.9BC Liquor Distribution Branch …………… - - - - - - - - - - - 210 n/a BC Lottery Corporation …………………… - 60 85 90 132 155 140 150 145 155 100 233 n/a BC Transmission Corporation …………… 70 70 - - - - - - - - - - n/a Columbia Power Corporation ……………… - - - - - - 300 296 291 286 282 276 n/a Columbia Basin power projects …………… 208 196 183 481 475 470 464 459 448 433 418 1,387 18.8Post-secondary institutions' subsidiaries … 149 220 173 173 215 198 222 310 340 418 387 504 11.7Transportation Investment Corp. ………… 20 544 1,148 1,779 2,610 3,209 3,335 3,355 3,398 - - - n/a Other………………………………………… 30 35 34 33 35 34 35 33 31 30 30 84 9.8
9,531 11,917 13,333 15,534 17,634 19,625 21,040 22,532 24,338 21,312 23,281 25,932 9.5Warehouse borrowing program ……………… 2,081 - - - - - - - - - - - n/a
Total self-supported debt ………………………… 11,612 11,917 13,333 15,534 17,634 19,625 21,040 22,532 24,338 21,312 23,281 25,932 7.6Total provincial debt ……………………………… 38,014 41,885 45,154 50,193 55,816 60,693 62,920 65,251 65,837 64,919 65,962 72,161 6.0
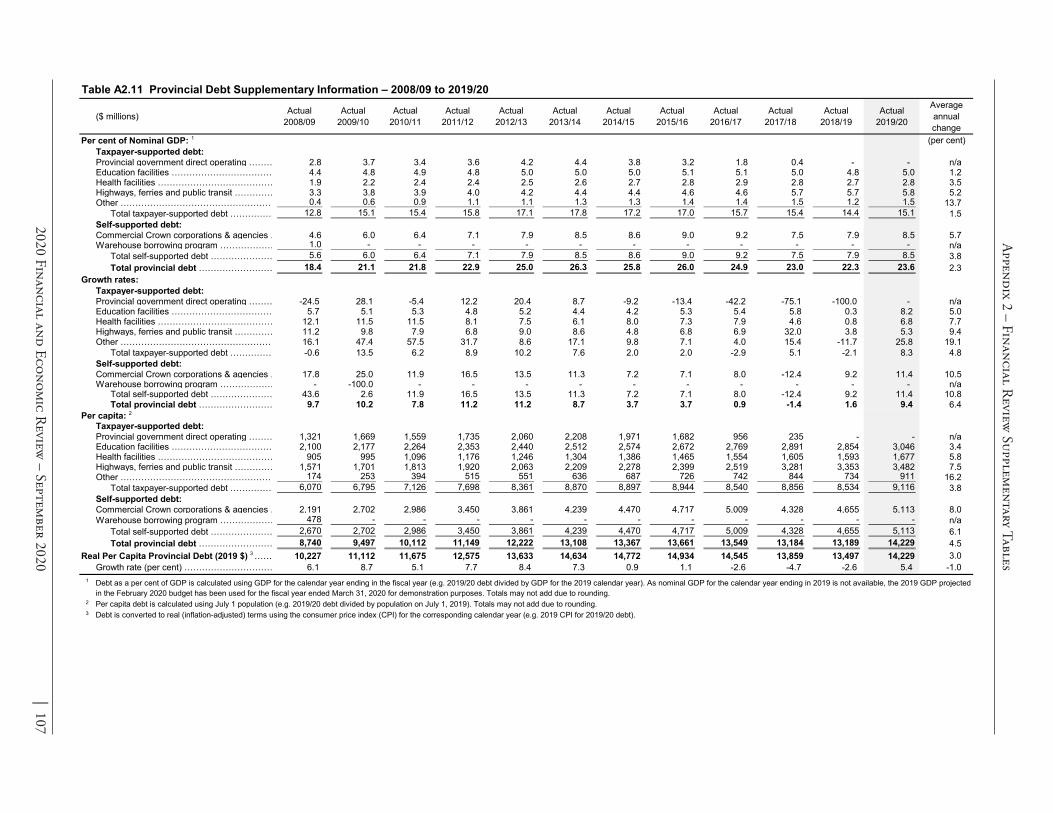
2020 Financial and Econom
ic Review
– September 2020
| 107
Appendix 2 – Financial Review
Supplementary Tables
Table A2.11 Provincial Debt Supplementary Information – 2008/09 to 2019/20
($ millions) Actual 2008/09
Actual 2009/10
Actual 2010/11
Actual 2011/12
Actual 2012/13
Actual 2013/14
Actual 2014/15
Actual 2015/16
Actual 2016/17
Actual 2017/18
Actual 2018/19
Actual 2019/20
Average annual change
Per cent of Nominal GDP: 1 (per cent)Taxpayer-supported debt:Provincial government direct operating ……… 2.8 3.7 3.4 3.6 4.2 4.4 3.8 3.2 1.8 0.4 - - n/a Education facilities ……………………………… 4.4 4.8 4.9 4.8 5.0 5.0 5.0 5.1 5.1 5.0 4.8 5.0 1.2Health facilities ………………………………… 1.9 2.2 2.4 2.4 2.5 2.6 2.7 2.8 2.9 2.8 2.7 2.8 3.5Highways, ferries and public transit …………… 3.3 3.8 3.9 4.0 4.2 4.4 4.4 4.6 4.6 5.7 5.7 5.8 5.2Other …………………………………………… 0.4 0.6 0.9 1.1 1.1 1.3 1.3 1.4 1.4 1.5 1.2 1.5 13.7
Total taxpayer-supported debt …………… 12.8 15.1 15.4 15.8 17.1 17.8 17.2 17.0 15.7 15.4 14.4 15.1 1.5Self-supported debt:Commercial Crown corporations & agencies … 4.6 6.0 6.4 7.1 7.9 8.5 8.6 9.0 9.2 7.5 7.9 8.5 5.7Warehouse borrowing program ……………… 1.0 - - - - - - - - - - - n/a
Total self-supported debt ………………… 5.6 6.0 6.4 7.1 7.9 8.5 8.6 9.0 9.2 7.5 7.9 8.5 3.8Total provincial debt ……………………… 18.4 21.1 21.8 22.9 25.0 26.3 25.8 26.0 24.9 23.0 22.3 23.6 2.3
Growth rates:Taxpayer-supported debt:Provincial government direct operating ……… -24.5 28.1 -5.4 12.2 20.4 8.7 -9.2 -13.4 -42.2 -75.1 -100.0 - n/a Education facilities ……………………………… 5.7 5.1 5.3 4.8 5.2 4.4 4.2 5.3 5.4 5.8 0.3 8.2 5.0Health facilities ………………………………… 12.1 11.5 11.5 8.1 7.5 6.1 8.0 7.3 7.9 4.6 0.8 6.8 7.7Highways, ferries and public transit …………… 11.2 9.8 7.9 6.8 9.0 8.6 4.8 6.8 6.9 32.0 3.8 5.3 9.4Other …………………………………………… 16.1 47.4 57.5 31.7 8.6 17.1 9.8 7.1 4.0 15.4 -11.7 25.8 19.1
Total taxpayer-supported debt …………… -0.6 13.5 6.2 8.9 10.2 7.6 2.0 2.0 -2.9 5.1 -2.1 8.3 4.8Self-supported debt:Commercial Crown corporations & agencies … 17.8 25.0 11.9 16.5 13.5 11.3 7.2 7.1 8.0 -12.4 9.2 11.4 10.5Warehouse borrowing program ……………… - -100.0 - - - - - - - - - - n/a
Total self-supported debt ………………… 43.6 2.6 11.9 16.5 13.5 11.3 7.2 7.1 8.0 -12.4 9.2 11.4 10.8Total provincial debt ……………………… 9.7 10.2 7.8 11.2 11.2 8.7 3.7 3.7 0.9 -1.4 1.6 9.4 6.4
Per capita: 2
Taxpayer-supported debt:Provincial government direct operating ……… 1,321 1,669 1,559 1,735 2,060 2,208 1,971 1,682 956 235 - - n/a Education facilities ……………………………… 2,100 2,177 2,264 2,353 2,440 2,512 2,574 2,672 2,769 2,891 2,854 3,046 3.4Health facilities ………………………………… 905 995 1,096 1,176 1,246 1,304 1,386 1,465 1,554 1,605 1,593 1,677 5.8Highways, ferries and public transit …………… 1,571 1,701 1,813 1,920 2,063 2,209 2,278 2,399 2,519 3,281 3,353 3,482 7.5Other …………………………………………… 174 253 394 515 551 636 687 726 742 844 734 911 16.2
Total taxpayer-supported debt …………… 6,070 6,795 7,126 7,698 8,361 8,870 8,897 8,944 8,540 8,856 8,534 9,116 3.8Self-supported debt:Commercial Crown corporations & agencies … 2,191 2,702 2,986 3,450 3,861 4,239 4,470 4,717 5,009 4,328 4,655 5,113 8.0Warehouse borrowing program ……………… 478 - - - - - - - - - - - n/a
Total self-supported debt ………………… 2,670 2,702 2,986 3,450 3,861 4,239 4,470 4,717 5,009 4,328 4,655 5,113 6.1Total provincial debt ……………………… 8,740 9,497 10,112 11,149 12,222 13,108 13,367 13,661 13,549 13,184 13,189 14,229 4.5
Real Per Capita Provincial Debt (2019 $) 3 …… 10,227 11,112 11,675 12,575 13,633 14,634 14,772 14,934 14,545 13,859 13,497 14,229 3.0Growth rate (per cent) ………………………… 6.1 8.7 5.1 7.7 8.4 7.3 0.9 1.1 -2.6 -4.7 -2.6 5.4 -1.0
1
2
3
Debt as a per cent of GDP is calculated using GDP for the calendar year ending in the fiscal year (e.g. 2019/20 debt divided by GDP for the 2019 calendar year). As nominal GDP for the calendar year ending in 2019 is not available, the 2019 GDP projected in the February 2020 budget has been used for the fiscal year ended March 31, 2020 for demonstration purposes. Totals may not add due to rounding.Per capita debt is calculated using July 1 population (e.g. 2019/20 debt divided by population on July 1, 2019). Totals may not add due to rounding. Debt is converted to real (inflation-adjusted) terms using the consumer price index (CPI) for the corresponding calendar year (e.g. 2019 CPI for 2019/20 debt).
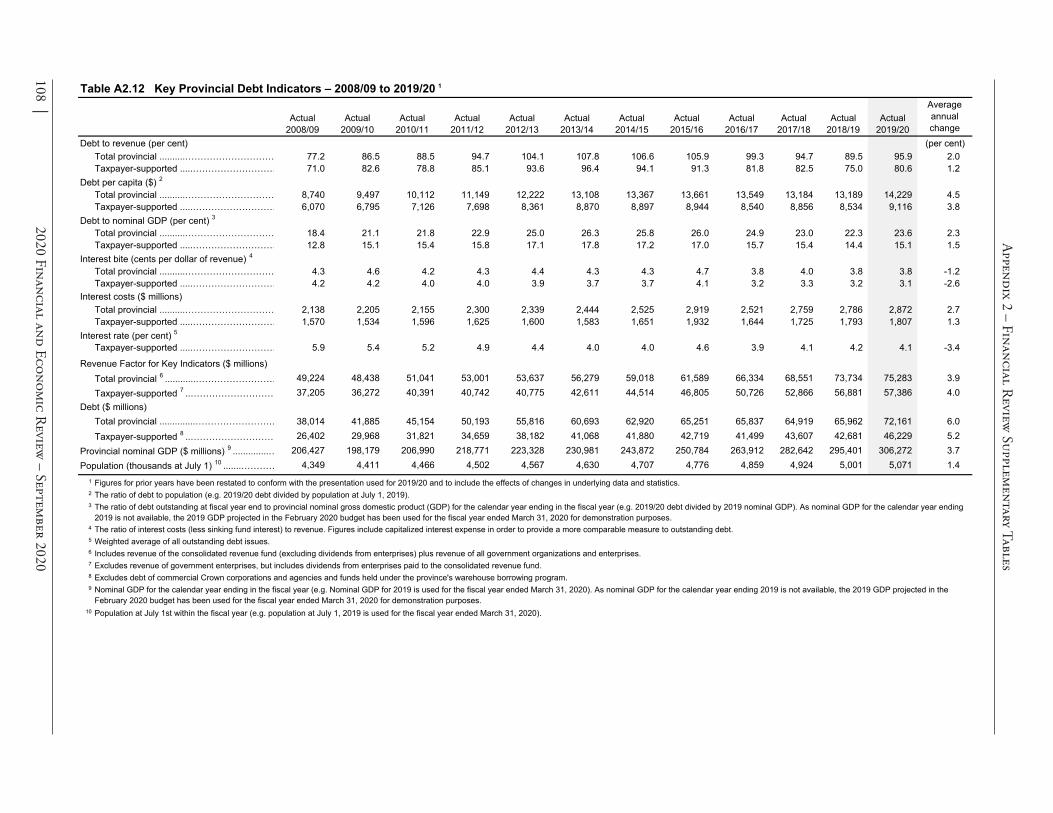
Appendix 2 – Financial Review
Supplementary Tables
108 | 2020 Financial and Econom
ic Review
– September 2020
Table A2.12 Key Provincial Debt Indicators – 2008/09 to 2019/20 1
Debt to revenue (per cent) (per cent)Total provincial ..........………………………… 77.2 86.5 88.5 94.7 104.1 107.8 106.6 105.9 99.3 94.7 89.5 95.9 2.0Taxpayer-supported .....……………………… 71.0 82.6 78.8 85.1 93.6 96.4 94.1 91.3 81.8 82.5 75.0 80.6 1.2
Debt per capita ($) 2
Total provincial ..........………………………… 8,740 9,497 10,112 11,149 12,222 13,108 13,367 13,661 13,549 13,184 13,189 14,229 4.5Taxpayer-supported .....……………………… 6,070 6,795 7,126 7,698 8,361 8,870 8,897 8,944 8,540 8,856 8,534 9,116 3.8
Debt to nominal GDP (per cent) 3
Total provincial ..........………………………… 18.4 21.1 21.8 22.9 25.0 26.3 25.8 26.0 24.9 23.0 22.3 23.6 2.3Taxpayer-supported .....……………………… 12.8 15.1 15.4 15.8 17.1 17.8 17.2 17.0 15.7 15.4 14.4 15.1 1.5
Interest bite (cents per dollar of revenue) 4
Total provincial ..........………………………… 4.3 4.6 4.2 4.3 4.4 4.3 4.3 4.7 3.8 4.0 3.8 3.8 -1.2Taxpayer-supported .....……………………… 4.2 4.2 4.0 4.0 3.9 3.7 3.7 4.1 3.2 3.3 3.2 3.1 -2.6
Interest costs ($ millions)Total provincial ..........………………………… 2,138 2,205 2,155 2,300 2,339 2,444 2,525 2,919 2,521 2,759 2,786 2,872 2.7Taxpayer-supported .....……………………… 1,570 1,534 1,596 1,625 1,600 1,583 1,651 1,932 1,644 1,725 1,793 1,807 1.3
Interest rate (per cent) 5
Taxpayer-supported .....……………………… 5.9 5.4 5.2 4.9 4.4 4.0 4.0 4.6 3.9 4.1 4.2 4.1 -3.4
Revenue Factor for Key Indicators ($ millions)Total provincial 6 ............……………………… 49,224 48,438 51,041 53,001 53,637 56,279 59,018 61,589 66,334 68,551 73,734 75,283 3.9Taxpayer-supported 7 ..………………………… 37,205 36,272 40,391 40,742 40,775 42,611 44,514 46,805 50,726 52,866 56,881 57,386 4.0
Debt ($ millions)Total provincial ..............……………………… 38,014 41,885 45,154 50,193 55,816 60,693 62,920 65,251 65,837 64,919 65,962 72,161 6.0Taxpayer-supported 8 ..………………………… 26,402 29,968 31,821 34,659 38,182 41,068 41,880 42,719 41,499 43,607 42,681 46,229 5.2
Provincial nominal GDP ($ millions) 9 ..............… 206,427 198,179 206,990 218,771 223,328 230,981 243,872 250,784 263,912 282,642 295,401 306,272 3.7Population (thousands at July 1) 10 .......………… 4,349 4,411 4,466 4,502 4,567 4,630 4,707 4,776 4,859 4,924 5,001 5,071 1.4
1
2
3
4
5
6
7
8
9
10
The ratio of interest costs (less sinking fund interest) to revenue. Figures include capitalized interest expense in order to provide a more comparable measure to outstanding debt.
Includes revenue of the consolidated revenue fund (excluding dividends from enterprises) plus revenue of all government organizations and enterprises.
Actual 2017/18
The ratio of debt outstanding at fiscal year end to provincial nominal gross domestic product (GDP) for the calendar year ending in the fiscal year (e.g. 2019/20 debt divided by 2019 nominal GDP). As nominal GDP for the calendar year ending 2019 is not available, the 2019 GDP projected in the February 2020 budget has been used for the fiscal year ended March 31, 2020 for demonstration purposes.
Nominal GDP for the calendar year ending in the fiscal year (e.g. Nominal GDP for 2019 is used for the fiscal year ended March 31, 2020). As nominal GDP for the calendar year ending 2019 is not available, the 2019 GDP projected in the February 2020 budget has been used for the fiscal year ended March 31, 2020 for demonstration purposes.
Excludes revenue of government enterprises, but includes dividends from enterprises paid to the consolidated revenue fund.Excludes debt of commercial Crown corporations and agencies and funds held under the province's warehouse borrowing program.
Actual 2014/15
Figures for prior years have been restated to conform with the presentation used for 2019/20 and to include the effects of changes in underlying data and statistics.The ratio of debt to population (e.g. 2019/20 debt divided by population at July 1, 2019).
Actual 2016/17
Actual 2019/20
Actual 2018/19
Population at July 1st within the fiscal year (e.g. population at July 1, 2019 is used for the fiscal year ended March 31, 2020).
Average annual change
Actual 2011/12
Actual 2012/13
Actual 2013/14
Actual 2008/09
Actual 2009/10
Actual 2010/11
Actual 2015/16
Weighted average of all outstanding debt issues.
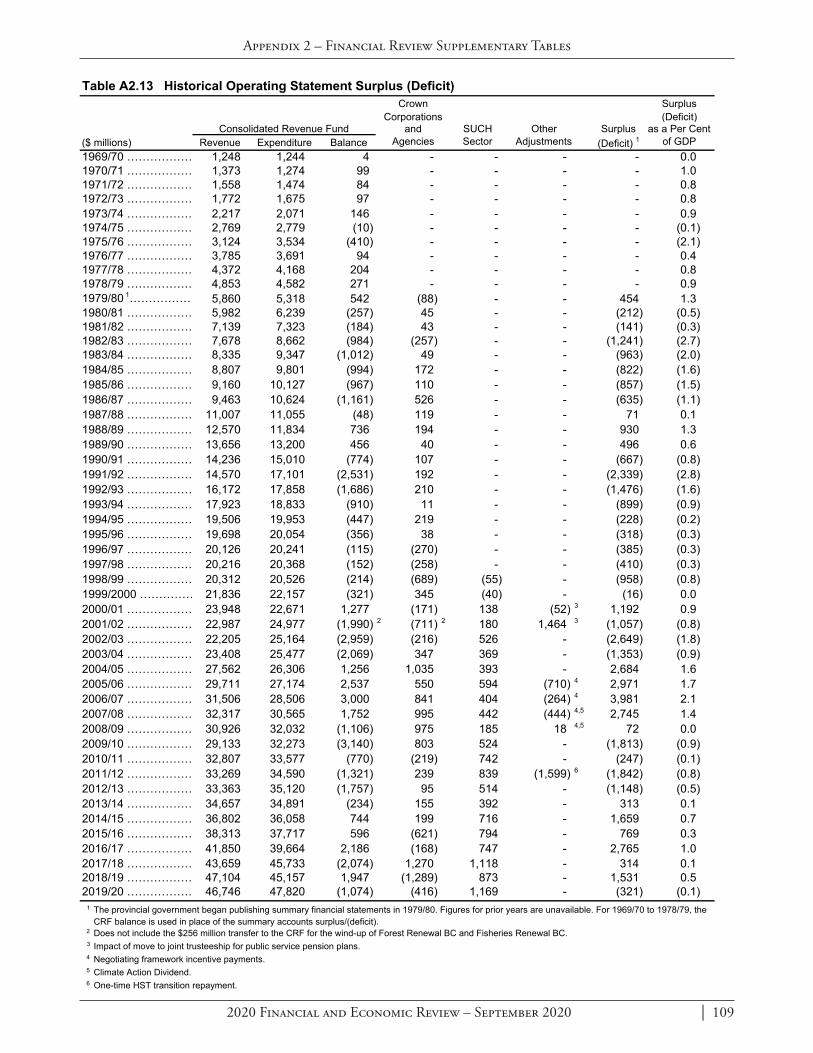
2020 Financial and Economic Review – September 2020 | 109
Appendix 2 – Financial Review Supplementary Tables
Table A2.13 Historical Operating Statement Surplus (Deficit)Crown Surplus
Corporations (Deficit)Consolidated Revenue Fund and SUCH Other Surplus as a Per Cent
($ millions) Revenue Expenditure Balance Agencies Sector Adjustments (Deficit) 1 of GDP1969/70 ……………… 1,248 1,244 4 - - - - 0.01970/71 ……………… 1,373 1,274 99 - - - - 1.0 1971/72 ……………… 1,558 1,474 84 - - - - 0.8 1972/73 ……………… 1,772 1,675 97 - - - - 0.8 1973/74 ……………… 2,217 2,071 146 - - - - 0.9 1974/75 ……………… 2,769 2,779 (10) - - - - (0.1) 1975/76 ……………… 3,124 3,534 (410) - - - - (2.1) 1976/77 ……………… 3,785 3,691 94 - - - - 0.4 1977/78 ……………… 4,372 4,168 204 - - - - 0.8 1978/79 ……………… 4,853 4,582 271 - - - - 0.9 1979/80 1……………… 5,860 5,318 542 (88) - - 454 1.3 1980/81 ……………… 5,982 6,239 (257) 45 - - (212) (0.5) 1981/82 ……………… 7,139 7,323 (184) 43 - - (141) (0.3) 1982/83 ……………… 7,678 8,662 (984) (257) - - (1,241) (2.7) 1983/84 ……………… 8,335 9,347 (1,012) 49 - - (963) (2.0) 1984/85 ……………… 8,807 9,801 (994) 172 - - (822) (1.6) 1985/86 ……………… 9,160 10,127 (967) 110 - - (857) (1.5) 1986/87 ……………… 9,463 10,624 (1,161) 526 - - (635) (1.1) 1987/88 ……………… 11,007 11,055 (48) 119 - - 71 0.1 1988/89 ……………… 12,570 11,834 736 194 - - 930 1.3 1989/90 ……………… 13,656 13,200 456 40 - - 496 0.6 1990/91 ……………… 14,236 15,010 (774) 107 - - (667) (0.8) 1991/92 ……………… 14,570 17,101 (2,531) 192 - - (2,339) (2.8) 1992/93 ……………… 16,172 17,858 (1,686) 210 - - (1,476) (1.6) 1993/94 ……………… 17,923 18,833 (910) 11 - - (899) (0.9) 1994/95 ……………… 19,506 19,953 (447) 219 - - (228) (0.2) 1995/96 ……………… 19,698 20,054 (356) 38 - - (318) (0.3) 1996/97 ……………… 20,126 20,241 (115) (270) - - (385) (0.3) 1997/98 ……………… 20,216 20,368 (152) (258) - - (410) (0.3) 1998/99 ……………… 20,312 20,526 (214) (689) (55) - (958) (0.8) 1999/2000 …………… 21,836 22,157 (321) 345 (40) - (16) 0.02000/01 ……………… 23,948 22,671 1,277 (171) 138 (52) 3 1,192 0.9 2001/02 ……………… 22,987 24,977 (1,990) 2 (711) 2 180 1,464 3 (1,057) (0.8) 2002/03 ……………… 22,205 25,164 (2,959) (216) 526 - (2,649) (1.8) 2003/04 ……………… 23,408 25,477 (2,069) 347 369 - (1,353) (0.9) 2004/05 ……………… 27,562 26,306 1,256 1,035 393 - 2,684 1.6 2005/06 ……………… 29,711 27,174 2,537 550 594 (710) 4 2,971 1.7 2006/07 ……………… 31,506 28,506 3,000 841 404 (264) 4 3,981 2.1 2007/08 ……………… 32,317 30,565 1,752 995 442 (444) 4,5 2,745 1.4 2008/09 ……………… 30,926 32,032 (1,106) 975 185 18 4,5 72 0.02009/10 ……………… 29,133 32,273 (3,140) 803 524 - (1,813) (0.9)2010/11 ……………… 32,807 33,577 (770) (219) 742 - (247) (0.1)2011/12 ……………… 33,269 34,590 (1,321) 239 839 (1,599) 6 (1,842) (0.8)2012/13 ……………… 33,363 35,120 (1,757) 95 514 - (1,148) (0.5)2013/14 ……………… 34,657 34,891 (234) 155 392 - 313 0.12014/15 ……………… 36,802 36,058 744 199 716 - 1,659 0.72015/16 ……………… 38,313 37,717 596 (621) 794 - 769 0.32016/17 ……………… 41,850 39,664 2,186 (168) 747 - 2,765 1.02017/18 ……………… 43,659 45,733 (2,074) 1,270 1,118 - 314 0.12018/19 ……………… 47,104 45,157 1,947 (1,289) 873 - 1,531 0.52019/20 ……………… 46,746 47,820 (1,074) (416) 1,169 - (321) (0.1)
1
2
3
4
5
6
Impact of move to joint trusteeship for public service pension plans.Negotiating framework incentive payments.Climate Action Dividend.One-time HST transition repayment.
Does not include the $256 million transfer to the CRF for the wind-up of Forest Renewal BC and Fisheries Renewal BC.
The provincial government began publishing summary financial statements in 1979/80. Figures for prior years are unavailable. For 1969/70 to 1978/79, the CRF balance is used in place of the summary accounts surplus/(deficit).
J:\FEP\ECB\Review\2005-06\Fiscal Tables\Appendix 2\Table A2.13 historical summary accts 2:09 PM 8/5/2020

Appendix 2 – Financial Review Supplementary Tables
110 | 2020 Financial and Economic Review – September 2020
Table A2.14 Historical Provincial Debt Summary 1
1969/70 ……… - 338 42 142 100 622 1,661 2,283 24.7 6.7 1970/71 ……… - 362 64 172 99 697 1,808 2,505 25.6 7.1 1971/72 ……… - 380 85 233 95 793 1,948 2,741 24.9 7.2 1972/73 ……… - 408 105 288 87 888 2,062 2,950 23.8 7.2 1973/74 ……… - 425 117 340 145 1,027 2,228 3,255 21.1 6.7 1974/75 ……… - 485 133 386 149 1,153 2,650 3,803 21.3 6.5 1975/76 ……… - 557 178 544 145 1,424 3,144 4,568 23.1 7.2 1976/77 ……… 261 658 236 649 188 1,992 3,787 5,779 24.4 8.4 1977/78 ……… 261 710 291 656 215 2,133 4,464 6,597 24.9 8.1 1978/79 ……… 261 778 334 653 91 2,117 4,838 6,955 23.3 7.1 1979/80 ……… 235 836 401 730 195 2,397 5,704 8,101 23.3 6.9 1980/81 ……… 209 919 461 729 270 2,588 5,956 8,544 21.6 6.5 1981/82 ……… 183 1,067 561 844 291 2,946 7,227 10,173 21.8 6.3 1982/83 ……… 883 1,204 660 1,024 894 4,665 7,692 12,357 26.5 10.0 1983/84 ……… 1,596 1,321 712 1,392 1,174 6,195 8,440 14,635 29.7 12.6 1984/85 ……… 2,476 1,308 717 691 1,276 6,468 9,082 15,550 30.0 12.5 1985/86 ……… 3,197 1,276 680 1,034 1,376 7,563 8,990 16,553 29.7 13.6 1986/87 ……… 4,802 1,268 681 1,097 812 8,660 8,485 17,145 29.1 14.7 1987/88 ……… 5,017 1,278 716 1,192 660 8,863 8,149 17,012 26.1 13.6 1988/89 ……… 4,919 1,322 763 1,213 842 9,059 7,396 16,455 22.8 12.6 1989/90 ……… 4,209 1,367 837 1,244 1,262 8,919 7,340 16,259 20.7 11.4 1990/91 ……… 4,726 1,565 959 1,287 1,281 9,818 7,444 17,262 21.0 11.9 1991/92 ……… 6,611 1,939 1,040 1,527 1,431 12,548 7,493 20,041 23.6 14.8 1992/93 ……… 8,969 2,426 1,141 1,719 1,641 15,896 7,526 23,422 25.9 17.6 1993/94 ……… 10,257 3,054 1,181 1,862 1,627 17,981 7,946 25,927 26.7 18.5 1994/95 ……… 10,181 3,631 1,318 2,158 1,749 19,037 8,013 27,050 26.1 18.4 1995/96 ……… 10,237 3,990 1,399 2,598 1,695 19,919 8,847 28,766 26.3 18.2 1996/97 ……… 11,030 4,230 1,431 3,144 1,440 21,275 8,096 29,371 26.1 18.9 1997/98 ……… 11,488 4,352 1,417 3,463 1,431 22,151 8,204 30,355 25.6 18.7 1998/99 ……… 11,707 5,023 1,494 3,678 1,330 23,232 8,910 32,142 26.8 19.4 1999/2000 …… 13,295 5,429 1,679 3,527 1,276 25,206 9,232 34,438 27.4 20.1 2000/01 ……… 11,578 5,737 2,028 4,234 1,527 25,104 8,684 33,788 24.8 18.4 2001/02 ……… 13,319 6,118 2,186 4,685 1,196 27,504 8,578 36,082 26.0 19.8 2002/03 ……… 14,957 6,394 2,265 4,835 919 29,370 7,487 36,857 25.6 20.4 2003/04 ……… 15,180 6,829 2,343 4,931 717 30,000 7,775 37,775 24.9 19.7 2004/05 ……… 13,969 7,122 2,253 4,644 660 28,648 7,221 35,869 21.8 17.4 2005/06 ……… 11,343 7,612 2,635 4,883 742 27,215 7,242 34,457 19.4 15.4 2006/07 ……… 8,889 8,026 3,053 5,436 533 25,937 7,502 33,439 17.6 13.6 2007/08 ……… 7,604 8,638 3,511 6,143 653 26,549 8,088 34,637 17.3 13.2 2008/09 ……… 5,744 9,133 3,936 6,831 758 26,402 11,612 38,014 18.4 12.8 2009/10 ……… 7,359 9,601 4,389 7,502 1,117 29,968 11,917 41,885 21.1 15.1 2010/11 ……… 6,964 10,108 4,895 8,095 1,759 31,821 13,333 45,154 21.8 15.4 2011/12 ……… 7,813 10,592 5,293 8,644 2,317 34,659 15,534 50,193 22.9 15.8 2012/13 ……… 9,408 11,145 5,691 9,421 2,517 38,182 17,634 55,816 25.0 17.1 2013/14 ……… 10,223 11,631 6,038 10,229 2,947 41,068 19,625 60,693 26.3 17.8 2014/15 ……… 9,280 12,118 6,522 10,725 3,235 41,880 21,040 62,920 25.8 17.2 2015/16 ……… 8,034 12,764 6,998 11,457 3,466 42,719 22,532 65,251 26.0 17.0 2016/17 ……… 4,644 13,457 7,552 12,242 3,604 41,499 24,338 65,837 24.9 15.7 2017/18 ……… 1,156 14,236 7,903 16,154 4,158 43,607 21,312 64,919 23.0 15.4 2018/19 ……… - 14,274 7,968 16,767 3,672 42,681 23,281 65,962 22.3 14.4 2019/20 ……… - 15,445 8,507 17,659 4,618 46,229 25,932 72,161 23.6 15.1
1
2
3
Taxpayer-Supported
Debt as a Per Cent of GDPYear
Self-Supported
Debt 3
Total Provincial
Debt
Total Debt as a
Per Cent of GDP
(per cent)
Provincial debt is prepared in accordance with Generally Accepted Accounting Principles and presented consistent with the Debt Summary Report included in the Public Accounts . Debt is shown net of sinking funds and unamortized discounts, excludes accrued interest, and includes non-guaranteed debt directly incurred by commercial Crown corporations and debt guaranteed by the Province.
Includes commercial Crown corporations and agencies and funds held under the province's warehouse borrowing program.
($ millions)
Taxpayer-Supported Debt
Provincial Government
Direct Operating
Education Facilities Capital
Financing
Health Facilities Capital
Financing
Highways, Ferries and
Public Transit Other 2
Total Taxpayer-Supported
Debt
Includes BC Buildings, BC Housing Management Commission, Provincial Rental Housing Corporation, other taxpayer-supported Crown agencies, and loan guarantee provisions.
J:\FEP\ECB\Review\2005-06\Fiscal Tables\Debt\Table A2.14 historical debt 7/14/2020 3:29 PM

This page intentionally left blank

VISIT OUR WEBSITE AT: WWW.GOV.BC.CA/FIN