2020 - bok.or.kr
TRANSCRIPT


2020

Korean System of National Accounts
Published on : December, 2020
Publisher : Lee, Juyeol Governor Bank of Korea
Editor : Park, Yang Su Director General Economic Statistics Department
Published by : Bank of Korea Seoul, Korea
Printed by : Jeil Printec
No reproduction, copy, transmission or translation of this publication may be made without written permission. Applications should be sent to the National Accounts Coordination Team, Economic Statistics Department, Bank of Korea, [email protected] or by fax (82-2) 759-4387.An electronic copy of this manual is available at http://www.bok.or.kr. For questions about this book, please contact the National Accounts Coordination Team, Economic Statistics Department, Bank of Korea at (82-2) 759-4394.
Contributors
Authors : • Senior Economists• Economists
Kim, Hwa YongAhn, Yong BiHwang, Ji YongKim, Sun ImKim, Yong HyunLee, Hyeon YeongLee, Kwang WonLee, Moon HeeLee, Seung HanPark, Min SuPark, Ji Won
• Junior Economists
• Analyst
Choi, Yeol MaeHeo, Jin WooJeong, Hyo WonKim, Ji EunKim, Ji HyunKim, Jun YoungKim, Kyu MinKim, Se YongPark, Seong HeeSong, Su HyukYoo, Hyeon KyeongYoon, Dong JaeYoon, Nam JunKim, Jung HeeShin, Ui Hyeon
Advisor : Park, Seong BinDirector, National Accounts DivisionLee, Dong WonHead, National Accounts Coordination Team
Choi, Jung TaeHead, National Expenditure Statistics TeamLee, Kwan KyoHead, National Income Statistics Section


Preface
Bank of Korea (BOK) has been steadily compiling the Korean national accounts for nearly sixty years since the BOK’s designation as the official agency for national income statistics compilation in 1957, in this process developing a high level of expertise. During the course of 12 comprehensive revisions, it has also done its utmost to implement new international standards, to adopt advanced techniques, and to enhance the quality of the national income statistics by improving the methodologies and expanding the data sources used.
BOK is at the same time committed to strengthening transparency in the procedures of national income statistics compilation, and to deepening users' understandings of them. For this purpose, this guide on Korea's national income statistics has been published in both Korean and English versions, and been revised on occasions of major changes in the methods and source data. �is revised guide is focused on re�ecting the latest changes in estimation methods and source data from the recent comprehensive revision, and implementing new international standards, while maintaining the basic framework of the previous version.
The BOK endeavored to explain the changes in its comprehensive revision in 2019 that updated the reference year from 2010 to 2015, as well as the additional implementation of new international standards a�er �nalizing the implementation of 2008 SNA and the improvement of statistical methods. In particular, we expanded the provision of national income distribution statistics with the introduction of income ratios from various economic entities so that these statistics could be used to analyze the e�ects of any redistribution of income or social welfare policies. We also enhanced the usefulness of the statistics as analysis and research tools by strengthening the compatibility between public accounts and government �nancial accounts. In addition, we incorporated the digital sharing economy into our statistics, which has been growing rapidly recently.
We would like to express our appreciation to all those who have cooperated with us in compiling the Korean national accounts. We hope that this book will provide e�ective help to many users seeking to understand and utilize the national accounts. We promise moreover to strive for further development of the national accounts in the future, and hope for the great interest and sage advice of all those consulting with us on this work.
PARK, YANG SU
Director GeneralEconomic Statistics Department
Bank of Korea


Contents
I. IntroductionChapter 1 Basic Concepts 3
1. Concepts of National Income 3
2. National Accounts and National Income Statistics 4
3. Circular Flow of National Economy 5
Chapter 2 History of National Accounts in Korea 8
Chapter 3 Methodological Changes to the Measurement of Korean National
Accounts due to Adoption of 2008 SNA 12
Ⅱ. Overview of National Accounts SystemChapter 4 Introduction 17
Chapter 5 Composition of National Accounts 18
1. Composition of Accounts 18
2. Structure of Integrated Economic Account 18
Chapter 6 Conceptual Elements of National Accounts 24
1. Classification of Economic Subject 24
2. Principal Transaction Items 28
Chapter 7 Rules of Accounting and Valuation 40
1. Rules of Accounting 40
2. Transaction Valuation Method 44
Ⅲ. Method and Data SourcesChapter 8 Introduction 49
1. Overview 49
2. Converting Nominal National Income into Real Value 50
Chapter 9 Production Approach 52
1. Production Approach Outline 52
2. Agriculture, Forestry and Fishing 52
3. Mining and Quarrying 58
4. Manufacturing 63
5. Electricity, Gas and Water Supply 72
6. Construction 78
7. Wholesale and Retail Trade, Accommodation and food service activities 89
8. Transportation 94

9. Finance and Insurance 98
10. Real Estate 109
11. Information and Communication 113
12. Business Activities 118
13. Public Administration, Defense & Other Government Services 124
14. Education Services 133
15. Human Health and Social Work Services 137
16. Cultural and Other Services 142
17. Taxes on Production and Imports, Subsidies 147
Chapter 10 Expenditure Approach 150
1. Introduction 150
2. Final Consumption Expenditure 154
3. Gross Capital Formation 164
4. Exports and Imports of Goods and Services 177
Chapter 11 Income Approach 184
1. Outline of Income Approach 184
2. Concept of Income Components 184
3. Estimation Method 191
4. Data Sources 194
Ⅳ. Tables and Principal IndicatorsChapter 12 Overview 197
Chapter 13 Consolidated Accounts 200
1. Gross Domestic Product and Expenditure Account 200
2. National Disposal Income and Its Appropriation Account 201
3. Capital Transactions Account 207
4. Financial Transactions Account 208
5. External Transactions Account 208
Chapter 14 Sectoral Accounts 211
1. Production Account by Institutional Sector 211
2. Income Account by Institutional Sector 212
3. Capital Account by Institutional Sector 214
4. Financial Account by Institutional Sector 216
Chapter 15 Public Sector Account 219

Chapter 16 Supporting Tables 222
1. GDP and GNI by Kind of Economic Activities 222
2. Expenditure on Gross Domestic Product 222
3. Gross Value Added and Factor Income by Kind of Economic Activities 222
4. National Income and National Disposable Income 223
5. Gross Capital Formation by Type of Capital Good and by Sector 223
6. Gross Capital Formation by Kind of Economic Activities 223
7. Gross Fixed Capital Formation by Kind of Economic Activities and Type of Capital Goods 223
8. Facilities Investments by Kind of Economic Activities 224
9. Final Consumption Expenditure of Households by Purpose 224
10. Final Consumption Expenditure of Households by Type 224
11. Final Consumption Expenditure of Non-profit Institutions Serving Households
by Purpose 224
12. Final Consumption Expenditure of Non-profit Institutions Serving Households
According to Cost composition and Purpose 225
13. General Government Final Consumption Expenditure by Function 225
14. General Government Total Expenditure by Function 225
15. External Transactions 225
16. Gross Savings and Gross Investments 226
Ⅴ. Technical IssuesChapter 17 Seasonal Adjustment 229
1. Introduction 229
2. Seasonal Adjustment Methods 231
3. Seasonal Adjustment of GDP in Korea 232
4. Recommendation for Using Seasonally Adjusted Figures 232
Chapter 18 Chain-Linking Method 233
1. Overview 233
2. Basic Comprehension of Indices 233
3. Real GDP Measurement Methods 234
4. Chain-linked Method: Advantages and Disadvantages 237
5. Complications with Real GDP Use 238
Chapter 19 Benchmarking Method 239
1. Introduction 239
2. Benchmarking Methods 239
3. Step Problem 240
4. Proportional-Denton Method 241

Appendices1. Classifications 247
2. Using the Economic Statistics System (ECOS) 252
Index 253
Reference 259
[List of Boxes]Box Ⅲ-9-1 : Nominal Value Added Ratio Calculation Method 68
Box Ⅲ-9-2 : FISIM 103
Box Ⅲ-10-1: Commodity Flow Method 153
Box Ⅲ-10-2: Estimation of Annual Changes in Inventories Using Corporate
Accounting Data (Example) 176
[List of Charts]
Chart Ⅰ-1-1 : Breakdown of National Accounts System by Five Sets of Statistics 5
Chart Ⅲ-9-1 : Distribution Channel of Electric Power 73
Chart Ⅳ-13-1: Comparison of Various Gross National Income Indicators in 2018 204
Chart Ⅳ-13-2: Composition of Gross National Disposable Income in 2018 205
Chart Ⅴ-17-1: Original and Seasonally Adjusted GDP Figures (Chain Volume Measure) 229
Chart Ⅴ-17-2: Seasonal Adjustment Process 230

Abbreviations and Acronyms
BLS Bureau of Labor Statistics
CIF Cost, Insurance and Freight
COFOG Classi�cation of the Functions of Government
COICOP Classi�cation of individual Consumption by Purpose
COPNI Classi�cation of the Purposes of Non-pro�t Institutions Serving Households
COPP classi�cation of outlays of producers by purpose
CPI consumer price index
ECOS Economic Statistics System
Eurostat Statistical O�ce of the European Communities
FISIM Financial Intermediation Services Indirectly Measured
FOB. Free on Board
GDI Gross Domestic Income
GDP Gross Domestic Product
GFCF Gross Fixed Capital Formation
GNDI Gross National Disposable Income
GNI Gross National Income
ICT Information and Communication Technology
IMF International Monetary Fund
I/O Input-Output
KSIC Korean Standard Industrial Classi�cation
NDI National Disposable Income
NI National Income
NNI Net National Income
NPISHs Non-pro�t Institutions Serving Households
OECD Organization for Economic Co-operation and Development
PPI Producer Price Index
SA Seasonal Adjustment
SAM Social Accounting Matrix
SDR Special Drawing Rights
SEEA System of Environmental and Economic Accounts
SNA System of National Accounts
UN United Nations
VAT Value Added Tax


BANK OF KOREA ┃┃ 3
Ⅰ. Introduction
Chapter 1: Basic Concepts
1. Concepts of National Income
1.1 Various economic statistics, such as those concerning the balance of
payments, foreign exchange reserves, fiscal scale, and the production and sales of
motor vehicles, can be used to measure the economic performance of a country or
the living standards of its people. However, these indicators show only a part of the
national economy. Accordingly, there are in reality many constraints in measuring the
overall economic situation of an economy. What is needed, therefore, is an indicator
that can comprehensively represent a country’s economic performance or the living
standards of its people. National income is generally regarded as the most e�ective
benchmark indicator for this purpose.
1.2 National income refers to the total market value of goods and services
newly produced by all economic units, including households, enterprises and the
government within a country during a certain period of time (for example, a quarter
or a year). It is commonly known by the term, gross domestic product (GDP).1)
1.3 Income, for its part, can be seen through its economic, tax-generating and
social statistical aspects. For national accounts, however, income is defined as total
(value added) production, excluding intermediate consumption from the output
produced by each economic unit. In summary then:
• Production (Value Added) = Output - Intermediate Consumption
1) Gross national income (GNI) is another core indicator in national income statistics. GNI is not a concept of value added, but a concept of residents’ income in comparison with GDP. GNI is equal to GDP plus net factor income from abroad.

4 ┃┃ 한국은행
Korean System of National Accounts
2. National Accounts and National Income Statistics
1.4 National income statistics are not the sole means for measuring the �ow of
a country’s economy. The supply and demand of goods and services, and industry
inputs and outputs, for example, can also be measured by input-output tables or
supply and use tables. We can also refer to the �ow of funds accounts, which show
the circulation of funds between economic sectors; the balance of payments, which
details external transactions with institutions worldwide; and the national balance
sheet, which shows the status of assets and liabilities within a national economy at a
given point of time. However, these statistics have been developed independently and
di�er in their respective methodologies and compilation standards. Consequently, a
framework that tethers these statistics to one common standard is needed to grasp a
national economy comprehensively and systematically.
1.5 Recognizing this necessity, the United Nations established an international
standard, the System of National Accounts (SNA), which systematically links various
statistics. The system links input-output tables (or supply and use tables) to the
production account of national accounts; national income statistics to the production,
income and capital accounts; flow of funds accounts to the capital and financial
accounts; balance of payments to the external transactions account; and the national
balance sheet to the balance sheet account.
1.6 In this way, the SNA systematically links five sets of statistics – national
income statistics, input-output tables (or supply and use tables), the flow of funds
accounts, the balance of payments, and the national balance sheet – and consistently
records goods and services transactions and the �ow of funds in the overall national
economy using the same accounting method. As a result, the national accounts can be
seen as a national economy’s general �nancial statement, representing a snapshot of
national economic activity and the status of a nation’s assets and liabilities at a certain
point in time.

BANK OF KOREA ┃┃ 5
Ⅰ. Introduction
Chart Ⅰ-1-1 Breakdown of National Accounts by Five Sets of Statistics2)
National Accounts
Production Accounts
Input-outputtables
(Supply and use tables)
Income Accounts
National Income
Statistics
Capital Accounts
Flow ofFunds
Financial Accounts
External Accounts
Balance ofpayment
InternationalInvesmentPosition
Balance Sheet Accounts
National Balance Sheet
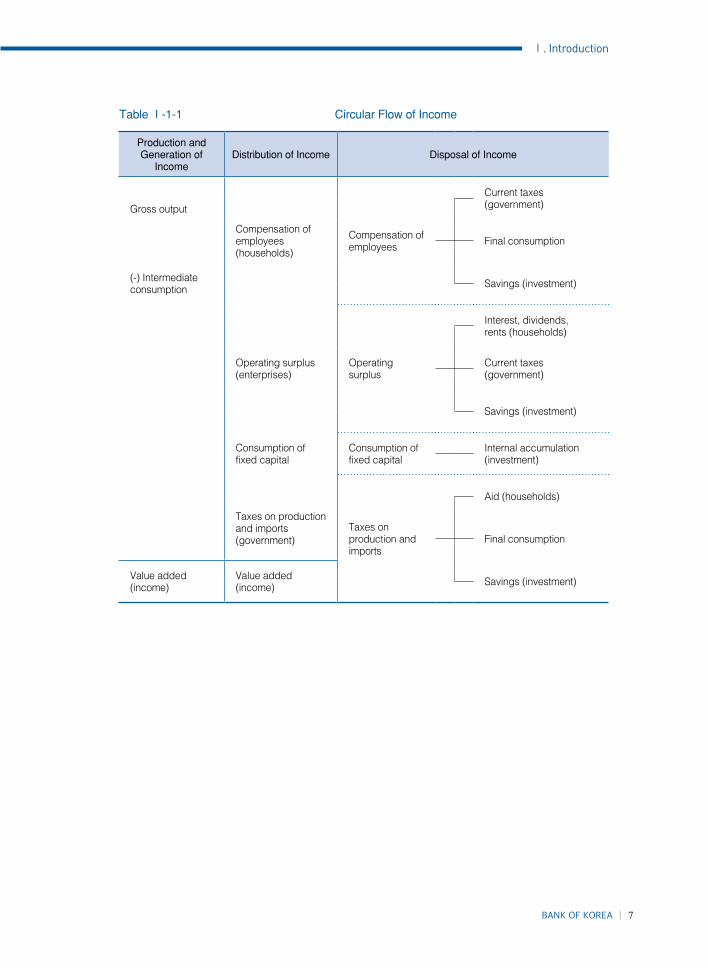
3. Circular Flow of National Economy
1.7 A national economy grows by the reiterative processes of generating income
through production activities, distributing and disposing the income generated, and
�nancing and accumulating the capital necessary for income generation. �is cycle is
known as the circular �ow of income.
1.8 First, in the course of generating income, production agents (mainly
enterprises) combine machinery, buildings, production factors and raw materials to
produce goods and services. When the produced goods and services are sold for the
purpose of investment or consumption, the portion of the sales price exceeding total
production cost is referred to as generated income.
1.9 Distribution of income refers to the process of distributing generated
income to those who supply production factors (e.g. labor, land and capital, etc.).
Compensation of employees3) is distributed to those households offering labor, the
operating surplus4) to production agents themselves, and taxes on production and
imports to the government.
2) The international investment position (IIP) is a statistical statement of stock at a certain point in time, showing the value and composition of financial assets and the liabilities of an economy’s residents vis-à-vis its non-residents.
3) This includes wages and salaries payable in cash or in kind; social insurance contributions payable by employers, which include contributions to social security schemes; actual social contributions to other employment-related social insurance schemes; and imputed social contributions to other employment-related social insurance schemes.
4) This is a similar concept to operating profits on the corporate statement of profit and loss, but strictly speaking there are differences between the depreciation method and the inventory asset assessment method.

6 ┃┃ 한국은행
Korean System of National Accounts
1.10 Income disposal occurs when economic units (i.e. households, enterprises5)
and government) purchase the goods and services necessary for carrying out
economic activities with earned income or save the remaining portion to be utilized
as investment capital.
1.11 Production must be accompanied by investment in related facilities in order
to enable the economic units to generate and distribute income continuously. The
�nancing of capital means the source of funds for investment and the accumulation
of capital emerge as investment in production facilities. For example, enterprises �rst
appropriate capital for investment from their own internal reserves and then come to
rely on loans from �nancial institutions and the issuance of stocks or corporate bonds
to meet capital shortfalls as needed for the purchase of factory sites, buildings and
machinery.
1.12 Putting the circular �ow of a national economy into speci�c �gures produces
national income accounts, which reveal the circular flow of a national economy
accurately, comprehensively and systematically.
5) The term “enterprise” may refer to a corporation, a quasi-corporation, a non-profit institution (NPI) or an unincorporated enterprise.
BANK OF KOREA ┃┃ 7
Ⅰ. Introduction
Table Ⅰ-1-1 Circular Flow of Income
Production and Generation of
IncomeDistribution of Income Disposal of Income
Gross output
Compensation ofemployees(households)
Compensation of employees
Current taxes (government)
Final consumption
(-) Intermediate consumption Savings (investment)
Operating surplus (enterprises)
Operating surplus
Interest, dividends,rents (households)
Current taxes (government)
Savings (investment)
Consumption of fixed capital
Consumption of fixed capital
Internal accumulation(investment)
Taxes on production and imports
Aid (households)
Taxes on production and imports(government) Final consumption
Value added(income)
Value added(income) Savings (investment)
8 ┃┃ 한국은행
Korean System of National Accounts
Chapter 2: History of National Accounts in Korea
2.1 The history of national income statistics in Korea can be traced back to
around the end of the colonial period. Before Liberation (the period from 1937 to
1945), the Ministry of Finance of the Government-General of Chosun (the colonial
Japanese government) compiled rough estimates on income annually. Immediately
a�er liberation (1945 to 1957), the Planning O�ce, the Ministry of Finance and the
Bank of Chosun (the Bank of Korea from 1950) compiled national income statistics
from the economy’s production, distribution and expenditure sides, respectively.
2.2 �e Economic Coordination O�ce of the UN, established to support post-
war reconstruction work, also estimated national income independently to attain
guidelines for its assistance policy. However, insufficient data sources and differing
estimation methods resulted in widely divergent figures, a lack of consistency and
confusion.
2.3 In August 1957, the Tax Advisory Team of the U.S. Treasury Department, led
by Dr. James K. Hall, visited Korea and noted in a paper titled “Recommendation for
Korean Gross National Product (GNP)” that the Korean government should avoid
compiling national income statistics from various organizations due to the lack of
consistent verification and rather recommended that the Bank of Korea be made
solely responsible for compiling national income statistics. �e Korean government
adopted this recommendation, and the Bank of Korea became the o�cial compiler of
national income statistics in Korea.
2.4 In 1958, the Bank of Korea used the 1953 SNA as recommended by the UN to
calculate the country’s annual GNP and related expenditures at current and constant
prices (base year: 1955). It also retroactively estimated the annual GNP from 1953 to
1957. �e Bank of Korea built the foundation for Korean national income statistics
in 1959 by adding a distribution-side national income series, a general government
balance table and an external transactions table, among other calculations.

BANK OF KOREA ┃┃ 9
Ⅰ. Introduction
2.5 From the early 1960s, demand for quarterly statistics became acute since such
statistics were an essential component of the government's economic development
plans. The Bank of Korea thus began producing quarterly analyses together with
retrospective estimates going back to 1960. Quarterly reports became institutionalized
starting in 1968.
2.6 In 1986, the Bank of Korea began integrating national income statistics,
�ow of funds accounts and the balance of payments table, and in 1988 combined the
production account that linked input-output tables with national income statistics.
2.7 In 1995, the Bank of Korea changed the key indicator of economic growth
from the previous gross national product (GNP) to gross domestic product (GDP).
From 1999, it introduced gross national income (GNI) and began to release quarterly
nominal GDP and seasonally-adjusted statistics.
2.8 �e Bank of Korea completed the shi� to the 1993 SNA in 2004, adding the
valuation of output by basic prices and new treatment of the �nancial intermediation
services indirectly measured (FISIM) disposal method, expanding the scope of
capital formation and �xed capital consumption, and adjusting the base year to 2000.
Following its �rst announcement of “advance” quarterly estimates in 2005, the Bank
of Korea in 2006 completed the work of converting the main indicator of quarterly
economic growth from a year-on-year comparison based on previously collected data
to a quarter-to-quarter comparison based on seasonally-adjusted time series data.
2.9 In 2009, in accordance with 1993 SNA recommendations, the method for
the compilation of real GDP statistics was changed from the �xed-weighted method
to the annual chain-linking method (reference year: 2005) to re�ect more immediate
changes in economic situations. Moreover, the estimation method for expenditure
components was altered from the commodity-flow method, which was based on a
production-approach measurement of national income, to the direct (expenditure
component) estimation method.

10 ┃┃ 한국은행
Korean System of National Accounts
2.10 In 2014, the Bank of Korea completed its comprehensive revision of the
Korean national accounts, beginning with statistics from 1953. �ese comprehensive
revisions included implementation of the 2008 SNA and updating the reference year
from 2005 to 2010. �e Bank of Korea, jointly with Statistics Korea, newly released the
Korean national balance sheet at the same time. �e national balance sheet allowed
for the systematic integration of stock accounts, which record asset accumulation,
and flow accounts for production and income. The Bank of Korea also adjusted
discrepancies between quarterly GDP and annual GDP in a more systematic way by
adopting an advanced benchmarking technique, numerically based, that minimizes
revisions of quarterly growth rate of GDP and reduces step problems between years.
2.11 In 2019, the Bank of Korea strengthened the income account and the public
sector account to meet statistical demand. �e Bank of Korea also re�ected the digital
economy in the GDP �gures, and updated the reference year from 2010 to 2015.

BANK OF KOREA ┃┃ 11
Ⅰ. Introduction
Table Ⅰ-2-1 History of National Accounts in Korea
Year Milestone
1937~45 Rough estimates of total production volumes by item were compiled annually by the financial bureau of the Government-General of Chosun.
1945~57Various organizations, including the Planning Bureau, the Bank of Chosun and the Financial Bureau, developed national income estimates independently, resulting in confusing and dramatically disparate estimates.
1957 The Bank of Korea was designated the official compiler of national income and related statistics.
1958“Gross Domestic Product by Industry” and “Expenditure on GDP” estimates compiled every year from 1953 to 1957 in accordance with the 1953 SNA as recommended by the UN.
1968 Compilation of quarterly national income statistics began.
1986 National accounts combined with national income statistics, flow of funds account and balance of payments in accordance with the 1968 SNA.
1988Input-output tables and national income statistics connected to compile production accounts; national accounts completed through consolidating four of five national economic statistics with the exception of the national balance sheet.
1995 Main index for economic growth rate shifted from GNP to GDP.
19991993 SNA partially reflected by adopting GNI, and release calendar set in advance in accordance with the IMF's SDDS. In addition, quarterly nominal GDP and seasonally-adjusted statistics released for the first time.
2004 Primary 1993 SNA standards reflected, leading to complete adoption of the 1993 SNA systems.
2005 Advance estimates of quarterly GDP released for the first time.
2006 Primary quarterly GDP index shifted from year-on-year percentage change in original series to period-on-period percentage change based on seasonally-adjusted series.
2009
In accordance with 1993 SNA recommendations, the method for compilation of real GDP statistics is changed from a fixed-weighted method to the annual chain-linking method (reference year: 2005). The estimation method for expenditure components altered from commodity-flow method, which was based on national income measured by production approach, to direct (expenditure component) estimation.
2014
The Bank of Korea completes comprehensive revisions of the Korean National Accounts, beginning with statistics from 1953. These comprehensive revisions include implementation of the 2008 SNA and updating of the reference year from 2005 to 2010. The Bank of Korea, jointly with Statistics Korea, compiled and released the first results of the Korean national balance sheet for 2012.
2019The Bank of Korea strengthened the income account and the public sector account to meet statistical demand. The Bank of Korea also reflected the digital economy in the GDP figures, and updated the reference year from 2010 to 2015.

12 ┃┃ 한국은행
Korean System of National Accounts
Chapter 3: Methodological Changes to the Measurement of Korean National Accounts due to Adoption of 2008 SNA
3.1 The SNA is the internationally agreed-upon standard for compilation of
national account statistics. Since the �rst SNA was published by the UN in 1953, it
has been revised three times (in 1968, 1993 and 2008). �e 2008 SNA is an updated
version of the 1993 SNA. Though the 2008 SNA maintains the basic framework of
the 1993 SNA, it better reflects the needs of its users and changes in the economic
atmosphere. For example, the 2008 SNA recommends new approaches for emerging
economic phenomena such as globalization and the knowledge economy.
3.2 In 2010, the Bank of Korea established a comprehensive plan to implement
the 2008 SNA by 2014. During this period, the bank collected new source data and
conducted business surveys as necessary to ensure the successful implementation
of the 2008 SNA, while analyzing specific estimation methods. As a result of these
e�orts, the comprehensive revision of the Korean national accounts was completed in
2014. �ese comprehensive revisions include implementation of the 2008 SNA and
updating of the reference year from 2005 to 2010. With the implementation of the
2008 SNA, there were many conceptual changes to the Korean national accounts. �e
major methodological changes that impacted the Korean national accounts including
GDP are summarized below.
3.3 With the introduction of the 2008 SNA, the asset boundary was extended
to recognize expenditure on research and development (R&D) as an investment
in R&D assets. This means that R&D expenditures that contribute to production
for more than a year are no longer deducted from the output to measure the value
added. R&D expenditures are categorized as intellectual property products in the
gross �xed capital formation, which also includes computer so�ware, database, and
entertainment, literary and original artistic originals. Additionally, expenditure on
large military weapons such as warships, ballistic missiles and tanks are also treated as
assets. �e 1993 SNA treated as gross �xed capital formation only those expenditures
by the military on �xed assets of a kind that could be used for civilian purposes of

BANK OF KOREA ┃┃ 13
Ⅰ. Introduction
production. On the other hand, military weapons, and the vehicles and equipment
whose sole purpose was to launch or deliver such weapons, were not treated as gross
�xed capital formation but as intermediate consumption.
3.4 The 2008 SNA gives guidance to distinguish between legal ownership and
economic ownership, and emphasizes the principle of ownership change in recording
transactions in goods, services and �nancial assets. Under this principle, the imports
and exports of goods sent abroad for processing are recorded based on economic
ownership change principles, while merchanting margins are reclassified from the
services category to the net exports of goods category. Previously, the imports and
exports of goods sent abroad for processing were exempt from change of ownership
principles. Regarding the measurement of transactions of enterprises participating
in global production in the national accounts and balance of payments statistics, this
“economic ownership” principle better re�ects the reality.
3.5 �e term “goods sent abroad for processing” refers to the situation in which
a resident company, the principal, sends raw materials or semi-processed goods
abroad for processing while retaining economic ownership of these goods. After
processing, the goods may be sent back to the company, or to customers that are
resident in the country. It is also possible that after processing, the goods do not
return and are directly delivered to customers in the country where the processing
takes place or are delivered to yet another country. Under the 1993 SNA, these sort
of goods were treated as exports. However, the 2008 SNA recommends that imports
and exports be recorded on a change of ownership basis. �at is, the �ows of goods
between the country owning the goods and the country providing the processing
services should not be recorded as imports and exports of goods. Instead the fee paid
to the processing unit should be recorded as the import of processing services by the
country owning the goods and as an export of processing services by the country
providing such services.
3.6 Merchanting is the activity of buying some commodities in a foreign country
and selling them in a foreign country, without going through the merchant’s country.
14 ┃┃ 한국은행
Korean System of National Accounts
Under the 1993 SNA the margins of the merchant were recorded as exports of
services. However, they are now treated as net exports of goods. �us, goods acquired
by a merchant are entered as negative exports, whereas goods sold are recorded as
positive exports. Merchant margins are classi�ed separately from exports and imports
of general goods and recorded as net exports.
3.7 The Bank of Korea newly compiled public sector accounts by integrating
government and public corporation transactions and released the initial results
in April 2014. Public sector accounts provide data for transactions concerning
the public in GDP, and this account is compiled separately as a satellite account in
accordance with the 2008 SNA. Meanwhile, �scal indicators, including total revenue,
total expenditure and net lending/borrowing of the public sector, are calculated
in accordance with the 2008 SNA in order to make it possible to evaluate public
expenditure outcomes and analyze �scal soundness, which grew in importance a�er
the European sovereign debt crisis. Furthermore the Bank of Korea has begun to
compile supply and use tables, which provide a breakdown of supplies and usages
by commodity type for each industry. Thus the linkage between I-O statistics and
statistical data by industry including GDP was strengthened.
3.8 The method for calculating financial intermediation services indirectly
measured (FISIM) was refined using the market interest rate as the reference rate
according to the 2008 SNA recommendation. And in terms of estimating the output
of insurance using the expectation approach, the periods of moving average were
changed from 9 quarters to 20 quarters to reduce the volatility of insurance output.


BANK OF KOREA ┃┃ 17
Ⅱ. Overview of National Accounts System
Chapter 4: Introduction
4.1 �e System of National Accounts (SNA) as a guide or standard to compile
national accounts was prepared under the auspices of the United Nations (UN),
the European Commission (EC), the Organisation for Economic Co-operation and
Development (OECD), the International Monetary Fund (IMF) and the World Bank
(WB). It includes o�cial economic statistics such as national income statistics, input-
output tables, �ow of funds, balance of payment, and the national balance sheet. For
balance of payments, the “Balance of Payment and International Investment Position
Manual (BPM)” prepared by the IMF is used, though its contents are almost identical
to those of the SNA in terms of concept, recording method and coverage.
4.2 The SNA is a consistent and integrated statistical system comprised of
internationally agreed concepts, de�nitions, classi�cations, and accounting methods
and aimed at facilitating economic policies and analyses. �us, the SNA is basically
dependent on economic principles and business accounting systems, such as
double-entry bookkeeping. Economic theories are preferable to business accounting
principles since all transactions registered in each account comprise a consolidated
system matched with corresponding items from another account.
4.3 The original 1953 SNA has been revised three times – in 1968, 1993, and
2008 – to reflect changes in the economic environment. Countries apply one of
the four SNA versions, according to their economic situation. �e Korean national
account is currently compiled in accordance with the 2008 SNA.

18 ┃┃ 한국은행
Korean System of National Accounts
Chapter 5: Composition of National Accounts
1. Composition of Accounts
5.1 The five national economic statistics included in national accounts are
introduced briefly below. The system of accounts used in the 2008 SNA consists of
a central framework and supplemental (other) framework. In addition, the central
framework is composed of several sub-accounts which show production, income,
consumption, accumulation, wealth and other fundamental economic phenomena.
�e other framework consists of satellite accounts and the social accounting matrix
(SAM).
Table Ⅱ-5-1 System of Accounts for the 2008 SNA
Integrated economic account
Supply-use tables and input-output tables
CentralFramework Financial transaction tables & financial asset/liability tables
Complete balance sheets and assets and liabilities accounts
Functional analysis
Population and employment tables
Other Frameworks
Satellite Accounts: Tourism, health, system of environmental and economic accounts (SEEA), etc.
Social accounting matrix (SAM)
2. Structure of Integrated Economic Account
5.2 The integrated economic account is the principal part of the central
framework and reveals the overall national economy by recording all transactions
between each institutional sector, all assets and liabilities, and all changes among
assets. It is comprised of the current account, accumulation account, national balance
sheet and external transaction account.

BANK OF KOREA ┃┃ 19
Ⅱ. Overview of National Accounts System
Table Ⅱ-5-2 Structure of Integrated Economic Account
CurrentAccount
Production account
Income account
• Primary distribution of income account
- Generation of primary income account
- Allocation of primary income account
• Secondary distribution of income account
• Redistribution of income-in-kind account
• Use of income account
AccumulationAccount
Capital account
Financial account
Other changesin asset account
• Other changes in volume of asset account
• Revaluation account
National Balance Sheet
Opening balance sheet
Changes in balance sheet account
Closing balance sheet
External Transaction Account
Current account
Accumulation account
Balance sheet
Productionaccount
Incomeaccount
Capitalaccount
Other changesin volume of
assets account
Financialaccount
Revaluationaccount
National Balance Sheet
National Balance Sheet
<Opening Stocks> <Transactions>
Net lenading/Net borrowing
Savings, etc
GDP
<Other Flow> <Closing Stocks>

20 ┃┃ 한국은행
Korean System of National Accounts
A. Current Account
5.3 The current account is divided into production and income accounts
which show the production of goods and services and the generation, distribution,
redistribution and disposal of income.
5.4 First, the production account records the results of production, such as gross
output, intermediate consumption and value added. By summing all the value added
by each institutional sector, gross domestic product can be calculated.
5.5 �e income account is divided into primary and secondary distribution of
income accounts and the use of income account. Moreover, the primary distribution
of income account can be divided into generation of income account and allocation
of primary income account. Consequently, the income account shows how income
is generated and allocated or redistributed and how much disposable income each
economic participant spends or saves.
B. Accumulation Account
5.6 The accumulation account records assets and liabilities as a result of
transactions or other activities within institutional sectors. It is composed of capital,
�nancial, and other changes in asset accounts.
5.7 The capital account records capital formation and net savings carried over
from the current account as the source of capital formation.
5.8 �e �nancial account records the transactions of �nancial products between
institutional sectors. Capital account net lending and the di�erence between �nancial
assets and �nancial liabilities in the �nancial transaction account should be equal in
theory, though it is very di�cult to make them equal in practice.
5.9 Other changes in asset account are divided into “other changes in the volume

BANK OF KOREA ┃┃ 21
Ⅱ. Overview of National Accounts System
of asset account” and the “revaluation account.” “Other changes in the volume of asset
account” is an account that records the changes of assets and liabilities caused by other
factors besides typical transactions; the “revaluation account” records the changes
caused by the changed price structure.
C. National Balance Sheet
5.10 �e national balance sheet consists of the opening balance sheet, changes in
balance sheet account and closing balance sheet; it records the assets and liabilities of
each institutional sector at the opening and closing accounting period. �e closing
balance sheet is derived by re�ecting the changes from the opening balance sheet.
D. External Transaction Account
5.11 The external transaction account records current transactions between
residents and non-residents and assets and liabilities related to each transaction. It is
composed of the current account, accumulation account and balance sheet, each of
which has the exact framework of domestic accounts.
Table Ⅱ-5-3 Basic Structure of Integrated Economic Account
[Current Account]
Production account
Uses Sources
Intermediate consumption Gross output
Value added
Generation of income account
Uses Sources
Compensation of employees Value added
Taxes on production and imports
Subsidies(-)
Operating surplus/mixed income
22 ┃┃ 한국은행
Korean System of National Accounts
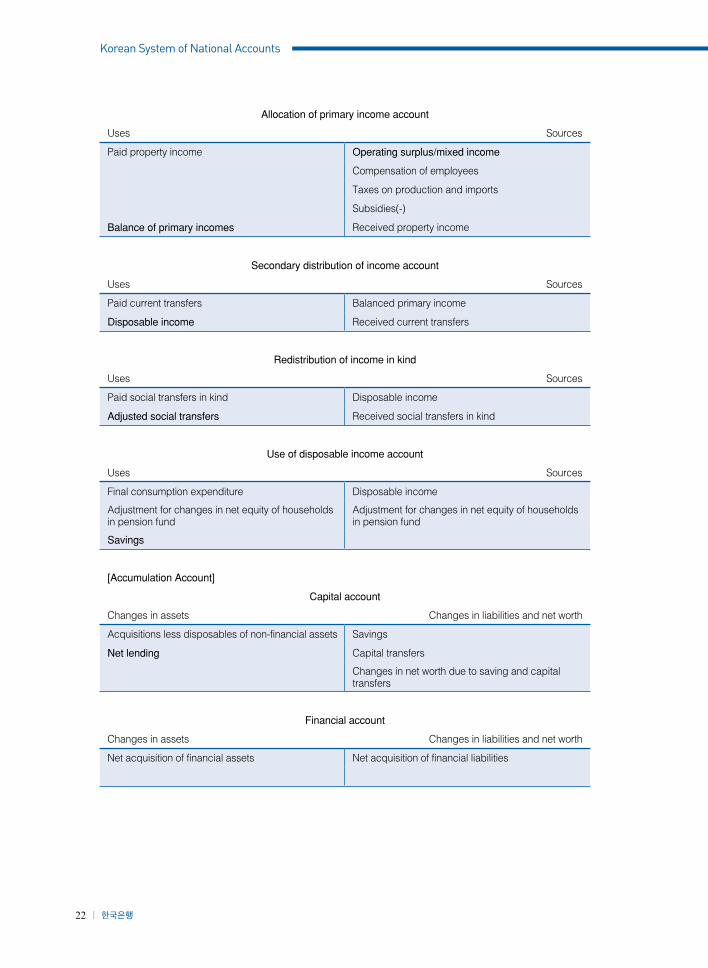
Allocation of primary income account
Uses Sources
Paid property income Operating surplus/mixed income
Compensation of employees
Taxes on production and imports
Subsidies(-)
Balance of primary incomes Received property income
Secondary distribution of income account
Uses Sources
Paid current transfers Balanced primary income
Disposable income Received current transfers
Redistribution of income in kind
Uses Sources
Paid social transfers in kind Disposable income
Adjusted social transfers Received social transfers in kind
Use of disposable income account
Uses Sources
Final consumption expenditure Disposable income
Adjustment for changes in net equity of households in pension fund
Adjustment for changes in net equity of households in pension fund
Savings
[Accumulation Account]
Capital account
Changes in assets Changes in liabilities and net worth
Acquisitions less disposables of non-financial assets Savings
Net lending Capital transfers
Changes in net worth due to saving and capital transfers
Financial account
Changes in assets Changes in liabilities and net worth
Net acquisition of financial assets Net acquisition of financial liabilities

BANK OF KOREA ┃┃ 23
Ⅱ. Overview of National Accounts System
Other changes in volume of asset account
Changes in assets Changes in liabilities and net worth
Non-financial assets Liabilities
Financial assets Changes in net worth due to other changes in volume of assets
Revaluation account
Changes in assets Changes in liabilities and net worth
Nominal holding gains and losses Nominal holding gains and losses
Changes in net worth due to nominal holding gains and losses
[National Balance Sheet]
Opening balance sheet
Assets Liabilities and net worth
Non-financial assets Liabilities
Financial assets Net worth
Changes in balance sheet account
Assets Liabilities and net worth
Changes in non-financial assets Changes in liabilities
Changes in financial assets Changes in net worth due to:
- Saving and capital transfers
- Other changes in volume of assets
- Nominal holding gains and losses
Closing balance sheet
Assets Liabilities and net worth
Non-financial assets Liabilities
Financial assets Net worth

24 ┃┃ 한국은행
Korean System of National Accounts
Chapter 6: Conceptual Elements of National Accounts
6.1 National accounts consist of consolidated tables which systematically record
in a designated method all transactions among many economic subjects in terms of
production, distribution and expenditures.
6.2 National accounts are intended to provide useful data for analyzing overall
national economic circulation for the purpose of policy development, research and
international comparison. All transactions occurring in a national economy should be
classi�ed and integrated to match one of the purposes prescribed above. Moreover, all
transactions should be de�ned and recorded in a consistent manner.
1. Classification of Economic Subject
A. Institutional Unit and Institutional Sector
6.3 Many economic subjects – e.g. retailers, housekeepers, enterprises, and
government agencies, just to name a few – play diverse roles in a national economy.
However, because it is impossible to compile national income statistics for each
subject, they are grouped according to similar purposes or functions. �e 2008 SNA
correspondingly defines institutional units and institutional sectors to facilitate
economic analysis.
6.4 An institutional unit is an economic entity capable in its own right of owning
assets, incurring liabilities and engaging in economic activities and transactions with
other entities. It takes largely one of two forms: as an individual entity or as a legal or
social entity, such as a corporation or government agency. Social entities also have
responsibilities or duties linked to their economic decisions, though they are limited.
In the national account system domestic institutional units are classified by five
sectors according to function, behavior and purpose. �e rest-of-the-world falls into a
separate non-resident sector.
BANK OF KOREA ┃┃ 25
Ⅱ. Overview of National Accounts System
B. Classification by Institutional Sector
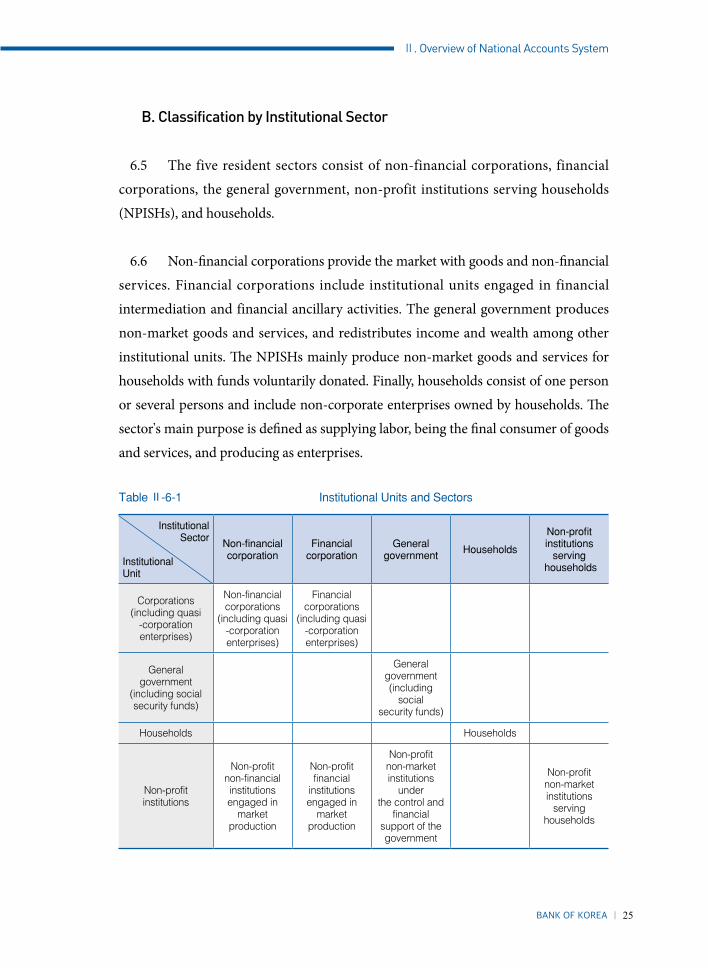
6.5 The five resident sectors consist of non-financial corporations, financial
corporations, the general government, non-profit institutions serving households
(NPISHs), and households.
6.6 Non-�nancial corporations provide the market with goods and non-�nancial
services. Financial corporations include institutional units engaged in financial
intermediation and financial ancillary activities. The general government produces
non-market goods and services, and redistributes income and wealth among other
institutional units. �e NPISHs mainly produce non-market goods and services for
households with funds voluntarily donated. Finally, households consist of one person
or several persons and include non-corporate enterprises owned by households. �e
sector’s main purpose is de�ned as supplying labor, being the �nal consumer of goods
and services, and producing as enterprises.
Table Ⅱ-6-1 Institutional Units and Sectors
InstitutionalSector
InstitutionalUnit
Non-financialcorporation
Financialcorporation
Generalgovernment Households
Non-profitinstitutions
serving households
Corporations(including quasi
-corporationenterprises)
Non-financialcorporations
(including quasi-corporationenterprises)
Financialcorporations
(including quasi-corporationenterprises)
Generalgovernment
(including socialsecurity funds)
Generalgovernment(including
socialsecurity funds)
Households Households
Non-profitinstitutions
Non-profitnon-financialinstitutionsengaged in
marketproduction
Non-profitfinancial
institutionsengaged in
marketproduction
Non-profitnon-marketinstitutions
underthe control and
financialsupport of thegovernment
Non-profitnon-marketinstitutions
servinghouseholds

26 ┃┃ 한국은행
Korean System of National Accounts
6.7 �e total economy consists of all the institutional units that reside within the
economic boundary of a nation. The economic boundary is primarily the nation’s
geographic boundary but is not limited to that. “Residency” is determined not just
by nationality or legal criterion but by economic activity over a designated period
(typically one year) within the same area. External transactions involve those between
residents and non-residents and are recorded in the rest-of-the-world account. �e
rest-of-the-world functions as a separate institutional sector.
Non-financial Corporations
6.8 Non-financial corporations are enterprises that produce goods and non-
financial services and are explicitly independent from their owners. Independence
means that income, expenditures, and assets and liabilities are controlled and
managed independently from the ownership. It includes all private and public
incorporated enterprises serving non-�nancial activities, unincorporated enterprises
or quasi-corporations that have complete accounting systems.
Financial Corporations
6.9 Financial corporations are corporations or quasi-corporations whose
main activity is financial intermediation or financial ancillary service. Financial
intermediation means the intermediation of cash shortage and surplus through a
financial market. Financial ancillary service is an assistance activity that is closely
related to and accelerates �nancial intermediation.
6.10 According to the 2008 SNA, financial corporations can be divided into
nine subsectors according to their activities in the market and the liquidity of their
liabilities. �ese are: the central bank; deposit-taking corporations except the central
bank; money market funds (MMF); Non-MMF investment funds; other financial
intermediaries except insurance corporations and pension funds; �nancial auxiliaries;
captive �nancial institutions and money lenders; insurance corporations; and pension
funds.

BANK OF KOREA ┃┃ 27
Ⅱ. Overview of National Accounts System
General Government
6.11 Government units are unique legal entities established by political processes
that have legislative, judicial or executive authority over other institutional units
within a given area. �eir main function is to provide those public and social services
which other units cannot supply sufficiently to the community and individual
households for free or at a low cost. As the purpose of their economic activity is not
for pro�t, they do not have operating surplus unlike other economic units. Moreover,
as their outputs are not sold in the market, their production costs are �nanced mainly
through tax revenue.
6.12 General government is divided into central government, local government
and social security funds, such as the National Pension Fund. Public non-profit
institutions like the Korea Development Institute (KDI), which is a research institute
serving the government, are also classi�ed within the general government sector.
Non-profit Institutions Serving Households (NPISHs)
6.13 NPISHs provide education, medical, religious and other social services
for free or at prices below economically signi�cant prices. Labor unions, consumer
groups or charity organizations funded by voluntary donations are all included here.
Non-pro�t institutions that have only one or no full-time employees are classi�ed as
households rather than as NPISH.
Households
6.14 A household is defined as a group of persons who share the same
accommodations and some or all of their income and wealth, and who consume
certain types of goods and services collectively (mainly housing and food). A
household is the main subject of consumption expenditure activities related to
production and disposal of goods and services. It can also be a producer of goods
and services for sale or transaction in the market by owning and controlling

28 ┃┃ 한국은행
Korean System of National Accounts
unincorporated enterprises. It sometimes produces goods and services for the
inhabitants’ own �nal use.
The Rest-of-the-World
6.15 The rest-of-the-world sector is composed of all institutions not residing in
the country who have transactions or interests with residents there. �us the external
transaction account cannot in itself be considered a complete accounting system
because it records only economic relationships between residents and non-residents.
In addition, embassies, foreign military forces and international organizations are
regarded as the rest-of-the-world, even though they are physically located in a
national territory not their own.
2. Principal Transaction Items
2.1 Production Account
A. Gross Output
6.16 Output (or control total) means the sum of goods and services produced
during a certain period, while �gures for goods and services re�ect the total sold in
the market. Output can be classi�ed into three categories: market output, non-market
output, and output for one’s own �nal use.
6.17 Market output is output that can be sold at economically signi�cant prices in
the market or output that is produced for commercial sale.
6.18 Non-market output is output supplied free or below economically signi�cant
prices by non-market producers like the government.
6.19 Output for one’s own �nal use also entails no signi�cant market transaction.

BANK OF KOREA ┃┃ 29
Ⅱ. Overview of National Accounts System
6.20 Output should be primarily valued on the basis of production time regardless
of whether it is involved in market transactions. In the event that market prices for
valuation do not exist, output is valued by the production or input costs.
6.21 As expenditure structure and the form of output differ according to
production units, the de�nition of output also di�ers. For instance, if an electronics
company in the manufacturing sector produces 10,000 TVs with a unit price of
500,000 Korean won, the company's output is 5 billion won. Whether or not the goods
produced are sold is not considered; all output produced is tallied up. If 5,000 TVs
among the 10,000 units subsequently sell and the remaining ones are warehoused,
the volume of output does not change. Similarly, a farming household producing 10
bags of rice priced at 160,000 won per bag produces output of 1.6 million won even if
family members consume all of the rice themselves.
6.22 As previously stated, with regard to goods with market prices for transactions,
it is easy to calculate output by making use of production volume and unit prices. But
the outputs of the wholesale and retail trade industry are difficult to quantify, and
�nancial intermediation services provided by the �nance sector require yet another
separate de�nition for output.
6.23 More speci�cally, in the wholesale and retail industry, output is measured as
the total value of the trade margins (wholesale and retail margins). �e trade margin
is de�ned as the di�erence between the actual or imputed price realized on a good
purchased for resale and the price that would have to be paid by the distributor to
replace the good at the time it is sold or disposed of.
6.24 In regard to the transport and storage industry, output is measured by the
value of the amounts receivable for transporting goods or persons and for storing
goods. In some sectors of the service industry, incomes such as fares and commissions
receivable for providing services are calculated as output. For instance, income from
lodging charges represents the output of hotels or inns; income from tuition fees
represents the output of educational institutions; and income from fares represents
the output of passenger transportation businesses such as buses and taxis.

30 ┃┃ 한국은행
Korean System of National Accounts
6.25 However, in the case of the financial and insurance sectors, the question
becomes how to value the charges from the sale of services. First, in the finance
industry, output is calculated by adding up �nancial intermediation services indirectly
measured (FISIM)6) to the sales charges receivable for actual services as a result of
remittance, money collection, and currency exchange or card businesses. �e output
of the insurance industry is measured by insurance premiums, i.e., imputed sales
are derived by deducting insurance claims payable and changes in reserves from
premiums receivable and the capital gains from invested reserves.
6.26 Meanwhile, services supplied by government and non-profit institutions
serving households (NPISHs) are not traded in the market, so it is di�cult to calculate
their value based on market prices. Accordingly, total input costs, which are measured
as intermediate consumption incurred in producing the services plus value added,
are regarded as their output. In respect to household services, the element input for
service production is primarily labor, so the total remuneration (compensation of
employees) payable by a corporation to its employees in return for work is regarded as
the output.
B. Intermediate Consumption
6.27 Intermediate consumption or intermediate input consists of the value of
goods and services consumed as inputs during the process of production. It includes
indirect costs for sales such as entertainment expenses, advertisement and publicity
costs as well as material costs.
6.28 Intermediate consumption and �nal consumption expenditures are classi�ed
according to whether the goods or services enter the process of production or are
consumed by households, which are the final consumption units. For example, in
the case of a bar of soap or towel, if the employer purchases it and workers use it at a
factory or o�ce, it is treated as intermediate consumption. However, if it is taken by
6) This means implicit profits stemming from financial intermediation services on deposits and loans, which is explained in Box Ⅲ-9-2 in Chapter 9.

BANK OF KOREA ┃┃ 31
Ⅱ. Overview of National Accounts System
workers for use at home, it is treated as a �nal consumption expenditure.
6.29 The distinction between intermediate consumption and gross fixed capital
formation depends on whether goods purchased by a producer are entirely used up
in the course of production during the accounting period or generate pro�ts a�er the
accounting period. In particular, when expenditures on maintenance and repairs are
undertaken with the objective of simply maintaining fixed assets in good working
order, they are regarded as intermediate consumption. However, when they are
undertaken with the objective of extending the service life of �xed assets or improving
productivity signi�cantly, they must be treated as gross �xed capital formation.
6.30 In the 2008 SNA, research and development is treated as gross capital
formation except where it is clear that the activity does not entail any economic
benefit for its owner, in which case it is treated as intermediate consumption.
Expenditures on military equipment, including large military weapons systems, are
treated as fixed capital formation. Expenditures on durable military goods such as
bombs, torpedoes and spare parts are recorded as inventory until use, after which
they are recorded as intermediate consumption.
C. Value Added
6.31 Value added refers to the value of goods and services newly created by
productive activity in any given period. It is obtained by deducting the value of
intermediate consumption from the value of output. Namely, if an electronics
company inputs 3 billion won in intermediate consumption, including costs for
purchasing semiconductors and LCD panels, and advertisement and publicity costs
associated with the sale of 10,000 TVs valued at 5 billion won, the value added created
by the company becomes 2 billion won.
6.32 Value added consists of compensation of employees, operating surplus,
consumption of fixed capital, taxes on production and imports, and subsidies
(a deduction). Among these, consumption of fixed capital is used as a financial

32 ┃┃ 한국은행
Korean System of National Accounts
source for capital accumulation, and the others are distributed as income for each
institutional unit.
6.33 Value added is classified as gross value added when consumption of fixed
capital is included and net value added when consumption of �xed capital is excluded.
2.2 Income Account
A. Compensation of Employees
6.34 Compensation of employees is defined as the total remuneration, in cash
or in kind, payable by an enterprise to an employee in return for work done by the
latter during the accounting period. Compensation of employees has two main
components: wages and salaries payable in cash or in kind; and social insurance
contributions payable by employers, including contributions to social security
schemes.
6.35 Payment in cash from employers equals total remuneration paid in the form
of cash and includes the tips that employees receive from customers.
6.36 Payment in kind describes goods and services provided to employees by
employers free or at discounted prices, and coverage is limited to those things that
employees can dispose of at their discretion according to their own needs and desires.
Goods and services needed at the workplace are excluded and listed as employer
intermediate consumption during production.
6.37 The employer’s payments toward retirement allowances are also treated as
compensation for employees.
B. Taxes and Subsidies on Production and Imports
6.38 Taxes and subsidies on production and imports are sub-divided into

BANK OF KOREA ┃┃ 33
Ⅱ. Overview of National Accounts System
those levied on goods or services produced and other taxes or subsidies levied on
production processes, such as taxes payable on the machinery, buildings or other
assets used for production. Other government taxes and subsides not related to the
production process are not included and should be treated as current transfers or
capital transfers.
C. Operating Surplus/Mixed Income
6.39 Operating surplus is the residual after deducting compensation for
employees, fixed capital consumption, net taxes and subsidies for production from
gross value added. It contains an enterprise's profit, net interest payment, and net
rent payment. The products produced by government or NPISHs are not assessed
at market prices but at production cost, so the corresponding value added of those
products does not include operating surplus.
6.40 The SNA adopts the term “mixed income” as a new substitute for the
operating surplus of unincorporated enterprises. �is re�ects the fact that the income
of an unincorporated enterprise owned by a household includes compensation of
employees and pure operating surplus. Namely, the owner of an unincorporated
enterprise simultaneously plays the roles of entrepreneur and laborer.
D. Income of Quasi-corporations
6.41 A quasi-corporation is an unincorporated enterprise that behaves like a
separate corporation in the aspects of financing and operation with a complete
income statement and balance sheet account.
6.42 �e owner of a quasi-corporation can withdraw some or all of the income of
the enterprise, and it is listed as property income in the income account in the same
manner as corporate dividends.

34 ┃┃ 한국은행
Korean System of National Accounts
E. Property Income
6.43 Property income is income received by the owner of financial assets and/
or natural resources in exchange for allowing another institutional unit to use such
assets in a production process. Property income is interest or dividends in the case of
�nancial assets and rent in the case of natural resources.
F. Current Transfer
6.44 Current transfer is an income transaction (in cash and in kind) incurred
without any rewards in return, and can be divided into voluntary transfer and
compulsory transfer.
6.45 Compulsory transfer involves legal requirements or enforcements, such as
current taxes, penalties, mandatory levies, etc. Voluntary transfer includes charitable
donations, o�erings to religious organizations, etc.
G. Final Consumption Expenditure
6.46 Final consumption expenditure is an expenditure on goods and services for
consumption subjects such as households, NPISHs and government.
6.47 Final consumption expenditures include the consumption of newly produced
goods and services in the designated period, but some transactions cannot be
included. Most notably, purchasing a house is not classified as final consumption
expenditure but rather �xed capital formation, because the SNA treats a house as an
object acquired for the service it provides not an object to be consumed. Moreover,
crops or services which homeowners produce for their own �nal use are included as
�nal consumption expenditures, even though they are not sold in the marketplace.
6.48 Final consumption expenditures by government and NPISHs, however, vary
slightly from those of households. Because government and NPISHs are subjects

BANK OF KOREA ┃┃ 35
Ⅱ. Overview of National Accounts System
linked to production as well as consumption, their purchases of goods and services
are regarded as intermediate consumption, not final consumption expenditures.
Consequently, the final consumption expenditure for government and NPISHs is
their own final use of goods and services produced by themselves. In other words,
they input much higher costs than sales revenue in order to supply public and social
services, and the di�erences between their actual input costs and sales revenues are
recorded as their �nal consumption expenditures.
H. Savings
6.49 Savings are the residuals after deducting current expenditures, e.g. current
transfers or �nal consumption expenditures, from current income. �ey are used as
funds for capital formation and connect income and capital accounts.
2.3 Capital and Financial Account
A. Gross Fixed Capital Formation
6.50 Producers sometimes purchase machinery or build factories to maintain
production ability or to enhance their competitiveness. These kinds of activities
are usually planned out based on a long-term perspective. Capital goods are goods
perennially used in the production process as mentioned above. The purchase of
capital goods is called gross �xed capital formation (GFCF) or gross �xed investment.
6.51 In other words, gross �xed capital formation is the net acquisition of �xed
assets during the accounting period. However, the purchase or disposal of non-
produced �xed assets such as land is not included as GFCF.
6.52 When purchased by households, the same type of fixed asset is treated as
a final consumption expenditure. For example, the purchase of a car for business
purposes is recorded as GFCF, while the purchase of a car by a household for leisure
activities is treated as a �nal consumption expenditure.

36 ┃┃ 한국은행
Korean System of National Accounts
6.53 According to the 2008 SNA, expenditure on weapon systems,7) and the
acquisition of intellectual property products including the results of research and
development (R&D), mineral exploration and evaluation, computer software and
entertainment, literary and artistic originals, are also regarded as GFCF.
B. Changes in Inventories
6.54 Inventories are classi�ed into materials and supplies, works-in-progress, and
�nished goods. Changes in inventories are measured by the value of the entries into
inventories less the value of withdrawals and less the value of any recurrent losses of
goods held in inventories during the accounting period. Changes in inventories are
similar to GFCF in terms of the sources of future earnings. But they are di�erent in
the aspect that GFCF generates earnings for many years, while the earnings generated
by changes in inventories are realized immediately.
6.55 �e production of high value capital goods such as ships, heavy machinery,
buildings and other structures like dams and roads may take several months or years
to complete. �e output in the middle of construction from such production is usually
measured on the construction basis and classified as GFCF during the accounting
period. On the other hand, dwellings under construction are recorded as work-in-
progress or �nished goods inventories until ownership is transferred to the �nal users.
C. Acquisitions Less Disposals of Valuables
6.56 Valuables are assets whose qualities do not degrade under ordinary
conditions. �ey are purchased as a store of value rather than for use in production
or consumption. Because the acquisition of valuables cannot easily be described as
GFCF or intermediate consumption, the 2008 SNA recommends listing them as a
7) The 2008 SNA recommends that military weapons systems comprising vehicles and other equipment such as warships, submarines, military aircraft, tanks, missile carriers and launchers, etc. be classified as fixed assets and that the classification of military weapons systems as fixed assets be based on the same criteria as for other fixed assets. Most single-use weapons, such as ammunition, missiles, rockets, bombs, etc., are treated as military inventories. However, some single-use items, such as certain types of ballistic missiles with a highly destructive capability, may provide an ongoing service of deterrence against aggressors and therefore meet the general criteria for classification as fixed assets.

BANK OF KOREA ┃┃ 37
Ⅱ. Overview of National Accounts System
sub-item of gross capital formation.
D. Consumption of Fixed Capital
6.57 Consumption of �xed capital is the decline in the current value of the stock
of fixed assets owned and used by a producer as a result of physical deterioration,
normal obsolescence or normal accidental damage during the accounting period.
6.58 Generally, institutional units using fixed assets in the production process
reserve a part of the value added to purchase replacements for worn-out �xed assets.
6.59 Consumption of fixed capital that shows quality decline in the economic
sense is not the same as depreciation listed on a financial statement to accelerate
investment or obtain a tax exemption.
E. Capital Transfers
6.60 Capital transfer is similar to current transfer in terms of being an outlay
without reward, but differs in the sense that capital transfer entails the disposal or
acquisition of assets.
6.61 Assisting with funding for investment or compensating for losses as the result
of a disaster are examples of capital transfers. In addition, dues on capital, such as
inheritance or gi� taxes, are also classi�ed as capital transfer.
F. Acquisition Less Disposals of Non-produced Non-financial Assets
6.62 Non-produced non-financial assets consist of natural resources, contracts,
leases and licenses, and goodwill and marketing assets, according to the SNA.
6.63 Natural resources include land, mineral and mineral resources, non-
cultivated biological resources, water resources, and other natural resources. Land

38 ┃┃ 한국은행
Korean System of National Accounts
consists of ground, including soil and any associated surface waters, over which
ownership rights are enforced and from which economic bene�ts can be derived by
their owners through holding or using such land.
6.64 Land transactions are treated as if they arise only between residents. The
purchase of land by non-residents is regarded in the same way as if a nominal resident
entity had bought the land. �e transaction is recorded as if the current resident gives
the land’s valued equity to the non-resident, who is the actual owner of the land.
Consequently, the purchase and sale of land do not appear within the measure of a
national economy, while the di�erence between the purchase and sale, namely the net
purchase, is recorded in the sectoral accounts.
6.65 �e price of land is assessed as the net land price with the ownership transfer
cost deducted since the transfer cost is treated as a produced service.
G. Financial Transactions
6.66 Financial transactions comprise a record of all transactions that entail
transfer of ownership, such as the acquisition and disposal of �nancial assets or the
issuance and repayment of liabilities.
2.4 External Transactions Account
A. Imports and Exports of Goods and Services
6.67 Some goods and services domestically produced are exported to the rest-of-
the-world. In addition, residents sometimes import goods and services produced in
foreign countries to satisfy domestic demand. Imports and exports comprise all goods
and services transactions in the external transaction account.
6.68 In addition, goods and services purchased by foreign tourists or embassy
personnel within the national territory are treated as exports and vice versa.

BANK OF KOREA ┃┃ 39
Ⅱ. Overview of National Accounts System
B. Net Factor Income from the Rest-of-the-World
6.69 Received factor income is income received in return for participating in
economic activities abroad. Net factor income is derived by deducting the factor
income paid to non-residents from the factor income residents received from
activities in foreign countries.
6.70 Net factor income consists of standard income – compensation of employees,
interest, dividends, etc. – obtained from economic activities with the rest-of-the-
world.
C. Net Current Transfer from the Rest-of-the-World
6.71 Net current transfer from the rest-of-the-world is income acquired in the
absence of economic activity, e.g. overseas remittance from relatives abroad or
�nancial aid from other countries.

40 ┃┃ 한국은행
Korean System of National Accounts
Chapter 7: Rules of Accounting and Valuation
7.1 All transactions tabulated as part of a national account should be designated,
assessed and recorded in a consistent manner in order to make equivalent the value of
income derived from production, distribution and expenditures.
1. Rules of Accounting
1.1 Time of Recording
7.2 Generally, transactions arise throughout the entire designated period and
the multi-step accounting process. Consequently, the time for recording and the
standard criteria for assessment must be prescribed to ensure systematic recording of
transactions.
7.3 According to the SNA, the time of recording of the acquisition of goods is
the moment when the economic ownership8) of those goods changes hands. When
change of ownership is not obvious, the moment of entering in the books of the
transaction partners may be a good indication and, failing that, the moment when
physical possession and control is acquired. �ese subsidiary rules apply in particular
to internal transactions or when a change of ownership occurs under a financial
lease or hire-purchase arrangement. Imports and exports of goods are recorded
when change of ownership occurs. In the absence of sources specifying the date on
which ownership changes, there is a strong presumption that the goods will cross the
frontiers of the countries concerned either shortly before or soon a�er the change of
ownership takes place. Trade statistics based on customs documents reflecting the
physical movement of goods across the national or customs frontier are therefore
o�en used to arrive at an approximation.
7.4 Services are recorded in the SNA when they are provided. Some services
8) Regarding the determination of the timing of recording of transactions in goods, services and financial assets, the principle of change of ownership is basically applied. Economic ownership takes account of where the risks and rewards of ownership lie. A change in ownership from an economic point of view means that all risks, rewards, rights and responsibilities of ownership are transferred. The 2008 SNA gives guidance to distinguish between legal ownership and economic ownership, and recommends that assets be recorded on the balance sheets of the economic rather than the legal owner.

BANK OF KOREA ┃┃ 41
Ⅱ. Overview of National Accounts System
are special in the sense that they are characteristically supplied on a continuous
basis. Examples are operating leasing, insurance and housing services (including
those of owner-occupied dwellings). These services are recorded as being provided
continuously over the entire period the contract lasts or the dwelling is available.
1.2 Rules of Accounting by Transaction Items
A. Gross Output
7.5 Gross output is recorded at the time of production. Since services cannot
exist in inventory form, the time of production is identical to the time the services are
provided. In the case of wholesale and retail trade, their output is recorded at the time
the goods are sold or ownership is transferred.
7.6 The SNA recommends assessing output at the basic price: the amount
receivable by the producer from the purchaser for a unit of a good or service produced
as output minus any tax payable and plus any subsidy receivable by the producer as a
consequence of its production or sale. Should the basic price be unobtainable, output
can be assessed at the producer's price.
• Basic Price = Producer’s Price - Taxes on products excluding invoiced VAT + Subsidies on products
7.7 In addition, products not for sale but used for one’s own �nal expenditure
should be assessed at the basic market price at which the same product would be
listed if sold commercially; a non-market product or product to which it is hard to
a�x a market price due to quality di�erences is assessed at production cost.

42 ┃┃ 한국은행
Korean System of National Accounts
B. Intermediate Consumption
7.8 Intermediate consumption should be assessed at the purchaser's price at the
point that goods or services are inputted to production. �e purchaser’s price is the
amount paid by the purchaser, excluding any VAT or similar tax deductible by the
purchaser, in order to deliver a unit of a good or service at the time and place required
by the purchaser. �e purchaser’s price of a good includes any transport charges paid
separately by the purchaser for delivery at the required time and place.
• Purchaser’s Price = Producer’s Price + VAT not deductible by the producer + trade and transport margin
C. Final Consumption Expenditure
7.9 Final consumption expenditure is recorded at the time of purchase regardless
of the delivery time for goods or services. In the case of an installment purchase or
credit transaction, the expenditure is recorded when the goods are delivered to the
purchaser because the purchaser, at that moment, assumes the actual rights and
responsibilities of ownership even if not the legal rights and responsibilities.
7.10 Household �nal consumption expenditures on goods or services are assessed
at the purchaser's price.
D. Gross Fixed Capital Formation
7.11 GFCF is recorded at the time of acquisition of ownership. However, in the
case of a contract of sales made in advance, the transfer of ownership may occur
in stages as value is put in place. In this case, interim payments are often used to
approximate the value of GFCF.
7.12 Fixed assets acquired through barter are valued at estimated purchaser

BANK OF KOREA ┃┃ 43
Ⅱ. Overview of National Accounts System
prices plus any costs of ownership transfer. In practice, neither taxes on products nor
transportation costs may apply, in which case purchaser prices will not differ from
the basic prices of products. Fixed assets produced for own gross fixed capital or
assets transferred in kind are valued at their estimated basic prices, or by their costs of
production when satisfactory estimates of their basic prices cannot be made.
E. Changes in Inventories
7.13 All increases in inventories are recorded when the goods are produced or
purchased, and decreases in inventories are recorded when the goods are disposed of
as intermediate consumption or other forms.
7.14 The inventories purchased from other economic subjects are assessed at
purchaser prices, while the inventories produced by the producers are assessed at
basic prices. In addition, work-in-progress should be assessed by multiplying the
estimated basic price of the �nished goods by the proportionate level of completion,
e.g. a 500,000 won TV that is 50% complete would have a recorded value of 250,000
won.
F. Exports and Imports of Goods and Services
7.15 Exports and imports of goods are recorded when the legal ownership is
transferred, as with standard domestic transactions. But in the case of goods imported
by �nancial lease, goods-for-export transferred to a subsidiary overseas, and goods
sent abroad for processing, it is assumed that ownership is transferred without change
in ownership. But in the case of goods purchased from non-residents and sold to non-
residents in the same accounting period outside the nation’s economic territory, the
transfer of ownership is not recorded.
7.16 Goods exported are assessed at the freight on board (FOB) price which
contains the price of goods and the transport delivery charges. Goods imported are
also assessed at the same price, but in general the import price is recorded at the cost,

44 ┃┃ 한국은행
Korean System of National Accounts
insurance and freight (CIF) price as determined by the importing country. �erefore,
the CIF price must be adjusted to the FOB price by deducting the transportation fare
and insurance fee.
7.17 Services exported and imported are assessed at the price agreed to between
trading partners. In the case of insurance services, the value is assessed at the service
fee included in the insurance premium.
G. Distributional Transaction
7.18 Distributional transaction is recorded when claims arise. Most distributional
transactions, such as compensation of employees, interest, rent, social contributions
and benefits, are recorded at the time when obligation payables arise. In the case
of tax, it is recorded when tax obligations arise. On the other hand, current tax on
income is recorded at the moment of payment.
2. Transaction Valuation Method
A. Market Prices and Factor Cost
7.19 Output is assessed at market prices in national accounts because a nation’s
level of welfare can be correctly measured by assessing the amount of transactions
conducted at market prices. �e �gures represent the marginal bene�t to consumers
and the marginal cost to producers. Also, the market price is easier to grasp than any
other price.
7.20 But in special cases, such as non-pecuniary or non-commercial transactions,
the following criteria apply:
• In the case of barter transactions, the basic price attached to the same
commodity being sold commercially is applied.

BANK OF KOREA ┃┃ 45
Ⅱ. Overview of National Accounts System
• Products for own final use can be assessed at basic price when the
commodity has a known market price. If there is no market price to apply,
the production cost can serve as a reasonable measure of value.
• Goods and services produced and provided to other production processes
as intermediate consumption or �xed asset formation in the same enterprise
are recorded as an output and assessed at the basic price of the production’s
establishment.
• Even illegal transactions, if voluntarily made, are assessed at the comparable
legal market prices.
7.21 For assessing national income, factor cost can be applied. Here, the factor cost
is the sum of all payments to the production factor, e.g. labor and capital. National
income at factor cost is calculated by deducting net taxes on production and imports
from the national income at market prices.
• National income at factor cost = National income at market price - Net taxes on production and imports
B. Current Prices and Chained Reference Year Prices
7.22 National income statistics are largely divided into two sets: the nominal
series assesses current-year prices and the real series assesses prices from a base year,
using chained reference-year prices. In the case of nominal national income, changes
in both volume and price during the object period are reflected in the statistics.
Accordingly, if commodity prices rise even without an increase in volume, the size of
nominal national income becomes greater to that extent. Consequently, real national
income is more suitable for measuring actual changes in the volume of goods and
services and related changes in the living standard of a nation since it removes the
e�ect of price changes.

46 ┃┃ 한국은행
Korean System of National Accounts
7.23 In measuring real national income, a fixed base-year price was generally
used before the 1990s. But real national income measured by a �xed base-year price
has a signi�cant disadvantage in that it does not adequately re�ect changes in relative
prices and production structure over time. For that reason, the SNA introduced the
chain-linking method,9) which uses a chain volume index for measuring real national
income, to better re�ect the economic reality.
9) For a detailed explanation of the Korean case, refer to Chapter 18.


BANK OF KOREA ┃┃ 49
Ⅲ. Method and Data Sources
Chapter 8: Introduction
1. Overview
8.1 Due to the complexity in terms of framework and concepts, national income
statistics can be estimated using various methods. In general, they can be measured
from three sides: production, income, and expenditures. Korea approaches national
income estimation primarily from the production side, given the available means
for compiling basic data. Korea also applies an expenditure approach independently
to estimate expenditure components, and an income approach to estimate income
account.
A. Production Approach
8.2 �e production approach is a method to estimate one economy's value added
from the production side. It is also called the net-output or value-added approach.
8.3 In this approach, the value of domestic gross production, namely gross
output, is measured first by industry or commodity, and the net value of domestic
gross production is calculated by deducting intermediate consumption, which is used
in the production process, from gross output. �is net value is the same as net output
or value added.
B. Expenditure Approach
8.4 The expenditure approach is divided into a demand approach and supply
approach as a means to estimate the expenditure component of GDP.
8.5 �e demand approach produces estimates based on expenditure data from
�nal consumers. Final consumption expenditures are generated by households and
government; capital formations by enterprises and government; and exports and
imports by the domestic and rest-of-the-world sectors. Data recorded in each provide

50 ┃┃ 한국은행
Korean System of National Accounts
the basis for the demand approach.
8.6 �e supply approach is based on supply data linked to �nal consumers. �is
approach includes the commodity-�ow method or research-on-retail-trade method.
The commodity-flow method estimates final demand by tracing the process of
commodity �ows from producers to �nal consumers.
8.7 While the best way to grasp final demand is to trace every transaction
involving every entity, that is not realistic in practice. Indirect methods, such as the
commodity-flow method are much more practical but lack accuracy. That is why
Korea uses a supplementary method that relies on the specific characteristics of
expenditure components.
C. Income Approach
8.8 The income approach estimates national income from the side of income
generation. It is usually used to estimate national income distribution. The income
approach is subdivided into the income-paid-out approach and income-received
approach, according to survey objectives.
8.9 �e income-paid-out approach inspects data from enterprises that have paid
out to cover production factor income. �is method tallies sample or census data that
lists the salaries, interest payments, and pro�ts of related enterprises.
8.10 Conversely, the income-received approach uses data collected from
employees and other income receivers.
2. Converting Nominal National Income into Real Value
8.11 In converting nominal value into real value, three methods are used
generally: the quantity-extrapolation method, the de�ation method, and the double-
de�ation method. �ey are applied separately or together depending on the situation
BANK OF KOREA ┃┃ 51
Ⅲ. Method and Data Sources
with basic data and estimation methods.
8.12 Firstly, the quantity-extrapolation method expands real value by using
quantity indexes. In this method, real values for the current year are obtained by
multiplying relevant quantity indexes or indicators by real values from the previous
year or reference year. �is method is used when technical structure and quality rarely
change.
8.13 Secondly, the deflation method divides nominal values by relevant price
indices, such as producer price index (PPI), consumer price index (CPI), export price
index (EPI) or import price index (IPI), depending on component characteristics.
8.14 Lastly, the double-de�ation method is commonly used to estimate real value
added by industry. In this method, real output and real intermediate consumption
are obtained by dividing nominal output and nominal intermediate consumption
by relevant price indices, respectively. Consequently, real value added is calculated
by deducting real intermediate consumption from real output. �is method’s merit
comes from the way it re�ects changes in technical structure and quality that appear
over time. Hence, it is useful for enhancing the accuracy of real value added in a
given year. However, this method cannot be applied to all industries due to basic data
constraints.
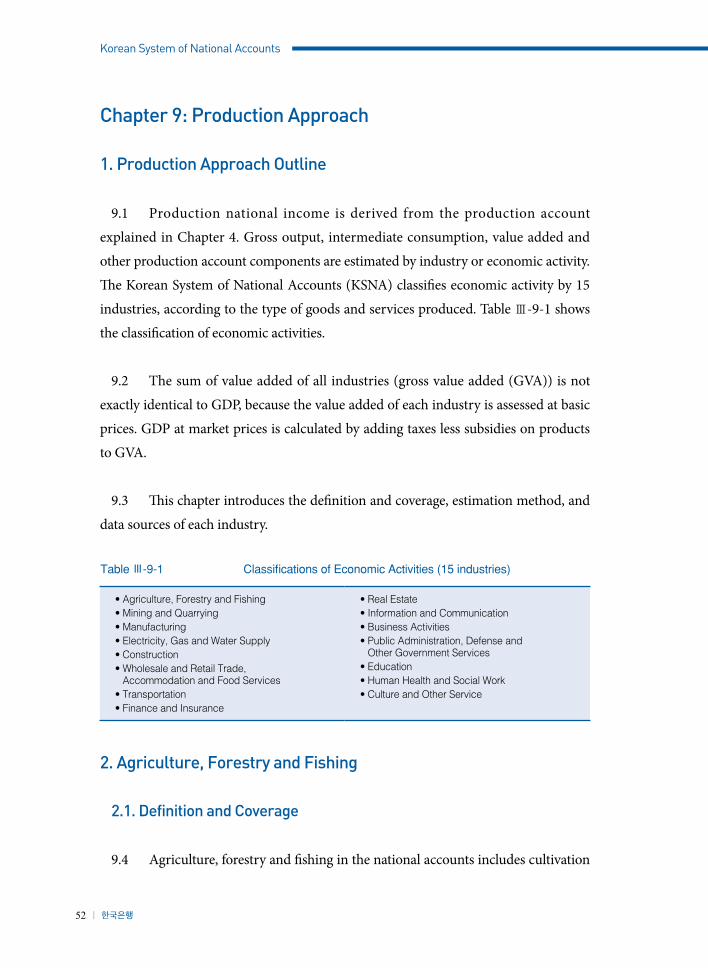
52 ┃┃ 한국은행
Korean System of National Accounts
Chapter 9: Production Approach
1. Production Approach Outline
9.1 Production national income is derived from the production account
explained in Chapter 4. Gross output, intermediate consumption, value added and
other production account components are estimated by industry or economic activity.
�e Korean System of National Accounts (KSNA) classi�es economic activity by 15
industries, according to the type of goods and services produced. Table Ⅲ-9-1 shows
the classi�cation of economic activities.
9.2 The sum of value added of all industries (gross value added (GVA)) is not
exactly identical to GDP, because the value added of each industry is assessed at basic
prices. GDP at market prices is calculated by adding taxes less subsidies on products
to GVA.
9.3 �is chapter introduces the de�nition and coverage, estimation method, and
data sources of each industry.
Table Ⅲ-9-1 Classifications of Economic Activities (15 industries)
• Agriculture, Forestry and Fishing• Mining and Quarrying • Manufacturing• Electricity, Gas and Water Supply• Construction• Wholesale and Retail Trade,
Accommodation and Food Services• Transportation• Finance and Insurance
• Real Estate• Information and Communication• Business Activities• Public Administration, Defense and
Other Government Services• Education• Human Health and Social Work• Culture and Other Service
2. Agriculture, Forestry and Fishing
2.1. Definition and Coverage
9.4 Agriculture, forestry and �shing in the national accounts includes cultivation

BANK OF KOREA ┃┃ 53
Ⅲ. Method and Data Sources
and livestock businesses, forestry, �shing and related services (see Table Ⅲ-9-2).
9.5 �e cultivation includes the following activities:
• The growing of various crop products, such as cereal grains (rice, barley,
corn), fruit, crops used for oils and fats, vegetables, �oricultural crops and
textile crops, etc.;
• The cultivation of trees other than those registered under the forestry
business;
• �e production of non-forest related saplings and seeds; and
• �e growing of mushrooms and bean sprouts.
9.6 �e livestock business includes the following activities:
• The expansion of the number of livestock by growth, multiplication and
breeding; and
• �e production of raw cow or sheep milk and eggs.
9.7 Forestry covers the following sub-divided activities:
• The production of saplings for timber-planting and the planting and
cultivating of trees in forests (forest management);
• The production of lumber and fuel materials through felling forest trees
(felling);
• The gathering of edible wild plants, mushrooms and seeds (gathering
forestry products); and
• �e gathering of green manure and compost; forest feed; and �rewood and
charcoal; and hunting activities(gathering forestry products)
9.8 Fishing industry includes:
• Marine �shing through which marine animals and plants from ocean and

54 ┃┃ 한국은행
Korean System of National Accounts
freshwater sources are captured and gathered; and
• Fish farming through which marine animals and plants are raised in arti�cial
environments.
Table Ⅲ-9-2 Coverage of Agriculture, Forestry and Fishing
Classification Coverage
Cultivation Grains, vegetables, fruits, horticultural products, seed crops and other crops
Livestock Dairy and beef cattle, pig breeding, poultry, other livestock
Forestry Forest management, felling, gathering forestry products
Fishing Ocean fishing, inland water fishing, ocean cultures, inland water cultures
2.2. Estimation Method in Reference Year
A. Cultivation
■ Output
9.9 Cultivation output in a given reference year is primarily estimated by using
survey data from the “Agricultural, Food and Rural Affairs Statistical Yearbook”
published by the Ministry of Agriculture, Food and Rural A�airs. Forestry Statistical
Yearbook and supplemental statistics for other products are also used.
■ Intermediate Consumption
9.10 Cultivation intermediate consumption for a given reference year is calculated
by deducting value added from output.
■ Value Added
9.11 Cultivation value added in a given reference year is calculated by using factor
income data such as labor costs and rent from income data of crops and livestock, and
input structure survey for Input-Output table of benchmark year.

BANK OF KOREA ┃┃ 55
Ⅲ. Method and Data Sources
B. Livestock Business
■ Output
9.12 �e method for estimating livestock business output in a given reference year
is to multiply production of each livestock by the unit price. Livestock production
is divided into the net increase in the number of livestock and the number of
slaughtered livestock. Total livestock business output is obtained by summing these
two parts using regional livestock prices and slaughter unit prices, respectively. �e
main sources of data for estimating livestock business output are the livestock survey
report from Statistics Korea, monthly slaughter statistics from the Animal and Plant
Quarantine Agency, and regional price statistics from the National Agricultural
Cooperative Federation.
■ Intermediate Consumption
9.13 Livestock business intermediate consumption in a given reference year is
calculated by deducting value added from output.
■ Value Added
9.14 Value added for the livestock business is similar to the cultivation; using
factor income data such as labor costs and rent from income data of crops and
livestock, and input structure survey for Input-Output table of benchmark year.
C. Forestry and Fishing
■ Output
9.15 Forestry business output is primarily estimated by using output data
contained in the Korea Forest Service’s Statistical Yearbook of Forestry, and the
Ministry of Agriculture, Food and Rural Affairs specialty crops production results.
56 ┃┃ 한국은행
Korean System of National Accounts
In particular, the yearbook includes net gross growing stock. �is net gross growing
stock is appropriated for entry under work in progress in the expenditure account.
Fishing business output is obtained by multiplying production quantity by unit
price. Data on production and price by species of �sh are based on data compiled by
Statistics Korea.
■ Intermediate Consumption
9.16 Forestry and Fishing business intermediate consumption is calculated by
deducting value added from output.
■ Value Added
9.17 Value added for forestry is estimated by using factor income data, such as
labor costs and rent from income data from forestry business entities, and by using
the input structure survey for the input-output table of the benchmark year.
�e �shing business’s value added is also estimated by using factor income data and
the input structure survey for the input-output table of the benchmark year.
2.3. Estimation Method for the Current Year
A. Nominal Value
9.18 �e methodologies for estimating output and value added in the current year
for agriculture, forestry and �shing businesses are the same as those used for reference
year output.
B. Real Value
9.19 �e estimation method for calculating real output in the agriculture, forestry
and �shing industries is to divide the nominal output by the unit price or price index
of each product.

BANK OF KOREA ┃┃ 57
Ⅲ. Method and Data Sources
Real intermediate consumption is estimated by the sum of each intermediate
consumption that is divided by its respective de�ator. Real value added is calculated
by deducting real intermediate consumption from real output, which is called the
double de�ation method.
2.4. Data Sources
9.20 �e data sources used to estimate the value added of agriculture, forestry and
�shing in reference and current years are nearly identical. Table Ⅲ-9-3 shows speci�c
data sources.
Table Ⅲ-9-3 Agriculture, Forestry and Fishing Data Sources
Reference Material Institution Responsible Major Contents
Agricultural, Food and Rural Affairs Statistics Yearbook
Ministry of Agriculture, Food and Rural Affairs Production quantity, production amount
Materials in fertilizer sales National Agricultural Cooperative Federation
Fertilizer sales price, fertilizer sales quantity
Fresh ginseng Korea Ginseng Corporation
Quantity of ginseng, amount of ginseng purchased, etc.
Specialty crops production results
Ministry of Agriculture, Food and Rural Affairs Production quantity
Floriculture crops production results
Ministry of Agriculture, Food and Rural Affairs Production quantity
Farm and Fishery Household Economy Survey Report Statistics Korea Value added component, intermediate
consumption data
Crop production statistics Statistics Korea Cultivation area, production quantity
Agricultural Chemicals Yearbook
Korea Crop Protection Association
Shipment quantity, amount of agricultural chemicals
National Agricultural Cooperative FederationMonthly Bulletin
National Agricultural Cooperative Federation
Farming household sales price indexFarming household purchase price indexRegional livestock prices
Livestock statistics Statistics Korea Net increase in number of livestock by age
Other livestock statistics, including duck eggs and honey
Statistics Korea Number of other livestock by species
Monthly slaughter statistics Animal and Plant Quarantine Agency Total number of slaughtered livestock
Milk production results Korea Dairy Committee Production quantity
General deer farm sales price, deer antler production quantity and price
Korea Deer Breeders Association
Average price; deer antler production quantity by kind of deer, sex and age

58 ┃┃ 한국은행
Korean System of National Accounts
Survey of production cost of livestock goods Statistics Korea Production expenses
Hunting production quantity Ministry of Environment Production quantity
Statistical Yearbook of Forestry Korea Forest Service Production quantity, Production price
Extent of afforestation Korea Forest Service Afforestation area, afforestation amount
Fishery production survey Statistics Korea Production quantity and production amount by industry, kind of fish
Balance sheets on services related to agriculture, forestry and fishing
National Agricultural Cooperative Federation; National Federation of Fisheries Cooperatives; Korea Agricultural & Rural Infrastructure Corporation
Compensation of employees, operating expenses, etc.
National Tax Statistics National Tax Service External turnover by industry
Producer Price Index Bank of Korea Price index by item
Consumer Price Index Statistics Korea Price index by item
3. Mining and Quarrying
3.1. Definition and Coverage
9.21 Mining and quarrying refer to the industrial activities of digging, extracting
and abstracting solid, liquid and gaseous naturally occurring minerals, both organic
and inorganic, from below the ground and from the surface of the earth. �e mining
and quarrying industry is sub-divided as follows:
• �e digging, agglomerating and disposing of coal (coal mining);
• �e extraction of crude petroleum and natural gas;
• The exploitation of such metal ore as iron and non-iron ore (metallic
mining); and
• The quarrying of stone, sand, gravel and other non-metal ores (mining of
non-metal ores).
A. Coal, Crude Petroleum and Natural Gas Mining
9.22 Coal mining is largely divided into the activity of digging, agglomerating and
BANK OF KOREA ┃┃ 59
Ⅲ. Method and Data Sources
disposing of such coals as anthracite coal, bituminous coal, brown coal and peat, and
the industrial activities of improving the quality of coal and spalling, pulverizing and
selecting coal for the purpose of commercial sales. Korean coal mining consists of:
• Anthracite coal mining; and
• Bituminous coal mining.
9.23 Crude petroleum and natural gas mining refer to the industrial activity
of extracting crude petroleum and natural gas. Korea started commercial crude
petroleum and natural gas production in July 2004 at an o�shore well in the Donghae
Gas Field in waters o� the southeast coast, near Ulsan.
B. Metal Ore Mining
9.24 Metal ore mining refers to the industrial activity of digging metallic ores
containing ferrous and non-ferrous metals like:
• Iron ores and copper ores; and
• Lead and zinc ores.
C. Non-Metallic Mineral Mining
9.25 Non-metallic minerals exclude coal, crude petroleum, natural gas, and
metallic ores. Korea’s non-metallic minerals are listed below:
• Sand and gravel;
• Rubble;
• Limestone;
• Minerals for raw materials for ceramics; and
• Raw salt.

60 ┃┃ 한국은행
Korean System of National Accounts
Table Ⅲ-9-4 Coverage of Mining and Quarrying
Classification Coverage
Coal, crude petroleum and natural gas mining Anthracite coal, bituminous coal, crude petroleum, natural gas
Metal Ore Mining Iron, copper, lead, zinc, and other non-ferrous ores
Non-Metallic Mineral Mining Sand, gravel, rubble, and other construction stone; limestone; raw materials for ceramics; raw salt; other non-metallic mineral mining
9.26 This classification is in accordance with the Korean Standard Industrial
Classi�cation (KSIC). Classi�cation of coal briquettes was changed from the mining
and quarrying to the manufacturing industry in the ninth revision of the KSIC in
February 2008. When raw materials are purchased, the pulverizing and grinding of
non-metallic minerals are also classi�ed as the manufacturing industry.
9.27 The collection, cleaning and supply of tap water or industrial water are
classi�ed as the water supply industry. Mining and ground-leveling are included in
the construction industry. Probing minerals and conducting geological surveys are
considered part of the business services industry when contracts are involved.
3.2. Estimation Method in the Reference Year
■ Output
9.28 Mining and quarrying output estimates in the reference year are calculated
by multiplying output by unit price per product. �e quantities and unit prices per
product are derived from the Mineral Commodities Supply & Demand Statistics
put out by the Korea Institute of Geoscience and Mineral Resources, from the Sand
and Gravel Supply & Demand Statistics by the Ministry of Land, Infrastructure and
Transport, and from the Economic Census by Statistics Korea.

BANK OF KOREA ┃┃ 61
Ⅲ. Method and Data Sources
■ Intermediate Consumption
9.29 Reference year estimates of intermediate consumption for the mining
and quarrying industry are calculated by multiplying output by the intermediate
consumption ratio derived from input-output tables.
■ Value Added
9.30 Reference year estimates of value added for the mining and quarrying
industry are obtained by deducting value added from output. Value added
components, such as compensation to employees, consumption of �xed capital, and
any operating surplus, are distributed based on the input-output tables and on data
about the capital stock of �xed assets.
3.3. Estimation Method in the Current Year
A. Nominal Value
■ Output
9.31 Output is drawn from the Mineral Commodities Supply & Demand, the
Sand and Gravel Supply & Demand Statistics and the Annual Report on Mining and
Manufacturing Survey.
■ Intermediate Consumption
9.32 Estimates of nominal intermediate consumption for the mining and
quarrying industry are obtained by deducting the nominal value added from nominal
output.

62 ┃┃ 한국은행
Korean System of National Accounts
■ Value Added
9.33 Nominal estimates of value added for this industry are calculated by
multiplying the nominal outputs by the nominal value added ratio. Nominal value
added ratio is obtained by applying the rates of change of the value added ratio to
the reference year ratio. The rates of change for the value added ratio are derived
from the Financial Statements Analysis and the Annual Report on the Mining and
Manufacturing Survey. And value added components such as compensation of
employees, consumption of fixed capital, and operating surplus are obtained using
input-output tables and the capital stock of �xed assets data.
B. Real Value
■ Output
9.34 Real output estimates for the mining and quarrying industry are obtained
by multiplying the reference year unit price by the annual output derived from the
Mineral Commodities Supply & Demand Statistics and the Sand and Gravel Supply &
Demand Statistics.
■ Intermediate Consumption
9.35 Real intermediate consumption estimates for the mining and quarrying
industry are obtained by deflating nominal intermediate consumption with the
intermediate consumption de�ators derived from PPIs and IPIs.
■ Value Added
9.36 Real value added estimates for this industry are obtained by using the
double de�ation method. In other words, real value added estimates are calculated by
deducting real intermediate consumption estimates from real output estimates.

BANK OF KOREA ┃┃ 63
Ⅲ. Method and Data Sources
3.4. Data Sources
9.37 Data sources used in the reference year and the current year are listed in
Table Ⅲ-9-5.
Table Ⅲ-9-5 Mining and Quarrying Data Sources
Reference Material Institution in Charge Major Contents
Economic Census,Annual Report on Mining and Manufacturing Survey
Statistics Korea Production amount by item, major production cost
Input-Output TablesSupply and Use Tables Bank of Korea Value added ratio of the reference
year
Mineral Commodities Supply & Demand Statistics
Korea Institute of Geoscience and Mineral Resources Production quantity by item
Producer Price Index Bank of Korea Output deflator, intermediate consumption deflator
Imports Price Index Bank of Korea Intermediate consumption deflator
Exports Price Index Bank of Korea Output deflator
Coal production quantity Korea Coal Corporation Anthracite coal production quantity
Sand and Gravel Supply & Demand Statistics
Ministry of Land, Infrastructure and Transport
Sand and gravel production quantity
Raw salt production quantity Korea Salt Manufacture Association Raw salt production quantity
4. Manufacturing
4.1. Definition and Coverage
9.38 Manufacturing is defined as industrial activity, primarily the physical or
chemical transformation of raw materials, substances, or components into new
products with di�erent characteristics. According to product type and characteristics,
manufacturing can be divided into 13 industries:
① food, beverages and tobacco; ② textiles and leather; ③ wood, paper, printing and
reproduction; ④ petroleum, coal products; ⑤ chemicals and chemical products; ⑥
non-metallic mineral products; ⑦ basic metal, products; ⑧ fabricated metal products;
⑨ Computer, electronic and optical products; ⑩ electrical equipment; ⑪ machinery

64 ┃┃ 한국은행
Korean System of National Accounts
and equipment; ⑫ transport equipment; ⑬ other manufacturing and repair services
of industrial equipment.
Table Ⅲ-9-6 Coverage of Manufacturing
Classification Coverage
Food, beverages and tobacco
Food
Meat and processed meat products, dairy, processed seafood products, canned or cured fruits and vegetables, polished rice, polished barley, flour and cereal preparations, sugar, baked goods, confectionery products, noodles, animal and marine fats and oils, processed edible refined oils, etc.
Beverages Alcoholic beverages, soft drinks; ice, etc.
Tobacco Dried leaf tobacco, various tobacco products, etc.
Textiles and leather
Textile and clothing products
Natural and chemical fiber yarn, thread and other fiber yarn, natural and chemical fiber fabrics, other fiber fabrics, knitted fabrics, fiber bleaching and dyeing, knitted apparel, textile apparel, other accessories, etc.
Leather products Leather, fur, bags and handbags, leather footwear, etc.
Wood, paper, printing and reproduction
Wood and wooden products
Lumber, plywood, reconstituted and pressed wood, wooden products for construction, wooden containers, etc.
Pulp and paperPulp; newsprint, printing paper, other raw paper and cardboard, corrugated paper and solid fiber boxes; paper containers, office paper, sanitary paper products, etc.
Printing and reproduction
Printing, publishing and reproduction of recorded media, etc.
Petroleum, coal products
Petroleum and coal products
Coal briquettes, naphtha, fuel oil, coal products, lubricants, etc.
Chemicals and chemical products
Basic chemicals Organic and inorganic basic chemicals, mineral pigments, dyes, etc.
Synthetic resins and synthetic rubbers Synthetic resins, synthetic rubber, etc.
Chemical fibers Regenerated fiber, synthetic fiber, etc.
Medicaments Medicaments
Fertilizer and pesticides
Nitrogen compounds, chemical fertilizer, agricultural chemicals, etc.
Other chemical products
Paints, ink, coating agents, cosmetics, detergents, polish, etc.
Plastic products Plastic primary products, industrial and household plastic products, etc.
Rubber products Tires, tubes, industrial rubber products, etc.

BANK OF KOREA ┃┃ 65
Ⅲ. Method and Data Sources
Non-metallic mineral products
Glass and glass products
Sheet glass and primary glass products, industrial glass products, etc.
Other non-metallic mineral products
Pottery products for home and industry, clay products for construction, cement, ready-mixed concrete, concrete products, lime, gypsum and plaster products, cut stone and stone products, asbestos and mineral wool products, abrasives, asphalt, etc.
Basic metal, products
Primary iron and steel products
Pig iron, steel ingots and semi-finished products, hot-rolled steel plates and sheets, cold-rolled steel plates and sheets, coated steel plates, steel pipe and tubes, iron and steel foundries, etc.
Non-ferrous metal ingots and primary Non-ferrous metal products
Copper ingots, aluminum ingots, zinc ingots, gold and silver ingots, other non-ferrous metal ingots, primary copper products, primary aluminum products, etc.
Metal foundries Steel and non-ferrous metal foundries
Fabricated metal products
Fabricated metal products
Metal products for construction and structure, metal tanks and reservoir equipment, fabricated wire products, metal cans, barrels and drums, hand tools; household metallic products, fastening metal products, screws, etc.
Computer, electronic and optical products
Semiconductors Discrete device, integrated circuits (IC), etc.
Electronic signal equipment Flat digital displays (LCD, OLED, etc.), etc.
Other electronic components
Electron tubes, electric resistors, electric condenser, magnetic coils, transformer amplifiers, printed circuit boards, etc.
Computer and peripheral equipment
Computers, peripheral equipment, etc.
Telecommunication, video, and audio equipment
wire communication equipment, wireless communication equipment, broadcasting equipment, TVs, electric household video and audio equipment, etc.
Precision instruments
Medical instruments, industrial automatic adjusting and regulating instruments, measuring and analytical instruments, cinematograph and optical instruments, watches and clocks, etc.
Electrical equipment Electrical equipment
Motors and generators, capacitors, rectifiers, and electric transmission and distribution equipment, batteries, electric wires and cables, refrigerators and freezers, washing machines, electric fans, heating and cooking equipment, household electric heat equipment, etc.
Machinery and equipment
General-purpose machinery and equipment
Engines and turbines, pumps and compressors, conveyers and conveying equipment, air-conditioning equipment and industrial refrigeration equipment, filtering or purifying machinery for liquid and gases, valves, bearings, boilers, etc.
Special-purpose machinery and equipment
Metal-cutting type machine tools, metal-forming machine tools, metal-working machinery such as molds and industrial patterns, agricultural machinery, construction and mining machinery, food processing machinery, textile machinery, etc.

66 ┃┃ 한국은행
Korean System of National Accounts
Transport equipment
Motor vehicles Motor vehicles, motor vehicles with special equipment, motor vehicle engines and parts, trailers and containers, etc.
Ships and boats Steel-bound ship, ship repairing, ship parts, etc.
Other transport equipment Rolling stock, aircraft, motorcycles, bicycles, etc.
Other manufacturing and repair services of industrial equipment
Other manufacturingWood furniture, metal furniture, toys and games, sporting and athletic goods, musical instruments, stationery, jewelry and plated ware, decorations, etc.
Manufacturing services and repair services of industrial equipment
Manufacturing services, maintenance and repair services of industrial machinery and equipment
9.39 According to the KSIC, an industry that directly processes base materials
produced by itself can be classi�ed as a manufacturing industry if it can be divided
and recognized as a separate business body. Otherwise, it is classified as part of
the agriculture, forestry and fishing industry, depending on what base material it
processes.
9.40 Other examples include the assembly of purchased machinery components
classified under the construction industry, including assembly of components for
bridges, water tanks, storage and warehouse facilities, rail lines and overpasses,
elevators and escalators, piping, sprinkler �re extinguishing systems, central heating
systems, ventilation and air conditioners, lighting, and electric wiring. In addition,
the assembly and installation of standardized products or structure components at
a construction site can be classified as part of the construction industry. When a
manufacturing, wholesale or retail business has been contracted to assemble or install
machinery and equipment as part of a sale, the work is classi�ed as manufacturing,
wholesale or retail trade industry, depending on the main activity.
4.2. Estimation Method in the Reference Year
■ Output
9.41 Output is drawn from the gross output listed in the Economic Census and
import/export �gures in Balance of Payments. Other products which are not included

BANK OF KOREA ┃┃ 67
Ⅲ. Method and Data Sources
in the Census are estimated by using output and price indices obtained from trade
associations.
■ Intermediate Consumption
9.42 Intermediate consumption is calculated in the reference year by using input-
output tables.
■ Value Added
9.43 Value added is obtained in the reference year by subtracting intermediate
consumption from output. Components of value added such as compensation of
employees, consumption of fixed capital, and operating surplus are obtained using
input-output tables and capital stock of �xed assets data.
4.3. Estimation Method in the Current Year
A. Nominal Value
■ Output
9.44 Output is attained by using the gross output listed in the Annual Report
on Mining and Manufacturing Survey and the import/export �gures in the Balance
of Payments. Small businesses with fewer than 10 employees are excluded from the
report, so their contribution is estimated by using the small businesses ratio applied in
the input-output tables. Other products that are not included in the Report on Mining
and Manufacturing Survey (slaughtered livestock, poultry products, polished rice,
cleaned barley, processed �sh and frozen �sh products, etc.) are estimated by using
output and price indices obtained from trade associations.

68 ┃┃ 한국은행
Korean System of National Accounts
■ Intermediate Consumption
9.45 Nominal intermediate consumption for the manufacturing industry is
calculated by subtracting the nominal value added from the value of nominal output.
Detailed nominal inputs by commodity are estimated by using reference intermediate
consumption and price indices, such as PPIs and IPIs.
■ Value Added
9.46 Value added is attained by multiplying nominal output by the nominal value
added ratio. Here, the nominal value added ratio is computed by applying year-on-
year rates of change in the value added ratio calculated using the Financial Statement
Analysis and the Annual Report on Mining and Manufacturing Survey.
9.47 Components of value added such as compensation of employees,
consumption of �xed capital, and operating surplus are obtained using input-output
tables and capital stock of �xed assets data.
Nominal Value Added Ratio Calculation Method
The nominal value added ratio is calculated by multiplying the value added ratio in the same period of the previous year by the rates of change in the value added ratio. The rates of change in the value added ratio are calculated by using the Financial Statement Analysis and the Annual Report on Mining and Manufacturing Survey.
• Nominal value added= Nominal output × Nominal value added ratio= Compensation of employees + Consumption of fixed capital + Operating surplus
+ Net taxes on production (taxes on production - subsidies on production)
• Value added ratio = Value added ÷ Output
Box Ⅲ-9-1

BANK OF KOREA ┃┃ 69
Ⅲ. Method and Data Sources
• Nominal value added ratio = The value added ratio in the same period of the previous year × [Value added
ratio provided by the Financial Statement Analysis of the relevant quarter ÷ Value added ratio provided by the Financial Statement Analysis of the same period of the previous year]
The value added ratio provided by the Financial Statement Analysis is calculated by analyzing compensation of employees, consumption of fixed capital, operating surplus and output from major balance sheet items, and income and cost statements from the Financial Statement Analysis.
• Value added in the Financial Statement Analysis*= Operating surplus + Employment costs + Interest expenses + Tax and dues +
Depreciation amortization
* To coincide with the concept of value added in the national accounts, operating profits and write-offs of bad loans should be used instead of current profits to indicate operating surplus among value added in the Financial Statement Analysis.
As a reference, value added in the Annual Report on Mining and Manufacturing Survey is calculated by deducting major production costs, including raw material costs, from the production amount. Accordingly, to convert it into value added under the national accounts standard, indirect production costs, including costs for advertising and publicity, should also be deducted.
• Value added in the Annual Report on Mining and Manufacturing Survey**= Production amount - Major production costs (raw material costs, fuel costs,
electricity charges, water expenses, outside order and processing costs, repair and maintenance costs)
** To coincide with the concept of value added in the national accounts, indirect production costs, such as payments in kind, freight charges, premiums, advertisement and publicity costs, traveling expenses, transportation costs, communication costs, costs for supplies, and rents should be considered part of each establishment’s production costs and excluded along with major production costs.

70 ┃┃ 한국은행
Korean System of National Accounts
B. Real Value
■ Output
9.48 �e procedure for estimating real output consists of three stages. In the �rst
stage, nominal estimates for output are divided into two parts: external (exports) and
domestic demand (output minus exports). In the second stage, nominal exports and
domestic demand are de�ated using the export de�ator and PPIs, respectively. In the
�nal stage, output is obtained by adding up exports and domestic demand.
■ Intermediate Consumption
9.49 Real intermediate consumption is estimated by deflating nominal
intermediate consumption by the intermediate consumption de�ator using PPIs and
import de�ators.
■ Value Added
9.50 Real value added is obtained using the double deflation method: i.e.
deducting real intermediate consumption from real output.
4.4. Data Sources
9.51 Data sources for estimates are as follows.
Table Ⅲ-9-7 Manufacturing Data Sources
Reference Material Institution in Charge Major Contents
Economic Census,Annual Report on Mining and Manufacturing Survey
Statistics Korea Production amount by item, major production cost
Balance of Payments Bank of Korea Export and import figures; export, import and output deflators.
Financial Statement Analysis Bank of Korea Value added ratio

BANK OF KOREA ┃┃ 71
Ⅲ. Method and Data Sources
Input-Output TablesSupply and Use Tables Bank of Korea Output of the reference year, value
added ratio
Producer Price Index Bank of Korea Output deflator, intermediate consumption deflator
Statistical Yearbook of National Tax National Tax Service Production tax, subsidies
Local Government Tax Yearbook Ministry of the Interior and Safety Production tax, subsidies
Polished rice production quantity
Ministry of Agriculture, Food and Rural Affairs
Production quantity of polished rice and polished barley
4.5. Special Classifications for Manufacturing
A. Information and Communication Industry Classifications
9.52 To report on its information and communication industry, Korea uses the
same classi�cation the OECD Science and Technology Committee uses to de�ne the
“information and communication technology industry.” Coverage of the information
and communication industry is as follows.
Table Ⅲ-9-8 Coverage of Information and Communication Industry Coverage
Classification Coverage
Information and communication manufacturing
semiconductor devices, integrated circuits (IC), flat digital display (LCD, OLED, etc.), electron tubes, electric resistors, electric condenser, magnetic coils, transformer amplifiers, printed circuit boards, computer and peripheral parts, wire communication equipment, wireless communication equipment, broadcasting equipment, TVs, electric household audio equipment, etc.
Information and communication service
Software development and supply, broadcasting, wire and wireless broadcasting; computer-related service, information service, etc.
B. Classification by Industrial Type
9.53 The manufacturing sector can also be classified according to the type of
goods produced: i.e. primary materials, processing assembly, and living and other
types. Primary materials refer to industries producing materials and parts, including
metals and chemicals chie�y used as intermediate materials in the production process
of the manufacturing industry. Processing assembly refers to the capital goods or

72 ┃┃ 한국은행
Korean System of National Accounts
machinery industry in a broad sense, indicating a technology-intensive, energy-
saving, high-tech industry. Living and other type industry means those producing
economic materials directly related to consumption or goods in the �nal stage of all
industrial production processes.
Table Ⅲ-9-9 Classification of Manufacturing by Industrial Type
Classification Coverage
Primary materialsFiber yarn and fabrics; wood and wooden products; pulp and paper; petroleum, coal and chemicals; non-metallic mineral products, excluding petroleum and coal; metals, fabricated metal products
Processing assembly Machinery equipment, electrical and electronic equipment
Living and other type Food, beverages and tobacco; clothing and textile products; leather products; printing and reproduction; furniture and other manufacturing industries
5. Electricity, Gas and Water Supply
5.1. Definition and Coverage
9.54 The electricity, gas and water supply industries are further classified into
electricity, gas, steam & air conditioning supply, water supply, sewage & waste
management, and remediation service industries (see Table Ⅲ-9-10).
9.55 �e electricity supply industry refers to the production of electric energy by
thermal, nuclear, hydroelectric, wind, solar, tidal or other power-generation facilities
to supply electricity to residential buildings, industries and to commercial facilities,
and the transmission and sale of electricity.
9.56 Looking at the distribution channel of electric power shown in Chart Ⅲ-9-
1, electric power is mostly supplied by KEPCO, with a limited amount of direct sales
from other companies. KEPCO sells electric power in one of two ways: either through
the Korea Power Exchange (KPX), purchasing from one of six KEPCO subsidiaries
that generate power and then selling it to the public, or by purchasing electric power
from other self-generating companies and then selling it to the public.

BANK OF KOREA ┃┃ 73
Ⅲ. Method and Data Sources
Chart Ⅲ-9-1 Distribution Channel of Electric Power
Electric power generating companies
Korea Power Exchange
(KPX)
KEPCO Consumer
Electric power generating companies
< PPA *>
Direct-sale private company Consumer
* Power Purchase Agreement (PPA) refers to contracted electric power purchases between privatized power generation businesses and KEPCO.
9.57 �e gas, steam and air conditioning supply industry refer to the manufacture
of gas such as coal gas, water gas, producer gas or direct fuel gas supply through a
pipeline, and heat, steam, hot and chilled water, and cool air distribution through
pipeline for cooling, heating, power supply, or other activities.
9.58 This industry excludes the manufacture of compressed or liquefied gas
(manufacturing), automobile gas stations (wholesale and retail), gas stations supplying
gas to retailers (wholesale), and gas pipeline operations (transport), and includes
distribution of phreatic water through a pipeline.
9.59 The water supply, sewage & waste management, and remediation service
industries refer to the activities of intake, collection, purification and distribution
of water to supply living, industrial and commercial water to users, the operation of
sewage, wastewater treatment facilities and collection, transportation, storage, and
treatment of human and animal waste, and the activities of collection, transmission,
and management of industrial and household waste, materials recovery, and
remediation.
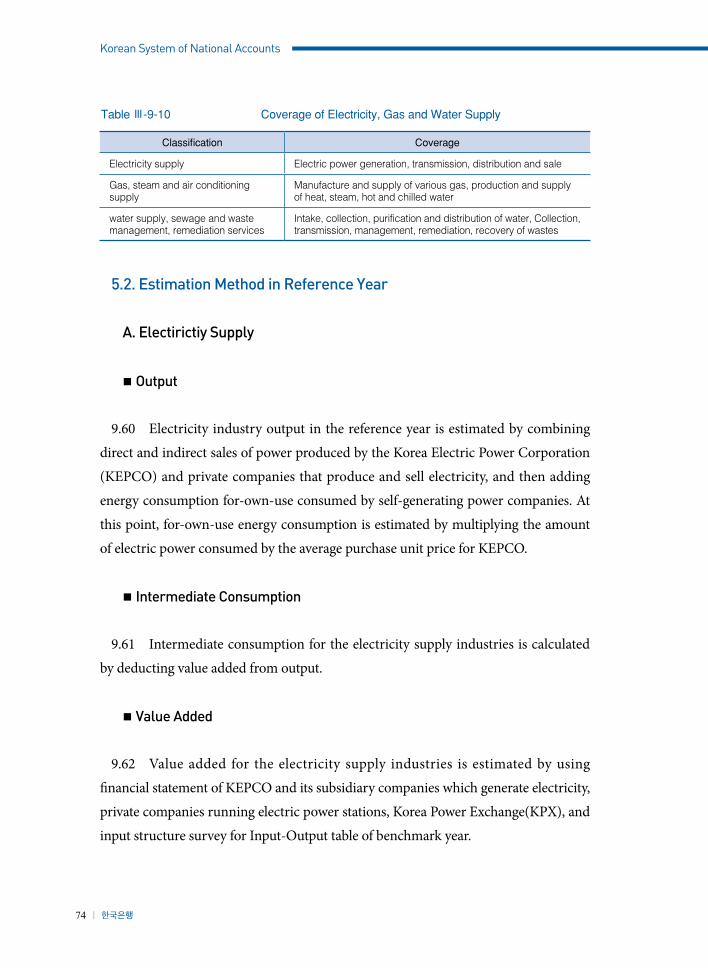
74 ┃┃ 한국은행
Korean System of National Accounts
Table Ⅲ-9-10 Coverage of Electricity, Gas and Water Supply
Classification Coverage
Electricity supply Electric power generation, transmission, distribution and sale
Gas, steam and air conditioning supply
Manufacture and supply of various gas, production and supply of heat, steam, hot and chilled water
water supply, sewage and waste management, remediation services
Intake, collection, purification and distribution of water, Collection, transmission, management, remediation, recovery of wastes
5.2. Estimation Method in Reference Year
A. Electirictiy Supply
■ Output
9.60 Electricity industry output in the reference year is estimated by combining
direct and indirect sales of power produced by the Korea Electric Power Corporation
(KEPCO) and private companies that produce and sell electricity, and then adding
energy consumption for-own-use consumed by self-generating power companies. At
this point, for-own-use energy consumption is estimated by multiplying the amount
of electric power consumed by the average purchase unit price for KEPCO.
■ Intermediate Consumption
9.61 Intermediate consumption for the electricity supply industries is calculated
by deducting value added from output.
■ Value Added
9.62 Value added for the electricity supply industries is estimated by using
�nancial statement of KEPCO and its subsidiary companies which generate electricity,
private companies running electric power stations, Korea Power Exchange(KPX), and
input structure survey for Input-Output table of benchmark year.
BANK OF KOREA ┃┃ 75
Ⅲ. Method and Data Sources
B. Gas, steam and air conditioning supply
■ Output
9.63 Gas supply industry output consists of LNG and LPG sales. It is estimated by
using data, such as Korea Gas Corporation (KOGAS) sales, and the margin of LNG
sales and LPG sales by city gas companies. Transactions between KOGAS and city gas
companies are deducted to prevent double counting of output because the amount of
gas is identical and stays within the same industry.
9.64 Steam & air conditioning supply output is calculated by combining the steam
and hot water sales of integrated energy providers, categorized by the integrated
energy providers handbook.
■ Intermediate Consumption
9.65 Intermediate consumption for the Gas, steam and air conditioning supply
industries is calculated by deducting value added from output.
■ Value Added
9.66 Value added for the gas, steam & air conditioning supply industry is
estimated by using financial statements from KOGAS and city gas companies,
economic census data, and responses from the input structure survey for the input-
output table of the benchmark year.
C. Water supply, sewage and waste management, remediation services
■ Output
9.67 Water supply industry output in the water supply, sewage and waste
management, remediation services industry is calculated by combining the water

76 ┃┃ 한국은행
Korean System of National Accounts
sales of the Korea Water Resources Corporation (K-water) with those of provincial
public corporations. , sewage and waste management, remediation services industry
output is estimated by using the Service Industry Survey done by Statistics Korea. In
the case of material recovery industry, output is estimated by deducting purchases of
direct material from sales.
■ Intermediate Consumption
9.68 Intermediate consumption for the water supply, sewage and waste
management, remediation services industries is calculated by deducting value added
from output.
■ Value Added
9.69 Value added for the water supply, sewage & waste management, and
remediation service industries generated by the government is estimated using a
cost approach method, compiling each factor income component. The private part
is estimated by using value added components from the economic census and input
structure survey for the input-output table of the benchmark year.
5.3. Estimation Method in Current Year
A. Nominal Value
9.70 Current-year nominal output and value added for the electricity, gas,
and water supply industries is compiled in the same manner as the reference-year
estimation method, but using annual services industry survey and current year input
structure instead of economic census and input structure survey of benchmark year.

BANK OF KOREA ┃┃ 77
Ⅲ. Method and Data Sources
B. Real Value
■ Output
9.71 Current-year real output for the electricity, gas, and water supply industries
is calculated by applying the rate of change in the sales amount to the previous year's
output or de�ating nominal value by the relevant de�ator such as PPI or CPI.
■ Intermediate Consumption
9.72 �e real value of intermediate consumption for the electricity, gas, and water
supply industries is calculated by de�ating nominal intermediate consumption with
the PPI or CPI, etc. Moreover, the real value can be derived by using the compounded
rate of change in quantity for each input item, or by applying the intermediate
consumption ratio of the previous year.
■ Value Added
9.73 Current-year real value added for the electricity, gas, and water supply
industries is calculated by using the double deflation method. That is to say, it is
calculated by deducting real intermediate consumption from real output.
5.4. Data Sources
9.74 Annual estimates concerning the electricity, gas, and water supply industries
are drawn from the relevant companies’ balance sheet statistics that re�ect their cost
structures. In the case of water supply by provincial public corporations, data from
the Ministry of Public Administration and Security is applied. Sewage and waste
management, remediation services are based on the Service Industry Survey and the
Wholesale and Retail Trade Survey conducted by Statistics Korea.

78 ┃┃ 한국은행
Korean System of National Accounts
9.75 Reference and current year estimations for the electricity, gas, and water
supply industries use the data sources listed in Table Ⅲ-9-11.
Table Ⅲ-9-11 Data Sources of Electricity, Gas, and Water Supply
Classification Reference Material Institution Responsible
Electricity supply
Financial statement Korea Electric Power Corporation,Korea Power Exchange, etc.
Electric power transaction Statement Korea Power Exchange
Electricity purchase statement Korea Electric Power Corporation
Monthly report on majorelectric power statistics Korea Electric Power Corporation
Unit value of import of nuclearFuel Korea Hydro and Nuclear Power
Direct-sale results Hanju, Yeochun NCC, Daegu Dyeing Industrial Center
Commercial self-power generation results Korea Power Exchange
Gas, steam and air conditioning supply
Financial statement Korea Gas Corporation
Gas sales results City gas companies,Korea Gas Corporation
Heat supply results Integrated energy providers
Integrated energy business materials Korea Energy Agency
Water supply, sewage and waste anagement, remediation services
Water supply profit results Provincial government offices, Korea Water Resources Corporation
Financial statement Korea Water Resources Corporation,Ministry of the Interior
Service Industry Survey, Wholesale and Retail Trade Survey Statistics Korea
National Tax Statistics National Tax Services
6. Construction
6.1. Definition and Coverage
9.76 �e construction industry refers to industrial activities, carried out by general
or professional builders on their own account or on a contract basis. Such activities
include:

BANK OF KOREA ┃┃ 79
Ⅲ. Method and Data Sources
• The erecting or installing of various buildings (including temporary
buildings and prefabricated buildings) and structures on construction sites;
• �e enlarging, rebuilding, remodeling, repairing or dismantling of buildings
and structures on construction sites; and
• �e blasting, digging and ground-leveling required to develop construction
sites, etc.
9.77 Construction is mainly divided into building construction, heavy and civil
engineering and specialized construction.
9.78 Building construction is sub-divided into two categories:
• Residential building construction; and
• Non-residential building construction;
9.79 Heavy and civil engineering is sub-divided into two categories:
• Roads and railways construction; and
• Other civil engineering projects construction;
9.80 Specialized construction is sub-divided into �ve categories:
• Site preparation;
• Architecture related specialized construction;
• Building completion and �nishing;
• Electrical and communication works; and
• Other specialized construction;
9.81 Construction is also divided into private and government construction
depending on the entity placing the order.

80 ┃┃ 한국은행
Korean System of National Accounts
A. Building Construction
Residential Buildings
9.82 Residential buildings are divided into detached home construction and
common home construction:
• Detached home construction includes single-family homes, multi-household
homes, and o�cial residences.
• Common home construction includes apartment houses, row houses,
multiplex houses, and dormitories.
9.83 Construction of residential buildings includes not only new construction,
enlargement, remodeling and rebuilding but also large-scale repairs10) that are related
to capital expenditure.
Non-residential Buildings
9.84 Construction of non-residential buildings includes new construction,
enlargement, remodeling, rebuilding and large-scale repairs that are related to capital
expenditure. Non-residential buildings are classified into those for industrial use,
commercial use, educational and social use, public use, agricultural and �sheries use,
and others. Speci�cally:
• Industrial building construction includes factories and sites for
manufacturing, processing and repairing.
• Commercial building construction includes neighborhood facilities, retail
facilities, lodging facilities, leisure facilities, facilities for storage and the
10) This refers to expenditures for construction to extend service lives or to increase property values.

BANK OF KOREA ┃┃ 81
Ⅲ. Method and Data Sources
treatment of dangerous materials, automobile-related facilities, and general
business facilities.
• Educational and social building construction includes cultural and assembly
facilities (e.g. performance halls, viewing places, assembly places, etc.),
medical treatment facilities, education and research facilities (e.g. schools,
vocational training institutes, educational institutes, research institutes,
etc.), religious facilities, training institutions, cemetery-related facilities,
sightseeing and resting facilities (e.g. outdoor concert halls, freeway rest
stops, parks, amusement parks, etc.).
• Public building construction includes public business facilities, military
facilities, and broadcasting and communication facilities, etc.
• Agriculture and fishery building construction includes animal and plant-
related facilities (e.g. animal pens, greenhouses, slaughterhouses, etc.), etc.
“Others” includes warehousing facilities (e.g. cargo handling places, etc.), etc.
B. Heavy and Civil Engineering
Roads and Railways Construction
9.85 Roads and railways construction is classi�ed into road, railroad. �e detailed
classi�cation is as follows:
• Road facilities construction includes new construction, and repairs and
renovation and pavement work for roads, bridges, tunnels, crossroads, land
bridges, elevated roads, and air�elds and runways.
• Railroad facilities construction includes new construction, and repairs and
renovations of railroads, bridges, tunnels and subways. However, railroad

82 ┃┃ 한국은행
Korean System of National Accounts
and subway station buildings are included in non-residential building
construction.
Other Civil Engineering Projects Construction
9.86 Other civil engineering projects construction includes harbor facilities,
erosion control and river work, water supply and sewage facilities construction, city
civil engineering, and agriculture and �shery engineering. Speci�cally:
Harbor facilities construction includes new construction, and repairs and
renovations of route facilities such as breakwaters, and piers and lighthouses as
well as port dredging work.
• Erosion control and river work includes the repair and reclamation of rivers,
erosion control work, new construction, repairs and reconstruction of multi-
purpose dams, bank construction, and disaster rehabilitation work.
• Environmental puri�cation facilities construction includes terminal disposal
sewage plants, wastewater treatment plants, incineration plants, atmosphere
environmental measurement facilities, and puri�cation facilities, etc.
• Industrial plants construction includes industrial manufacturing facilities
and plants construction, and installation of oil and gas pipelines.
C. Specialized Construction
Site Preparation
9.87 Site preparation includes agriculture and fishery engineering and city civil
engineering. Speci�cally:
• Agriculture and �shery engineering includes farmland development work,

BANK OF KOREA ┃┃ 83
Ⅲ. Method and Data Sources
irrigation facilities construction, cultivation and reclamation, disaster
rehabilitation work, �shing port and �sh farming facilities construction, and
the construction of farm roads.
• City civil engineering includes land development and land adjustment for
roads, housing lots and factory sites, and new construction, repairs and
renovations of parks and stadiums.
Architecture Related Specialized Construction
9.88 Architecture related specialized construction includes water supply and
sewage facilities. Speci�cally:
• Water supply and sewage facilities construction includes new construction,
repairs and reconstruction of water supply, sewage facilities, etc.
Building Completion and Finishing
9.89 Building completion and �nishing includes building repairs. Speci�cally:
• Building repairs refer to expenditures for general maintenance and repair11)
of residential buildings, non-residential buildings, and structures, including
outsourced repairs and self-completed repairs. Heating, water, waterproo�ng,
painting, and electrical work conducted for existing buildings and structures
are included in construction repairs when the expenditure is made for pro�t
or for current maintenance. However, such capital expenditures as large-
scale repairs that extend service lives or increase property values are not
dealt with under construction repairs but are rather included under building
construction in the relevant sector.
11) This refers to upkeep and repair activities carried out regularly to ensure proper use and good condition for the duration of the service life period.

84 ┃┃ 한국은행
Korean System of National Accounts
Electrical and Communication Works
9.90 Electrical and communication works includes power plant facilities and
communication facilities. Speci�cally:
• Power plant facilities construction includes installation of facilities for power
generation, transmission and distribution. However, the costs of purchasing
equipment like power generators are excluded from the output.
• Communication facilities construction includes installation of
communication equipment and cables, line work, and electricity source
work.
Other Special Civil Engineering
9.91 Other special civil engineering encompasses construction for supply to the
military as well as national defense civil engineering, engineering for cemetery-related
facilities, and civil engineering work not included in other sectors.
Table Ⅲ-9-12 Coverage of Construction
Classification Coverage
Building construction
Residential Detached and common homes
Non-residential Industrial, commercial, educational & social, public, agriculture and fishery buildings, etc.
Heavy and civil engineering
Roads and railways construction Road (including airport) and railroad
Other civil engineering projects construction
Harbor facilities, Erosion control and river work, Environmental purification facilities, Industrial plant construction sewage facilities
Specialized construction
Site preparation Agriculture and fishery engineering, City civil engineering,
Architecture related specialized construction Water supply and sewage facilities
Building completion and finishing Building repairs
Electrical and communication works Power plant facilities, Communication facilities

BANK OF KOREA ┃┃ 85
Ⅲ. Method and Data Sources
Other specialized construction
Construction for supply to the military and national defense civil engineering, engineering for cemetery-related facilities, other facilities not included in other sectors
Table Ⅲ-9-13 Construction Industry Classification
Construction Type Order Type
Building ConstructionPrivate buildings
Government buildings
Heavy and civil EngineeringPrivate civil engineering
Government civil engineering
Specialized ConstructionPrivate civil engineering
Government civil engineering
6.2. Estimation Method in Reference Year
■ Output
Building Construction
9.92 Outputs for residential and non-residential building construction are
estimated by using the value of Construction Put In Place as delineated in the Report
on the Construction Survey. Government orders are estimated by using the Report on
the Construction Survey and government budget spending data. �e values of private
orders are obtained by deducting government building construction from total
output.
Heavy and Civil Engineering
9.93 Heavy and civil engineering output is estimated by using value of
Construction Put In Place as delineated in the Report on the Construction Survey.
Heavy and civil engineering ordered by the government is estimated by using the
Report on the Construction Survey and government budget spending data, while that

86 ┃┃ 한국은행
Korean System of National Accounts
ordered by the private sector is obtained by deducting government civil engineering
from total output.
Specialized Construction
9.94 Specialized construction (excluding building repairs) output is estimated
by using value of Construction Put In Place as delineated in the Report on the
Construction Survey. Specialized construction ordered by the government is
estimated by using the Report on the Construction Survey and government budget
spending data, while that ordered by the private sector is obtained by deducting
government specialized construction from total output. Meanwhile, building repairs
output is estimated by using value of Construction Put In Place as delineated in the
Report on the Construction Survey and value of output of building repairs businesses
as listed in the taxation data from National Tax Service.
■ Intermediate Consumption
9.95 Intermediate consumption is estimated by multiplying output by the
intermediate consumption ratio which is obtained through input-output tables, etc.
■ Value Added
9.96 Value added is obtained by deducting intermediate consumption from
output.
6.3. Estimation Method in Current Year
A. Nominal Value
■ Output
9.97 Building construction nominal output is estimated by using the value of
BANK OF KOREA ┃┃ 87
Ⅲ. Method and Data Sources
Construction Put In Place as delineated in the Report on the Construction Survey,
which is the same as the reference year estimation. Building construction ordered by
the government is estimated by using government budget spending data.
9.98 Heavy and civil engineering output is estimated by the value of Construction
Put In Place as delineated in the Report on the Construction Survey. Heavy and civil
engineering ordered by the government is estimated by using government budget
spending data, and that ordered by the private sector is obtained by deducting the
public sector �gures obtained from the budget data from total output.
9.99 Specialized construction (excluding building repairs) output is estimated
by using value of Construction Put In Place as delineated in the Report on the
Construction Survey. Specialized construction ordered by the government is
estimated by using the Report on the Construction Survey and government budget
spending data, while that ordered by the private sector is obtained by deducting
government specialized construction from total output. Meanwhile, building repairs
output is estimated by using value of Construction Put In Place as delineated in the
Report on the Construction Survey and value of output of building repairs businesses
as listed in the taxation data from National Tax Service.
■ Intermediate Consumption
9.100 Nominal intermediate consumption is obtained by deducting value added
from output.
■ Value Added
9.101 Nominal value added is estimated by multiplying output by the value-added
ratio, which is obtained from the Report on the Construction Survey from Statistics
Korea, the Financial Statement Analysis on Construction from the Construction
Association of Korea (CAK), and the Financial Statement Analysis from the Bank of
Korea, etc.

88 ┃┃ 한국은행
Korean System of National Accounts
B. Real Value
■ Output
9.102 Real output is estimated by deflating nominal output using the output
de�ator. �e output de�ator is obtained by calculating the weighted average between
the intermediate consumption de�ator and value added de�ator, which are obtained
through input-output tables, PPI, and the wage index.
■ Intermediate Consumption
9.103 Real intermediate consumption is estimated by deflating nominal
intermediate consumption using the intermediate consumption de�ator.
■ Value Added
9.104 Real value added is obtained by deducting real intermediate consumption
from real output.
6.4. Data Sources
9.105 Data sources used for the estimation are as follows.
Table Ⅲ-9-14 Data Sources of Construction
Reference Material Institution Responsible Main Contents
Report on the Construction Survey Statistics Korea Value of Construction Put In Place
Statistics on Building Permission and Commencement Works
Ministry of Land, Infrastructure and Transport Building commencement works
Central and local government budget spending data
Ministry of Strategy and FinanceLocal government
Budget spending on construction
Annual Local BudgetStatistics Report Ministry of the Interior and Safety Budget spending on
construction
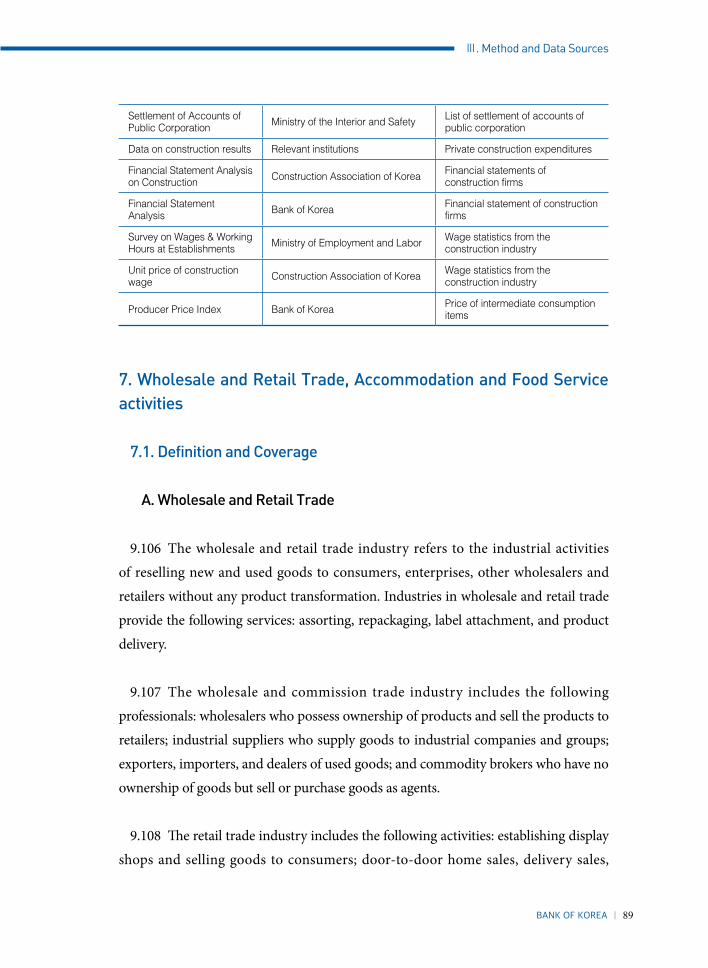
BANK OF KOREA ┃┃ 89
Ⅲ. Method and Data Sources
Settlement of Accounts of Public Corporation Ministry of the Interior and Safety List of settlement of accounts of
public corporation
Data on construction results Relevant institutions Private construction expenditures
Financial Statement Analysis on Construction Construction Association of Korea Financial statements of
construction firms
Financial Statement Analysis Bank of Korea Financial statement of construction
firms
Survey on Wages & Working Hours at Establishments Ministry of Employment and Labor Wage statistics from the
construction industry
Unit price of construction wage Construction Association of Korea Wage statistics from the
construction industry
Producer Price Index Bank of Korea Price of intermediate consumption items
7. Wholesale and Retail Trade, Accommodation and Food Service activities
7.1. Definition and Coverage
A. Wholesale and Retail Trade
9.106 The wholesale and retail trade industry refers to the industrial activities
of reselling new and used goods to consumers, enterprises, other wholesalers and
retailers without any product transformation. Industries in wholesale and retail trade
provide the following services: assorting, repackaging, label attachment, and product
delivery.
9.107 The wholesale and commission trade industry includes the following
professionals: wholesalers who possess ownership of products and sell the products to
retailers; industrial suppliers who supply goods to industrial companies and groups;
exporters, importers, and dealers of used goods; and commodity brokers who have no
ownership of goods but sell or purchase goods as agents.
9.108 �e retail trade industry includes the following activities: establishing display
shops and selling goods to consumers; door-to-door home sales, delivery sales,

90 ┃┃ 한국은행
Korean System of National Accounts
consumer cooperatives, mobile sales, and sales by communication media, hawkers
and peddlers, and auctions.
9.109 However, should a company provide raw materials to another manufacturer
for the manufacture of a product that will be returned and sold under the initiating
company’s responsibility, that transaction is classi�ed as manufacturing, not wholesale
or retail trade. �is is because transformation of the product has occurred. A company
that manufactures and sells specific goods for individuals, household consumption
and the general public is also classified as manufacturing, not as part of the retail
trade industry. �e sale of food for immediate consumption is part of the food service
sector. Supplying gas from a pipeline facility is classi�ed as the manufacture of gas and
distribution of gaseous fuel through a system of mains.
9.110 �e wholesale and retail trade industry can also be classi�ed into agricultural,
forestry, livestock, �shery goods, mining products, and industrial goods according to
the commodities traded.
Table Ⅲ-9-15 Coverage of Wholesale and Retail Trade
Classification Coverage
Wholesale trade and commission trade
Specialized-commodity wholesale trade, wholesale of non-specialized goods, wholesale on a fee or contract basis, etc.
Retail trade Retail sale in non-specialized stores, specialized-commodity retail trade, retail sale of used goods, retail sale not in stores, etc.
B. Accommodation and Food Service activities
9.111 The Accommodation industr y provides lodging or short-term
accommodation services for travelers, vacationers and others. �e establishments in
these industries can be divided into two sub-sectors: general accommodation and
accommodation with cooking facilities, other accommodation.
9.112 General accommodation and accommodation with cooking facilities
includes the provision of short-day lodging to individuals or membership owners by

BANK OF KOREA ┃┃ 91
Ⅲ. Method and Data Sources
charging fees at hotels, inns, condominiums, resorts, and juvenile camps.
9.113 Other accommodation comprises establishments primarily engaged in
operating rooming and boarding houses, dormitories and other similar facilities.
These establishments provide longer-term accommodations that may serve as a
principal residence for the period of occupancy. These establishments may also
provide meals, laundry and other related services.
Table Ⅲ-9-16 Coverage of Accommodation
Classification Coverage
General accommodation and accommodation with cooking facilities
Hotels, inns, condominiums, resorts, juvenile camps, other tourist accommodation, etc.
Other accommodation Boarding and rooming houses, dormitories, campsites, and others
9.114 �e food and beverage service activities provide meals, snacks, and beverages
to customers for immediate consumption on and o� the premises.
Table Ⅲ-9-17 Coverage of Food and Beverage service activities
Classification Coverage
Restaurants and mobile food service activities
Korean style restaurants, Chinese style restaurants, Japanese style restaurants, Western style restaurants, other Eastern and Western-style restaurants, cafeterias, catering and mobile food services, Confectionery stores (pizza, hamburger, sandwich and similar food restaurants)
Drinking places and non-alcoholic beverages places
General drinking establishments, dance clubs, other drinking establishments, etc.

92 ┃┃ 한국은행
Korean System of National Accounts
7.2. Estimation Method in Reference Year
■ Output
9.115 The output of wholesale and retail trade refers to the total trade margin12)
realized from goods that wholesalers and retailers purchase for the purpose of
resale. The total trade margin is calculated by deducting purchase amount from
sales amount.13) �e trade margin includes not only trade conducted for ownership
of goods, but also commissions received while performing brokerage activities
without actual ownership of goods. Meanwhile, goods purchased for resale should be
valued excluding any transport charges invoiced separately by the suppliers or paid
to third parties by wholesalers or retailers; these transport services form part of the
intermediate consumption of wholesalers or retailers.
9.116 In the national accounts, the margin, the output of wholesale and retail trade,
is estimated by summing the trade margin of each commodity. �e main data source
is the Economic Census released by Statistics Korea. Output for the accommodation
and food service activities is also measured based on the Economic Census.
■ Intermediate Consumption
9.117 Intermediate consumption is estimated by deducting value added from
output.
12) According to the SNA, a trade margin is defined as the difference between the actual or imputed price realized on a good purchased for resale and the price that would have to be paid by the distributor to replace the good at the time it is sold or otherwise disposed of.
13) The following are alternative formulas for trade margin:Trade margin = Sales amount Purchase amount
= Sales Cost of goods sold= Sales (Beginning inventory + Current purchase amount Ending inventory) = Sales × Margin ratio= Sales × Gross profit/Sales= Gross profit= Cost of goods sold × Gross profit/Cost of goods sold= Cost of goods sold × Markup ratio
BANK OF KOREA ┃┃ 93
Ⅲ. Method and Data Sources
■ Value Added
9.118 Value added is estimated by multiplying the output by the value added ratio.
The components of value added such as compensation of employees, consumption
of �xed capital, and operating surplus are obtained using the Economic Census and
input-output tables of the reference year.
7.3. Estimation Method in Current Year
A. Current Value
9.119 Annual estimations of nominal output, intermediate consumption, and value
added are the same as the reference year’s estimation methods, and utilize the data
from National Tax Service and the Report on the Service Industry Survey put out by
Statistics Korea and.
B. Real Value
■ Output
9.120 In principle, real output is computed by dividing the current output by the
appropriate de�ators corresponding to each item.
9.121 Real output of wholesale and retail trade is obtained by deducting the real
cost of goods sold from real sales. �e value of real sales is estimated by dividing the
current sales by the de�ators of corresponding industries, using CPI, PPI, EPI, and the
ratios of the selling place by industry. �e value of real cost of goods sold is derived by
dividing the current cost by appropriate de�ators such as CPI, PPI, IPI, and the ratios
of the purchasing place by industry.
9.122 CPI is used for the accommodation and food service activities.

94 ┃┃ 한국은행
Korean System of National Accounts
■ Intermediate Consumption
9.123 Real intermediate consumption is estimated by de�ating current intermediate
consumption using the appropriate deflator, which is calculated based on input-
output tables and PPI, etc.
■ Value Added
9.124 The double deflation method is used to estimate value added. Therefore,
real value added is obtained by deducting real intermediate consumption from real
output.
7.4. Data Sources
Table Ⅲ-9-18 Wholesale and Retail Trade, Accommodation and Food Service activities Data Sources
Industry Reference Material Institution Responsible
Wholesale and retail trade
Economic Census Statistics Korea
Report on the Service Industry SurveyMonthly Report on the Index of Services Statistics Korea
Financial Statements of Corporations and Individuals National Tax Service
Financial Statement Analysis Bank of Korea
Accommodation and food service activities
Economic Census Statistics Korea
Report on the Service Industry SurveyMonthly Report on the Index of Services Statistics Korea
Financial Statements of Corporations and Individuals National Tax Service
Financial Statement Analysis Bank of Korea
Annual Report on Hotel Industry Korea Hotel Association
8. Transportation
8.1. Definition and Coverage
9.125 �e transportation industry refers to industrial activities related to providing

BANK OF KOREA ┃┃ 95
Ⅲ. Method and Data Sources
passenger or freight transport, whether scheduled or not, by rail, road, water or air,
and the associated production carried out in terminals; parking facilities; airfields;
harbors; and cargo handling, storage, and operation of other related facilities. From
the reference year 2015, the public postal activities included in the information and
communication industry were transferred to the transportation industry.
9.126 �e transportation industry includes the following subsectors:
Table Ⅲ-9-19 Coverage of Transportation
Classification Coverage
Land transport
Passenger transport by railways, including inter-urban, urban and suburban; freight transport on mainline rail networks as well as short-line freight railroadsPassenger road transport, including scheduled bus services, charters, excursions and other occasional coach services, taxi operation, airport shuttles, etc.;All freight transport operations by road and transport via pipelines
Water transport Transport of passengers and freight over inland, coastal waters and overseas
Air transport Transport of passengers and freight by air or via space
Storage and support activities for transportation
Support activities related to land, water and air transport of passengers and freight; loading and unloading of freight irrespective of the mode of transport used for transportation; operation of storage and warehouse facilities for all types of goods; forwarding of freight, arranging or organizing of transport operations, activities of sea-freight forwarders and air-cargo agents, etc.
Postal and courier services
Door-to-door transport, local delivery and messenger services, public postal services
8.2. Estimation Method in Reference Year
A. Rail Transport, Air Transport, and Supporting Air Transport Activities
■ Output
9.127 Output for the reference year is measured based on the �nancial statements
of railway corporations, airlines, and other related corporations.

96 ┃┃ 한국은행
Korean System of National Accounts
■ Intermediate Consumption
9.128 Intermediate consumption of the reference year is obtained by subtracting
value added from output.
■ Value Added
9.129 Value added is estimated by multiplying the output by the value added ratio.
The components of value added such as compensation of employees, consumption
of �xed capital, and operating surplus are obtained using input-output tables of the
reference year.
B. Road Transport, Transport of Parcels, Water Transport, Storage and
Support Activities
■ Output
9.130 �e outputs of these industries in the reference year are mainly derived from
the Economic Census released by Statistics Korea.
■ Intermediate Consumption
9.131 Intermediate consumption is estimated by deducting value added from
output.
■ Value Added
9.132 Value added is estimated by multiplying the output by the value added ratio.
The components of value added such as compensation of employees, consumption
of �xed capital, and operating surplus are obtained using the Economic Census and
report on the transportation survey from Statistics Korea and input-output tables of
the reference year.

BANK OF KOREA ┃┃ 97
Ⅲ. Method and Data Sources
8.3. Estimation Method in Current Year
A. Current Value
9.133 �e current values of output, intermediate consumption, and value added are
estimated by using the same methods as those for the reference year.
B. Real Value
9.134 �e real value of output is primarily computed by dividing current value by
the appropriate deflators. Real intermediate consumption is calculated by deflating
current intermediate consumption using the appropriate de�ator estimated by using
input-output tables and PPI, etc. Real value added is attained by the double de�ation
method. In other words, real value added estimates are calculated by deducting real
intermediate consumption from real output.
8.4. Data Sources
Table Ⅲ-9-20 Transportation Data Sources
Reference Material Institution Responsible
Economic Census Statistics Korea
Report on the Transportation Survey Statistics Korea
Financial Statements of Corporations and Individuals National Tax Service
Financial Statements of Railroad Corporations Korea Railroad Corporation, Korea Rail Network Authority
Financial Statements of Subway Corporations Subway corporations
Statistical Yearbook of Ministry of Land, Infrastructure and Transport Ministry of Land, Infrastructure and Transport
Financial Statements of Airlines Airline Corporations
Financial Statements of Korea Expressway Corporation Korea Expressway Corporation
Financial Statements of Airport Corporations Airport Corporations
Balance of Payments Bank of Korea

98 ┃┃ 한국은행
Korean System of National Accounts
9. Finance and Insurance
9.1. Definition and Coverage
9.135 The finance and insurance industry covers the industrial activities of
financial institutions which are principally engaged in financial intermediation or
in auxiliary financial activities closely related to financial intermediation. Financial
intermediation may be de�ned as a productive activity in which �nancial institutions
play a role to settle individual economic agents' fund shortages or surpluses by
intermediating funds between lenders and borrowers through the �nancial market.
“Auxiliary financial activities” refer to supplementary productive activities, which
are not �nancial intermediation in themselves but help �nancial intermediation take
place smoothly.14)
9.136 �e �nance and insurance industry can be grouped into the following sub-
sectors:15)
• Central bank and depository institutions;
• Financial investment funds;
• Other �nancial institutions, excluding insurance corporations and pension
funds;
• Life insurance corporations;
• Pension funds;
• Non-life insurance corporations; and
• Services auxiliary to �nance and insurance.
14) Services auxiliary to financial intermediation may be carried out as secondary activities of financial intermediaries or be provided by specialist agencies or brokers. The latter are called services auxiliary to finance and insurance, and they form a sub-sector of the finance and insurance industry.
15) According to the 2008 SNA, finance and insurance are grouped in institutions as well as in their functions such as money market fund (MMF) and non-MMF, whereas finance and insurance were categorized only by institutions in the 1993 SNA.

BANK OF KOREA ┃┃ 99
Ⅲ. Method and Data Sources
A. Central Bank and Depository Institutions
9.137 �e central bank is the institution whose principal role is to issue currency,
to manage reserve deposits of other depository institutions and government deposits,
and to manage official foreign exchange reserves. Depository institutions are
institutional units with liabilities in the forms of deposits or financial instruments.
Depository institutions are sub-divided into general banks, special banks, domestic
branches of foreign banks, mutual �nance companies, the Korea Post Postal Savings
Division, merchant banks, and mutual savings banks, etc.
B. Financial Investment Funds
9.138 Financial investment funds are institutional units newly established according
to the 2008 SNA. They include asset management corporations (own account),
MMFs, non-MMFs, mutual funds and trust companies. The trust accounts, which
were included in other sub-sectors (banks, securities firms, insurance companies),
respectively, have been reclassi�ed as Financial Investment Funds since the update of
the reference year from 2010 to 2015.
C. Other Financial Institutions
9.139 Other financial institutions are institutional units primarily engaged in
financial intermediation, excluding the central bank, depository institutions, and
life insurance and non-life insurance corporations. �ey raise funds on the �nancial
markets, not in the form of deposits or close substitutes for deposits, but for the
purpose of acquiring financial assets. Financial corporations classified under this
heading include credit-specialized �nancial companies, the Korea Housing Finance
Corporation (trust accounts), the Korea Securities Finance Corporation, pawnshops,
private �nancing, etc.

100 ┃┃ 한국은행
Korean System of National Accounts
D. Life Insurance Corporations
9.140 Life insurance corporations are institutional units which offer life-related
insurance. �is sub-sector includes life insurance companies, the Korea Post Postal
Insurance Division, and mutual life aid companies.
E. Pension Funds
9.141 As the size of pension funds has been growing dramatically due to the
population ageing, this sector has been newly established since the update of the
reference year from 2010 to 2015. Pension Funds consist of retirement pension funds
sold by relevant sub-sectors (banks, securities �rms, insurance companies).
F. Non-life Insurance Corporations
9.142 Non-life insurance corporations, which are similar to life insurance
corporations, are institutional units providing insurance related to accidents or �res
to individual institutional units or groups of units. �is sub-sector includes non-life
insurance companies, and non-life mutual aid companies.
G. Services Auxiliary to Finance and Insurance
9.143 Services auxiliary to finance and insurance are institutional units which
are, for the purpose of accelerating financial intermediation, engaged primarily in
activities closely related to financial intermediation but which do not themselves
perform an intermediation role. This sub-sector consists of corporations such as
securities, investment advisories, financial supplementary service institutions, and
insurance supplementary service institutions.

BANK OF KOREA ┃┃ 101
Ⅲ. Method and Data Sources
Table Ⅲ-9-21 Coverage of the Finance and Insurance Industry
Classification Coverage
Central bank and depository institutions
Bank of Korea
Depository banks (general banks, specialized banks, domestic branches of foreign banks, etc.)
Mutual finance companies (National Agricultural Cooperative Federation, National Federation of Fisheries Cooperatives, National Forestry Cooperative Federation, etc.), Credit Unions, Korean Federation of Community Credit Cooperatives, Korea Post Postal Savings Division;merchant banks, mutual savings banks, etc.
Financial investment funds
Asset management corporations (own account), MMF, Non-MMF; Mutual Fund, trust companies etc.
Other financialInstitutions
Credit-specialized companies (installment finance, credit cards; financial leasing, new technology project finance, etc.)
Other intermediaries (Korea Housing Finance Corporation, Korea Securities Finance Corporation, pawnshops, etc.)
Life insurance companies
Life insurance companies
Korea Post Postal Insurance Division
Life insurance-related mutual aid from Nonghyup and Suhyup, Korea Teachers' Credit Union, Military Mutual Aid Association, etc.)
Pension Funds Retirement pension funds of banks, securities firms, and insurance companies
Non-life insurancecompanies
Non-life insurance companies (including Seoul Guarantee Insurance)
Non-life mutual aid from NACF (National Agricultural Cooperative Federation) and NFFC (National Federation of Fisheries Cooperatives), Korea Shipping Association Mutual Aid, Construction Guarantee, Korea Taxi Mutual Aid Association, National Bus Mutual Aid Association, etc.
Services auxiliary to finance and insurance
Securities institutions (securities firms, investment advisories, futures companies,Korea Exchange, KOSCOM (Korea Securities Computing Corporation), Korea Securities Depository, etc.)
Insurance auxiliary service institutions (insurance agents and brokers, insurance appraisal companies, etc.)
Financial auxiliary service institutions (Korea Financial Telecommunication & Clearings Institute, Korea Asset Management Corporation, Korea Deposit Insurance Corporation, money exchangers, etc.)

102 ┃┃ 한국은행
Korean System of National Accounts
9.2. Estimation Method in Reference Year
A. Central Bank and Depository Institutions
■ Output
9.144 Output for the central bank is estimated using the sum-of-costs approach in
which output is calculated by adding up ordinary expenses such as fees and charges,
cost of issuing national currency, severance payments, and general administrative
costs.
9.145 The output for depository institutions consists of financial intermediation
services indirectly measured (FISIM) and actual services. FISIM are related to the
function of connecting deposits with fund users so as to distribute funds e�ectively.
FISIM are sub-divided into intermediation services on loans and intermediation
services on deposits. The output of FISIM on loans is calculated by deducting
outstanding loans multiplied by the reference rate from property income receivable.
The output of FISIM on deposits is calculated by deducting property income
payable from outstanding deposits multiplied by the reference rate. Property
income receivable refers to interest receivable by financial intermediaries, gains on
redemption of loans, etc. On the contrary, property income payable refers to interest
payable, losses on redemption of loans, etc.
9.146 Actual services are �nancial services for which depository institutions impose
explicit fees. Actual services are estimated by adding up commissions, guarantee fees,
and securities lending fees, etc.

BANK OF KOREA ┃┃ 103
Ⅲ. Method and Data Sources
FISIM
Financial institutions such as banks primarily settle individual economic agents' fund shortages or surpluses by intermediating funds between lenders and borrowers through the financial markets. However, they do not charge service fees such as commissions to their customers. Interest charged on borrowers is higher than the interest given to lenders, and the difference between interest receivable and interest payable is recognized as imputed revenue.
Unlike actual services, financial intermediation services are hard to estimate directly. Thus they are collectively known as FISIM.
FISIM are currently calculated using the following formula:
FISIML = L × (Lr – r*) = RL – (L × r*)FISIMD = D × ( r* – Dr) = (D × r* ) – RD
where, FISIML: FISIM on loansFISIMD: FISIM on depositsLr: interest rate of loans, Dr: interest rate of depositsRL: the amount of interest receivable for loans (property income receivable)RD: the amount of interest payable for deposits (property income payable)r*: reference rate, L: the amount of loans, D: the amount of deposits
FISIM becomes the intermediate consumption or final consumption expenditure of economic agents. FISIM are distributed to each agent by using financial asset and liability statistics, loans to industries by commercial and specialized banks, and financial statement analysis, taxation data of the National Tax Service, etc.
Box Ⅲ-9-2

104 ┃┃ 한국은행
Korean System of National Accounts
■ Intermediate Consumption
9.147 Intermediate consumption for the central bank is estimated by deducting
value added items such as compensation of employees and consumption of fixed
capital from output.
9.148 Intermediate consumption of depository institutions is estimated by adding
intermediate consumption items on the income statement such as commissions,
rental charges, entertainment expenses, public relations expenses, etc.
■ Value Added
9.149 �e value added of the central bank consists of compensation of employees,
consumption of fixed capital, and other taxes on production less subsidies.
Compensation of employees includes all labor costs such as wages and salaries,
retirement bene�ts, and welfare bene�ts. Consumption of �xed capital is estimated by
using capital stock of �xed assets data. �e amount of other taxes on production less
subsidies is allocated by government unit.
9.150 �e value added for depository institutions is divided into compensation of
employees, consumption of fixed capital, other taxes on production less subsidies,
and operating surplus. Compensation of employees, consumption of fixed capital,
and other taxes on production less subsidies are estimated by using the same method
employed by the central bank. Operating surplus is calculated by subtracting
compensation of employees, consumption of fixed capital, and other taxes on
production less subsidies from the total amount of value added – i.e. the amount of
output le� a�er deducting intermediate consumption.

BANK OF KOREA ┃┃ 105
Ⅲ. Method and Data Sources
B. Financial Investment funds
■ Output
9.151 The output for financial investment funds consists only of actual services
estimated by using asset management, operating fees, commissions received on sales,
and trust fees as indicated on the income statement.
■ Intermediate Consumption
9.152 Intermediate consumption of �nancial investment funds is estimated using
the income statements; the same method used by for depository institutions.
■ Value Added
9.153 The value added for financial investment funds is also divided into
compensation of employees, consumption of �xed capital, other taxes on production
less subsidies, and operating surplus. Value added is determined in the same manner
used for depository institutions.
C. Other Financial Institutions
9.154 Similar to depository institutions, output for other �nancial institutions also
consists of �nancial intermediation services and actual services. Output is calculated
in the similar manner used for depository institutions while some services such
as cash advance service and card loan service are regarded as FISIM. Intermediate
consumption is also calculated using the same methods as depository.
D. Life Insurance and Non-life Insurance
9.155 Life insurance and non-life insurance are estimated by deducting the sum

106 ┃┃ 한국은행
Korean System of National Accounts
of net insurance claims payable16) and net increases in policy reserves17) from the
sum of net premiums receivable18) and investment pro�ts as indicated on the income
statements of the relevant institutions.19) Meanwhile, intermediate consumption and
value added are estimated using the same methods as those used for depository.
E. Pension Funds
9.156 Output of pension funds consists of fees related to retirement pension funds,
including trust fees of banks and securities �rms and separate account commissions
of insurance companies. Value added (or intermediate consumption) is estimated by
multiplying the value added (or intermediate consumption) of each sub-sector selling
the retirement pension funds by the sector’s retirement pension output ratio to the
total.
F. Services Auxiliary to Finance and Insurance
9.157 Similar to depository institutions, the output of services auxiliary to �nance
and insurance is also composed of actual services and FISIM. FISIM are calculated by
using interest receivable and interest payable, and the actual services are derived by
adding up various commission incomes. Meanwhile, the output of insurance auxiliary
service institutions consists of commission incomes.
9.158 Intermediate consumption and value added for services auxiliary to �nance
and insurance are calculated using the same methods as those used for depository
institutions.
16) Net insurance claims payable = Direct claims paid - Refund of claims paid. In the case of non-life insurance, “Reinsurance Claims Recovered - Reinsurance Claims Paid” needs to be added.
17) Net increase in policy reserves = Provision for policy reserve – Reversal of policy reserve
18) Net premiums receivable = Direct premium written – (Cancellation refund – Refund of return premium) In the case of non-life insurance, “Assumed Reinsurance – Ceded Reinsurance Premium” needs to be added.
19) In the case of insurance, a situation may occur in which companies have to pay enormous amounts of insurance claims at once. According to the 1993 SNA in which output for non-life insurance is measured as insurance premiums less insurance claim payments, there could be a negative (-) output. For this reason, the 2008 SNA recommends that the formula for calculating output not be based on actual claims but be based on past experience and future expectations. Insurance companies base premiums on their own estimations of the likelihood of claims, and the term “adjusted claims” is used to describe the level of claims used in determining the value of output. In Korea, adjusted claims are calculated by using the 20-quarter moving average of the ratio between insurance claims payable and premiums receivable.

BANK OF KOREA ┃┃ 107
Ⅲ. Method and Data Sources
9.3. Estimation Method in Current Year
A. Nominal Value
9.159 The method for estimating nominal value for finance and insurance is the
same as that used to calculate it in the reference year.
B. Real Value
Central Bank and Depository Institutions
9.160 Output for the central bank and depository institutions is estimated as actual
services and FISIM. Real actual services are estimated by deflating nominal actual
services using a corresponding de�ators. FISIM are estimated as follows: the growth
rates of interest-bearing assets and liabilities deflated by the consumer price index
are multiplied by the FISIM of the previous year. Real intermediate consumption
is calculated by deflating nominal intermediate consumption. Real value added
is estimated by the double deflation method which deducts real intermediate
consumption from real output.
Financial Investment Funds
9.161 Real output for �nancial investment funds is calculated by de�ating nominal
actual services. Real intermediate consumption and real output are calculated using
the same methods as those used for depository institutions.
Other Financial Institutions
9.162 Output of other �nancial Institutions consists of actual services and FISIM,
and is estimated in the same manner used by for depository institutions. Intermediate
consumption and value added are estimated using the same methods as those used
for depository institutions.

108 ┃┃ 한국은행
Korean System of National Accounts
Life Insurance, Pension Funds and Non-life Insurance
9.163 Value added at constant real prices for life insurance, pension funds and non-
life insurance is estimated by deducting intermediate consumption from output. Real
output and real intermediate consumption are calculated by deflating output and
intermediate consumption at current prices, respectively.
Services Auxiliary to Finance and Insurance
9.164 Value added at constant real prices for services auxiliary to finance and
insurance is estimated by deducting intermediate consumption from output. For
securities companies, real FISIM is deflated using the same methods as depository
institutions.
9.165 Real price actual services and intermediate consumption for financial
auxiliaries are calculated by de�ating current-price actual services and intermediate
consumption, respectively.
9.4. Data Sources
Table Ⅲ-9-22 Finance and Insurance Data Sources
Classification Reference Material Institution Responsible
Central Bank Financial Statement Bank of Korea
Depository institutions, other financial institutions, services auxiliary to finance and insurance
Financial StatementFinancial Supervisory Service and individual financial institutions
Financial Assets and Liabilities Outstanding Bank of Korea
Financial investment funds, life insurance, pension funds, non-life insurance
Financial StatementFinancial Supervisory Service and individual financial institutions
DeflatorProducer Price Index Bank of Korea
Consumer Price Index Statistics Korea.

BANK OF KOREA ┃┃ 109
Ⅲ. Method and Data Sources
10. Real Estate
10.1. Definition and Coverage
9.166 The real estate industry covers housing services, leasing of non-residential
buildings, development and subdividing of real estate, real estate-related services.
A. Housing Services
9.167 Housing services refer to providing dwellings for persons in need of
residences. Housing services include not only actual rental services occurring when
an owner leases the accommodation to tenants but also imputed rental services
occurring when owners themselves reside in their dwellings.
9.168 The services of owner-occupied dwellings – imputed rental services – are
included in production, whereas services for own final consumption are generally
excluded from production.20) Imputed rental services are measured as the estimated
rent that a tenant would have to pay for the same accommodation.
B. Renting of Non-residential Buildings
9.169 Renting of non-residential buildings refers to the industry concerned with
leasing real estate for non-residential purposes such as shopping centers, warehouses,
and o�ces.
C. Development and Subdividing of Real Estate
9.170 Development and subdividing of real estate refers to the activity of
developing and selling real estate such as own-developed land and subcontract-based
20) This is because: ① the ratio of leased housing to total housing differs among countries and can even change sharply within a country over time. If services of owner-occupied dwellings are excluded from production, there is a possibility of distortion in international comparisons; ② some countries impose taxes on the imputed services of owner-occupied dwellings; and ③ a number of countries have long recognized the services of owner-occupied dwellings as production activity.

110 ┃┃ 한국은행
Korean System of National Accounts
buildings. �is activity includes reselling real estate without leasing.
D. Real Estate-related Services
9.171 Real estate-related services refer to various services related to real estate,
including brokerage, appraisal, and management. Real estate brokerage covers real
estate intermediary and agent services in the course of leasing, purchasing, and selling
real estate. Real estate appraisal involves the business of estimating and appraising real
estate under commission or contract. Real estate management refers to the activity of
managing others' real estate as an agent.
Table Ⅲ-9-23 Coverage of Real Estate Industry
Classification Coverage
Housing services Actual rental services, imputed rental services
Renting of non-residential buildings Leasing of buildings except residential buildings
Development and subdividing of real estate Development and selling of real estate such as own-developed land and subcontract-based buildings
Real estate-related service
Real estate brokerage Brokerage of real estate
Real estate appraisal Appraisal of real estate
Real estate management Management of real estate as an agent
10.2. Estimation Method in Reference Year
A. Housing Services
9.172 Output for housing services in the reference year is the sum of actual rental
services and imputed rental services as estimated in the Census. Actual rental services
are estimated by adding up rental costs by region and by type of rental. Imputed rental
services are derived from multiplying the corresponding number of households by
the imputed rental cost which is the weighted average of rental costs by region and
type of rental. Value added is obtained by multiplying output by the value added ratio
calculated from input-output tables.
BANK OF KOREA ┃┃ 111
Ⅲ. Method and Data Sources
B. Renting of Non-residential Buildings
9.173 Output for renting of non-residential buildings is obtained by adding up
the rental costs of economic sectors estimated by using compiled commercial and
individual returns released by the National Tax Service. Value added is obtained by
multiplying output by the value added ratio calculated from input-output tables.
C. Development and Subdividing of Real Estate
9.174 Output for development and subdividing of real estate is calculated by adding
up the land-development profits of the Korea Land and Housing Corporation and
the building subdivision fees of related enterprises. Value added for the real estate
development industry is obtained by multiplying output by the value added ratio
calculated from input-output tables.
D. Real Estate-related Services
9.175 Outputs for the real estate brokerage and real estate management industries
are estimated using compiled commercial and individual returns released by the
National Tax Service. Value added is obtained by multiplying output by the value
added ratio calculated from input-output tables.
9.176 Output, intermediate consumption, and value added for the real estate
appraisal industry are calculated using data gathered by the Korea Appraisal Board
and the Korea Association of Property Appraisers.
10.3. Estimation Method in Current Year
A. Nominal Value
9.177 Output at current prices for housing services is estimated by applying the
rent index of the consumer price index and the total space of residential buildings

112 ┃┃ 한국은행
Korean System of National Accounts
derived from the statistics on completion and demolition of residential buildings from
the Ministry of Land, Infrastructure and Transport.
9.178 Output for renting of non-residential buildings is calculated by using the
statistics on completion and demolition of non-residential buildings, and the vacancy
rate from the Korea Appraisal Board.
9.179 Output for development and subdividing of real estate and real estate-related
services is estimated by the same method as that used in the reference year.
B. Real Value
9.180 Output at real prices for housing services is estimated from the total space of
residential buildings in the current year and the rental cost in the reference year. Value
added is estimated by deducting the real-price intermediate consumption derived
from input-output tables from the output.
9.181 Output at real prices for renting of non-residential buildings, development
and subdividing of real estate and real estate-related services is estimated by de�ating
output at current prices. Value added is estimated by deducting the real-price
intermediate consumption derived from input-output tables from the output.

BANK OF KOREA ┃┃ 113
Ⅲ. Method and Data Sources
10.4. Data Sources
Table Ⅲ-9-24 Data Sources of Real Estate
Classification Reference Material Institution Responsible
Housing services
Census Statistics Korea
Input-output tables Bank of Korea
Number of households Ministry of the Interior and Safety, Local Government
Statistics on building completion and demolition
Ministry of Land, Infrastructure and Transport
Renting of non-residential buildings
Income Statement National Tax Service
Input-output tables Bank of Korea
Development and subdividing of real estate
Input-output tables Bank of Korea
Financial Statement Korea Landing and Housing Corporation, etc.
Economic Census Statistics Korea
Service Industry Survey Statistics Korea
Compiled commercial and individual returns National Tax Service
Real estate-related services
Compiled commercial and individual returns National Tax Service
Economic Census Statistics Korea
Service Industry Survey Statistics Korea
Input-output tables Bank of Korea
Financial statement Korea Appraisal Board, etc.
DeflatorsProducer price index Bank of Korea
Consumer price index Statistics Korea
11. Information and Communication
11.1. Definition and Coverage
9.182 Information and communication industry is divided into communications,
and publishing, broadcasting, motion picture, and information services.
Communication services are sub-classi�ed into: ① wired telecommunications such
as wired telephone for home and business entities, high-speed internet services ②

114 ┃┃ 한국은행
Korean System of National Accounts
wireless and satellite telecommunications including the mobile phone services; and ③
other telecommunications activities referring to the provision of various value added
services based on telecommunications networks.
9.183 Publishing, broadcasting, motion picture, and information services are sub-
classified into: ① publishing: newspapers, books, software, etc.; ② broadcasting:
ground radio wave TV, radio, program provider, IPTV, system operator, etc.;
③ motion picture: movies, advertisement, television program production and
distribution activities, theater operation, audio producing, etc.; ④ information:
providing information through the portal site, etc.; ⑤ computer programming, system
integration and management : IT system management and support service, hosting
service, etc.
9.184 Table Ⅲ-9-25 shows the detailed classification of information and
communication industry.
Table Ⅲ-9-25 Coverage of Information and Communication
Classification Coverage
Communication
Wired telecommunications Wired telephone for home and business entities, high-speed internet services
Wireless and satellite telecommunications
Mobile phone, wireless high-speed internet services
Other telecommunications Mobile virtual network operator(MVNO), Electronic payment services
Publishing, broadcasting, motion picture, information
Publishing
Newspaper Daily and non-daily newspapers
Book, periodicals and other prints
Textbooks and other teaching materials, magazines and periodical
Software development and supply
Books, periodicals, dictionaries and encyclopedias, atlases, maps, etc.
Broadcasting
Ground radio wave TV, radio
Cable, satellite, and others Program Provider, IPTV, system Operator
Motion picture
Video, audio production and distribution Movies, advertisements, TV program, records
Movie and video projection Theater

BANK OF KOREA ┃┃ 115
Ⅲ. Method and Data Sources
Information services Portal and other information intermediary services
Computer programming, system integration and management
IT system management and support, hosting services
11.2. Estimation Method in Reference Year
A. Communication
■ Output
9.185 Output of the communication industry in the reference year is calculated
based on the Information and Communication Technology Survey conducted by
the Korea Association for ICT Promotion, and the financial statements of mobile
telecommunication corporations. Internet management and support services
categorized as value added network services are included in the IT system integration
and support services category, not in the other telecommunication categories.
■ Intermediate Consumption
9.186 Reference year intermediate consumption is calculated by deducting value
added from output.
■ Value Added
9.187 The value added of communication industry is estimated by using factor
income data of KAIT and input structure survey for Input-Output table of benchmark
year.

116 ┃┃ 한국은행
Korean System of National Accounts
B. Publishing, Broadcasting, Motion pictures, and information services
■ Output
9.188 Reference year output for publishing, broadcasting, motion pictures, and
information services is obtained based on the Service Industry Survey, Economic
Census, Broadcasting Industry Survey, and ICT Industry Survey.
■ Intermediate Consumption
9.189 Reference year intermediate consumption is calculated by deducting value
added from output.
■ Value Added
9.190 Publishing, broadcasting, motion pictures, and information services value
added in a given reference year is estimated by compiling data from the Economic
Census, ICT Industry Survey, National Tax Statistics, and input structure survey for
Input-Output table of benchmark year.
11.3. Estimation Method in Current Year
A. Nominal Value
9.191 The estimation methods for the nominal value of output, intermediate
consumption, and value added for information and communication services are
mostly identical to the methods used to obtain comparable �gures for the reference
year, but using annual Services Industry Survey and current year input structure
instead of economic census and input structure survey of benchmark year.

BANK OF KOREA ┃┃ 117
Ⅲ. Method and Data Sources
B. Real Value
9.192 �e real value of output is obtained primarily by de�ating nominal output by
the relevant price indicators. �e real value of intermediate consumption is obtained
by de�ating detailed items of nominal intermediate consumption by the relevant price
indices. The real value of value added is obtained by applying the double-deflation
methods.
11.4. Data Sources
9.193 The data sources used to estimate the value added of information and
communication in reference and current years are nearly identical. Table Ⅲ-9-26
shows speci�c data sources.
Table Ⅲ-9-26 Information and Communication Data Sources
Reference Material Institution Responsible
Financial statements of telecommunications companies KT, SKT, LG U+ , etc.
Information and Communication Technology Survey
Ministry of Science, ICT and Future Planning, Korea Association for ICT Promotion, Korea Electronics Association
National Tax Statistics National Tax Service
Service Industry Survey Statistics Korea
Financial Statement Analysis Bank of Korea
Advertising Yearbook Cheil Communications, Inc.
Total sales and number of audiences of movie cinemas Korean Film Council
Wired and wireless telecommunications subscriber statistics
Ministry of Science, ICT and Future Planning
Content Industry Statistics Korea Creative Content Agency
Employment and labor statistics of Korea Ministry of Employment and Labor
Broadcasting Industry Survey Korea Information Society Development Institute
Official Digital Announcement Financial Supervisory Service

118 ┃┃ 한국은행
Korean System of National Accounts
12. Business Activities
12.1. Definition and Coverage
9.194 Business activity services support manufacturing and other industries in
their e�orts to improve management and strengthen competitiveness. Firms engaged
in business activities are constantly growing industries in the service- and knowledge-
based economy.
9.195 Business activities cover:
• Professional, scientific and technical services(business related professional
services, research and development, architectural and scienti�c and technical
services); and
• Business support services(business facilities management and landscape
services, renting of equipment and goods, activities of employment
placement agencies and provision of human resources, other business
support services).
A. Business related professional Services
9.196 Business-related professional services fall under three main categories: legal
and accounting services, market surveys & management consulting services, and
advertising.
Legal and accounting services include:
• Legal representation;
• Patent attorney representation;
• Legal document services;
• Administrative document preparation for clients;
• Process serving;
• Tax a�airs;

BANK OF KOREA ┃┃ 119
Ⅲ. Method and Data Sources
• Accounting; and
• Registration.
Market surveys and management consulting services include:
• Market and public opinion surveys (surveys on consumer behavior, product
popularity, potential markets, etc.); and
• Business and management consulting (consultation on general management,
strategic planning, human resource management, etc.), etc.
9.197 The advertising industry refers to businesses contracted to produce and
carry advertisements. These include advertising agencies, technical developers of
advertisements (graphic artists, photographers), and purchasers and sellers of media
time and space for advertising. �e advertising industry can be classi�ed into three
areas:
• Advertising in the four traditional media channels (television, radio,
newspapers, and magazines);
• Outdoor and sales promotions (SP) advertising; and
• New media advertising (cable television, Internet and PC communication).
B. Research and Development
9.198 Research institutions are divided according to sectors, and include the
following:
• National research institutions;
• Research institutions connected with non-pro�t organizations; and
• Private research institutions connected to businesses.
9.199 When companies whose primary purpose is to strengthen their own business
operations, this is classi�ed as the activity of a private research institution connected
to business. Such research includes:

120 ┃┃ 한국은행
Korean System of National Accounts
• �at for improving production of goods and manufacturing; and
• That for delineating the merits of improved product design (testing,
inspection, analysis, design and manufacturing of prototypes, etc.).
9.200 Research institutions are also divided according to their research contents, as
follows:
• Research and experimental development on natural science and engineering
(physics, chemistry, biology, agriculture, etc.); and
• Research and experimental development on social sciences and humanities,
etc.
C. Architectural and Scientific and Technical Services
9.201 Architectural and scientific and technical services include architectural
services, engineering-related services, and scienti�c and technical services.
Architectural services include:
• Architectural design;
• Construction engineering;
• Measuring and blueprints; and
• City planning and landscaping.
Engineering-related services include:
• Mechanical design; and
• Electrical and electronic engineering.
Scienti�c and technical services include:
• Inspection and analysis of material components; and
• Geological surveys and exploration, etc.

BANK OF KOREA ┃┃ 121
Ⅲ. Method and Data Sources
D. Business Support Services
9.202 Business support services cover:
• business facilities management and landscape services;
• Renting of equipment and goods;
• Activities of employment placement agencies and provision of human
resources; and
• Other business support services.
�e category of business facilities management and landscape services covers:
• Disinfection and insect extermination services (extermination of vermin in
buildings, sanitation and disinfection of restrooms, etc.);
• General cleaning of structures; and
• Cleaning of industrial facilities (washing of industrial facilities, water and
sewage pipes, ships and industrial equipment, etc.).
Renting of equipment and goods includes:
• Renting of transport equipment;
• Renting of personal and household goods; and
• Renting of industrial machinery and equipment.
Other business support services include:
• Exhibition and event agency;
• Packaging and energy replenishment (trademark application, clothing
packaging, gas injection, etc.);
• Security and guard services;
• Security systems service activities;
• Document preparation services; and
• Call center activities and telemarketing services, etc.

122 ┃┃ 한국은행
Korean System of National Accounts
12.2. Estimation Method in Reference Year
9.203 �ere is little di�erence in the estimation methods among the sub-sections in
the business services sectors except for data sources.
■ Output
9.204 Estimations of output for business services in the reference year are based on
the Economic Census from Statistics Korea, data from the National Tax Service, and
other complete enumeration data.
■ Intermediate Consumption
9.205 Intermediate consumption for this industry group is calculated by using
input-output tables.
■ Value Added
9.206 Value added for this industry group is obtained by deducting intermediate
consumption from output.
12.3. Estimation Method in Current Year
A. Nominal Value
■ Output
9.207 �e nominal values of output for the business services sector are estimated
based on the Service Industry Survey from Statistics Korea, the �nancial statements
of corporations and individuals compiled by the National Tax Service, and other data
sources.

BANK OF KOREA ┃┃ 123
Ⅲ. Method and Data Sources
■ Intermediate Consumption
9.208 �e nominal values of intermediate consumption for this industry group are
obtained by deducting current price value added from current price output.
■ Value Added
9.209 �e nominal values of value added for this industry group are calculated by
multiplying output by the value added ratio. �e value added ratio is derived from
the Service Industry Survey and from the financial statements of corporations and
individuals.
B. Real Value
■ Output
9.210 Real estimates of output for the business service sector are obtained by
dividing the nominal value of output by de�ators using PPI or CPI.
■ Intermediate Consumption
9.211 The real values of intermediate consumption are obtained by deflating
detailed items of nominal intermediate consumption.
■ Value Added
9.212 Real estimates of value added for this industry group are obtained by
using the double-deflation method. In other words, real estimates of value added
are calculated by deducting real estimates of intermediate consumption from real
estimates of output.
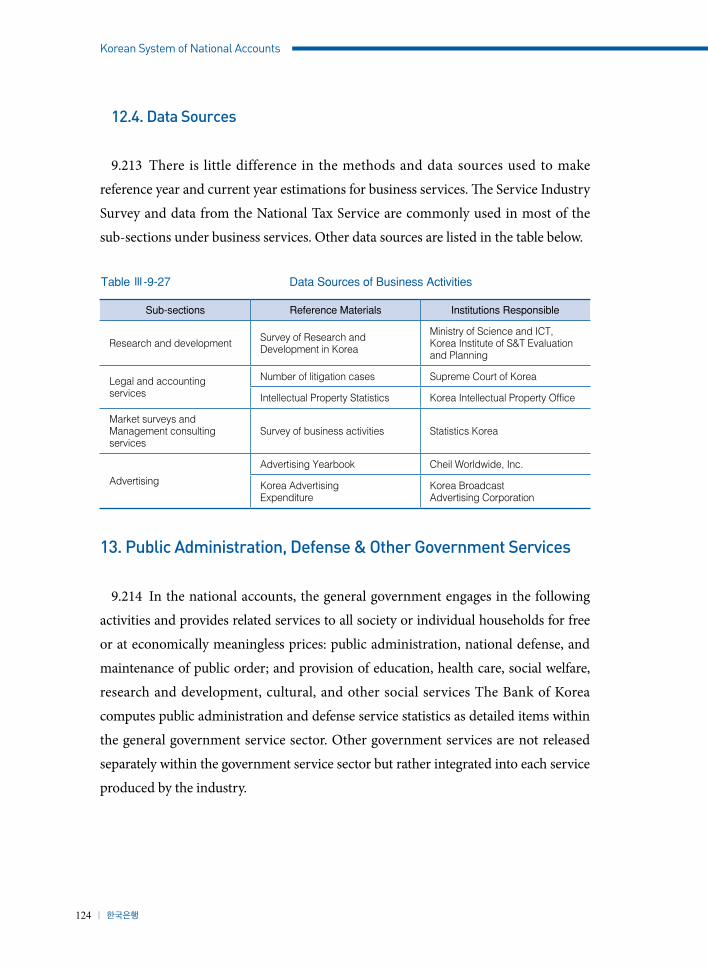
124 ┃┃ 한국은행
Korean System of National Accounts
12.4. Data Sources
9.213 There is little difference in the methods and data sources used to make
reference year and current year estimations for business services. �e Service Industry
Survey and data from the National Tax Service are commonly used in most of the
sub-sections under business services. Other data sources are listed in the table below.
Table Ⅲ-9-27 Data Sources of Business Activities
Sub-sections Reference Materials Institutions Responsible
Research and development Survey of Research and Development in Korea
Ministry of Science and ICT,Korea Institute of S&T Evaluation and Planning
Legal and accounting services
Number of litigation cases Supreme Court of Korea
Intellectual Property Statistics Korea Intellectual Property Office
Market surveys and Management consulting services
Survey of business activities Statistics Korea
Advertising
Advertising Yearbook Cheil Worldwide, Inc.
Korea AdvertisingExpenditure
Korea BroadcastAdvertising Corporation
13. Public Administration, Defense & Other Government Services
9.214 In the national accounts, the general government engages in the following
activities and provides related services to all society or individual households for free
or at economically meaningless prices: public administration, national defense, and
maintenance of public order; and provision of education, health care, social welfare,
research and development, cultural, and other social services The Bank of Korea
computes public administration and defense service statistics as detailed items within
the general government service sector. Other government services are not released
separately within the government service sector but rather integrated into each service
produced by the industry.

BANK OF KOREA ┃┃ 125
Ⅲ. Method and Data Sources
Table Ⅲ-9-28 Sub-sections of Government Services
Estimation Method Sub-sections
The sum-of-costs approach(Output = Intermediate consumption + Value added)
Public Administration and Defense (Central Government)
Public Administration and Defense (Local Government)
Education Services (Public)
Health Services (Public)
Social Welfare Services (Public)
Social Insurance Services (Public)
Cultural Services (Public)
Financial and Insurance Services (Public)
Research and Development (Public)
Wastewater Treatment (Public)
Waste Disposal (Public)
Market Output Approach(Output - Intermediate consumption = Value added)
Water Services
Railroad Transportation Services
Postal Services
Financial Services
Insurance Services
13.1. Definition and Coverage
9.215 The general government, as an entity carrying out economic activities, is
an institution providing public services that cannot be produced economically or
conveniently by other market-oriented institutions. It also manages the country and
implements social and economic policies.
9.216 The general government sector is regarded as consuming most of its own
output, i.e. goods and services produced by the government itself, and sells some part
of those services to the private sector at economically insigni�cant prices. Hence, the
general government sector conventionally has no operating surplus. Accordingly, the
output of the general government is estimated using total costs imputed (the sum-of-
costs approach). �e Bank of Korea decided in 2008 to coincide the expanded and
reorganized general government coverage of the 2008 SNA with the Government

126 ┃┃ 한국은행
Korean System of National Accounts
Finance Statistics (GFS). Hence, several sub-sections of government services are
estimated using market output.
9.217 In Korea, the general government sector is sub-divided into administrative
government (central and local), social security funds, and non-profit institutions
(NPIs) controlled by government. Administrative government engages in public
administration, national defense, and the maintenance of public order, health care,
education, culture and entertainment, and other social services. It also supports
economic growth and improvement in social welfare and technology and is divided
into the central and local government.
9.218 The central government can be sub-divided into general accounts, special
accounts, and funds managed by central administrative departments. By using the
revised coverage, the Foreign Exchange Stabilization Fund and �nancial funds as well
as government enterprise special accounts such as grain, procurement, postal savings
and insurance, and postal programs special accounts are newly included under the
central government
9.219 Local government is sub-classified into general local-government accounts
(i.e. those of the self-administrating special metropolitan city (Seoul) and �ve other
metropolitan cities, provinces, small cities, counties, and city wards), other special
accounts controlled by local administrative departments, local government enterprise
special accounts, funds, and special accounts for local educational o�ces and their
expenses
9.220 Social security funds consist of institutional units which generally involve
compulsory contributions that are controlled by the government for the purpose of
offering social security benefits to members of the community. They are separately
organized institutional units that �nance funds from the government or the private
sector. Social security funds include the institutions operating social security funds
and the funds themselves.

BANK OF KOREA ┃┃ 127
Ⅲ. Method and Data Sources
9.221 NPIs controlled by government refer to institutional units o�ering services
to households or enterprises for free or at economically insigni�cant prices, or those
providing research and analysis on public administration services for the government.
Major policy decisions of the institutions, including fund financing and control
and personnel a�airs, are made mainly or entirely by the government. �e coverage
of NPIs controlled by government has also been broadened to include central
institutions that are under the umbrella of the central government and subject to the
Act on the Management of Public Institutions (AMPI), and local institutions which
have a less than 50% sales/production cost ratio and are subject to the Local Public
Enterprises Act (LPEA).
9.222 The general government as an institutional sector includes small-sized
government corporations supplying goods and services to the government or
the private sector. For instance, operation of munitions factories, toll roads, and
restaurants in public buildings fall under this category. But in the Korean national
accounts, at present, coverage of the general government as a producer is the same
as that of the general government as an institutional sector due to limits in obtaining
basic statistical materials.
13.2. Estimation Method in Reference Year
A. Central Government
■ Output
9.223 Output for the central government in the reference year is calculated simply
by combining value added and intermediate consumption from expenditure data by
account, jurisdiction, and detailed items as obtained from the Ministry of Strategy and
Finance (MOSF) based on the sum-of-costs approach method. For other activities
using the market output approach, output is calculated from the sales of goods and
services.

128 ┃┃ 한국은행
Korean System of National Accounts
■ Intermediate Consumption
9.224 Intermediate consumption for the central government is obtained by
combining general operating expenses, travel expenses, management expenses, and
other goods and services expenses21) from among the �scal execution results detailed
per item by the MOSF.
■ Value Added
9.225 Value added for the central government is measured as the sum of
compensation of employees, consumption of fixed capital, and other taxes on
production. Compensation of employees is measured by summing labor costs,
retirement bene�ts, welfare bene�ts, and awards from among �scal execution results
by detailed item provided by the MOSF. �e consumption of �xed capital is compiled
by the National Balance Sheet Team, according to the perpetual inventory method
(PIM). In the 2008 SNA, fixed capital itself should be something that is produced.
Depreciation or qualitative degradation of non-produced assets (e.g. land, minerals,
and other underground resources) do not constitute consumption of �xed capital. So
the cost of land purchase is exempted from consumption of �xed capital. Other taxes
on production are estimated by summing up automobile and other taxes as indicated
in the fiscal execution results of the MOSF. For other activities using the market-
output approach, value added is calculated by subtracting intermediate consumption
from output.
21) The government account classifies account items in accordance with their characteristics. Items are classified by code numbers, such as the 100s (personnel expenses), 200s (goods and service expenses), 300s (current transfers), 400s (capital expenditures), etc. The performance amount of each item is broken down under the relevant account code in the national accounts. In general, the items in the 100s (personnel expenses) of the government are treated as “compensation of employees” in the national accounts, and the items in the 200s (goods and service expenses) are treated as “intermediate consumption.”

BANK OF KOREA ┃┃ 129
Ⅲ. Method and Data Sources
B. Local Government (General Accounts, Other Special Accounts)
■ Output
9.226 Local government output is also estimated by the sum-of-costs approach
method, using the budget summary and �scal execution results of local administrative
departments. For activities using the market-output approach such as those carried
out by the water service special account and subway public corporations, output is
calculated by using the sales of goods and services.
■ Intermediate Consumption
9.227 Intermediate consumption is measured by summing expenditures for items
such as ordinary operational costs, travel costs, allowances paid to expedite work
processes, etc.
■ Value Added
9.228 Local government value added is measured as the sum of compensation
of employees, consumption of fixed capital, and other taxes on production – the
same method employed for comparable central government figures. For the water
service special account and subway public corporations which use the market-output
approach, value added is calculated by subtracting intermediate consumption from
output.
C. Local Government (Education Special Account)
9.229 The output for education special account is obtained by combining
compensation of employees, consumption of �xed capital, other taxes on production
and intermediate consumption using the fiscal execution results of 17 local
educational o�ces.

130 ┃┃ 한국은행
Korean System of National Accounts
D. Social Security Funds and NPIs Controlled by Government
9.230 The estimation methods of output, intermediate consumption, and value
added for social security funds and NPIs controlled by government in the reference
year are basically the same as those for the central government. �e data sources are
the settlement of accounts of each institution, which are shared with the MOSF.
13.3. Estimation Method in Current Year
A. Nominal Value
9.231 The estimation methods of output, intermediate consumption, and value
added at current prices in the current year are the same as those in the reference year.
B. Real Value
Central Government
■ Output
9.232 Constant price estimates of central government output are found by
combining constant price intermediate consumption and constant price value added.
For activities using the market-output approach such as the postal deposit service,
constant price output is calculated by dividing the nominal output by de�ators such as
PPI for the relevant industry.
■ Intermediate Consumption
9.233 Constant price estimates of intermediate consumption for the central
government are calculated by dividing current price intermediate consumption by
intermediate consumption de�ators such as PPI or CPI or output de�ators by relevant
industry.

BANK OF KOREA ┃┃ 131
Ⅲ. Method and Data Sources
■ Value Added
9.234 Constant price estimates of value added are attained by combining
compensation of employees, consumption of fixed capital, and other taxes on
production at constant prices.
9.235 Compensation of employees at constant prices is calculated using the number
of public sector employees and the number of national defense personnel, etc.22)
9.236 Constant price consumption of fixed capital is compiled by the National
Balance Sheet Team using the internationally accepted PIM. Constant price estimates
of other taxes on production are derived by dividing nominal other taxes on
production by an intermediate consumption de�ator. For activities using the market-
output approach such as postal deposit and postal services, constant price value added
is calculated by subtracting constant price intermediate consumption from constant
price output.
Local Government
9.237 The estimation methods of output, intermediate consumption, and value
added at constant prices for the local government are nearly the same as those used to
derive comparable �gures for the central government.
Social Security Funds and NPIs Controlled by Government
9.238 The estimation methods of output, intermediate consumption, and value
added at constant prices for social security funds and NPIs controlled by government
are nearly the same as those used to derive comparable figures for the central
government.
22) The number of public sector employees is estimated from the number of personnel enrolled in public-sector social security schemes.

132 ┃┃ 한국은행
Korean System of National Accounts
13.4. Data Sources
9.239 �e budget summaries and expenditures of central and local governments,
social security schemes, and NPIs controlled by government are used for measuring
general government preliminary estimates in the current year. Estimation of final
general government value in the reference and current year is based on the Settlement
Report of Expenditure Accounts. Detailed data sources are listed in the table below.
Table Ⅲ-9-29 Public Administration, Defense, and Other Government Service Data Sources
Reference Material Institution Responsible Major Contents
National Budget (Central Government Budget)
Ministry of Strategy and Finance Summary of central government budget
Central Government Budget Each agency Budget by detailed item
Fund Management Plan and Attached Papers
Ministry of Strategy and Finance
Fund statuses and management plan details
Settlement Report of Revenue and Expenditure Accounts
Ministry of Strategy and Finance
Settlement of general and special accounts by agency and reasons for changes
Financial Statement for National Debts
Ministry of Strategy and Finance
Borrowed funds, national bonds and acts to which liabilities are borne, debt guarantee certificates
Financial Statement for Changes in Total Amount of State Property
Ministry of Strategy and Finance
Changes and present holdings by account, type and management office
Reserve fund statements Ministry of Strategy and Finance
Statements by detailed items and accounts
Report on the Settlement of Funds
Ministry of Strategy and Finance
Summary of settlements and settlement documents
Local government budget outlines Ministry of the Interior Financial status and total budgets of local
government bodies
Local government budgets Provinces, counties (gun), cities, wards (gu) Detailed local government budgets
Financial Yearbook of Local Government Ministry of the Interior Budgets and settlements by account and
local government body
Local government settlement reports Provinces and cities Detailed settlements of local government
bodies
Annual Local Tax Statistics Report Ministry of the Interior Tax assessments and collection data by
type of tax and local government body
Statistical Yearbook of National Tax National Tax Service By-item tax concepts and tax assessment
and collection status

BANK OF KOREA ┃┃ 133
Ⅲ. Method and Data Sources
Statistical Yearbook of Education
Korean Educational Development Institute
Settlement report of revenue and expenditures for school-supporting associations
Expenditure of the central government
Ministry of Strategy and Finance
Execution results by account, agency and detailed item
Accumulated local government expenditures Ministry of the Interior Budget and expenditures by agency and
item
Accumulated educational expenditures Relevant educational offices Budgets and expenditures by item
Number of national defense personnel Ministry of National Defense National defense average working
strength
Summary of government personnel numbers Ministry of the Interior Number of central and local government
personnel
Number of personnel in social security schemes
Health Insurance Review Agency, National Health Insurance Service, National Pension Service
Number of personnel in social security schemes
Present number of personnel at central, local (including educational) government and social security funds
National Health Insurance Service
Number of personnel at central, local (including educational) government and social security funds subscribing to health insurance
14. Education Services
14.1. Definition and Coverage
9.240 Education services refer to the industry providing educational services that
enable people to acquire knowledge, technology, and skills. The sector is split into
three main divisions:
• Primary educational institutions (including preschools);
• Secondary and advanced educational institutions; and
• Other educational institutions (vocational and technology education
institutions, adult education institutions, etc.).
9.241 Education services can also be sub-divided according to the type of supplier
as follows:

134 ┃┃ 한국은행
Korean System of National Accounts
• National educational institutions;
• Private non-profit educational institutions (non-profit institutions serving
households); and
• Private for-pro�t educational institutions (education service industry).
A. National Educational Institutions
9.242 National educational institutions cover regular educational institutions and
other educational institutions belonging to the general government sector.
B. Private Non-profit Educational Organizations
9.243 Private non-profit educational organizations cover the service activities of
private educational institutions whose objectives are not to achieve pro�t. �ey include:
• Primary educational institutions (including preschools); and
• Middle schools, high schools, and universities.
C. Private For-profit Educational Organizations (Education Service
Industry)
9.244 Private for-profit educational institutions cover the service activities of
various training schools founded with the objective of achieving pro�ts. �ey include:
• Professional training institutions (technology, art, business, etc.);
• General training institutions (art and physical fitness institutes, college
entrance exam preparatory institutions, foreign language academies, etc.);
• Various kinds of consignment training institutions (financial training
institutes, etc.); and
• Individual and group private lessons, home tutoring, and private lessons by
phone or Internet, etc., which are carried out in the absence of a clear place
of business.
BANK OF KOREA ┃┃ 135
Ⅲ. Method and Data Sources
14.2. Estimation Method in Reference Year
9.245 �ere is little di�erence in the estimation methods among the sub-sections in
the education services industry apart from the sources of data.
■ Output
9.246 Estimations of output for education services in the reference year are based
on data from the National Tax Service, the Economic Census from Statistics Korea,
the Annual Report of Educational Statistics, and others.
■ Intermediate Consumption
9.247 Estimates of intermediate consumption for this industry group are calculated
by using input-output tables.
■ Value Added
9.248 Estimates of value added for this industry group are obtained by deducting
intermediate consumption from output.
14.3. Estimation Method in Current Year
A. Nominal Value
■ Output
9.249 The nominal values of output for the education services sector are derived
from data sources such as the Service Industry Survey from Statistics Korea, total
sales data from the National Tax Service, the Annual Report of Educational Statistics,
and so on.

136 ┃┃ 한국은행
Korean System of National Accounts
■ Intermediate Consumption
9.250 �e nominal values of intermediate consumption for this industry group are
obtained by deducting value added from output.
■ Value Added
9.251 �e nominal values of value added for this industry group are calculated by
multiplying output by the value added ratio. �e value added ratio is derived from
the Service Industry Survey and from the financial statements of corporations and
individuals.
B. Real Value
■ Output
9.252 The real values of output for the education services sector are obtained by
dividing the nominal value of output by de�ators using PPI or CPI.
■ Intermediate Consumption
9.253 The real values of intermediate consumption are obtained by deflating
detailed items of nominal intermediate consumption.
■ Value Added
9.254 Real estimates of value added for this industry group are obtained by
using the double-deflation method. In other words, real estimates of value added
are calculated by deducting real estimates of intermediate consumption from real
estimates of output.

BANK OF KOREA ┃┃ 137
Ⅲ. Method and Data Sources
14.4. Data Sources
9.255 There is little difference in the data sources between reference year and
annual estimations for education services. The Service Industry Survey, and data
from the National Tax Service and the Annual Report of Educational Statistics are
commonly used in most education service sub-sections. Other data sources are
outlined in the table below.
Table Ⅲ-9-30 Education Data Sources
Sub-sections Reference Material Institutions Responsible
Private non-profit educational organizations
Numbers of teachers and staff Korea Teachers Pension
Corporate and school expenses accounting data for private universities
Korea Advancing Schools Foundation
Job competency development training status Ministry of Employment and Labor
Private for-profit educational organizations(education service industry)
Private Education Expenditure Survey Statistics Korea
15. Human Health and Social Work Services
15.1. Definition and Coverage
9.256 Human health and social work services are divided into two sections:
• Medical and health care services; and
• Social work activities.
9.257 Medical and health care services cover the following:
• Activities to prevent and cure various diseases to preserve the health of
human beings; and
• Sales of medical supplies based on prescriptions.

138 ┃┃ 한국은행
Korean System of National Accounts
9.258 Social work activities cover work carried out to protect the most vulnerable,
such as children, the elderly, women, and people with disabilities.
A. Medical and health care services (National Institutions)
9.259 Medical and health care services (national institutions) cover the medical
and health activities of the Ministry of Health and Welfare (MOHW), provincial
governments, national institutional hospitals, military hospitals, and public health
centers.
B. Medical and health care services (Non-profit Organizations)
9.260 Medical and health care services (non-profit organizations) include the
activities of privately-established general hospitals and clinics, and health institutions.
C. Medical and health care services (For-profit Industry)
9.261 Medical and health care services (for-profit industry) category includes
privately-established general hospitals and clinics, dental hospitals and clinics,
Oriental medicine hospitals and clinics, maternity hospitals, pathology research
institutions, and other medical practices, as well as the sales of prescription medicine.
D. Social Work Activities (National Institutions)
9.262 The social work activities (national institutions) category includes the
social welfare activities of the MOHW and provincial governments to protect the
most vulnerable in our society, such as children, the elderly, people with disabilities,
women, and the homeless. It also covers the activities of social security funds such as
the National Pension Fund.
BANK OF KOREA ┃┃ 139
Ⅲ. Method and Data Sources
E. Social Work Activities (Non-profit Organizations)
9.263 Social work activities (non-profit organizations) cover the activities of
privately-established non-profit accommodations and non-accommodations
providing welfare facilities. �ey also include social welfare groups o�ering various
social work services to protect vulnerable groups, such as children, the elderly, people
with disabilities, women, and the homeless.
15.2. Estimation Method in Reference Year
9.264 �ere is little di�erence in the estimation methods among the sub-sections in
the human health and social work services sectors apart from data sources.
■ Output
9.265 Output estimates for human health and social work services in the reference
year are based on data from the National Tax Service, the Economic Census from
Statistics Korea, and other complete enumeration data from the Health Insurance
Review and Assessment Service and the Health and Welfare Statistical Year Book.
■ Intermediate Consumption
9.266 Estimates of intermediate consumption for this industry group are calculated
by using input-output tables.
■ Value Added
9.267 Estimates of value added for this industry group are obtained by deducting
intermediate consumption from output.
140 ┃┃ 한국은행
Korean System of National Accounts
15.3. Estimation Method in Current Year
A. Nominal Value
■ Output
9.268 �e nominal values of output for the human health and social work services
sector are obtained from such data sources as the Service Industry Survey, the total
sales data from the National Tax Service, and other complete enumeration data from
the Health Insurance Review and Assessment Service and the Health and Welfare
Statistical Year Book.
■ Intermediate Consumption
9.269 �e nominal values of intermediate consumption for this industry group are
obtained by deducting value added from output.
■ Value Added
9.270 �e nominal values of value added for this industry group are calculated by
multiplying output by the value added ratio. �e value added ratio is derived from
the Service Industry Survey and from the financial statements of corporations and
individuals.
B. Real Value
■ Output
9.271 Real estimates of output for the human health and social work services sector
are obtained by dividing the nominal value of output by de�ators using PPI or CPI.

BANK OF KOREA ┃┃ 141
Ⅲ. Method and Data Sources
■ Intermediate Consumption
9.272 The real values of intermediate consumption are obtained by deflating
detailed items of nominal intermediate consumption.
■ Value Added
9.273 Real estimates of value added for this industry group are obtained by
using the double-deflation method. In other words, real estimates of value added
are calculated by deducting real estimates of intermediate consumption from real
estimates of output.
15.4. Data Sources
9.274 There is little difference in the data sources used to derive reference year
estimates and annual estimates for human health and social work services. The
Service Industry Survey and data from the National Tax Service are commonly used
for most sub-sections of human health and social work services. Other data sources
are provided in Table Ⅲ-9-31.
Table Ⅲ-9-31 Human Health and Social Work Services Data Sources
Sub-sections Reference Material Institution Responsible
Medical and Health Care Services
Total hospital fees by type of medical care institution and establishment type
Health Insurance Review and Assessment Service,National Health Insurance Corporation
Social Work Activities Health and welfare statistical yearbook Ministry of Health and Welfare

142 ┃┃ 한국은행
Korean System of National Accounts
16. Cultural and Other Services
16.1. Definition and Coverage
9.275 Cultural and other services cover arts, sports and recreation related services
and other services. Arts, sports and recreation related services include creative, arts
and entertainment services, sports and amusement services, and travel agency and
related services. Other services cover personal services, maintenance and repair
services, services of membership organizations, and household services. Speci�cally,
this classi�cation includes the activities detailed below.
A. Creative, Arts and Entertainment Services
9.276 Creative, arts and entertainment services include activities related to theater
and music, independent artists, libraries and reading rooms, museums and art
galleries, science halls, zoos, and botanical gardens.
B. Sports and Amusement Services
9.277 Sports and amusement services include sports facilities (golf courses,
swimming pools etc.), professional sporting events, sporting organizations, sporting
operation businesses, performance halls, amusement and theme parks, amusement
centers (karaoke, computer rooms, etc.), and casinos.
C. Travel agency and Related Services
9.278 Travel agency and related services include the provision of various travel-
related services, such as arranging the use of travel-related facilities and proxy for the
conclusion of contracts for domestic and foreign travelers.

BANK OF KOREA ┃┃ 143
Ⅲ. Method and Data Sources
D. Personal Services
9.279 Personal services include:
• Washing and dry cleaning;
• Personal care; and
• Other services for individuals.
9.280 Washing and dry cleaning services include the laundering and delivering
of laundry. Personal care services include haircutting, skin treatments, obesity
treatments, and manicures/pedicures. Other service activities include individual
services that are not included in the above, such as those carried out by funeral
homes, wedding halls, dating agencies, fortunetellers, and personal caregivers.
E. Maintenance and Repair Services
9.281 This industry covers the professional industrial activities involved in
the maintenance and repair of motor vehicles and motorcycles, computers and
communication equipment, and personal and household goods.
F. Membership Organizations
9.282 Membership organizations cover the activities of business, professional
membership, religious, political, labor, and other social organizations.
G. Household Services
9.283 The household services category covers work conducted in the house by
an agent, such as cooking and cleaning. It includes all housework services whether
provided by individually-hired persons or originating from a business designated to
provide such services.

144 ┃┃ 한국은행
Korean System of National Accounts
16.2. Estimation Method in Reference Year
9.284 There is little difference in the estimation methods used among the sub-
sections in the cultural and other services sectors apart from data sources.
■ Output
9.285 Estimation of output for cultural and other services in the reference year is
based on data from the National Tax Service, Economic Census from Statistics Korea,
and other complete enumeration data.
■ Intermediate Consumption
9.286 Estimates of intermediate consumption for this industry group are calculated
by using input-output tables.
■ Value Added
9.287 Estimates of value added for this industry group are obtained by deducting
intermediate consumption from output.
16.3. Estimation Method in Current Year
A. Nominal Value
■ Output
9.288 �e nominal values of output for the cultural and other services sector are
obtained from data sources such as the Service Industry Survey from Statistics Korea,
total sales data from the National Tax Service, and other complete enumeration data.

BANK OF KOREA ┃┃ 145
Ⅲ. Method and Data Sources
■ Intermediate Consumption
9.289 �e nominal values of intermediate consumption for this industry group are
obtained by deducting value added from output.
■ Value Added
9.290 �e nominal values of value added for this industry group are calculated by
multiplying output by the value added ratio. �e value added ratio is derived from
the Service Industry Survey and from the financial statements of corporations and
individuals.
B. Real Value
■ Output
9.291 Real estimates of output for the cultural and other services sector are
obtained by dividing the nominal value output by de�ators using PPI or CPI.
■ Intermediate Consumption
9.292 The real values of intermediate consumption are obtained by deflating
detailed items of nominal intermediate consumption.
■ Value Added
9.293 Real estimates of value added for this industry group are obtained by
using the double-deflation method. In other words, real estimates of value added
are calculated by deducting real estimates of intermediate consumption from real
estimates of output.

146 ┃┃ 한국은행
Korean System of National Accounts
16.4. Data Sources
9.294 In the case of cultural and other services, the basic statistical data sources
used to estimate reference and annual year are the same and the Service Industry
Survey and data from National Tax Service are commonly used in most of the sub-
sections. Other data sources utilized in each sector are provided in Table Ⅲ-9-32.
Table Ⅲ-9-32 Cultural and Other Service Data Sources
Sub-sections Reference Material Institutions Responsible
Creative, arts and entertainment services
Number of national library users National Library of Korea
Status of admission revenue Cultural Heritage Administration
Sports and amusement services
Leisure industry yearbook Korea Leisure Industry Research Institute
Number of spectators and admission revenue
Korea Baseball Organization,Korea Football Association, Korea Basketball Association
Number of golf course visitors Korea Golf Course Business Association
Gambling statistics National Gambling Control Commission
Lottery income and payouts National Lottery Commission
Exchange figures for casinos Casino
Financial statementsKorea Racing Authority, Korea Sports Promotion Foundation, etc.
Membership organizations
Survey of business activities Statistics Korea
Number of labor groups and union members Ministry of Employment and Labor
Expenditure breakdown by political party National Election Commission
Household services
Population census, Agriculture, forestry and fishery survey
Statistics Korea
Household income and expenditure survey Statistics Korea
BANK OF KOREA ┃┃ 147
Ⅲ. Method and Data Sources
17. Taxes on Production and Imports, Subsidies
17.1. Definition and Coverage
9.295 Taxes are money or goods forcibly collected from the general public without
immediate bene�t in order to cover the expenses of national or local governments.
9.296 Table Ⅲ-9-33 shows the system of classification for Korea’s taxes and
subsidies. Taxes on production and imports are divided into taxes on products and
other taxes on production.
9.297 Taxes on products are taxes imposed on goods and services when a producer
produces, sells or imports goods and services. Taxes on products consist of value
added tax, individual consumption tax, and securities transaction tax, etc.
9.298 Other taxes on production are taxes imposed on the ownership or use of
land, buildings, and other assets used in production. Other taxes on production
consist of property tax, stamp tax, etc.
9.299 Subsidies are current unrequited payments that government units make to
enterprises on the basis of the levels of their production activities or the quantities or
values of the goods or services produced, sold or imported. Subsidies are divided into
subsidies on products and other subsidies on production.
9.300 A subsidy on a product usually becomes payable when the good or service
is produced, sold or imported, but it may also be payable when a good is transferred,
leased, delivered, used for own consumption or own capital formation or in other
circumstances. Meanwhile, other subsidies on production consist of subsidies except
subsidies on products that resident enterprises may receive as a consequence of
engaging in production. �is category includes payroll or total workforce subsidies
but not subsidies related directly to products themselves. For reference, current
taxes on income, wealth, etc. are part of secondary income receivable by the general

148 ┃┃ 한국은행
Korean System of National Accounts
government sector and are a component of secondary income payable by other
sectors. And capital taxes, such as inheritance and gi� taxes, are non-recurrent and
required to be paid only when a speci�c or irregular event occurs.
Table Ⅲ-9-33 Structure of Taxes and Subsidies
■ Taxes on production and imports
Taxes on products
Value added taxes
Import taxes
Export taxes
Other taxes on products
Other taxes on production
■ Current taxes on income, wealth, etc.
■ Capital taxes
■ SubsidiesSubsidies on products
Other subsidies on production
17.2. Estimation Method
A. Nominal Value
9.301 Taxes on production and imports are distributed across each industry and
divided into taxes on products (value added taxes, import taxes, and other taxes
on products) by using data on an accrual basis from the government revenue of
the Ministry of Strategy and Finance, and the Ministry of the Interior. Table III-9-
34 outlines the system of classification for Korea’s taxes and their corresponding
classi�cation in the 2008 SNA.
9.302 Subsidies are estimated by adding the items that fall under the subsidies of
national accounts among the current transfers to private accounts. �ey are split into
subsidies on products and other subsidies on production by industry. Related data is
derived from government expenditure reports.
9.303 Meanwhile, net other taxes on production (= other taxes on production
minus other subsidies on production) are included in the value added amounts by

BANK OF KOREA ┃┃ 149
Ⅲ. Method and Data Sources
each industry, which are evaluated at basic prices. Unlike taxes on products, net taxes
on products are announced as an individual item.
B. Real Value
9.304 �e real value of taxes on production, imports, and subsidies are estimated
by multiplying the real output of taxes(subsidies) imposed product by the nominal tax
rate in the previous year.
Table Ⅲ-9-34 Classification of Taxes in Korea
Classification in Korea Classification in the 2008 SNA
National taxes
Internal taxes
Direct taxes
Income tax Current taxes
Corporation tax Current taxes
Inheritance and gift tax Capital taxes
Indirect taxes
Value added tax Taxes on products
Individual consumption tax Taxes on products
Liquor tax Taxes on products
Stamp tax Other taxes on production
Securities transaction tax Taxes on products
Customs dutiesTransportation, energy, environment taxEducation taxSpecial tax for rural developmentComprehensive real estate holding tax
Taxes on productsTaxes on productsTaxes on products, etc.1)
Taxes on products, etc.1)
Other taxes on production
Local taxes
Provincial taxes
Ordinary taxes
Acquisition taxRegistration and license tax
Leisure taxLocal consumption tax
Taxes on productsOther taxes on production, Current taxesTaxes on productsTaxes on products
Objective taxes
Community resource and facility taxLocal education tax
Other taxes on productionTaxes on products, etc.1)
City, county taxes
Inhabitant taxProperty taxAutomobile tax
Tobacco consumption taxLocal income tax
Other taxes on production, current taxesOther taxes on productionOther taxes on production, current taxesTaxes on productsOther taxes on production, current taxes
Notes: 1) Education tax, special tax for rural development tax, and local education tax are divided into taxes on products, other taxes on production, and current taxes according to financial resources.

150 ┃┃ 한국은행
Korean System of National Accounts
Chapter 10: Expenditure Approach
1. Introduction
10.1 Expenditure on GDP shows how income distributed to economic units
is used by the final users. In the circular flow of the national economy, households
o�er enterprises the factors necessary for production, such as labor and capital, and
receive income in return. Deducting net taxes (taxes paid to the government minus
subsidies, unemployment benefits, etc. received from the government) from this
household income leaves disposable income. Households then use disposable income
to purchase goods or increase savings.
10.2 With the operating surplus received as a result of production activity,
enterprises purchase machinery, factory sites and buildings to replace or expand
production facilities. The government builds office buildings and social overhead
capital (SOC), and purchases various goods necessary for administrative purposes
with the taxes received from other economic entities.
10.3 Also, net exports, i.e. exports of goods and services minus imports of goods
and services, constitute external sector expenditures. Anything remaining or lacking
when these expenditures are totaled and compared with GDP from the production
side is noted as changes in inventories and acquisitions less disposal of valuables.
10.4 Combining these components (household consumption, enterprise
investment, government and other public sector purchases, external sector net
exports, and changes in inventories and acquisitions less disposal of valuables)
yields the expenditure on the �nal output produced in the economy, in other words
“expenditures” for gross domestic product (GDP). This is called “national income
from the expenditure side” (GDP = Consumption + Investment + eXports – iMports).
10.5 In the national accounts, the expenditures of various economic units are
sub-classified in accordance with specialized terms such as private consumption

BANK OF KOREA ┃┃ 151
Ⅲ. Method and Data Sources
expenditure, government consumption expenditure, gross fixed capital formation,
exports of goods and services, imports of goods and services, and changes in
inventories and acquisitions less disposal of valuables.
10.6 Each component of the national income is a major macroeconomic index
that shows the economic activity level comprehensively. Such indexes can be used to
inform the decision-making and post-evaluation processes of an economic unit.
10.7 �e composition of the expenditure component of GDP is shown in Table Ⅲ
-10-1.
Table Ⅲ-10-1 Composition of the Expenditure Component of GDP
Classification Composition
Finalconsumptionexpenditure
Privateconsumption
• Final consumption expenditure of households: Final consumption expenditures in the domestic market, Direct purchases abroad by resident households, (-) Direct purchases in the domestic market by non-resident households,
• Final consumption expenditure of NPISHs
Governmentconsumption
Gross fixed capital formation
Facility investment Transport equipment, machinery
Construction investment Buildings, civil engineering
Intellectual property product investment
Research & Development (R&D), other intellectual property products (entertainment, literary and artistic originals, computer software and databases, mineral exploration and evaluation)
Changes in inventories and acquisitions less disposal of valuables
Finished goods, goods in the process of production (work-in-progress), goods for resale, raw materials and suppliers,acquisitions less disposal of valuables
Export of goods and services Export of goods, export of service
(-) Import of goods and services Import of goods, import of service
10.8 �ere are two methods used to compile the composition of expenditure of
GDP: the demand approach method and the supply approach method. In general,
when estimating the share of expenditure on GDP, we do not use just one method but
use both methods depending on the situation of the preliminary data.

152 ┃┃ 한국은행
Korean System of National Accounts
10.9 Most OECD members and other advanced countries generally employ
the demand approach method to estimate household consumption, government
consumption, construction investment, intellectual property product investment,
changes in inventories and acquisitions less disposal of valuables, and the export
and import of goods and services. �ey usually employ the supply approach method
to estimate facility investments. However, the specific characteristics of each item
are what actually determine whether the demand or supply approach method is
used. From 2005 in Korea, the demand approach method has been mostly used for
estimation; while the supply approach method has been used when there is a shortage
of basic data from the demand side, e.g. in the case of facility investment.
10.10 �e supply approach method is the representative indirect estimation method
(e.g. commodity flow method). It discloses how much of the national economy’s
aggregate supply (total output + import) is used for intermediate demand and �nal
demand according to input-output tables.
10.11 To maintain the usefulness of the CFM, input-output tables should accurately
re�ect the current economic situation, but devising actual survey input-output tables
is very time consuming, as there are structural limitations to reflecting the current
economic situation in a timely manner. And when compiling statistics, it is di�cult to
ensure consistency and check the national income from the production side and the
expenditure side independently. Thus international organizations, such as the IMF,
recommend limited use of CFM.
10.12 Demand approach method estimates are based on expenditure survey data
collected from �nal users who directly purchase the �nal output, such as households,
�rms, and the government.

BANK OF KOREA ┃┃ 153
Ⅲ. Method and Data Sources
Commodity Flow Method
The commodity flow method is a method to estimate the share of expenditure on GDP through tracing the process of commodity circulation. It was developed by S. Kuznets and is a representative method with a supply approach. It is mainly used for estimating items for which there is a shortage of demand side basic data such as facility investment or inventories.
The estimating process by the commodity flow method is introduced briefly below.Firstly, domestic gross output is calculated on the production side. Then, total final
demand is derived by adding imports and deducting intermediate consumption and exports. Finally, each expenditure item such as consumption expenditure or investment is calculated by multiplying the total final demand by the weight of each item as delineated from input-output tables in the base year.
Total supply(Gross
domestic output
+ Imports)
– Intermediate consumption – Exports =
Total domestic demand
Final consumption expenditure
Fixed investment
inventories
(Weight on total domestic demand)
Box Ⅲ-10-1
10.13 �ese methods cover non-observed economic activity which is easily missed
when the focus is on production. �ey have a high degree of accuracy because they
are based on recent survey results from related �elds.
10.14 In reference year 2010, most new treatments of the 2008 SNA were adapted
to GDP. First of all, research and development, entertainment, literary and artistic
originals, and weapons systems, which were formally treated as expenditures, were
recorded as gross �xed capital formation.
154 ┃┃ 한국은행
Korean System of National Accounts
10.15 “Intangible �xed assets,” which had already covered computer so�ware and
mineral exploration and evaluation, came also to include research and development,
and entertainment, literary and artistic originals, and was renamed the more
descriptive “intellectual property products.” Expenditures on weapons systems were
also classi�ed as facility investment.
10.16 The recording time of global manufacturing activity shifted from the
physical movement of goods to the actual change in ownership of goods. As a result,
transactions between countries can be recorded with greater accuracy. Furthermore,
reinvested earnings of foreign direct investment were newly recognized in order to
catch the income �ow between economic entities.
10.17 As the role of the general government and the public sector became
increasingly more important after the financial crisis, the public sector category
was clarified and refined, reflecting the 2008 SNA’s classification. Total revenue,
total expenditure, and net lending (borrowing) of the public sector were also newly
introduced for analysis.
10.18 In this chapter, each �nal expenditure item will be introduced in detail.
2. Final Consumption Expenditure
10.19 Final consumption expenditure in the economy may be de�ned as the total
value of all expenditures on goods and services by households, non-pro�t institutions
serving households (NPISHs), and general government units to satisfy their
individual or collective needs and wants.
2.1. Private Consumption Expenditure
A. Definition and Coverage
10.20 Private consumption expenditure consists of the following:
BANK OF KOREA ┃┃ 155
Ⅲ. Method and Data Sources
• Final consumption expenditure of households; and
• Final consumption expenditure of NPISHs.
Final Consumption Expenditure of Households
10.21 Final consumption expenditure of households is the total value of goods
and services purchased by households for the purpose of consumption. However,
not all goods and services purchased by households are recorded under their final
consumption expenditure. For instance, housing purchases for the purpose of own
use are recorded as gross fixed capital formation since a house is not an object of
consumption but a good offering residential service. Secondhand goods purchased
by households are also excluded as they had already been included within household
final consumption expenditure at the time of the original purchase. Conversely,
some goods and services that households did not actually purchase are factored into
their �nal consumption expenditure. Residential service (the imputed rental charge)
produced by a homeowner for the purpose of one’s own final use, for instance,
is included in the final consumption expenditure of households even though the
household did not actually purchase it.
10.22 The 2008 SNA suggests including resident households’ consumption
expenditures overseas among the final consumption expenditure of resident
households. Accordingly, the final consumption expenditure of households is
obtained by calculating �nal consumption expenditures in the domestic market and
adding direct purchases abroad by resident households, and then finally deducting
direct purchases in the domestic market by non-resident households. At the same
time, direct purchases abroad by resident households are recorded as service import,
and direct purchases in the domestic market by non-resident households are recorded
as service export in transactions with the rest-of-the-world.
Final Consumption Expenditure of NPISHs
10.23 Non-profit institutions serving households (NPISHs) refer to institutions

156 ┃┃ 한국은행
Korean System of National Accounts
offering goods and services for free or at economically insignificant prices to their
members or households. NPISHs are non-market producers just like the general
government. Unlike the case with general market producers, for reasons of social and
economic policy NPISHs’ input costs are much higher than the amount (income)
recovered through sales of goods and non-goods. �e di�erence between total input
costs and income from sales is regarded as the �nal consumption expenditure of the
services produced by the producer itself.
Table Ⅲ-10-2 Coverage of Private Consumption Expenditures
Classification Coverage
Final consumptionexpenditure of households
• Final consumption expenditures in the domestic market
[COICOP1) 2)]- Food and non-alcoholic beverages- Alcoholic beverages and tobacco- Clothing and footwear- Housing, water, electricity, gas and
other fuels- Furnishings, household
equipment and routine household maintenance
- Health- Transport- Information and communication- Recreation, sports and culture- Education services- Restaurants and accommodations
services- Miscellaneous goods and services
[Classification of final consumption expenditure of households by type]- Durable goods:
furniture, automobiles, TVs, PCs, etc.
- Semi-durable goods: clothing and footwear, household appliances, etc.
- Non-durable goods: food and beverages, water, electricity, gas and other fuels
- Services
• Direct purchases abroad by resident households
• (-) Direct purchases in the domestic market by non-resident households
Final consumptionexpenditure of NPISHs
[COPNI2)]- Health, recreation and culture, education, social protection, other services
Notes: 1) COICOP: Classification of individual consumption according to purpose. In the 1993 SNA, transactions between producers and the household sector are not sub-divided according to “kind of products” but functionally divided according to the “purpose” of the transaction.
2) Classifications of household consumption adjusted in accordance with the revision to the global standard “Classification of individual consumption according to purpose (COICOP 2018)”
3) COPNI: Classification of the purposes of non-profit institutions serving households.

BANK OF KOREA ┃┃ 157
Ⅲ. Method and Data Sources
B. Recording Time and Evaluation
Recording Time
10.24 Final consumption expenditure of households should be recorded when the
payables are created. �is implies that the expenditure on a good is to be recorded at
the time its ownership changes while expenditure on a service is recorded when the
delivery of the service is completed. Non-monetary transactions are recorded when
the goods involved are made available to the household. However, when a good is
acquired under a hire purchase agreement, financial lease or a similar method of
�nancing, the purchaser accepts the risks and rewards of ownership from the time the
good is delivered. Even though there is no legal change of ownership at this point, it is
assumed that there is a change of economic ownership.
Evaluation
10.25 Final consumption expenditure of households is recorded by the purchaser's
price, including all of the producer's taxes. �e purchaser’s price is the amount that
the buyer must pay to receive one unit of goods at the time and place chosen by
the buyer. This includes any shipping charges that the buyer should pay. And due
to market imperfections, if one household pays a different or discounted price in
connection with a bulk or o�-season purchase, that calculation is entered under actual
price paid. �e purchaser's price does not include any interest or service charges that
may be added when the seller arranges for credit to be provided to the purchaser.
C. Estimation Method in Reference Year
Final Consumption Expenditures in the Domestic Market
10.26 Final consumption expenditures in the domestic market include consumption
by residents and non-residents, and are estimated with data from the Service
Industry Survey, the Household Income & Expenditure Survey, and other sources.
158 ┃┃ 한국은행
Korean System of National Accounts
10.27 Expenditures on most goods and services are estimated by using sales �gures
from the Service Industry Survey and input-output tables. To calculate expenditures
at purchaser prices, sales taxes must be added to Service Industry Survey sales �gures.
10.28 Goods like grain, tobacco, electricity, gas, water supply, and heat energy; and
services like education, communication, health, housing rentals, financial services,
and insurance are estimated by using data from related associations and production-
side estimates of GDP.
Direct Purchases Abroad by Resident Households and Direct Purchases in
the Domestic Market by Non-resident Households
10.29 Direct purchases abroad by resident households and direct purchases in
the domestic market by non-resident households are compiled based on estimates
indicated in the external transaction account. And those estimates are calculated from
Balance of Payments statistics (e.g. travel services and credit card usage).
Final Consumption Expenditure of NPISHs
10.30 The final consumption expenditure of NPISHs is estimated by deducting
commodity and non-commodity sales from the output of non-pro�t institutions as
estimated from GDP using the production approach.
D. Estimation Method in Current Year
Final Consumption Expenditures in the Domestic Market
10.31 The current year nominal value estimation method for final consumption
expenditures in the domestic market is primarily the same as the reference year
method. However, instead of the Service Industry Survey, the Whole and Retail Trade
Survey and the Service Industry Activity Index, etc., are used.

BANK OF KOREA ┃┃ 159
Ⅲ. Method and Data Sources
10.32 �e real value is estimated by dividing the 215 kinds of nominal value that
exist under the COICOP classification system into related deflators such as CPI.
These nominal and real values are added up by COICOP code and then the final
consumption expenditures of households by purpose and by type are obtained.
Direct Purchases Abroad by Resident Households and Direct Purchases in
the Domestic Market by Non-resident Households
10.33 Direct purchases abroad by resident households and direct purchases in
the domestic market by non-resident households are compiled based on external
transaction account estimates. As for de�ators, the exchange rate-adjusted consumer
price index of major travel countries is used for direct purchases abroad by resident
households, and the domestic consumer price index is used for direct purchases in
the domestic market by non-resident households.
Final Consumption Expenditure of NPISHs
10.34 Nominal and real value estimation methods for the final consumption
expenditure of NPISHs are the same as those used for the reference year.
E. Data Sources
10.35 Data for compiling private consumption expenditures are collected from the
sources listed in Table III-10-3.

160 ┃┃ 한국은행
Korean System of National Accounts
Table Ⅲ-10-3 Private Consumption Expenditure Data Sources
Reference Material Institution Responsible
Collection Period Major Contents
Economic Census Statistics Korea Every 5 yearsService industry sales by sub-classes, sales ratio by consumers, etc.
Wholesale and Retail Trade Survey Statistics Korea Following year Sales by industry for the
wholesale and retail sectors
Household Income and Expenditure Survey Statistics Korea Quarterly Household expenditures by
item
Monthly Report of Retail Sales Statistics Korea Monthly Retail sales index by item
Monthly Report on the Index of Services Statistics Korea Monthly Service industry trends by
industry
Automobile StatisticsKorea Automobile Manufacturers Association
Monthly Number of domestic automobile sales
Food Grain ConsumptionSurvey Report Statistics Korea Following year Rate of change in grain
consumption
IR of KT&G KT&G Quarterly Domestic tobacco sales results
Status of Registrations of Imported Automobiles
Korea Automobile Importers & Distributors Association
Monthly Number of imported and registered automobiles
Monthly Report on Major Electric Power Statistics
Korea Electric Power Corporation Monthly Results of electric power
sales for household use
2.2. Government Consumption Expenditure
A. Definition and Coverage
10.36 Within the national accounts, the government, as the producer of
government services, is concurrently producer and consumer. In the 2008 SNA, the
general government is the �nal consumer for its products – with the exception of sales
proceeds it receives for the goods and services produced.
10.37 Government consumption can be divided into two primary components: 1)
“expenditure executed” to supply public administration, maintain national defense,
maintain law and order, maintain public health, and maintain other “free” collective

BANK OF KOREA ┃┃ 161
Ⅲ. Method and Data Sources
services paid by general taxes and other income; and 2) the offering of goods and
services to individual households for free or at economically insignificant prices.
�ese individual services mainly apply to medical treatment, health, education, etc.
10.38 The SNA recommends dividing expenditure into final consumption
expenditure and actual final consumption to avoid ambiguity. Final consumption
expenditure refers to the amount spent by the institutional sector on public-related
goods and services; and actual �nal consumption refers to the value of all goods and
services that are connected to meeting private needs and desires. The concept of
government consumption is the same as that in the government �nal consumption
expenditure. It includes the collective services offered to the whole of society and
individual services offered to individual households. Government actual final
consumption is the value obtained by deducting expenditures (individual services)
from goods and services offered to individual households from government final
consumption expenditure.
10.39 Government final consumption expenditure is the value obtained by
deducting receipts from commodity and non-commodity sales from output
produced by the government plus social security benefits in kind. Receipts from
commodity sales are sales sold to enterprises with prices near to production costs.
This includes licenses and commission fees, inspection fees, and revenues from air
and port transportation. Receipts from non-commodity sales are primarily sales
sold to households. �is service generally is o�ered at the current cost and includes
admission and tuition fees, parking fees, entrance fees, revenues from hospitals, etc.23)
• Government Final Consumption Expenditure= Output (CT) - Receipts from commodity and non-commodity sales
+ Social security benefits in kind
23) Using prices to separate commodities from non-commodities is unreliable. Consequently, sales to industry are labeled “commodities,” and sales to households are labeled “non-commodities.”

162 ┃┃ 한국은행
Korean System of National Accounts
10.40 The reason receipts from commodity and non-commodity sales are
deducted from output produced by the government when calculating government
�nal consumption expenditure is that commodity and non-commodity sales are not
services the government produces for self-consumption but are part of intermediate
consumption and �nal consumption in enterprises and households. In short, within
the national accounts, government consumption applies to the value of goods and
services the government produces for self-consumption only.
10.41 Meanwhile, social security benefits in kind are goods and services offered
by the government to individual households in the form of in kind transfers. The
government purchases these goods and services in the market and offers them to
households
B. Estimation Method in Reference Year
10.42 As stated above, government consumption (government �nal consumption
expenditure) is the value obtained by deducting receipts from commodity and non-
commodity sales from output produced by the government and adding social security
bene�ts in kind to output.
10.43 Government output is calculated by combining value added and intermediate
consumption. Value added is measured as the sum of compensation of employees,
consumption of fixed capital, and other taxes on production; and intermediate
consumption is obtained by combining general operating expenses. Receipts from
commodity and non-commodity sales are calculated sectorally by summing the
revenues from relevant items attained from the report on settlements by central and
local governments and from social security funds and public non-pro�t institutions.
10.44 Social security benefits in kind are estimated by deducting social security
bene�ts paid in cash a�er calculating social security bene�ts through reported social
security fund settlements. Social security bene�ts in kind include payments for health
care from the National Health Insurance Corporation, payments for recuperation

BANK OF KOREA ┃┃ 163
Ⅲ. Method and Data Sources
from the Workmen’s Accident Compensation Insurance, and expenditures for re-
employment education from the Korea Labor Welfare Corporation. According to the
revision, social security bene�ts in kind have been broadened to include payments for
child care, government scholarships and related payments.
C. Estimation Method in Current Year
10.45 �e estimation method for government consumption in the current year is
the same as that used for calculating it in the reference year.
10.46 As with government consumption, constant price output in the current year
is equal to the constant price output for the general government, so the estimation
methods are the same. Receipts from commodity and non-commodity sales at
constant prices are calculated by dividing nominal data by the government's output
deflator; and social security benefits in kind are calculated by dividing nominal
social security bene�ts in kind by the private sector’s de�ators related to health and
educational services.
D. Data Sources
10.47 Data sources used to estimate government consumption in the reference year
and current year are primarily the same as those used to estimate government output.
However, data sources related to receipts from the sale of products and non-products
and social security bene�ts in kind should be added. �e data sources listed in Table
Ⅲ-10-4 are equal to those listed in Table Ⅲ-9-29.

164 ┃┃ 한국은행
Korean System of National Accounts
Table Ⅲ-10-4 Government Consumption Expenditure Data Sources
Reference Material Institution Responsible Major Contents
Yearbook of Local Nontax Receipts Ministry of Interior
Local government general accounts and special accounts nontax receipts
Report of Social Security Fund Settlements
National Health Insurance Service
Social security funds plus related benefits and contributions
3. Gross Capital Formation
3.1. Gross Fixed Capital Formation
A. Definition and Coverage
10.48 Producers construct buildings and/or purchase machinery, vehicles and
other equipment in order to maintain their production capacities and improve
competitiveness. Such acquisitions of machinery and vehicles or construction of
buildings are made from a medium and long-term viewpoint to sustain income
sources. Tangible or intangible assets that are not exhausted during the relevant period
but used repeatedly and continuously for production over many accounting periods
(normally one year or longer) are called “�xed assets” or “capital goods.” In the SNA,
the total value of a producer's net acquisition of �xed assets (acquisition less disposal),
is called “gross �xed capital formation (GFCF)” or “gross �xed investment.”
10.49 Asset acquisition includes not only the purchase of new assets but also the
acquisition of existing assets through purchasing, exchanging, transferring or self-
producing assets. It also includes improvements in existing asset capacity and the
accompanying costs related to transfers of ownership. Conversely, if existing fixed
assets are sold by disposal, exchange and transfer, then gross �xed capital formation
(GFCF) is calculated by the net fixed asset acquisition value (acquisition less
disposals). In the case of asset acquisition by lease, the pro�t and risk from the asset is
actually moved to the lessee, so it is included in GFCF.

BANK OF KOREA ┃┃ 165
Ⅲ. Method and Data Sources
10.50 Among non-�nancial assets, assets that are the objects of GFCF are con�ned
to assets made through production processes. So tangible non-produced assets,24)
such as land, mineral and energy resources, and non-cultivated biological resources
cannot be calculated as GFCF. However, expenditures for capacity improvement, land
enlargement, and soil deterioration prevention, and accompanying expenses such
as commissions and taxes related to ownership transfers of non-produced assets, are
included in GFCF.
B. Classification
10.51 GFCF can be sub-classi�ed into construction investment, facility investment,
and intellectual property product investment by the type of capital good.
10.52 Firstly, the construction investment category is sub-classi�ed into buildings
and civil engineering.
10.53 Buildings are further classi�ed into residential buildings and non-residential
buildings. Residential buildings refer to single and multiple dwellings, including
various types of buildings for residence such as boarding houses. Non-residential
buildings include industrial buildings (such as warehouses and factories), commercial
buildings, government o�ce buildings, schools, hospitals, etc.
10.54 Civil engineering refers to structures including transportation-related social
overhead capital (SOC) facilities, such as roads, railroads and subways, harbors, and
other SOC facilities such as electric power, communication and water supply and
sewage facilities.
10.55 Secondly, facility investment is sub-classi�ed into two categories: transport
equipment (automobiles, airplanes, ships and rolling stock) and machinery (various
machines and equipment used for production facilities in industry). Livestock for
24) These assets are necessary for producing goods and services, but they are assets that are not produced such as land, underground resources (coal, oil, natural gas, and metal and non-metal minerals) and forests and fields.

166 ┃┃ 한국은행
Korean System of National Accounts
breeding, dairy cows for producing milk, and sheep for producing wool are also
included in facility investment. In the 2008 SNA, the “weapons systems” category is
newly included under facility investment and divided into “transport equipment” and
“machinery,” accordingly.
10.56 Thirdly, intellectual property product investment is sub-classified into
research and development (R&D), and other intellectual property products25)
expected to be used for production for one year or more.
Table Ⅲ-10-5 Classification of Gross Fixed Capital Formation by Type of Capital Good
Classification Sub-classification
ConstructionInvestment
Buildings
Residential buildings Single and multiple dwelling buildings
Non-residential buildings
Factories, warehouses, commercial buildings, government office buildings, schools, hospitals, etc.
Civil engineering
Roads(including airfield runways), railroads, subways, harbors, Erosion control and river works, water supply and sewage facilities, agriculture and fishery engineering, city civil engineering, power facilities, chemical plants, etc.
FacilityInvestment
Transport equipment Automobiles, aircraft, ships, rolling stock, etc.
MachineryGeneral equipment, electrical and electronic equipment, precision machinery, other machinery equipment, breeding stock, dairy stock, etc.
Intellectual Property Product Investment
Research and development Research and development(R&D)
Other intellectual property products
Computer software and databases, Entertainment, literary and artistic originals, mineral exploration
C. Record of Gross Fixed Capital Formation (GFCF)
Recording Time
10.57 According to the 2008 SNA, GFCF is recorded when a producer who intends
to use a �xed asset for production receives ownership of the relevant asset.26)
25) Other intellectual property products include computer software and databases, entertainment, literary and artistic originals, and mineral exploration
26) Until ownership is transferred, assets are recorded as inventory.

BANK OF KOREA ┃┃ 167
Ⅲ. Method and Data Sources
10.58 In general, it takes a long period of time for buildings and structures to be
completed. In cases where construction is carried out a�er conclusion of a purchase
contract, ownership is regarded as being transferred in stages, so that the value of
the output that is transferred at each stage is treated as purchaser’s GFCF. In the case
where ownership is not transferred, the structure is recorded as inventory.
Evaluation
10.59 GFCF is evaluated by the amount of net fixed assets acquisition, which
includes the increase in the value of �xed assets made through production activities
during the accounting period. In this case, the price of fixed assets is appraised by
the purchaser's price that includes not only the price of the product itself but also the
trade margin, expenses for transportation and establishment, and ownership transfer-
related expenses (payment fees to engineers, technicians, architects, lawyers, and real
estate brokers; ownership transfer-related taxes, etc.).
10.60 �e purchaser's price means the price that the purchaser pays to acquire one
unit of a good or service at a time and place chosen by the purchaser. �e deductible
value added tax is not included; however, transportation fees that the purchaser paid
on top of the product price are included.
10.61 �us when a used capital asset is traded, the transaction payment does not
a�ect the GFCF of the national economy because it is o�set between the acquiring
enterprise and the relinquishing enterprise. But the costs of ownership transfer are
added to the national economy’s GFCF.
D. Estimation Method in Reference Year
Construction Investment
10.62 The value of reference year construction investment is calculated using
the value of output from construction activities, deducting the values of ordinary

168 ┃┃ 한국은행
Korean System of National Accounts
maintenance and repairs, export and the change in construction inventories, and then
adding accompanying costs.
10.63 Firstly, the baseline value for the assessment of output from construction
activities is the value of construction completed, obtained from the Report on the
Construction Survey conducted by Statistics Korea.
10.64 The value of investment in newly constructed buildings and structures is
obtained by subtracting from the output the value of ordinary maintenance and
repairs, exports and the change in construction inventories. �e stock of construction
inventories, such as unsold houses, and the value of construction investment are
inversely related.
10.65 The purchaser's price-based value of construction investment is obtained
by including accompanying costs. Accompanying costs include costs of ownership
transfers in respect to newly constructed and existing buildings and structures, such
as acquisition taxes and brokerage fees. Agency fees on sales of newly constructed
buildings are also included. �e value of accompanying costs is based on data from
the tax statistics report and on data about the production-side output of the real
estate-related services industry.
Facility Investment
10.66 Facility investment estimates basically follow the commodity �ow method,
which estimates the value of investment according to the disposal process of the
produced commodity.
10.67 Facility investment can be sub-classi�ed into domestic and import facilities.
For domestic facilities, domestic supply by commodity is calculated by deducting the
export value from the output value that is obtained from the Economic Census and
related associations by commodity. Domestic final demand by commodity is then
calculated by deducting the intermediate demand that is obtained from the domestic
transaction table in input-output tables from domestic supply by commodity. This

BANK OF KOREA ┃┃ 169
Ⅲ. Method and Data Sources
domestic final demand is divided into consumption, fixed investment and changes
in inventories. The ratio between consumption, fixed investment and changes in
inventories is obtained from various materials, including input-output tables from the
reference year.
10.68 In the case of import facilities, final import demand by commodity is
calculated by deducting intermediate demand obtained from the import transaction
table of input-output tables from the value of the import. Import facility investment
can then be calculated by applying the �xed investment ratio of input-output tables.
10.69 But domestic and import facilities estimated in this way do not include
accompanying registration and acquisition taxes, trade and transport margins, or
other costs. �erefore, purchaser price-based facility investment can be estimated by
adding the accompanying costs and trade and transport margins obtained from data
compiled in government sectoral tax reports, margins reported in wholesale and retail
industry estimation materials, and reports from other sources.
Intellectual Property Product Investment
10.70 �e value of research and development investment is obtained utilizing data
from the Survey of Research and Development in Korea27) conducted by the Korea
Institute of S&T Evaluation and Planning. Production values of other intellectual
property products are obtained from data gathered by related associations, Statistics
Korea, etc.
10.71 The value of the investment is obtained by utilizing the commodity flow
method after calculating the final demand value by applying the intermediate
consumption ratio from input-output tables to domestic production and import value.
Purchaser price-based intellectual property product investment is then obtained by
adding taxes on products and trade and transport margins.
27) This survey is designed according to the “OECD Proposed Standard Practice for Surveys of Research and Experimental Development: Frascati Manual,” and survey data is modified in accordance with the SNA.

170 ┃┃ 한국은행
Korean System of National Accounts
E. Estimation Method in Current Year
Construction Investment
10.72 Construction investment at current prices for the current year is estimated in
the same way as the reference year. �e value of construction investment in real terms
is also estimated by deducting the real values of ordinary maintenance and repairs,
exports, and the change in construction inventories from the real value of output
from construction activities, and adding real accompanying costs. Each of these real
values is obtained by de�ating values at current prices using PPI, the wage index, and
other relevant price indices.
Facility Investment
10.73 Current year facility investment is also estimated by using the commodity
�ow method, as with reference year facility investment. It is estimated by multiplying
the previous year's facility investment �gure by the current year's year-on-year rate of
increase in supply by facility asset.
10.74 Domestic facility investment is estimated by using the year-on-year rate of
increase in domestic supply that is calculated by deducting the export amount by
commodity from the shipment amount by commodity. �e shipment data is obtained
from the Mining and Manufacturing Survey of Statistics Korea and other reports
by related associations. �e export amount is obtained from Korea Customs Service
statistics. Import facilities are estimated by using the year-on-year rate of increase in
import as indicated in Korea Customs O�ce statistics.
10.75 By adding the accompanying cost and trade and transport margins to these
estimated investment values, the �nal facility investment estimates are obtained.
10.76 The real value is calculated by dividing nominal value by PPI, IPI, and
relevant price indices.

BANK OF KOREA ┃┃ 171
Ⅲ. Method and Data Sources
Intellectual Property Product Investment
10.77 Current year intellectual property product investment is estimated in the
same way as in the reference year. Investment in some products is estimated by
multiplying the previous year’s investment �gure by the year-on-year rate of increase
in domestic supply and import �gures. Firstly, nominal value is estimated and then
the real value is calculated by dividing the nominal value by the relevant price indices.
F. Gross Fixed Capital Formation by Kind of Economic Activity
10.78 GFCF by kind of economic activity is estimated by distributing the total
GFCF value by type of capital goods according to economic activity. The weights
which are used to distribute it by kind of economic activity can be obtained from the
Mining and Manufacturing Survey, Construction Survey, the �nancial statements of
corporations, etc.
G. Data Sources
10.79 �e data sources needed to compile GFCF are given in Table Ⅲ-10-6.

172 ┃┃ 한국은행
Korean System of National Accounts
Table Ⅲ-10-6 Gross Fixed Capital Formation Data Sources
Classification Reference Material Institution Responsible Major Contents
ConstructionInvestment
Construction Survey Statistics KoreaConstruction orders received and the value of construction completed
Service Industry Survey Statistics KoreaInformation of real estate-related service industry
Statistics on Building Permission and Commencement Works
Ministry of Land, Infrastructure and Transport
Building permission and commencement works
Input-Output Tables Bank of Korea Intermediate demand ratio, investment ratio
Government Settlement Report
Ministry of Economy and Finance; Ministry of the Interior and Safety
Budget spending of governments by economic purpose
Producer Price Index Bank of Korea Price index by commodity
Export & Import Price Index
Bank of Korea Price index by commodity
Facility Investment
Economic Census,Mining and Manufacturing Survey
Statistics Korea Output, shipment value by commodity
Customs Clearance-based Export and Import
Korea Customs Service Export/import volume and value
Monthly Automobile Statistics
Korea Automobile Manufacturers Association
Basic data on automobile investment
Aircraft Registration StatusMinistry of Land, Infrastructure and Transport
Aircraft registration
Input-Output Tables Bank of Korea Intermediate demand ratio, investment ratio
Producer Price Index Bank of Korea Price index by commodity
Export & Import Price Index
Bank of Korea Price index by commodity
Intellectual Property Product Investment
Survey of Research and Development in Korea
Korea Institute of S&T Evaluation and Planning
Research and development expenditure by sector
Information & Communication Technology Survey
Ministry of Science and ICT
Software production
Economic Census,Service Industry Survey
Statistics KoreaSoftware and other industry production statistics
Content Industry StatisticsMinistry of Culture, Sports and Tourism
Expenditure related to entertainment, literary and artistic original works
Status & Insight : Korean Film Industry
Korean Film Council Film production
Foreign Exchange Receipts and Payments
Bank of KoreaExport/import value of intellectual property products

BANK OF KOREA ┃┃ 173
Ⅲ. Method and Data Sources
3.2. Changes in Inventories and Acquisitions Less Disposal of Valuables
A. Definition and Coverage
10.80 Inventories in the economic account refer to goods which each industry
(producer) possesses prior to further processing (i.e. production) or sale at a certain
time.
10.81 Gross capital formation is measured by the total GFCF value, and changes
in inventories and acquisitions less disposal of valuables. Changes in inventories are
included because inventories are stored for future consumption.
10.82 Changes in inventories take place during certain time periods. In other
words, inventories are known as stock variables, and changes in inventories – i.e.
stock-building – are considered �ow variables. �e main components of inventories
are as follows: materials and supplies, works-in-progress, �nished goods, and goods
for resale. �ey are measured by the value of the entries into inventories less the value
of withdrawals and less the value of any recurrent losses of goods held in inventories
during the accounting period.
10.83 Changes in inventories cover not only inventories possessed by producers,
but also changes in inventories in the process of distribution, changes in forest tree
growth amounts in arti�cial forestation areas, and changes in unsold houses whose
ownership has not been transferred. However, changes in natural assets where
ownership cannot be exercised and changes in inventories possessed by consumers
(households) are excluded.
10.84 Inventory changes are classified by agricultural and non-agricultural
inventories, with the latter subdivided into materials and supplies, works-in-progress,
�nished goods, and goods for resale.
10.85 Acquisitions less disposals of valuables (precious metals and stones, antiques
and other art objects, other valuables) are items that are not used primarily for
174 ┃┃ 한국은행
Korean System of National Accounts
production or consumption and are expected to appreciate or at least not to decline
in real value, that do not deteriorate over time in normal conditions, and that are
acquired and held primarily as stores of value.
10.86 Due to these characteristics, it is difficult to treat them as GFCF or
intermediate consumption. In the 2008 SNA, it is recommended that they are
recorded in the capital account.
B. Estimation Method
10.87 Changes in book value of mining and manufacturing inventories are
estimated using the Service Industry Census, the Mining and Manufacturing Survey,
�nancial statements from the National Tax Service, and others.
10.88 Real changes in inventories are estimated by deducting the real inventory
level at the beginning of the period (inventory book values divided by price index
at the beginning of the period) from the real inventory level at the end of the period
(inventory book value divided by price index at the end of the period).
10.89 Di�erent price indices are used depending on the types of inventories. PPI
is used for finished goods and works-in-progress inventories in the mining and
manufacturing industries. PPI and CPI are used for inventories of goods for resale
in the wholesale and retail industries. The housing price index is used for housing
inventory in the construction sector. PPI and the import price index are used for
material inventory.
10.90 Holding gains (or losses) for inventory value adjustment are calculated by
subtracting changes in value at current prices (based on National Accounts standards)
from changes in book value (based on business accounting standards).
10.91 Inventory valuation adjustment is required to accurately reflect current
economic status. It is assumed that many enterprises in Korea use first-in first-out

BANK OF KOREA ┃┃ 175
Ⅲ. Method and Data Sources
(FIFO), which implies goods are withdrawn in the same order as they are entered. But
an exception is crude oil since its price is so volatile; it is therefore estimated by the
average cost method.
10.92 Inventories of crude oil are directly estimated using information from the
Korea National Oil Corporation. Inventories of buildings are estimated by obtaining
data on unsold buildings.
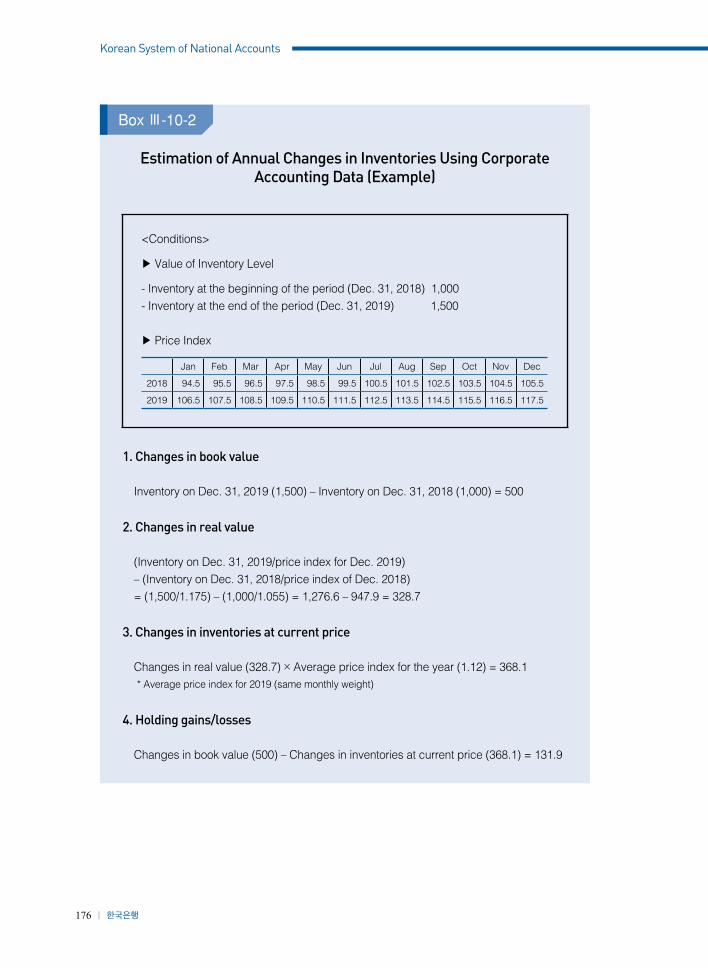
176 ┃┃ 한국은행
Korean System of National Accounts
Estimation of Annual Changes in Inventories Using Corporate Accounting Data (Example)
<Conditions>
▶ Value of Inventory Level
- Inventory at the beginning of the period (Dec. 31, 2018) 1,000- Inventory at the end of the period (Dec. 31, 2019) 1,500
▶ Price Index
Jan Feb Mar Apr May Jun Jul Aug Sep Oct Nov Dec
2018 94.5 95.5 96.5 97.5 98.5 99.5 100.5 101.5 102.5 103.5 104.5 105.5
2019 106.5 107.5 108.5 109.5 110.5 111.5 112.5 113.5 114.5 115.5 116.5 117.5
1. Changes in book value
Inventory on Dec. 31, 2019 (1,500) – Inventory on Dec. 31, 2018 (1,000) = 500
2. Changes in real value
(Inventory on Dec. 31, 2019/price index for Dec. 2019)– (Inventory on Dec. 31, 2018/price index of Dec. 2018)= (1,500/1.175) – (1,000/1.055) = 1,276.6 – 947.9 = 328.7
3. Changes in inventories at current price
Changes in real value (328.7) × Average price index for the year (1.12) = 368.1 * Average price index for 2019 (same monthly weight)
4. Holding gains/losses
Changes in book value (500) – Changes in inventories at current price (368.1) = 131.9
Box Ⅲ-10-2
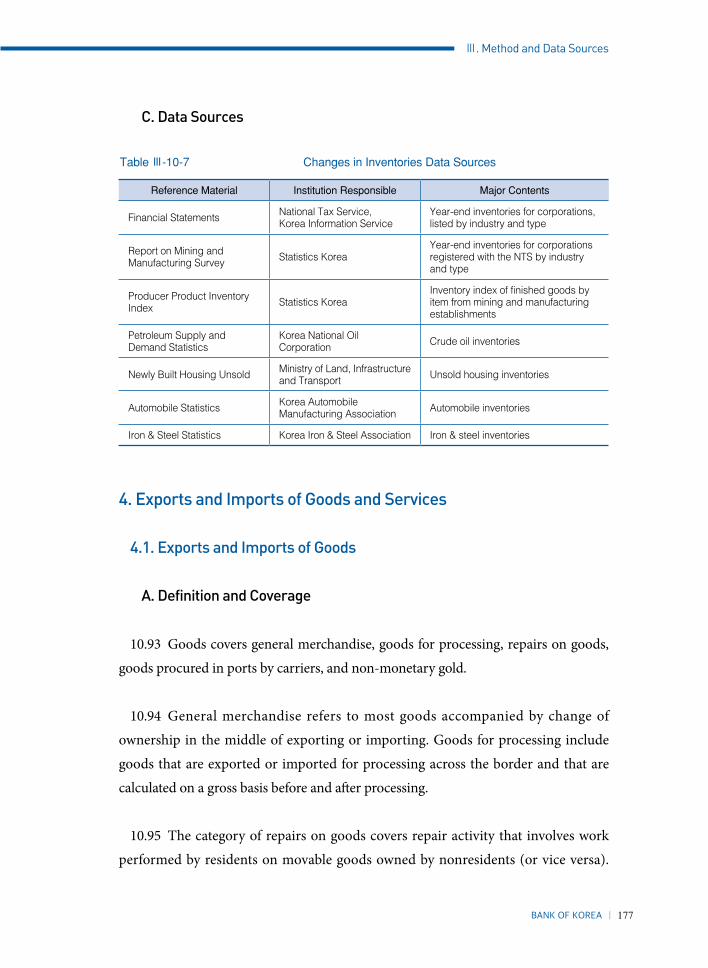
BANK OF KOREA ┃┃ 177
Ⅲ. Method and Data Sources
C. Data Sources
Table Ⅲ-10-7 Changes in Inventories Data Sources
Reference Material Institution Responsible Major Contents
Financial Statements National Tax Service,Korea Information Service
Year-end inventories for corporations, listed by industry and type
Report on Mining and Manufacturing Survey Statistics Korea
Year-end inventories for corporations registered with the NTS by industry and type
Producer Product Inventory Index Statistics Korea
Inventory index of finished goods by item from mining and manufacturing establishments
Petroleum Supply and Demand Statistics
Korea National Oil Corporation Crude oil inventories
Newly Built Housing Unsold Ministry of Land, Infrastructure and Transport Unsold housing inventories
Automobile Statistics Korea Automobile Manufacturing Association Automobile inventories
Iron & Steel Statistics Korea Iron & Steel Association Iron & steel inventories
4. Exports and Imports of Goods and Services
4.1. Exports and Imports of Goods
A. Definition and Coverage
10.93 Goods covers general merchandise, goods for processing, repairs on goods,
goods procured in ports by carriers, and non-monetary gold.
10.94 General merchandise refers to most goods accompanied by change of
ownership in the middle of exporting or importing. Goods for processing include
goods that are exported or imported for processing across the border and that are
calculated on a gross basis before and a�er processing.
10.95 The category of repairs on goods covers repair activity that involves work
performed by residents on movable goods owned by nonresidents (or vice versa).

178 ┃┃ 한국은행
Korean System of National Accounts
Examples of such goods are ships, aircra�, and other transportation equipment. �is
is differentiated from goods for processing in that it is counted only for the repair
value.
10.96 Goods procured in ports cover goods (e.g., fuels, provisions, stores, and
supplies) procured by resident or nonresident carriers abroad or in the compiling
economy.
10.97 Non-monetary gold covers exports and imports of all gold not held as reserve
assets (monetary gold) by the authorities. Non-monetary gold is treated as any other
commodity and, when feasible, is subdivided into gold held as a store of value and
other (industrial) gold.
B. Estimation Method in Reference Year
10.98 �e price of exported or imported goods can be evaluated on an FOB basis
and recorded when its ownership is transferred to nonresidents (or vice versa). Trade
statistics are needed to convert on a change of ownership basis as recommended
by the SNA because export and import data are discerned at the time goods clear
customs. �is entails that re-export and re-import are extracted from customs data
respectively and smuggled goods should be added (coverage adjustment). In addition,
some customs clearance statistics such as ships exports should be calculated by adding
or subtracting in accordance with the transfer of ownership (timing adjustment).
10.99 Customs clearance-based import statistics should be converted to a Free
on Board (FOB) basis by deducting freight and insurance charges, which should be
counted as a service import if it is a transaction between residents and nonresidents.
10.100 �e average exchange rate weighted by the daily trade value is applied to the
dollar-denominated nominal export import data so as to convert them to the won-
denominated data.

BANK OF KOREA ┃┃ 179
Ⅲ. Method and Data Sources
C. Estimation Method in Current Year
10.100 Current-year methodology is primarily the same as that used for reference-
year calculations.
10.101 Some real export or import data can be extrapolated for some items through
volume records kept in customs clearance statistics, i.e. mineral fuel, energy, steel and
iron whose quality rarely varies (volume extrapolation method). Alternatively, real
data can be derived by dividing nominal export or import by each export or import
price index, which is established especially for machinery, electronic products and
motor vehicles (price de�ation method). In addition, the nominal value of aircra� is
converted into real value through the trade partner's product price indices.
D. Data Sources
Table Ⅲ-10-8 Export and Import of Goods Data Sources
Reference Material Institution Responsible Major Contents
Custom clearance statistics Korea Customs Service Amounts of exports and imports of goods by commodity types
Transactions between North and South Korea Korea Customs Service Amounts of transactions on by
commodity types
Balance of payment (BOP) The Bank of KoreaExports and imports of goods and services by volume, compiled in accordance with BOP
Exported and imported goods prices The Bank of Korea Exported and imported goods prices
by commodity types
4.2. Exports and Imports of Services
A. Definition and Coverage
10.102 �e service sector includes transportation and communication, insurance,
miscellaneous services, direct purchases in domestic market (abroad) by non-
residents (residents) household, and by extraterritorial bodies (government).

180 ┃┃ 한국은행
Korean System of National Accounts
Transportation and Communication Services
10.103 Transportation services cover all transportation services that are performed
by residents of one economy for those of another and that involve the carriage of
passengers, the movement of goods, rentals of carriers with crew (by sea, air, land,
internal waterways, or pipelines) and related supporting and auxiliary services.
10.104 Communications services cover transactions between residents and
nonresidents in international communications be it postal and courier services,
telecommunications, or other types of transmission. Related repair and maintenance
are also included.
Insurance Services
10.105 Insurance services encompass the provision of various types of insurance
to nonresidents by resident insurance enterprises, and vice versa. Such services cover
freight insurance, other types of direct insurance (such as life, non-life insurance) and
reinsurance.
Miscellaneous Services
10.106 Miscellaneous services cover construction; financial; computer and
information services; royalties and license fees; other business services; and personal,
cultural and recreational services.
Construction Services
10.107 Construction services cover work performed on construction projects
and installations by employees of an enterprise in locations outside the economic
territory of the enterprise. Projects carried out by foreign subsidiaries or branches of
enterprises (direct investors) and certain site offices are not included because such
projects are part of the production of the host economy.

BANK OF KOREA ┃┃ 181
Ⅲ. Method and Data Sources
Financial Services
10.108 Financial services cover financial intermediary and auxiliary services
conducted between residents and nonresidents. Included are intermediary service
fees, such as those associated with letters of credit, bankers' acceptances, lines of credit,
�nancial leasing, and foreign exchange transactions. Also included are commissions
and other fees related to transactions in securities-brokerage, placements of issues,
underwriting and other hedging instruments.
Computer and Information Services
10.109 Computer and information services cover computer data and news-related
service transactions between residents and nonresidents. Included are data bases
(such as development, storage, and online time series) and maintenance and repair of
computers and peripheral equipment.
Royalties and License Fees
10.110 Royalties and license fees cover the exchange of payments and receipts
between residents and nonresidents for the authorized use of intangible, non-
produced, non-financial assets and proprietary rights (such as patents, copyrights,
trademarks, industrial processes, franchises, etc.) and for the use of produced
originals or prototypes (such as manuscripts and �lms).
Other Business Services
10.111 Other business services cover various categories, other than those previously
de�ned, of service transactions between residents and nonresidents. Merchanting and
other trade-related services, operating leases, miscellaneous business, professional
and technical services are included in this category.

182 ┃┃ 한국은행
Korean System of National Accounts
Cultural and Recreational Services
10.112 Cultural and recreational services cover expenditures related to the
production of �lms or videos, radio and television programs, and musical recordings;
the operation of libraries, museums and other cultural venues; and sports-related
activities.
Direct Purchases in Domestic Market (Abroad) by Non-resident (Resident)
Households
10.113 Direct Purchases in Domestic Market (Abroad) by Non-resident (Resident)
Households in the national accounts primarily correspond to goods and services
acquired within an economy by recreational travelers during visits of less than one
year and recorded under the Balance of Payments. International students and patients
who remain residents are excluded from this category even though the total period
of residence is over one year. Business travel is not included in this category. Instead,
the value spent on business travel is treated as intermediate inputs, thus classi�ed as
miscellaneous services item.
Direct Purchases in Domestic Market (Abroad) by Extraterritorial Bodies
(Government)
10.114 Direct Purchases in Domestic Market (Abroad) by Extraterritorial Bodies
(Government) relate to the government services in the Balance of Payments. Included
are all transactions by non-resident embassies, consulates, military units, and defense
agencies located within an economy. These transactions comprise expenditures
on goods and services, such as office supplies, furnishings, utilities, operation and
maintenance of o�cial vehicles, and o�cial entertainment.
B. Estimation Method
10.115 The respective values of exports and imports of services are based on

BANK OF KOREA ┃┃ 183
Ⅲ. Method and Data Sources
receipts and payments in the Balance of Payments. �e Export (Import) of Services-
weighted average exchange rate is used to convert the dollar-denominated values into
Korean won.

184 ┃┃ 한국은행
Korean System of National Accounts
Chapter 11: Income Approach
1. Outline of Income Approach
11.1 �e income account reveals how value added derived from the production
account is distributed and used by institutional units. The account consists of the
primary and secondary distributions of the income account, the redistribution of
income in kind account, and the use of income account.
11.2 �e primary distribution of income account shows how gross value added is
distributed to labor, capital, and government, and �ows to and from the rest-of-the-
world. �is account contains the generation of income account and the allocation of
primary income account.
11.3 The secondary distribution of income account covers redistribution of
income through current transfers between each institutional sector. �e redistribution
of income in kind account shows transfers in kind, such as public education or health
services provided to households by the government or NPISHs. �e use of income
account delineates how each institutional sector uses their disposable income for �nal
consumption expenditures and saving.
2. Concept of Income Components
11.4 The income account contains non-financial corporations, financial
corporations, general government, households and NPISHs, and the rest-of-the-world
as institutional sectors.
A. Compensation of employees
11.5 Compensation of employees is de�ned as the total remuneration in cash or
in kind payable by an enterprise to an employee in return for work performed during
the accounting period. �e unpaid voluntary workers of unincorporated enterprises

BANK OF KOREA ┃┃ 185
Ⅲ. Method and Data Sources
owned by a member of the workers’ own household are excluded from the count.
Compensation of employees is composed of wages and salaries in cash or in kind and
the employer's social contributions.
11.6 Employers’ social contributions consist of two types – employers’ actual
contributions to social insurance schemes; and employers’ imputed contributions.
First, the actual contributions by employers to social insurance schemes are social
contributions payable by employers to social security schemes or other employment-
related schemes to secure social benefits for their employees. Second, in some
situations where employers provide non-pension benefits themselves directly to
their employees or family members without involving an insurance enterprise or
autonomous pension fund or special fund, these remunerations shall be imputed for
such employees equal in value to the amount of social contributions.
11.7 As employers’ actual social contributions are made for the benefit of their
employees, that amount is first recorded in the generation of income account as
a component of compensation of employees, and then recorded in the secondary
distribution of income account as being transferred by households to social security
funds or other employment-related social insurance schemes, as the case may be.
11.8 �e amounts of employers’ imputed contributions ought to be based on the
actuarial schemes that insurance companies determine the level of premiums charged
for similar insurance contracts. As is the case with the employers’ actual social
contributions, this imputed social contribution is also �rst recorded in the generation
of income account as a component of compensation of employees, and then recorded
in the secondary distribution of income account as being paid to employers by
employees.
B. Operating Surplus and Mixed Income
11.9 Operating surplus and mixed income are surpluses that are made in the
process of production and are also defined as income prior to deducting explicit

186 ┃┃ 한국은행
Korean System of National Accounts
and implicit interest or rent on financial assets, lands, and other non-produced
assets needed in production activities. In addition, operating surplus and mixed
income are the balancing items of the income generation account and are calculated
by deducting compensation of employees and net taxes on production and import
from net value added. Mixed income is accrued to households in which the owners
of unincorporated enterprises or members of the same household may contribute
unpaid labor inputs. Because mixed income implicitly contains an element of
remuneration for work done by the owner or other members of the household, it
cannot be separately identi�ed from the return to the owner as entrepreneur.
C. Property Income
11.10 Property income is de�ned as a reward for lending �nancial or tangible non-
produced assets. Property income accrues when the owners of financial assets and
natural resources put them at the disposal of other institutional units of production.
�e income payable for the use of �nancial assets is called “investment income,” while
the income payable for the use of a natural resource is referred to as “rent.” Property
incomes are divided by interest, dividends, and withdrawals from income of quasi-
corporations, reinvested earnings on foreign direct investment, and investment
income disbursements and rent.
11.11 Interest is a form of income that is receivable by the owners of certain kinds
of �nancial assets – which include deposits, debt securities, loans, and other accounts
receivable – in return for putting the financial asset at the disposal of another
institutional sector. And the amounts of interest in the income account, paid by
borrowers to �nancial corporations, are less than actual payments by the estimated
values of the charges payable (FISIM), while the amounts of interest in the income
account, receivable by depositors to financial corporations, are higher than actual
receipts by the amount of the service charge payable (FISIM).
11.12 Dividends are a form of investment income to which shareholders become
entitled as a result of placing funds at the disposal of a corporation. Although

BANK OF KOREA ┃┃ 187
Ⅲ. Method and Data Sources
dividends may occasionally take the form of an issue of shares, this form is not
included in the dividends that the SNA defines, because the issues of bonus shares
simply represent a reclassification between own funds, reserves, and undistributed
pro�ts.
11.13 Withdrawal of income from a quasi-corporation consists of that part
of distributable income that the owner withdraws from the quasi-corporation,
analogous to the income withdrawn from corporations by paying out dividends to
their shareholders. Withdrawals of income from a quasi-corporation are calculated by
deducting from operating surplus any interest, investment income disbursements and
rent payable, and adding property incomes receivable, not including withdrawals of
funds realized by the sale or disposal of the quasi-corporation’s assets, such as the sale
of inventories, �xed assets, land or other non-produced assets.
11.14 Reinvested earnings on foreign direct investment, as imputed retained
earnings, are equal to the earnings arising from residents’ foreign direct investment
or non-residents’ domestic direct investment attributable to investment fund
shareholders, less the dividends payable or withdrawal of income from the
corporation or quasi-corporation. Reinvested earnings are treated as if they were
distributed and remitted to foreign direct investors in proportion to their ownership
of the equity of the enterprise and then reinvested by them by means of additions to
equity in the �nancial account.
11.15 Investment income on technical reserves and pension entitlements, such as
interests or dividends, is treated as income attributable to the policyholders.
11.16 Rent is the income receivable by owners of natural resources leased to other
units. The SNA demonstrates the distinction between rent and rentals, with rent
considered a form of property income and rentals treated as sales or purchases of
services. �e Bank of Korea currently estimates the rent on land only.

188 ┃┃ 한국은행
Korean System of National Accounts
D. Taxes Less Subsidies on Production and Imports
11.17 Taxes on production and imports are taxes that are levied on the production,
sale and use activities of goods and services. Subsidies on production and imports are
one-way current transfers from government to enterprises without a corresponding
transaction in proportion to the quantity or value of goods and services produced or
imported.
E. Social Contributions
11.18 Social contributions are actual or imputed social contributions paid
by employers or employees to sustain social insurance schemes such as social
security funds. Social contributions consist of employers’ actual and imputed social
contributions, and households’ social contributions. Actual social contribution
in Korea includes national pension, health insurance, unemployment insurance,
industrial accident insurance, government employees’ pension, military personnel
pension, teachers’ pension, and retirement pension. And imputed social contributions
in Korea include retirement pay and other bene�ts, etc.
F. Social Benefits
11.19 Social benefits are current transfers received by households provided in
certain situations, such as in cases of sickness, unemployment or retirement. �ey are
divided into social security bene�ts in cash, other social insurance bene�ts, and social
assistance bene�ts in cash.
11.20 Social security bene�ts in cash are social insurance bene�ts payable in cash
to households by social security funds. The benefits are divided between pension
(national pension) and non-pension (unemployment insurance, industrial accident
insurance) benefits. Other social insurance benefits are social benefits payable by
social insurance schemes other than social security to contributors to the schemes,
their dependents or survivors. �e bene�ts are divided between pensions (government

BANK OF KOREA ┃┃ 189
Ⅲ. Method and Data Sources
employees’ pension, military personnel pension, teachers’ pension, and retirement
pension) and other bene�ts (retirement pay, etc.). Social assistance bene�ts in cash are
current transfers payable to households by the government sector to meet the same
needs as social insurance bene�ts but which are not made under a social insurance
scheme requiring participation usually by means of social contributions.
11.21 Meanwhile, health insurance, a social contribution, is treated as a social
transfer in kind provided to households by the general government.
G. Other Current Transfers
11.22 Other transfers consist of all current transfers between resident institutional
units, or between resident and non-resident units, other than current taxes on
income, wealth, etc., social contributions and bene�ts and social bene�ts in kind, and
other miscellaneous current transfers.
11.23 Non-life insurance policies provide coverage against various events or
accidents resulting in damage to goods or property or harm to persons as a result
of natural or human causes (e.g. fires, floods, accidents, sickness, etc.). Insurance
policyholders pay premiums to obtain insurance coverage during the accounting
period.
11.24 Service charges are provided to the insurance corporation by insurance
policyholders, and net insurance premiums are insurance policyholders’ shares of the
amounts payable to them by the insurance corporation for settlement of damages.
Therefore, service charges constitute purchases of services by the policyholders
and are recorded as intermediate or �nal consumption, as appropriate. Net non-life
insurance premiums constitute current transfers and are recorded in the secondary
distribution of income account. Non-life claims are also recorded as current transfers
to policyholders.
11.25 Other current transfers not elsewhere classi�ed consist of current transfers

190 ┃┃ 한국은행
Korean System of National Accounts
other than insurance-related premiums and claims, current transfers within the
general government and current international cooperation, fines and penalties,
current transfers to NPISHs (membership dues, subscriptions, voluntary donations,
etc.), current transfers between households, and compensation payments.
H. Social Transfers in Kind
11.26 Social transfers in kind are de�ned as goods and services that the government
or NPISHs provide households as a form of transfer in kind.
I. Balance of Primary Income
11.27 Primary income is income that accrues to institutional units as a consequence
of their involvement in the processes of production or ownership of assets that may
be needed for the purpose of production. Balance of primary income is calculated
by summing compensation of employees, operating surplus, taxes less subsidies on
production and import, and net property income.
J. Disposable Income and Adjusted Disposable Income
11.28 Disposable income is defined as income available for consumption or
investment expenditure activities per institutional unit. Adjusted disposable income is
calculated to add social transfers in kind to disposable income.
K. Adjustment for the Change in Net Equity of Households in Pension
Funds
11.29 Because private pension fund reserves are a collective possession of
households, pension benefits and payments should be regarded as the acquisition
and disposal of �nancial assets. But these are recorded as current transfers to avoid
confusion caused by the di�erent recording manner used for public pension funds. So
to calculate savings correctly, these should be adjusted to household savings.

BANK OF KOREA ┃┃ 191
Ⅲ. Method and Data Sources
L. Savings
11.30 Savings are calculated to deduce final consumption expenditures from
disposable income and serve as a source of future consumption or investment.
3. Estimation Method
A. Generation of Income Account
11.31 Compensation of employees, operating surplus, other taxes on production,
other subsidies on production, and consumption of �xed capital, resulting from the
production account, are all recorded in the uses of each institutional sector. Gross
domestic product at basic prices is recorded in the resources of each institutional
sector. However, taxes less subsidies on products is only recorded in the total economy
sector, not the separate institutional sector.
B. Allocation of Primary Income Account
11.32 Compensation of employees from the production account and net
compensation of employees from the rest-of-the-world account are recorded in the
household and NPISHs sector, while the uses and resources for the rest-of-the-world
come from the external transaction account.
11.33 �e total operating surplus generated in the production account is divided
into the sources of each institutional sector. The data for distribution come from
�nancial statements by business type, provided by the National Tax Service (NTS).
11.34 Taxes on production and imports and subsidies come from the production
account and constitute a source for government expenditure.
11.35 Data for property income come from NTS’ �nancial statements by business
type, the final accounts provided by financial corporations, financial statement

192 ┃┃ 한국은행
Korean System of National Accounts
analyses, estimates from the government account, and estimates from the external
transaction account, etc.
C. Secondary Distribution of Income Account
1) Current Taxes on Income, Wealth, etc.
11.36 Current taxes on income, wealth, etc., are derived from the government
section and constitute sources of the government sector and are divided into the uses
of other institutional sectors.
2) Social Contributions
11.37 Social contributions related to the national pension, health insurance,
unemployment insurance, industrial accident insurance, government employees’
pension, military personnel pension, and teachers’ pension are considered
transactions between the government and the household and NPISHs sector,
and are recorded as resources of the government and uses of the household and
NPISH sector. Social contributions related to retirement pension are considered
transactions between �nancial corporations and the household and NPISHs sector,
and are recorded as sources of financial corporations and as uses of the household
and NPISHs sector based on data from the Financial Supervisory Service. Data for
employers’ imputed social contributions derive from NTS and estimates from the
government account.
3) Social Benefits
11.38 Social security bene�ts in cash come from the government account and are
recorded as uses in the government sector and as resources of the household and
NPISHs sector.
11.39 Other social insurance benefits come from the government account and

BANK OF KOREA ┃┃ 193
Ⅲ. Method and Data Sources
retirement pension data.
11.40 Social assistance benefits in cash are compiled by classifying government
�nancial reports and are recorded as uses of the government sector and resources of
the household and NPISHs sector.
4) Other Current Transfers
11.41 Net non-life insurance premiums and claims come from the annual bulletins
of insurance and so on. The total amount is divided into each institutional sector
referring to the related insurance type: i.e. fire, automobile, marine, guarantee,
casualty insurance, etc. Data from the government account and external transaction
account are also used for each sector.
11.42 Other current transfers n.e.c. related to residents are estimated by using data
from �nancial statements by business type (from NTS), the household survey (from
Statistics Korea), and estimated data from the government account.
C. Redistribution of Income in Kind Account
11.43 Government consumption for health, recreation, culture and religion,
education and social protection are accounted for as social transfers in kind and
recorded as uses of the government sector and as resources of the household and
NPISHs sector.
11.44 Consumption by NPISHs is considered social transfers in kind by NPISHs
and is recorded as uses and resources of the household and NPISHs sector.
D. Uses of the Income Account
11.45 Final consumption of the government and household and NPISHs
sectors come from the government account and private consumption expenditure,

194 ┃┃ 한국은행
Korean System of National Accounts
respectively. Actual consumption of the government and household and NPISHs
sectors is calculated by adjusting social transfers in kind in final consumption.
Adjustments for the change in net equity of households in pension funds is the
di�erence between social contributions and bene�ts.
4. Data Sources
�e primary data sources for the income account are listed in the table below.
Table Ⅲ-11-1 Income Account Data Sources
Reference Materials Institution Responsible
Consolidated Accounts for the Nation, Product Accounts by Institutional Sectors, External Transactions, estimates from government account, estimates from finance & insurance and real estate & leasing industries
Bank of Korea
Financial statement analyses Bank of Korea
Flow of funds (Financial assets and liabilities) Bank of Korea
Financial statements (Corporations and individual businesses) National Tax Service
Statistical Yearbook National Tax Service
Financial statements (life and non-life insurance corporations) Insurance Corporations, etc.
Population and Housing Census, Household Survey, Farm/Fishery Household Economy Survey, Census of Agriculture, Forestry and Fisheries, Transportation Survey, Construction Survey
Statistics Korea
Annual bulletins of property insurance Korea Insurance Development Institute
Balance sheets (Financial corporations, retirement pension) Financial Supervisory Service


BANK OF KOREA ┃┃ 197
Ⅳ. Tables and Principal Indicators
Chapter 12: Overview
12.1 The Bank of Korea officially announces four types of sequential national
income statistics: “advance” and “preliminary” quarterly estimates, and “preliminary”
and “final” annual estimates. The “advance” quarterly estimates list the real growth
rate, real value, and real increase rate of economic activities and expenditure
components within 28 days (4 weeks) of the quarter’s end. �e “preliminary” quarterly
estimates provide more detailed analysis, e.g. nominal value of economic activities
and expenditure components, GNI, and savings and investment ratios, within 70
days of the end of the quarter. Various consolidated accounts, sectoral accounts, and
supporting tables are published in the “preliminary” and “final” annual estimates,
which are released around 6 months a�er the covered year ends and 6 months a�er
the year following it ends, respectively.
12.2 Also, national income statistics are classified into four types by form and
content of statistics tables: consolidated accounts, sectoral accounts, public sector
accounts, and supporting tables.
12.3 The five consolidated accounts reveal most major aggregates and all
transactions regarding production, income, capital, finance, and foreign trade.
The gross domestic product and expenditure, national disposal income and its
appropriation, capital transactions, �nancial transactions, and external transactions
accounts are all consolidated accounts recorded only at current prices.
12.4 �e sectoral accounts record transactions above consolidated accounts for
each institutional sector: non-�nancial corporations, �nancial corporations, general
government, households and NPISHs, and the rest-of-the-world. �ey comprise the
production, income, capital transactions, and financial transactions accounts and
are recorded only at current prices. Sectoral accounts for the external transactions
account are not compiled.
12.5 �e public sector account shows economic activities by public sector, which

198 ┃┃ 한국은행
Korean System of National Accounts
includes both general government and public corporations. �e public sector account
is constructed according to a systemic framework. It includes the production, income,
and capital transactions accounts. Total revenue and total expenditure of the general
government and the public sector are compiled and recorded only at current prices.
12.6 �e supporting tables include detailed, economically valuable data which are
worth analyzing but not suitable for tabulating in accounting forms. �ey supplement
the consolidated and sectoral accounts by de�ning transactions by sector, purpose,
and type. �e Bank of Korea publishes 16 supporting tables.
12.7 Table Ⅳ-12-1 shows the corresponding release details and compilation
frequencies. �e detailed methods and the main indicators derived from the tables are
explained in the chapters that follow.
Table Ⅳ-12-1 Release Schedule of Tables
Name of Table
Compilation Frequency
Quarterly1)
(advance)Quarterly
(preliminary)Annual
(preliminary)Annual(final)
[Consolidated Accounts]
• Gross Domestic Product and Expenditure ○ ○
• National Disposable Income and its Appropriation ○ ○
• Capital Transactions ○ ○ ○
• Financial Transactions2) ○ ○
• External Transactions ○ ○
[Sectoral Accounts]
• Product Accounts by Institutional Sectors ○
• Income Accounts by Institutional Sectors ○ ○
• Capital Accounts by Institutional Sectors ○
• Financial Accounts by Institutional Sectors2) ○ ○ ○
[Public Sector Accounts]
• General Government Total Revenue and Total Expenditure
○ ○
• Public Sector Total Revenue and Total Expenditure ○

BANK OF KOREA ┃┃ 199
Ⅳ. Tables and Principal Indicators
[Supporting Tables]
• Gross Domestic Product by Kinds of Economic Activities and Gross National Income
○3) ○ ○ ○
• Expenditure on Gross Domestic Product ○ ○ ○ ○
• Gross Value Added and Factor Income by Kinds of Economic Activities
○
• National Income and National Disposable Income ○ ○
• Gross Capital Formation by Sector and Type of Capital Goods
○ ○ ○
• Gross Fixed Capital Formation by Kinds of Economic Activities
○
• Gross Fixed Capital Formation by Kinds of Economic Activities and Type of Capital Goods
○
• Facilities investments by investment Kinds of Economic Activities
○
• Final Consumption Expenditure of Households by Purpose
○ ○ ○
• Final Consumption Expenditure of Households by Type
○ ○ ○
• Final Consumption Expenditure of Non-profit Institutions Serving Households by Purpose
○ ○
• Final Consumption Expenditure of Non-profit Institutions Serving Households According to Cost-composition and Purpose
○
• General Government Final Consumption Expenditure by Function
○
• General Government Total Expenditure by Function ○
• External Transactions (Current Transactions, Capital and Financial Transactions)
○ ○
• Gross Savings and Gross Investments ○ ○ ○
Notes: 1) Compiled only at real value. 2) Financial transactions accounts are published separately in flow of funds statistics. 3) Gross National Income (GNI) is not calculated for advance estimates.

200 ┃┃ 한국은행
Korean System of National Accounts
Chapter 13: Consolidated Accounts
1. Gross Domestic Product and Expenditure Account
13.1 �e gross domestic product and expenditure account is the starting point for
the sequence of consolidated accounts, representing the composition of value added
generated from the domestic production process and disposal of �nal products.
13.2 As illustrated in Table Ⅳ-13-1, the left column of the account records
value added from domestic production under distribution items, which consist of
compensation of employees, operating surplus, consumption of fixed capital, and
taxes on production and imports (less subsidies). In the right column of the account,
the expenditure components of GDP are listed, e.g. private and government final
consumption; gross �xed capital formation; changes in inventories and acquisitions
less disposals of valuables; and exports and imports of goods and services.
13.3 Although gross domestic production and its expenditures should be
theoretically balanced, in practice a statistical discrepancy could appear as a result of
using di�erent data sources and compilation methods. �is discrepancy is recorded
in the right column of the account. GNI at market prices is calculated by adding
factor income receivable from abroad to GDP (and deducting factor income payable
abroad). �ough GNI is included in this account, it is treated as an o�-balance item.
13.4 From the gross domestic product and expenditure account, various
economic indicators including current GDP (which means the size of an economy),
GNI per capita, etc., are obtained on a yearly basis. �ese indicators provide a useful
tool for measuring the economic status of a country and the living standards of its
people. They also give a useful basis for international comparison as the values are
o�en expressed in US dollars.
13.5 For example, the World Bank lists the relative size of economies, according

BANK OF KOREA ┃┃ 201
Ⅳ. Tables and Principal Indicators
to the Atlas method.28) In the World Bank’s 2018 rankings, Korea ranked 10th in the
world in terms of economic scale, and ninth in terms of GNI per capita among 57
countries with a population larger than 20 million.
13.6 Although GNI per capita is useful to measure and compare living standards of
people across countries, it has some �aws: GNI per capita actually includes the income
of corporations and government as well as the income of households. �erefore, the
Bank of Korea also publishes “PGDI per capita,” which is a better alternative to GNI
per capita for measuring households’ income and living standards.
Table Ⅳ-13-1 Gross Domestic Product and Expenditures in 2018
(Unit: billion won)
Compensation of employees 868,145 Private final consumption expenditure 911,576
Operating surplus 489,156 Government final consumption expenditure 304,693
Consumption of fixed capital 359,140 Gross fixed capital formation 576,587
Taxes on production and imports 194,183 Changes in inventories and acquisitions
less disposals of valuables21,100
(less) Subsidies 12,431
Exports of goods and services 791,799
(less) Imports of goods and services 707,562
Statistical discrepancy 0
Gross domestic product 1,898,193 Expenditure on gross domestic product 1,898,193
Net factor income from the rest-of-the-world 7,645
Gross national income 1,905,837
2. National Disposal Income and its Appropriation Account
13.7 �e national disposal income and its appropriation account is a consolidated
income account that shows the generation of income and its use in the national
economy.
28) When converting gross national income from the national currency to US dollars for international comparison, this method applies a three-year average of exchange rates, adjusted for differences in rates of inflation between countries, to smooth transitory fluctuations in exchange rates and prices.

202 ┃┃ 한국은행
Korean System of National Accounts
13.8 As shown in Table Ⅳ-13-2, the left side of the account consists of private
and government �nal consumptions and net saving. �e net saving of this account
is carried forward to the capital account. �e �nal consumption expenditure should
coincide with �nal consumption displayed on the right side of the consolidated gross
domestic product and expenditure account.
13.9 The right column of the account records income resources such as
compensation of employees, operating surpluses, and taxes on production and
imports, minus subsidies. �ese are carried forward from the gross domestic product
and expenditure account. Disposable incomes received from the rest-of-the-world,
such as compensation of employees, property and entrepreneurial income, and capital
transfers, are also recorded in the right column of the account on a net basis.
13.10 As for the o�-balance items, the account includes national income at factor
cost and national income at market prices. National income at market prices is
calculated by deducting net current transfers from abroad from national disposable
income. National income at factor cost can then be derived from national income
at market prices by subtracting net taxes on production and imports (taxes less
subsidies). �us, national income at market prices coincides with net national income
(NNI), defined as GNI less the consumption of fixed capital. National income at
factor cost is exactly the same as national income (NI) obtained from compensation
of employees and operating surpluses generated within the economy, and is derived
by adding compensation of employees, property and entrepreneurial income from the
net rest-of-the-world �gure.

BANK OF KOREA ┃┃ 203
Ⅳ. Tables and Principal Indicators
Table Ⅳ-13-2 National Disposable Income and its Appropriation in 2018
(Unit: billion won)
Private final consumption expenditure 911,576 Compensation of employees 868,145
Government final consumption expenditure
304,693 Net compensation of employees from the rest-of-the-world
-1,280
Net saving 323,216 Operating surplus 489,156
Net property and entrepreneurial income from the rest-of-the-world
8,925
Taxes on production and imports 194,183
(less) Subsidies 12,431
Net current transfers from the rest-of-the-world
-7,212
Appropriation of national disposable income
1,539,485 National disposable income 1,539,485
Consumption of fixed capitalGross national disposable income
359,1401,898,625
National income at factor cost National income at market prices
1,364,9461,546,697

204 ┃┃ 한국은행
Korean System of National Accounts
Chart Ⅳ-13-1 Comparison of Various Gross National Income Indicators in 2018
(Unit: trillion won)
Gross output
4,369.31)
Gross domestic value added (GDP)1,898.21)
Intermediate consumption2,471.1
Gross Domestic Product (GDP)
1,898.2
Compensation of employees
868.1
Operating surplus489.2
Taxes less subsidies
181.8
Consumption of fixed capital
359.1
Gross NationalIncome (GNI)
1,905.8
868.1 489.2 181.8 359.1
Net factor income from the rest -of- the-world
7.6
Net National Income (NNI)= National income at market prices
1,546.7
866.92) 498.13) 181.8
National DisposableIncome (NDI)
1,539.5
866.9 498.1 181.8Net current transfers
-7.2
Gross National DisposableIncome (NDI)
1,898.6
866.9 498.1 181.8 -7.2Consumption of
fixed capital359.1
National Income (NI)= National income at factor cost
1,364.9
866.9 498.1
Notes: 1) Recorded at market prices. 2) Includes net compensation of employees from the rest-of-the-world. 3) Includes net property and entrepreneurial income from the rest-of-the-world.

BANK OF KOREA ┃┃ 205
Ⅳ. Tables and Principal Indicators
13.11 From the national disposal income and its appropriation account, some
economic indicators can be obtained, such as consumption (or savings) ratio, gross
domestic investment ratio, gross domestic �xed investment ratio, labor share, and so
on. �is account also provides data on the composition of gross national disposable
income, including components such as compensation of employees, operating
surplus, consumption of fixed capital, taxes on production and imports, and net
current transfers from abroad.
Ratio of compensation of employees to GNDI (%) = Compensation of employees
GNDI × 100
Chart Ⅳ-13-2 Composition of Gross National Disposable Income in 2018
(Unit: %)
Current transfersfrom the rest ofthe world, net
-0.4
Taxes onProduction and
imports lesssubsidies
9.6
Compensationof employees
45.7
Consumption offixed capital
18.9
Operating surplus,property and
enterprenerial income26.2
GrossNational
DisposableIncome100.0
13.12 The consumption ratio represents the nation’s level of consumption by
means of the ratio of goods and services used for final consumption expenditure
to gross national disposable income. �e savings ratio is simply the opposite of the
consumption ratio, as savings means the part of income not used for consumption.
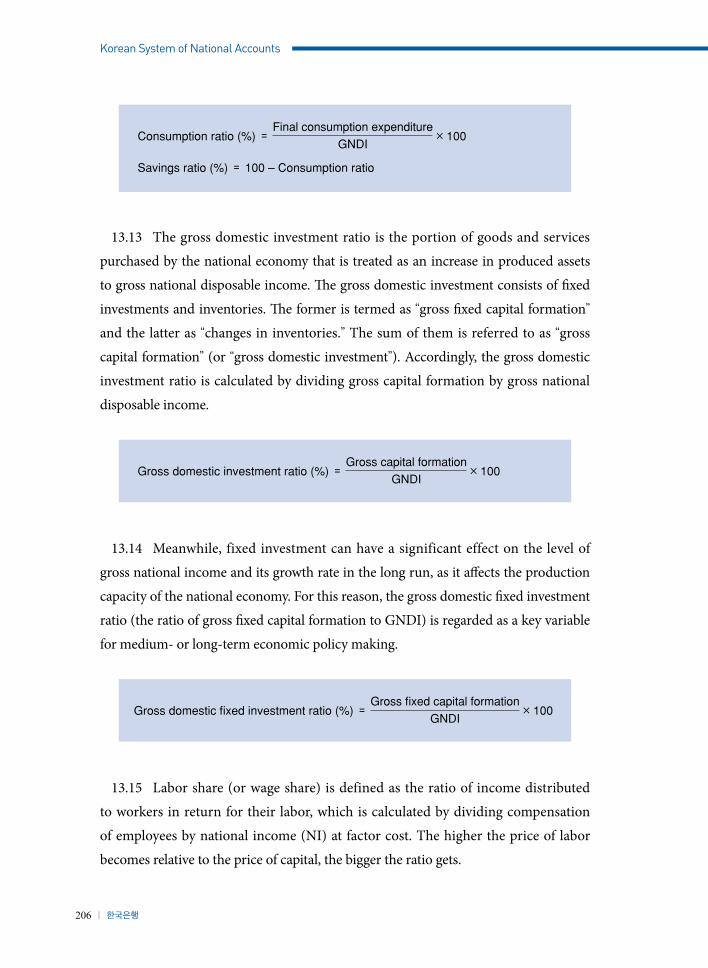
206 ┃┃ 한국은행
Korean System of National Accounts
Consumption ratio (%) = Final consumption expenditure
GNDI × 100
Savings ratio (%) = 100 – Consumption ratio
13.13 The gross domestic investment ratio is the portion of goods and services
purchased by the national economy that is treated as an increase in produced assets
to gross national disposable income. �e gross domestic investment consists of �xed
investments and inventories. �e former is termed as “gross �xed capital formation”
and the latter as “changes in inventories.” The sum of them is referred to as “gross
capital formation” (or “gross domestic investment”). Accordingly, the gross domestic
investment ratio is calculated by dividing gross capital formation by gross national
disposable income.
Gross domestic investment ratio (%) = Gross capital formation
GNDI × 100
13.14 Meanwhile, fixed investment can have a significant effect on the level of
gross national income and its growth rate in the long run, as it a�ects the production
capacity of the national economy. For this reason, the gross domestic �xed investment
ratio (the ratio of gross �xed capital formation to GNDI) is regarded as a key variable
for medium- or long-term economic policy making.
Gross domestic fixed investment ratio (%) = Gross fixed capital formation
GNDI × 100
13.15 Labor share (or wage share) is defined as the ratio of income distributed
to workers in return for their labor, which is calculated by dividing compensation
of employees by national income (NI) at factor cost. The higher the price of labor
becomes relative to the price of capital, the bigger the ratio gets.

BANK OF KOREA ┃┃ 207
Ⅳ. Tables and Principal Indicators
Labor share (%) = Compensation of employee
National income at factor cost × 100
3. Capital Transactions Account
13.16 The capital transactions account records the flows of non-financial assets
acquired (or disposed of) and the change in net worth by means of capital transfers.
13.17 As illustrated in Table Ⅳ-13-3, the left column of the account displays
acquisitions of non-financial assets, including capital accumulation items such as
gross �xed capital formation, changes in inventories and valuables, net acquisitions of
non-produced non-�nancial assets, and net lending to the rest-of-the-world.
13.18 The resources available for the accumulation of these assets are recorded
in the right column. �ese consist of net saving, which is the balancing item carried
forward from the national disposable income and its appropriation account,
consumption of fixed capital, and net capital transfers from the rest-of-the-world.
Consumption of �xed capital is carried forward from the gross domestic product and
expenditure account, while net capital transfers comes from the external transaction
account.
Table Ⅳ-13-3 Capital Transactions Account in 2018
(Unit: billion won)
Gross fixed capital formation
Changes in inventories
Acquisitions less disposal of valuables
Acquisitions less disposal of non-produced non-financial assets
Net lending to the rest-of-the-world
576,587
19,205
1,895
-358
85,023
Net saving
Consumption of fixed capital
Net capital transfers from the rest-of-the-world
323,216
359,140
-4
Gross accumulation 682,352 Finance of gross accumulation 682,352

208 ┃┃ 한국은행
Korean System of National Accounts
4. Financial Transactions Account
13.19 �e �nancial transactions account is the account that records transactions of
�nancial assets and liabilities.
13.20 �e le� column of the account represents acquisitions of �nancial assets less
disposals, while the right column records incurrence of liabilities less their repayment.
�e balance of the le� and right columns of the account is recorded as net lending or
borrowing. �is item is equal to net lending, which is the balancing item of the capital
transaction account. Moreover, since all domestic financial positions are netted on
consolidation in the �nancial transaction account, the �gure coincides with the value
of the economy’s �nancial position with the rest-of-the-world, which appears in the
external transactions account.
13.21 In principle, net lending or borrowing in the �nancial transactions account
should be identical to the net lending or borrowing in the capital transactions
account. However, in practice, this identity can be very difficult to achieve due to
errors and omissions as a result of di�erent data sources and valuation methods.
Table Ⅳ-13-4 Financial Account in 2018
(Unit: billion won)
Financial assets 876,822 Financial liabilitiesNet lending (+) / Net borrowing (-)
790,21286,611
Financial assets 876,822 Financial liabilities + Net lending (or borrowing) 876,822
5. External Transactions Account
13.22 The external transaction account is a consolidated account which
covers transactions between residents and non-residents recorded respectively
in the previous four consolidated accounts. This account consists of current
and capital transactions accounts. First of all, as illustrated in Table Ⅳ-13-5, the
current transactions account shows items such as exports of goods and services,

BANK OF KOREA ┃┃ 209
Ⅳ. Tables and Principal Indicators
compensation of employees, property and entrepreneurial income receivable, and
current transfers from the rest-of-the-world in the le� column. Imports of goods and
services, compensation of employees, property and entrepreneurial income payable,
and current transfers to the rest-of-the-world are displayed in the right column of the
account. �e balancing item, the remaining amount of receipts from the rest-of-the-
world a�er deducting payments to it, is treated as a national surplus (or de�cit) on
current transactions and is recorded in the right column of the account.
13.23 Meanwhile, the capital transactions account records net acquisition of
foreign financial assets as a right column payment. The receipts, which are listed
in the left column, consist of national surpluses from current transactions carried
over from the current transactions account, net rest-of-the-world capital transfers,
net incurrence of foreign liabilities, acquisitions less disposal of non-produced non-
�nancial assets (a deducted item), and errors and omissions.

210 ┃┃ 한국은행
Korean System of National Accounts
Table Ⅳ-13-5 The External Transactions Account in 2018
<Current Transactions>
(Unit: billion won)
Exports of goods and services
Compensation of employees from the rest of the world
Property and entrepreneurial income from the rest of the world
Current transfers from the rest of the world
791,799
902
39,847
12,299
Imports of goods and services
Compensation of employees to the rest of the world
Property and entrepreneurial income to the rest of the world
Current transfers to the rest of the world
Surplus of the nation on current transactions
707,562
2,183
30,922
19,512
84,669
Receipts from the rest of the world 844,848 Payment to the rest of the world and surplus of the nation on current transactions
844,848
<Capital Transactions>
(Unit: billion won)
Surplus of the nation on current transactions
Net capital transfers from the rest of the world
Net incurrence of foreign liabilities
(-)Acquisitions less disposal of non-produced financial assets
Errors and omissions
84,669
-4
43,848
-358
189
Net acquisition of foreign financial assets
129,060
Incurrence of liabilities 129,060 Acquisitions of financial assets 129,060

BANK OF KOREA ┃┃ 211
Ⅳ. Tables and Principal Indicators
Chapter 14: Sectoral Accounts
1. Production Account by Institutional Sector
14.1 The production account can be recorded by institutional sector. In this
manner, the account can be used for analysis of the effect that changes in the
industrial structure or government economic policies have had on each economic
participant’s productivity or performance.
14.2 �e production account is composed of output, intermediate consumption,
and value added. Output can be broken into market output, non-market output, and
output for own �nal use. Gross value added is de�ned as the value of output less the
value of intermediate consumption. Net value added is calculated by deducting �xed
capital consumption from gross value added.
14.3 Table Ⅳ-14-1 shows the production account by institutional sector in 2018.
�e non-�nancial corporation sector produced 3,225 trillion won, and recorded 2,092
trillion won in intermediate consumption. National gross value added in 2018 was 1,737
trillion won. By institutional sector, it breaks down as follows: 1,133 trillion won from
non-financial corporations, 99 trillion won from financial corporations, 184 trillion
won from the general government, and 319 trillion won from households and NPISHs.
Table Ⅳ-14-1 Production Accounts by Institutional Sectors in 2018(unit: billion won)
Transaction and Balancing Items
Non-financial Corporations
Financial Corporations
General Government
Households and NPISHs1) Total Economy
Uses Sources Uses Sources Uses Sources Uses Sources Uses Sources
Gross Output2)
Market outputOutput for own final use
Other non-market output
- - - -
3,225,2553,225,255
- -
- - - -
173,485173,485
- -
- - - -
256,04636,809
- 219,237
- - - -
552,875356,56578,682
117,628
- - - -
4,207,4803,792,114
78,682336,865
Intermediate consumptionTaxes less subsidies on products
2,091,867-
- -
74,206-
- -
71,652-
- -
233,395-
- -
2,471,120161,652
- 161,652
Gross value added2) Fixed capital consumptionNet value added2)
1,133,388238,521894,867
- - -
99,2798,449
90,830
- - -
184,39354,249
130,144
- - -
319,48057,920
261,560
- - -
1,736,541359,140
1,377,401
- - -
Note: 1) Non-profit institutions serving households 2) Recorded as basic prices.

212 ┃┃ 한국은행
Korean System of National Accounts
2. Income Account by Institutional Sector
14.4 The income account by institutional sector is a compilation that re-
records the national disposable income and its appropriation account separated into
institutional sectors. This account shows distributed gross value added and factor
income by institutional sector that comprises production activities. It also indicates
income transfers between sectors and details uses and sources of income in the
secondary distribution of income account. Table Ⅳ-14-2 shows the income account
by institutional sector in 2018. �e institutional sector consists of rest-of-the-world
and domestic sectors, including non-financial corporations, financial corporations,
the general government, and households. The households sector also contains
NPISHs and private unincorporated enterprises.
14.5 �e institutional sector income account reveals balance of primary incomes,
disposable incomes, adjusted disposable income, consumption expenditures, savings,
net personal saving ratios, and others. Personal net disposable income represents
disposable income usable at one’s own discretion. Personal adjusted net disposable
income is calculated by adding net social transfer in kind to personal net disposable
income. �e net personal savings ratio is calculated by dividing personal net savings
by personal adjusted net disposable income with adjustments made for changes in the
net equity of households in pension funds. �is net personal savings ratio e�ectively
represents the household sector’s propensity to save.
Net personal savings ratio (%) = Net personal savings
(Personal adjusted net disposable income +Adjustment for changes in the net equity of housholds in pension funds)
× 100
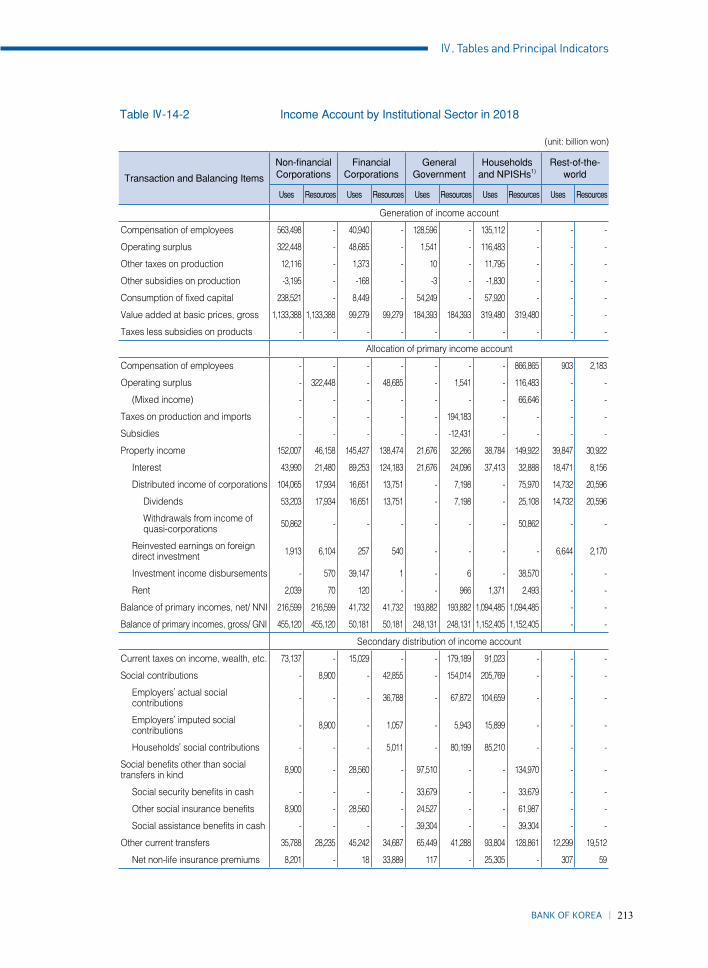
BANK OF KOREA ┃┃ 213
Ⅳ. Tables and Principal Indicators
Table Ⅳ-14-2 Income Account by Institutional Sector in 2018
(unit: billion won)
Transaction and Balancing Items
Non-financial Corporations
Financial Corporations
General Government
Households and NPISHs1)
Rest-of-the-world
Uses Resources Uses Resources Uses Resources Uses Resources Uses Resources
Generation of income account
Compensation of employees 563,498 - 40,940 - 128,596 - 135,112 - - -
Operating surplus 322,448 - 48,685 - 1,541 - 116,483 - - -
Other taxes on production 12,116 - 1,373 - 10 - 11,795 - - -
Other subsidies on production -3,195 - -168 - -3 - -1,830 - - -
Consumption of fixed capital 238,521 - 8,449 - 54,249 - 57,920 - - -
Value added at basic prices, gross 1,133,388 1,133,388 99,279 99,279 184,393 184,393 319,480 319,480 - -
Taxes less subsidies on products - - - - - - - - - -
Allocation of primary income account
Compensation of employees - - - - - - - 866,865 903 2,183
Operating surplus - 322,448 - 48,685 - 1,541 - 116,483 - -
(Mixed income) - - - - - - - 66,646 - -
Taxes on production and imports - - - - - 194,183 - - - -
Subsidies - - - - - -12,431 - - - -
Property income 152,007 46,158 145,427 138,474 21,676 32,266 38,784 149,922 39,847 30,922
Interest 43,990 21,480 89,253 124,183 21,676 24,096 37,413 32,888 18,471 8,156
Distributed income of corporations 104,065 17,934 16,651 13,751 - 7,198 - 75,970 14,732 20,596
Dividends 53,203 17,934 16,651 13,751 - 7,198 - 25,108 14,732 20,596
Withdrawals from income of quasi-corporations 50,862 - - - - - - 50,862 - -
Reinvested earnings on foreign direct investment 1,913 6,104 257 540 - - - - 6,644 2,170
Investment income disbursements - 570 39,147 1 - 6 - 38,570 - -
Rent 2,039 70 120 - - 966 1,371 2,493 - -
Balance of primary incomes, net/ NNI 216,599 216,599 41,732 41,732 193,882 193,882 1,094,485 1,094,485 - -
Balance of primary incomes, gross/ GNI 455,120 455,120 50,181 50,181 248,131 248,131 1,152,405 1,152,405 - -
Secondary distribution of income account
Current taxes on income, wealth, etc. 73,137 - 15,029 - - 179,189 91,023 - - -
Social contributions - 8,900 - 42,855 - 154,014 205,769 - - -
Employers’ actual social contributions - - - 36,788 - 67,872 104,659 - - -
Employers’ imputed social contributions - 8,900 - 1,057 - 5,943 15,899 - - -
Households’ social contributions - - - 5,011 - 80,199 85,210 - - -
Social benefits other than social transfers in kind 8,900 - 28,560 - 97,510 - - 134,970 - -
Social security benefits in cash - - - - 33,679 - - 33,679 - -
Other social insurance benefits 8,900 - 28,560 - 24,527 - - 61,987 - -
Social assistance benefits in cash - - - - .39,304 - - 39,304 - -
Other current transfers 35,788 28,235 45,242 34,687 65,449 41,288 93,804 128,861 12,299 19,512
Net non-life insurance premiums 8,201 - 18 33,889 117 - 25,305 - 307 59

214 ┃┃ 한국은행
Korean System of National Accounts
Non-life insurance claims - 6,629 33,889 168 - 106 - 26,738 59 307
Current transfers not-elsewhere classified 27,588 21,606 11,335 630 65,332 41,182 68,499 102,123 11,933 19,145
Residents 24,126 19,319 11,335 630 63,334 40,969 54,813 92,690 - -
Rest-of-the-world 3,462 2,287 - - 1,997 214 13,686 9,432 11,933 19,145
Disposable income, net / NDI 135,909 135,909 30,442 30,442 405,414 405,414 967,720 967,720 - -
Disposable income, gross / GDI 374,430 374,430 38,892 38,892 459,664 459,664 1,025,640 1,025,640 - -
Redistribution income in kind account
Social transfers in kind - - - - 167,559 - 34,148 201,706 - -
Adjusted disposable income, net 135,909 135,909 30,442 30,442 237,856 237,856 1,135,278 1,135,278 - -
Adjusted disposable income, gross 374,430 374,430 38,892 38,892 292,105 292,105 1,193,199 1,193,199 - -
Use of income account
Final consumption expenditure - - - - 304,693 - 911,576 - - -
Actual final consumption - - - - 137,134 - 1,079,135 - - -
Adjustment for the change in net equity of households in pension funds
- - 14,295 - - - - 14,295 - -
Net saving 135,909 - 16,148 - 100,722 - 70,439 - - -
Gross saving 374,430 - 24,597 - 154,971 - 128,359 - - -
Note: 1) Non-profit institutions serving households
3. Capital Account by Institutional Sector
14.6 The capital account by institutional sector is compiled by dividing the
capital transaction account of the consolidated accounts into institutional sectors.
It represents a net lending corresponding to the amount available to each sector for
financing, directly or indirectly, other sectors or a net borrowing corresponding to
the amount a sector is obliged to borrow from other sectors. Table Ⅳ-14-3 shows the
accumulation of non-�nancial assets, the form of the capital raised by each sector, and
the amount of net lending or net borrowing for each sector.
14.7 Initially, three items are recorded in the liabilities and net worth section: net
savings those are carried forward from the income accounts by institutional sectors,
the current external balance of the external transactions account (current account
surplus), and net capital transfers. However external transactions, such as current
external balance (current account surplus) and net-capital transfers, are recorded
reversely since they are viewed from the position of a foreign country. Meanwhile,
the domestic institutional sector’s net-capital transfers are compiled from additional

BANK OF KOREA ┃┃ 215
Ⅳ. Tables and Principal Indicators
survey results. Five items are recorded in the accumulation of assets part (changes
in assets): gross fixed capital formation, consumption of fixed capital, changes in
inventories, acquisitions less disposal of valuables, and acquisition less disposal of
non-produced non-�nancial assets.
14.8 Among the recorded items discussed above, on the gross fixed capital
formation, (-) consumption of �xed capital, changes in inventories and acquisitions
less disposal of valuables, the total values of the gross domestic product and
expenditure accounts are distributed by relevant institutional sector. On the
acquisitions less disposal of non-financial assets of foreign trade, the figures of
the foreign trade account are recorded and for those of domestic trade, separately
investigated and recorded. Also, net lending (total capital raising less total capital
accumulation) is recorded on the changes in assets.
14.9 Domestic net lending must be adjusted (o�set) with external transactions,
but statistical discrepancies can occur due to di�erences in estimation methods and
data sources between saving and investment.
14.10 Table Ⅳ-14-3 shows the capital account by institutional sector in 2018. �e
households and NPISHs, financial corporations, and general government sectors
are fund-surplus sectors where saving (changes in liabilities and net worth) exceed
investment (changes in assets). However, the non-financial corporation sector is
a fund-shortage sector where investment exceeds saving. In the rest-of-the-world
sector, investment exceeds saving; this means that the domestic funds surplus owing
to the current account surplus is supplied to the rest-of-the-world.
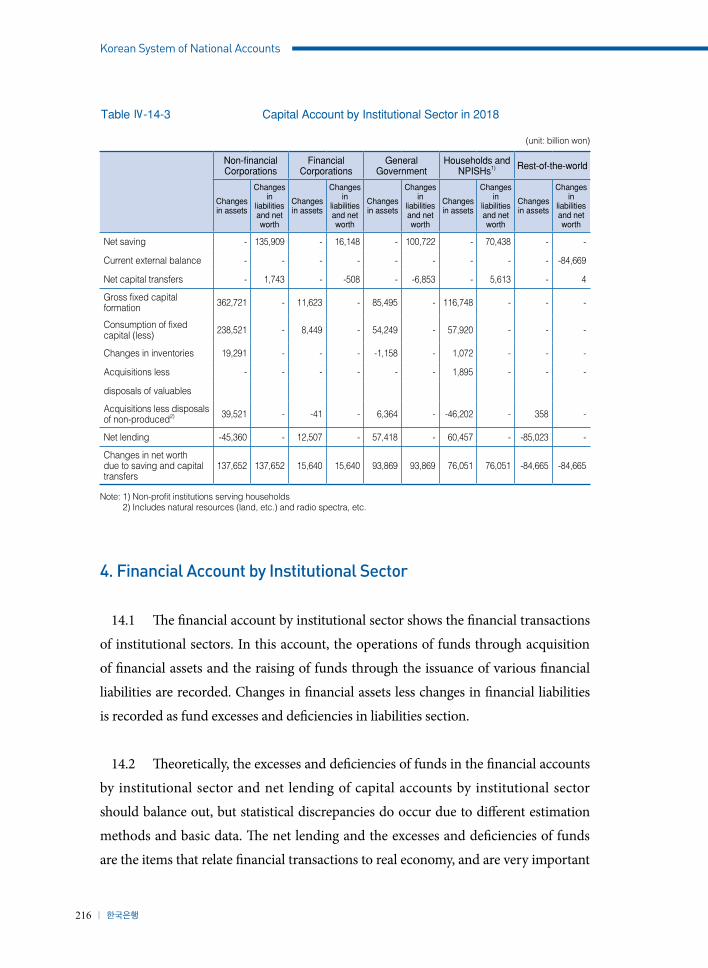
216 ┃┃ 한국은행
Korean System of National Accounts
Table Ⅳ-14-3 Capital Account by Institutional Sector in 2018
(unit: billion won)
Non-financial Corporations
Financial Corporations
General Government
Households and NPISHs1) Rest-of-the-world
Changes in assets
Changes in
liabilities and net worth
Changes in assets
Changes in
liabilities and net worth
Changes in assets
Changes in
liabilities and net worth
Changes in assets
Changes in
liabilities and net worth
Changes in assets
Changes in
liabilities and net worth
Net saving - 135,909 - 16,148 - 100,722 - 70,438 - -
Current external balance - - - - - - - - - -84,669
Net capital transfers - 1,743 - -508 - -6,853 - 5,613 - 4
Gross fixed capital formation 362,721 - 11,623 - 85,495 - 116,748 - - -
Consumption of fixed capital (less) 238,521 - 8,449 - 54,249 - 57,920 - - -
Changes in inventories 19,291 - - - -1,158 - 1,072 - - -
Acquisitions less - - - - - - 1,895 - - -
disposals of valuables
Acquisitions less disposals of non-produced2) 39,521 - -41 - 6,364 - -46,202 - 358 -
Net lending -45,360 - 12,507 - 57,418 - 60,457 - -85,023 -
Changes in net worth due to saving and capital transfers
137,652 137,652 15,640 15,640 93,869 93,869 76,051 76,051 -84,665 -84,665
Note: 1) Non-profit institutions serving households 2) Includes natural resources (land, etc.) and radio spectra, etc.
4. Financial Account by Institutional Sector
14.1 �e �nancial account by institutional sector shows the �nancial transactions
of institutional sectors. In this account, the operations of funds through acquisition
of �nancial assets and the raising of funds through the issuance of various �nancial
liabilities are recorded. Changes in �nancial assets less changes in �nancial liabilities
is recorded as fund excesses and de�ciencies in liabilities section.
14.2 �eoretically, the excesses and de�ciencies of funds in the �nancial accounts
by institutional sector and net lending of capital accounts by institutional sector
should balance out, but statistical discrepancies do occur due to di�erent estimation
methods and basic data. �e net lending and the excesses and de�ciencies of funds
are the items that relate �nancial transactions to real economy, and are very important

BANK OF KOREA ┃┃ 217
Ⅳ. Tables and Principal Indicators
means of showing the supply and demand patterns of funds between institutions.
In general, the household sector is a fund-surplus agent in which saving exceeds
investment, whereas the non-�nancial corporations sector is a fund-shortage agent in
which investment exceeds saving. If the national economy only consists of households
and non-�nancial corporations, the non-�nancial corporations would raise funds for
investment by increasing �nancial liabilities and then the households would supply
funds to corporations by increasing financial assets. Capital and financial accounts
by institutional sector show the investment and fund-raising scale of these sectors
transparently.
14.3 Table Ⅳ-14-4 shows the amount of fund-surplus in the households and
NPISHs sector as being 58 trillion won in 2018. �is sector raised 100 trillion won
through loans from financial corporations for economic activities, such as housing
purchases and consumption. �e households and NPISHs sector purchased deposits,
insurance, pensions, equity and related items with its fund-surplus.
14.4 �e �nancial account by institutional sector is very useful when investigating
the outside fund-raising patterns of institutions, especially the patterns of non-
�nancial corporations that generally use three methods to raise outside funds: indirect
financing, i.e. borrowing funds from banks and other financial companies; direct
�nancing, i.e. raising funds directly by issuing bonds or stocks in the �nancial market;
and, foreign �nancing, i.e. borrowing from abroad through foreign loans. According
to Table Ⅳ-14-4, non-�nancial corporations raised 90 trillion won from loans and 61
trillion won via direct �nancing, such as issuing bonds, in 2018.

218 ┃┃ 한국은행
Korean System of National Accounts
Table Ⅳ-14-4 Financial Account by Institutional Sector in 2018
(unit: billion won)
Non-financial Corporations)
Financial Corporations
General Government
Households and NPISHs1)
Rest-of-the-world
Uses Sources Uses Sources Uses Sources Uses Sources Uses Sources
Total 130,117 174,600 492,527 478,337 93,475 34,323 160,704 102,952 43,970 130,580
Gold & SDRs - - 63 - - - - - - 63
Currency & Deposits 46,676 - 60,918 210,476 30,440 2,996 75,295 - 144 -
Insurance & Pension Reserves 1,232 - 3,046 64,960 - - 60,683 - - -
Securities other than Shares 22,824 8,786 87,662 89,588 13,200 19,287 -50 - 30,425 36,401
Loans - 90,266 195,996 13,207 - -4,363 - 100,288 -31 -3,434
Government Loans - 9,968 - -2,409 9,283 -436 - 2,160 - -
Equity and Investment Fund Shares
22,685 41,945 78,065 59,989 31,267 7,188 23,501 - -7,082 39,315
Financial Derivatives - - - - - - - - - -
Trade Credits -1,259 3,383 5,821 - -516 -301 - 193 834 1,604
Foreign Direct Investment 35,082 13,554 3,334 -196 2,200 - 1,483 - 13,358 42,100
Other Foreign Claims and Debts 215 2,029 17,004 -5,237 -1,954 -943 -735 - 6,322 14,531
Miscellaneous 2,662 4,670 40,618 37,486 9,556 10,895 527 311 - -
Fund excesses or deficiencies - -44,484 - 14,190 - 59,153 - 57,752 - -86,611
Note: 1) Non-profit institutions serving households

BANK OF KOREA ┃┃ 219
Ⅳ. Tables and Principal Indicators
Chapter 15: Public Sector Account
15.1 A�er the global �nancial crisis revealed the severe �nancial issues of many
European countries, some European governments began to inject signi�cant public
funds into saving weakened organizations, or made the decision to simply take them
over. Subsequently, the demand for accurate �nancial statistics, which expose the level
of �nancial soundness and sustainability of the public sector – government and public
corporations included – increased dramatically. Re�ecting these circumstances, the
2008 SNA recommended that each country establish an o�cial public sector account,
and South Korea began to do so in 2014.
15.2 �e public sector account provides statistics on every economic activity of
the public sector within certain period of time. As Figure Ⅳ-15-1 shows, the public
sector includes the general government (central government, local government,
and social security funds), non-financial public corporations, and financial public
corporations which perform quasi-public �nancial activities.
Figure Ⅳ-15-1 Coverage of the Public Sector
General Account
Special AccountCentral Government
Fund
NPIs Controlled by Government
General Account
Special Account
GeneralGovernment
Special Account for Public EnterpriseLocal Government
Education Special Account
Public SectorFund
NPIs Controlled by Government
FundSocial Security Fund
NPIs Controlled by Government
Central Non-Financial Public CorporationsNon-financial Public
Corporations Local Non-Financial Public CorporationsPublic
CorporationFinancial Public
Corporation

220 ┃┃ 한국은행
Korean System of National Accounts
15.3 The public sector account consists of production and income and capital
accounts in accordance with how products have been created and then disposed. �at
is, the public sector account presents how the value added and capital income created
by the production activities of the public sector have been disposed of, maintained, or
in what ways they are de�cient. Meanwhile, every economic activity of public sector
is recorded on an accrual basis, and internal transactions between subsections are
removed.
Figure Ⅳ-15-2 System of Public Accounts
Production Accounts (Production activity)
Income Accounts (Income redistribution)
Capital Accounts (Capital transactions)
Output - Intermediate consumption
⇒Operating surplus, etc.± Property Income± Taxes on productions and
imports± Social contributions± Other current transfers– Final consumption expenditure
⇒ Savings+ Capital taxes± Capital transfers– Capital formation
Value added(Compensation of employees)(Operating surplus, etc.)
Net lending/borrowing(= Total revenue – Total expenditure)Savings
15.4 The public sector account consists of “general government” total revenue,
total expenditure, and net lending/borrowing by subsector; and “public sector” total
revenue, total expenditure, and net lending/borrowing by subsector, from which
differing financial indicators are induced. Net lending/borrowing is the remaining
amount of money a�er production, income and capital transactions, and is equal to
the difference between total revenue and total expenditure. Net borrowing means
excessive expenditure beyond annual capacity, which has resulted in either increased
debt or decreased assets. Using total expenditure and net lending/borrowing divided
by nominal GDP, it is possible to analyze the propriety of the size, �nancial soundness
and sustainability of the public sector or make comparisons with other countries.
Table Ⅳ-15-1 shows total expenditure of the public sector in 2019 as 862.4 trillion
won, 44.9% of GDP.

BANK OF KOREA ┃┃ 221
Ⅳ. Tables and Principal Indicators
Table Ⅳ-15-1 Public Sector Total Revenue, Total Expenditure, and Net Lending/Borrowing
(Unit: trillion won, %)
2014 2015 2016 2017 2018 2019p
Total revenue (a) 711.7 733.1 768.1 807.7 852.7 876.3
Total expenditure (b) 694.2 700.7 720.9 753.7 799.6 862.4
(44.4) (42.3) (41.4) (41.1) (42.1) (44.9)
Net lending/borrowing (a-b) 17.5 32.4 47.2 54.1 53.1 13.8
Note: Numbers in brackets are the ratio to nominal GDP.
222 ┃┃ 한국은행
Korean System of National Accounts
Chapter 16: Supporting Tables
1. GDP and GNI by Kinds of Economic Activities
16.1 The table which shows GDP and GNI by kinds of economic activities
contains a detailed listing of value added in kind for 15 economic activities based
on basic prices. It also contains taxes less subsidies on products, GDP (at market
prices), trading gains and losses from changes in the terms of trade, GNI, and net
factor income from the rest-of-the-world. Data on growth rates by kinds of economic
activities, de�ators, and contributions to GDP growth are additional bene�ts.
16.2 �e table’s values are given in current prices and chained 2015 year prices,
and both the seasonally adjusted and seasonally non-adjusted series are provided.
2. Expenditure on Gross Domestic Product
16.3 This table shows GDP by type of final disposal: final consumption
expenditures, gross capital formation, and export and import of goods and services.
It includes data on the growth rates, de�ators, and contributions to GDP growth by
expenditure type. Data is based on current prices and chained 2015 year prices, and
both the seasonally adjusted and seasonally non-adjusted series are provided.
3. Gross Value Added and Factor Income by Kinds of Economic Activities
16.4 �is table shows output, intermediate consumption, and value added and its
components by economic activities. Using this table, the value added ratio and ratio
of compensation of employees can be calculated. �e value added ratio is de�ned as
the ratio of value added to gross output. �e ratio of compensation of employees is
calculated by dividing compensation of employees by total factor income (which is
the sum of compensation of employees and operating surplus).

BANK OF KOREA ┃┃ 223
Ⅳ. Tables and Principal Indicators
4. National Income and National Disposable Income
16.5 This table complements the gross national disposable income and its
disposal account. It represents the relationship between national income at factor cost
or market prices and gross national disposable income. National income at factor
cost is de�ned as the sum of compensation of employees and operation surplus such
as property income and entrepreneurial income. National income at market prices
is calculated by adding taxes on production and imports (less subsidies) to national
income at factor cost.
5. Gross Capital Formation by Type of Capital Goods and by Sector
16.6 �is table shows classi�ed gross capital formation by type of capital goods
and by sector. Construction, facilities investment, and intellectual property products
are divided into more detailed types. Construction is composed of residential
buildings, non-residential buildings, and other construction. Facilities investment
is divided into transport equipment, and machinery and equipment. Intellectual
property products are separated into two types: research and experimental
development, and other intellectual property products. �is table also represents the
sectoral amounts of private and government investment for each type of capital goods.
Values both at current prices and at chained reference year prices are provided.
6. Gross Capital Formation by Kinds of Economic Activities
16.7 �is table shows classi�ed construction and facilities investment by 15 kinds
of economic activities. Values both at current prices and at chained reference year
prices are provided.
7. Gross Fixed Capital Formation by Kinds of Economic Activities and Type of Capital Goods
16.8 Gross fixed capital formation is composed of construction, facilities

224 ┃┃ 한국은행
Korean System of National Accounts
investment, and intellectual property products. �is table shows classi�ed gross �xed
capital formation by economic activities. �is table also provides the sectoral amounts
of transport equipment, machinery and equipment, and research and experimental
development by economic activities. Data at both current prices and chained
reference year prices are shown.
8. Facilities investments by Kinds of Economic Activities
16.9 This table shows facilities investments classified by economic activities.
Values both at current prices and at chained reference year prices are provided.
9. Final Consumption Expenditure of Households by Purpose
16.10 �is table records �nal consumption expenditure of households classi�ed by
purpose. It is composed of 12 items which are classi�ed by expenditure purposes. �is
table is useful not only for analyzing consumers’ consumption patterns but also for
assessing national welfare.
10. Final Consumption Expenditure of Households by Type
16.11 This table details final household consumption expenditure by type. Final
consumption expenditures are divided into expenditures on goods and on services. In
addition, goods are divided into durable goods, semi-durable goods, and non-durable
goods. �e table aids analysis of cyclical consumer demand �uctuations.
11. Final Consumption Expenditure of Non-profit Institutions Serving Households by Purpose
16.12 This table shows NPISHs’ activities by purpose: i.e. health, recreation and
culture, education, social protection, and others.

BANK OF KOREA ┃┃ 225
Ⅳ. Tables and Principal Indicators
12. Final Consumption Expenditure of Non-profit Institutions Serving Households According to Cost Composition and Purpose
16.13 This table shows input cost and disposal of services in the NPISH sector.
Services produced by NPISHs are mostly disposed of as final consumption
expenditures connected to own use or as sales to other institutional sectors.
13. General Government Final Consumption Expenditure by Function
16.14 This table is a re-recording of general government final consumption
expenditure by sector and by function. By sector, the general government is divided
into central government, local government, and social security funds. �e activities
of the general government are composed of 10 functions: general public services,
defense, public order and safety, economic a�airs, environment protection, housing
and community amenities, health, recreation, culture and religion, education, and
social protection. The table can be used to project the scale of future government
expenditures or to make comparisons of government expenditure structures with
other countries.
14. General Government Total Expenditure by Function
16.15 �is table shows current and capital expenditures of the general government
by sector and function, as well as the government transfers to other institutional
sectors.
15. External Transactions
16.16 This table is composed of current accounts and capital and financial
accounts. It is a detailed compilation of the external transaction account in the
consolidated account.

226 ┃┃ 한국은행
Korean System of National Accounts
16.17 From this table, the ratio of exports and imports to GNI, which represents
an economy’s degree of dependency on external trade, can be derived as follows:
Ratio of Exports and Imports to GNI (%) = Total Exports and Imports*
Current GNI × 100
* Exports and imports of goods and services + factor income received and paid
16. Gross Savings and Gross Investments
16.18 �is table shows gross savings and gross investments by institutional sector.
Gross savings are calculated by deducting �nal consumption expenditure from gross
national disposable income. Gross investments are divided into domestic gross capital
formation and foreign investment. Foreign investment is equal to the national surplus
in current transactions.
16.19 Gross saving and gross investment ratios are calculated by dividing gross
saving and gross investment by gross national disposable income, respectively. Gross
saving ratios by institutional sector are the ratios of each institutional gross saving to
gross national disposable income. Rather than representing institutional propensities
for saving, they represent each institutional sector’s share of the national gross saving
ratio.
Gross savings ratio (%) = Gross saving
GNDI × 100


BANK OF KOREA ┃┃ 229
Ⅴ. Technical Issues
Chapter 17: Seasonal Adjustment
1. Introduction
17.1 Monthly or quarterly economic time series o�en show cyclical patterns over
the course of a year because of changes in weather, national holidays, social habits, etc.
�ese periodic movements are called seasonal variations. For example, GDP �gures
are generally lower every �rst quarter and relatively higher every fourth quarter, as
Chart Ⅴ-17-1 indicates.
17.2 If raw data were used or analyzed without removing seasonality, inaccurate
comparisons of different periods within the same year could result. Therefore,
seasonal �uctuations should be estimated and removed from the original series for a
more accurate understanding of short-term GDP movements.
Chart Ⅴ-17-1 Original and Seasonally Adjusted GDP Figures(Chain Volume Measure)
0
100
200
300
400
500
600
1990 1995 2000 2005 2010 2015
Original
Seasonally adjusted
(In trillion won)

230 ┃┃ 한국은행
Korean System of National Accounts
17.3 In general, economic time series contain four separate components: trend,
cyclical, seasonal, and irregular. The original series are formulated by the addition
or multiplication of these components. A trend shows an underlying long-term
movement over time usually due to the lasting impact of technological changes or
consumer preferences. Cyclical variations are medium-term (normally, over 1 year)
changes caused by circumstances which repeat in cycles, such as successive business
expansions and economic recessions.
17.4 Seasonal variations are short-term movements (usually with a 1 year
cycle) caused by the climate and various social customs. The seasonal component
also includes calendar effects which influence economic activity because of the
composition of trading days or moving holidays (such as Lunar New Year and
Chuseok (Korea’s �anksgiving)). Irregular variations are random disturbances due
to strikes, natural disasters, and other unpredictable events.
17.5 Seasonal adjustment (SA) refers to the statistical process that breaks the
original time series down into trend, cyclical, seasonal, and irregular components.
�rough this process, the seasonal component is removed from the original series.
Accordingly, seasonally adjusted �gures can reveal certain non-seasonal features more
clearly.
Chart Ⅴ-17-2 Seasonal Adjustment Process
<Original Series> <Seasonally Adjusted Series>
Trend Trend
Cyclical Seasonal Adjustment Cyclical
SeasonalIrregular
Irregular

BANK OF KOREA ┃┃ 231
Ⅴ. Technical Issues
2. Seasonal Adjustment Methods
17.6 The simplest method to remove seasonality from the original series is to
observe year-on-year changes (or growth rates). Other alternatives include taking
a moving average of the seasonal-irregular ratios for each quarter or applying a
regression model with seasonal dummy variables. All of these methods assume that
seasonality does not change over time. This fixed seasonality approach has been
criticized for neglecting economic structural changes which could have an impact on
seasonality.
17.7 For this reason, seasonal adjustment techniques to estimate moving
seasonality have been developed. �ere are two main approaches: the moving average
method and the model-based method. The key premise of the moving average
method is that seasonality can be removed by applying moving average to the original
series. Due to advances in computer technology, more elaborated techniques have
become feasible, such as the widely used X-11 variants, especially X-12-ARIMA
developed by the U.S. Census Bureau.
17.8 The X-12-ARIMA process consists of three main steps: prior adjustment,
seasonal adjustment by moving averages (X-11 method), and diagnostics. First, prior
adjustment is performed by applying regARIMA (regression model with ARIMA
errors) to the original series. The treatment of outliers and adjustment of calendar
effects are carried out in this step. Next, by applying moving averages to the data
adjusted in the previous step, seasonal variations are removed. In the �nal step, the
quality of seasonal adjustment is assessed. Spectrums, sliding spans, and revision
history are the tools for such diagnostics.
17.9 In contrast, the model-based method assumes that the trend, cyclical,
seasonal, and irregular components follow stochastic processes (like ARIMA). Each
component is estimated using signal extraction techniques – SEATS developed by
the Bank of Spain being the best known technique. �e Census Bureau incorporated
X-11 and SEATS into a uni�ed system, X-13ARIMA-SEATS.

232 ┃┃ 한국은행
Korean System of National Accounts
3. Seasonal Adjustment of GDP in Korea
17.10 From September 1999, seasonally adjusted GDP �gures have been released
to the public. For most GDP series, appropriate regARIMA models are set once a year
and the projected seasonal factors are produced for the current year. Consequently,
there is no revision of seasonally adjusted �gures during the course of a single year. At
the time of revising seasonal factors, the �gures for the previous 9 years are revised.
However, at the benchmark year which is set every 5 years, the whole series is revised.
17.11 Since di�erent seasonal adjustment options (detection of outliers, treatment
of calendar effects, and ARIMA models) produce different results, the seasonal
adjustment process should be well de�ned. �e Bank of Korea annually reports the
assessment measures for stability and the quality of seasonally adjusted statistics
and the revisions of seasonal factors in the periodical Quarterly National Accounts
(available in Korean only).
4. Recommendation for Using Seasonally Adjusted Figures
17.12 Seasonally adjusted figures still contain irregular variations. For this
reason, quarter-on-quarter growth rates can show severe fluctuations. Therefore,
it is dangerous to gauge economic trends using a single quarterly growth rate or
annualized growth rate. In order to �nd the fundamental �ow of GDP, it is better to
use the rate of change based on moving averages taken over 2 or 3 quarters or a trend
cycle component. However, trend-cycle values at the end of a series are more likely to
be revised than those at the center of the series.

BANK OF KOREA ┃┃ 233
Ⅴ. Technical Issues
Chapter 18: Chain-Linking Method
1. Overview
18.1 Given the steady advances in information and communications technology,
the prices of ICT-related goods can drop sharply and the industry’s structure
dramatically change. In this situation, a �xed-weighted method can distort real GDP
statistics over time. Conversely, a chain-linked method which adopts the previous
year’s price weight every year can much more readily re�ect technological, industrial
or economic changes. Consequently, international organizations related to national
accounts, such as the UN, IMF, and OECD, recommend the chain-linked method for
compiling real GDP. For this reason, the KSNA adopted this method when the tenth
rebasing of the Korean National Income Statistics took place with 2005 selected as the
new reference year.
2. Basic Comprehension of Indices
A. Index Concept
18.2 An index is an indicator which measures comparative inter-temporal or
inter-spatial changes of quantities or numbers. Two methods can measure changes
between temporal points: one compares two temporal points directly, and the other
compares two points by studying intermediate temporal points cumulatively. Because
an index represents a relative scale, it needs a comparison point, which is called a
reference base.
B. Type of Index
18.3 Indices are used in a variety of fields, especially in economics in the form
of a price index or quantity index. There are many kinds of price and quantity
indices depending on the method of applying weights and calculating the mean. �e
variability of weights determines if an index is “�xed” or “chained.”
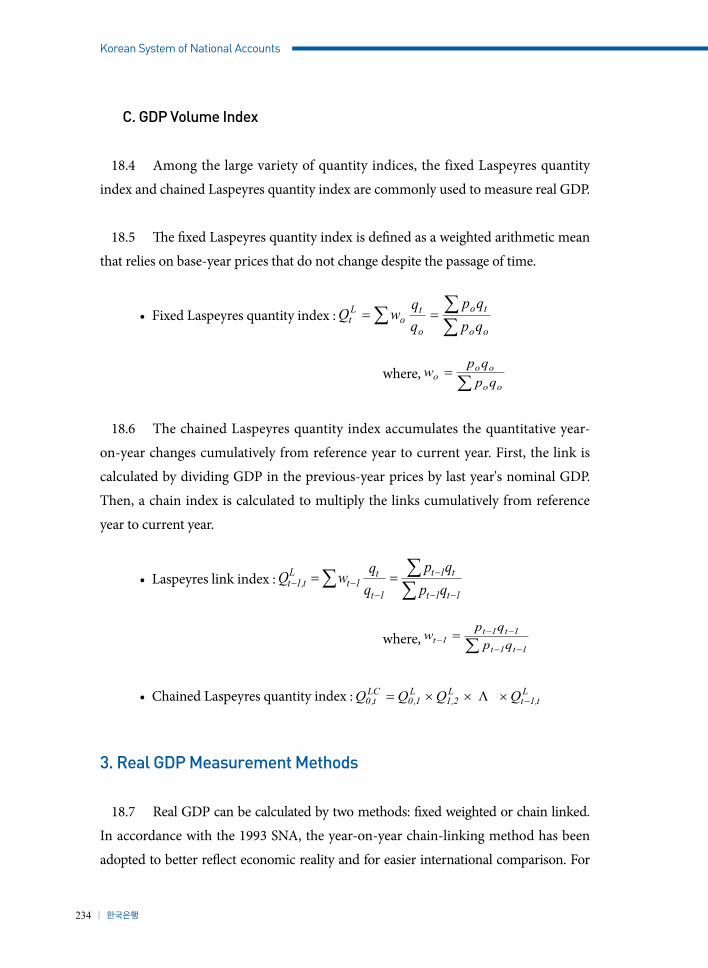
234 ┃┃ 한국은행
Korean System of National Accounts
C. GDP Volume Index
18.4 Among the large variety of quantity indices, the fixed Laspeyres quantity
index and chained Laspeyres quantity index are commonly used to measure real GDP.
18.5 �e �xed Laspeyres quantity index is de�ned as a weighted arithmetic mean
that relies on base-year prices that do not change despite the passage of time.
• Fixed Laspeyres quantity index :
where,
18.6 The chained Laspeyres quantity index accumulates the quantitative year-
on-year changes cumulatively from reference year to current year. First, the link is
calculated by dividing GDP in the previous-year prices by last year's nominal GDP.
Then, a chain index is calculated to multiply the links cumulatively from reference
year to current year.
• Laspeyres link index :
where,
• Chained Laspeyres quantity index :
3. Real GDP Measurement Methods
18.7 Real GDP can be calculated by two methods: �xed weighted or chain linked.
In accordance with the 1993 SNA, the year-on-year chain-linking method has been
adopted to better re�ect economic reality and for easier international comparison. For

BANK OF KOREA ┃┃ 235
Ⅴ. Technical Issues
this reason, Korea also adopted the annual chain-linking method to measure real GDP.
A. Fixed-weighted Method
18.8 �e real GDP calculated by a �xed-weighted method is de�ned as the sum
of current year quantities multiplied by base year prices, or stated as a formula:
• Fixed Laspeyres quantity index
(where, )
• Real GDPt :
• Growth rate of real GDPt(%)
B. Chain-linked Method
18.9 Links representing changes in quantity compared to the previous year
are calculated first, and chain indices are compiled by multiplying these links
cumulatively. Finally, real GDP at chained prices is derived by multiplying GDP at the
reference year by the chain index for the year. �is process can be expressed by using
the chain index below:
• Laspeyres link
(where, )
• Laspeyres chain index :

236 ┃┃ 한국은행
Korean System of National Accounts
• Real GDPt : or
• Growth rate of real GDPt(%)
18.10 As shown in the formulas above, the most outstanding characteristic of a
chain-linked method is that the growth rate of real GDP is calculated on the basis
of the previous year's weight and prices, which are very relevant to the current year.
Another noticeable feature is that the change in weights, which is closely related to
changes in relative prices and technical structures, is re�ected in real GDP estimates.
18.11 Table Ⅴ-18-1 shows the simpli�ed formulas for the �xed- and chain-linked
methods.
Table Ⅴ-18-1 Comparison of Real GDP Compilation Formulae
Fixed-weighted Method Chain-linked Method
QuantityIndex
(Laspeyres)where,
( : chain index, : link)
Weights (changing every year)
RealGDP
(amount)
GDPt = GDPt =
GrowthRates(%)

BANK OF KOREA ┃┃ 237
Ⅴ. Technical Issues
4. Chain-linked Method: Advantages and Disadvantages
A. Advantages
18.12 �e most desirable advantage of a chain-linked method compared to a �xed-
weighted method is that it better re�ects economic reality.
18.13 Since a �xed-weighted method applies the same price weights from the base
year to all the comparative years, real GDP can be distorted and slow to re�ect recent
economic changes. In a �xed-weighted method, substitution bias, which is de�ned as
over or under estimation of a growth rate by failing to adopt the relative price changes,
becomes a major problem.
18.14 In comparison, since the change in weights is re�ected every year, a chain-
linked method can mitigate substitution bias. Moreover, it can solve the problem of
potentially rewriting history. When applying a �xed-weighted method, all the growth
rates of the time series are subject to change according to the changing base year.
But there is no need to change the growth rate of the time series with a chain-linked
method as this method changes the base year every year.
B. Disadvantages
18.15 The biggest disadvantage of a chain-linked method is that the aggregate
value at chained prices is not identical to the sum of its components because of its
non- additivity. However, according to the 1993 SNA, additivity is satisfied in only
special cases such as with a �xed Laspeyres index, and the non-additivity of a chain-
linked method is merely a mathematical anomaly that does not signi�cantly detract
from its advantages.
18.16 In addition, a chain-linked method needs more price information than a
�xed-weighted method and requires more detailed calculations.

238 ┃┃ 한국은행
Korean System of National Accounts
5. Complications with Real GDP Use
18.17 Due to the non-additivity, using real GDP statistics can pose some problems.
First of all, when an ordinary contribution formula is used, the sum of subsectors’
contributions to GDP growth may not equal the GDP growth rate. And the sum of
the subsectors’ real value may not equal aggregate real value. �ese problems come
from the characteristics of non-additivity in the chain-linked method.
18.18 To solve these problems, the Bank of Korea regularly posts a revised
contribution formula which satisfies the additivity on ECOS (the Bank of Korea's
online economic statistics system). Also, the Bank of Korea provides addition and
deduction programs for chained real GDP on ECOS.
BANK OF KOREA ┃┃ 239
Ⅴ. Technical Issues
Chapter 19: Benchmarking Method
1. Introduction
19.1 Annual estimates of GDP are fundamentally different from quarterly
estimates in regard to data sources and compilation methodologies. When compiling
quarterly preliminary estimates, reliable data are seldom available. For the timeliness
of GDP, monthly, quarterly indicators or sampling survey results are used. Conversely,
there are supply and use tables, census results, and much more reliable information
for annual estimates (especially annual final estimates). Therefore, inconsistency
between quarterly and annual estimates is common.
19.2 Benchmarking is the statistical adjustment process which combines quarterly
data with annual data in a consistent time series. Through benchmarking, short-
term movements of quarterly estimates are preserved, while the annual benchmarks
are used for long-term movements. To maintain the temporal consistency of GDP,
benchmarking should be an essential part of the compilation process.
2. Benchmarking Methods
19.3 Benchmarking techniques can be categorized into two main approaches:
numerical and statistical modeling. �e main advantage of the numerical approach
is that there is no need to set a statistical model for quarterly national accounts. �e
numerical approach includes the family-of-Denton, Bassie, and other methods. As
for the statistical modeling approach, there are the Chow-Lin, the generalized-least-
squares (GLS) regression model, and other methods (refer to the IMF’s Quarterly
National Accounts (QNA) manual or Eurostat for detailed explanations of the
di�erent techniques). Among the various benchmarking methods, the proportional-
Denton method is the most widely used. Its main advantages are summarized below:
1) It is easier to understand and implement since it uses a quadratic-minimization
method.

240 ┃┃ 한국은행
Korean System of National Accounts
2) It e�ectively preserves the quarter-to-quarter changes (short-term movement) of
the original estimates.
3) Unlike the additive Denton, it adjusts the original values in proportion to the
level of each observation.
19.4 Benchmarking deals with two problems: distribution (quarterization) and
extrapolation. Distribution refers to the process which aligns historical quarterly data
to annual benchmarks. On the other hand, extrapolation is the adjustment process
for the most recent period when the annual value is not yet available. For desirable
extrapolation, it is important to forecast future annual data or an annual benchmark
to indicator BI ratio precisely.
19.5 Setting the reference year as 2010, the Bank of Korea adopted the
proportional-Denton method primarily to maintain temporal consistency between
preliminary estimates of GDP and �nal annual estimates.
3. Step Problem
19.6 The simple way to remove discrepancies between quarterly and annual
estimates is to distribute the annual total according to the proportions of quarterly
values within a year. �is is called “prorating” and can be formulated as below.
where, is the benchmarked value for quarter of year ;
is the value of the indicator or original quarterly estimates;
is the annual benchmark for year .

BANK OF KOREA ┃┃ 241
Ⅴ. Technical Issues
�e annual BI ratio is contained here in the second line of the previous formula,
19.7 Since the discrepancies vary between years, prorating could cause a break
between years (i.e. between the fourth quarter of one year and the �rst quarter of the
next year). As shown in Table Ⅴ-19-1, the step problem can be found in every �rst
quarter. �is occurs since the annual BI ratios are di�erent between years.
Table Ⅴ-19-1 Prorating and Step Problem
Quarter
Original SeriesAnnualBench-mark
AnnualBI
ratio
Distributed DataQuarterlyBI ratios(=B/A)Value
Quarterlygrowth
rates (%)Value
Quarterlygrowth
rates (%)
Year 1. 1 5,324 5,324 1.000
2 4,591 4,591 1.000
3 4,654 4,654 1.000
4 4,457 4,457 1.000
Total 19,026 19,026 1.000 19,026
Year 2. 1 5,764 29.3 5,822 30.6 1.010
2 4,770 -17.3 4,818 -17.3 1.010
3 4,944 3.6 4,994 3.7 1.010
4 4,519 -8.6 4,565 -8.6 1.010
Total 19,997 20,199 1.010 20,199
Year 3. 1 6,232 37.9 5,822 35.2 0.990
2 4,958 -20.5 4,818 -20.5 0.990
3 5,372 8.4 4,994 8.4 0.990
4 4,580 -14.8 4,565 -14.8 0.990
Total 21,142 20,930 0.990 20,199
4. Proportional-Denton Method
19.8 �e proportional-Denton method prevents the step problem by minimizing
di�erences between neighboring quarterly BI ratios as follows.

242 ┃┃ 한국은행
Korean System of National Accounts
subject to
where, is the benchmarked quarterly value;
is the value of the indicator or original quarterly estimates;
is the annual benchmark for year y;
is the last year with annual benchmarks.
19.9 Regarding distribution and extrapolation, the proportional-Denton method
has the following features.
Distribution : �e average of quarterly BI ratios within a year equals the annual BI
ratio. �e quarterly BI ratios are smooth in order to relieve the step problem.
Extrapolation : For those quarters when the annual benchmark is not available
( ), the values are adjusted using the BI ratio for the last quarter of the last
benchmark year. �at is,
19.10 The second line of the formula above shows that extrapolation in the
proportional-Denton method uses growth rates from the last quarter of the last
benchmark year.
19.11 As in Table Ⅴ-19-2, the proportional-Denton method reduces the size of
breaks between years when compared to the prorating result in Table V-19-1. Instead,

BANK OF KOREA ┃┃ 243
Ⅴ. Technical Issues
the quarterly values for year 1 are adjusted even when the annual BI ratio is equal to
1. �is is needed for quarterly BI ratios to be as smooth as possible. When the annual
benchmark for the previous year is still unavailable, the ratio for the last quarter of the
last benchmark year is used for the BI ratio. For example, the BI ratio from Q4 Year
2 (1.013) was used as the BI ratio for Year 3. If the annual BI ratio for Year 3 is found
to deviate widely from 1.013, substantial revisions of the extrapolation results will be
made.
Table Ⅴ-19-2 Benchmarking by the Proportional-Denton Method
Quarter
Original SeriesAnnualBench-mark
AnnualBI
ratio
Benchmarked DataQuarterlyBI ratios(=B/A)
Value(A)
Quarterlygrowth
rates (%)
Value(B)
Quarterlygrowth
rates (%)
Year 1. 1 5,324 5,315 0.998
2 4,591 4,585 0.999
3 4,654 4,655 1.000
4 4,457 4,471 1.003
Total 19,026 19,026 1.000 19,026
Year 2. 1 5,764 29.3 5,804 29.8 1.007
2 4,770 -17.3 4,817 -17.0 1.010
3 4,944 3.6 5,002 3.8 1.012
4 4,519 -8.6 4,576 -8.5 1.013
Total 19,997 20,199 1.010 20,199
Year 3. 1 6,232 37.9 6,313 38.0 1.013
2 4,958 -20.5 5,022 -20.5 1.013
3 5,372 8.4 5,442 8.4 1.013
4
Total ? ?
19.12 It may be possible to reduce the size of the probable revision by forecasting
the next annual BI ratio. In order to do this, it is important to �nd a systematic pattern
among annual BI ratios from the past movements. By including the forecast values
of the next annual BI ratio, the proportional-Denton method can be enhanced as
follows:

244 ┃┃ 한국은행
Korean System of National Accounts
subject to ①
①
Where is the quarterly BI ratio;
is the observed annual BI ratio for the back series;
is the forecast of annual BI ratio for the forward series;
Forecasting the annual BI ratio correctly is a di�cult process, given the complexity
of �nding the systematic movement of BI ratios. Given this situation, it is preferable to
avoid incorporating the forecast information into the benchmarking process.


BANK OF KOREA ┃┃ 247
Appendices
1. Classifications
1.1 Sector Classifications
The 2008 SNA classifies resident institutional unit by one of five institutional sectors, according to its principal function, behavior and purpose. An institutional unit is de�ned as an economic entity that is capable, in its own right, of owning assets, incurring liabilities and engaging in economic activities and in transactions with other entities. �e institutional sector is composed of non-�nancial corporations, �nancial corporations, general government, households and non-profit institutions serving households. Such classi�cation by institutional sector makes it possible to analyze the e�ect economic policy has had on each sector: non-�nancial corporations, �nancial corporations, general government, households, non-profit institutions serving households, the rest of the world.
A. Total Economy
(1) Non-financial corporations
The non-financial corporations sector consists of corporations and quasi-corporations which produce goods and non-�nancial services.
A quasi-corporation is defined as an unincorporated enterprise which has a complete accounting system like an incorporated enterprise.
(2) Financial corporations
�e �nancial corporations sector is composed of corporations and quasi-corporations whose principal activity is financial intermediation or financial auxiliary services.
Appendices

248 ┃┃ 한국은행
(3) General government
�e general government is an institutional unit that mainly produces non-market goods and services for individual or collective consumption. �e government provides goods and services at prices below what is considered economically signi�cant and supplies collective services such as defense, public administration and public health services free of charge.
(4) Household
A household is defined as a group of persons who share the same living accommodations; who pool some, or all, of their income and wealth; and who consume certain types of goods and services collectively, primarily housing and food. The main function of a household is to supply labor and final consumption expenditures, and it may also function as a non-corporation enterprise producing goods and services.
(5) Non-profit institutions serving households (NPISHs)
�e non-pro�t institutions serving households sector comprises institutional units which provide goods and services free of charge or at prices below those considered economically significant and which fund their principal resources through the spontaneous charity of households.
B. The Rest of the World
The ROW sector is composed of resident units and all non-resident institutional units engaged in economic relations.
Korean System of National Accounts

BANK OF KOREA ┃┃ 249
1.2 Functional Classification
�e 2008 SNA proposes functional classi�cation as a means to separate transactions by producers and institutional sectors. The classification’s four items appear below. �e o�cial Korean SNA has adopted all of them except the classi�cation of outlays of producers by purpose (COPP).
A. Classification of Individual Consumption by Purpose (COICOP)
• Food and non-alcoholic beverages• Alcoholic beverages and tobacco• Clothing and footwear• Housing, water, electricity, gas and other fuels• Furnishings, household equipment and routine household maintenance• Health• Transport• Information and communications• Recreation, sport and culture• Education services• Restaurants and accommodation services• Miscellaneous goods and services
B. Classification of the Functions of Government (COFOG)
• General public services• Defence• Public order and safety• Economic a�airs• Environmental protection• Housing and community amenities• Health• Recreation, culture and religion• Education• Social protection
Appendices

250 ┃┃ 한국은행
C. Classification of the Purposes of Non-profit Institutions Serving Households (COPNI)
• Health• Recreation and culture• Education• Social protection• Others
1.3 Industry and Product Classification
�e Korean System of National Accounts (KSNA) classi�es industries and products based on the Korean Standard Industrial Classification (KSIC) and Input-Output Tables. The 15 relevant economic activities used to define separate parts in the national account are listed below:
• Agriculture, forestry and �shing• Mining• Manufacturing• Electricity, gas and water supply• Construction• Wholesale and retail trade, accommodation and food services• Transportation• Finance and insurance• Real estate• Information and communication• Business activities• Public administration, defence and other government services• Education• Human health and social work• Cultural and other services
Korean System of National Accounts

BANK OF KOREA ┃┃ 251
1.4 Assets Classification
An asset is a store of value representing a bene�t or series of bene�ts accruing to the economic owner by holding or using the entity over a period of time. In the KSNA, assets are classi�ed as non-�nancial assets and �nancial assets/liabilities.
A. Non-financial assets
Non-�nancial assets are further subdivided into those that are produced and those that are non-produced.
(1) non-�nancial produced assets are de�ned as those assets which are the result of a production process. In addition, these assets are composed of fixed assets, inventories and valuables.
(2) non-financial non-produced assets are defined as those assets which are produced by nature. �e assets are divided into three categories, land, mineral and energy reserves, and standing timber assets.
B. Financial assets/liabilities
Financial assets are defined as those assets which have corresponding liabilities. According to the 2008 SNA, �nancial assets consist of gold and SDRs; currency and deposits; insurance and pension reserves; securities other than shares; loans; shares and other equities; �nancial derivatives; and other accounts receivable/payable.
Appendices

252 ┃┃ 한국은행
2. Using the Economic Statistics System (ECOS)
�e Economic Statistics System (ECOS) is the Bank of Korea's website (http://ecos.bok.or.kr) built to make economic statistics available to the general public online in Korean and English. �e Bank of Korea announces national accounts (advance and preliminary) quarterly and annually through press releases and online through ECOS.
Users of the statistics can conveniently search through the varied and detailed national income statistics listed on ECOS at any time, convert them into rates of change (compared to the previous quarter, year-on-year, etc.) and three-period moving averages, as well as depict them in various types of graphs. They can also download their search results in the form of EXCEL �les.
ECOS includes not only detailed statistical data related to national income, but also lists the release methods and release calendars for these statistics, along with such statistical commentary publications as Korean Quarterly National Accounts and Korean System of National Accounts.
For further information about the use of national income statistics in ECOS, please contact the National Accounts Coordination Team at the Bank of Korea (+82-2-759-4380, 5286), or leave a message on ECOS’s "Questions and Answers" board.
Korean System of National Accounts

BANK OF KOREA ┃┃ 253
Index
< A >
accrual basis 9.301accumulation account 5.6accumulation of capital 1.11additivity 18.15advance quarterly estimate 12.1advertising services 9.197agriculture, forestry and �shing 9.4
< B >
balancing item 11.9base year 2.8, 18.13basic price 7.6basic metal 9.38benchmarking method 19.3broadcasting 9.183building construction 9.78business support services 9.202
< C >
capital formation 10.48capital goods 10.48capital transactions account 13.18central bank 9.137central government 9.218chain-linked method 18.1changes in inventories 10.83chemicals and chemical (products) 9.38circular �ow of income TableⅠ-1-1classi�cation by industrial type 9.53classi�cation of individual consumption by purpose (COICOP) Table Ⅲ-10-2classi�cation of the purposes of non-pro�t institutions serving households (COPNI) Table Ⅲ-10-2coal mining 9.22collective service 10.38commodity �ow method Box Ⅲ-10-1compensation of employees 6.34, 11.5computer, electronic and optical products 9.38, Table Ⅲ-9-6construction industry 9.76construction investment 10.62consumption of �xed capital 6.57
Index

254 ┃┃ 한국은행
cultivation 9.5cultural and recreational services 10.106cultural and other services 9.275current account Table Ⅱ-5-2current taxes on income, wealth Table Ⅲ-9-34, 11.22current transactions 13.22current transfer 6.44current-year price 7.22
< D >
depository institution 9.137direct purchases abroad by resident households 10.29direct purchases in the domestic market by non-resident households 10.29disposable income 11.28disposal of income 5.3distribution of income 1.9, 11.1domestic �nal demand 10.67domestic investment 13.13double-de�ation method 8.14
< E >
economic scale 13.5economically signi�cant price 6.17ECOS Appendiceselectricity supply industry 9.55electricity, gas and water supply 9.54entertainment services 9.276expenditure approach 8.4, 10.1exports and imports of goods and services 10.93external transaction account 5.11extraction of crude petroleum and natural gas 9.21
< F >
FOB (freight on board) 7.16facility investment 10.66�nal annual estimates 12.1�nal consumption expenditure 10.19�nal consumption expenditure of NPISHs 10.23�nance and insurance 9.135�nancial auxiliaries 9.143�nancial intermediation services indirectly measured(FISIM) Box Ⅲ-9-2�shing 9.8�nancial investment funds 9.138�xed assets 6.52, 10.49
Korean System of National Accounts

BANK OF KOREA ┃┃ 255
�xed-weighted method 18.8�ow of funds accounts 1.4food, beverages and tobacco 9.38forestry 9.7
< G >
gas, steam and air conditioning supply 9.57general government 9.215GNI per capita 13.4Goods sent abroad for processing 3.5, 7.15government consumption expenditure 10.36gross domestic product 1.2, 10.4, 13.1gross �xed capital formation 10.48gross �xed investment 10.48gross investment ratio 16.19gross savings ratio 16.19gross value added 9.2, 14.2
< H >
heavy and civil engineering 9.79household services 9.283housing services 9.167human health and social work services 9.256
< I >
import facility investment 10.68income 1.3, 11.1income approach 11.1industry and product classi�cation Appendicesinformation and communication 9.52, 9.182Input-Output table 1.4Intellectual property product investment 10.56intermediate consumption 1.3, 7.8
< K >
Korea Standard Industry Classi�cation(KSIC) Appendices
< L >
labor share 13.15life insurance corporations 9.140link 18.6, 18.9livestock 9.6
Index

256 ┃┃ 한국은행
living and other type industry 9.53local government 9.219, Table Ⅲ-9-29
< M >
machinery equipment 9.38, Table Ⅲ-9-6maintenance and repair services 9.38manufacturing 9.38margin ratio 9.115market output 14.2market price 7.7market producer 10.23markup ratio 9.115merchanting 3.6metallic ore mining 9.24mining and quarrying 9.21motion picture 9.182
< N >
national accounts 1.6national balance sheet 4.1national educational institutions 9.241national income 1.2national income statistics 12.2net tax 6.38net value added 14.2nominal 7.22, 8.11nominal value added ratio Box III-9-1non metallic mineral mining 9.25non metallic mineral products 9.38non-life insurance corporations 9.142non-market output 6.18, 14.2non-market producers 10.23non-produced assets 10.50non-pro�t institutions serving households (NPISHs) 6.13non-residents 7.15, 10.113NPIs 9.221
< 0 >
operating surplus/mixed income 6.39other �nancial intermediaries 6.10other manufacturing industries 9.38other service activities 9.275other subsidies on production 9.299other taxes on production 9.298
Korean System of National Accounts

BANK OF KOREA ┃┃ 257
output 6.16output for own �nal use 6.16, 14.2own consumption 9.300own �nal use 6.16, 10.21, 14.2owner-occupied dwelling 9.168
< P >
personal services 9.279petroleum, coal 9.38preliminary annual estimates 12.1preliminary quarterly estimates 12.1primary materials-type industry 9.53private consumption 10.20private consumption expenditure 10.20private for-pro�t education organizations 9.244private non-pro�t educational organizations 9.243processing assembly-type industry 9.53producer’s prices 7.6production account 6.16production approach 8.2, 9.1production cost 7.7professional, scienti�c and technical services 9.195property income payable 9.145property income receivable 9.145proportional-Denton method 19.8purchaser's prices 7.8
< Q >
quarter-on-quarter growth rates 17.12
< R >
ratio of exports and imports to GNI 16.17real 7.22real estate 9.166real estate-related services 9.171receipts from commodity and non-commodity sales 10.39reference rate Box III-9-2renting of equipment 9.202Renting of non-residential buildings 9.169Research and development (R&D) 9.214residents 6.15, 10.102retail industry 9.108
Index

258 ┃┃ 한국은행
< S >
seasonal adjustment 17.5social organizations 9.282social security bene�ts 10.39social security funds 9.220social work activities 9.258specialized construction 9.80sports and amusement services 9.277statistical discrepancy 13.3step problem 19.6stock 10.82subsidies 6.38, 9.315subsidies on products 9.300system of national accounts 1.5, 4.1
< T >
taxes and subsidies on production and imports 6.38taxes on production and import 9.296taxes on products 9.296textiles and leather 9.38total supply Box Ⅲ-10-1trade margin 6.23, 9.115trading gains and losses from changes in the terms of trade 16.1transaction 3.4, 4.2transportation 9.215transport equipment 9.38
< V >
value added 6.31
< W >
water supply, sewage and waste management, remediation services 9.59weight 18.1wholesale and retail trade 9.106wholesale and commission trade industry 9.107wood, paper, printing and reproduction 9.38work-in-progress 6.55, 7.14
< X >
X12-ARIMA 17.8
Korean System of National Accounts

BANK OF KOREA ┃┃ 259
Reference
System of National Accounts 1993, Commission of the European Communities-Eurostat, IMF, OECD, UN, World Bank, 1993.
System of National Accounts 2008, Commission of the European Communities-Eurostat, IMF, OECD, UN, World Bank, 2008.
The European System of Accounts, Eurostat, 1995.
The European System of Accounts, Eurostat, 2010.
Quarterly National Accounts Manual: Concepts, Data Sources, and Compilation, IMF, 2001
Reference