2020 annual report: state of nonprofits and philanthropy
TRANSCRIPT

University of San Diego University of San Diego
Digital USD Digital USD
State of Nonprofits in San Diego The Nonprofit Institute
10-2020
2020 Annual Report: State of Nonprofits and Philanthropy in San 2020 Annual Report: State of Nonprofits and Philanthropy in San
Diego Diego
Laura Deitrick University of San Diego
Tessa Tinkler University of San Diego
Jon Durnford Datalake Nonprofit Research
Thomas Abruzzo University of San Diego
Taylor Funderburk University of San Diego
See next page for additional authors
Follow this and additional works at: https://digital.sandiego.edu/npi-stateofnp
Part of the Nonprofit Administration and Management Commons
Digital USD Citation Digital USD Citation Deitrick, Laura; Tinkler, Tessa; Durnford, Jon; Abruzzo, Thomas; Funderburk, Taylor; and Meschen, Connelly, "2020 Annual Report: State of Nonprofits and Philanthropy in San Diego" (2020). State of Nonprofits in San Diego. 17. https://digital.sandiego.edu/npi-stateofnp/17
This Report is brought to you for free and open access by the The Nonprofit Institute at Digital USD. It has been accepted for inclusion in State of Nonprofits in San Diego by an authorized administrator of Digital USD. For more information, please contact [email protected].

Authors Authors Laura Deitrick, Tessa Tinkler, Jon Durnford, Thomas Abruzzo, Taylor Funderburk, and Connelly Meschen
This report is available at Digital USD: https://digital.sandiego.edu/npi-stateofnp/17

Stories of Strength, Resilience, and Innovation
Presented by:The Nonprofit Institute
October 2020

About The Nonprofit InstituteMission: The Nonprofit Institute (NPI) is committed to providing education, training, and research to build leaders and strengthen organizations that help meet critical community needs.
Vision: The Nonprofit Institute envisions a world where ethical, compassionate leaders and strong organizations are working together toward a more inclusive, just society and healthy planet.
Research Team
Laura Deitrick, PhDAssociate DirectorThe Nonprofit Institute
Tessa Tinkler, PhDSenior Research AssociateThe Nonprofit Institute
Jon Durnford, MBAPrincipalDataLake, LLCResearch AssociateThe Nonprofit Institute
Cite AsDeitrick, L., Tinkler, T., Abruzzo, T., Durnford, J., Funderburk, T. (2020). Annual Report: State of Nonprofits and Philanthropy in San Diego. San Diego, CA: The Nonprofit Institute, University of San Diego.
Copyright © 2020. All Rights Reserved.
The Nonprofit InstituteSchool of Leadership and Education SciencesUniversity of San Diegosandiego.edu/nonprofit
‘Together’ Image: Adi Goldstein
Data SourcesThe Nonprofit Institute. (2020). 2020 State of Nonprofits Quarterly Index.The Nonprofit Institute. (2020). 2020 Nonprofit Leaders Surveys.IRS Business Master File (BMF) of exempt organizations, circa 2018.IRS Form 990 and 990-EZ public charity returns, circa 2012-2018 (IRS e-File and GuideStar digitized datasets), DataLake, LLC (www.datalake.net).Labor Market Information Division, California Economic Development Department (2019).
Notes• Full technical appendices available at:
https://www.sandiego.edu/soles/nonprofit/resources/nonprofit-quarterly/
• Due to rounding, some charts and tables may not add to 100%• Some quotes have been edited for readability
Report SponsorsResearch supported by the Caster Family Center for Nonprofit and Philanthropic Research at University of San Diego.
Additionally, we recognize and thank our annual report sponsors:
Thomas Abruzzo, MADoctoral Research AssistantThe Nonprofit Institute
Taylor Funderburk, MAResearch AssociateThe Nonprofit Institute
Connelly Meschen, MArchAssistant Director of Operations and AdministrationThe Nonprofit Institute

IntroductionThe year 2020 has become one of reckoning – as a time for reflection and hindsight about how we got to this point of crisis, as well as one for envisioning a new path forward. As the pandemic shows no sign of abating, the disruption wrought by COVID-19 is broad and deep for nonprofits, their leaders, and constituents.
Nonprofits find themselves at the epicenter of colliding crises, as San Diegans confront systemic inequities which have been laid bare in this pandemic. Low-wage communities and communities of color have felt the disproportionate impacts of the unfolding public health and economic crises, exacerbated by poor air quality which has worsened with extreme weather-induced wildfires. Protests for racial justice and an increasingly polarized electorate are challenging us to find new ways for fostering meaningful dialogue where San Diegans can come together to find common ground with local data, information and analysis from trusted sources.
Essential nonprofit workers and organizations that provide our community safety net and enhance our quality of life are grappling with how to best navigate unprecedented disruptions. Declining revenue from cancelled events and programs, along with changes to charitable giving have induced a hollowing out of this essential workforce through a substantial number of staff furloughs and layoffs. More broadly, nonprofit leaders are reexamining their missions and asking painful questions about their role in perpetuating and addressing inequity.
The 2020 State of Nonprofit and Philanthropy Report synthesizes findings from three nonprofit leader surveys (including COVID-19 impacts surveys), public opinion polling, and other sources of nonprofit data to provide the most up to date and holistic picture of this essential sector. The story that emerges is both hopeful and concerning. Some nonprofits have adapted quickly by finding new ways to collaborate, leveraging capacity, and more effectively advocating together for those they serve. Yet, other nonprofits struggle to bridge digital divides and regain their financial footing. San Diego’s nonprofit sector is home to a wide variety of
organizations. Most are small with 85 percent of nonprofits reporting budgets under $1million. Throughout the report significant or noticeable differences between small and large organizations or organizational sub-sectors are called out. Nonprofit sub-sectors are categorized by the National Taxonomy of Exempt Entities (NTEE).
Collectively, the data point to three key themes around which this report is organized: strength, resilience, and innovation.Embedded within these themes are stories of growing divides and, simultaneously, a developing recognition of interconnectedness within the nonprofit sector. This paradox necessitates attention from nonprofit leaders, philanthropists, and the public actors that support the sector.
Key Findings:
● COVID-19 has adversely impacted most nonprofits in San Diego County, with nearly all organizations reporting decreased revenues and donations, resulting in widespread layoffs and furloughs of staff.
● Demand for nonprofit services is shifting as community needs change. In areas where demand is growing, inability to meet all the increased demand signifies community needs may be going unmet.
● Smaller nonprofits (budgets under $1 million), which comprise 85% of the San Diego nonprofit sector, reported more difficulty managing remote work environments and raising money in digital formats, than larger nonprofits (budgets over $1 million).
● More Human Service and Health related nonprofits report stronger financial positions while more Arts and Cultured organizations describe their financial position as weak.
● Black, Indigenous and People of Color (BIPOC) leaders are underrepresented in nonprofit leadership.
● Public trust in nonprofits remains high, however public confidence in nonprofits, government, and corporations to respond to COVID-19 is waning as the pandemic continues.
1

Through 2019, typical measures of nonprofit sector strength reflected regular growth in terms of assets, revenues, and employment (Figure 1). In fact, nonprofit sector growth has been steady for over a decade; some experts have even referred to nonprofit sector employment as recession proof. However, our research examining the impacts of COVID-19 on the nonprofit sector documents substantial layoffs and furloughs that, when coupled with decreased charitable contributions and program revenue, threaten the strength of San Diego’s nonprofit sector. While the effects of COVID-19 have touched all nonprofit organizations, negative financial impacts have been more profound in small nonprofits and in certain subsectors, such as education and arts and culture nonprofits (See our addendum report, Culture Shift: Measuring COVID-19 Impact on San Diego Arts and Culture Nonprofits).
Why is this important?A strong nonprofit sector benefits San Diegans both socially and economically. Every day, local, state, and federal government agencies call upon San Diego nonprofits to provide critical social services, education, and workforce development programs to benefit our region. Previous NPI research found that California nonprofits rely on government funding for an estimated 30% of the nonprofit sector’s total revenue.1 The corporate sector relies on nonprofits to sustain a quality of life in the region that is conducive to doing business. And, local nonprofits, especially arts and culture institutions and environmental nonprofits, are foundational to tourism, San Diego’s second largest trade economy.
In addition to social benefits, nonprofits are an integral, but often overlooked, component of San Diego’s economy, creating economic impact through business functions and employment. Strong nonprofits attract new dollars into our region through grants
and contracts for research and services. In turn, nonprofit sector jobs are created, initiating a multiplier effect when wages are spent in the local economy. In this respect, most San Diego nonprofits are much the same as small businesses but have the added benefit of a social purpose, often referred to as a double bottom line.
The weakening of nonprofit subsectors is cause for concern on two fronts. First, strong nonprofits are needed as part of the response to COVID-19, which has disproportionately impacted some of San Diego's most vulnerable populations. 2-1-1- San Diego continues to document growing need for food, shelter, and other emergency services typically provided by local nonprofits.
Furthermore, the findings of a newly released report from The San Diego Association of Governments (SANDAG) predict a loss of $12.4 billion in gross regional product.2 The research attributes COVID-19 to 176,000 lost jobs in San Diego County, two-thirds of which were in the tourism, education, and healthcare sectors. The concentration of nonprofit activity in these areas and the sector’s focus on workforce and business development, demonstrate a direct link between economic recovery in San Diego’s key industries and the recovery and strength of nonprofits.
Strong Nonprofits Vital to San Diego Economy and Recovery
31. California Association of Nonprofits & The Nonprofit Institute. (2019). Causes Count: The Economic Power of California’s Nonprofit Sector.2. SANDAG. (2020). COVID-19 Impacts on the San Diego Regional Economy. Six-Months of Economic Analysis Since Statewide Stay Home Order Began.

Pre-COVID-19 State of the Nonprofit Sector
11,898 REVENUE
$21BEXPENSES
$19.4BASSETS
$34.9B
NONPROFITSRegistered 501(c)(3)
Public Charities
+3.4% CONTRIBUTION SOURCESSpecial Events and Memberships 2.3%
Other Direct Contributions 45.8%Indirect Contributions 3.2%
Government Grants 48.6%
795PRIVATE
FOUNDATIONS
68% PROGRAM
REVENUES / FEES
26% CONTRIBUTION
REVENUES
5%OTHER
REVENUES
2017 to 2018
+3.4%2017 to 2018
$25.8 $27.6 $29.8
$32.1 $34.9
$15.8 $18 $18.3 $19.6 $21.1 $14.5 $16.3 $17.1 $18.1 $19.4
$0.0
$5.0
$10.0
$15.0
$20.0
$25.0
$30.0
$35.0
$40.0
2014 2015 2016 2017 2018
5 YEAR TREND OF REVENUE, EXPENSES, AND ASSETS (in billions)2014-2018
Assets —Expenses —Revenue —
4
Figure 1. Overview of the San Diego Region’s Nonprofit Sector3
3. Data are derived from most recently available IRS filings (circa 2018)
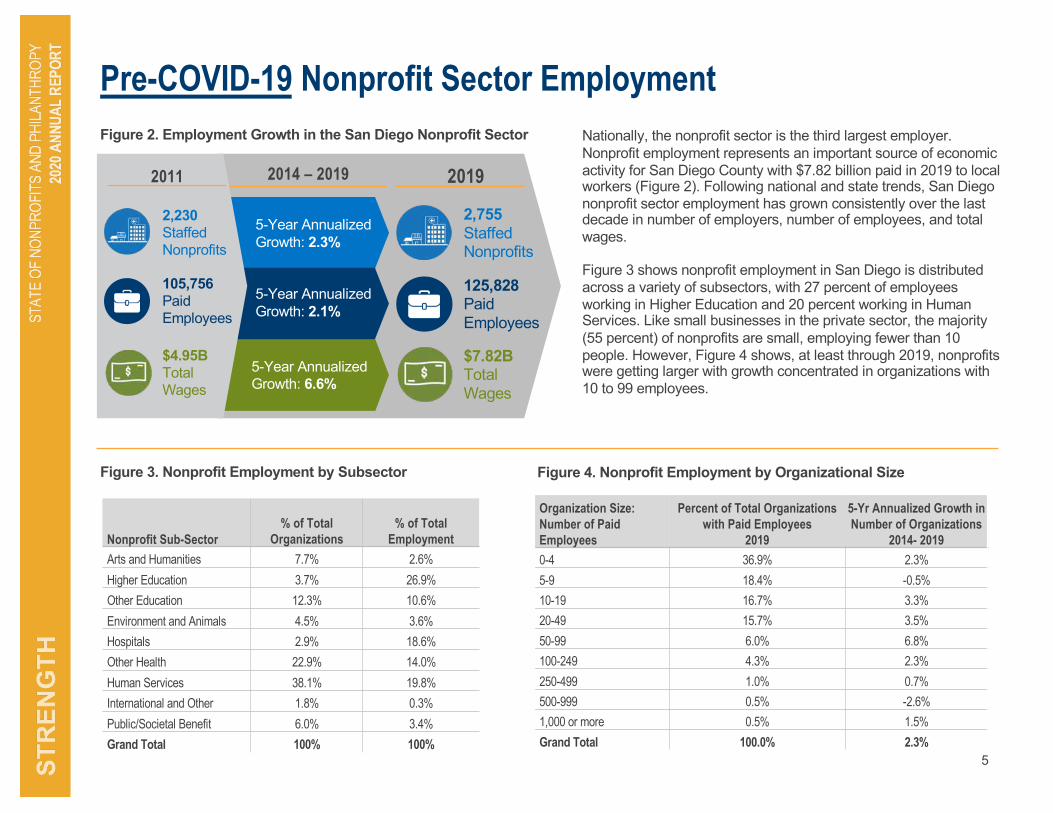
Pre-COVID-19 Nonprofit Sector EmploymentNationally, the nonprofit sector is the third largest employer. Nonprofit employment represents an important source of economic activity for San Diego County with $7.82 billion paid in 2019 to local workers (Figure 2). Following national and state trends, San Diego nonprofit sector employment has grown consistently over the last decade in number of employers, number of employees, and total wages.
Figure 3 shows nonprofit employment in San Diego is distributed across a variety of subsectors, with 27 percent of employees working in Higher Education and 20 percent working in Human Services. Like small businesses in the private sector, the majority (55 percent) of nonprofits are small, employing fewer than 10 people. However, Figure 4 shows, at least through 2019, nonprofits were getting larger with growth concentrated in organizations with 10 to 99 employees.
5-Year Annualized Growth: 2.3%
5-Year Annualized Growth: 2.1%
5-Year Annualized Growth: 6.6%
5
Figure 2. Employment Growth in the San Diego Nonprofit Sector
20192011
$4.95BTotal Wages
$7.82BTotal Wages
105,756Paid Employees
125,828Paid Employees
2,230Staffed Nonprofits
2,755Staffed Nonprofits
2014 – 2019
Organization Size: Number of Paid Employees
Percent of Total Organizations with Paid Employees
2019
5-Yr Annualized Growth in Number of Organizations
2014- 20190-4 36.9% 2.3%5-9 18.4% -0.5%10-19 16.7% 3.3%20-49 15.7% 3.5%50-99 6.0% 6.8%100-249 4.3% 2.3%250-499 1.0% 0.7%500-999 0.5% -2.6%1,000 or more 0.5% 1.5%Grand Total 100.0% 2.3%
Figure 3. Nonprofit Employment by Subsector
Nonprofit Sub-Sector% of Total
Organizations% of Total
EmploymentArts and Humanities 7.7% 2.6%Higher Education 3.7% 26.9%Other Education 12.3% 10.6%Environment and Animals 4.5% 3.6%Hospitals 2.9% 18.6%Other Health 22.9% 14.0%Human Services 38.1% 19.8%International and Other 1.8% 0.3%Public/Societal Benefit 6.0% 3.4%Grand Total 100% 100%
Figure 4. Nonprofit Employment by Organizational Size

Post-COVID-19: Operational Capacity Moving Toward RecoveryDespite the strong position of San Diego’s nonprofit sector at the end of 2019, the COVID-19 pandemic has had an unprecedented impact on nonprofit services, financial health, and employment. While the sector remains in flux, surveys conducted in March, April, and September offer some evidence of recovery as nonprofits have begun to resume more of their services and programs.
Figure 5 shows that, overall, organizations have increased their operational capacity since March. The percent of organizations that reported operating at a severely reduced capacity or not at all has decreased from 60% in March to 25% in September. Similarly, the percentage of organizations operating to a greater extent than usual has more than doubled from 12% in March to 27% in September.Operational capacity varies by nonprofit subsector. In the September survey, among organizations that reported they were
operating to a greater extent than usual, 59% were Human Service organizations. In contrast, of the organizations that reported operating in a severely reduced capacity, 50% were Arts and Culture organizations.
“”
Figure 5. Shifts in Current Operating Capacity Over Time
6
60%
47%
25%23% 24%
39%
5% 6% 9%12%
23%27%
Severely Reduced Capacity or Not at all Moderately Reduced Capacity To a Greater Extent Than Usual
MARCH
Same as We Always Do
APRIL SEPTEMBER
We do not have the ability to fully open our facilities and programs in order to offer our services due to the health order. Without ‘permission’ to do that, we will not be able to grow back to our former strength.
- Human Services: Youth Development

“”
Post-COVID-19: Impacts on Nonprofit FinancialsAs noted earlier in Figure 1, nonprofits derive revenue from two primary sources: fee-for-service program revenue and contributions (donations). The proportion of revenue sources depends on the size of the organization as smaller organizations rely more on contributed revenue, while larger organizations typically generate more program revenue. As shown in Figure 6, San Diego nonprofits reported losses in both revenue categories. More organizations (79 percent), report a loss of fee-for-service revenue due, in large part, to closures and program cancellations. Loss of fee-for-service revenue is highest for Arts and Culture nonprofits (Figure 7).
7
55%
33%
68%
64%
69%
46%
73%
75%
75%
78%
58%
96%
Human Services
Mutual PublicBenefit
Environment
Education(excludes
Higher Ed)
Public HealthClinics and
Other Health
Arts & Culture
Figure 7. Percent of Organizations by Nonprofit Sub-sector that Have Experienced Loss of Fee-for-Service Revenue or Individual Donations since March 1, 2020
We have essentially cut the organization to bare bones and are running on the strength of our volunteers and core staff positions. Unfortunately, most of our revenue generating departments have been closed, but our mission goes beyond those functions.
- Human Services
79%
16%53%32%
Yes Not Yet, but Anticipated No
Loss of Fee-for-Service Revenue
Decline in Individual Donations
Figure 6. Percent of Organizations that Have Experienced Loss of Fee-for-Service Revenue or Individual Donations since March 1, 2020
Loss of Fee-for-Service Revenue
Decline in Individual Donations

“”
Post-COVID-19: Shifting Demands for Nonprofit ServicesAlthough many nonprofits have had to pause or curtail services to comply with stay at home orders and physical distancing requirements, need for nonprofit services is growing. Half of all organizations reported increased demand for services, and more than one-quarter reported the demand has remained the same. Nearly all organizations attribute changes in demand to be in part a result of COVID-19. Furthermore, of those organizations that reported increased demand for services, only 14% reported being able to meet all increased demand, indicating substantial unmet need. As Figure 8 shows, changes in demand for services varied by subsector, with 40% of Arts and Culture organizations experiencing a decrease in demand while 69% of Human Services organizations experienced an increase in demand.
8
-19%
-40%
-7%
-8%
49%
18%
69%
63%
Total Sector
Arts, Culture, Humanities
Human Services
Mutual, Public, Societal Benefit
Figure 8. Changes to Demand for Nonprofit Services*
*Percentages do not add up to 100; 5% of respondents overall reported “Don’t Know” what current demand is
Demand hasDecreased
Demand hasRemained the Same
Demand hasIncreased
27%
31%
24%
17%
Only 14% of nonprofit leaders reported being able to meet all increased demand for
services, indicating there is substantial unmet need in the community.
[We are] changing our services to be successful in meeting the needs of people where they are because of COVID-19.
- Nonprofit Leader
*Excludes subsectors with fewer than 10 responses, including Animal Welfare, Higher Education, and International
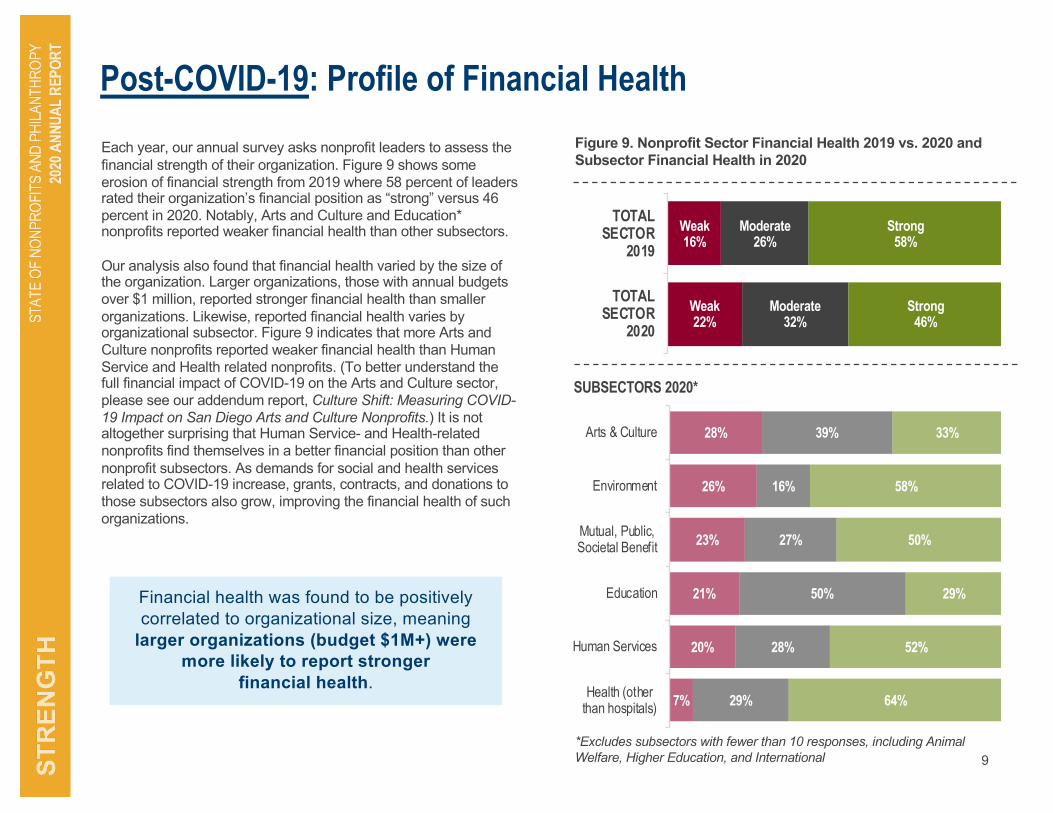
Post-COVID-19: Profile of Financial HealthEach year, our annual survey asks nonprofit leaders to assess the financial strength of their organization. Figure 9 shows some erosion of financial strength from 2019 where 58 percent of leaders rated their organization’s financial position as “strong” versus 46 percent in 2020. Notably, Arts and Culture and Education* nonprofits reported weaker financial health than other subsectors.
Our analysis also found that financial health varied by the size of the organization. Larger organizations, those with annual budgets over $1 million, reported stronger financial health than smaller organizations. Likewise, reported financial health varies by organizational subsector. Figure 9 indicates that more Arts and Culture nonprofits reported weaker financial health than Human Service and Health related nonprofits. (To better understand the full financial impact of COVID-19 on the Arts and Culture sector, please see our addendum report, Culture Shift: Measuring COVID-19 Impact on San Diego Arts and Culture Nonprofits.) It is not altogether surprising that Human Service- and Health-related nonprofits find themselves in a better financial position than other nonprofit subsectors. As demands for social and health services related to COVID-19 increase, grants, contracts, and donations to those subsectors also grow, improving the financial health of such organizations.
Weak22%
Weak16%
Moderate32%
Moderate26%
Strong46%
Strong58%
TOTALSECTOR
2020
TOTALSECTOR
2019
9
Figure 9. Nonprofit Sector Financial Health 2019 vs. 2020 and Subsector Financial Health in 2020
28%
26%
23%
21%
20%
7%
39%
16%
27%
50%
28%
29%
33%
58%
50%
29%
52%
64%
Arts & Culture
Environment
Mutual, Public,Societal Benefit
Education
Human Services
Health (otherthan hospitals)
SUBSECTORS 2020*
Financial health was found to be positively correlated to organizational size, meaning
larger organizations (budget $1M+) were more likely to report stronger
financial health.

10
Nonprofit Workforce
37%30% 26%
Layoffs Furloughs Pay Cuts
40%30%
16% 14%
We cut payfor executive or
senior-levelemployees only
We institutedpay cuts
across theboard
We cut payfor certainpositions
We reducedstaff hours
Figure 11. Percent of Organizations that Have Used Various Pay Cut Strategies
Figure 10. Percent of Organizations that Have Made Cuts to Payroll Expenses
Q1-19Q2-19 Q3-19
Q4-19 Q1-20
Q2-20
Q3-20
050
100150200250300350400
Q1-19 Q2-19 Q3-19 Q4-19 Q1-20 Q2-20 Q3-20
Figure 12. Nonprofit Job Postings on NPWorks.org
The COVID-19 pandemic has had a negative effect on the nonprofit workforce much as it has on businesses of all sizes in San Diego. Out of the 193 organizations that reported having employees, nearly half (47%) of respondent organizations instituted layoffs or furloughs. As Figure 10 outlines, among employment strategies used to cut costs, layoffs have been most common followed by furloughs and pay cuts.
Roughly one quarter (26%) of organizations reported instituting pay cuts, and as Figure 11 shows, 40 percent of those organizations instituted cuts only for senior level staff while 30 percent instituted them across the board.
Certain subsectors have been more adversely affected than others. The nonprofits that have had to lay off or furlough the most employees are those that typically require high levels of contact between people in order to deliver services. Within the survey sample, on average, organizations furloughed 10 percent and laid off 9 percent of their staff. Arts and Culture organizations, which are more likely to offer indoor and in-person services, on average had to furlough 19 percent and lay off 15 percent of their staff.
Although there is some early evidence of recovery in that 67 percent of the organizations that instituted furloughs have brought staff back, there is also evidence that employees who have been laid off are finding far fewer options for employment in the nonprofit sector than prior to the COVID-19 pandemic. As Figure 12 shows, nonprofit job postings have decreased substantially since the beginning of the pandemic, meaning unemployed nonprofit workers may need to seek employment outside of the sector.


ResilienceLike people, some organizations are better equipped to manage change than others. Researchers who study organizations characterize this ability as resilience and define it to mean “the ability of an organization to anticipate, prepare for, respond, and adapt to both incremental change as well as sudden disruptions.”4
Resilient organizations tend to share some common features that help explain why some nonprofits may thrive while others will struggle for survival (see box).
Why is this important?
San Diegans expect nonprofits to step in when the public and/or private sector can not or will not respond to pressing needs. At the onset of the pandemic, many nonprofits were called to provide essential services while adapting to rapidly changing conditions on the ground and within their organizations. For example, our early COVID-19 impact research showed that access to responsive funding, such as The San Diego Foundation’s COVID-19 Response Fund, Jewish Community Foundation Emergency Response Fund, County of San Diego Small Business and Nonprofit Loan Fund, among others, and the ability to repurpose existing grant money allowed organizations to pivot quickly as conditions changed their delivery modes to meet new health and safety guidelines.
Many local nonprofits who applied were able to access emergency relief funding through the federal government and foundations, most notably Paycheck Protection Funds. In addition to flexible resources, as the pandemic continues, other elements of organizational resiliency such as public trust, diversity, and strong leadership will be needed for long-term survival of the nonprofit sector.
12
Furthermore, COVIDadditional and disproportionate impact on local nonprofits, leaving smaller organizations and arts and culture organizations worse off than others.
Resilient organizations are better equipped to adapt to changing conditions and weather
unexpected shocks. Resilient nonprofits share common elements.
Hallmarks of resilient nonprofits include:
• An ability to scan the environment and improvise
• Access to adequate and flexible resources
• Public trust and strong governance• Diversity among board and staff to bolster
informed decision-making and strategy options
• Leadership that is entrepreneurial and collaborative
• Unwavering commitment to core values and mission
4. BSI, https://www.bsigroup.com/en-US/our-services/Organizational-Resilience/

Public TrustFor more than five years, NPI has partnered with Luth Research in the administration of a quarterly survey to gauge San Diegans’ perceptions of local nonprofits. As Figure 14 shows, San Diegans continually express high levels of confidence in nonprofits, more so than government and corporations. Our data find the public expresses more confidence in local nonprofits to provide quality services, act on the public's behalf, as well as (not pictured) spend money wisely, act ethically, work efficiently, and promote positive social change.
In spring and summer polling, we asked San Diego residents about their confidence in the ability of the three sectors to respond to issues related to COVID-19. As Figure 13 indicates, in the initial months of the pandemic (April through June), 80 percent of the public had high levels of confidence in nonprofits to respond. However, as the pandemic worsened and persisted in July through September, the public’s confidence eroded across all three sectors. Most notably, confidence in local nonprofits dropped from 80 percent to 67 percent, putting nonprofits more in line with the corporate and government sectors.
13
80%
67%
68%
59%
65%
63%
(Q2) Apr-Jun2020
(Q3) Jul-Sep2020
Figure 13. Percent of San Diegans Who Express Confidence in Local Institutions to Respond to Issues Related to COVID-19
NONPROFITS
CORPORATIONS
GOVERNMENT
0%20%40%60%80%
100%
2017 q1 2017 q2 2017 q3 2017 q4 2018 q1 2018 q2 2018 q3 2018 q4 2019 q1 2019 q2 2019 q3 2019 q4 2020 q1 2020 q2 2020 Q3
Figure 16. Confidence to Act on the Public’s Behalf
0%20%40%60%80%
100%
2017 q1 2017 q2 2017 q3 2017 q4 2018 q1 2018 q2 2018 q3 2018 q4 2019 q1 2019 q2 2019 q3 2019 q4 2020 q1 2020 q2 2020 Q3
Figure 15. Confidence to Provide Quality Services
0%20%40%60%80%
100%
2017 q1 2017 q2 2017 q3 2017 q4 2018 q1 2018 q2 2018 q3 2018 q4 2019 q1 2019 q2 2019 q3 2019 q4 2020 q1 2020 q2 2020 q3
Figure 14. Overall Public Confidence
NONPROFITS
CORPORATIONS
GOVERNMENT
NONPROFITSCORPORATIONSGOVERNMENT
NONPROFITSCORPORATIONSGOVERNMENT
NONPROFITSCORPORATIONSGOVERNMENT
2017 2018 2019 2020
2017 2018 2019 2020
2017 2018 2019 2020

Leadership Capacity Moving to an online work environment has been challenging for many nonprofits, especially smaller organizations (Figure 17). Although there have been many technological barriers to remote work, the larger challenge nonprofit leaders identified was leading and managing staff remotely. Sixty-six percent of respondents rated their leadership team as competent in technological skills. In contrast, as Figure 18 shows, only half of respondents reported feeling very or extremely confident in being an effective leader and managing the staff and board remotely.
14
48%
48%
51%
52%
Being an effectiveleader remotely
Using technology to collaboratewith external partners
Managing my team in aremote work environment
Engaging the board in aremote environment
Figure 17. Rating of Leadership Team’s Skills in Using Technology to Manage a Remote Work Environment
Figure 18: Percent of Respondents Who Are Very or Extremely Confident in Remote Work-Related Areas
Needs Improvement
22%
Competent66%
Very Strong
12%
42% of organizations in this category have
budgets under $250,000
“
”
Two-thirds of leaders reported needing support to manage the stress and anxiety of their staff.
We have tried to focus our staff on the need to balance their new remote working life with their personal lives and the stress that this causes. Our staff is working at capacity and our daily staff ‘All Calls’ are mandatory and have proven to be an excellent way to stay connected.
- Mutual, Public, and Societal Benefit

Diversity of LeadershipThe benefits of diversity within organizations are well documented. Diverse teams are more innovative, appealing to workers, and perhaps most important in the wake of COVID-19, resilient to economic disturbances and shocks in their operating environment.5In nonprofits, this is especially important at the board level where diversity of ideas can promote more informed and equitable decision-making.6
Respondents in the survey were asked to report the ethnicity of the members of their leadership and board. As Figure 19 shows, nonprofit leaders and board members are not representative of the ethnic diversity in San Diego County, where 55% of residents identify as Black, Indigenous and People of Color (BIPOC).7
The majority of nonprofits reported they were satisfied with their organization’s willingness to talk about issues around diversity, equity, and inclusion, but were less satisfied with their actual ability to implement objectives and consequently have struggled to hire and recruit diverse leaders, staff, and board members (Figure 20).
Some subsectors seem to be increasing ethnic diversity and implementing more equitable and inclusive practices than others. Human Services organizations reported higher levels of satisfaction on measures of diversity, equity and inclusion and reported their leadership teams and boards were comprised of a higher percentage of people of color than other nonprofit types.
15
68%46%
Willingness to discussconcepts of diversity,equity, and inclusion
Ability to implementdiversity, equity, andinclusion objectives
32%24%
33%25%
0%
20%
40%
60%
80%
100%
LeadershipTeam
CEO Board Board Chair
Figure 19. Percent of People who Identify as BIPOC in Leadership Positions
Figure 20. Percent “Very” or “Completely” Satisfied with Organizational Progress with Diversity, Equity, and Inclusion
55% of San Diego Residents
Identify as BIPOC
5. The World Economic Forum COVID Action Platform, weforum.org6. Council of Nonprofits, councilofnonprofits.org7. SANDAG. 2019 Estimates.

Diversity Strategies to Move the Needle Inside NonprofitsAs Figure 21 indicates, more than half of organizations are providing training for their staff members, however only a quarter of organizations are providing training for their board members. This is relevant as research shows training on racial diversity is less effective at making progress towards racial equity than structural changes such as policies, which in the nonprofit sector, is the job of the board.
These differences were statistically significant, indicating that an effective strategy for increasing racial equity in the nonprofit sector is to increase the number of CEOs and Board Chairs who identify as BIPOC. Figure 22 illustrates differences in diversity of leadership teams and boards when the CEO identifies as BIPOC versus when the CEO identifies as White. The findings are similar for when the board leader identifies as BIPOC as well.
Figure 22. Percent of Leadership Teams and Boards Who Identify as BIPOC by Ethnicity of CEO
Organizations Where CEO Identifies as
BIPOC
Diversity of Leadership Team
Diversity of Board
49%BIPOC
57%
25%
Staff Members Board members
Analysis of the data shows that the ethnicity of leadership equates to better diversity outcomes. Organizations in which the CEO identifies as BIPOC and organizations in which the Board Chair identifies as BIPOC had more ethnically diverse boards and leadership teams than organizations in which the CEO and/or Board Chair were White.
16
61%BIPOC
24%BIPOC
24%BIPOCOrganizations
Where CEO Identifies as
White
Figure 21. Percent of Organizations that Provided Specialized Training on Diversity, Equity, and Inclusion to Staff and Board
Increasing the number of CEOs and Board Chairs who identify as BIPOC
can lead to greater racial equity in nonprofit staff and boards.
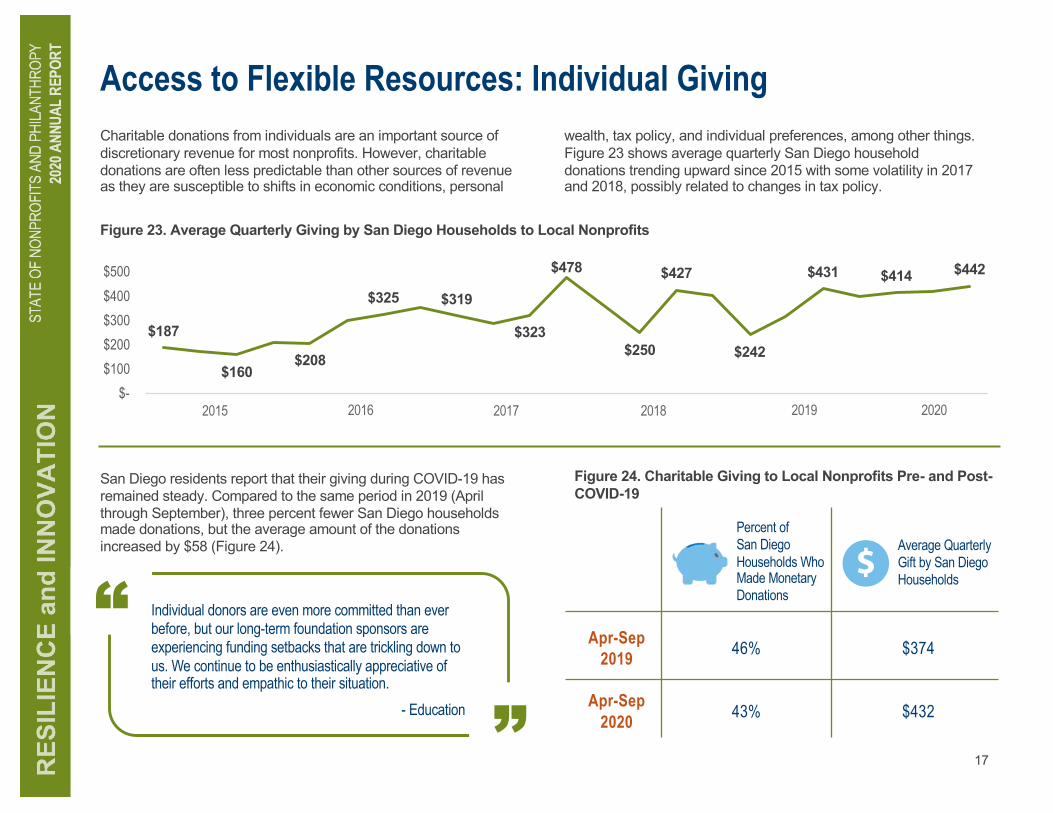
Access to Flexible Resources: Individual Giving
San Diego residents report that their giving during COVID-19 has remained steady. Compared to the same period in 2019 (April through September), three percent fewer San Diego households made donations, but the average amount of the donations increased by $58 (Figure 24).
17
$
$37446%
$43243%
Apr-Sep2019
Apr-Sep2020
Percent of San Diego Households Who Made Monetary Donations
Average Quarterly Gift by San Diego Households
Figure 24. Charitable Giving to Local Nonprofits Pre- and Post-COVID-19
$187
$160$208
$325 $319
$323
$478
$250
$427
$242
$431 $414 $442
$- $100 $200 $300 $400
$500
Q1-2015 Q2-2015 Q3-2015 Q4-2015 Q1-2016 Q2-2016 Q3-2016 Q4-2016 Q1-2017 Q2-2017 Q3-2017 Q4-2017 Q1-2018 Q2-2018 Q3-2018 Q4-2018 Q1-2019 Q2-2019 Q3-2019 Q4-2019 Q1-2020 Q2-2020 Q3-2020
Figure 23. Average Quarterly Giving by San Diego Households to Local Nonprofits
2017 2018 2019 202020162015
Charitable donations from individuals are an important source of discretionary revenue for most nonprofits. However, charitable donations are often less predictable than other sources of revenue as they are susceptible to shifts in economic conditions, personal
wealth, tax policy, and individual preferences, among other things. Figure 23 shows average quarterly San Diego household donations trending upward since 2015 with some volatility in 2017 and 2018, possibly related to changes in tax policy.
“
”
Individual donors are even more committed than ever before, but our long-term foundation sponsors are experiencing funding setbacks that are trickling down to us. We continue to be enthusiastically appreciative of their efforts and empathic to their situation.
- Education

Furthermore, there is also a growing donor divide between who is giving and the types of causes being supported (Figure 26). In our public opinion polling, half of all respondents have altered their typical giving as a result of COVID-19. Of those who report they have donated recently to a nonprofit, 50 percent said they have re-prioritized the organizations they support. The result is some organizations are losing donors to what are deemed more immediate needs such as food security, support for essential workers, and Black Lives Matter and racial justice causes.
“”
Access to Resources: Evidence of Digital and Donor Divides
18
29%Gave Less
50%No Change
21%Gave More
Figure 26. COVID-19 Influences on San Diegans Charitable Giving
We have seen a shift in some of our donors' priorities. Some are reallocating their support towards more short-term, critical needs (for example food distribution).
– Arts and Culture
“
”
The pandemic has significantly reduced our ability to reach and communicate with our donors. At an individual level, we have maintained relationships with numerous consistent supporters, but are losing supporters who do not have a direct avenue for engagement.
- Arts and Culture
Not Confident43%
Not Confident27%
Moderate40%
Moderate38%
Confident17%
Confident35%
BudgetsUnder $1M
BudgetsOver $1M
Figure 25. Confidence in Organization’s Ability to Digitally Fundraise
Of those who report donating, 50% reported who they gave to has
changed due to COVID-19.
We have been challenged with connecting with donors due to the inability to hold in-person events because of COVID-19. As a grassroots nonprofit, we have been unable to raise funds for operations support in order to run a digital donor campaign.
- Human Services
Analysis of the data point to a growing digital divide between smaller and larger nonprofits as evidenced by their confidence to fundraise digitally (Figure 25).

“”
Adaptation: Volunteers Volunteers are critical to nonprofit resiliency. Engaged volunteers complement the nonprofit workforce, providing access to additional skills and knowledge needed to meet the needs of the community. As Figure 27 shows, quarterly volunteering patterns fluctuate subtly during the year. Since we began tracking volunteering in 2011, on average each quarter, 35 percent of San Diego households have volunteered for local nonprofits and, on average, they volunteered 24 hours of time.
39%34% 36% 38%
33%37% 38% 41%
37% 37% 37% 37%33% 33% 32% 35% 37%
33% 36%40%
33% 31%
0%
10%
20%
30%
40%
50%
Q1-2015 Q2-2015 Q3-2015 Q4-2015 Q1-2016 Q2-2016 Q3-2016 Q4-2016 Q1-2017 Q2-2017 Q3-2017 Q4-2017 Q1-2018 Q2-2018 Q3-2018 Q4-2018 Q1-2019 Q2-2019 Q3-2019 Q4-2019 Q1-2020 Q2-2020
Figure 27. Average Quarterly Percent of San Diego Households Who Volunteered
19
Considering the COVID-19 restrictions on group gatherings and the now remote nature of many nonprofit programs, a decline in volunteering would not be surprising. However, the data show little to no fall-off in volunteering when comparing household volunteering in the second and third quarters of 2019 to the first three quarters of 2020 (Figure 28).
We had to train our volunteer trainers to use Zoom, etc. Some volunteer trainers were not willing to go online. Therefore, we were able to recruit from beyond San Diego County to fill the much needed gap.
- Health
2017 2018 2019 202020162015
79% of Nonprofit Leaders Reported a Lack Confidence in Their Ability to
Engage Volunteers Digitally
26.234.5%
22.331%
Apr-Sep2019
Apr-Sep2020
Percent of San Diego Households Who Volunteered
Average Number of Hours Volunteered
Figure 28. Volunteering Pre- and Post-COVID-19


Future Predictions for the State of Nonprofits and PhilanthropyIn 2020, the state of San Diego’s nonprofit and philanthropy sector is best described as precarious and unpredictable for most. Much of the sector’s future will be tied to November election results and related policy initiatives, more so than individual efforts. Collectively, nonprofit leaders are tempered in their fundraising and financial health predictions for 2021. As Figures 29 and 30 show, nearly 40 percent of leaders predict worsening conditions, while 30 percent predicted conditions will be about the same as this year.
Furthermore, comments from 165 nonprofit leaders draw attention to urgent challenges facing San Diego and its nonprofit sector including threats to resources and funding that limit their ability to respond to community needs, systemic injustices, inequalities, and racism that diminish the quality of life for all San Diegans.
Nonprofits are responding to urgent challenges by innovating through new partnerships, redesigning and delivering programs in virtual environments, and finding new ways to engage donors.
The following pages highlight these urgent challenges and innovative responses described by nonprofit leaders in their own words.
21
12% 31% 29% 16% 6% 7%
8% 29% 31% 22% 5% 5%
Figure 29. 2021 Fundraising Outlook
Figure 30. Expectation of Financial Outlook for 2021 Calendar Year Compared to 2020 Calendar Year
Much Worse Than This Year
Somewhat Worse Than This Year
About the Same as This Year
Somewhat Better Than This Year
Much Better Than This Year
Don’t Know
Much Worse Than This Year
Somewhat Worse Than This Year
About the Same as This Year
Somewhat Better Than This Year
Much Better Than This Year
Don’t Know

Impacts of COVID-19 in the Words of San Diego’s Nonprofit LeadersSystemic Injustices and Inequalities
“Diversifying our outreach and adapting out messaging to be one of more inclusion and accessibility for more of San Diego's population. Bringing equity into our conversations at the city level and within our own organization. Ramping up our focus on sustainability in our efforts to get more people riding bikes more frequently.”
– Mutual, Public, and Societal Benefit
“The most urgent challenge we are facing is compassion fatigue from our communities. With many injustices occurring simultaneously, it can be challenging to engage community members and donors and raise awareness on issues we are advocating for when there are also many other immediate needs and issues as well.”
– Human Services
“Ensuring that as we recover from this pandemic and the economy, that everyone can recover with equity. Many of the hardest hit families are the lowest incomes and people of color and many will need additional supports and resources to ensure they not only recover back to where they were, to be able to move from beyond those economic conditions where they were already needing resources.”
– Human Services
Organizational Health and Sustainability
“Unfortunately most of our revenue generating departments have been closed, but our mission goes beyond those functions. ALL remaining staff is furloughed to some degree and we are using a Work Share program. Our general operating expenses cannot be met with the reduced capacity and restrictions imposed on our revenue generating operations. We calculated how long we can last in this mode and we believe we can ride out the COVID-19 storm and reopen fully and bring back staff positions gradually. I wouldn't call this a strategy but more of a series of harsh tactics with the ultimate goal of collections survival. This is not easy to carry out, especially when you have to layoff good people.”
– Arts and Culture
“The organization is facing staff layoffs, lack of fund to support the organization and its operation, and some other challenges due to COVID-19.”
– Refugee Services
Redesigning How to Interface with the Public Taking into Consideration Safety and Legal Requirements
“We don't have the bandwidth to invest much time in training staff to become more technologically sophisticated -- in a small nonprofit, people wear many hats. We are doing our best to connect to families using new technology -- but delivering services to children remotely involves quite a bit of training and legal liability issues that appear to be overwhelming to us right now. Larger organizations seem to have been able to pivot better.”
– Mutual, Public, and Societal Benefit
“A large portion of our business must be redesigned and services delivered in a different way. It's a wonderful opportunity for creativity and engaging staff and others on better ways to accomplish a mission that is person-centered and really takes the needs and desires of service recipients into consideration. No longer forcing individuals into fitting into an established model...just because it's what's available. The transition will be a bit challenging but in the end will be extremely rewarding for all.”
– Human Services
“We bring online education opportunities offline. We have strong relationships with the communities we serve, but we relied on in-person meetings with funders - which are no longer happening. It's continuing to be a big shift for us to figure out how to expand our base of supporters through online only (no in-person).”
– Health
22

Delivering Programs and Services
“The population we serve is now isolated more than ever, with specific mandates for them to shelter-in-place. They remain at high-risk for the near and long future, which also means we have a lengthy road ahead of providing services and supports beyond most other populations. All the changes happening right now are scary for us all, especially those who can't leave their homes and those who are on fixed incomes. And if individual donors and foundations tighten up their giving (we have at least 12 Foundations and Banks so far who have temporarily stopped their grants program resulting in more than $200,000 in lost grant money we typically receive), it will become more and more difficult to sustain our necessary work. I feel we are all in the same boat though, and so we are just so very thankful we can be of service, and that many local firms/foundations are stepping up to care for our San Diego Community.”
– Human Services
“This is a tough one! Overall, ensure that our staff and board have the tools to meet the demands of the community. We are being asked to help other organizations/educational institutions within the community and just don't have the bandwidth/capacity to do so. Diversifying funding avenues is one challenge, as we were dependent on a certain amount of revenue from facility rentals and program fees. The demand for our programs is very strong, yet revenue diversification is a challenge.”
– Health
“Since all of our programs were canceled due to COVID-19 I created an online web series for teens focusing on leadership, mental health, and communication. I reached out to people in the field to collaborate on the curriculum to ensure the best quality information. Our first web series began in May and although I was optimistic, I was trying to be realistic when registration opened. I set a goal for 5 and we received 17 enrollments for the month of May. This number jumped to 27 in June and since has been fluctuating due to the strenuous circumstances. “
– Human Services
Resources and Funding
“We are most challenged to find unrestricted operating funds to keep the administration going. With the City of San Diego grants coming in at about half of expected, we are scrambling to make up shortfalls and keep from furloughing workers (myself included). We also are challenged to figured out how to present meaningful arts and culture events with no budget for re-creating/re-imagining what that would look like online. Finally we have had to pause our project to build an Arts Center as funders/banks/investors/developers are seemingly holding their breath until after the election.”
– Arts and Culture
Need for Software and Hardware Supplies
“We need equipment -- staff are still working on personal devices at home, and will be unable to seamlessly transition between at-home and in-office work.”
– Arts and Culture
“Our server is incredibly slow, outdated, and causes issues both on-site and off-site. Due to our location we run on air-waves for internet and connection, but get limited service (around 5-10 MB/S). We are looking into fiber optics, but the cost to run to our location is extremely burdensome. We also have older generation and second-hand hardware, and many staff just use personal laptops as they are faster and more effective.”
– Health
“To keep residents engaged with their families we successfully pursued grants for more computers and iPads. This also keeps residents in touch with their day programs, and other social activities.”
– Human Services
23
Impacts of COVID-19 in the Words of San Diego’s Nonprofit Leaders

Conclusions
Assessing the Strength, Resilience, and State of San Diego’s Nonprofit Sector Finds that Local Nonprofits are:
Vital to the Recovery of San Diego’s Economy
Nonprofits provide vital services and support for working families by expanding access to quality childcare, education, and workforce development. They will play an essential role in ensuring a more inclusive recovery.
Vital to an Effective Government and Healthy Communities
Nonprofits are an integral partner to government delivering so many frontline essential services on behalf of government. The interdependence of government and nonprofits has grown to the point where we must wonder… Are nonprofits too big to fail? OR The interdependence of government and nonprofits has grown to the point where our investment in economic recovery must include investments that support and strengthen the nonprofit sector.
Vital to an Equitable Quality of Life in our Region
Smaller, community-based nonprofits need our attention given their adverse, significant losses of revenue and contributions. They are trusted and have the capacity to reach communities disproportionately impacted by poverty, racial injustice, and COVID-19.
What Does the Sector Need to Build Resilience?
1. Advocates at all levels of government to ensure consideration of nonprofits in policy matters that impact them. Nonprofits are found to be highly trusted in the minds of the public, but seemingly getting lost in a sea of competing interests as the public and private sectors are the primary focus for cash, loan, and other assistance.
2. Immediate, deliberate, and consistent investment from its government and philanthropic partners. The reported loss of revenue is so profound, charitable donations of individuals will not be enough to meet growing demands for service.
3. A focus on small nonprofits and a better understanding of their important role in creating access and equity
4. Continued partnerships and innovation to leverage limited resources
24