2020 2021 tariff compliance statement general …
TRANSCRIPT
2020 – 2021
TARIFF COMPLIANCE STATEMENT
GENERAL STATEMENT
31 May 2020

This page is intentionally left blank

2020-21 TARIFF COMPLIANCE STATEMENT – GENERAL STATEMENT
i
Contents
Abbreviations and acronyms ........................................................................................................................................ 3
Supporting documents .................................................................................................................................................. 5
1. Executive summary ............................................................................................................................................... 7
1.1 PoM has undertaken extensive research and analysis to prepare its 2020-21 TCS ............................................. 7 1.2 Port of Melbourne is highly exposed to uncertainty in trade and financial markets ........................................... 8 1.3 PoM’s rate of return estimate is informed by extensive analysis and advice from independent experts ........... 9 1.4 Prescribed Services revenue remains below the level required to cover efficient costs ................................... 10
2. About this 2020-21 TCS ...................................................................................................................................... 12
2.1 Purpose of this document .................................................................................................................................. 12 2.2 Structure of this document................................................................................................................................. 13 2.3 Financial information, and use of terminology, in this document ..................................................................... 14 2.4 Next steps and stakeholder feedback ................................................................................................................ 14
3. Regulatory context ............................................................................................................................................. 15
3.1 Nature of PoM’s regulatory framework ............................................................................................................. 15 3.2 PoM’s regulatory framework is unique .............................................................................................................. 16 3.3 Application of the TAL ........................................................................................................................................ 17 3.4 The ESC’s five-yearly review ............................................................................................................................... 17 3.5 Pricing Order changes for the Port Rail Transformation Project ........................................................................ 18
4. Historical performance ....................................................................................................................................... 20
4.1 PoM’s 2018-19 actual performance ................................................................................................................... 20 4.2 ESC’s feedback on PoM’s 2019-20 TCS ............................................................................................................... 21
5. What Port Users and other stakeholders are telling PoM .................................................................................. 22
5.1 PoM’s Port Users and other stakeholders for Prescribed Services .................................................................... 22 5.2 Importance of engagement ................................................................................................................................ 23 5.3 What PoM has done ........................................................................................................................................... 24
6. The length of the regulatory period ................................................................................................................... 27
7. 2020-21 trade volume forecasts ......................................................................................................................... 28
7.1 Overview of forecasting approach ..................................................................................................................... 28 7.2 Overview of key outcomes ................................................................................................................................. 29
8. Performance standards ...................................................................................................................................... 31
9. 2020-21 ARR and Prescribed Services revenue (subject to the TAL) .................................................................. 34
9.1 Cost allocation .................................................................................................................................................... 34 9.2 2020-21 ARR calculated using the ABBM ........................................................................................................... 34
9.2.1 Capital base ................................................................................................................................................ 36 9.2.2 Capex .......................................................................................................................................................... 37 9.2.3 Rate of return on capital ............................................................................................................................ 38 9.2.4 Depreciation and economic asset lives ...................................................................................................... 47

2020-21 TARIFF COMPLIANCE STATEMENT – GENERAL STATEMENT
ii
9.2.5 Opex ........................................................................................................................................................... 49 9.2.6 Indexation allowance ................................................................................................................................. 50
9.3 Prescribed Services revenue (subject to the TAL) .............................................................................................. 50 9.4 Comparison of ARR and Prescribed Services revenue (subject to the TAL) plus revenue for legacy contracts . 51
10. 2020-21 tariffs .................................................................................................................................................... 52
10.1 Upper and lower bounds .................................................................................................................................... 52
11. Efficient cost recovery ........................................................................................................................................ 54
Attachment 1 – 2020-21 forecast opex for Prescribed Services ................................................................................. 55
1.1. Efficiency and prudence of opex ........................................................................................................................ 56 1.2. Opex forecasting method ................................................................................................................................... 57
Attachment 2 – 2020-21 forecast capex for Prescribed Services ............................................................................... 59
1.1. Capex forecast .................................................................................................................................................... 59 1.2. Efficiency and prudence of capex ....................................................................................................................... 61 1.3. Capex forecasting method .................................................................................................................................. 61 1.4. Capex governance .............................................................................................................................................. 63 1.5. Asset Management System ................................................................................................................................ 65 1.6. Capitalisation Guideline ...................................................................................................................................... 66 1.7. Capex mapping to regulatory model categorisation .......................................................................................... 67

2020-21 TARIFF COMPLIANCE STATEMENT – GENERAL STATEMENT
3
Abbreviations and acronyms
Abbreviation / acronym
Description
A Actual
ABBM Accrual building block methodology
ABS Australian Bureau of Statistics
ACCC Australian Competition and Consumer Commission
AMP Asset Management Plans
ARR Aggregate Revenue Requirement
BEE Benchmark Efficient Entity
BISOE BIS Oxford Economics
BITRE Bureau of Infrastructure, Transport and Regional Economics
Capex Capital expenditure
CAPM Capital Asset Pricing Model
CCA Cost Contribution Amount
CFA Collaborative Framework Agreement
CPI Consumer Price Index
Cth Commonwealth
D Debt
DDM Dividend Discount Model
Deloitte Deloitte Risk Advisory
DELWP Victorian Department of Environment, Land, Water and Planning
E Equity
ECR Efficient Cost Recovery
EGM Executive General Manager
ESC Essential Services Commission of Victoria
F Forecast
FFM Fama French Model
Gamma
GRESB Global Real Estate Sustainability Benchmark
IRC Investment Review Committee
ISO International Standards Organisation
IT Information technology
KPI Key Performance Indicator
MTOFSA Maritime Transport and Offshore Facilities Security Act 2003 (Cth)
MTOFSR Maritime Transport and Offshore Facilities Security Regulations 2003 (Cth)
Opex Operating expenses
PCD Port Concession Deed

2020-21 TARIFF COMPLIANCE STATEMENT – GENERAL STATEMENT
4
Abbreviation / acronym
Description
PCG Project Control Group
PCJF Preliminary Concept Justification Form
PCP Port Capacity Project
PDIP Port Development Implementation Plan
PDS Port Development Strategy
PES Port Environmental Strategy
PLF Port Licence Fee
PLT Port Lease Transaction
PMA Port Management Act 1995 (Vic)
PoM Port of Melbourne
PRG Program Review Group
PWG Project Working Group
PRTP Port Rail Transformation Project
RAS Rail Access Strategy
Rd Return on debt
Re Return on equity
Rf Risk-free rate
RTO Rail Terminal Operator
RTS Reference Tariff Schedule
SAMP Strategic Asset Management Plan
SDE Swanson Dock East
SDW Swanson Dock West
SL-CAPM Sharpe-Lintner Capital Asset Pricing Model
SME Subject Matter Experts
SoRA Statement of Regulatory Approach
TAL Tariffs Adjustment Limit
Tariffs Tariffs for Prescribed Services
TCS Tariff Compliance Statement
TEU Twenty-foot Equivalent Unit
VPCM Victorian Ports Corporation (Melbourne) Harbour Master
WACC Weighted Average Cost of Capital
WATI Weighted Average Tariff Increase
WSCAM Wharf Structures’ Condition Assessment Manual

2020-21 TARIFF COMPLIANCE STATEMENT – GENERAL STATEMENT
5
Supporting documents
Table i lists the supporting documents that are incorporated within, and form a part of, Port of Melbourne’s (PoM) 2020-21 Tariff Compliance Statement (TCS).
Table i: 2020-21 TCS supporting documents
Appendix Title
A PoM, 2020-21 Reference Tariff Schedule (RTS)
B PoM, Regulatory Model
C PoM, Regulatory Model User Guide
D PoM, Cost Allocation Model
E PoM, Cost Allocation Model User Guide
F PoM, Efficient Cost Bounds Model
G PoM, Efficient Cost Bounds Model User Guide
H KPMG, Report of factual findings to Management of the Port of Melbourne Group - Prescribed Services Revenue 30 June 2019
I PoM, Port User and other stakeholder consultation
J PoM, 2020 TCS Presentation
K BIS Oxford Economics, Port of Melbourne Trade Forecasts – Detailed outlook to FY21, April 2020
L BIS Oxford Economics, Trade Volumes Forecasting Model
M BIS Oxford Economics, Port of Melbourne Forecast Mechanics
N Synergies Economic Consulting, Determining a WACC estimate for Port of Melbourne, May 2020
O PoM, Contracts with Port Users (Confidential)
P PoM, Compliance with Pricing Order – Cross-Reference Table
Q Incenta Economic Consulting, Estimating the Port of Melbourne’s equity beta, May 2020
R NERA Economic Consulting, Review of Regulators’ Approaches to Determination of the Market Risk Premium, May 2020

2020-21 TARIFF COMPLIANCE STATEMENT – GENERAL STATEMENT
6
This page is intentionally left blank
2020-21 TARIFF COMPLIANCE STATEMENT – GENERAL STATEMENT
7
1. Executive summary
1.1 PoM has undertaken extensive research and analysis to prepare its 2020-21 TCS
This is PoM’s 2020-21 Tariff Compliance Statement (TCS) for its Prescribed Services’ tariffs for the period 1 July 2020 to 30 June 2021 (2020-21). It demonstrates how PoM’s tariffs for Prescribed Services for 2020-21 comply with the Pricing Order.
In preparing this TCS, PoM has carefully considered the Essential Services Commission’s (ESC) Interim Commentary on the 2019-20 TCS and the feedback provided by the ESC in prior years. PoM has undertaken extensive analysis to support the 2020-21 TCS, including commissioning independent expert reports to support the determination of the return on capital.
The key positions in this TCS are:
PoM has adopted a one-year regulatory period, as per previous submissions. In doing so, PoM notes that the main benefits regarding the adoption of longer regulatory periods are already present for Port Users, given the certainty on prices provided by the Tariffs Adjustment Limit (TAL), and strong incentives for PoM to seek efficiency gains
a Weighted Average Tariff Increase (WATI) for Prescribed Services of 2.2 per cent from 2019-20 levels, in accordance with the TAL, being the annual change in the Consumer Price Index (CPI)1 to March 2020
all tariffs have been adjusted by the same percentage (2.2 per cent).2 There are no new or discontinued tariffs from 2019-203
a pre-tax nominal weighted average cost of capital (WACC) of 8.93 per cent. Notwithstanding the unprecedented market dislocation caused by COVID-19, which has acutely demonstrated the ongoing risks to PoM’s trade volumes, this is significantly lower than PoM’s 2019-20 pre-tax nominal WACC of 10.46 per cent. In arriving at the 2020-21 WACC estimate, PoM has undertaken extensive research and analysis, drawn on independent expert advice on key issues, and made a number of material adjustments to address the ESC’s feedback in its 2019-20 Interim Commentary, and
as per the 2019-20 TCS PoM has adopted an alternative to straight-line depreciation, by setting depreciation to zero. This approach has been adopted on the basis that Prescribed Services revenue is currently not sufficient to recover straight-line depreciation, in accordance with the Pricing Order.
PoM has continued to develop its engagement with Port Users and other stakeholders to understand their views and priorities. The extensive consultation program underpinning the 2050 Port Development Strategy (PDS) continued throughout 2019 and 2020. This process has provided Port Users and other stakeholders with opportunities to review and contribute to the long-term investment strategy at the port, and has assisted PoM in its understanding of the priorities of stakeholders. This first edition of the PDS will be finalised in mid-2020, however stakeholder engagement will continue as we begin to implement the strategy, and then re-engage on the next edition of the PDS.
A key component of the 2050 PDS is the Port Rail Transformation Project (PRTP), a transformative rail project to improve landside transport connections for industry. PoM has been working with industry for the past 12 months on the structure of the PRTP to deliver a new rail operating framework from 1 June 2020, and deliver new rail infrastructure in the port. To fund the PRTP, the Government has amended the Pricing Order to allow PoM to amend the Reference Tariff Schedule for 2019-20 to increase the Prescribed Service Tariff for containerised ‘Full – inward’ Wharfage Fees from $110.77 (GST-exclusive) per TEU to $120.52 (GST-exclusive) per TEU on and from 1 June 2020.
1 All Groups Index Number, weighted average of eight capital cities published by the Australian Bureau of Statistics (ABS) 2 In accordance with the Export Pricing Decision under clause 14 of the Pricing Order, in the four years prior to Financial Year 2021, Prescribed Service Tariffs for full outbound container wharfage services are to reduce by 2.5% year on year. From the start of the 2021 Financial Year, prices for Prescribed Service Tariffs for full outbound container wharfage services must remain at the same or a greater percentage discount to full inbound container wharfage services. 3 PoM has agreed with the ESC to offer slipway services as Prescribed Services under contract.

2020-21 TARIFF COMPLIANCE STATEMENT – GENERAL STATEMENT
8
The information in this TCS (including the appendices) addresses the requirements of the Pricing Order. Appendix P cross-references these requirements to relevant sections of this document.
1.2 Port of Melbourne is highly exposed to uncertainty in trade and financial markets
PoM is submitting this TCS in a period of significant and unprecedented economic uncertainty. In a recent economic and financial update, the Governor of the Reserve Bank of Australia said of the economic outlook:4
The result of both the restrictions and the uncertainty is that over the first half of 2020 we are likely to experience the biggest contraction in national output and income that we have witnessed since the 1930s.
The COVID-19 global pandemic has also affected financial markets, which are undergoing a period of significant volatility. The RBA has noted that the Australian equity market fell sharply with the onset of the crisis, with Australia also impacted by the substantial rise in risk premiums in global equity markets.5 Successive cuts to the RBA’s official cash rate in March have brought it to a historical low of 0.25 per cent, and the yield on 10-year Commonwealth Government Bonds (a well accepted basis for estimating the risk free rate in many regulatory regimes) has been tracking at below 1 per cent per annum for much of the year. The 20-day average of the 10-year Commonwealth Government Bonds yield as at end-March 2020 was 0.90 per cent, compared to 1.96 per cent at the same time last year. In the context of these changes in financial markets, it is important that the approaches used to estimate the return on capital (which rely on both current market conditions and long-term averages), remain appropriate and provide a rate of return commensurate with the risks that apply to PoM’s benchmark efficient entity.
Unlike many Australian regulated infrastructure businesses, such as water and energy networks, PoM is highly exposed to movements in the Australian economy, and the economies of our major trading partners. This is clearly demonstrated by the significant reduction in PoM’s trade volumes and revenue with the onset of the COVID-19 crisis:
full container volumes for February were 10 per cent lower than for the same period in 2019
container trade volumes for March 2020 showed an increase over February, reflecting the view that the processing of the cargo backlog out of China would start to flow through, and are broadly consistent with the same month last year, and
trade data for April 2020 show total container volumes for the month are down by 11 per cent compared to April 2019. Full overseas container imports were down 9 per cent, while full overseas container exports were down 8 per cent.
PoM’s container trade forecasts, prepared by BIS Oxford Economics (BISOE), show a significant drop in 2019-20 and negative effects continuing in the first half of 2020-21, before a slight recovery in the second half of 2020-21. However, BISOE has noted that the timing and pace of the recovery is highly uncertain and warn of substantial downside risks to their trade forecasts.
The TAL price cap arrangements under the Pricing Order, which are expected to be in place until 2037, combined with volume-based tariffs for Prescribed Services, mean that PoM bears the risks of these variations in demand on behalf of Port Users. These risk sharing arrangements differ markedly from the typical regulatory settings for other regulated infrastructure service providers in Australia, which are afforded the ability to adjust prices at regular (i.e. 4-5 year) intervals to take account of changes in demand and costs, and may also be shielded from volume risks under revenue cap price control mechanisms.
The unique and heightened risk profile borne by PoM through the operation of the Pricing Order, and as highlighted by the recent trade volatility, needs to be considered holistically when assessing the appropriateness of PoM’s WACC.
4 Lowe, P., “An Economic and Financial Update”, Reserve Bank of Australia – Governor Speech, Sydney – 21 April 2020, available at: https://www.rba.gov.au/speeches/2020/sp-gov-2020-04-21.html 5 RBA, Financial Stability Review – April 2020, available at https://www.rba.gov.au/publications/fsr/2020/apr/the-australian-and-global-financial-systems.html

2020-21 TARIFF COMPLIANCE STATEMENT – GENERAL STATEMENT
9
Despite the ongoing uncertainty and volume risks, PoM remains committed to continuing to invest at the port, with forecast capital expenditure of $80.9 million in 2020-21 to deliver major projects such as wharf rehabilitation and implementation of the PRTP.
1.3 PoM’s rate of return estimate is informed by extensive analysis and advice from independent experts
PoM and its advisors have undertaken extensive additional research and analysis in estimating the required rate of return for the 2020-21 TCS. An expert report from Synergies, Determining a WACC estimate for Port of Melbourne, is provided at Appendix N that provides the detailed reasoning for the WACC estimate, and demonstrates compliance with the Pricing Order. In arriving at our WACC estimate, we have:
carefully considered the ESC’s revised interpretation of the Pricing Order, as set out in version 2.0 of the SoRA of April 2020. We provided a submission to the ESC on its proposed amendments to the SoRA6, and have given careful consideration to the proper interpretation and application of the Pricing Order (see section 9.2.3.2)
continued to utilise the Sharpe Lintner CAPM, Black CAPM, and Fama French Model (FFM) to derive the estimate of the cost of equity for PoM, but in recognition of the concerns raised by the ESC about the current data availability to inform the Black CAPM and FFM, applied a zero weight to these approaches and 100 per cent weight to the SL CAPM for the purpose of our point estimate of the WACC
obtained independent expert advice from Incenta Economic Consulting (Incenta) on estimating PoM’s equity beta (provided at Appendix Q). Incenta’s independent analysis considers the earlier work done by Synergies to support the 2019-20 TCS, the ESC’s preliminary views, and the analysis undertaken by Frontier. Notably, Incenta’s independent view is that the equity beta for PoM is likely to be 1.0, from within a range of 0.93 to 1.07. PoM notes that Synergies has undertaken further detailed analysis of the comparator set and made amendments to the approach (such as removing the statistical filtering approach that Frontier and the ESC raised concerns about) to support its equity beta estimate of 1.0 for the 2020-21 TCS. PoM considers that the approaches taken by Synergies and the independent analysis by Incenta are well accepted approaches, and also notes that the equity beta estimates are the same notwithstanding the small differences in approach
reduced the market risk premium (MRP) estimate from 7.77 per cent to 7.57 per cent, with various amendments including reducing the weights to each of the Wright and dividend discount model (DDM) approaches to estimating the MRP from 25 per cent to 15 per cent. PoM obtained an independent review by NERA Economic Consulting (NERA) on regulators’ approaches to determination of the MRP in regimes that are contextually similar or analogous to that applying to PoM (provided at Appendix R). NERA’s expert report provides an extensive review of approaches taken by regulators in Australia, New Zealand, Europe and North America to the MRP, and demonstrates that both the Wright and the DDM approaches are well accepted by regulators to estimate the MRP. PoM also notes that the COVID-19 crisis has increased risks in finance markets, which puts upward pressure on the MRP – evidenced by most respondents to a recent survey increasing their MRP estimates by 2 per cent following the onset of COVID-197, and
increased the gamma estimate from 0.25 to 0.33 (resulting in a lower pre-tax nominal WACC). We no longer apply any weight to the market value approach to estimating gamma, which was criticised by the ESC in its Interim Commentary, have increased the weighting to the utilisation approach to two-thirds and retain a one-third weighting to the approach widely adopted by practitioners (zero gamma). We consider this approach to be well accepted, on the basis that the views and practices of financial market practitioners are relevant for the purpose of determining the allowed rate of return under the Pricing Order. In particular, this approach has widespread use and acceptance among finance practitioners engaged in determining rates of return, as
6 PoM’s submission to the ESC’s redraft of the SoRA is available on the ESC website, here: https://www.esc.vic.gov.au/sites/default/files/documents/PoM%20response%20to%20Draft%20SRA%20-%2028%20Feb%202020.pdf 7 Fernandez et al, Survey: Market Risk Premium and Risk-Free Rate used for 81 countries in 2020, 25 March 2020, p.1

2020-21 TARIFF COMPLIANCE STATEMENT – GENERAL STATEMENT
10
evidenced by KPMG’s 2019 survey of finance practitioners, which found that almost all respondents (92%) did not use a gamma factor in discount rates.8
Based on the above, PoM has estimated a pre-tax nominal WACC of 8.93 per cent, as shown in Table 1. This estimate is a significant reduction compared to PoM’s 2019-20 pre-tax nominal WACC estimate of 10.46 per cent (which itself was a reduction from the previously estimated pre-tax nominal WACC of 11.52 per cent).
Table 1: Cost of capital parameters values underpinning PoM’s 2020-21 WACC estimate, and comparison to 2019-20
Parameter 2019-20 2020-21
Return on equity (pre-tax) (Re) 12.69% 10.60%
Market risk premium 7.77% 7.57%
Equity beta 1.0 1.0
Risk free rate 1.96% 0.90%
Corporate tax (tc) 30% 30%
Gamma () 0.25 0.33
Return on debt (pre-tax) (Rd) (see note 1) 5.24% 5.04%
Risk free rate 1.96% 0.90%
Debt risk premium (‘on the day’) 2.15% 2.42%
Debt raising costs 0.10% 0.10%
Capital structure (gearing)
Share of debt (D/(E+D)) 30% 30%
Share of equity (E/(E+D)) 70% 70%
Pre-Tax Nominal WACC 10.46% 8.93%
Note 1 – The return on debt is transitioning to a 10-year trailing average, commencing 2017-18. As such, the 2020-21 return on debt is calculated as a weighted average of the ‘on the day’ return on debt from 2017-18 (5.45%, with 70% weighting), 2018-19 (4.58%, with 10% weighting), 2019-20 (4.21%, with 10% weighting) and 2020-21 (3.42%, with 10% weighting).
1.4 Prescribed Services revenue remains below the level required to cover efficient costs
Table 2 sets out the actual and forecast Aggregate Revenue Requirement (ARR), as well as the Prescribed Services revenue (subject to the TAL) plus revenue from legacy contracts9 for 2017-18 to 2020-21. It shows that, in all years, Prescribed Services revenue plus revenue from legacy contracts is lower than the ARR. For 2020-21, PoM forecasts that its Prescribed Services revenue plus revenue from legacy contracts will be $89.4 million below the ARR, despite the approach to depreciation, which sets depreciation to zero and defers the recovery of the return of capital building block component until future regulatory periods.
8 KPMG, KPMG Valuation Practices Survey 2019, December 2019 9 “Legacy contracts” are for contracts for Prescribed Services that were in place at the time of Port Lease Transaction (PLT).

2020-21 TARIFF COMPLIANCE STATEMENT – GENERAL STATEMENT
11
Table 2: ARR and Prescribed Services revenue (subject to the TAL) plus revenue from legacy contracts, $ Million
2017-18 (A) 2018-19 (A) 2019-20 (F) 2020-21 (F)
ARR
Return on capital 495.3 511.3 481.7 425.1
Return of capital – see Note 1 0.0 0.0 0.0 0.0
Operating expenses (opex) 126.4 124.5 128.6 133.9
Indexation allowance -91.3 -84.4 -61.4 -104.3
Total ARR 530.5 551.4 548.9 454.7
Prescribed Services revenue (subject to the TAL) plus revenue from legacy contracts
WATI excluding Export Pricing Decision tariffs (%) – see Note 2
n.a. n.a. 1.3% 2.2%
WATI including Export Pricing Decision tariffs (%) – see Note 2
1.1% 0.9% 0.5% 2.2%
TAL (%) 2.1% 1.9% 1.3% 2.2%
Prescribed Services revenue (subject to the TAL) plus revenue from legacy contracts
364.1 362.8 389.7 365.3
Under-recovery of ARR 166.4 188.6 159.2 89.4
Note 1 – PoM has adopted an alternative approach to straight-line depreciation on the basis that the return of capital derived using a straight-line depreciation methodology is not capable of being recovered in the applicable Financial Year (clause 4.4.2 of the Pricing Order). See section 9.2.4 for an overview of PoM’s alternative depreciation methodology Note 2 – PoM has used audited revenues to calculate the WATI for 2019-20 and 2020-21. For 2017-18 and 2018-19, PoM has (a) used audited volumes from two years prior to calculate the WATI (because audited revenues at a service level are not available) and (b) only calculated the WATI including export tariffs.
Table 3 sets out the calculation of PoM’s capital base. It shows the forecast closing 2019-20 capital base, as at 30 June 2020, becomes the opening 2020-21 capital base, as at 1 July 2020. The forecast closing 2019-20 capital base of $4,734.0 million submitted in PoM’s 2019-20 TCS has been adjusted for 2018-19 actual values. The main adjustment is that 2018-19 actual capex was $10.4 million lower than forecast. The forecast closing 2019-20 capital base (and therefore opening 2020-21 capital base) is $4,720.9 million.
While depreciation is typically deducted from the opening capital base, as noted above PoM has set depreciation to zero and has deferred its recovery to future years due to the shortfall between Prescribed Services revenue and the ARR. Our principles for the recovery of deferred depreciation are set out in further detail in section 9.2.4. Table 3: Capital Base, $ Million
2016-17 (A) 2017-18 (A) 2018-19 (A) 2019-20 (F) 2020-21 (F)
Opening Capital Base (1 July) 4,142.0 4,269.0 4,410.9 4,552.5 4,720.9
Plus Indexation Allowance 54.8 91.3 84.4 61.4 104.3
Plus Efficient Capex 72.2 50.6 57.3 107.0 80.9
Less Depreciation 0.0 0.0 0.0 0.0 0.0
Closing Capital Base (30 June) 4,269.0 4,410.9 4,552.5 4,720.9 4,906.1

2020-21 TARIFF COMPLIANCE STATEMENT – GENERAL STATEMENT
12
2. About this 2020-21 TCS
2.1 Purpose of this document
PoM is required to submit an annual TCS to the ESC by no later than 31 May each year10 that demonstrates how its tariffs for Prescribed Services for the upcoming financial year comply with the Pricing Order. The leasing of space and facilities on Port land are classified as non-Prescribed Services. These non-Prescribed Services are not subject to the Pricing Order and PoM’s associated charges are based on commercial agreements. Non-Prescribed Services are not covered by this TCS.11
This is the fourth annual TCS that PoM has submitted to the ESC. It is the final TCS that PoM will submit for the period covered by the ESC’s first five-yearly inquiry of PoM’s compliance with the Pricing Order, which will cover the period 2016-17 to 2020-21.
In preparing this 2020 TCS, PoM has carefully considered the issues and concerns raised by the ESC in its interim commentaries in formulating its positions, and undertaken extensive analysis including obtaining independent advice on key issues. As a result, we have made a number of amendments to the positions adopted in previous TCS submissions and provided further information to demonstrate compliance with the Pricing Order.
In preparing this TCS, PoM has addressed:
clause 7.1.2 of the Pricing Order, which details the required contents of a TCS
the ESC’s Interim Commentary on PoM’s 2019-20 TCS
the ESC’s follow up questions on PoM’s 2019-20 TCS, and
the ESC’s Statement of Regulatory Approach (SoRA).
Clause 7.1.2 of the Pricing Order provides that PoM’s TCS must:
set out its tariffs for the upcoming financial year
detail the basis of any adjustments to tariffs (i.e. re-balancing), including any new or discontinued tariffs
explain and justify the building blocks included in the accrual building block methodology (ABBM) and the basis on which the rate of return has been estimated
provide information on contracts with Port Users
describe how PoM has consulted with, and incorporated feedback from, Port Users
explain how PoM’s tariffs for 2020-21 comply with the Pricing Order, including the Pricing Principles and Cost Allocation Principles
contain any further supporting information determined by the ESC, in accordance with clause 9 of the Pricing Order, and
comply with the information requirements in clause 8 of the Pricing Order.
Appendix P is a compliance checklist that cross-references to where in this TCS the requirements of clause 7 have been addressed.
10 Under clause 7.1.1(a) of the Pricing Order 11 The ESC undertakes periodic reviews of PoM’s rental agreements with Port tenants in accordance with section 53 of the Port Management Act (Victoria) 1995.

2020-21 TARIFF COMPLIANCE STATEMENT – GENERAL STATEMENT
13
2.2 Structure of this document
The remainder of this document is structured as follows:
section 3 explains the regulatory context to this TCS
section 4 details PoM’s 2018-19 financial and trade volume performance and the nature of the ESC’s feedback on PoM’s 2019-20 TCS
section 5 details what Port Users and other stakeholders have told PoM in the course of its stakeholder engagement over 2019-20 and how PoM is responding to it
section 6 nominates a one year regulatory period, being 2020-21
section 7 provides an overview of PoM’s 2020-21 trade volume forecasts
section 8 discusses PoM’s draft performance standards
section 9 compares the ARR, calculated under the ABBM, with Prescribed Services revenue (subject to the TAL) plus revenue from legacy contracts
section 10 details PoM’s 2020-21 Prescribed Services’ tariffs
section 11 discusses the need to ensure efficient cost recovery
Attachment 1 explains and justifies PoM’s 2020-21 forecast Opex
Attachment 2 explains and justifies PoM’s 2020-21 forecast Capex, and
Attachment 3 details where PoM has addressed the ESC’s feedback on its 2019-20 TCS.
There are a number of appendices (i.e. Appendices A to P) that support, and form a part of, PoM’s 2020-21 TCS. These are structured as illustrated in Figure 1 to be as clear and accessible as possible to the ESC, Port Users and other stakeholders.
Figure 1: 2020-21 TCS document structure
TCS General StatementSupporting models
Reference Tariff Schedule
Supporting documents

2020-21 TARIFF COMPLIANCE STATEMENT – GENERAL STATEMENT
14
2.3 Financial information, and use of terminology, in this document
This document contains the following financial information:
2018-19 – actual and forecast values. The forecast values were submitted in PoM’s 2018-19 TCS
2019-20 – forecast values that were submitted in PoM’s 2019-20 TCS. These forecast values have not been updated, unless otherwise specified. Actual information will be provided in PoM's 2021-22 TCS because, at the time of submitting this TCS, PoM does not have a full year of actual information for 2019-20, and
2020-21 – forecast values.
The 2020-21 capex, opex, revenue and trade volume forecasts reflect PoM’s current view of the budget at the time of submitting this TCS to the ESC. PoM’s 2020-21 budget will not be finalised until June 2020. The forecasts in this TCS may therefore not reflect PoM’s final budget for 2020-21.
All financial information provided in this TCS is denominated in nominal dollars (referred to as “current price terms” in clause 8.1.1 of the Pricing Order), unless stated otherwise. The numbers in the tables may not add due to rounding. All clause references are to the Pricing Order, unless otherwise stated. Capitalised terms that are not otherwise defined have the meaning given in the Pricing Order.
In this document:
“Prescribed Services revenue (subject to the TAL)” means revenue from Prescribed Services in PoM’s Reference Tariff Schedule (RTS). It does not include revenue associated with contracts for Prescribed Services, and
“ARR” means the Aggregate Revenue Requirement calculated using the ABBM. The initial 2016 capital base included the assets associated with legacy contracts for Prescribed Services that were in place at the time of Port Lease Transaction (PLT). The “ARR” is therefore inclusive of revenue associated with these legacy contracts.
PoM has added Prescribed Services revenue associated with the legacy contracts to “Prescribed Services revenue (subject to the TAL)” for the purposes of comparing it with the “ARR” in Table 2 and Table 18. PoM has agreed to this treatment of legacy contracts with the ESC.
PoM has also agreed with the ESC that the costs and revenues of all new Prescribed Services’ contracts entered into after the PLT should be excluded from the WATI calculation and all comparisons of revenue streams, albeit that PoM is fully disclosing the revenue earned under these Prescribed Services’ contracts in the confidential Appendix O.
PoM is only submitting data for the regulatory year 2020-21. Future calculations beyond 2020-21, and any modelling input assumptions (e.g. CPI in future years), are included in the regulatory model for illustrative purposes only and will change in versions submitted in future TCSs.
2.4 Next steps and stakeholder feedback
It is important for PoM to understand Port Users and other stakeholders’ views and feedback to enable it to continue to meet their needs and expectations. PoM welcomes feedback on the published version of this TCS through any of the following channels:
Channel Details
Email [email protected]
Post GPO Box 2149 Melbourne VIC 3001 Australia
PoM will continue to engage with Port Users and other stakeholders as part of its commitment to engagement, as discussed in section 5.

2020-21 TARIFF COMPLIANCE STATEMENT – GENERAL STATEMENT
15
3. Regulatory context
3.1 Nature of PoM’s regulatory framework
PoM operates under a regulatory framework that came into effect on 1 July 2016. The regulatory framework is set out in the:
Port Management Act 1995 (Vic) (PMA), and
Pricing Order issued by the Governor-in-Council, and made pursuant to section 49A of the PMA.
The Victorian Government developed the regulatory regime to be fit-for-purpose to reflect PoM’s unique circumstances. It covers:
Prescribed Services – these include channel services, berthing services, the provision of short-term storage and cargo marshalling facilities and the provision of access to, or use, of certain place or infrastructure (including wharves, slipways, gangways, roads and rail infrastructure)12
non-Prescribed Services (e.g. rental agreements for space and facilities on port land), and
functions related to any second container port, should one be developed in the future.
The Pricing Order relates only to Prescribed Services. Charges for non-Prescribed Services are not subject to the Pricing Order13 and are therefore not dealt with in this TCS.
Section 48 of the PMA sets out the objectives of the regulatory framework, which are summarised in Figure 2.
Figure 2: Objectives of the regulatory framework
The Pricing Order:
details the Pricing Principles and regulatory mechanisms that govern how PoM must set its tariffs for Prescribed Services, and
requires PoM to demonstrate how its tariffs for the upcoming financial year comply with the Pricing Order.
12 Prescribed Services are defined in section 49(1)(c) of the PMA 13 Fees and charges for some non-Prescribed Services are contained in the Other Fee Schedule of the RTS. Charges for certain other non-Prescribed Services, such as leasing of space and facilities, are based on commercial agreements.
Efficiency Promote efficient investment for the long-term interests of Port Users and Victorian consumers
Ensure prices are fair and reasonable having regard for the level of competition and efficiency
Allow PoM a reasonable opportunity to recover its efficient costs of providing Prescribed Services
Facilitate and promote competition between ports, shippers and third party operators
Fair and reasonable prices
Efficient Cost Recovery
Competition
2020-21 TARIFF COMPLIANCE STATEMENT – GENERAL STATEMENT
16
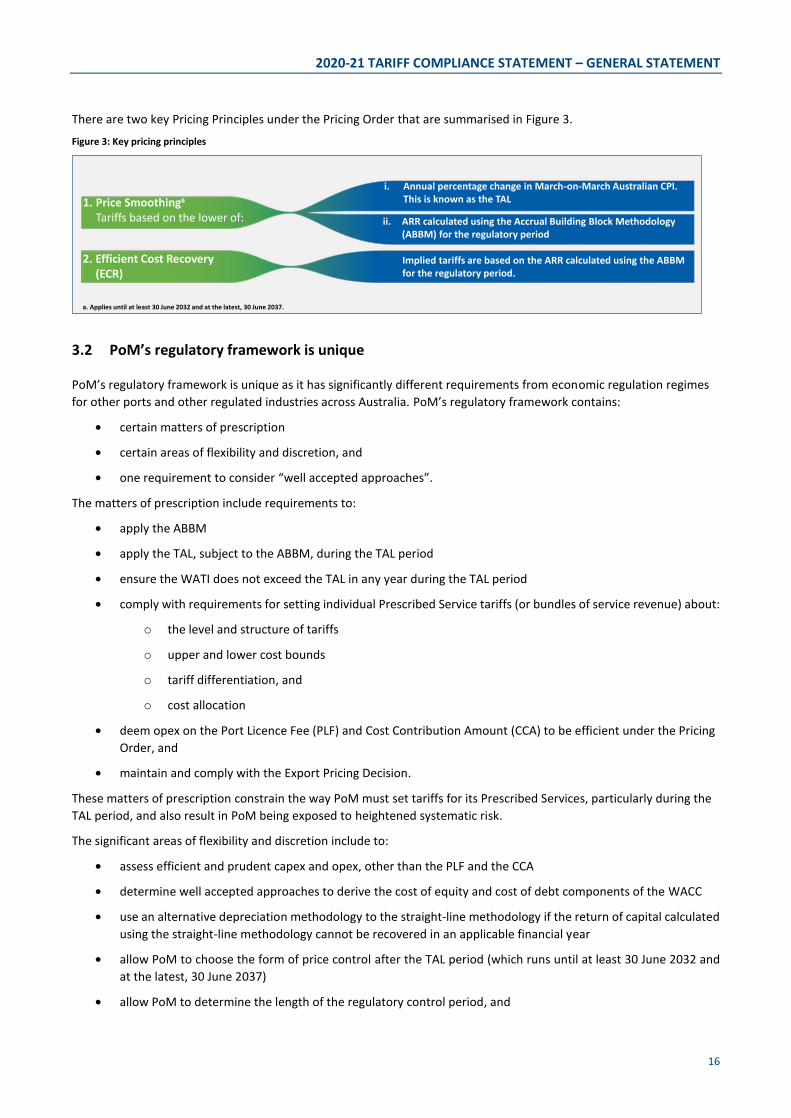
There are two key Pricing Principles under the Pricing Order that are summarised in Figure 3. Figure 3: Key pricing principles
3.2 PoM’s regulatory framework is unique
PoM’s regulatory framework is unique as it has significantly different requirements from economic regulation regimes for other ports and other regulated industries across Australia. PoM’s regulatory framework contains:
certain matters of prescription
certain areas of flexibility and discretion, and
one requirement to consider “well accepted approaches”.
The matters of prescription include requirements to:
apply the ABBM
apply the TAL, subject to the ABBM, during the TAL period
ensure the WATI does not exceed the TAL in any year during the TAL period
comply with requirements for setting individual Prescribed Service tariffs (or bundles of service revenue) about:
o the level and structure of tariffs
o upper and lower cost bounds
o tariff differentiation, and
o cost allocation
deem opex on the Port Licence Fee (PLF) and Cost Contribution Amount (CCA) to be efficient under the Pricing Order, and
maintain and comply with the Export Pricing Decision.
These matters of prescription constrain the way PoM must set tariffs for its Prescribed Services, particularly during the TAL period, and also result in PoM being exposed to heightened systematic risk.
The significant areas of flexibility and discretion include to:
assess efficient and prudent capex and opex, other than the PLF and the CCA
determine well accepted approaches to derive the cost of equity and cost of debt components of the WACC
use an alternative depreciation methodology to the straight-line methodology if the return of capital calculated using the straight-line methodology cannot be recovered in an applicable financial year
allow PoM to choose the form of price control after the TAL period (which runs until at least 30 June 2032 and at the latest, 30 June 2037)
allow PoM to determine the length of the regulatory control period, and
1. Price Smoothinga
Tariffs based on the lower of:
i. Annual percentage change in March-on-March Australian CPI. This is known as the TAL
ii. ARR calculated using the Accrual Building Block Methodology (ABBM) for the regulatory period
2. Efficient Cost Recovery (ECR)
Implied tariffs are based on the ARR calculated using the ABBMfor the regulatory period.
a. Applies until at least 30 June 2032 and at the latest, 30 June 2037.

2020-21 TARIFF COMPLIANCE STATEMENT – GENERAL STATEMENT
17
allow for tariff changes and rebalancing during the TAL period, subject to consulting with Port Users and the approval of the ESC.
These areas of flexibility and discretion reflect that:
the Victorian Government wanted to introduce a compliance monitoring framework that:
o minimises regulatory burden
o does not provide direct price control, and
o facilitates and promotes competition between ports, shipping lines and third party operators
PoM is different from other regulated businesses, such as electricity and water networks, that have different market dynamics and are subject to full economic regulation. The Port is part of a competitive national and international transport supply chain and faces effective competition from other ports and transport modes that are unregulated, and material countervailing power from Port Users
it is appropriate for the regime to adapt to evolving circumstances and needs over time, including for PoM to undertake growth-related capex sooner than was anticipated at the time of the PLT, such as investment for rail and larger vessels, and
economic regulation is an imprecise tool where reasonable minds can disagree on matters. For example, what constitutes efficient costs, or where there is inherent uncertainty of key inputs, such as parameters for the rate of return.
There is a requirement to “use one or a combination of well accepted approaches” to derive the cost of equity and cost of debt components of the WACC. This is discussed in section 9.2.3 and Appendix N.
3.3 Application of the TAL
PoM’s 2020-21 Prescribed Services tariffs are subject to a price cap through the application of the TAL.
The TAL requires that tariffs for Prescribed Services change by no more than the annual increase in CPI until at least 30 June 2032, and at the latest 30 June 2037. PoM expects the TAL to apply until 2037, because tariffs implied by the ABBM are expected to be higher than tariffs subject to the TAL for the entirety of this period.
The long-term price cap under the TAL provides certainty and transparency in tariffs for Port Users through to at least 2032, and likely 2037.
This is effectively a form of a price cap, which combined with the fact that PoM’s Prescribed Services tariffs are entirely volume-based (i.e. no fixed or annual charges), means that PoM bears the risks related to demand on behalf of customers. This is significantly different from the regulatory settings for most other Australian regulated infrastructure, where:
Many regulated businesses are subject to revenue caps, where prices adjust to ensure the regulated business meets its revenue requirement despite variations in demand, or hybrid arrangements that have thresholds for variations in demand before prices are reset.
Even where price caps are in place, regulated businesses typically have the ability to adjust prices at regular intervals (e.g. 4-5 years), to re-align costs and revenues, and
Tariff structures for most regulated businesses typically have a fixed component through annual or service charges, which shields them from variations in demand.
The TAL arrangements mean PoM is subject to the most stringent regulatory pricing controls of any Australian port, and also faces heightened exposure to systematic risks.
3.4 The ESC’s five-yearly review
The ESC will undertake a formal public compliance inquiry every five years that will include findings on whether there has been any non-compliance and, to the extent there has been, whether any such non-compliance is “significant and

2020-21 TARIFF COMPLIANCE STATEMENT – GENERAL STATEMENT
18
sustained”.14 The ESC’s first formal compliance review will be undertaken in 2021 for the review period commencing on 1 July 2016 and ending on 30 June 2021.15 The outcomes of the compliance inquiry must be reported to the ESC Minister within six months of each five-yearly review period.
In undertaking its five-yearly inquiry, section 48A of the PMA requires the ESC to have regard to the regulatory objectives in section 48 of the PMA (see Figure 2 above). In this regard, PoM considers that it is important to recognise that:
economic regulation is only a safeguard to promote or mimic competition – it is not a perfect substitute for competition
the ESC’s role is to monitor compliance, rather than to set tariffs
there are many flexible and discretionary elements of the Pricing Order (and PMA) that are open to interpretation
reasonable minds can disagree on efficient costs or where there is inherent uncertainty of key inputs, and
misapplying the Pricing Order may result in the PMA objectives not being achieved.
In preparing this 2020-21 TCS, and its earlier submissions, PoM has carefully considered the feedback provided by the ESC, and on the basis of further detailed analysis and independent advice on key issues, made a number of adjustments to its positions.
3.5 Pricing Order changes for the Port Rail Transformation Project
The Port Rail Transformation Project (PRTP), announced in January 2020, will deliver a new rail operating framework from 1 June 2020, and deliver new rail infrastructure in the port. The PRTP is designed to encourage mode shift from road to rail through improved infrastructure and industry reform. It addresses both the infrastructure and commercial frameworks necessary to enable the supply chain to grow the rail mode share.
The PRTP will be funded by an amendment to the Prescribed Service Tariff for containerised ‘Full – inward’ container Wharfage Fees, in accordance with the Pricing Order amendment gazetted by the Government on 20 May 2020.
Following gazettal of the Pricing Order amendment on 20 May 2020, the Reference Tariff Schedule for the Financial Year commencing 1 July 2019 has been amended to increase the Prescribed Service Tariff for containerised ‘Full – inward’ Wharfage Fees from $110.77 per TEU (GST-exclusive) to $120.52 per TEU (GST-exclusive) on and from 1 June 2020.
PoM has followed the procedures set out in clause 6.3 of the Pricing Order to amend the Reference Tariff Schedule:
On 31 January 2020, PoM notified Port Users and the ESC of its intention to amend the Reference Tariff Schedule (clause 6.3.1(a))
On 30 April 2020, PoM provided notice to Port Users and the ESC of the final version of the amended Reference Tariff Schedule (clause 6.3.1(b)).
In addition to amending the Prescribed Service Tariff for containerised ‘Full – inward’ Wharfage Fees, the key changes to the Pricing Order include new or amended clauses specifying that:
The TAL does not apply to the amendment to the Prescribed Service Tariff for containerised ‘Full – inward’ Wharfage Fees, which is also deemed to comply with the Pricing Principles and the Cost Allocation Principles in the year in which the amendment takes effect
Capital expenditure to deliver the PRTP will be added to the capital base – this includes the acquisition of existing rail assets and any other capital expenditure required to achieve the objectives of the PRTP (the Rail Asset Deliverables)
14 Division 2A of the PMA, s.49I(1) 15 The ESC must complete the inquiry no later than six months after a review period – clause 49I of the PMA

2020-21 TARIFF COMPLIANCE STATEMENT – GENERAL STATEMENT
19
Actions by PoM to acquire existing rail infrastructure or undertake capital expenditure to achieve the Rail Asset Deliverables are taken to be prudent acts for the purpose of inclusion in the capital base. For the avoidance of doubt, future capital expenditure may still be assessed for efficiency
PoM’s forecast operating expenses are to include an amount equal to the annual prevailing rent per square metre (exclusive of outgoings) applied to the designated area, foregone due to the re-purposing of land to achieve the Rail Asset Deliverables (the Designated Area), and any actual third party outgoings incurred by PoM in relation to the Designated Area.
PoM has consulted extensively on its rail strategy and PRTP, details of which are set out in section 5 and Appendix I.

2020-21 TARIFF COMPLIANCE STATEMENT – GENERAL STATEMENT
20
4. Historical performance
4.1 PoM’s 2018-19 actual performance
Given the 31 May 2020 submission deadline, PoM does not have a full year of actual information for 2019-20 at the time of submitting this TCS to the ESC. PoM will provide this information in next year’s 2021-22 TCS. PoM can only therefore provide actual information for 2018-19 at this stage.
Table 4 compares PoM’s 2018-19 forecast revenue, capex and opex for Prescribed Services with actual outcomes. Table 4: Comparison of 2018-19 forecast and actual revenue, Capex and Opex, $ Million
2018-19 (F) 2018-19 (A) Difference (%) Difference ($)
Revenue 371.8 362.8 -2.4% -9.0
Capex 67.7 57.3 -15.4% -10.4
Opex 127.9 124.5 -2.7% -3.5
PoM’s 2018-19 revenue was marginally lower than forecast due to actual trade volumes being slightly lower overall than forecast, as detailed in Table 5, below, which compares PoM’s 2018-19 forecast trade volumes with actual volumes.
PoM’s 2018-19 actual opex was broadly in line with its forecast. There was a slight underspend in controllable opex, mainly in labour and transition costs, which resulted in total opex being 3 per cent lower than forecast.
Overall, there was a net underspend of $10.4 million for Capex in 2018-19. Most categories came in slightly under forecast, particularly dredging Capex, which was re-prioritised to 2019-20 to gain efficiencies from the availability of the Boskalis large dredge in Australia (see section 9.2.2). Capex on wharves was approximately $5 million higher than forecast, largely due to increased expenditure needs identified during the renewal program at Swanson Dock. Specifically, surveys and testing of the timber piles at Swanson Dock revealed deterioration of a significant number of piles necessitating increased remediation expenditure. Table 5: Comparison of 2018-19 forecast and actual trade volumes
Trades Units (Million) 2018-19 (F) 2018-19 (A) Difference (absolute)
Difference (%)
Containers – import TEU 1.27 1.28 0.0 0.5%
Containers – export 0.84 0.78 -0.1 -7.9%
Containers – empty 0.55 0.64 0.1 17.0%
Containers – Bass Strait 0.32 0.32 0.0 -0.9%
Dry bulk Revenue tonnes 4.40 3.98 -0.4 -9.5%
Liquid bulk 2.90 2.52 -0.4 -13.0%
Motor vehicles 7.37 6.89 -0.5 -6.5%
Breakbulk 3.38 3.71 0.3 9.8%
Channel – Melbourne Gross tons 119.19 120.42 1.2 1.0%
Channel – Shared 132.61 132.87 0.3 0.2%
Notes: 1. 'Containers - Bass Strait' includes empty containers. 2. 'Breakbulk' includes Wheeled Unitised cargos.

2020-21 TARIFF COMPLIANCE STATEMENT – GENERAL STATEMENT
21
4.2 ESC’s feedback on PoM’s 2019-20 TCS
The ESC provided informal feedback on PoM’s 2019-20 TCS through its Interim Commentary, and in subsequent meetings between PoM and ESC Staff.
As set out in the Interim Commentary, the purpose of the feedback is to provide PoM and other stakeholders an opportunity to understand the matters that are likely to be the focus of the ESC’s assessment of PoM’s compliance with the Pricing Order in its five-yearly inquiry.16
PoM welcomes the continued engagement with the ESC during 2019-20. It is important for PoM to understand any issues or concerns that the ESC has about PoM’s regulatory approach and positions so that PoM can respond appropriately, including by refining or further justifying its positions and approach, where necessary, in the lead up to the five-yearly review.
The ESC’s 2019-20 Interim Commentary recognised that in its 2019-20 TCS, PoM had:
improved the transparency of its modelling and the transparency of its treatment of depreciation in the revenue requirement, improving ease of understanding of the calculation of its tariffs
made a number of minor changes to its weighted average tariff calculations and tariffs, which the ESC considered is now more consistent with the requirements of the Pricing Order, and
clearly outlined its engagement program with Port Users and other stakeholders. The ESC also noted that it is satisfied with PoM’s engagement program, and encouraged by the open and ongoing dialogue between PoM and its stakeholders and customers, which over time should equip the port to respond to the ongoing needs of its customer base.17
Feedback provided by the ESC on compliance issues was focussed on:
the rate of return (WACC), which the ESC noted would require further justification to demonstrate compliance with the Pricing Order, and
PoM’s treatment of deferred depreciation, which the ESC requested more detail on.
Section 9.2.3 and Appendix N of this TCS respond to the issues raised by the ESC and set out our approach to the rate of return, while our approach to depreciation is set out in section 9.2.4.
The ESC has not issued PoM with a Supporting Information Determination under clause 9 of the Pricing Order and has therefore not specified the form and content of information to be provided by PoM in this TCS.
16 ESC, Interim Commentary - Port of Melbourne tariff compliance statement 2019-20, 16 December 2019, p.iv 17 ESC, Interim Commentary - Port of Melbourne tariff compliance statement 2019-20, 16 December 2019, pp.1-2

2020-21 TARIFF COMPLIANCE STATEMENT – GENERAL STATEMENT
22
5. What Port Users and other stakeholders are telling PoM
Stakeholder engagement is fundamental to PoM’s operations. PoM considers effective engagement to be not just a means to an end but rather a core operational value that is integral to the provision of its Prescribed Services, which are part of a dynamic international freight supply chain.
PoM continued its proactive engagement program with Port Users and other stakeholder over the course of 2019-20, which covered the following key areas:
the 2050 Port Development Strategy (PDS), PoM’s 30-year roadmap for the future development of the Port
the Port Rail Transformation Project (PRTP), which also forms part of the PDS, and followed on from earlier engagement on the Rail Access Strategy and Port Rail Shuttle Network, and
TCS consultation and broad business engagement, which included updates and consultation on the above projects, and sought the views of Port Users and other stakeholders on PoM’s investment strategy and the 2020-21 TCS.
This section provides an overview of:
PoM’s engagement activities in 2019-20
the views and feedback provided to PoM by Port Users and other stakeholders, and
how PoM has, or will, respond to address this feedback.
Appendix I provides further detail on these matters.
5.1 PoM’s Port Users and other stakeholders for Prescribed Services
All of PoM’s Prescribed Services tariffs are levied on shipping lines, who are direct Port Users.
Stevedores18, transport providers, cargo owners and freight forwarders are all examples of indirect Port Users because they rely on Prescribed Services, but they do not directly pay PoM’s Prescribed Services tariffs:
stevedores recover their total costs based on commercial arrangements with shipping lines and transport providers. The Australian Competition and Consumer Commission (ACCC) monitors stevedore charges and publishes an annual report on its findings, and
shipping lines and transport providers both charge cargo owners directly, or freight forwarders acting for cargo owners, for their services.
Figure 4 illustrates the relationship between PoM and direct and indirect Port Users for the provision of Prescribed Services.
18 PoM leases space and facilities on port land to stevedores (and other Port Users), which is classified as a non-Prescribed Service.

2020-21 TARIFF COMPLIANCE STATEMENT – GENERAL STATEMENT
23
Figure 4: PoM’s relationship with Port Users and Prescribed Services provision
The PRTP has a unique set of direct and indirect Port Users, which include Rail Terminal Operators (RTOs), Rail Service Providers, Intermodal Terminal Operators, Network Access Providers and Industry Associations.
Through the TCS consultations in early 2020, PoM engaged a wide range of Port Users and other stakeholders on the broad areas detailed above.
5.2 Importance of engagement
PoM appreciates that engagement needs to be two-way to be meaningful. Accordingly, the key objective of PoM’s engagement is to establish open communications with Port Users and other stakeholders, in order for PoM to:
provide accessible, relevant and transparent information on PoM’s priority investments and future direction, and
understand, discuss and address Port Users and other stakeholders’ business needs, insights and requirements on key matters to ensure that PoM is meeting their expectations now and into the future.
Figure 5 sets out PoM’s core engagement principles that underpin and characterise its approach to consultation.

2020-21 TARIFF COMPLIANCE STATEMENT – GENERAL STATEMENT
24
Figure 5: PoM’s engagement principles
PoM has applied these core principles in developing and conducting its engagement activities to foster genuine and meaningful discussions with Port Users and other stakeholders.
5.3 What PoM has done
PoM continuously and actively engages Port Users and other stakeholders to inform them about its investment strategy and to allow them to provide their views and perspectives on PoM’s plans for the future.
Table 6 shows that, consistent with its commitment to working collaboratively with Port Users and other stakeholders, PoM has maintained a high level of engagement with Port Users and other stakeholders.
Table 6: Invitations, acceptances and attendance (individuals) – engagement activities to inform relevant TCS
Port Users and other Stakeholders 2017-18 TCS 2018-19 TCS 2019-20 TCS 2020-21 TCS
Invited to participate 171 655 1,222 517
Accepted invitations 84 533 758 112
Attended the engagement activities 68 230 878 136
Notes: 2020-21 TCS figures relate only to the TCS consultation sessions held in early 2020, figures from other regulatory engagements such as industry discussions, port visits etc. (which are included for previous regulatory periods) are excluded.
Table 7 summarises the engagement activity PoM has undertaken, what it heard from Port Users and other stakeholders and how it has or will respond. Appendix I provides further detail on these matters. Table 7: What PoM has done, what it heard and how it has or will respond
Topic PoM’s engagement activity Port Users and stakeholders’ feedback PoM’s response
TCS - Eight engagement sessions held in February and March with all levels of industry, in Burnie, Launceston, Hobart, Sydney (2), Griffith, Wagga Wagga and Melbourne (2)
- Queries on deferred deprecation when the TAL period finishes and impact on prices
- Opportunities for tariff rebalancing raised included reducing empty container wharfage, incentives for rail use, incentives for exporters, or to
- PoM’s principles for recovering deferred depreciation are based on minimising price impacts and volatility.
- PoM commenced engaging with port users around tariff rebalancing in preparation for the 2019-20 TCS, and will continue these discussions,
Collaborative Identify stakeholders and their perspectives. Invite broad input. Incorporate views.
Be clear about engagement purpose. Share information and future direction. Provide rationale for decisions and planning.
Provide realistic timeframes. Action feedback and views raised through engagement. Advise outcomes.
Actively seek feedback. Identify engagement opportunities. Use clear, non-technical and accessible language. Respect differing views.
Transparent
Responsive
Inclusive
Authentic
Effective
Engage on matters of importance to stakeholders. Be consistent and encourage dialogue and broad contributions.
Deliver outcomes of value to Port Users in aggregate.

2020-21 TARIFF COMPLIANCE STATEMENT – GENERAL STATEMENT
25
Topic PoM’s engagement activity Port Users and stakeholders’ feedback PoM’s response
- Presentation slides and key questions on the TCS provided to attendants and industry associates for comment
address where infrastructure development disadvantaged certain trades
- Feedback also included trade, operational issues, broader regulatory issues (e.g. stevedore infrastructure charges, ACCC liner class exceptions)
including as part of the big ships strategy.
- PoM will continue to engage with Port Users to ensure that it is abreast of key trade developments and implications for infrastructure. PoM will also continue to engage in broader regulatory issues at the port, as they arise.
PDS - The Port Development Strategy 2050 (2050 PDS) was released in draft on 12 November 2019. A four week consultation period took place. Comments and submissions were received via a dedicated email address until Friday December 6 2019
- There were more than 40 engagement briefings and meetings held during the consultation period, including with Community groups and Local Government, Boardroom briefings, Ministerial meetings, Industry groups, Tasmanian customers, Government agencies
- Other stakeholder groups such as stevedores and the Port of Melbourne’s tenants were also contacted by email to alert representatives of the release of the 2050 PDS for consultation, and to invite comment.
- More than 100 stakeholders were contacted via email to alert them of the release of the 2050 PDS and to invite comment
- The final 2050 PDS will be released and made available on the Port of Melbourne website.
- A summary of changes, FAQs and key themes will also be published on the same site.
- The overall response to the 2050 PDs across industry, community, local government and government agencies has been extremely positive, with the long-term vision and clear positions commented on
- Many concerns, questions and issues raised were familiar to PoM through regular engagement with the community, industry and government, including the impacts of growth, emissions, pollution, noise, congestion, and environment. Many comments also related to the extent to which different stakeholders may benefit, or be impacted by investments.
- Operational queries around the timing and transition plan for the proposed move of Tasmanian operators within the port, and alternatives considered
- Queries around long-term plans to connect Webb Dock via rail
- Queries around productivity assumptions, and noted that automation and efficiency can deliver cost savings – are there plans for these types of investments at the port
- Noted that increased utilisation of the Appleton and Victoria precinct could lead to congestion in that area
- As a landlord port we will encourage our long term tenants to progressively move to ever increasing use of equipment and machinery that is more productive and energy efficient with fewer greenhouse gas emissions
- PoM’s Sustainability Report was released in 2019, and will continue to be updated. The PDS also supports sustainability through encouraging mode shift, and has been updated to reflect environmental legislation
- The PDS outlines PoM’s proposed Webb Dock Freight Link, our plan to connect Webb Dock to rail. PoM is investigating plans for Webb Dock rail in conjunction with the State
- The PDS takes productivity growth into account. PoM does not have an operational role in investing in stevedoring infrastructure, however, we will continue to work with long-term tenants on the productivity agenda. In addition, the promotion of competition is expected to drive efficiency
- PoM is exploring opportunities to support efficiency with PDS investments, including integrating the former Melbourne Wholesale Market Site into the Port to provide additional capacity and better access to the Port
PRTP - More than 500 interactions in varying forms over the past 18 months alone.
- These interactions included 1-1 meetings, site tours, hosting tours and participating in working groups and industry events.
- Ministerial roundtable on the PRTP with 50 attendees from across business and Government
- Extensive direct engagement with key industry participants and other stakeholders (e.g. RTOs, Stevedores, intermodal operators)
- Direct contact with around 120 individuals post-announcement
- Broad stakeholder engagement via the TCS consultations
- Also covered by PDS, with the rail strategy forming a key component
- Current intermodal and rail operators, all of whom have stated they support the project
- The approach to rail needs to be scalable, so it can respond and adapt as container volumes grow.
- Competitiveness and equity issues with operators who do not directly benefit from the PRTP
- Recognise that rail brings benefits to Tasmanian trades as well
- Questions around the calculation, timing and application of the price adjustment (e.g. whether it would come off, apply to transhipments, apply to all terminals)
- Query on whether PoM would consider deferring the PRTP (and TCS) price
- The PRTP began in 2018, as a direct result of feedback from customers that an infrastructure solution alone would not achieve the outcomes required by its stakeholders for mode shift
- Reforms to the operating arrangements for on-dock rail will bring immediate benefits to the supply chain. PoM is developing longer-term options like the Webb Dock Rail Link Project – which was part of TCS / PDS engagement
- Agreements with Rail Terminal Operators oblige them to pass through cost savings (where PoM has taken costs out of the supply chain)
- PoM’s approach to pricing is intended to support the PMA objectives of promoting competition, and as such, we do not currently apply terminal specific pricing

2020-21 TARIFF COMPLIANCE STATEMENT – GENERAL STATEMENT
26
Topic PoM’s engagement activity Port Users and stakeholders’ feedback PoM’s response
adjustments given the impact of COVID-19.
- The Pricing Order amendments ensure only prudent and efficient costs are covered by the tariff adjustment
- The PRTP is already delivering productivity and efficiency gains. It is important that this investment proceeds because it will contribute to Victoria’s recovery from COVID-19 by creating jobs. Construction is expected to commence by the end of this year
Big ships - Covered by PDS, as accommodating larger vessels is a key component of PDS
- Broad stakeholder engagement via the TCS consultations
- Noted that big ships are resulting in vessels missing berth windows, which has a cascading effect on Port Users
- Concerns raised around the long-term future of Swanson Dock given infrastructure constraints in handling big ships
- In relation to charging, query whether the investment was part of facilitating trade, and some stakeholders noted that big ships should bear the costs of the investments to handle big ships
- PoM is working with stakeholders to better understand impacts on Port Users from current design vessel limitations
- PoM’s channels and supporting infrastructure with regard to container shipping have been designed to enable safe navigation of a “design vessel”. Noting Port Users’ concerns about operational challenges from larger vessels, PoM is developing an investment program to provide a new service to vessels larger than the design vessel (subject to approval from the Harbour Master19). This investment program will include Swanson Dock, to facilitate and promote competitiveness between Webb and Swanson precincts on berth infrastructure
- Big ships investments are not targeted at increasing port capacity (which is sufficient for the next decade), but rather responding to the changing nature of the service provided to accommodate larger vessels than the port was designed for. This will drive efficiencies in the supply chain, but have limited impact on PoM’s volumes
- PoM is considering various cost recovery options for the new service and will consult further with Port Users and the ESC in 2020.
19 The lease of the Port of Melbourne to PoM on 1 November 2016 resulted in separation of the regulatory functions of the port; which now reside with the Victorian Ports Corporation Melbourne (VPCM) Board and the Harbour Master. In this regard the Harbour Master is a key decision maker who has independent statutory powers, undertaking functions under the Marine Safety Act 2010 (Vic). The Harbour Master’s primary responsibility is navigational safety, including determining the conditions under which all vessels can safely navigate through port waters. Ships larger than the design vessel are able to call at the Port of Melbourne upon obtaining approval from the Harbour Master.

2020-21 TARIFF COMPLIANCE STATEMENT – GENERAL STATEMENT
27
6. The length of the regulatory period
Under clause 13 of the Pricing Order, PoM may determine the regulatory period for the purposes of calculating its ARR using the ABBM and its Prescribed Services revenue (subject to the TAL), as well as the associated tariffs.
Consistent with previous years, PoM has determined a one-year regulatory period for 2020-21. We consider that the use of a one-year regulatory period remains the best option for Port Users and PoM at this time. PoM’s proposal to maintain a one-year regulatory period was raised with Port Users and other stakeholders during the TCS consultations. No concerns about the approach to the regulatory period were raised by participants in the consultations.
PoM notes that the main benefits regarding the adoption of longer regulatory periods are already present, given the current regulatory settings:
Port Users have certainty on prices out until at least 2032, and likely 2037, due to the operation of the TAL
as set out in section 5 and Appendix I, PoM continuously and actively engages Port Users and other stakeholders to inform them about its investment strategy and to allow them to provide their views and perspectives on PoM’s plans for the future. This is most apparent in the preparation of the PDS (which will be updated every 5 years), but also forms a key part of PoM’s regular engagement process for significant capital projects, and
PoM has strong incentives to continue to seek out efficiencies in opex and capex regardless of the length of the regulatory period, since the TAL applies regardless of PoM’s actual cost outcomes (unlike other regulated Australian infrastructure businesses, which typically have the opportunity to adjust prices to reflect changes in underlying costs every 4-5 years).
PoM will continue to consult Port Users and other stakeholders, including the ESC, on the benefits and practicalities of applying longer regulatory periods.
As noted in earlier submissions, PoM is still in the process of developing, in conjunction with Port Users, strategies and performance standards that would support longer regulatory periods:
the PDS – the PDS 2050 outlines the high-level plans and approach for developing the capacity and efficiency of the Port over the next 30 years, through to 2050, while also providing a planning framework that is adaptable and responsive to changing needs over time. As noted above, PoM consulted extensively on the draft PDS in late 2019, and will finalise it by mid-2020.
performance standards – the 2019-20 TCS contained draft performance standards to allow the ESC, Port Users and other stakeholders to assess whether PoM is meeting service outcomes in an efficient, consistent and timely manner. In last year’s TCS, it was noted that the performance standards would need to be settled following finalisation of the PDS and Rail Access Strategy (RAS), and have regard to the case for tariff rebalancing. PoM’s draft performance standards are discussed in section 8.
The Rail Access Strategy (RAS) was submitted to the Government in 2019,20 outlining short and medium-term projects that are critical to successfully deliver improved rail access to the port. The first of these is the PRTP, as set out above. Performance standards related to the RAS are discussed in section 8.
It is PoM’s intent to review the case for adoption of a longer regulatory period once the long-term investment plans embodied in the PDS and the associated performance standards are settled, as they are critical to determining the performance outcomes that PoM will deliver to meet Port Users’ and other stakeholders’ long-term needs.
20 In accordance with section 91Q of the PMA and clause 27 of the Port Lease

2020-21 TARIFF COMPLIANCE STATEMENT – GENERAL STATEMENT
28
7. 2020-21 trade volume forecasts
PoM engaged BIS Oxford Economics (BISOE) once again to forecast its trade volumes for 2020-21. PoM forecasts channel volumes internally by applying historical correlations between ship tonnage and trade volumes to the BISOE trade forecasts, in conjunction with published shipping schedules for the Bass Strait operators and cruise vessels.
In response to the ESC’s 2018-19 Interim Commentary, PoM provided the ESC with additional documentation to explain how its 2019-20 trade volume forecasts were prepared and to promote the transparency of these forecasts. These explanatory documents are provided again for the 2020-21 TCS:
Appendix K presents BISOE’s trade forecasts for PoM for 2020-21
Appendix L is the forecasting model prepared by BISOE, and
Appendix M is the handbook that should be read in conjunction with the forecasting model that explains the mechanics of how the forecasts for 2020-21 have been prepared.
7.1 Overview of forecasting approach
BISOE’s forecasting approach is set out below:
Step 1 – for containerised trade only, acknowledge the common characteristics between major Australian container ports, namely that:
o each major container port services only the relevant State (with the exception of Burnie)
o imports are the dominant full container trade (with Burnie and Adelaide being exceptions), and
o there was strong growth between the 1990s and mid-2000s, with slower growth since the Global Financial Crisis.
These common characteristics inform trade analysis. In particular, for containerised imports, the outlook tends to track the national macroeconomic outlook with state-specific demand factors. For containerised exports, BISOE overlays the national production outlook with local specialisation from within PoM.
Step 2 – for each commodity, identify the macroeconomic or industry drivers. BISOE has grouped imported commodities according to six broad categories linked with common drivers to minimise the chance of a historical mis-categorisation creating a spurious result in the historical time series.
Step 3 – explain any variances (i.e. sudden shifts in volumes) from the macroeconomic or industry drivers. These variances, which may reflect a change in modal choice, port facilities or local production factors, are examined to explain any variances.
Step 4 – apply macroeconomic drivers. Once the relationship between the trade volumes and macroeconomic drivers are established, and future structural changes are identified, the forecast trade volumes reflect the macroeconomic outlook. The macroeconomic drivers include: Victorian, Tasmanian and Australian population growth; Victorian and Australian domestic final demand; Victorian, Tasmanian and Australian retail growth; Victorian machinery and equipment investment growth; Australian building (dwelling and non-dwelling) construction.
On top of this, BISOE applies an additional layer that quantifies the impact on trades above and beyond the changes in the macroeconomic situation (e.g. declines in jet fuel and motor spirit).
Table 8 details the source, or basis, for the key inputs and assumptions that are used in each worksheet in BISOE’s forecasting model at Appendix L. This is further explained in Appendix M.

2020-21 TARIFF COMPLIANCE STATEMENT – GENERAL STATEMENT
29
Table 8: Input assumptions for BISOE’s forecasting model
Worksheet Input/assumption Source/basis
Full outbound BISOE21 custom series on industrial production and demand
Based on historical link between production volumes and trade
Full inbound Retail turnover, investment and production (ABS) Based on historical link between demand and trade
Bass Strait Demand for consumer goods (ABS), BISOE custom series on industrial production and demand
Based on historical link between demand/production volumes and trade
General Cargo Bass Strait trade, recent trends Based on prominence of roll-on roll-off trade in the Bass Strait
Empty Full imports and full exports Balancing equation
Other Bulk Motor vehicle sales, BISOE custom series on agricultural production and building activity
Federal Chamber of Automotive Industries, BISOE economic model (for forecasts)
Transhipments Inbound (direct) TEUs, recent trends Based on historical link between transhipment and direct volumes
7.2 Overview of key outcomes
The demand forecasts for 2020-21 were prepared at a time of significant economic disruption and uncertainty. In terms of the impact of recent events on the PoM supply chain:
total container volumes (full and empty) for April 2020 are down by 11.3 per cent compared with April 2019. Full overseas container imports were 9.2 per cent down whilst full overseas container exports were down 8.1 per cent
shipping lines have cancelled a total of 30 vessel sailings (‘blank sailings’), between January and April, double the cancellations for the same period in 2019. Shipping lines attributed 22 of these to COVID-19, while eight were attributed to the regular Lunar New Year reduction in trade
while the availability of food-quality and refrigerated containers for export packing has tightened, other empty containers are beginning to stockpile, which may present challenges to available storage capacity, and
as PoM’s volumes are closely linked with the Australian economy and the economies of our major trading partners, the impacts of COVID-19 on unemployment, income and economic activity are likely to flow through to PoM’s import and export volumes.
PoM has adopted forecasts prepared by BISOE as at 1 April 2020, and will closely monitor the impacts of the current crisis and potentially revise these as the flow-on effects to trade are better known.
The 1 April 2020 forecasts prepared by BISOE reflect a material downgrade in economic conditions around the world as more countries introduce restrictions to limit the spread of COVID-19. BISOE expects the global economy and many major economies to enter a deep recession in the first half of 2020, resulting in a global growth of 0 per cent. As a result, demand forecasts for PoM for the remainder of 2019-20, and subsequently 2020-21, include:
Import full containers are expected to fall by 9 per cent overall in 2019-20. In 2020-21, BISOE expects even weaker trade performance for the first half of 2020-21 as activity slows with imports affected by uncertainty, a surge in unemployment and falling demand, before a recovery in (some) imports in the latter half of 2020-21.
21 The “BISOE” economic model are series that are constructed in BIS Oxford’s database that service to explain underlying movements in sectors of interest but may not reflect a public data series.
2020-21 TARIFF COMPLIANCE STATEMENT – GENERAL STATEMENT
30
The overall result for imports in 2020-21 is expected to be broadly consistent with the depressed figures from 2020-21 (-0.1 per cent growth from 2019-20 to 2020-21)
Export full containers to fall by 5 per cent in 2019-20. Agricultural exports will be affected by drought in Queensland and NSW (diverting Victorian produce north), while manufacturing will be impacted by the effects of COVID-19 on our major trading partners. Similar to imports, overall exports for 2020-21 are expected to broadly remain at the (depressed) 2019-20 level (0.4 per cent growth from 2019-20 to 2020-21).
Due to the unprecedented uncertainty in the currently rapidly evolving environment, BISOE also noted that despite its recent revisions to forecasts, it considered that there remain ongoing, sizeable downside risks. Therefore, BISOE prepared a downside scenario to incorporate a worsening of the outbreak, the imposition of social restrictions, and financial stress. This scenario would see the global economy enter outright contraction in 2020, with GDP falling by 1.3 per cent over the full year. In Australia, there would be a permanent reduction in GDP, as businesses and households become permanently more risk averse, leading to lower levels of investment and employment.
Of its downside scenario, BISOE noted:22
Rather than being a low probability, extreme case, to us this scenario represents a plausible alternative baseline that, if the situation continues to deteriorate at the current pace, could become our central view in the coming months.
These risks to future demand are indicative of the risks to PoM of making large capital investments, particularly during the price cap arrangements under the TAL, and current under-recovery of the ARR demonstrated in Table 2 and Table 18, and further reinforces the importance of a holistic assessment when considering the appropriateness of PoM’s WACC.
22 BIS Oxford Economics, Port of Melbourne Trade Forecasts, April 2020, p.5

2020-21 TARIFF COMPLIANCE STATEMENT – GENERAL STATEMENT
31
8. Performance standards
Performance standards reflect the level of service consistent with certain tariff outcomes. They increase transparency and accountability in relation to how a business performs on key matters valued by stakeholders.
PoM recognises the need to develop performance standards consistent with tariffs subject to the TAL, which:
are within its control, and
reflect what Port Users and other stakeholders value.
PoM consulted on and developed initial draft performance standards for its 2018-19 TCS. These draft standards drew on the Bureau of Infrastructure, Transport and Regional Economics (BITRE) performance framework and had regard for the types of performance standards that are in place for the Victorian water businesses, which are also regulated by the ESC.
In the 2019-20 TCS, PoM updated the draft performance standards with new provisions for on-port rail, and noted that it would review the draft standards further in light of its consultation in 2019 on its PDS, the Victorian Government’s impending decision on the Rail Project and PoM’s proposed upcoming engagement on tariff rebalancing.
As noted above, PoM submitted its Rail Access Strategy (RAS) to the Victorian Government in 2019, which sets out on-dock rail terminal infrastructure options for the movement of freight into, and out of, the Port that provide viable, cost effective and sustainable alternatives to road transport.23 The RAS also includes broad timeframes for key initiatives to deliver the future port rail system.
In the TCS consultations held in early 2020, Port Users and other stakeholders did not provide direct comments on the draft performance standards, or more generally on services or performance targets that they would like to see PoM report on. However, participants in the consultations did provide various comments about infrastructure and performance issues, which provides insights into those aspects of PoM’s performance that customers value most. These included comments and queries about topics such as:
the timing of key infrastructure projects, such as the rail investments in the PRTP and the delivery timeframes and implementation plans for the PDS, including investments to support big ships
the extent to which climate change considerations form a part of PoM’s planning, and
operational issues related to various projects, such as concerns about the possibility of future congestion in the Appleton Dock and Victoria Dock precincts, and the extent to which new technologies and productivity improvements are likely to be adopted at the port.
As set out in Figure 4 above, PoM does not have a direct role in port operations. However, we recognise that PoM may have an ability to influence the efficiency and productivity of port operations, such as by supporting efficient operations with appropriate infrastructure, minimising disruptions during major investments, and ensuring that Port Users have incentives to invest in productivity enhancements.
Based on the feedback provided in consultations, PoM has updated its draft performance standards to provide for regular reporting on the progress of key infrastructure projects. We have also made other minor refinements to clarify the standards and enhance their relevance, for example:
improving the clarity of the standards by providing a description of each standard and then the measure by which it will be assessed, and
some draft standards in earlier TCSs, while important PoM corporate objectives and internal key performance indicators, appear to be of less relevance to Port Users in the context of the TCS consultations, such as PoM’s compliance with OHS regulations and legislation administered by Government bodies other than the ESC. These have been streamlined to reduce the number of standards and enhance their relevance to Port Users.
23 An overview of the RAS, Our Plan for Rail, is available on PoM’s website, at https://www.portofmelbourne.com/port-operations/rail-operations/

2020-21 TARIFF COMPLIANCE STATEMENT – GENERAL STATEMENT
32
Table 9 details the draft performance standards provided in its 2020-21 TCS, updated from the previous TCS as described above.
Table 9: Draft performance standards (updated from 2019-20 TCS)
Category Performance standard Measure / Reporting against standard
Safety and Environment
1. Prepare a safety management plan and environment management plan in accordance with s.91C(1) of the PMA.
2. Prepare and maintain a Sustainability Report to determine and monitor Environmental, Social and Governance (ESG) actions and targets.
1. Regular updates to the Safety and environmental management plan (SEMP) – originally certified in 2016, and updated in 2018 and 2020.
2. The inaugural 2018 Sustainability Report was released in 2019, detailing PoM’s actions and performance across its ESG systems, which are guided by relevant UN Sustainable Development Goals.
Reliability / Availability / Capacity
3. Maintain International Organisation for Standardisation (ISO) 55001 certification achieved for asset management, to ensure infrastructure is maintained at current levels in accordance with Good Operating Practice.
4. Maintain channel depths through maintenance dredging program. Vessel access to shipping channels 100% of the time in accordance with the declared depths as detailed in the Port Information Guide. PoM’s channel and wharf infrastructure is based on a design container vessel of 300 metres length overall x 40 metres beam with a maximum draught of 14 metres.24
3. Most recent International Organisation for Standardisation (ISO) 55001 certification achieved on 11 April 2019. Surveillance audit passed in April 2020, with recertification application to occur in April 2022. The surveillance audit only looks at targeted areas of the overall system whereas recertification will be a review of all aspects of the system in relation to the standard.
4. Maintenance dredging program in 2018-19 (last year of actuals) was $4.4m (Melbourne Channel only), down from $6.9m in 2017-18 ($5.0m Shared Channel and $2.0m Melbourne Channel). Note: An increase in the size of vessel utilising the channels beyond the design vessel will need enhancements to the existing channel infrastructure to maintain acceptable safety and operability margins.
Infrastructure planning and strategies
Develop medium- to long-term investment plans and strategies for the Victorian Government:
5. Port Development Strategy (PDS) will set out PoM’s long-term (30 year) vision for the growth and development of the Port.
6. Rail Access Strategy (RAS), will set out cost effective and sustainable on-dock rail terminal infrastructure options.
5. The PDS is required to be provided to the Victorian Government in 2020 and updated every five years thereafter (section 91K of the PMA). The draft PDS is available on the PoM website, and will be finalised in mid-2020.
6. The first RAS was provided to the Victorian Government in October 2019 and must be updated on an ongoing basis at the same time as the PDS. A summary is available on the PoM website.
Customer and community engagement
7. Port Users and other stakeholders’ consulted on and considered in the development of the TCS.
8. Port Users and other stakeholders’ consulted on and considered in the development of long-term plans (e.g. PDS, RAS).
7. For the 2020-21 TCS, PoM held 8 consultation sessions, and considered the views of Port Users and other stakeholders in developing the TCS, as set out in section 5.
8. Extensive consultation was undertaken for the PDS and RAS (see section 5).
24 Ships larger than the design vessel are able to call at the Port of Melbourne upon obtaining approval from the Harbour Master. The lease of the Port of Melbourne to PoM on 1 November 2016 resulted in separation of the regulatory functions of the port, which now reside with the Victorian Ports Corporation Melbourne (VPCM) Board and the Harbour Master.

2020-21 TARIFF COMPLIANCE STATEMENT – GENERAL STATEMENT
33
Category Performance standard Measure / Reporting against standard
Major project delivery
9. Major projects under the RAS to be delivered in the short-term (i.e. 0-5 years) and reported on in subsequent TCSs include:
- Port Rail Transformation Project
- Former Melbourne Wholesale Market Site
- Container origin and destination study.
9. At the end of each regulatory period, PoM will report on progress against the major projects outlined in the relevant strategy (e.g. PDS, RAS, PRTP), with a focus on timing/stage of delivery and any material changes to timing or scope.
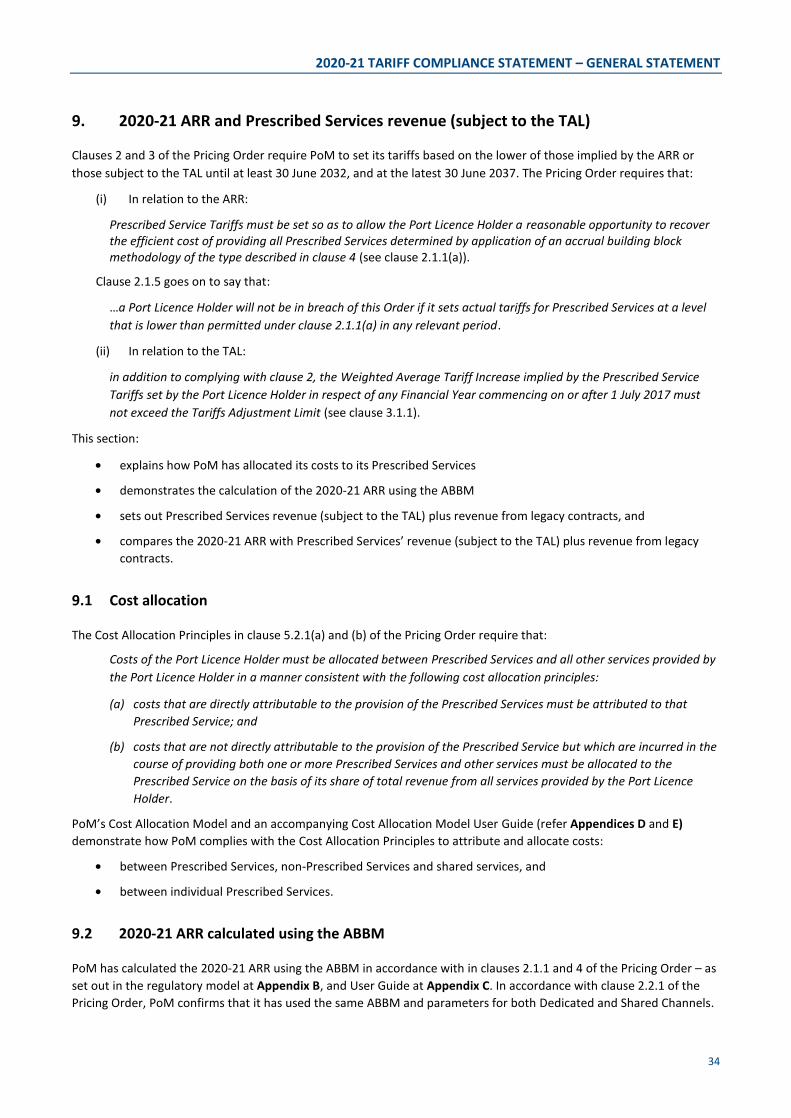
2020-21 TARIFF COMPLIANCE STATEMENT – GENERAL STATEMENT
34
9. 2020-21 ARR and Prescribed Services revenue (subject to the TAL)
Clauses 2 and 3 of the Pricing Order require PoM to set its tariffs based on the lower of those implied by the ARR or those subject to the TAL until at least 30 June 2032, and at the latest 30 June 2037. The Pricing Order requires that:
(i) In relation to the ARR:
Prescribed Service Tariffs must be set so as to allow the Port Licence Holder a reasonable opportunity to recover the efficient cost of providing all Prescribed Services determined by application of an accrual building block methodology of the type described in clause 4 (see clause 2.1.1(a)).
Clause 2.1.5 goes on to say that:
…a Port Licence Holder will not be in breach of this Order if it sets actual tariffs for Prescribed Services at a level that is lower than permitted under clause 2.1.1(a) in any relevant period.
(ii) In relation to the TAL:
in addition to complying with clause 2, the Weighted Average Tariff Increase implied by the Prescribed Service Tariffs set by the Port Licence Holder in respect of any Financial Year commencing on or after 1 July 2017 must not exceed the Tariffs Adjustment Limit (see clause 3.1.1).
This section:
explains how PoM has allocated its costs to its Prescribed Services
demonstrates the calculation of the 2020-21 ARR using the ABBM
sets out Prescribed Services revenue (subject to the TAL) plus revenue from legacy contracts, and
compares the 2020-21 ARR with Prescribed Services’ revenue (subject to the TAL) plus revenue from legacy contracts.
9.1 Cost allocation
The Cost Allocation Principles in clause 5.2.1(a) and (b) of the Pricing Order require that:
Costs of the Port Licence Holder must be allocated between Prescribed Services and all other services provided by the Port Licence Holder in a manner consistent with the following cost allocation principles:
(a) costs that are directly attributable to the provision of the Prescribed Services must be attributed to that Prescribed Service; and
(b) costs that are not directly attributable to the provision of the Prescribed Service but which are incurred in the course of providing both one or more Prescribed Services and other services must be allocated to the Prescribed Service on the basis of its share of total revenue from all services provided by the Port Licence Holder.
PoM’s Cost Allocation Model and an accompanying Cost Allocation Model User Guide (refer Appendices D and E) demonstrate how PoM complies with the Cost Allocation Principles to attribute and allocate costs:
between Prescribed Services, non-Prescribed Services and shared services, and
between individual Prescribed Services.
9.2 2020-21 ARR calculated using the ABBM
PoM has calculated the 2020-21 ARR using the ABBM in accordance with in clauses 2.1.1 and 4 of the Pricing Order – as set out in the regulatory model at Appendix B, and User Guide at Appendix C. In accordance with clause 2.2.1 of the Pricing Order, PoM confirms that it has used the same ABBM and parameters for both Dedicated and Shared Channels.

2020-21 TARIFF COMPLIANCE STATEMENT – GENERAL STATEMENT
35
Figure 6: ABBM approach
ABBM
Operating Expenditure
Allowance for ‘prudent and efficient’ forecast expenditure
Return of capital (Depreciation)
Straight-line depreciation based on the shorter of useful life or the lease term. Ability to defer unrecovered depreciation from the TAL period.
PoM will consult on options for recovering any deferred depreciation to minimise volatility in tariff levels through price smoothing.
Return on capital
Capital base x WACC (nominal, pre-tax)Capital base: roll forward calculated based on opening capital base plus efficient and
prudent capex plus CPI less depreciationInitial capital base in the Pricing Order: $4.1bn (at 1 July 2016)
WACC: based on one or a combination of well accepted approaches that distinguish the cost of equity and debt
CPI indexation
CPI is deducted to achieve a real return on CPI indexed capital base
ARR less legacy contract revenue Implied tariffs
+
+
=
-
2020-21 TARIFF COMPLIANCE STATEMENT – GENERAL STATEMENT
36
Table 10 sets out the 2020-21 ARR calculated using the ABBM. This ARR recovers the costs of legacy contracts for Prescribed Services that were in place at the time of PLT.
The return of capital is set to zero. PoM has adopted an alternative approach to straight-line depreciation on the basis that the return on capital derived using a straight-line depreciation methodology is not capable of being recovered in the applicable Financial Year (clause 4.4.2 of the Pricing Order). See section 9.2.4 for an overview of PoM’s alternative depreciation methodology. The ABBM inputs, and the calculation of each building block comprising the ABBM, are discussed in the following sections. Table 10: ARR, $ Million
2020-21 (F)
Return on capital 481.7
Return of capital 0.0
Operating expenses (Opex) 128.6
Indexation allowance (61.4)
ARR (see note 1) 548.9
Note 1 – The ARR is inclusive of revenue associated with legacy contracts.
9.2.1 Capital base
PoM has determined the forecast rolled forward values of its capital base, at 1 July 2020, to be $4,720.9 million and, at 1 July 2021, to be $4,906.1 million. PoM has calculated these values in accordance with clause 4.2.1 of the Pricing Order by:
adding indexation in accordance with clauses 4.2.1(b) and 4.6.1(a) of the Pricing Order. Clause 4.6.1(a) provides that the opening capital base must be indexed by the percentage change in CPI for the relevant financial year
adding prudent and efficient net Capex in accordance with clauses 4.2.1(c) and 4.6.1(b) of the Pricing Order. Clause 4.6.1(b) provides that Capex is indexed by half a year’s inflation (i.e. one half of the percentage change in CPI) for the relevant financial year. This assumes Capex is incurred halfway through a financial year, and is net of any capital contributions or proceeds from disposing assets, and
deducting depreciation (i.e. the return of capital allowance). However, because in 2017-18, 2018-19, 2019-20 and 2020-21 PoM’s Prescribed Services revenue (subject to the TAL) plus revenue from legacy contracts is below the ARR (as shown in Table 1 and Table 17), PoM has used an alternative depreciation methodology, which involves setting the return of capital to zero and deferring recovery of depreciation to future years.
The forecast closing 2019-20 capital base of $4,734.0 million submitted in PoM’s 2019-20 TCS has been adjusted for 2018-19 actual capex values, which were $10.4 million lower than forecast, and is therefore $4,720.9 million.25
Table 11 sets out PoM’s forecast closing capital base values as at 30 June 2020 and 30 June 2021. This capital base includes the costs of contracts for Prescribed Services that were in place at the time of PLT. It does not include the costs of any new contracts that were entered into after PLT.
25 In addition, we have made a minor adjustment to historical capex values for 2017-18, revising the amount downward by $2.3m to account for costs associated with contracts for prescribed services entered into since the PLT.

2020-21 TARIFF COMPLIANCE STATEMENT – GENERAL STATEMENT
37
Table 11: Capital Base, $ Million
2016-17 (A) 2017-18 (A) 2018-19 (A) 2019-20 (F) 2020-21 (F)
Opening Capital Base (1 July) 4,142.0 4,269.0 4,410.9 4,552.5 4,720.9
Plus Indexation Allowance 54.8 91.3 84.4 61.4 104.3
Plus Efficient Capex 72.2 50.6 57.3 107.0 80.9
Less Depreciation (see Note 1) 0.0 0.0 0.0 0.0 0.0
Closing Capital Base (30 June) 4,269.0 4,410.9 4,552.5 4,720.9 4,906.1
Note 1 – PoM’s Prescribed Services’ revenue (subject to the TAL) plus revenue from legacy contracts is below the ARR derived using straight line depreciation, therefore PoM has applied an alternative to straight-line depreciation by setting depreciation to zero (clause 4.4.2 of the Pricing Order).
PoM’s regulatory model at Appendix B provides further details on the capital base roll forward.
9.2.2 Capex
Table 12 sets out PoM’s 2020-21 forecast capex for Prescribed Services.
Forecast capex for 2020-21 is below the forecast for 2019-20, due mainly to reduced expenditure on wharves and channels. Further details of these changes are set out in Attachment 2, along with a description of the method used to prepare PoM’s 2020-21 capex forecast and why the forecast is prudent and efficient.
Major expenditure categories and items for 2020-21 include:
Rail – capex is mainly related to investments to deliver the PRTP, which amount to $125 million in total, spread over several years
Wharves – capex is substantially lower than in previous years. Major expenditure items include finalisation of Stage 2 of the remediation and rehabilitation project at Swanson Dock East, construction of a Southern Mooring Dolphin at Webb Dock East, and rehabilitation works at South Wharf, and
Roads – capex on roads relates mainly to Market Site and South Dynon Precinct. As set out in Our Plan for Rail, work will commence in 2020-21 to progress plans to integrate the former Melbourne Wholesale Market Site into the Port to provide additional capacity and better access to the port.26
Table 12: Forecast 2020-21 Capex, $ Million
Capex category 2020-21 (F)
PCP 0.0
Channel (see note 2) 2.4
Wharves 30.5
Road 8.1
Rail 30.2
Plant 3.3
Other 6.4
26 PoM, Our Plan for Rail, p.22 available at https://www.portofmelbourne.com/facilities-development/our-plan-for-rail/

2020-21 TARIFF COMPLIANCE STATEMENT – GENERAL STATEMENT
38
Capex category 2020-21 (F)
Total (see note 1) 80.9
Notes: 1. Capex is gross capex (i.e. before capital contributions and asset disposals are removed). 2. The 'Channel' asset class includes channel protection assets.
9.2.3 Rate of return on capital
The rate of return on capital (referred to as the WACC) aims to compensate PoM’s debt and equity holders for the opportunity cost of either lending or investing their funds in the Port.
9.2.3.1 Pricing Order requirements
In summary, the key Pricing Order requirements relating to the return on capital, required to calculate the ARR under the ABBM are that it must be:
commensurate with that required by a benchmark efficient entity (BEE) providing services with a similar degree of risk to PoM in providing the Prescribed Services (clause 4.1.1(a) of the Pricing Order)
estimated using one or a combination of well-accepted approaches that distinguish the cost of equity and debt (clause 4.3.1(a)), and
calculated on a pre-tax nominal basis (clause 4.3.1(b)).
These requirements must be interpreted in the context of the objectives of the regulatory regime discussed in section 3.1. Critical to promoting the regulatory objectives is:
the need for efficient investment in the long-term interests of users and Victorian consumers, and
providing a reasonable opportunity for PoM to recover its efficient costs of providing the Prescribed Services (i.e. the costs that would be incurred by an efficient business in a workably competitive market, providing services with a similar degree of risk as that which applies to PoM in the provision of the Prescribed Services).
The pre-tax nominal WACC formula is expressed in Figure 7:
Figure 7: pre-tax nominal formula
Where:
Re = post-tax return on equity Rd = pre-tax return on debt D = proportion of debt within the assumed capital structure E = proportion of equity within the assumed capital structure t = corporate tax rate = gamma (value of imputation credits)
There are important differences between the Pricing Order and deterministic regulatory regimes. In the context of the WACC:
clause 4.3.1 of the Pricing Order provides PoM with flexibility and discretion as to the one or more approaches it uses to calculate the rate of return, provided those approaches are well accepted, and
recognising the imprecision of the estimate of the required rate of return, there is no single correct approach or correct allowance that meets the requirements of clause 4.3.1 and 4.1.1(a). There could be a range of
DEDR
DEE
tR
dc
e
*
11

2020-21 TARIFF COMPLIANCE STATEMENT – GENERAL STATEMENT
39
outcomes that are compliant with those clauses. PoM must demonstrate how its approach complies with the Pricing Order. It is not for the ESC to make a determination about what it considers to be the preferred approach or preferred rate of return.
9.2.3.2 Interpretation of “well accepted approaches” and key clauses in the Pricing Order
In previous years, the ESC has expressed the view in its Interim Commentaries that some of the approaches used by PoM in calculating the WACC do not constitute “well accepted approaches” for the purposes of clause 4.3.1 of the Pricing Order.
Relevantly, clause 4.3.1 requires PoM, in “determining a rate of return on capital for the purposes of clause 4.1.1(a)”, to “use one or a combination of well accepted approaches that distinguish the cost of equity and debt, and so derive a weighted average cost of capital” (emphasis added).
In April 2020 (subsequent to the release of the 2019-20 Interim Commentary, released in December 2019), the ESC published version 2.0 of its Statement of Regulatory Approach (SoRA) which provides “guidance to the port on how it may demonstrate compliance with the pricing order, including through information provided in its tariff compliance statements”.
Previously, in version 1.0 of the SoRA, the ESC had expressed the view that, in order to satisfy clause 4.3.1, an approach must be “accepted by those entities that normally determine the inputs to an accrual building block methodology – that is, economic regulators” or “review bodies that have the task of overseeing the decisions of economic regulators”.27 In the ESC’s Feedback on consultation and other matters: Statement of Regulatory Approach version 1.0 consultation paper, it added that, in order to be “well accepted”, an approach must be currently used, or have recently been used, by at least one regulator.28
PoM has made submissions to the ESC on a number of occasions that its interpretation of clause 4.3.1 was too narrow. PoM has consistently submitted that the question of whether an approach is well accepted need not be answered merely by reference to whether a particular approach is accepted in decisions made by economic regulators.29
The ESC has now revised its interpretation of clause 4.3.1 in version 2.0 of the SoRA and its view of the requirement that PoM “must use one or a combination of well accepted approaches” in deriving the cost of capital. Version 2.0 of the SoRA expresses the ESC’s revised interpretation of clause 4.3.1 (emphases added):30
We consider that the requirement to use ‘one or a combination of well accepted approaches’ is likely to be satisfied where that approach is, or approaches are, broadly or generally recognised as being used, or appropriate for use, to estimate a return on capital in the context of an economic regulatory regime which has objects such as efficiency and principles such as that a regulated service provider should be provided with a return commensurate with a benchmark efficient entity providing services with a similar degree of risk.
In looking at whether an approach is generally recognised as being used, or appropriate for use, in the terms set out above, the views and practices of practitioners in the area of economic regulation may be informative. This would include the views of regulators and other professionals engaged in the practice of economic regulation in regimes similar to that applying to the port. These other professionals might include academics, economists and finance practitioners.
PoM considers that the view expressed by the ESC in version 2.0 of the SoRA is an improvement on the view expressed in version 1.0 of the SoRA. It appears to be a broader interpretation of clause 4.3.1 compared to the interpretation in
27 ESC, Statement of Regulatory Approach – version 1.0, December 2017, p.20.
28 ESC, Feedback on consultation and other matters: Statement of Regulatory Approach version 1.0, December 2017, p.41.
29 See PoM, Tariff Compliance Statement 2019-20, 31 May 2019, p.36; PoM, Tariff Compliance Statement 2018-19, 31 May 2018, p.20 and Appendix I, pp.5-6; PoM, Tariff Compliance Statement 2017-18, 31 May 2017, pp.26-28.
30 ESC, Statement of Regulatory Approach – version 2.0, April 2020, p.21.

2020-21 TARIFF COMPLIANCE STATEMENT – GENERAL STATEMENT
40
version 1.0. However, PoM considers that the statement in version 2.0 is ambiguous and appears still to restrict the interpretation of clause 4.3.1 of the Pricing Order in a way that is not permitted by the words of the clause.
The principal source of ambiguity and impermissible restriction arises from the words that appear in bold in the above extract from version 2.0 of the SoRA. These words suggest (or, ambiguously, might suggest) that the views and practices of practitioners in financial markets are not to be taken into account, unless they are views and practices of such practitioners “in the context” or “in the area” of economic regulation.
PoM does not accept that any such restriction applies. PoM considers that the Pricing Order as a whole provides for a regulatory regime of a kind which is “a surrogate for the rewards and disciplines normally provided by a competitive market”.31 Further, the immediate purpose of an allowance for the return referred to in clause 4.1.1(a) is to reflect the return which would be required by the benchmark efficient entity to attract and retain capital investment from the financial markets. The views and practices of financial market practitioners are relevant given those purposes, whether or not they arise in the context of economic regulation. We note in fact that many regulators obtain or inform their selection of parameters when estimating WACCs by market-based observations, using market data of non-regulated entities and surveys of finance practitioners engaged in work more broadly than the context of economic regulation.
In addition, aside from version 2.0 of the SoRA, the ESC has expressed its approach in ways with which PoM disagrees, as follows:
the ESC has suggested that a single “well accepted” approach must be identified,32 rather than allowing for the possibility that there may be multiple “well accepted approaches”, and
the ESC has suggested that it is not only each approach used that must be “well accepted”, but also that any “combination” of those approaches must also be “well accepted”.33
The phrase “well accepted approaches” is not defined in the Pricing Order or in the PMA. Nor do the words of clause 4.3.1 specify by whom a relevant approach must be “well accepted”. In PoM’s view, and consistent with general principles of statutory interpretation:
The term “well accepted approaches” requires quite broad or widespread use or recognition of an approach (or approaches, as the case may be), but it (or they) need not be universally or ubiquitously used in order to be “well accepted”
The requisite use or recognition may exist amongst:
o economic regulators (in Australia or overseas) whose use or recognition is in the context of an analogous economic regulatory regime, or
o others engaged in determining rates of returns on capital for Australian entities, and in particular practitioners working in the capital markets open to Australian entities or in analogous economic regulatory regimes.
Clause 4.3.1 allows for the existence and use of more than one “well accepted approach” to the determination of rates of return on capital as this is expressly contemplated by the words “a combination of well accepted approaches”.
There may be more than one “well accepted approach” to determining particular inputs or parameter values (such as the market risk premium (MRP)) which are in turn used to determine the rate of return on capital, and PoM may choose from such approaches and may use them in combination, including by a process of weighting, when determining the rate of return on capital for the purposes of clause 4.3.1. (Such a combination does not, itself, also need to be “well accepted”.)
31 See East Australian Pipeline Pty Limited v Australian Competition and Consumer Commission (2007) 233 CLR 229 at [18].
32 As implied on p.23 of the ESC’s Interim commentary on PoM’s 2019-20 TCS which refers to “the well-accepted approach when setting gamma within the context of an economic regulatory regime” (emphasis added).
33 While not expressly stated in version 2.0 of the SoRA, this was expressly stated at p.40 of the ESC’s Feedback on consultation and other matters: Statement of Regulatory Approach version 1.0 consultation paper, and implied in version 1.0 of the SoRA.

2020-21 TARIFF COMPLIANCE STATEMENT – GENERAL STATEMENT
41
PoM’s interpretation is consistent with, and supported by, the following:
The language and purposes of the pricing regime set out in the Pricing Order and PMA, the objectives of which include:34
o promoting efficient use of prescribed services and investment for the long-term interests of users and Victorian consumers
o ensuring prescribed prices are fair and reasonable whilst having regard to the level of competition in, and efficiency of, the regulated industry
o allowing PoM a reasonable opportunity to recover the efficient costs of providing prescribed services, including a return commensurate with the risks involved
o facilitating and promoting competition, and
o eliminating resource allocation distortions by prohibiting a State sponsored port operator from providing a relevant service at a price lower than the competitively neutral price for that service.
The requirement in clause 4.1.1(a) that the allowance in PoM’s accrual building block methodology to recover a return on its capital base be “commensurate with that which would be required by a benchmark efficient entity providing services with a similar degree of risk as that which applies to the Port Licence Holder in respect of the provision of the Prescribed Services”; noting that a benchmark efficient entity is not necessarily a regulated (or unregulated) entity.
The requirement in clause 2.1.1(a) that Prescribed Service Tariffs must be set to allow PoM a reasonable opportunity to recover the efficient cost of providing all Prescribed Services determined by application of an accrual building block methodology.
Finally, PoM notes that it agrees with the ESC’s statement in version 2.0 of the SoRA that the views and practices of other professionals, such as academics, may also be informative in considering whether an approach is generally recognised as being used or appropriate for use in the estimation of rates of return on capital.
9.2.3.3 ESC commentary on the 2019-20 rate of return
PoM, advised by Synergies Economic Consulting (Synergies), adopted a pre-tax nominal WACC of 10.46 per cent for the 2019-20 TCS, taken from a range of 10.07 per cent to 10.92 per cent, which was lower than its adopted pre-tax nominal WACC of 11.52 per cent in the 2018-19 TCS. The key elements of Synergies’ approach to estimating the rate of return for the 2019-20 TCS were:
a cost of equity estimate based on a combination of three models, the Sharpe Lintner Capital Asset Pricing Model (SL CAPM), Black CAPM and Fama-French Model (FFM) weighted at 90 per cent / 5 per cent / 5 per cent, respectively – where previously they were equally weighted (one third weighting to each model)
a market risk premium (MRP) estimate of 7.77 per cent based on 50 per cent weighting to the Ibbotson approach, and 25 per cent weighting each to the Wright and dividend discount model (DDM) approaches – where previously equal weights were applied to the Ibbotson and Wright approaches (50 per cent weighting to each model)
a gamma estimate of 0.25 based on equal weighting to the market approach, utilisation approach and approach applied by finance practitioners (one third weighting to each approach), and
an equity beta of 1, based on an asset beta of 0.7 and gearing of 30 per cent. The asset beta was derived from a comparator set drawn from ports and railroad businesses, with various filtering methodologies applied to ensure comparability of the sample and data integrity.
In its 2019-20 Interim Commentary, the ESC noted the reduction in PoM’s WACC estimate, but also stated that the rate of return continues to appear high and, in the ESC’s interim view, would require further substantial justification to
34 PMA, section 48.

2020-21 TARIFF COMPLIANCE STATEMENT – GENERAL STATEMENT
42
demonstrate compliance with the Pricing Order. The ESC noted that the input parameters in PoM’s WACC estimation – market risk premium, asset beta and gamma, contribute to PoM’s relatively high (in the ESC’s view) WACC estimate.35
In summary, the ESC’s key comments and concerns on the approaches and input parameters used by PoM to estimate the WACC were as follows:
the ESC maintained its preliminary view that “…neither [the Black CAPM nor FFM] is well accepted by Australian regulators for various reasons, which indicates that the approaches are unlikely to be considered well accepted”.36 However, the ESC also recognised the significantly lower weightings given by PoM to the Black CAPM and FFM in estimating the cost of equity, and that relative to an approach of using the SL CAPM alone, the inclusion of the Black CAPM and FFM increased the WACC by 10 basis points and ARR by $4.6m.37
In relation to the MRP, the ESC raised concerns about the use of the Wright and DDM approaches:
o Regarding Wright, the ESC stated “our preliminary position is that we maintain our view that given the ERA’s withdrawal of support of the Wright approach and the recent AER’s WACC guidance final decision, the Wright approach may no longer be considered (to the extent it was ever considered to be) well-accepted by Australian regulators”38 and on this basis, the ESC’s preliminary view was that “the port’s weighting on the Wright approach may not be well supported”39
o Regarding PoM’s use of DDMs, the ESC’s preliminary view was that the DDM is not a well-accepted approach and PoM had not provided sufficient explanation as to why it adopted it.40 The ESC identified reservations about DDMs raised by the AER, and stated that “the port should reassess its use of the dividend discount model to estimate the market risk premium and if it remains of the view that the dividend discount model is appropriate to use, provide detailed information on how it has implemented the model or models used in that estimate.” 41
In relation to gamma, the ESC noted that only IPART currently applies a market value approach to estimating gamma, and found that “the high weighting on the market-approach relative to non-market approach does not align with recent regulatory decisions and sentiment”. 42 As such, the ESC maintained its preliminary view that “the utilisation approach, and not the market value approach to estimating gamma, is the well-accepted approach when setting gamma within the context of an economic regulatory regime”.43 The ESC also provided its preliminary view that PoM should revisit the appropriateness of the distribution rate used in its estimate of gamma in light of recent regulatory decisions.44 The ESC did not comment on PoM’s reliance on surveys of finance academic literature and valuation experts (i.e. one-third weighting zero gamma) other than to note that it had previously attributed PoM’s ‘low gamma’ to the material weighting on this approach.45
In relation to beta, the ESC, while noting that it considered that PoM’s approach to estimating beta “leans away from compliance”, recognised that PoM had addressed some of the issues raised in previous commentaries (by excluding airports, and including only developed economies in the comparator set).46 The ESC engaged Frontier Economics (Frontier) to provide independent advice on specific issues related to PoM’s beta estimate. Based on the advice provided by Frontier, the ESC formed initial views on the following matters:
o the choice of comparators – the ESC’s initial view was that railroad comparators do not appear to have similar systematic risk profiles as a port, and suggested PoM investigate further whether the characteristics of railroad firms warrant their inclusion in the overall comparator sample or
35 ESC, Interim commentary – Port of Melbourne tariff compliance statement 2019-20, December 2019, p.1 36 Ibid., p.10 37 Ibid., pp.9-10 38 Ibid., p.17 39 Ibid., p.17 40 Ibid., p.15 41 Ibid., p.20 42 Ibid., p.22 43 Ibid., p.23 44 Ibid., p.23 45 Ibid., p.20 46 Ibid., p.24

2020-21 TARIFF COMPLIANCE STATEMENT – GENERAL STATEMENT
43
alternatively the port may want to review the weightings of the betas in the North American railroads, or consider the betas as upper bound values only47
o the choice of industry classification system – the ESC’s preliminary view was that PoM should review classification systems in addition to the Global Industry Classification Standard (GICS) to see if the sample of port comparators can be expanded to reduce the reliance on railroads48, and
o the exclusion of low significance comparators – the ESC’s concern was that the statistical test tends to bias the overall beta estimate up, by excluding low betas and retaining high-beta stocks.49
The ESC stated that if the port were to address the concerns identified in its 2019-20 Interim Commentary and adopt the ESC’s findings, the WACC estimate would be within the range of about 7.5 per cent to 8 per cent (pre-tax nominal), at gamma of 0.4 and 0.25, respectively.50
9.2.3.4 PoM’s rate of return estimate for 2020-21
PoM and its advisors have undertaken extensive additional research and analysis in estimating the required rate of return for the 2020-21 TCS. An expert report from Synergies, Determining a WACC estimate for Port of Melbourne, is provided at Appendix N that provides the detailed reasoning for the WACC estimate, which PoM has adopted for the 2020-21 TCS. In arriving at our WACC estimate, we have:
considered the ESC’s revised interpretation of the Pricing Order, as set out in version 2.0 of the SoRA of April 2020. PoM provided a submission to the ESC on its proposed amendments to the SoRA51, and have given careful consideration to the proper interpretation and application of the Pricing Order. PoM’s considerations and positions on the interpretation of the Pricing Order are set out in section 9.2.3.2, above
considered the ESC’s preliminary views on the rate of return, as provided in its Interim Commentary of December 2019 (and earlier Interim Commentaries), and the work undertaken by Frontier on behalf of the ESC. Detailed responses to the ESC’s preliminary views and findings, and the work by Frontier, are set out in Appendix N
obtained independent expert advice from Incenta Economic Consulting (Incenta) on estimating PoM’s equity beta (provided at Appendix Q). Incenta’s independent analysis considers the earlier work done by Synergies to support the 2019-20 TCS, the ESC’s preliminary views, and the analysis undertaken by Frontier. Notably, Incenta’s independent view is that the equity beta for PoM would be likely to be 1.0, from within a range of 0.93 to 1.07. PoM notes that Synergies has undertaken further detailed analysis of the comparator set and made amendments to the approach (such as removing the statistical filtering approach that Frontier and the ESC raised concerns about) to support its equity beta estimate of 1.0 for the 2020-21 TCS. PoM considers that the approaches taken by Synergies and the independent analysis by Incenta are well accepted approaches, and also notes that the equity beta estimates are the same notwithstanding the small differences in approach
reduced the market risk premium estimate from 7.77 per cent to 7.57 per cent, with various amendments including reducing the weights to each of the Wright and dividend discount model (DDM) approaches to estimating the MRP from 25 per cent to 15 per cent. PoM obtained an independent review by NERA Economic Consulting (NERA) on regulators’ approaches to determination of the MRP in regimes that are contextually similar or analogous to that applying to PoM (provided at Appendix R). NERA’s independent analysis provides an extensive review of approaches taken by regulators in Australia, New Zealand, Europe and North America to the MRP (including consideration of the comparability of the regulatory regimes), and demonstrates that both the Wright and the dividend discount model (DDM) approaches are well accepted by regulators to estimate the MRP. PoM notes that Synergies has considered the independent findings of NERA in determining an estimate of the MRP to support PoM’s 2020-21 TCS, and has also undertaken extensive additional analysis
47 Ibid., pp.25-26 48 Ibid., pp.26-27 49 Ibid., pp.27-29 50 Ibid., pp.1-2 51 Our submission to the ESC’s redraft of the SoRA is available on the ESC website, here: https://www.esc.vic.gov.au/sites/default/files/documents/PoM%20response%20to%20Draft%20SRA%20-%2028%20Feb%202020.pdf

2020-21 TARIFF COMPLIANCE STATEMENT – GENERAL STATEMENT
44
on the components of the MRP, including addressing concerns raised by the ESC in its Interim Commentaries about the implementation of the approaches (Ibbotson, Wright and DDM). PoM considers that the work undertaken by Synergies, and the evidence gathered by NERA, demonstrates that the approaches adopted are well accepted approaches and are implemented appropriately.
Based on the above, PoM has estimated a pre-tax nominal WACC of 8.93 per cent. This estimate is a significant reduction compared to PoM’s 2019-20 TCS pre-tax nominal WACC estimate of 10.46 per cent (which itself was a reduction from the previously estimated pre-tax nominal WACC of 11.52 per cent). Based on Appendix N, PoM considers that the approach to determining the rate of return complies with the requirements of the Pricing Order.
Table 13 provides an overview of the key parameters in the WACC formula, Synergies’ approach to estimating each parameter for the purposes of assisting PoM with its 2020-21 TCS pre-tax nominal WACC estimate, together with key findings from the independent expert reports, and additional considerations from PoM.
Table 13: Pre-tax nominal rate of return
Parameter Summary of approach
Return on equity (pre-tax)
In determining the WACC for PoM’s previous TCS submissions, Synergies has utilised the SL CAPM, Black CAPM, and Fama French Model (FFM) in deriving its estimate of the cost of equity for PoM. Synergies has continued to utilise all three approaches in its analysis to support the 2020-21 TCS. However, noting the concerns raised by the ESC in its Interim Commentaries regarding data availability, Synergies has adjusted the weights applied to the approaches. The estimated pre-tax nominal WACC of 8.93 per cent determined by Synergies applies a zero weight to the Black CAPM and FFM approaches and 100 per cent weight to the SL CAPM. For the purpose of cross-checks, Synergies also considers the previous weightings of 90 per cent / 5 per cent / 5 per cent to the SL CAPM, Black CAPM and FFM approaches, respectively.
MRP
Synergies has undertaken extensive analysis to support the approach to estimating the MRP for the 2020-21 TCS. In addition, PoM has obtained an independent review by NERA on regulators’ approaches to determination of the MRP in analogous regulatory regimes. NERA was asked to provide an independent expert report which identified similar regulatory regimes to that applying to PoM, and to review and summarise the approaches used by regulators to estimate the MRP and risk free rate and/or total market return (TMR). On the basis of Synergies’ analysis, and the independent advice provided by NERA: - Synergies has retained the Wright approach as a component of the MRP estimate. NERA’s
independent report identifies that in addition to the Queensland Competition Authority (QCA) in Australia, many overseas regulators use the Wright approach, including the New Zealand Commerce Commission (NZCC), the Italian energy regulator (ARERA) and all UK regulators.52 We consider that the analysis undertaken by Synergies, and the independent expert advice from NERA, demonstrates that the Wright approach is a well-accepted approach to estimating the MRP
- Synergies has retained DDMs as a component of the MRP estimate. Synergies’ report addresses the ESC’s interim commentary by providing extensive further justification for the inclusion of DDMs. NERA’s report identifies that DDMs are widely applied by regulators, including IPART, the QCA, ERA, NZCC and a number of overseas regulators. We consider that Synergies’ analysis, and the independent expert advice from NERA, demonstrates that DDMs are a well-accepted approach to estimating the MRP. Synergies has also revised the implementation of DDMs, by only adopting approaches that have been used in Australian regulatory precedent and ensuring that the implementation of these approaches mirrors the approach taken by the relevant regulators, and
- Synergies has revised the weights applied to the Wright and DDM approaches downwards, to 15 per cent each, and apply a 70 per cent weight to the Ibbotson approach. The chosen weights are informed and supported by the cross-checks applied by Synergies.
PoM has adopted Synergies’ resulting MRP estimate for the 2020-21 TCS of 7.57 per cent, which is lower than the 2019-20 TCS estimate of 7.77 per cent. This MRP estimate produces a TMR of 8.47 per cent when
52 NERA’s work also identifies that few regulators outside of Australia apply the Ibbotson approach combined with a current estimate of the risk free rate to estimate the MRP.
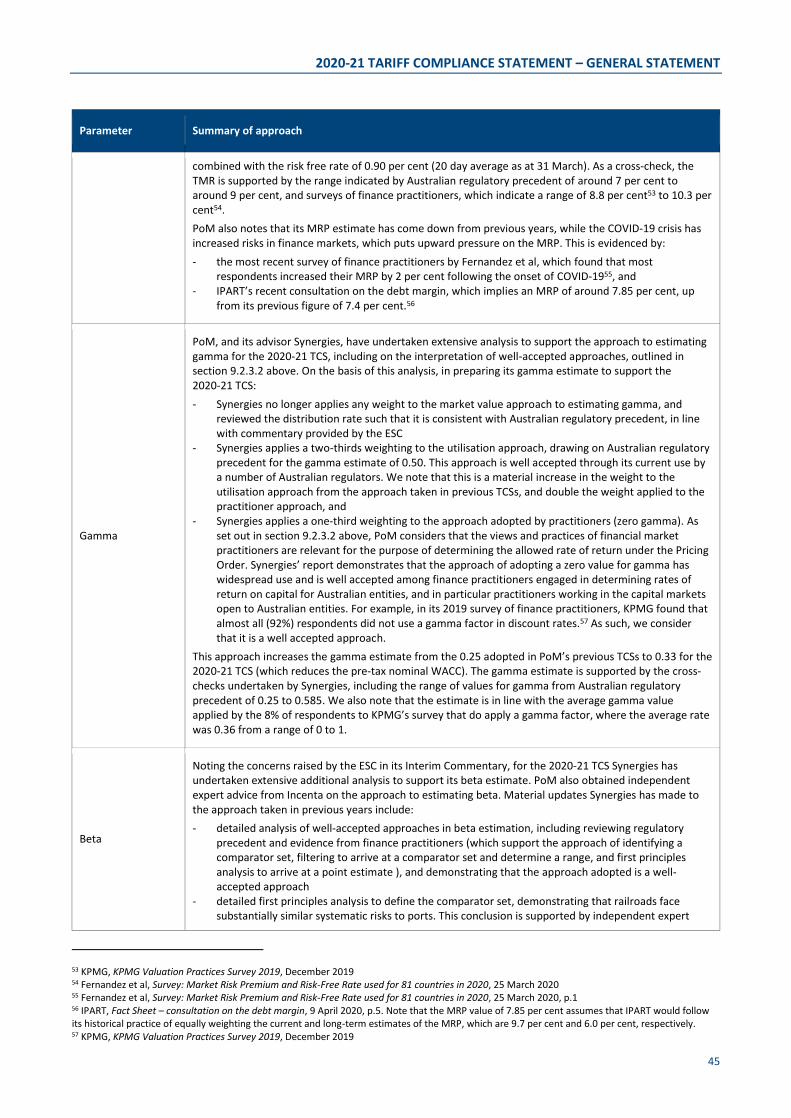
2020-21 TARIFF COMPLIANCE STATEMENT – GENERAL STATEMENT
45
Parameter Summary of approach
combined with the risk free rate of 0.90 per cent (20 day average as at 31 March). As a cross-check, the TMR is supported by the range indicated by Australian regulatory precedent of around 7 per cent to around 9 per cent, and surveys of finance practitioners, which indicate a range of 8.8 per cent53 to 10.3 per cent54. PoM also notes that its MRP estimate has come down from previous years, while the COVID-19 crisis has increased risks in finance markets, which puts upward pressure on the MRP. This is evidenced by: - the most recent survey of finance practitioners by Fernandez et al, which found that most
respondents increased their MRP by 2 per cent following the onset of COVID-1955, and - IPART’s recent consultation on the debt margin, which implies an MRP of around 7.85 per cent, up
from its previous figure of 7.4 per cent.56
Gamma
PoM, and its advisor Synergies, have undertaken extensive analysis to support the approach to estimating gamma for the 2020-21 TCS, including on the interpretation of well-accepted approaches, outlined in section 9.2.3.2 above. On the basis of this analysis, in preparing its gamma estimate to support the 2020-21 TCS: - Synergies no longer applies any weight to the market value approach to estimating gamma, and
reviewed the distribution rate such that it is consistent with Australian regulatory precedent, in line with commentary provided by the ESC
- Synergies applies a two-thirds weighting to the utilisation approach, drawing on Australian regulatory precedent for the gamma estimate of 0.50. This approach is well accepted through its current use by a number of Australian regulators. We note that this is a material increase in the weight to the utilisation approach from the approach taken in previous TCSs, and double the weight applied to the practitioner approach, and
- Synergies applies a one-third weighting to the approach adopted by practitioners (zero gamma). As set out in section 9.2.3.2 above, PoM considers that the views and practices of financial market practitioners are relevant for the purpose of determining the allowed rate of return under the Pricing Order. Synergies’ report demonstrates that the approach of adopting a zero value for gamma has widespread use and is well accepted among finance practitioners engaged in determining rates of return on capital for Australian entities, and in particular practitioners working in the capital markets open to Australian entities. For example, in its 2019 survey of finance practitioners, KPMG found that almost all (92%) respondents did not use a gamma factor in discount rates.57 As such, we consider that it is a well accepted approach.
This approach increases the gamma estimate from the 0.25 adopted in PoM’s previous TCSs to 0.33 for the 2020-21 TCS (which reduces the pre-tax nominal WACC). The gamma estimate is supported by the cross-checks undertaken by Synergies, including the range of values for gamma from Australian regulatory precedent of 0.25 to 0.585. We also note that the estimate is in line with the average gamma value applied by the 8% of respondents to KPMG’s survey that do apply a gamma factor, where the average rate was 0.36 from a range of 0 to 1.
Beta
Noting the concerns raised by the ESC in its Interim Commentary, for the 2020-21 TCS Synergies has undertaken extensive additional analysis to support its beta estimate. PoM also obtained independent expert advice from Incenta on the approach to estimating beta. Material updates Synergies has made to the approach taken in previous years include: - detailed analysis of well-accepted approaches in beta estimation, including reviewing regulatory
precedent and evidence from finance practitioners (which support the approach of identifying a comparator set, filtering to arrive at a comparator set and determine a range, and first principles analysis to arrive at a point estimate ), and demonstrating that the approach adopted is a well-accepted approach
- detailed first principles analysis to define the comparator set, demonstrating that railroads face substantially similar systematic risks to ports. This conclusion is supported by independent expert
53 KPMG, KPMG Valuation Practices Survey 2019, December 2019 54 Fernandez et al, Survey: Market Risk Premium and Risk-Free Rate used for 81 countries in 2020, 25 March 2020 55 Fernandez et al, Survey: Market Risk Premium and Risk-Free Rate used for 81 countries in 2020, 25 March 2020, p.1 56 IPART, Fact Sheet – consultation on the debt margin, 9 April 2020, p.5. Note that the MRP value of 7.85 per cent assumes that IPART would follow its historical practice of equally weighting the current and long-term estimates of the MRP, which are 9.7 per cent and 6.0 per cent, respectively. 57 KPMG, KPMG Valuation Practices Survey 2019, December 2019

2020-21 TARIFF COMPLIANCE STATEMENT – GENERAL STATEMENT
46
Parameter Summary of approach
advice from Incenta, who estimated beta after constructing their own comparator set based on an extensive first principles analysis of relevant sectors and potential comparators. We note that Incenta did not agree with any of Frontier’s suggested additions to the port comparator set, and provided substantial evidence and analysis on the comparability of the systematic risks between ports and railroads (Incenta’s estimated average 10 year asset beta for railroads is 0.86, while for ports it is 0.85), and
- replacing the previously applied statistical significance filter with a market capitalisation threshold. The adoption of a size threshold is supported by independent expert advice from Incenta, who found that the application of a minimum size threshold has substantial precedent amongst regulators and their advisers.
On the basis of the analysis undertaken by Synergies, PoM has adopted an asset beta of 0.70 for the 2020-21 TCS, from a range of 0.70 to 0.75. Combined with the adopted gearing of 30 per cent, this results in an equity beta of 1.0 for the 2020-21 TCS. PoM notes that its adopted value for beta is supported by the independent analysis undertaken by Incenta, who (based on a different comparator set) estimated an equity beta of 1.0 (point estimate), based on an asset beta of 0.75 and a benchmark gearing level of 25 per cent.
Capital structure (gearing)
PoM has adopted a benchmark gearing ratio of 30 per cent based on the gearing levels of the entities in the Synergies comparator sample (which includes firms used by Synergies to estimate the asset beta). This is the same approach as has been applied in previous years. We note that Incenta applies a comparable approach in its independent report, using the average gearing level of its comparable entities over the period for which betas are estimated, to arrive at a benchmark gearing level of 25 per cent.
Return on debt (pre-tax)
The return on debt is the required yield (or interest) on issued debt. The cost of debt is the sum of the risk-free rate (Rf) and an estimate of the debt risk premium (DRP) consistent with the risk profile of the BEE. In the 2020-21 TCS, PoM has continued with the trailing average approach to estimating the cost of debt commenced in 2018-19. This method will result in less volatility over time and is more consistent with the debt management practices of a BEE.
PoM considers that its estimated WACC complies with the Pricing Order requirements. In particular, we note that to determine an estimate of the return on capital that is consistent with the Pricing Order, one key requirement is that PoM must use one or a combination of well accepted approaches that distinguish the cost of equity and debt and so derive a WACC (clause 4.3.1(a)). As set out above, and in Appendix N, both PoM’s WACC estimate and the individual WACC parameters are determined using a combination of well accepted approaches.
Furthermore, PoM’s estimated rate of return (and hence return on its capital base) is commensurate with that which would be required by a benchmark efficient entity (BEE) providing services with a similar degree of risk to PoM in providing the Prescribed Services (clause 4.1.1(a) of the Pricing Order). This is demonstrated by our beta estimate (which is supported by independent analysis undertaken by Incenta), and the various cross checks applied to the individual WACC parameters and overall outcome, as set out above and in Appendix N.
Table 14 sets out the parameter estimates calculated for each element of its 2020-21 WACC.
A more detailed discussion of the parameters relevant to the WACC estimate is at Appendix N. Table 14: Cost of capital parameters values underpinning PoM’s 2020-21 WACC estimate
Parameter 2020-21
Return on equity (pre-tax) (Re) 10.60%
Market risk premium 7.57%
Equity beta 1

2020-21 TARIFF COMPLIANCE STATEMENT – GENERAL STATEMENT
47
Parameter 2020-21
Risk free rate 0.90%
Corporate tax (tc) 30%
Gamma () 0.33
Return on debt (pre-tax) (Rd) (see note 1) 5.04%
Risk free rate 0.90%
Debt risk premium (‘on the day’) 2.42%
Debt raising costs 0.10%
Capital structure (gearing)
Share of debt (D/(E+D)) 30%
Share of equity (E/(E+D)) 70%
Pre-Tax Nominal WACC 8.93%
Note 1 – The return on debt is transitioning to a 10-year trailing average, commencing 2017-18. As such, the 2020-21 return on debt is calculated as a weighted average of the ‘on the day’ return on debt from 2017-18 (5.45%, with 70% weighting), 2018-19 (4.58%, with 10% weighting), 2019-20 (4.21%, with 10% weighting) and 2020-21 (3.42%, with 10% weighting).
9.2.4 Depreciation and economic asset lives
9.2.4.1 Economic asset lives
Clauses 4.4.1(a) and 4.4.1(b) of the Pricing Order provide that PoM must depreciate its assets over a period no shorter than the economic life of the relevant asset or the remaining term of the lease, whichever is shorter, and no longer than the remaining term of the lease.
Table 15 shows the economic lives for PoM’s new Capex and the remaining lives of existing assets. Table 15: Economic lives for new Capex and remaining asset lives
Asset category Economic lives for new Capex
Remaining lives for the initial capital base
as at 1 July 2016
Melbourne Channel 50 50
Melbourne Channel Over Dredge 3 1.5
Shared Channels 50 50
Shared Channel Over Dredge 3 1.5
Channel Protection Assets 50 23
Channel Service Protection 40 14
Roads 20 8
Rail 30 18

2020-21 TARIFF COMPLIANCE STATEMENT – GENERAL STATEMENT
48
Asset category Economic lives for new Capex
Remaining lives for the initial capital base
as at 1 July 2016
Buildings 25 26
Wharves 25 23
Plant 10 18
Land 50 50
PCP - Wharves 50 n.a.
PCP - Civil 50 n.a.
Navigational Aids 30 n.a.
Utilities 25 n.a.
Civil 30 n.a.
Minor capital works 40 n.a.
Note: remaining life of ‘n.a.’ is assigned to asset classes that had zero value as at 1 July 2016.
9.2.4.2 Use of the alternative depreciation method
Under clause 4.4.2(a) of the Pricing Order, PoM may use an alternative depreciation methodology to the straight-line depreciation methodology to be applied under clause 4.4.1 if:
(a) the application of clause 3.1.1 [the Tariffs Adjustment Limit] means that the return of capital derived using a straight-line depreciation methodology is not capable of being recovered in the applicable Financial Year; or
(b) the alternative depreciation methodology is reasonably likely to reduce the variance in the expected annual percentage changes in the level of Prescribed Services Tariffs through to the end of the Port Lease.
As set out in Table 2 and Table 18 the return of capital is not capable of being recovered in 2020-21 (nor was it in any prior year to-date) due to the application of the TAL. Therefore, PoM has set the 2020-21 return of capital to zero and deferred recovery of straight-line depreciation to future years. This method complies with the Pricing Order provisions relating to depreciation, including clause 4.4.3, which requires that the return of capital allowance is not below zero.
In its 2019-20 Interim Commentary, the ESC noted that PoM had demonstrated that its methods for calculating deferred and straight-line depreciation only recover depreciation once over their economic lives. However, the ESC also noted that PoM did not clearly indicate in its model or tariff compliance statement 2019-20 how it is going to recover the deferred depreciation in the future years.58
Importantly, the unrecovered depreciation balance sits within the capital base. That is, the capital base for a given year includes any unrecovered straight-line depreciation from prior years. ‘Unrecovered depreciation’ is simply another way of presenting a portion of the remaining value of the asset base, which remains within the capital base until it is recovered through the return of capital component of the ARR. This is illustrated in Figure 8, below.
58 ESC, Interim commentary – Port of Melbourne tariff compliance statement 2019-20, December 2019, pp.34-35

2020-21 TARIFF COMPLIANCE STATEMENT – GENERAL STATEMENT
49
Figure 8: Unrecovered depreciation within the capital base
This approach ensures that the initial capital base and any new net capex is not recovered more than once.
Within the regulatory model, any straight-line depreciation that cannot be recovered – and, therefore, is added to the ‘deferred depreciation’ balance – is recovered when forecast revenues are high enough within the TAL or the TAL no longer applies.
Post the TAL period, the regulatory model allows the PoM to nominate whether any portion of the balance is further deferred into future years to avoid tariff shocks to Port Users, consistent with clause 4.4.2(b). This mechanism ensures that there is sufficient flexibility to smooth out the potential impact of removing the TAL. PoM intends to make such a nomination in a future TCS closer to the relevant regulatory period and following consultation with Port Users.
The intent of this approach is to promote the PMA objectives by ensuring that the PoM has an opportunity to recover its efficient capital costs while managing Port User impacts.
PoM’s key principles for recovering depreciation of the capital base are guided by the Pricing Order, as follows:
the capital base will be recovered on a straight-line basis, over a period which is no shorter than the remaining economic life of the asset, and no longer than the remaining term of the Port Lease
where any amount of depreciation calculated on a straight-line basis is unable to be recovered in a given financial year, that amount of depreciation will excluded from the ARR (by setting that component of depreciation to zero) and deferred for recovery in future periods
deferred depreciation will only be recovered where forecast revenues are high enough within the TAL or the TAL no longer applies, and
where the TAL no longer applies, the deferred depreciation will be recovered in a manner that is consistent with clause 4.4.2(b). That is, where the depreciation method would be reasonably likely to reduce the variance in the expected annual percentage changes in the tariffs through to the end of the Port Lease.
PoM will continue to engage with Port Users and other stakeholders and the ESC on the key principles underpinning its approach to depreciation of the asset base in the future, including its commitment to smooth prices.
9.2.5 Opex
Table 16 sets out PoM’s 2020-21 forecast opex for Prescribed Services. Around 80 per cent of PoM’s 2020-21 forecast opex is non-controllable and relates to two items, being the PLF and the CCA. These items are required by, and are

2020-21 TARIFF COMPLIANCE STATEMENT – GENERAL STATEMENT
50
calculated in accordance with, the relevant components of the PMA59 and the Port Concession Deed (PCD),60 respectively, and are deemed to be prudent and efficient under clause 4.5 of the Pricing Order. As a result, only around 20 per cent, or $30 million, of opex is controllable by PoM.
Attachment 1 explains the method that has been used to prepare PoM’s 2020-21 opex forecast and why the forecast is prudent and efficient. It also explains the basis on which opex has been allocated between Prescribed Services, non-Prescribed Services and shared services. Table 16: Forecast 2020-21 Opex, $ Million
Opex categories 2020-21 (F)
Port Licence Fee 87.6
Cost Contribution Amount 16.2
Labour 11.3
Repairs and Maintenance 3.4
Other 15.4
Total 133.9
9.2.6 Indexation allowance
The indexation building block, as required under clause 4.1.1(d) of the Pricing Order, impacts the overall ABBM by its inclusion as a negative amount. This deduction from the ABBM is made to maintain a real rate of return given that a nominal rate of return, discussed in section 9.2.3, is applied to an inflation-adjusted capital base61, discussed in section 9.2.1. The indexation building block is the sum of the following, as discussed in section 9.2.1 above:
the indexation of the opening capital base (clause 4.6.1(a) of the Pricing Order), and
half a year’s inflation on Capex (clause 4.6.1(b) of the Pricing Order).
PoM has used the annual March all capital cities CPI (with a one year lag) in accordance with clause 4.6 of the Pricing Order to calculate the indexation allowance. The detailed calculations are contained in PoM’s regulatory model provided at Appendix B. Table 17: Indexation allowance, $ Million
2020-21 (F)
Indexation Allowance -104.3
9.3 Prescribed Services revenue (subject to the TAL)
The TAL is defined by the Pricing Order as “…the percentage change in CPI between the March quarter immediately preceding the relevant Financial Year and the March quarter in the Financial Year two years preceding the relevant Financial Year”.
The 2020-21 TAL is based on the percentage change between the 2019 March quarter and 2020 March quarter CPI (All Groups Index Number, weighted average of eight capital cities published by the Australian Bureau of Statistics) and is 2.2 per cent.
59 The Port Licence Fee has been calculated in accordance with sections 44K and 44J of the PMA 60 The Cost Contribution Amount has been calculated in accordance with clause 27.1 of the PCD 61 The capital base includes an allowance for indexation
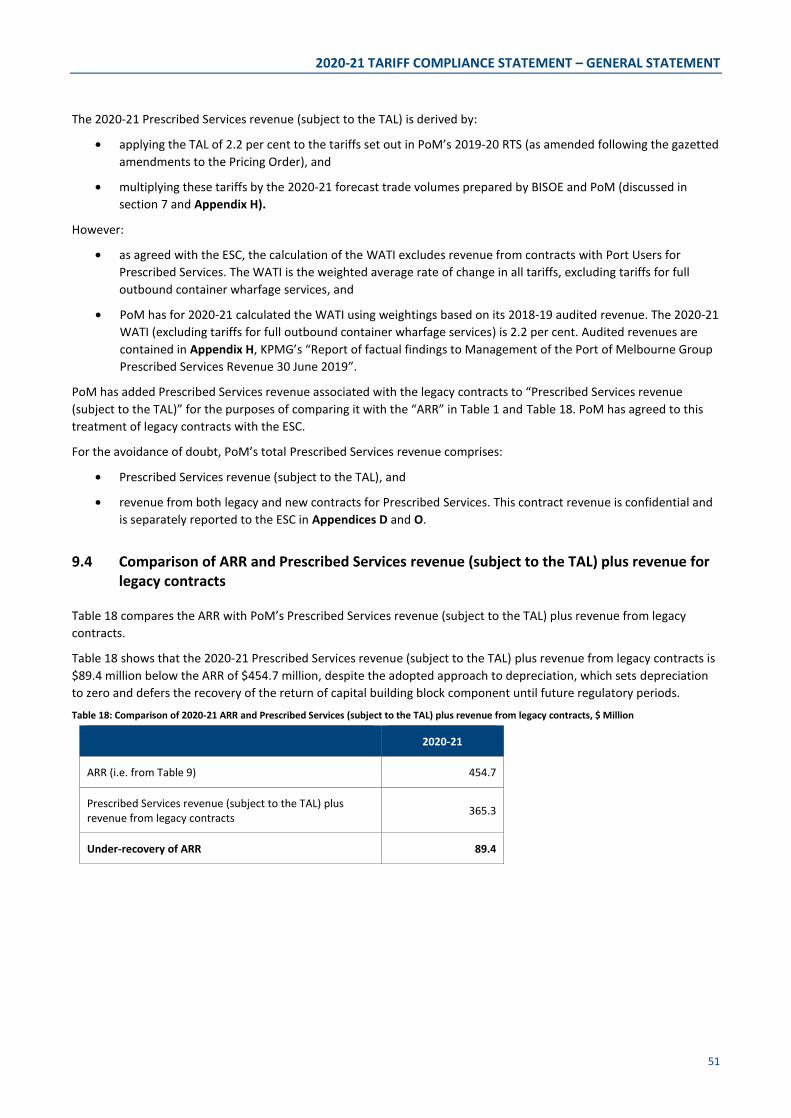
2020-21 TARIFF COMPLIANCE STATEMENT – GENERAL STATEMENT
51
The 2020-21 Prescribed Services revenue (subject to the TAL) is derived by:
applying the TAL of 2.2 per cent to the tariffs set out in PoM’s 2019-20 RTS (as amended following the gazetted amendments to the Pricing Order), and
multiplying these tariffs by the 2020-21 forecast trade volumes prepared by BISOE and PoM (discussed in section 7 and Appendix H).
However:
as agreed with the ESC, the calculation of the WATI excludes revenue from contracts with Port Users for Prescribed Services. The WATI is the weighted average rate of change in all tariffs, excluding tariffs for full outbound container wharfage services, and
PoM has for 2020-21 calculated the WATI using weightings based on its 2018-19 audited revenue. The 2020-21 WATI (excluding tariffs for full outbound container wharfage services) is 2.2 per cent. Audited revenues are contained in Appendix H, KPMG’s “Report of factual findings to Management of the Port of Melbourne Group Prescribed Services Revenue 30 June 2019”.
PoM has added Prescribed Services revenue associated with the legacy contracts to “Prescribed Services revenue (subject to the TAL)” for the purposes of comparing it with the “ARR” in Table 1 and Table 18. PoM has agreed to this treatment of legacy contracts with the ESC.
For the avoidance of doubt, PoM’s total Prescribed Services revenue comprises:
Prescribed Services revenue (subject to the TAL), and
revenue from both legacy and new contracts for Prescribed Services. This contract revenue is confidential and is separately reported to the ESC in Appendices D and O.
9.4 Comparison of ARR and Prescribed Services revenue (subject to the TAL) plus revenue for legacy contracts
Table 18 compares the ARR with PoM’s Prescribed Services revenue (subject to the TAL) plus revenue from legacy contracts.
Table 18 shows that the 2020-21 Prescribed Services revenue (subject to the TAL) plus revenue from legacy contracts is $89.4 million below the ARR of $454.7 million, despite the adopted approach to depreciation, which sets depreciation to zero and defers the recovery of the return of capital building block component until future regulatory periods.
Table 18: Comparison of 2020-21 ARR and Prescribed Services (subject to the TAL) plus revenue from legacy contracts, $ Million
2020-21
ARR (i.e. from Table 9) 454.7
Prescribed Services revenue (subject to the TAL) plus revenue from legacy contracts 365.3
Under-recovery of ARR 89.4

2020-21 TARIFF COMPLIANCE STATEMENT – GENERAL STATEMENT
52
10. 2020-21 tariffs
As outlined in section 9.3, the forecast 2020-21 Prescribed Services revenue (subject to the TAL) plus revenue from legacy contracts is lower than the ARR (calculated under the ABBM). PoM’s 2020-21 tariffs are therefore subject to the TAL.
PoM also confirms that:
its WATI (excluding tariffs for full outbound container wharfage services) for Prescribed Services is 2.2 per cent
all tariffs will increase by the TAL of 2.2 per cent, being the annual change in the Consumer Price Index (CPI) to March 2020, and
it has not rebalanced its tariffs. All tariffs have been adjusted by the same percentage adjustment (i.e. the TAL of 2.2 per cent) consistent with clause 3.2.1 of the Pricing Order. There are no new or discontinued tariffs from 2019-20.
As noted in section 3.3, the Prescribed Service Tariff for containerised ‘Full – inward’ Wharfage Fees for the Financial Year commencing 1 July 2019 has been amended to increase the tariff from $110.77 (GST-exclusive) per TEU to $120.52 (GST-exclusive) per TEU on and from 1 June 2020, in accordance with the Pricing Order amendment gazetted by the Government on 20 May 2020.62
PoM’s 2020-21 tariffs are set out in the RTS provided at Appendix A and are effective from 1 July 2020.
As agreed with the ESC, PoM has calculated its 2020-21 tariffs by applying the cumulative CPI index to the Initial Prescribed Services Tariffs, rather than by applying the annual CPI to the previous year’s tariffs.63 This results in minor aggregate rounding differences that are self-correcting over time, as demonstrated in Appendix B.
10.1 Upper and lower bounds
Clause 2.1.1 of the Pricing Order requires that revenue for each Prescribed Service Bundle should be on, or between, the upper bound (clause 2.1.1(b)(i)), which represents the standalone cost of providing each Prescribed Service Bundle, and the lower bound (clause 2.1.1(b)(ii)), which represents the avoidable cost of not providing the Prescribed Service Bundle. This is commonly known as the “efficient pricing band”.
As in 2019-20, PoM has prepared an Efficient Cost Bounds Model and an accompanying Efficient Cost Bounds User Guide (see Appendices F and G). The Efficient Cost Bounds Model demonstrates PoM’s compliance with clause 2.1.1(b) of the Pricing Order by:
estimating the indicative standalone and avoidable costs of supplying each Prescribed Services Bundle, based on the most recent available data, and
demonstrating that forecast revenue for each Prescribed Services Bundle falls within those efficient pricing bounds in accordance with the Pricing Principles in the Pricing Order.
Figure 9 shows the conceptual approach that is used in the model. The blue bar represents the revenue from a given Prescribed Services Bundle, while the two orange circles represent the standalone and avoidable costs for that bundle. The two boxes to the right illustrate what components are used in the efficient cost bounds model to make up the two cost measures respectively.
62 The increased tariff is input to the regulatory model for the 2019-20 year. However, to ensure that calculated revenue for that year is appropriate an average tariff for the year is used. That average is estimated as the weighted average of the initial tariff for the year (with a 11/12 weight) and the new tariff (with a 1/12 weight). The estimated tariff with be updated in future to reflect volume weights once actual data is available.
63 With the exception of wharfage fees for inward full containerised cargo. Given that this tariff has been amended during 2019-20, the CPI adjustment is applied to the 2019-20 tariff applicable from 1 June 2020.

2020-21 TARIFF COMPLIANCE STATEMENT – GENERAL STATEMENT
53
Figure 9: Illustrative representation of the efficient cost bounds
Standalone cost of service bundle
Avoidable cost of service bundle
Revenue
Annualised cost of new capex
required if only that service
bundle is provided
Annualised cost of existing capital base required if only that
service bundle is provided
Annual opex if only that service
bundle is provided
Annualised cost of new capex
avoided if that service bundle is
not provided
Annual opex avoided if
that service bundle is not
provided
2020-21 TARIFF COMPLIANCE STATEMENT – GENERAL STATEMENT
54
11. Efficient cost recovery
Efficient cost recovery (ECR) is required to promote the objectives in section 48(1)(a) of the PMA:
that PoM should have a reasonable opportunity to recover its efficient costs of providing Prescribed Services, including a return commensurate with the risks involved, and
to promote efficient investment for the long-term interests of Port Users and Victorian consumers.
Clause 2.1.1(a) of the Pricing Order reinforces these requirements through the ECR principle which requires:
Prescribed Service Tariffs must be set so as:
(a) to allow the Port Licence Holder a reasonable opportunity to recover the efficient cost of providing all Prescribed Services determined by application of an accrual building block methodology of the type described in clause 4 (Aggregate Revenue Requirement)
Importantly, there is no express qualifier on this principle in relation to the application of the TAL. This means that the principle that PoM should have a “reasonable opportunity” to recover its efficient costs and commensurate return is independent of the obligation to apply the TAL during the period until at least 2032 and at the latest 2037.
Allowing PoM to recover its efficient costs of, and commensurate return on, investment is important to avoid compounding PoM’s under-recovery of its efficient costs and having a higher capital base and tariffs at the end of the TAL period. These matters are particularly important because the Pricing Order constrains the depreciation period to the end of the lease.
PoM is also required to promote efficient investment. It is not reasonable to expect that any port operator (whether regulated or unregulated) would undertake investment where it is not commercially sustainable, due to an inability to recover efficient costs and commensurate return.
PoM’s previous and current TCSs show that because PoM’s tariffs are subject to the TAL, PoM will not recover its efficient and prudent costs of providing Prescribed Services as calculated by the ABBM in these years.

2020-21 TARIFF COMPLIANCE STATEMENT – GENERAL STATEMENT
55
Attachment 1 – 2020-21 forecast opex for Prescribed Services
Opex is the operating, maintenance and other non-capital expenditure that PoM incurs to provide Prescribed Services. Table 19 shows PoM’s opex from 2017-18 to 2020-21 by category.
Table 19: 2017-18 to 2020-21 Prescribed Services Opex by category ($, Million)
Opex categories 2017-18 (A) 2018-19 (A) 2019-20 (F) 2020-21 (F)
Port Licence Fee 82.5 84.4 86.3 87.6
Cost Contribution Amount 15.3 15.6 15.9 16.2
Insurance, Rates & Taxes 1.1 1.1 1.3 2.0
Labour Costs 10.6 8.2 9.6 11.3
Repairs & Maintenance 3.5 4.1 3.7 3.4
Professional Services 3.6 4.6 3.8 4.3
Security 2.1 1.7 1.9 1.7
Utilities, Admin, Rental & IT 5.0 4.5 4.7 7.5
Transition 2.8 0.3 1.4 -
Total 126.4 124.5 128.6 133.9
Note – in addition to updating 2018-19 opex figures for actual data, we have made a minor adjustment to correct for ‘negative’ opex amounts that were previously included in the regulatory model (which related to accounting adjustments rather than actual expenditure), the effect of which is to increase the prescribed opex related to ‘insurance, rates and taxes’ across the relevant years (2016-17 to 2019-20) by around $1.0 million. We have also implemented a more precise approach to allocating capitalised labour costs between prescribed and non-prescribed services, the effect of which is to reduce prescribed labour costs across the four relevant years (2016-17 to 2019-20) by around $0.7 million.
Figure 10 shows each opex category as a proportion of total annual opex for 2017-18 to 2019-20.
Figure 10: 2020-21 (F) opex – category as a % of total
Figure 10 and Table 19 show that around 80 per cent of PoM’s 2019-20 forecast opex relates to two items – the PLF and the CCA. These items are non-controllable opex. They are required by, and calculated in accordance with, the relevant

2020-21 TARIFF COMPLIANCE STATEMENT – GENERAL STATEMENT
56
requirements in the PMA64 and PCD65. The PLF and CCA are deemed to be prudent and efficient under clause 4.5 of the Pricing Order. Only around 20 per cent, or $30 million, of PoM’s 2020-21 forecast opex is therefore controllable by PoM, which is in line with prior years.
The main increases from 2019-20 to 2020-21 relate to:
Increased FTE requirements in respect of Capital Projects mainly due to the current Rail and PDS requirements.
Increased insurance costs based on increases in costs for Crime & Property Insurance and Directors & Officers Liability Insurance, resulting from a hardening insurance market.
1.1. Efficiency and prudence of opex
The Pricing Order requires PoM’s opex to reflect efficient expenditure incurred by a prudent service provider. PoM’s 2020-21 controllable Opex is efficient and prudent because it:
is based on PoM’s most recent actual opex which provides the best available information or outcomes from competitively tendered contracts
reflects business as usual expenditure requirements, which are prepared as part of its annual budget process. The annual opex forecasts going into the TCS are prepared as part of PoM’s annual budget process, which is subject to detailed review by Finance, the Executive, Shareholders and Board. The 2020-21 opex forecast reflects PoM’s current view of the budget at the time PoM is submitting this TCS to the ESC. Given that the 2020-21 opex budget will not be finalised until June, the forecasts in this TCS may therefore not reflect PoM’s final opex budget for 2020-21, and
reflects the application of PoM’s asset management system, which has been certified to International Standards Organisation (ISO) 55001:2014 - Asset Management. This is discussed further in section 1.5 of Attachment 2.
Further, the following controls, practices and procedures apply to ensure all aspects of PoM’s opex are prudent, efficient and deliver value for money:
procurement policy and approach – PoM reviewed and updated its Procurement Policy in 2017 following an internal audit administered by Deloitte Risk Advisory (Deloitte). PoM’s Procurement and Contract Management Policy drives commercial outcomes through competitive tendering (appropriate to the value of the contract engagement) to identify preferred suppliers. This competitive pressure on suppliers will ensure that PoM only incurs efficient costs for all outsourced arrangements through market-based pricing.
internal audit – Deloitte has been extended to 30 June 2021 to undertake ongoing internal audit of various areas across PoM in order to assess whether the necessary controls and processes are in place, and are being followed, and to identify areas for improvement. The guiding themes underpinning these internal audits are: safety and security of all who use the Port; the need to enhance and streamline operations to ensure sustainable business performance; compliance with the concession deed and legislative and regulatory requirements; infrastructure forward planning; sound financial management to support decision making; and corporate social responsibility
contract structure – PoM’s repairs and maintenance contracts are structured based on fixed and variable cost components to ensure only necessary works are undertaken with all additional works subject to inspections or reviews and different rate schedules. This is discussed in section 1.2 below, and
PoM has sound recruitment policies and practices in place to ensure labour costs remain efficient and prudent and reflect current market conditions.
PoM also faces high-powered incentives to achieve cost efficiencies during the TAL period. The shortfall between PoM’s forecast 2020-21 Prescribed Services revenue (subject to the TAL) plus revenue from legacy contracts and the ARR
64 The Port Licence Fee has been calculated in accordance with sections 44K and 44J of the PMA 65 The Cost Contribution Amount has been calculated in accordance with clause 27.1 of the PCD

2020-21 TARIFF COMPLIANCE STATEMENT – GENERAL STATEMENT
57
provides a strong incentive for PoM to constrain its opex to prudent and efficient levels. This is because with depreciation set to zero, PoM does not recover any revenue shortfall relating to opex during the TAL period, and cannot defer its recovery until future periods.
1.2. Opex forecasting method
PoM’s 2020-21 opex forecast was initially developed using a “bottom-up” forecasting methodology, which is subsequently subject to a detailed top-down review by the Finance group, Executive, Directors, Shareholders and Board to identify opportunities for efficiency. The individual opex categories are explained below together with an explanation of how PoM has forecast 2020-21 opex.
Table 20: Description of Opex categories and PoM’s approach to forecast Capex by category
Opex category Description and forecasting methodology
Port Licence Fee and Cost Contribution Amount
The PLF has been calculated in accordance with sections 44K and 44J of the PMA. The CCA has been calculated based on clause 27.1 of the PCD. In accordance with clause 4.5 of the Pricing Order, costs associated with the PLF and CCA payable under the PCD are deemed prudent and efficient.
Insurance Costs, Rates and Taxes
The largest component of this expenditure category is insurance costs. PoM’s 2020-21 insurance forecast is based on the actual invoiced premiums for 2019-20, which relate to coverage for:
industrial special risks (property) port operators liability environmental impairment liability directors’ and officers’ liability crime motor vehicle marine hull and protection and indemnity marine cargo business travel cyber liability Tasmanian workers compensation contract works public and products (construction) liability
These actual invoiced premiums for 2019-20 are then adjusted based on discussions with PoM’s insurance broker. The adjustments accommodate expected changes in premiums related to, for instance, market trends and increases in values of commissioned assets (following the completion of projects or expected revaluation increases on Property Plant and Equipment). PoM typically pays its insurance on an annual basis. Forecast expenditure relating to rates and taxes is also based on prior year actual expenditure.
Labour
PoM operates under a landlord port model and therefore the majority of its operational activities relate to the management of port infrastructure and related assets. As such, employee time is typically related to the business as a whole, apart from certain specific responsibility / cost centres which attribute all their time to a particular business segment. Labour costs relate to employee labour and on-costs. These costs are based on prior year actual expenditure adjusted for known and expected changes in required resources.
Repairs and Maintenance
Repairs and Maintenance opex relates to repairs and maintenance on electrical infrastructure, roads and civil, hazardous berths, navigational aids and wharves, buildings and other repairs and maintenance. The 2020-21 Repairs and Maintenance forecast is based on competitively tendered fixed and variable contracts with PoM’s suppliers. As in previous years, the majority of the contract costs are fixed (upwards of 80 per cent) and relate primarily to routine testing, inspection and maintenance of assets. Routine inspection, testing and maintenance is driven by legislative and regulatory compliance (such as the Building Regulations 2006), asset criticality and implications of failure associated with these assets. The variable component comprises less than 20 per cent of the total forecast and relates primarily to operation and repairs. The works program is largely driven by the asset condition reports arising from the inspection regime undertaken as part of the fixed component of the contract. This ensures that

2020-21 TARIFF COMPLIANCE STATEMENT – GENERAL STATEMENT
58
Opex category Description and forecasting methodology expenditure on these assets is only undertaken as and when required to maintain asset operability and condition.
Other – Utility and Administration (including security)
Other support costs include security, utilities and administration and IT, which are necessary to support the management function. In relation to:
security – This ongoing contract comprises a fixed and a variable component. PoM’s security requirements are primarily driven by regulatory compliance obligations under the Maritime Transport and Offshore Facilities Security Act 2003 (Cth) (MTOFSA) and Maritime Transport and Offshore Facilities Security Regulations 2003 (Cth) (MTOFSR))
utility and administration – this relates to costs for advertising and promotions, professional memberships and corporate subscriptions, electricity and water charges, communication costs and training and conferences. These costs are based on actual costs in the prior year and are adjusted for known and expected changes.
IT – these costs are based on actual software licencing costs in the prior year (with the major licences being for Microsoft, TechnologyOne and Objective) and are adjusted for known and expected changes.
Other – Professional and Advisory
This relates to the engagement of professional services including legal, accounting, tax and audit, environmental, as well as engineering condition inspections. PoM’s 2020-21 forecast is based on average actual costs in earlier years and adjusted for known and expected additional engagements.

2020-21 TARIFF COMPLIANCE STATEMENT – GENERAL STATEMENT
59
Attachment 2 – 2020-21 forecast capex for Prescribed Services
Capex is typically associated with the creation of new assets, many of which have long asset lives, or the renewal or rehabilitation of existing assets. Capex tends to be large and variable over time and recovery of these costs is therefore spread over the life of the asset via the return on and of capital.
1.1. Capex forecast
Table 21 sets out PoM’s capex from 2017-18 to 2020-21 by category.
Table 21: 2017-18 to 2020-21 Prescribed Services Capex by category ($, Million)
Capex category 2017-18 (A) 2018-19 (A) 2019-20 (F) 2020-21 (F)
PCP 1.7 - - -
Channel 7.2 5.0 33.4 2.4
Wharves 35.1 42.6 57.9 30.5
Road 1.5 0.2 2.7 8.1
Rail 2.3 3.4 5.4 30.2
Plant 0.8 1.2 2.2 3.3
Other 2.5 4.8 5.4 6.4
Total 51.2 57.3 107.0 80.9
Note – in addition to updating 2018-19 Capex figures for actual data, we have made a minor adjustment to correct for expenditure related to contracts for prescribed services in 2017-18, which results in an overall reduction of $2.3 million in capex in that year. This adjustment is covered in Appendix O.
Section 1.7 of this Attachment 2 provides a mapping of the capex categories in Table 21 to the capex categories in the regulatory model, at Appendix B.
Forecast capex for 2020-21 is below the forecast for 2019-20, due mainly to reduced expenditure on wharves and channels:
as noted in the 2019-20 TCS, in 2019-20 PoM revised the scope of its dredging program to take advantage of the availability of the Boskalis large dredger Magnor, which was in Australia late in 2019. Mobilisation costs for the Magnor whilst it is in Australia are materially lower. The use of the larger dredger, while bringing forward some capital expenditure, is expected to reduce total capital expenditure on dredging over the next 5 years
there is a significant reduction in capex on wharves from last few years, due to a major renewal program at Swanson Dock East comes to a close (final expenditure in FY21 is around half of previous years), and completion of the Swanson Dock Mooring Bollard Upgrade.
Note also that with the Gazettal of the Pricing Order amendments in May 2020, PoM expects to incur in the order of $21.4 million in acquiring the Rail Assets in June 2020. However, in line with the approach of not updating forecasts for previous years with new forecasts, and only updating actual capex figures when they are known, we have not updated the 2019-20 forecast capex figures (this amount was not included in previous forecast for 2019-20 due to the uncertainty surrounding the PRTP).
Figure 11 shows each capex category as a proportion of total annual capex for 2020-21.
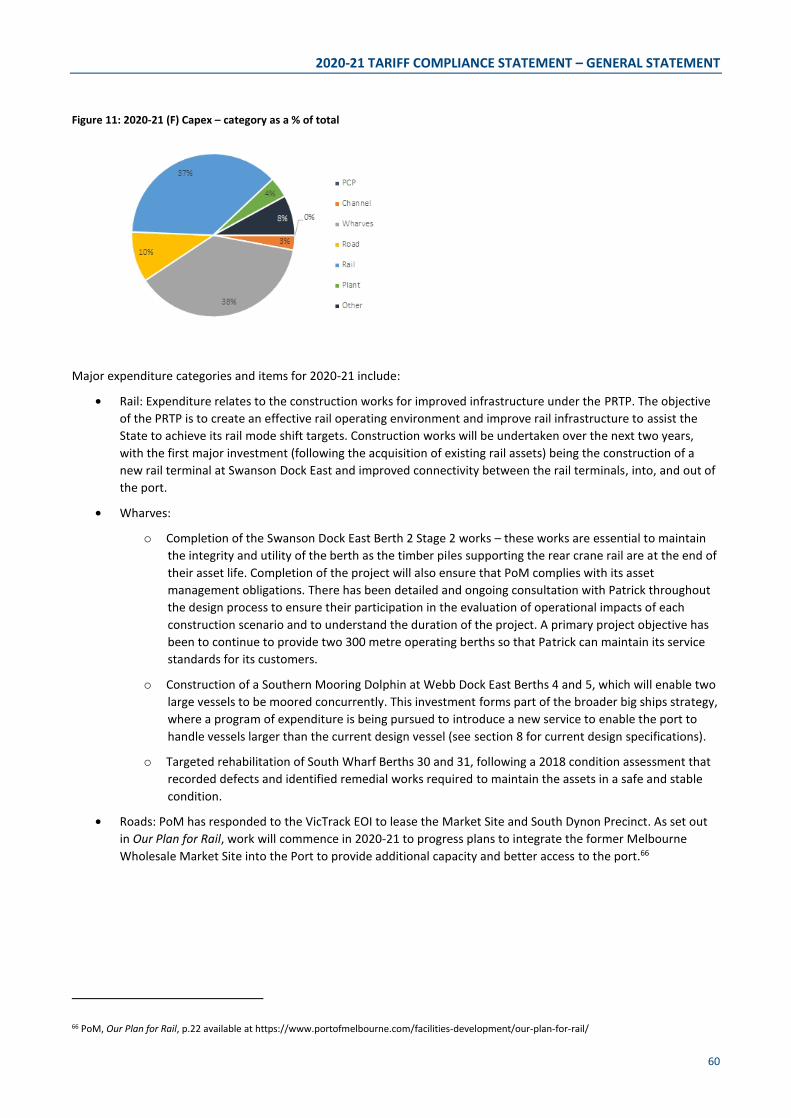
2020-21 TARIFF COMPLIANCE STATEMENT – GENERAL STATEMENT
60
Figure 11: 2020-21 (F) Capex – category as a % of total
Major expenditure categories and items for 2020-21 include:
Rail: Expenditure relates to the construction works for improved infrastructure under the PRTP. The objective of the PRTP is to create an effective rail operating environment and improve rail infrastructure to assist the State to achieve its rail mode shift targets. Construction works will be undertaken over the next two years, with the first major investment (following the acquisition of existing rail assets) being the construction of a new rail terminal at Swanson Dock East and improved connectivity between the rail terminals, into, and out of the port.
Wharves:
o Completion of the Swanson Dock East Berth 2 Stage 2 works – these works are essential to maintain the integrity and utility of the berth as the timber piles supporting the rear crane rail are at the end of their asset life. Completion of the project will also ensure that PoM complies with its asset management obligations. There has been detailed and ongoing consultation with Patrick throughout the design process to ensure their participation in the evaluation of operational impacts of each construction scenario and to understand the duration of the project. A primary project objective has been to continue to provide two 300 metre operating berths so that Patrick can maintain its service standards for its customers.
o Construction of a Southern Mooring Dolphin at Webb Dock East Berths 4 and 5, which will enable two large vessels to be moored concurrently. This investment forms part of the broader big ships strategy, where a program of expenditure is being pursued to introduce a new service to enable the port to handle vessels larger than the current design vessel (see section 8 for current design specifications).
o Targeted rehabilitation of South Wharf Berths 30 and 31, following a 2018 condition assessment that recorded defects and identified remedial works required to maintain the assets in a safe and stable condition.
Roads: PoM has responded to the VicTrack EOI to lease the Market Site and South Dynon Precinct. As set out in Our Plan for Rail, work will commence in 2020-21 to progress plans to integrate the former Melbourne Wholesale Market Site into the Port to provide additional capacity and better access to the port.66
66 PoM, Our Plan for Rail, p.22 available at https://www.portofmelbourne.com/facilities-development/our-plan-for-rail/

2020-21 TARIFF COMPLIANCE STATEMENT – GENERAL STATEMENT
61
1.2. Efficiency and prudence of capex
The Pricing Order requires PoM’s capex to reflect efficient expenditure incurred by prudent service provider. The following sections set out PoM’s forecasting and delivery, governance and asset management processes, demonstrating the processes in place to ensure that all capex is prudent and efficient:
annual capex forecasts going into the TCS are prepared as part of PoM’s annual budget process, which is subject to detailed review by Finance, the Executive, Shareholders and Board. The 2020-21 capex forecast reflects PoM’s current view of the budget at the time PoM is submitting this TCS to the ESC. Given that the 2020-21 capex budget will not be finalised until June, the forecasts in this TCS may therefore not reflect PoM’s final capex budget for 2020-21
much of PoM’s expenditure on renewals and maintenance reflect contractual, compliance and regulatory obligations for Channels and Wharfage. Rail and road expenditure is targeted towards improving operational efficiencies. This is discussed in section 1.3 below
capex forecasting and delivery is undertaken in accordance with PoM’s expenditure governance framework. Forecasts are reviewed by PoM’s Investment Review Committee (IRC) and are required to be consistent with its Asset Management Framework. These are discussed in sections 1.4 and 1.5 below
delivery of capex projects is undertaken by external contractors appointed in accordance with PoM’s Procurement and Contract Management Policy, which drives market-based pricing of all outsourced arrangements.
PoM also faces high-powered incentives to achieve cost efficiencies during the TAL period. The shortfall between Prescribed Services revenue (subject to the TAL) plus revenue from legacy contracts and the ARR means that PoM has an incentive to constrain its capex to prudent and efficient levels. This is because with depreciation set to zero, PoM does not recover any shortfall relating to the return on capex during the TAL period, and cannot defer its recovery until future periods. Further, the period in which PoM can recover deferred depreciation is limited to the period between the end of the TAL and the end of the lease.
1.3. Capex forecasting method
PoM’s 2020-21 capex forecast was initially developed using a “bottom-up” forecasting methodology, which is subsequently subject to a detailed top-down review by the Finance group, Executive, Directors, Shareholders and Board to identify opportunities for efficiency. Table 22 explains each capex category and the method that has been used to prepare PoM’s 2019-20 capex forecasts for each capex category.
Table 22: Description of Capex categories and PoM’s approach to forecast capex by category
Capex category Forecasting method
Channels
Channels provide port access for commercial vessels visiting the Port. Maintenance dredging is a routine part of port operations to remove a build-up of sediment to allow the safe navigation of vessels throughout port waters. Maintenance dredging activities including dredging, sweeping, water injection, material transport and placement, bunding, capping and associated environmental testing and monitoring functions. PoM maintains its channels in accordance with the declared depths as detailed in the Port Information Guide. The primary legislative instrument that controls PoM’s dredging activities is the Coastal Management Act 1995 (Vic). PoM has 10 year (2012-2022) approvals, for the performance of maintenance dredging activities, from the Victorian Department of Environment, Land, Water and Planning (DELWP) and the Commonwealth Department of the Environment and Energy. The compliance requirements of the maintenance dredging activities are set out in PoM’s Safety and Environmental Management Plan (SEMP), approved by DELWP. PoM annually reviews the volumes to be dredged using the most effective and appropriate dredging methodology having regard for historical dredged volumes, the results of the most recent hydrographic surveys of port waters and the requirements of the SEMP. PoM’s whole of bay survey program developed, in conjunction with the Victorian Ports Corporation (Melbourne) Harbour Master (VPCM), sets out the frequency and other details of the hydrographic surveys of port waters that PoM undertakes to inform dredging requirements and needs. The survey results are also provided to VPCM.

2020-21 TARIFF COMPLIANCE STATEMENT – GENERAL STATEMENT
62
Capex category Forecasting method
This annual review process ensures that the volumes of dredging work undertaken are efficient. PoM’s dredging program is performed by an external contractor under a Collaborative Framework Agreement (CFA). The CFA was executed in February 2013 following a global tender process and was reviewed and renewed for a second four year term in February 2017. The review found that the scope of works for each dredging program had consistently delivered works that were conducted within the CFA, budgets, agreed schedules and in accordance with the requirements and obligations of the EMP.
Wharves
Wharves are the common user area for loading and unloading cargo. PoM maintains the condition of its wharves in accordance with the Wharf Structures’ Condition Assessment Manual (WSCAM). Each asset has a modelling strategy, which determines the basis on which PoM assesses whether rehabilitation capex is required. In particular, the strategy sets out the assets:
maximum potential life effective life, and maximum number of rehabilitations (to maintain its condition).
For instance, an asset classification is assigned a maximum life of, say, 100 years and may require rehabilitation every 20 years. PoM’s asset system maintains these dates which inform its Five Year Capex program and long-term capex forecast (which forms the basis of its Five Year Capex Program). PoM provides preliminary concept scope and requirements for its capex renewal and rehabilitation projects to an external quantity surveyor to ensure its expenditure forecast for the upcoming financial year is robust. These cost estimates are also tested and verified based on internal knowledge and expertise. All renewal / rehabilitation capex is undertaken by external contractors selected via a select or public tender process in accordance with PoM’s Procurement and Contract Management Policy. Rehabilitation / renewal capex is undertaken to meet the service lives determined based on the lowest life cycle cost taking into consideration operational levels, business drivers and compliance requirements (obligations to maintain and repair and handback conditions under the PCD) and is therefore efficient and prudent.
Rail
PoM owns and maintains on-port common user rail tracks, which connect to on-port private sidings as well as off-port rail networks, which are generally used for grain distribution and containerised trade. PoM’s contract with Australian Rail Track Corporation (ARTC) provides that ARTC is responsible for undertaking condition inspections, developing the forward works program and undertaking the required work at agreed rates. PoM tests and verifies ARTC’s renewal strategy, works program and rates through external quantity surveyors. Going forward, under the PRTP PoM will own, develop and expand the existing on-dock rail terminals at Swanson Dock to provide direct connections to the Swanson Dock container terminals. Over time, PoM will develop a new Port Rail Access System which is designed to provide open port rail access, streamline the transport of import and export containers by rail and maximise the overall capacity and efficiency of the System.
Road
PoM has common user roads on the Port which are essential for the movement of road transport, including heavy trucks, through the Port. Road rehabilitation work is determined via ongoing risk based optimised asset condition assessments, where asset utilisation is a key factor. PoM’s roads are designed to facilitate truck usage in accordance with the National Heavy Vehicle accreditation scheme and PoM also has regard for VicRoads standards in designing and rehabilitating its roads. The majority of work is subject to competitive tender under PoM’s Procurement and Contract Management Policy given the value of this work.
Plant
Plant capex largely relates to Information Technology (IT) capex and miscellaneous rehabilitation capex relating to fire systems, mechanical and electrical systems (generators), gangways, equipment for contaminated waters (pumps and traps) and gates. IT capex relates to business applications (generally software) and IT infrastructure (generally hardware) which is required to replace or refresh assets that have reached the end of their useful life. PoM bases its forecast IT costs on indicative pricing from its support partners or in some cases the manufacturer. PoM IT continues to operate with a hybrid on-premise / SaaS approach to infrastructure; has made significant progress towards centralising business system governance; and is further consolidating its focus on cybersecurity with a comprehensive two-year security program. Performance to-date against the 2017-20 IT strategy has been strong, with the majority of initiatives delivered and expenditure overall below the approved capex and opex budgets.
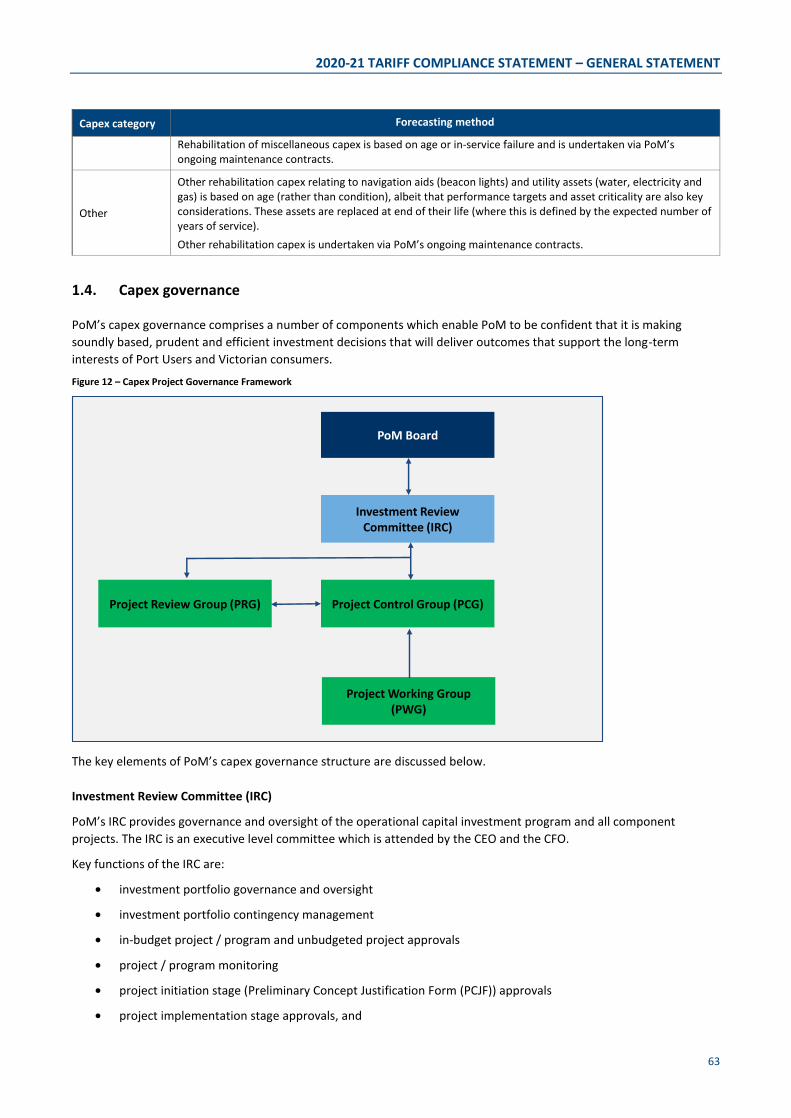
2020-21 TARIFF COMPLIANCE STATEMENT – GENERAL STATEMENT
63
Capex category Forecasting method
Rehabilitation of miscellaneous capex is based on age or in-service failure and is undertaken via PoM’s ongoing maintenance contracts.
Other
Other rehabilitation capex relating to navigation aids (beacon lights) and utility assets (water, electricity and gas) is based on age (rather than condition), albeit that performance targets and asset criticality are also key considerations. These assets are replaced at end of their life (where this is defined by the expected number of years of service). Other rehabilitation capex is undertaken via PoM’s ongoing maintenance contracts.
1.4. Capex governance
PoM’s capex governance comprises a number of components which enable PoM to be confident that it is making soundly based, prudent and efficient investment decisions that will deliver outcomes that support the long-term interests of Port Users and Victorian consumers.
Figure 12 – Capex Project Governance Framework
The key elements of PoM’s capex governance structure are discussed below.
Investment Review Committee (IRC)
PoM’s IRC provides governance and oversight of the operational capital investment program and all component projects. The IRC is an executive level committee which is attended by the CEO and the CFO.
Key functions of the IRC are:
investment portfolio governance and oversight
investment portfolio contingency management
in‐budget project / program and unbudgeted project approvals
project / program monitoring
project initiation stage (Preliminary Concept Justification Form (PCJF)) approvals
project implementation stage approvals, and
PoM Board
Investment Review Committee (IRC)
Project Control Group (PCG)Project Review Group (PRG)
Project Working Group (PWG)

2020-21 TARIFF COMPLIANCE STATEMENT – GENERAL STATEMENT
64
project closeout approval including benefit realisation / residual risk review.
The governance and oversight function of the IRC covers all capital investment projects and programs, irrespective of sponsor and / or division. The IRC typically meets monthly or otherwise as required.
Program Review Group (PRG)
The PRG is managed by the Executive General Manager (EGM) Operations. The PRG function is to oversee and collate status and performance metrics from all projects under delivery through project delivery team(s) directly. This includes:
budget performance and cost control
schedule and delivery status
quality assurance tracking
risk and issue monitoring, and
safety and environmental performance.
The PRG provides updates to the IRC on the above on a monthly basis.
Project Control Group (PCG)
A PCG is formed to manage large, high risk or high complexity projects. Each PCG is chaired by the responsible Executive General Manager (EGM) and includes other relevant business EGMs as well the project delivery team and business representatives from Finance and Legal.
Each PCG is responsible for the commercial, strategic, legal and risk oversight of the project, making project decisions and providing governance and support to the project delivery team. The key functions of the PCG include:
budget and schedule management
project delivery / performance / benefit realisation accountability
project due diligence / risk management
project decision making responsibility
status reporting
project allowance drawdown approvals
project contingency drawdown requests.
Each PCG reports monthly to the IRC and provides updates on key project decisions and direction.
Project Working Group (PWG)
A PWG is established to manage low risk or low complexity projects. The PWG comprises representatives from each business unit that have a direct relationship with the project. The PWG’s role is to support the project delivery team for the duration of the project by ensuring a whole of business approach overseeing all aspects of project delivery. For large projects, the PWG’s functions include:
reviewing project budget and schedule performance
reviewing project status reporting
reviewing project life cycle cost assessments
reviewing project risk profiles and mitigation strategies
providing project decision endorsement and/or strategy alignment
reviewing project Key Performance Indicator (KPI) performance
reviewing project benefit realisation alignment
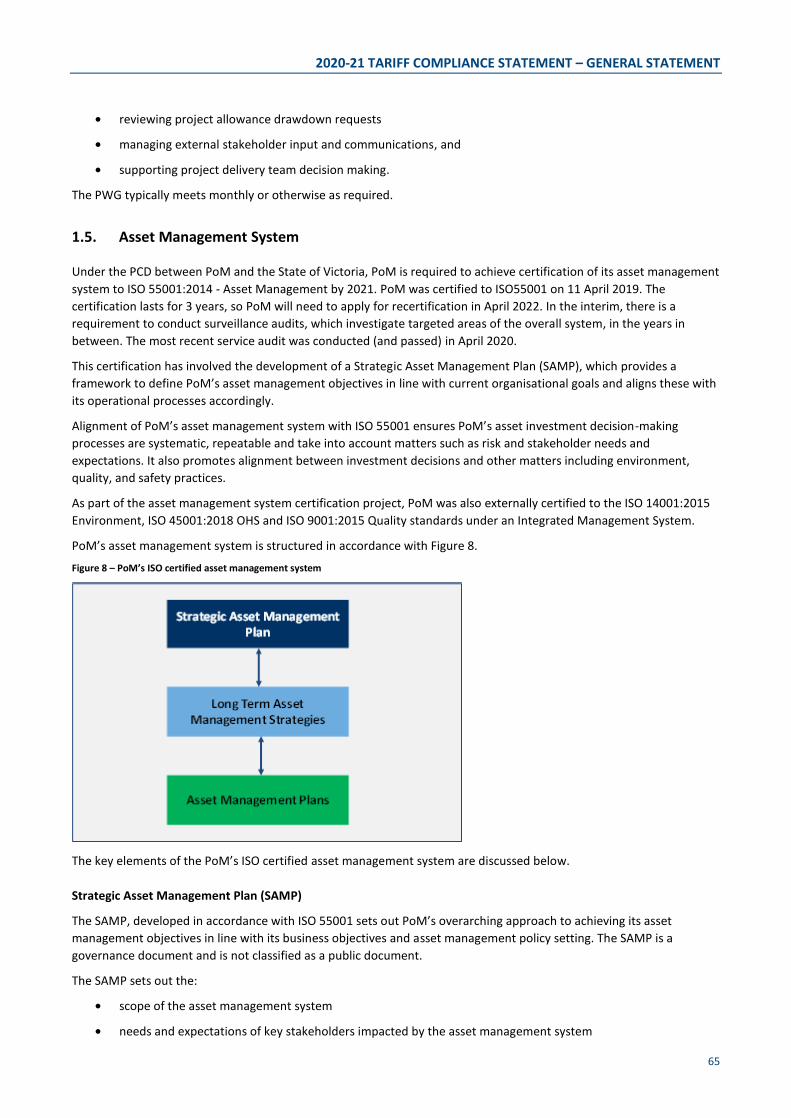
2020-21 TARIFF COMPLIANCE STATEMENT – GENERAL STATEMENT
65
reviewing project allowance drawdown requests
managing external stakeholder input and communications, and
supporting project delivery team decision making.
The PWG typically meets monthly or otherwise as required.
1.5. Asset Management System
Under the PCD between PoM and the State of Victoria, PoM is required to achieve certification of its asset management system to ISO 55001:2014 - Asset Management by 2021. PoM was certified to ISO55001 on 11 April 2019. The certification lasts for 3 years, so PoM will need to apply for recertification in April 2022. In the interim, there is a requirement to conduct surveillance audits, which investigate targeted areas of the overall system, in the years in between. The most recent service audit was conducted (and passed) in April 2020.
This certification has involved the development of a Strategic Asset Management Plan (SAMP), which provides a framework to define PoM’s asset management objectives in line with current organisational goals and aligns these with its operational processes accordingly.
Alignment of PoM’s asset management system with ISO 55001 ensures PoM’s asset investment decision-making processes are systematic, repeatable and take into account matters such as risk and stakeholder needs and expectations. It also promotes alignment between investment decisions and other matters including environment, quality, and safety practices.
As part of the asset management system certification project, PoM was also externally certified to the ISO 14001:2015 Environment, ISO 45001:2018 OHS and ISO 9001:2015 Quality standards under an Integrated Management System.
PoM’s asset management system is structured in accordance with Figure 8. Figure 8 – PoM’s ISO certified asset management system
The key elements of the PoM’s ISO certified asset management system are discussed below.
Strategic Asset Management Plan (SAMP)
The SAMP, developed in accordance with ISO 55001 sets out PoM’s overarching approach to achieving its asset management objectives in line with its business objectives and asset management policy setting. The SAMP is a governance document and is not classified as a public document.
The SAMP sets out the:
scope of the asset management system
needs and expectations of key stakeholders impacted by the asset management system

2020-21 TARIFF COMPLIANCE STATEMENT – GENERAL STATEMENT
66
asset management objectives, and
document hierarchy, decision making criteria and business processes required for PoM to achieve its asset management objectives.
Long-term asset management strategies
PoM’s PDS and Port Development Implementation Plan (PDIP) set out PoM’s strategic planning and development framework:
the 2050 PDS is PoM’s 30-year roadmap for the growth and development of the port (through to 2050). The PDS outlines PoM’s development objectives and details 10 key projects that we forecast will need to be developed by 2035 and 2050 to meet demand and support ongoing efficiency and productivity improvements. The PDS has been developed in consultation with industry, key stakeholders and the community, with 190 stakeholders participating in the development of the 2050 PDS, and will be finalised in mid-2020. Subsequently, the PDS will be updated and provided to the Victorian Government every five years.
the PDIP is a sub-set of the PDS and includes a more detailed 15 year view of planned development activities within the Port to support port capacity and growth in trade demand. The PDIP provides a high-level plan for implementing the 2050 PDS and the Rail Access Strategy (RAS) over a 15-year time horizon, including an overview of the major projects that are intend to be delivered over the next 15-years (to 2035). It also sets out how PoM will work collaboratively with Port Users and other stakeholders to ensure sustainable growth. PoM submitted its first PDIP to the Victorian Government on 31 October 2017 and is currently in the process of updating the PDIP in conjunction with the PDS. The PDIP is not a public document and is intended to only be used by PoM and the Victorian Government.
Asset Management Plans (AMP)
In accordance with the requirements of the PCD, PoM has developed and is maintaining a suite of AMPs which document PoM’s approach to managing Port assets.
The AMPs serve a dual compliance purpose as they are also a fundamental requirement for the ISO 55001 certification. Operationally, the AMPs support the delivery of the strategic objectives in the SAMP and focus on the ongoing management of Port assets including capital renewal, maintenance, and operational requirements.
1.6. Capitalisation Guideline
PoM has prepared its 2020-21 Prescribed Services capex forecasts using the same capitalisation approach used in previous years for Prescribed Services capex.
PoM’s Capitalisation Guideline sets out its approach to capitalising expenditure, which is capital in nature and is attributable to the acquisition and or construction of an asset. These costs typically include:
the cost of materials and direct labour
other costs directly attributable to bringing the assets to a working condition for its intended use
relocation costs (where relevant)
the costs of dismantling and removing the items and restoring the site on which they are located, and
capitalised borrowing costs.
The objective of PoM’s Capitalisation Guideline is to ensure that its capital costs are captured in an appropriate and accurate manner so that the asset value capitalised on PoM’s Fixed Asset Register is at its Fair Value. PoM’s capitalisation approach is consistent with the relevant accounting standards.

2020-21 TARIFF COMPLIANCE STATEMENT – GENERAL STATEMENT
67
1.7. Capex mapping to regulatory model categorisation
Table 23 shows how the Capex categories in Table 21 relate to the more granular capex categories in the regulatory model, at Appendix B.
Table 23: Mapping between the Capex categories in Table 21 and categories in the regulatory model
Regulatory model TCS
PCP - Wharves PCP
PCP - Civil
Melbourne Channel
Channel Melbourne Channel Over Dredge
Shared Channels
Shared Channel Over Dredge
Wharves Wharves
Road Road
Rail Rail
Plant Plant
Land Land
Utilities
Other
Navigational Aids
Channel Service Protection
Civil
Buildings
Minor Capital Works