2020-05-07 - williams-zhao report - signed and updated
TRANSCRIPT
NTCA-USF STUDY
EXPERT REPORT OF MICHAEL A. WILLIAMS, PH.D. AND WEI ZHAO, PH.D.
May 7, 2020

TABLE OF CONTENTS
I. INTRODUCTION AND SCOPE OF THE REPORT ........................................................................ 1
A. Summary of qualifications ................................................................................................ 1
B. Assignment ........................................................................................................................ 3
C. Outline of report ............................................................................................................... 3
II. EXECUTIVE SUMMARY ......................................................................................................... 4
III. INDUSTRY BACKGROUND ..................................................................................................... 5
A. Universal Service Fund .................................................................................................... 8
i. High-Cost Program ...................................................................................................... 8
ii. E-Rate Program ............................................................................................................ 9
iii. Rural Health Care Program ......................................................................................... 9
iv. Lifeline Program ......................................................................................................... 10
B. Evolution of the USF and the need to expand the contribution base ............................. 10
C. Proposed revision of the USF contribution methodology ................................................ 15
IV. SURVEY METHODOLOGY ................................................................................................... 20
A. Overview of the survey methodology .............................................................................. 20
B. Survey sampling .............................................................................................................. 21
C. Survey Instrument Design ............................................................................................... 24
i. Overview of survey principles ..................................................................................... 24
ii. Description of the experiment ..................................................................................... 26
V. EFFECTS OF PROPOSED CONTRIBUTION BASE EXPANSION ................................................ 31
VI. DEMAND ELASTICITY FOR BROADBAND SERVICES ............................................................ 39
A. Overview of price elasticity of demand .......................................................................... 39
B. Literature findings on demand elasticity of Internet services......................................... 41
C. Demand effects of the proposed revision of the USF contribution methodology based on the estimated demand elasticities .............................................................................. 44
VII. CONCLUSIONS .................................................................................................................... 47
APPENDIX I: RESUME ..................................................................................................................... 49
APPENDIX II: SURVEY DESIGN ....................................................................................................... 63

1
I. INTRODUCTION AND SCOPE OF THE REPORT
A. Summary of qualifications
i. Michael A. Williams
1. My name is Michael A. Williams. I am a Managing Director at Berkeley Research
Group, LLC (BRG). I specialize in analyses involving antitrust, industrial organization, and
regulation. I have published articles in a number of academic journals, including Proceedings of
the National Academy of Sciences, American Economic Review, Journal of Law and Economics,
International Journal of Industrial Organization, Journal of Industrial Economics, Physica A,
Journal of Economics and Management Strategy, Economics Letters, Journal of Public Economic
Theory, Behavioral Science, Review of Industrial Organization, Antitrust Bulletin, Texas Law
Review, and the Yale Journal on Regulation.
2. I have provided testimony before the United States District Court, Middle District
of Alabama; United States District Court, Western District of Arkansas; United States District
Court, Central, Northern, and Southern Districts of California; United States District Court,
District of Delaware; United States District Court, Middle District of Florida; United States
District Court, Northern District of Georgia; United States District Court, Eastern Division,
District of Idaho; United States District Court, Southern District of Illinois; United States District
Court, District of Kansas; United States District Court, District of Massachusetts; United States
District Court, District of Minnesota; United States District Court, District of New Jersey; United
States District Court, Southern District of New York; United States District Court, Eastern District
of Pennsylvania; United States District Court, Eastern District of Tennessee; United States District
Court, Northern and Southern Districts of Texas; United States Court of Federal Claims; State of
Connecticut, Superior Court; State of New Mexico, Second Judicial District; State of Nevada,
Gaming Commission and State Gaming Control Board; and public utilities commissions in

2
Arkansas, Hawaii, Michigan, Minnesota, Missouri, Nebraska, New Mexico, Texas, and
Washington.
3. I have been retained as an economic consultant by the U.S. Department of Justice,
Antitrust Division, the U.S. Federal Trade Commission, and the Canadian Competition Bureau.
Previously, I was an economist with the U.S. Department of Justice, Antitrust Division.
4. I hold a B.A. degree in economics from the University of California, Santa Barbara,
and I received my M.A. and Ph.D. degrees in economics from the University of Chicago. My
resume, which contains more information on my background and qualifications, is contained in
Appendix I.
ii. Wei Zhao
5. My name is Wei Zhao. I am a Director at Berkeley Research Group, LLC (BRG).
I specialize in analyses involving antitrust, industrial organization, and regulation. I have published
articles in a number of academic journals, including RAND Journal of Economics, Mathematical
Social Sciences, Review of Industrial Organization, Physica A, Virginia Law & Business Review,
University of Cincinnati Law Review, and ABA Economics Committee Newsletter.
6. I have been an economic consultant to the U.S. Department of Justice, Antitrust
Division, the U.S. Federal Trade Commission, and the Canadian Competition Bureau, as well as
many leading law firms in the United States. I have provided testimony before the United States
District Court, Northern District of Georgia. I hold a B.A. degree in finance from the Renmin
University of China, an M.A. from Columbia University, and a Ph.D. in economics from the Johns
Hopkins University. During my studies at Johns Hopkins, I served as a lecturer for the graduate-
level course Mathematical Methods for Economists. My resume, which contains more information
on my background and qualifications, is contained in Appendix I.

3
B. Assignment
7. We have been asked by NTCA–The Rural Broadband Association (NTCA) to
analyze from an economic perspective the effects of modifying and expanding the “contribution
base,” i.e., the supply of financial resources for the Universal Service Fund (USF), to include both
voice and broadband connections.1 In particular, we investigate the economic effects of modifying
and expanding the contribution base in such a manner on broadband adoption rates.
8. NTCA represents nearly 850 independent, community-based telecommunications
companies that provide telecommunications and broadband services in rural and small-town
America. NTCA advocates on behalf of its members in matters relating to legislative and
regulatory needs, and organizes training, development, industry events; and an array of employee
benefit programs. 2 NTCA members are “rural telephone companies” as defined in the
Communications Act of 1934, as amended by the Telecommunications Act of 1996, although all
have evolved to become broadband providers. Providers have an average of 4,455 residential fixed
broadband connections in service.3
C. Outline of report
9. Section II presents an executive summary of the report. Section III provides industry
background on the evolution of the USF. Section IV presents our methodology for surveying
consumers to assess preferences when it comes to the procurement of communications services.
1 The views and opinions expressed in this article are those of the authors and do not necessarily reflect the opinions, position, or policy of Berkeley Research Group, LLC or its other employees and affiliates.
2 NTCA – The Rural Broadband Association available at https://www.ntca.org/ruraliscool/who-we-are. 3 Broadband/Internet Availability Survey Report (2018); NTCA – The Rural Broadband Association p.1.

4
Section V reports the results from the survey and analyzes how the demand for broadband services
would be affected by the proposed modification and expansion of the contribution base. Section VI
summarizes the economic literature regarding the demand elasticity for broadband services. Section
VII contains our conclusions.
II. EXECUTIVE SUMMARY
10. This section summarizes our findings and conclusions. The facts or data upon which
we are basing the opinions and inferences discussed in this report are of a type reasonably relied
upon by experts in the field of Industrial Organization.4 Our primary conclusions are summarized
as follows:
We examine from an economic perspective the effects of modifying and expanding the “contribution base”—the supply of financial resources—for the Universal Service Fund (USF) to include both voice and broadband connections. We investigate the economic effects of the proposed contribution base modification and expansion on broadband adoption rates.
We conducted a survey that measures the effects on consumer broadband adoption and retention caused by including broadband Internet access services in the contribution base. The survey conducts a robust examination of consumer preferences and sensitivities.
4 The field of Industrial Organization has been defined as: “the study of the structure of firms and markets and of their interactions.” Carlton, D. and Perloff, J. (2005), Modern Industrial Organization, 4th ed., Boston, MA: Pearson Addison-Wesley, p. 2. As one well-known textbook summarizes: “A focus and concern with market power underpins industrial organization. . . . What are the determinants of market power? How do firms create, utilize, and protect it? When are antitrust enforcement or regulation appropriate policy responses to the creation, maintenance, or exercise of market power?” Church, J. and Ware, R. (2000), Industrial Organization: A Strategic Approach, Boston, MA: Irwin McGraw-Hill, p. vii. For this reason, Industrial Organization textbooks contain extended analyses of antitrust issues. See, e.g., Carlton, D. and Perloff, J. (2005), Modern Industrial Organization, 4th ed., Boston, MA: Pearson Addison-Wesley, Chapters 4, 5, 11, and 19; Church, J. and Ware, R. (2000), Industrial Organization: A Strategic Approach, Boston, MA: Irwin McGraw-Hill, Chapters 1, 5, 6, 7, 10, 19, 20, 21, 22, and 23; and Belleflame, P. and Peitz, M. (2015), Industrial Organization: Markets and Strategies, Cambridge University Press, Chapters 14, 15, 16, and 17.

5
We adhered to generally accepted principles of questionnaire design to minimize the probability of various forms of “response bias,” which “occurs when respondents either consciously or unconsciously tend to answer questions with a certain slant that misrepresents the truth.”5
The economic literature supports the conclusion that the demand for broadband connection has become more inelastic, i.e., less sensitive to price changes, over time.
The results of the survey support this conclusion. The estimated percentage reduction in demand for broadband services is approximately 0.08% for every 1% increase in total service fees.
This is a conservative estimate based the number of total accessible connections, and does not take into account any other gains in broadband adoption that might be realized and sustained as a result of programs supported by the USF.
III. INDUSTRY BACKGROUND
10. Transformative innovations in the field of communications have tremendously
impacted our daily lives in a significant and long-lasting way. The presence of computers and
smartphones has grown considerably in recent years, connecting people all over the world. Among
all U.S. households in 2016, 89 percent had a computer and/or smartphone, and 81 percent had a
broadband Internet subscription. As shown in Figures 1 and 2, demand for advanced Internet
connectivity has been increasing among all adult demographics.
5 Zikmund, W., D’Alessandro, S., Winzar, H., Lowe, B., and Babin, B. (2017), Marketing Research: Asia-Pacific Edition, Cengage.

6
FIGURE 1 PERCENTAGE OF U.S ADULTS WHO USE THE INTERNET, BY AGE
Source: Pew Research Center.

7
FIGURE 2 PERCENTAGE OF U.S HOUSEHOLDS WITHOUT INTERNET SUBSCRIPTIONS
Source: U.S Census.
11. The Telecommunications Act of 1996 was the first major amendment to the
Communications Act of 1934. The Act created a regulated platform to encourage competition in
the provision of various communications services.6 Among other factors, changes in the technical
capabilities of and consumer demand for communications services in the preceding two decades
led to the Act. One of these key technical innovations was development of digitally based
information processing. The ever-changing structure of this industry progressed out of the binds
of the outdated rules and regulations, warranting a revision. Though the terms of regulation may
6 Aufderheide, P. (1999) “Communications Policy and the Public Interest: The Telecommunications Act of 1996” Guilford Publications; pp 1-37.
8
have changed and technology has evolved dramatically, the core principle of “Universal Service”
continues to be maintained as a vital public policy by Congress and the Federal Communications
Commission (FCC).
A. Universal Service Fund
12. The Universal Service Administrative Company (USAC)7 administers the FCC’s
Universal Service Fund programs and collects monies for the USF under the direction of the FCC.
The FCC’s annual monitoring report tracks contributions and disbursements. The USF is collected
in order to support four crucial programs: the high-cost program, the schools and libraries (or “E-
rate”) program, the rural health care program, and the lifeline program. Each of these programs
has multiple sub-programs and components. The 2019 total program collection (revenue
requirement) for all of the four programs totaled approximately $8.3 billion.8
i. High-Cost Program
13. The goal of Universal Service is to ensure that all Americans are provided with
access to quality voice and broadband services that are affordable in nature. In order to guarantee
reliable services, critical infrastructure must be provided, and networks must be maintained.
However, deploying such networks and then sustaining such voice and broadband services in rural
and remote areas of the U.S. can prove very expensive.
14. The High-Cost USF program in particular is designed to ensure that consumers in
rural, insular, and high-cost areas have access to voice and broadband services at rates and service
7 USAC available at https://www.usac.org/about/. 8 2019 USAC quarterly contribution factor announcements available at https://www.fcc.gov/general/contribution-factor-quarterly-filings-universal-service-fund-usf-management-support.

9
levels that are reasonably comparable to those in urban areas.9 The program fulfills this universal
service goal by allowing eligible carriers who serve these areas to recover some of their costs of
deploying networks and delivering services from the federal USF. There are various components
to the High-Cost program, including the Connect America Fund, the Rural Digital Opportunity
Fund, and other mechanisms that provide support for network deployment and ongoing operations
in rural areas.
ii. E-Rate Program
15. The Schools and Libraries universal service support program, commonly known as
the “E-rate” program, helps schools and libraries to obtain affordable communications services.10
Funding may be requested for (1) telecommunications and Internet services to a school or library
and (2) for services that deliver Internet access within schools and libraries (internal connections,
basic maintenance of internal connections, and managed internal broadband services).
iii. Rural Health Care Program
16. Telehealth has emerged as a critical component of providing healthcare to
Americans, particularly those living in high-cost areas. The Rural Health Care Program aims to
improve the quality of health care available to patients in rural communities by ensuring that
eligible health-care providers have access to affordable telecommunications and broadband
services. Eligible health care providers include: (1) post-secondary educational institutions
offering health care instruction, teaching hospitals, and medical schools; (2) community health
centers or health centers providing health care to migrants; (3) local health departments or
agencies; (4) community mental health centers; (5) not-for-profit hospitals; (6) rural health clinics;
9 47 U.S.C. § 251(b)(3). 10 E-rate Program information available at https://www.fcc.gov/general/e-rate-schools-libraries-usf-program.

10
(7) skilled nursing facilities; and (8) consortiums of health care providers consisting of one or more
entities falling into the first seven categories.11
iv. Lifeline Program
17. The Lifeline Program helps households-in-need obtain communications services
vital to participate in today’s digital world. The program provides support to approved companies
that in turn offer discounts on services to eligible consumers. These discounts are provided to
qualifying low-income consumers to ensure that all Americans have the opportunities and security
that communications service brings, including being able to connect to jobs, family, and
emergency services. The Lifeline National Eligibility Verifier (National Verifier)12 is designed to
determine Lifeline subscriber eligibility, maintain an eligibility database, and conduct annual
recertification.
B. Evolution of the USF and the need to expand the contribution base
18. Over the course of the past decade, the FCC has taken a series of steps to reform
and “modernize” the various USF programs to orient them more toward furthering access to
broadband Internet access services. For example, in 2011, the FCC rechristened parts of the High-
Cost program as the “Connect America Fund,” and for the first time attached broadband buildout
obligations to the distribution of support.13 The FCC has taken similar steps with respect to other
11 Rural Health Care Program information available at https://www.fcc.gov/general/rural-health-care-program. 12 National Verifier homepage available at https://www.checklifeline.org/lifeline 13 Connect America Fund, et al., WC Docket No. 10-90, et al., Report and Order and Further Notice of Proposed Rulemaking, 26 FCC Rcd 17663 (2011).
11
parts of the High-Cost program in ensuing years,14 as well as the other USF programs.15 Thus, as
of 2020, all of the programs share the objective of promoting affordable access to high-speed
connectivity for rural and low-income consumers, for schools and libraries, and for rural health
care facilities.
19. The USF does not receive any federal appropriations. Instead, to fund the program,
telecommunications carriers are required to contribute to the federal USF based on a percentage
of their end-user interstate and international telecommunications service revenues. Providers of
interstate telecommunications (a distinct class of service under the statute16) may also be required
to contribute “if the public interest so requires” as determined by the Commission. The
Commission has previously used this permissive authority to require other kinds of providers, such
as interconnected Voice over Internet Protocol (VoIP) services for example, to contribute likewise
based upon a certain percentage of their revenues.17 The FCC determines each quarter what the
“contribution factor” – the percentage of assessable revenues that each contributor must pay into
the USF –based on the ratio of (1) total projected quarterly costs of the universal service support
14 See, e.g., Connect America Fund, et al., WC Docket No. 10-90, et al., Report and Order, Notice of Proposed Rulemaking, Order, and Order on Reconsideration, 31 FCC Rcd 3087 (2016); Rural Digital Opportunity Fund, WC Docket No. 19-126, Notice of Proposed Rulemaking, 34 FCC Rcd 6778 (2019). 15 See, e.g., Lifeline and Link-Up Modernization, et al., WC Docket No. 11-42, et al., Order on Reconsideration, 31 FCC Rcd 3962 (2016); Rural Healthcare Support Mechanism, WC Docket No. 02-60, Report and Order, 27 FCC Rcd 16678 (2012); Modernizing the E-Rate Program for Schools and Libraries, WC Docket No. 13-184, Second Report and Order and Order on Reconsideration, 29 FCC Rcd 15538 (2014). 16 Compare 47 U.S.C. § 15(50) and (53). 17 Universal Service Contribution Methodology, et al, WC Docket No. 06-122, et al., Report and Order and Notice of Proposed Rulemaking, 21 FCC Rcd 7518 (2006).
12
mechanisms to (2) contributors’ total projected collected assessable revenues, net of projected
contributions.18
20. The companies contributing currently to the federal USF include wireline
telecommunications service providers, wireless telecommunications service providers, and certain
VoIP providers.19 Thus, although all of the USF programs have been amended to provide promote
broadband deployment and/or enable broadband adoption as described above, the current revenue-
based “contribution base” for the USF does not include broadband services as a contributing
element. The FCC allows, but does not require, contributors to the USF to recover the cost of their
USF contributions from end user ratepayers. Thus, consumers may have a “Universal Service”
line item among their telecommunications and telecommunications service charges,20 but these
surcharges today do not apply to broadband services procured by end user customers.
21. In recent years, the contribution base for the USF has been shrinking as consumers
and businesses migrate from traditional telecommunications services towards more data-intensive
communications services, such as broadband Internet access. The shift in the FCC’s own programs
to emphasize broadband deployment and adoption have contributed to this trend. For example, in
the first quarter of 2010, USAC reported that the contribution base would be $17.25 billion. In its
most recent report, USAC stated that the contribution base for first quarter 2020 is $11.13 billion—
a 35% decrease in the contribution base over the last decade.21 During this same ten-year period,
18 Proposed Fourth Quarter 2019 Universal Service Contribution Factor (12 September 2019), CC Docket No. 96-45; FCC Public Notice. 19 Federal Lifeline Program: Frequently Asked Questions available at https://fas.org/sgp/crs/misc/R44487.pdf. 20 Id. 21 From USAC quarterly contribution base and demand filings available at: https://www.usac.org/about/reports-orders/fcc-filings/.

13
the projected quarterly funding/collection requirements for the USF actually decreased as well, by
9%—from $2.11 billion in the first quarter of 2010 to $1.93 billion for the first quarter of 2020.22
22. The declining revenue base has led to a marked increase in the contribution factor,
from 6.7% for the first quarter of 2001, to 14.1% for the first quarter of 2010, to 21.2% for the first
quarter of 2020 (see Figure 3).23 Despite the increase in the USF contribution factor, the total size
of the USF from a distribution perspective has been essentially unchanged since 2010. Beyond the
quarterly comparisons referenced above, for the entirety of 2010, the USF disbursed approximately
$8 billion in support. The (unaudited) disbursement value for 2018 was $8.5 billion, representing
less than six percent total growth in annual disbursements over this eight-year period. Thus, it
seems clear that the increase in the contribution factor can be attributed almost entirely to the
shrinking base of revenues in the contribution base as currently constituted.24
22 From USAC quarterly contribution base and demand filings available at: https://www.usac.org/about/reports-orders/fcc-filings/. 23 From FCC Public Notices available at: https://www.fcc.gov/general/contribution-factor-quarterly-filings-universal-service-fund-usf-management-support. 24 See Comments of Free Press submitted before the Federal Communications Commission (2019); WC Docket No. 06-122.

14
FIGURE 3 QUARTERLY CONTRIBUTION FACTOR FOR UNIVERSAL SERVICE FUND
Source: FCC Quarterly Contribution Factor Filings.
23. In light of the trends with respect to the contribution factor specifically and the
communications marketplace more broadly, the FCC has examined a few times over the past fifteen
years whether and how it might reform the USF contribution methodology to promote the
sustainability of the programs and ensure that contributions continue to be equitable and
nondiscriminatory.25 One option that has been proposed by some parties, as discussed further below,
25 Universal Service Contribution Methodology et al., WC Docket No. 06-122 et al., Report and Order and Notice of Proposed Rulemaking, 21 FCC Rcd 7518 (2006); Universal Service Contribution Methodology et al., WC Docket No. 06-122 et al., Further Notice of Proposed Rulemaking, 27 FCC Rcd 5357 (2012).

15
would be to include broadband Internet access services within the “contribution base.” Recovering
USF contributions from broadband services in addition to services already contributing today
would clearly reduce the escalating contribution factor currently applied only to interstate and
international telecommunications services and selected offerings of telecommunications. Some,
however, have conjectured that doing so would have a negative effect on broadband adoption,
contrary to the goals of universal service. We examine this conjecture by analyzing the effect of
including broadband Internet access services in the contribution base on broadband adoption.
C. Proposed revision of the USF contribution methodology
24. In August 2014, the FCC asked the Federal-State Joint Board on Universal Service
to provide recommendations for modifying the methodology employed in computing contributions
towards the USF. The desired revisions in the methodology stem from the Commission’s
acknowledgment that although “it chose to assess contributions based on end-user revenues” when
it implemented the federal Telecommunications Act of 1996, since that time “network
convergence and technological innovation have transformed the telecommunications industry, and
the contribution system has become increasingly complex and difficult to administer.”26
25. In October 2019, after years of examination and deliberation among the federal and
State members, the State members of the Joint Board ultimately submitted their own draft
“Recommended Decision” on potential reforms of the USF contribution methodology. The State
members noted that the Joint Board had been requested by the Commission to propose revisions
to the methodology, based upon furthering the goals of improving the efficiency, fairness, and
26 Federal State Joint Board on Universal Service Universal Service Contribution Methodology et al., WC Docket Nos. 96-45, 06-122 et al., (FCC, Rel. August 7, 2014) at ¶ 2.

16
sustainability of the contribution system.27 Based upon this request and a review of the record
previously developed in the FCC’s contributions proceeding, the State members of the Joint Board
recommended an expansion of the contribution base, specifically supporting inclusion of providers
of certain enterprise communication services and broadband Internet access services as
contributors to universal service.28
26. Notwithstanding concerns about the sustainability of the current contributions
mechanism and the other considerations raised and examined by the State members of the Joint
Board, some have speculated that any reform that somehow includes broadband Internet access
services within the contributions base may have the unintended adverse consequence of deterring
adoption of broadband services.29 This report examines such assertions specifically with respect
to broadband Internet access service through an economic analysis of consumer responses to
potential changes in the USF contributions assessment attributable to such services.
27. More specifically, in the remainder of this report, we evaluate the effect of a “per-
connection” USF contributions assessment on consumer procurement and retention of broadband
services. While the current contributions mechanism is “revenues-based” as described above, and
while some like the State members of the Joint Board have proposed “hybrid” measures that assess
different services based upon different units, we have used a connections-based approach for
27 Federal State Joint Board on Universal Service Universal Service Contribution Methodology et al., WC Docket Nos. 96-45, 06-122 et al., State Members’ Draft Recommended Decision (October 15, 2019) at ¶ 11. 28 Federal State Joint Board on Universal Service Universal Service Contribution Methodology et al., WC Docket Nos. 96-45, 06-122 et al., State Members’ Draft Recommended Decision (October 15, 2019) at ¶¶ 17-18. 29 Federal State Joint Board on Universal Service Universal Service Contribution Methodology et al., WC Docket Nos. 96-45, 06-122 et al., State Members’ Draft Recommended Decision (October 15, 2014) at ¶ 17.
17
purposes of this analysis to leverage publicly available data to the greatest extent possible upon
existing connections, to be able to map consumer effects based upon each consumer’s clearly
established “connections” rather than varying “telecom spends” that may be harder for any
consumer to identify and isolate from month to month, and to avoid any potential complexity with
any so-called “hybrid” approaches (e.g., revenue-based assessments on some users and
connections-based assessments on others).
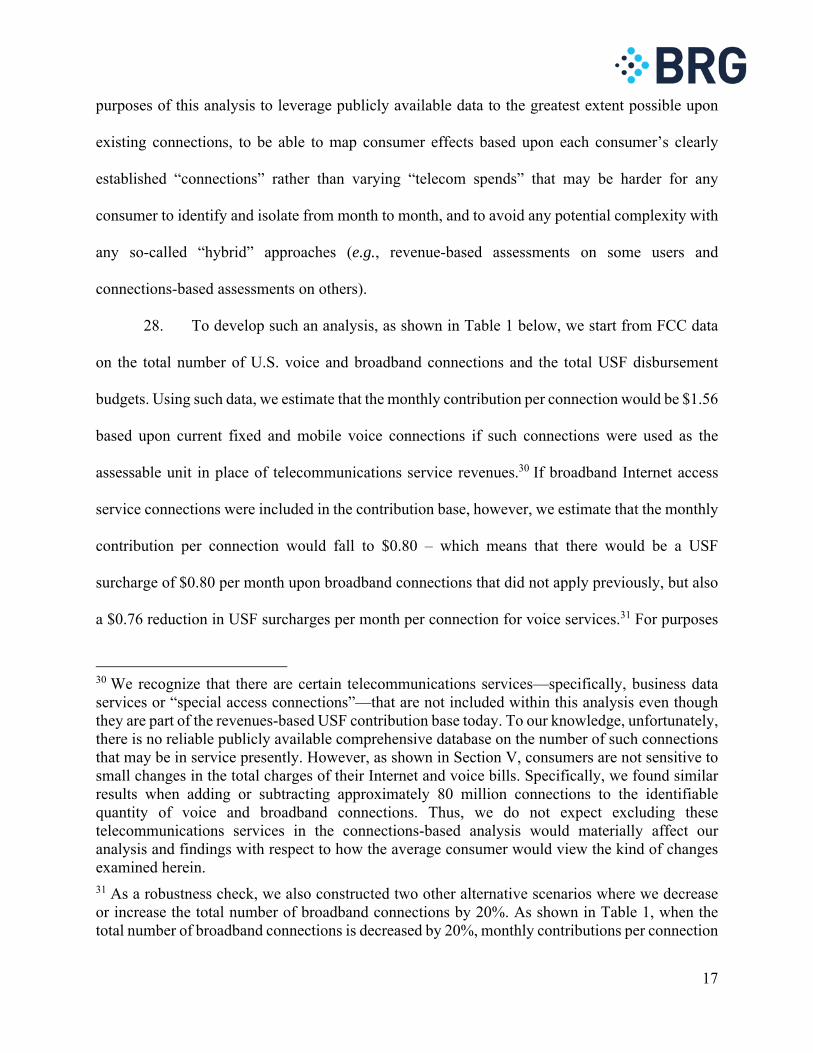
28. To develop such an analysis, as shown in Table 1 below, we start from FCC data
on the total number of U.S. voice and broadband connections and the total USF disbursement
budgets. Using such data, we estimate that the monthly contribution per connection would be $1.56
based upon current fixed and mobile voice connections if such connections were used as the
assessable unit in place of telecommunications service revenues.30 If broadband Internet access
service connections were included in the contribution base, however, we estimate that the monthly
contribution per connection would fall to $0.80 – which means that there would be a USF
surcharge of $0.80 per month upon broadband connections that did not apply previously, but also
a $0.76 reduction in USF surcharges per month per connection for voice services.31 For purposes
30 We recognize that there are certain telecommunications services—specifically, business data services or “special access connections”—that are not included within this analysis even though they are part of the revenues-based USF contribution base today. To our knowledge, unfortunately, there is no reliable publicly available comprehensive database on the number of such connections that may be in service presently. However, as shown in Section V, consumers are not sensitive to small changes in the total charges of their Internet and voice bills. Specifically, we found similar results when adding or subtracting approximately 80 million connections to the identifiable quantity of voice and broadband connections. Thus, we do not expect excluding these telecommunications services in the connections-based analysis would materially affect our analysis and findings with respect to how the average consumer would view the kind of changes examined herein. 31 As a robustness check, we also constructed two other alternative scenarios where we decrease or increase the total number of broadband connections by 20%. As shown in Table 1, when the total number of broadband connections is decreased by 20%, monthly contributions per connection

18
of this analysis, and to mitigate any concern that the most price-sensitive customers might be
adversely affected by the inclusion of broadband within the contribution base as revised, we also
assumed for purposes of our analysis that any subscriber receiving Lifeline USF support would
not be subject to a per-connection assessment.
lowers to $0.89, which means that there will be a USF surcharge of $0.89 per month per connection for internet services, but a $0.67 reduction in USF surcharges per month per connection for voice services. When the total number of broadband connections is increased by 20%, monthly contributions per connection lowers to $0.73, which means that there will be a USF surcharge of $0.73 per month per connection for broadband services, but a $0.83 reduction in USF surcharges per month per connection for voice services.

19
TABLE 1 USF CONTRIBUTION PER CONNECTION PER MONTH
Row Description Value
1 Mobile voice services (number of connections)/1 340,113,000
2 Wireline incl. all interconnected VoIP services (number of connections)/2 116,298,000
3 Total voice connections (Row 1 + Row 2) 456,411,000
4 Lifeline subscriber connections/3 10,343,756
5 Total assessable connections - before surcharge change (Row 3 - Row 4) 446,067,244
6 USF total disbursement budgets/4 $8,330,000,000
7 Monthly contribution per connection – before surcharge change (Row 6 / Row 5 / 12) $1.56
8 Mobile Internet services (number of connections)/5 312,778,000
9 Landline Internet services (number of connections)/6 108,188,000
10 Total Internet connections (Row 8 + Row 9) 420,966,000
11 Total assessable connections – after surcharge change (Row 5 + Row 10) 867,033,244
12 USF total disbursement budgets/7 $8,330,000,000
13 Monthly contribution per connection - after surcharge change (Row 12 / Row 11 / 12) $0.80
14 Reduction in monthly contribution per voice connection (Row 7 - Row 13) $0.76
15 Variations of total assessable connections – after surcharge change
16 Decrease by 20% (Row 5 + Row 10 x 0.8) 782,840,044
17 Corresponding monthly contribution per connection (Row 12 / Row 16 / 12) $0.89
18 Reduction in monthly contribution per voice connection (Row 7 - Row 17) $0.67
19 Increase by 20% (Row 5 + Row 10 x 1.2) 951,226,444
20 Corresponding monthly contribution per connection (Row 12 / Row 19 / 12) $0.73
21 Reduction in monthly contribution per voice connection (Row 7 - Row 20) $0.83 Notes: /1 /2 From Voice Telephone Services Report as of December 31, 2017. (rel. August 2019). /3 Total Lifeline subscribers as of end of 2017, USAC 2nd Quarter 2018 FCC Filings attachment LI08 Lifeline Subscribers by State or Jurisdiction. At end of 3rd Quarter 2019, the total number is 6,917,063. Lifeline Subscribers will include some fixed broadband-only Lifeline customers, however, given the high-cost of these services, it is not likely that the number of these customers is high, so the subscribers are applied to telecommunications connections for the monthly contribution per connection calculation in Row 3. /4 /7 2018 disbursement budgets. See FCC Notice of Proposed Rulemaking (FCC 19-46), page 5. (May 2019). /5 /6 Broadband connections from FCC Report: Internet Access Services Status as of December 31, 2017, Figure 6. (August 2019).
20
IV. SURVEY METHODOLOGY
A. Overview of the survey methodology
30. As a first step in assessing the effect on consumer broadband adoption and retention
associated with the inclusion of broadband Internet access services within the contribution base, it
is important to conduct a robust examination of consumer preferences and sensitivities. We
therefore designed and performed a survey analysis to study how consumers would react to the
potential appearance of per-connection surcharges for broadband on their bills. A key objective of
any survey is to design a realistic market scenario. To understand the preferences of the
respondents, it is important to use a tool that can represent the real-world scenario of the decision
making. Survey methodology is a prevalent method in commercial market research that firms
employ to investigate consumers’ reactions to products, services, or situations not available in their
current or prior experience.
31. Several components are important for correctly implementing a survey. First, a
sample must be selected and survey responses collected from a group of individuals sufficiently
representative of the population of interest. Second, an implementation vehicle must be
determined, and the survey must be implemented, and data recorded correctly. Third, data must be
analyzed to appropriately infer statistical insights.
32. We used standard econometric survey design to measure and forecast consumer
responses in hypothetical scenarios. In this approach, respondents choose from courses of action,
simulating a hypothetical market scenario in which the customer must make a decision.
Respondents are asked to indicate their preferences in this simulated market, by selecting one of
the offerings or rejecting all of them.

21
33. We created a hypothetical scenario in which a respondent could relate to the real-
world scenario of making a decision about existing telecommunication/Internet service, thus using
the common “What would you do?” approach for measuring survey responses.
34. We choose to use an email survey for our analysis. With the advent of the Internet-
age, it is now easier than ever to close the potential gap between respondents and investigators.
According to US census data, 79% of the adult US population now has regular access to the
Internet, either at home, at work, or on a mobile device. One possible criticism of this survey
population is that using email/web survey is not representative of the broader population. However,
this criticism fails to account for the fact that for special interest populations, use of Internet
technology is highly successful in eliciting required information. This particular study is one such
scenario, as the end choice is highly dependent on access to telecommunication and Internet
services. Furthermore, Schaefer and Dillman (1998)32 found no significant difference in response
rates between an e-mail survey and a mail survey. They also found that the e-mail survey
respondents provided more complete responses (lower item non-response) than mail survey
respondents, and the completion time was quicker with the e-mail survey.
35. Below, we describe the selection of the survey sample and the design of the survey
instrument. In each section, we describe how we carefully minimized threats to the validity of the
survey.
B. Survey sampling
36. A key question for any quantitative survey is selecting the appropriate “parent
population” or “survey universe,” i.e., the group of people whose behavior and opinions the survey
32 Schaefer, D and Dillman, D (1998), “Development of a Standard e-mail Methodology: Results of an Experiment”; Public Opinion Quarterly; Vol. 62; pp. 378-397.

22
is designed to represent. The USF is designed to serve the American people and, thus, we chose to
model the survey population to the U.S. Census population, meaning that survey respondents
would be representative of the U.S, population as a whole.
37. We adopted the following criteria for inclusion in the survey sample:
The respondent (an adult, at least 18 years old) must have been personally
involved in the decision to acquire the voice/ Internet service.
No adult member of the respondent’s household is currently employed in
the telecommunication providers industry or in advertising, marketing, or
market research.33
The respondent should not have current plans to make changes to their/ their
household’s Internet/data services.34
The respondent should currently be enrolled into at least one voice or
broadband Internet service; either serviced through in-home device or
mobile device. Additionally, the individual or his/her household should be
solely responsible for at least one of these services.
38. Based both on the coverage of their panel sample and on the prior positive
experience of BRG in working with the company, we selected Dynata35 to field the survey. Dynata
33 Screening out potential respondents with strong work-related connections to either the focus of the survey or to marketing research methods has become a standard practice in commercial market research. 34 By restricting the sample, we are able to infer that any choices made in the main section questions are directly influenced by the price / questions themselves. 35 This company is a well-established international market research firm formed in December 2017 from the merger of two major US-based companies, Research Now (founded in 1999) and Survey Sampling International (founded in 1977). Details of the company’s US panel operation can be found at

23
issued invitations to complete the online survey to panel members who represented approximately
the composition of the forty-eight contiguous states with respect to gender, age, gross household
income, and region of the country (four regions).36 Respondents were offered a range of rewards
including sweepstakes, points, charity donations, points for gift cards, music downloads, and
loyalty points such as airline miles for completing the questionnaire. Such incentives are now
standard practice in online panel-based research.37 If an invitee qualifies for the survey under the
sample screening criteria (which are deliberately made opaque to respondents), the incentive is not
contingent on providing any particular answers.
39. Dynata’s sample issue procedure is a dynamic process, reflecting the progress made
to date in achieving the sample quotas within an acceptable time frame. Over the fieldwork period,
reminder invitations are periodically sent to invitees who have not yet responded. If the responses
from certain target groups are taking too long, the incentive offered in the new invitations to those
groups may be increased.
40. If a particular group of invitees is achieving a higher proportion of completed
interviews than targeted, further recruitment in that segment may be curtailed for a while. Target
https://web.archive.org/web/20180929143958/https://www.surveysampling.com/audiences/consumeronline/ (visited June 8, 2019). Subsequent to our survey, on January 15th, 2019, the company rebranded under the new name Dynata. 36 Advancement of technology has made it possible to bridge the gap between potential respondents and investigators. According to US census data, 79% of the adult US population now has regular access to the Internet, either at home, at work, or on a mobile device. While face-to-face interviews, telephone interviews, and mailed self-completion questionnaires still do play an important role in survey research, online surveys provide greater ease and flexibility to respondents and investigators alike. 37 De Leeuw, E., Hox, J., and Dillman, D. (2008), International Handbook of Survey Methodology, New York, NY: Taylor & Francis Group.

24
percentages were adopted as guidelines to ensure that the final proportion of the sample mimics
the U.S Census proportions (see Table 3).
41. The opening section of the questionnaire collected basic identification information
to validate the respondent as the panel member invited to the survey. Respondents were asked
about their gender, age and five-digit zip code. Responses to these questions were used to screen
out respondents under the age of 18 and respondents of certain age groups if the quota for an age
group has been reached. The CAPTCHA38 challenge was used to ensure that the respondent was
a human—not a computer “bot.”
42. In the screening section, we also asked respondents a question about the number of
people living in their households to have respondents check if they entered any number other than
a positive integer.
C. Survey Instrument Design
i. Overview of survey principles
43. We carefully designed the survey instrument (see Appendix II) to provide insight
into respondent’s preferences. We adhered to general principles of questionnaire design to
minimize the probability of various forms of “response bias,” which “occurs when respondents
either consciously or unconsciously tend to answer questions with a certain slant that misrepresents
the truth.”39 Response biases “typically arise from the fact that answering hypothetical questions
about one’s likely responses is different from actually deciding in the marketplace.”
38 CAPTCHA is a type of challenge–response test used in computing to determine whether or not the user is human. 39 Zikmund, W., D’Alessandro, S., Winzar, H., Lowe, B., and Babin, B. (2017), Marketing Research: Asia-Pacific Edition, Cengage.

25
44. First, we designed the survey instrument to minimize any “ordering effects,” where
the order in which lists of responses are presented to respondents can influence the responses.
Often, ordering is constrained by the logic of the questionnaire flow, by the logic of presenting an
exhaustive set of mutually exclusive response options (in the case of “Choose one” questions), or
by a clear list in the case of “Choose all that apply” questions. However, whenever there are no
such logical constraints, it is good practice to vary the ordering of responses within a question
across the respondents by randomization. We used randomization throughout the questionnaire to
vary the order in such a way as to ensure that the respondents would not see the same list order
across all the questions.
45. Second, to ensure anonymous sponsorship of the survey, we provided no indication
to respondents, either in the questionnaire itself or in the invitations, as to why or for whom the
survey was being conducted. This avoids any suggestion to the respondents, explicit or implicit,
of what types of responses might be most “expected” or pleasing to the survey sponsors. This
particular form of response bias is sometimes referred to as “strategic bias.”
46. Third, commercial market research sometimes forces respondents to make choices
among proffered alternatives, no matter how unformed, uninformed, or slight those preferences
might be. In almost all circumstances, a “None of the above/ I don’t know” option should be given
to respondents in order to avoid alienating them or have them doubt the survey designer’s interest
in truthful, accurate responses. Providing this option gives respondents the ability to indicate that
none of the presented alternatives truly fits their situation, thus enhancing the reliability of the
survey responses.
47. Fourth, industry-standard techniques were used to help detect invalid or potentially
low-quality respondents. For example, we phrased screening questions in such a way that it would

26
be impossible for potential respondents to detect what answers would qualify to include them in
the survey. And a “please enter this response now” instruction inserted into a longer list—a
technique known in market research as a “red herring”—was used to identify any respondents
merely clicking on answers without properly reading the question. Additionally, respondents were
also requested to fill in their birth year as part of quality check. By cross checking their age (asked
in the screening section) and their birth year, it was possible to exclude those respondents who
have not been truthful or paying attention.
48. Lastly, the survey questions are crafted using personalization whenever
appropriate. Computer-assisted survey methods provide the opportunity to tailor the wording of
any question based on what has already been learned about a particular respondent from their
answers to earlier questions, thereby making the question clearer, more focused on the subject
matter and less ambiguous.40
ii. Description of the experiment
49. The opening section of the questionnaire is the “screener section,” used to ensure
that a potential respondent; guided to the questionnaire’s website - in response to a specific
invitation from Dynata, qualify to participate in the survey. First, some basic identification
information is collected from the panel member, essentially as a gatekeeper to validate that the
respondent is the panel member invited to the survey. The information collected at this stage
included the respondent’s gender, age, and five-digit zip code. Furthermore, a CAPTCHA
challenge was used to ensure that the respondent was a human, not a computer “bot.”
40 For example, once it has been ascertained that a respondent lives alone (a one-person household), it makes sense to frame subsequent questions to ask about “you” rather than about “your household.”

27
50. This also ensures that the overall sample is representative of the U.S Census
population. Results from skewed samples lead to incorrect statistical inferences. Additional
information on size of respondent’s locale and employment status was also collected. This
information helps classify into different groups which can give better insight on the reasoning
behind their choices. Another pre-requisite for the survey was also to ensure that the respondent
was not employed in “Advertising; marketing; market research” or by “Telecommunication
service providers.” Screening out potential respondents with strong work-related connections to
either the focus of the survey or to marketing research methods has become a standard procedure
in current commercial market research practice.
51. The last, and arguably the most important, requirement to qualify was to ensure the
respondent at the very least subscribed to one voice or broadband Internet service, either at home
or as a mobile service. It was also required that the individual or his/her household should be solely
responsible for at least one of these services.
52. When qualifying respondents complete the “screening section”; they are re-directed
towards to the “main section” of the survey questionnaire. This section starts off with asking
respondents on average how many bills they have to pay each month that include voice or
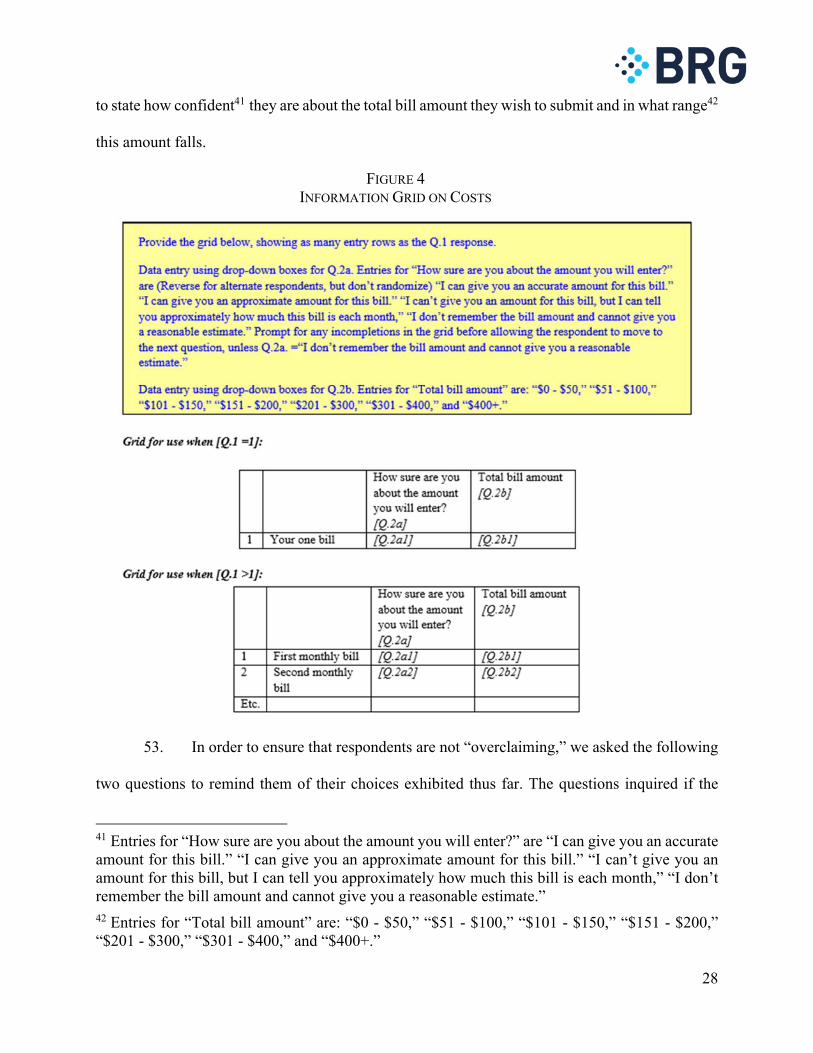
broadband services for personal use. Using the answer provided, a grid (see Figure 4) is generated
as part of the next question that aims to elicit information on their cost(s). Respondents are directed
28
to state how confident41 they are about the total bill amount they wish to submit and in what range42
this amount falls.
FIGURE 4 INFORMATION GRID ON COSTS
53. In order to ensure that respondents are not “overclaiming,” we asked the following
two questions to remind them of their choices exhibited thus far. The questions inquired if the
41 Entries for “How sure are you about the amount you will enter?” are “I can give you an accurate amount for this bill.” “I can give you an approximate amount for this bill.” “I can’t give you an amount for this bill, but I can tell you approximately how much this bill is each month,” “I don’t remember the bill amount and cannot give you a reasonable estimate.” 42 Entries for “Total bill amount” are: “$0 - $50,” “$51 - $100,” “$101 - $150,” “$151 - $200,” “$201 - $300,” “$301 - $400,” and “$400+.”
29
respondent had ever discontinued a home broadband Internet service (including DSL, Fiber, Cable,
fixed wireless and satellite) / cellphone Internet/data service (including mobile data plans and
wireless hotspots) or reduced the number of lines with service because of an increase in the
monthly cost.
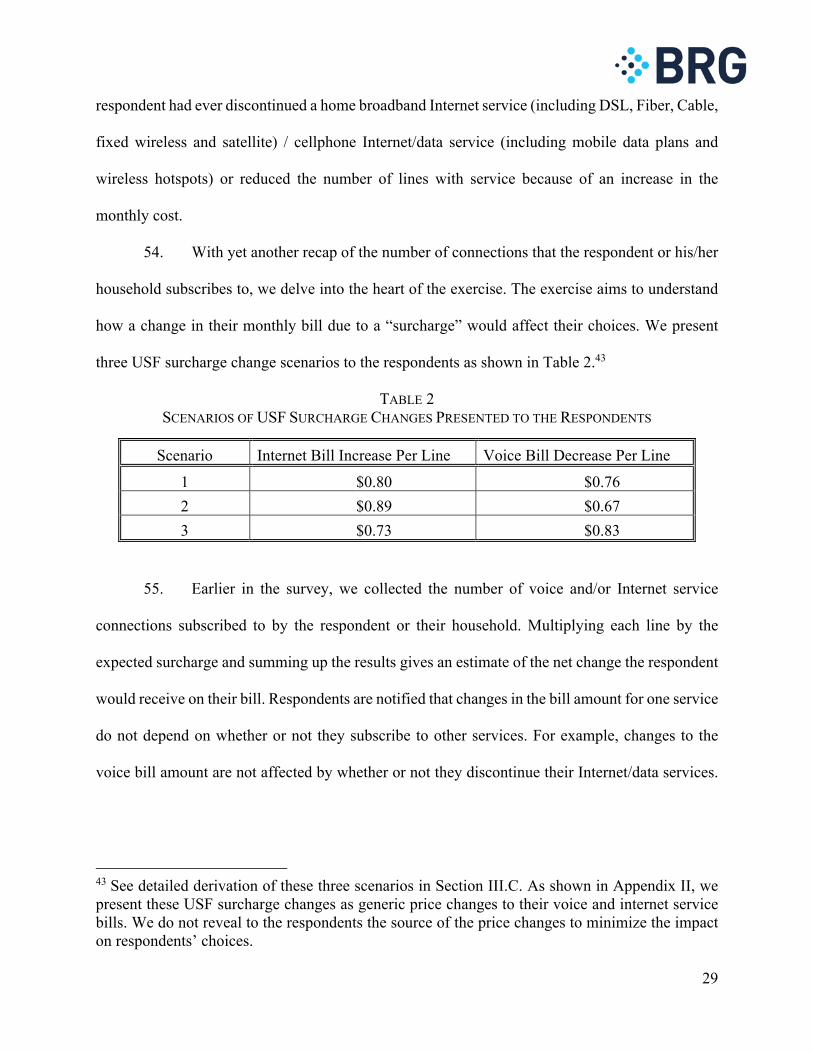
54. With yet another recap of the number of connections that the respondent or his/her
household subscribes to, we delve into the heart of the exercise. The exercise aims to understand
how a change in their monthly bill due to a “surcharge” would affect their choices. We present
three USF surcharge change scenarios to the respondents as shown in Table 2.43
TABLE 2 SCENARIOS OF USF SURCHARGE CHANGES PRESENTED TO THE RESPONDENTS
Scenario Internet Bill Increase Per Line Voice Bill Decrease Per Line
1 $0.80 $0.76
2 $0.89 $0.67
3 $0.73 $0.83
55. Earlier in the survey, we collected the number of voice and/or Internet service
connections subscribed to by the respondent or their household. Multiplying each line by the
expected surcharge and summing up the results gives an estimate of the net change the respondent
would receive on their bill. Respondents are notified that changes in the bill amount for one service
do not depend on whether or not they subscribe to other services. For example, changes to the
voice bill amount are not affected by whether or not they discontinue their Internet/data services.
43 See detailed derivation of these three scenarios in Section III.C. As shown in Appendix II, we present these USF surcharge changes as generic price changes to their voice and internet service bills. We do not reveal to the respondents the source of the price changes to minimize the impact on respondents’ choices.

30
Moreover, they are also asked to assume that the same change in bill amount is applied by all voice
service providers, and the same change in bill amount is applied by all Internet service providers.
56. Given all this information, the respondents are expected to select one among the
following choices provided in Figure 5. The choices were encoded using the numbers shown the
figure.
FIGURE 5 CHOICES PROVIDED AS PART OF THE EXERCISE
57. This exercise was repeated three times with the varying each time by the amounts
shown in Table 2. For choices other than “1” and “6,” the respondent was further questioned to
indicate how many in-home Internet services and/or cellphone Internet/data services they would
downgrade/discontinue/upgrade/add.44
58. For purposes of the analysis conducted, we were asked to assume that respondents
who participate in the Lifeline program would not be affected by the proposal, i.e., that their
44 By “upgrade,” we mean that one would their existing service with a more expensive service, offered by either the same carrier or a different carrier, that has increased download and upload speeds for their internet connection and/or an increased monthly data limit. By “downgrade,” we mean that one would replace their existing service with a cheaper service, offered by either the same carrier or a different carrier, that has reduced download and upload speeds for their internet connection and/or a reduced monthly data limit.

31
connections would not be subject the per-connection assessment being reviewed here. However,
revealing the link between this survey and the USF programs in the screening section may also
bias respondents’ answers. Therefore, we ask about respondents’ Lifeline program participation
status after the main choice questions.
59. The last part of the survey design asks respondents for debriefing questions.
Respondents are asked to qualify how well they identify with the following statements: “I tend not
to react to changes in the monthly bills I pay unless they are greater than $5,” “I didn’t fully
understand the question about change in bill amount that I was being asked,” and “When asked,
people always exaggerate the effect of price increases on their monthly purchasing decisions.”
When each statement appears, they were specified to select a number between 1 and 5 to indicate
how well that statement describes them.
60. The last statement in the debriefing question and the last question of the survey
tests the respondent’s attention towards the survey. These questions are often referred to as “red-
herring” questions.
V. EFFECTS OF PROPOSED CONTRIBUTION BASE EXPANSION
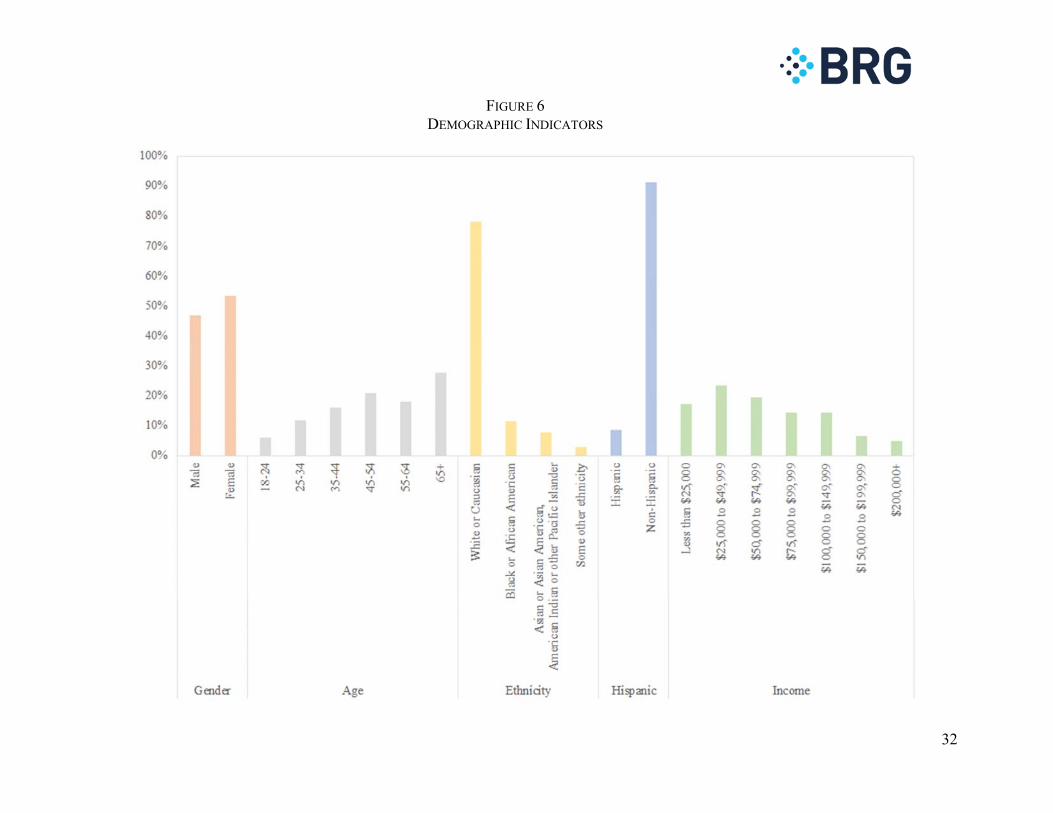
61. After screening, the survey yielded 5,000 completed responses. As mentioned in
Section IV, the survey invitations were issued in a manner to reflect the U.S Census percentages
for specific demographic indicators. Gender, age, ethnicity, and gross household income were
among the key demographic indicators tracked, as shown in Figure 6. As shown in Table 3, the
survey tracks the U.S. Census target population well in general for all demographic indicators.
32
FIGURE 6 DEMOGRAPHIC INDICATORS

33
TABLE 3 DESCRIPTIVE SUMMARY OF DEMOGRAPHIC INFORMATION
Category Description Survey Count
Survey percentage
(%)
U.S. Census
percentage (%)
Gender Male 2333 46.66% 49.16%
Female 2667 53.34% 50.84%
Age
18-24 294 5.88% 13.08%
25-34 587 11.74% 17.50%
35-44 804 16.08% 17.51%
45-54 1040 20.80% 19.19%
55-64 898 17.96% 15.55%
65+ 1377 27.54% 17.17%
Ethnicity
White or Caucasian 3912 78.24% 76.50%
Black or African American 567 11.34% 13.40%Asian or Asian American, American Indian or other Pacific Islander
383 7.66% 7.20%
Some other ethnicity 138 2.76% 2.90%
Hispanic Hispanic 432 8.64% 18.30%
Non-Hispanic 4568 91.36% 81.70%
Income
Less than $25,000 862 17.24% 21.33%
$25,000 to $49,999 1165 23.30% 22.51%
$50,000 to $74,999 972 19.44% 17.67%
$75,000 to $99,999 720 14.40% 12.32%
$100,000 to $149,999 719 14.38% 14.06%
$150,000 to $199,999 326 6.52% 5.83%
$200,000+ 236 4.72% 6.28%Total 5000 100.00%
34
62. The achieved demographic distribution of a sample may not always be identical to
the final target population. We do not have information concerning the demographic characteristics
of all purchasers of telecommunication services. Therefore, in order to examine the data quality,
we examined the responses to three of the “debriefing questions.” In these questions, respondents
had been asked to indicate “[h]ow well that statement describes the way in which you personally
thought about your own answers. . . “ using a five-point scale where “[a] ‘5’ answer means that
the statement ‘describes me perfectly,’ and a ‘1’ answer means the statement ‘doesn’t describe me
at all.’” Table 4 below shows how the respondents reacted to the three statements that might
feasibly relate to data quality.
63. As shown in Table 4, 83% of survey respondents agreed to the first statement. This
exemplifies the results of the survey that people tend not to react to small changes in their monthly
expenditure. Furthermore, close to 90% of the survey respondents indicated that they understood
the survey questions that were posed to them. Finally, in order to check if the respondents are
“overclaiming,” they were asked if “people always exaggerate the effect of price increases on their
monthly purchasing decisions.” 14% of the survey respondents agreed that they tend to exaggerate
the effect of price increases on their monthly purchasing decisions. This indicates that analysis
based on the survey would tend to overestimate the effect of proposed USF surcharge change on
Internet service adoptions.

35
TABLE 4 RESPONSES TO DEBRIEFING QUESTIONS CONCERNING RESPONDENT COGNITION
Doesn’t describe me at all
Describes me
perfectlyI’m not
sure Total
1 2 3 4 5
“I tend not to react to changes in the monthly bills I pay unless they are greater than $5.” 8.3% 7.3% 18.0% 31.3% 33.7% 1.4% 100.0%
“I didn’t fully understand the question about change in bill amount that I was being asked.” 52.4% 20.2% 15.7% 6.2% 2.9% 2.5% 100.0%“When asked, people always exaggerate the effect of price increases on their monthly purchasing decisions.” 23.2% 17.5% 36.8% 11.1% 3.2% 8.1% 100.0%

36
64. As discussed in Section IV.C, red-herring questions (an embedded directive to
respond in a particular way) are used to ensure that the respondents are attentive throughout the
survey. The last question of the debriefing sections instructs the respondents: “To confirm
attention, please select ‘Doesn’t describe me at all’ for this question.” Respondents who failed to
correctly complete this question were subsequently dropped from the sample. Furthermore, the
age of the respondent was also enquired as the last question. By matching this entry to their answer
for birth year (included as a screening question), we can gauge into their attentiveness.
Respondents whose answers did not match their age calculated from birth year were also dropped
from the sample.
65. Additionally, if the respondent is not able to provide a reliable measure for their
monthly costs, they are also excluded from the sample. We also exclude Lifeline participants post
completion of the survey.
66. Finally, the remaining survey responses were also tested to ensure that rationality
prevailed. For example, in response to lower monthly bills, rational individuals would choose to
either make no change or add (buy) new services. Conversely, in response to higher monthly bills,
rational individuals would choose to either make no change or discontinue services. Respondents
who made choices inconsistent with these rational decisions were excluded from the survey. The
final tally of all eligible respondents is 3,270. Table 5 shows the percentage distribution of eligible
respondents based on choices made in the three scenarios (defined in Table 2) presented in the
main section of the survey (see Q.5 in Appendix II.)

37
67. As shown in Table 5, on average 98% of the survey respondents did not choose to
make changes to their current communications services—voice or broadband—as a result of a
monthly increase in their bills that would amount to $0.80 per connection at most (in the case of
broadband-only subscribers) or less (in the case of purchasers of both voice and broadband). Since
the proposed change in the contribution base causes little or no impact on a respondent’s income
level, we focus on the price effect of the proposed USF surcharge changes on broadband adoption.
Specifically, we look into the price elasticity of demand for subscriptions of broadband services,
which is defined as the percent change in the demand for broadband subscriptions in response to
a given percentage change in the total charges for broadband (see Section IV for a further
discussion).
TABLE 5 PERCENTAGE DISTRIBUTION OF SURVEY RESPONDENTS BASED ON CHOICES ACROSS SCENARIOS
Specification Scenario 1 (%) Scenario 2 (%) Scenario 3 (%)
No change 97.98 97.98 97.98 Discontinuation 0.92 0.92 0.92 Downgrade 0.21 0.21 0.21 Upgrade 0.12 0.12 0.12 Add 0.00 0.00 0.00 Other 0.76 0.76 0.76
Total 100.00 100.00 100.00
68. For each respondent and each scenario, we calculate the percentage change in total
charges of broadband services as the ratio of (1) the total change in broadband service fees over
38
(2) the total monthly bill. We then calculate the average percentage change in total charges of
broadband services across all respondents and across the three scenarios.45
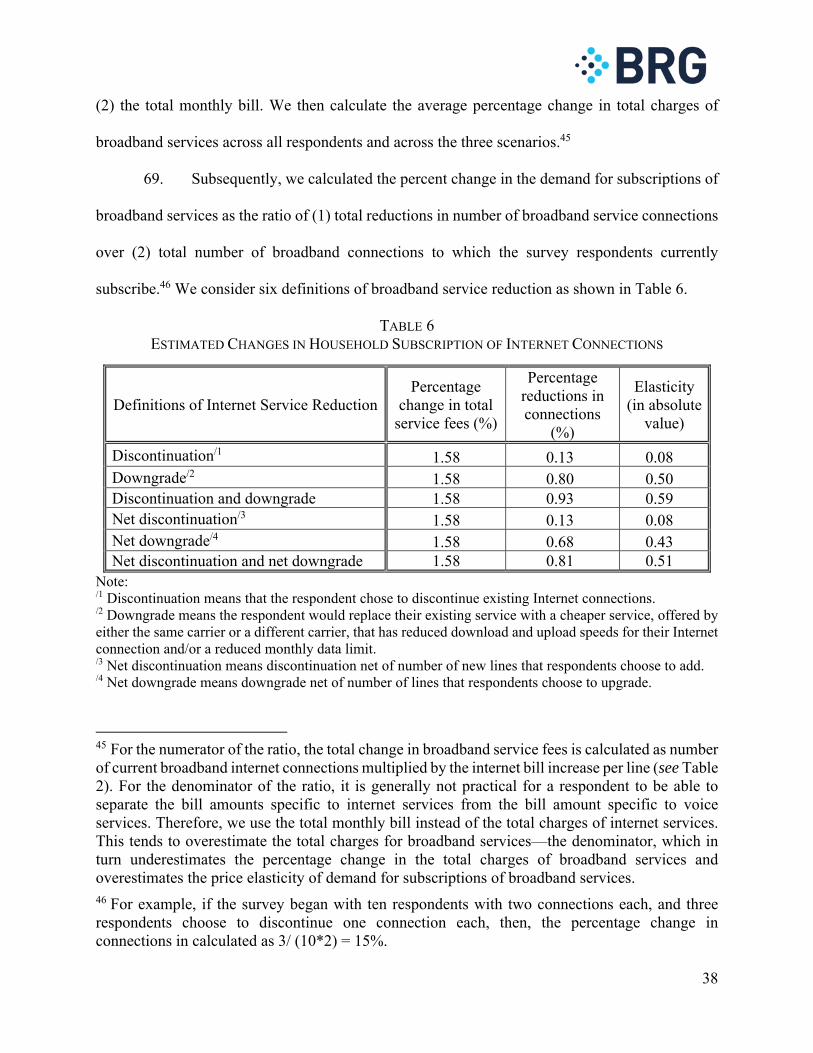
69. Subsequently, we calculated the percent change in the demand for subscriptions of
broadband services as the ratio of (1) total reductions in number of broadband service connections
over (2) total number of broadband connections to which the survey respondents currently
subscribe.46 We consider six definitions of broadband service reduction as shown in Table 6.
TABLE 6 ESTIMATED CHANGES IN HOUSEHOLD SUBSCRIPTION OF INTERNET CONNECTIONS
Definitions of Internet Service ReductionPercentage
change in total service fees (%)
Percentage reductions in connections
(%)
Elasticity (in absolute
value)
Discontinuation/1 1.58 0.13 0.08Downgrade/2 1.58 0.80 0.50Discontinuation and downgrade 1.58 0.93 0.59Net discontinuation/3 1.58 0.13 0.08Net downgrade/4 1.58 0.68 0.43Net discontinuation and net downgrade 1.58 0.81 0.51
Note: /1 Discontinuation means that the respondent chose to discontinue existing Internet connections. /2 Downgrade means the respondent would replace their existing service with a cheaper service, offered by either the same carrier or a different carrier, that has reduced download and upload speeds for their Internet connection and/or a reduced monthly data limit. /3 Net discontinuation means discontinuation net of number of new lines that respondents choose to add. /4 Net downgrade means downgrade net of number of lines that respondents choose to upgrade.
45 For the numerator of the ratio, the total change in broadband service fees is calculated as number of current broadband internet connections multiplied by the internet bill increase per line (see Table 2). For the denominator of the ratio, it is generally not practical for a respondent to be able to separate the bill amounts specific to internet services from the bill amount specific to voice services. Therefore, we use the total monthly bill instead of the total charges of internet services. This tends to overestimate the total charges for broadband services—the denominator, which in turn underestimates the percentage change in the total charges of broadband services and overestimates the price elasticity of demand for subscriptions of broadband services. 46 For example, if the survey began with ten respondents with two connections each, and three respondents choose to discontinue one connection each, then, the percentage change in connections in calculated as 3/ (10*2) = 15%.

39
70. As shown in Table 6, the average percentage change in total service fees is 1.58%,
while the percentage reductions in broadband service connections range between 0.13% and
0.93%. The estimated price elasticity of demand for subscriptions for Internet services range
between 0.08 (i.e., 0.13/1.58) and 0.59 (i.e., 0.93/1.58). When studying the net reduction in the
number of Internet service connections, the net discontinuation definition would be the most
relevant concept. The value “0.08” for the elasticity can be interpreted as follows: a 1% change in
the total service fee yields a 0.08% reduction in number of broadband service connections.
VI. DEMAND ELASTICITY FOR BROADBAND SERVICES
A. Overview of price elasticity of demand
71. In this section, we present studies from the economics literature that show that the
demand for Internet services such as broadband in the US has been increasing over time and that the
demand for Internet services is generally inelastic. The price elasticity of demand is commonly used
in economics to measure how the demand for a product or service changes when its price changes.
Specifically, price elasticity of demand equals (1) the percent change in the quantity demand for a
product divided by (2) the percent change in its price. The price elasticity of demand is generally
negative, meaning that when the price of a product increases (decreases), the quantity demanded for
the product decreases (increases). For example, a -0.5 value of the price elasticity of demand means
that a 10% increase in the price of the product leads to a 5% reduction in the quantity demanded.
72. The range of values for the price elasticity of demand tell whether a product is elastic
or inelastic. The demand for a product is elastic when the absolute value for the price elasticity of
demand is greater than one. The demand for a product is inelastic when the absolute value for the
price elasticity of demand is less than one.
73. The notion of price elasticity of demand is an important measure to consider when
understanding the demand for a product or service as it explains the responsiveness of consumers

40
to a change in price. The value of the price elasticity of demand depends on factors such as (1)
whether the product is regarded as a necessity or a luxury by consumers, (2) the number of
substitutes available for the product, and (3) the proportion of income devoted to the good/service.
If a product is regarded by consumers as being a necessity, then the price elasticity of demand
tends to be inelastic. If there are several substitutes for a product, then the price elasticity tends to
be elastic since consumers can switch to substitute products in response to a price increase. Finally,
if a product or service accounts for a small proportion of a consumer’s income, then the price
elasticity of demand for that product or service tends to be inelastic since a one percent increase in
the price of a more expensive good has more significant income effect than a one percent change
in the price of a cheaper good.
74. Considering these factors that affect the price elasticity of demand, demand for
Internet services is likely to be inelastic. First, recent surveys of households in the U.S. indicate that
broadband is a necessity for Americans households.47 Second, there is generally no substitutes to
broadband and mobile Internet services.48 Third, the monthly U.S. median household bill for Internet
services is approximately $66,49 which equals approximately 1% of the monthly U.S. median
household income.50
47 See “Luxury or Necessity? The Public Makes a U-Turn,” (April 23, 2019) Pew Research, available at https://www.pewresearch.org/wp-content/uploads/sites/3/2010/10/luxury-or-necessity-2009.pdf 48 See “FCC faces backlash for saying Americans might not need fast home Internet,” (August 11, 2017) Ars Technica, available at https://arstechnica.com/information-technology/2017/08/mobile-broadband-cant-replace-fast-home-internet-americans-tell-fcc/ 49 See “Do You Pay Too Much for Internet Service? See How Your Bill Compares.,” (December 24, 2019) Wall Street Journal, available at https://www.wsj.com/articles/do-you-pay-too-much-for-internet-service-see-how-your-bill-compares-11577199600. 50 For U.S. median household income, see: “More Americans go without health insurance for the first time in a decade,” (September 10, 2019) USA Today, available at

41
75. When making inferences using the estimated price elasticity of demand from the
economic literature, it is also important to consider how the market is defined in a given study as
well as the timing of the data collected. For instance, if a study attempts to study demand elasticity
for different forms of Internet services such as cable, DSL etc., it is possible that the estimated
elasticities for each of these services is high since different forms of broadband services may serve
as substitutes to each other. Similarly, it is also possible that studies using data from earlier time
periods would find the demand for Internet to be more price-elastic as Internet may not have been a
necessity during early time periods.
76. Given this background information on price elasticity of demand, we now discuss
studies from the economic literature that show that the demand for Internet and telecommunications
services has been increasing and price elasticity of demand for Internet services has become more
price-inelastic over time.
B. Literature findings on demand elasticity of Internet services
77. There is a substantial literature studying the demand for Internet services by U.S.
households in the U.S. over the last two decades. The results of studies over the last two decades
suggest that demand for Internet services was price-inelastic and has become more and more price-
inelastic as Internet services is increasingly viewed by consumers as a “household necessity”
across time.51
78. The initial set of studies in the economics literature studying the demand for
Internet services used survey data from the late 1990s. The results of these studies found that the
https://www.usatoday.com/story/money/2019/09/10/median-household-income-stagnant-last-year-poverty-fell/2271025001/. 51 Dutz, M., Orszag, J., and Willig, R. (2009), “The Substantial Consumer Benefits of Broadband Connectivity for US Households,” Mimeo.

42
demand for Internet services in general was price-inelastic while the demand for high speed
Internet services such as broadband was more price-elastic. Particularly the first set of studies,
Kridel et al. (1999) and Kridel et al. (2001) found that the estimated price elasticity of demand for
Internet access was highly inelastic with values ranging “from -0.18 to -0.38”52 but the estimated
price elasticity of demand for high speed Internet such as broadband was price-elastic with values
ranging from -1.08 to -1.79.53 Kridel et al. (1999) explained the results of their study to imply that
“current drivers of Internet growth are non-price factors.”54 However, Kridel et al. (1999) noted
that their survey indicated that price could be an important factor when considering the demand
for high speed Internet services and the results of their subsequent study, Kridel et al. (2001)
corroborated these suspicions.
79. While, Kridel et al. (1999) and Kridel et al. (2001) found that the demand for high
speed Internet services was price-elastic, the studies didn’t explain reasons for their findings.
Varian (2002) followed these initial studies and used experimental data from the INDEX project
in 1999 to study the demand for higher bandwidth. Varian (2002) found that the demand for high-
speed Internet was price-elastic with ranges from -1.3 to -3.1 for different bandwidths of Internet.
Further, the results of Varian (2002) found that the estimated price elasticity of demand increased
52 Kridel, D.J., Rappoport, P.N., and Taylor, L.D. (1999), “An Econometric Study of the Demand for Access to the Internet”, in: The Future of the Telecommunications Industry: Forecasting and Demand Analysis, Topics in Regulatory Economics and Policy Series, vol. 33, ed. by Loomis, D.G., and Taylor, L.D., Springer, Boston, MA. 53 Kridel, D.J., Rappoport, P.N., and Taylor, L.D., (2002), “The Demand for High-Speed Access to the Internet: The Case of Cable Modems,” in: Forecasting the Internet: Understanding the Explosive Growth of Data Communications, ed. by Loomis, D.G., and Taylor, L.D., Kluwer Academic Publishers, Dordrecht. 54 Kridel, D.J., Rappoport, P.N., and Taylor, L.D. (1999), “An Econometric Study of the Demand for Access to the Internet”, in: The Future of the Telecommunications Industry: Forecasting and Demand Analysis, Topics in Regulatory Economics and Policy Series, vol. 33, ed. by Loomis, D.G., and Taylor, L.D., Springer, Boston, MA.

43
monotonically as the bandwidth of Internet increased from 16kbps to 32kbps to 64kbps to 96kbps.
Varian (2002) explained these results by stating that the demand for higher speed Internet services
such as broadband is price-elastic due to few applications being available during the time of the
study. So, Varian (2002) concluded that ordinary users do not have “good reason to pay a
premium…to get broadband access”55 given the current set of applications and unless “new
applications are forthcoming,”56 he does not expect demand for broadband to grow. High speed
Internet services were a relatively new form of Internet services around 2000. As discussed above,
since other cheaper Internet services are available as substitutes, one would expect that demand
for high speed Internet services are much more elastic than demand for Internet services as a whole.
80. Studies following Kridel et al. (1999, 2001) and Varian (2002) have found that the
demand for broadband is becoming more and more price-inelastic as broadband is becoming a
“household necessity.”57 Particularly, studies by Dutz et al. (2012) and Glass and Stefanova (2010)
estimate the price elasticity of demand for Internet over time and find concrete evidence supporting
this notion. For instance, Dutz et al. (2012) estimate price elasticity for broadband using survey
data from 2005 to 2009 and find that the price elasticity declines monotonically from -1.53 in 2005
to -0.69 in 200858. Similarly, Glass and Stefanova (2010) estimate price elasticity however using
a survey of subscribers in rural areas only during 2005 and 2009. Specifically, Glass and Stefanova
55 Varian, H., (2002), “The Demand for Bandwidth: Evidence from the INDEX Experiment,” in: Broadband: Should We Regulate High-Speed Internet Access? ed. by Alleman, J., and Crandall, R., Brookings Institution, Washington, DC. 56 Varian, H., (2002), “The Demand for Bandwidth: Evidence from the INDEX Experiment,” in: Broadband: Should We Regulate High-Speed Internet Access? ed. by Alleman, J., and Crandall, R., Brookings Institution, Washington, DC. 57 Dutz, M., Orszag, J., and Willig, R. (2012), “The Liftoff of Consumer Benefits from the Broadband Revolution,” Review of Network Economics, vol. 11(4). 58 Dutz, M., Orszag, J., and Willig, R. (2012), “The Liftoff of Consumer Benefits from the Broadband Revolution,” Review of Network Economics, vol. 11(4).

44
(2010) find that the estimated elasticity declines from -0.66 in 2005 to -0.21 in 200959 again
reinforcing the notion that the demand for broadband is becoming more and more inelastic over
time.
81. In summary, the results of the various studies above show that demand for Internet
services was price-inelastic and has become increasingly so over time.60 Dutz et al. (2012) state
that the reason as to why broadband is becoming more inelastic over time is because an increasing
number of households are considering broadband to be a necessity and thus users are less willing
to alter their purchase as the price of broadband changes.61 Glass and Stefanova (2010) offer
reasons as to why broadband is becoming a household necessity. Particularly, Glass and Stefanova
(2010) cite the increase in demand for the Internet due to Internet integrating various services such
as voice, data and video that have made it possible to “satisfy a wide variety of needs from
entertainment to education to healthcare.”62 The explanations offered by Glass and Stefanova
(2010) are consistent with Varian (2002) that the demand for Internet would grow when new
applications appear that spur the demand for higher bandwidths of Internet.
C. Demand effects of the proposed revision of the USF contribution methodology based on the estimated demand elasticities
82. The most recent estimate of the demand elasticity of broadband services across all
groups in the US is -0.69 for the year 2008 in Dutz et al. (2012). As discussed above, studies in
59 Glass, V., Stefanova, S. (2010), “An empirical study of broadband diffusion in rural America,” Journal of Regulatory Economics, vol. 38. 60 Consistent with Dutz et al. (2012) and Glass and Stefanova (2010), Carare et al. (2015) used survey data from 2011 and found that the price elasticity of demand non-adopters is inelastic with a value of -0.62. 61 Dutz, M., Orszag, J., and Willig, R. (2012), “The Liftoff of Consumer Benefits from the Broadband Revolution,” Review of Network Economics, vol. 11(4). 62 Glass, V., Stefanova, S. (2010), “An empirical study of broadband diffusion in rural America,” Journal of Regulatory Economics, vol. 38.

45
the literature suggest that demand elasticity of broadband services would be even lower today. In
Table 7 below, we show the expected percentage reduction in broadband services in response to
the proposed revision of the USF contribution methodology, when applying three different demand
elasticities. First, we use the estimate of -0.69 in 2008 from Dutz et al. (2012) as a conservative
estimate of demand elasticity today. Second, we extrapolate from the estimates of demand
elasticities in 2005-2008 in Dutz et al. (2012) to achieve an estimate of -0.05 demand elasticity in
2019. Third, as a comparison, we use the estimated elasticity for net discontinuation in Internet
service subscriptions from our survey as shown in Table 6.
TABLE 7 ESTIMATED PERCENTAGE REDUCTION IN DEMAND FOR INTERNET CONNECTIONS
AFTER THE PROPOSED USF SURCHARGE CHANGE
Specification Elasticity
Percentage change in total
service fees (%)
Percentage changes in
connections (%)
Based on 2008 estimated elasticity 0.69 1.58 1.09Based on 2019 estimated elasticity 0.05 1.58 0.08Based on 2019 survey elasticity 0.08 1.58 0.13
83. As shown in Table 7, estimated percentage reduction in demand for broadband
services based on 2019 estimates is approximately 0.1%. In Figure 7 below, we present the actual
and predicted number of broadband connections in the U.S. To evaluate the effect of the proposed
revision of the USF contribution methodology on broadband connections, we lower the predicted
number of broadband connection in the period 2020-2024 by the estimated percentage shown in
the last column of Table 7. As shown in the figure, the proposed revision of the USF contribution
methodology has negligible effect in deterring the expansion of broadband services.

46
FIGURE 7 PREDICTED U.S. INTERNET CONNECTIONS WITH AND WITHOUT THE PROPOSED USF SURCHARGE CHANGE
Source: Connections over 200 kbps in at least one direction in FCC Internet Access Services Reports. Note: The three predicted values of number Internet connections after the USF surcharge change are very close so that they overlay each other in the
figure.
47
VII. CONCLUSIONS
84. Our primary conclusions are as follows.
85. We examine from an economic perspective the effects of modifying and expanding
the “contribution base”—the supply of financial resources—for the Universal Service Fund (USF)
to include both voice and broadband connections. We investigate the economic effects of the
proposed contribution base modification and expansion on broadband adoption rates.
86. We conducted a survey that measures the effects on consumer broadband adoption
and retention caused by including broadband Internet access services in the contribution base. The
survey conducts a robust examination of consumer preferences and sensitivities.
87. We adhered to generally accepted principles of questionnaire design to minimize
the probability of various forms of “response bias,” which “occurs when respondents either
consciously or unconsciously tend to answer questions with a certain slant that misrepresents the
truth.”63
88. The economic literature supports the conclusion that the demand for broadband
connection has become more inelastic, i.e., less sensitive to price changes, over time.
89. The results of the survey support this conclusion. The estimated percentage
reduction in demand for broadband services is approximately 0.08% for every 1% increase in total
service fees.
90. This is a conservative estimate based the number of total accessible connections,
and does not take into account any other gains in broadband adoption that might be realized and
sustained as a result of programs supported by the USF.
63 Zikmund, W., D’Alessandro, S., Winzar, H., Lowe, B., and Babin, B. (2017), Marketing Research: Asia-Pacific Edition, Cengage.

48
May 7, 2020
________________________ Michael A. Williams
________________________ Wei Zhao

49
APPENDIX I: RESUMES
MICHAEL A. WILLIAMS
BERKELEY RESEARCH GROUP, LLC 2200 Powell Street, Suite 1200 | Emeryville, CA 94608
Direct: 510.874.5946
SUMMARY Michael Williams, PhD is a Managing Director at Berkeley Research Group, LLC (BRG). He specializes in analyses involving antitrust, industrial organization, and regulation. He has published articles in a number of academic journals, including the Proceedings of the National Academy of Sciences, American Economic Review, Journal of Industrial Economics, International Journal of Industrial Organization, Journal of Law and Economics, American Law and Economics Review, Journal of Economics and Management Strategy, Review of Industrial Organization, Journal of Institutional and Theoretical Economics, Economics Letters, Journal of Public Economic Theory, Behavioral Science, Antitrust Bulletin, Physica A, Texas Law Review, and Yale Journal on Regulation. Dr. Williams been retained as an economic consultant by the U.S. Department of Justice, Antitrust Division, the U.S. Federal Trade Commission, and the Canadian Competition Bureau. Previously, he was an economist with the U.S. Department of Justice, Antitrust Division. He holds a B.A. degree in economics from the University of California, Santa Barbara, and he received his M.A. and Ph.D. degrees in economics from the University of Chicago. He has provided written and/or oral testimony before:
United States District Court, Middle District of Alabama
United States District Court, Western District of Arkansas
United States District Court, Central, Northern, and Southern Districts of California
United States District Court, District of Delaware
United States District Court, Middle District of Florida
United States District Court, Northern District of Georgia
United States District Court, Eastern Division, District of Idaho

50
United States District Court, Northern District of Illinois
United States District Court, Southern District of Illinois
United States District Court, District of Kansas
United States District Court, District of Massachusetts
United States District Court, District of Minnesota
United States District Court, District of New Jersey
United States District Court, Southern District of New York
United States District Court, Eastern District of Pennsylvania
United States District Court, Eastern District of Tennessee
United States District Court, Northern and Southern Districts of Texas
United States District Court, District of Utah
United States Court of Federal Claims
State of Connecticut, Superior Court
State of New Mexico, Second Judicial District
State of Nevada, Gaming Commission and State Gaming Control Board
Public utilities commissions: Arkansas, Hawaii, Michigan, Minnesota, Missouri,
Nebraska, New Mexico, Texas, and Washington
The Netherlands, Amsterdam District Court
EDUCATION
Ph.D., Economics University of Chicago M.A., Economics University of Chicago B.A., Economics University of California, Santa Barbara
51
PRESENT POSITION
Managing Director, Berkeley Research Group, LLC
PREVIOUS POSITIONS
Director, Competition Economics, LLC Economist, U.S. Department of Justice, Antitrust Division
US DEPARTMENT OF JUSTICE CASES
MERGER INVESTIGATIONS
General Electric Company’s acquisition of RCA.
Westwood One, Inc.’s acquisition of NBC Radio.
Turner Broadcasting System, Inc.’s attempted acquisition of CBS.
Norfolk Southern, Inc.’s acquisition of North American Van Lines.
Cooper Industries, Inc.’s acquisition of Westinghouse Electric, Corp.’s Lighting Fixture Business.
Southwestern Public Service Company’s acquisition of New Mexico Electric Service
Company.
ITT-Continental Baking Company’s acquisition of Bost Bakery, Inc.
Williams Companies’ acquisition of Northwest Energy, Corp.
Archer-Daniel-Midland’s acquisition of Gold Kist’s Valdosta, Georgia soybean processing plant.
PRICE FIXING
United States of America v. Weeks Marine, Inc. CONSENT DECREES
United States of America v. Wallpaper Institute

52
United States of America v. Greyhound, Corp.
United States of America v. Balley Manufacturing, Corp. PUBLICATIONS ARTICLES 1. “Market Share Liability: Lessons from New Hampshire v. Exxon Mobil,” Journal of
Environmental Law and Litigation (2019), vol. 34, pp. 219-251 (with Justine S. Hastings). 2. “The Voting Rights of Ex-Felons and Election Outcomes in the United States,” International
Review of Law and Economics (2019), vol. 59, pp. 40-56 (with Tilman Klumpp and Hugo M. Mialon).
3. “Masters of the Universe: Bid Rigging by Private Equity Firms in Multibillion Dollar
LBOs,” University of Cincinnati Law Review (2018), vol. 87, pp. 29-76 (with Christopher M. Burke, Stephanie A. Hackett, David W. Mitchell, Simon J. Wilke, Melanie Stallings Williams, and Wei Zhao).
4. “Rules of Evidence and Liability in Contract Litigation: The Efficiency of the General
Dynamics Rule,” Journal of Public Economic Theory (2017), vol. 19, pp. 1154–1165 (with Vlad Radoias and Simon J. Wilkie).
5. “The OPEC of Potatoes: Should Collusive Agricultural Production Restrictions Be Immune
From Antitrust Law Enforcement?,” Virginia Law & Business Review (2017), vol. 11, pp. 399-450 (with Melanie Stallings Williams and Wei Zhao).
6. “Global Evidence on the Distribution of GDP Growth Rates,” Physica A (2017), vol. 468, pp.
750-758 (with Grace Baek, Yiyang Li, Leslie Y. Park, and Wei Zhao). 7. “What is a But-For World?,” Antitrust (2016), vol. 31, pp. 102-108 (with Justine S.
Hastings). 8. “The Business of American Democracy: Citizens United, Independent Spending, and
Elections,” Journal of Law and Economics (2016), vol. 59, pp. 1-43 (with Tilman Klumpp and Hugo M. Mialon) (lead article).
9. “Global Evidence on the Distribution of Economic Profit Rates,” Physica A (2016), vol. 458,
pp. 356-363 (with Grace Baek, Leslie Y. Park and Wei Zhao). 10. “Fraud Cycles,” Journal of Institutional and Theoretical Economics (2016), vol. 172, pp.
544-572 (with R. Preston McAfee and Jiong Gong).
53
11. “Counterintuitive Signs in Reduced Form Price Regressions,” ABA Economics Committee Newsletter (2016), vol. 16, pp. 7-19 (with Yonghong An and Wei Zhao) (lead article).
12. “Brief of Economists and Other Social Scientists as Amici Curiae in Support of
Respondents,” Tyson Foods, Inc. v. Peg Bouaphakeo, et al., U.S. Supreme Court No. 14-1146, September 29, 2015. Cited in Opinion of the Court, 577 U.S. ___ (2016).
13. “Leveling the Playing Field? The Role of Public Campaign Funding in Elections,” American
Law and Economics Review (2015), vol. 17, pp. 361-408 (with Tilman Klumpp and Hugo M. Mialon) (lead article) (awarded 2015 Distinguished Article Prize).
14. “Global Evidence on the Distribution of Firm Growth Rates,” Physica A (2015), vol. 432, pp.
102-107 (with Brijesh P. Pinto and David Park). 15. “The Deterrent Effect of Cable System Clustering on Overbuilders: An Economic Analysis
of Behrend v. Comcast,” Economics Bulletin (2015), vol. 35, pp. 519-527 (with Philip J. Reny).
16. “Auctions and Bid Rigging,” in Oxford Handbook on International Antitrust Economics
(2015), vol. 2, eds. Roger D. Blair and D. Daniel Sokol, Oxford University Press, Chapter 20, pp. 498-522 (with Ken Hendricks and R. Preston McAfee).
17. “Evaluating Big Deal Journal Bundles,” Proceedings of the National Academy of Sciences
(2014), vol. 111, no. 26, pp. 9425-9430 (with Theodore C. Bergstrom, Paul N. Courant, and R. Preston McAfee).
18. Book Review, Cartels, Competition and Public Procurement. Law and Economics
Approaches to Bid Rigging, by Stefan E. Weishaar, Journal of Economic Literature (2014), vol. 52, pp. 548-549 (with Brijesh P. Pinto).
19. “Oracle’s Acquisition of PeopleSoft: U.S. v. Oracle,” in The Antitrust Revolution:
Economics, Competition, and Policy (2014), eds. John E. Kowka and Lawrence J. White, Oxford University Press, 6th ed. (with R. Preston McAfee and David S. Sibley).
20. “Predatory Hiring as Exclusionary Conduct: A New Perspective,” Pepperdine Journal of
Business, Entrepreneurship, and the Law (2013), vol. 7, pp. 1-25 (with Richard L. Braun) (lead article).
21. “Tax Incidence Under Imperfect Competition: Comment,” International Journal of
Industrial Organization (2012), vol. 30, pp. 399-402 (with Philip J. Reny and Simon J. Wilkie) (lead article).
22. “China’s Anti-Monopoly Law: What is the Welfare Standard?,” Review of Industrial
Organization (2012), vol. 41, pp. 31-52 (with Pingping Shan, Guofu Tan, and Simon J. Wilkie).

54
23. “Estimating Monopoly Power with Economic Profits,” UC Davis Business Law Journal (2010), vol. 10, pp. 125-150 (with Kevin Kreitzman, Melanie Stallings Williams, and William M. Havens).
24. Book Review, Truth or Economics: On the Definition, Prediction, and Relevance of
Economic Efficiency, by Richard S. Markovits, Journal of Economic Literature (2009), vol. 47, pp. 1133-1135.
25. “Interpreting Concentration Indices in the Secondary Market for Natural Gas Transportation:
The Implication of Pipeline Residual Rights,” Energy Economics (2008), vol. 30, pp. 807-817 (with Michael J. Doane, R. Preston McAfee, and Ashish Nayyar).
26. “Evaluating the Likely Competitive Effects of Horizontal and Vertical Mergers: A New
Approach,” Antitrust Report (2007) Issue 2, pp. 33-40 (with Ken Hendricks and R. Preston McAfee).
27. “Report on Petroleum Products Markets in the Northeast,” prepared for the Attorneys
General of Maine, Massachusetts, New Hampshire, New York, and Vermont (2007) (with Justine S. Hastings and Michael L. Mitton).
28. “Assigning Market Shares in Technology Markets: Why 1/N is Rarely the Right Answer,”
ABA Economics Committee Newsletter (2006) vol. 6, pp. 11-16 (with Ashish Nayyar). 29. “Evaluating and Enhancing Competition in the Interstate Natural Gas Transportation
Industry,” Natural Resources Journal (2004) vol. 44, pp. 761-808 (with Michael J. Doane and R. Preston McAfee).
30. “Pricing Access to a Monopoly Input,” Journal of Public Economic Theory (2004) vol. 6, pp.
541-555 (with David S. Sibley, Michael J. Doane, and Shu-Yi Tsai). 31. “What is a Barrier to Entry?,” American Economic Review (2004) vol. 94, pp. 461-465 (with
R. Preston McAfee and Hugo Mialon). 32. Deregulation of Entry in Long-Distance Telecommunications (2002), Institute of Public
Utilities, Michigan State University (with Paul W. MacAvoy). 33. “The Costs and Benefits of Long-Distance Entry: Regulation and Non-Price Discrimination,”
Review of Industrial Organization (2001) vol. 18, pp., 275-282 (with Dennis L. Weisman). 34. “Measuring Anticompetitive Effects of Mergers When Buyer Power is Concentrated,” Texas
Law Review, (2001) vol. 79, no. 6, pp. 1621-1639 (with Ken Hendricks, Joshua M. Fried, R. Preston McAfee, and Melanie Stallings Williams).

55
35. “Collusive Bidding in the Market for Corporate Control,” Nebraska Law Review, (2000) vol. 79, no. 1, pp. 48-74 (with Joshua M. Fried, R. Preston McAfee, and Melanie Stallings Williams).
36. “Having Your Cake—How to Preserve Universal-Service Cross Subsidies While Facilitating
Competitive Entry,” Yale Journal on Regulation, (1999) vol. 16, no. 2, pp. 311-326 (with Michael J. Doane and David S. Sibley).
37. “Four Decades of Regulatory Reform of the Gas Industry,” Oil & Gas Tax Quarterly, (1996)
vol. 45, no. 31-58 (with Paul W. MacAvoy and Michael J. Doane). 38. “Software Mergers: An Economic Perspective,” American Bar Association, Computer
Industry Committee, (1995) vol. 2, no. 3, pp. 7-9. 39. “Competitive Entry into Regulated Monopoly Services and the Problem of Stranded Costs,”
Hume Papers on Public Policy, (1995) (with Michael J. Doane). 40. “Collusive Bidding in Hostile Takeovers,” Journal of Economics and Management Strategy,
(1993) vol. 2, no. 4, pp. 449-482, (with R. Preston McAfee, Daniel Vincent, and Melanie Williams Havens) (lead article).
41. “The Renaissance of Market Definition,” The Antitrust Bulletin, (1993) vol. 38, no. 4, pp.
799-857, (with Joseph J. Simons). 42. “Horizontal Mergers in Spatially Differentiated Noncooperative Markets,” Journal of
Industrial Economics, (1992) vol. 40, no. 4, pp. 349-358, (with R. Preston McAfee and Joseph J. Simons) (lead article).
43. “Recent Developments in Economic Theory Regarding the Competitive Effects of Horizontal
Mergers,” International Merger Law (1992) (with R. Preston McAfee). 44. “Horizontal Mergers and Antitrust Policy,” Journal of Industrial Economics, (1992) vol. 40,
no. 2, pp. 181-188 (with R. Preston McAfee). 45. “New U.S. Merger Enforcement Guidelines: Competitive Effects,” International Merger
Law, (1992) no. 21, pp. 6-9 (with R. Preston McAfee and Joseph J. Simons). 46. “On What Economic Grounds Should Horizontal Mergers Be Challenged?,” International
Merger Law, (1991) no. 7, pp. 16-18 (with R. Preston McAfee). 47. “Why Did So Many Savings and Loans Go Bankrupt?,” Economics Letters, (1991) vol. 36,
no. 1, pp. 61-66 (with Harindra de Silva, Michael F. Koehn, and Stanley I. Ornstein).

56
48. “Consumer Welfare Loss: The Unawarded Damages in Antitrust Suits,” University of Dayton Law Review, (1990) vol. 15, no. 3, pp. 457-470 (with Melanie Williams Havens and Michael F. Koehn).
49. “Concentration, Potential Entry, and Performance in the Airline Industry,” Journal of
Industrial Economics, (1989) vol. 38, no. 2, pp. 119-139 (with Gloria J. Hurdle, Richard L. Johnson, Andrew S. Joskow, and Gregory J. Werden) (lead article).
50. “The Department of Justice Merger Guidelines: A Critique and a Proposed Improvement,”
Pepperdine Law Review, (1989) vol. 16, no. 4, pp. 1069-1081 (with R. Preston McAfee). 51. “Can the Concentration-Collusion Hypothesis Be Refuted Empirically?,” Economics Letters,
(1989) vol. 30, no. 3, pp. 253-257 (with Gregory J. Werden). 52. “The Role of Stock Market Studies in Formulating Antitrust Policy Toward Horizontal
Mergers,” Quarterly Journal of Business and Economics, (1989) vol. 28, no. 4, pp. 3-21 (with Gregory J. Werden).
53. “The Role of Stock Market Studies in Formulating Antitrust Policy Toward Horizontal
Mergers: Reply,” Quarterly Journal of Business and Economics, (1989) vol. 28, no. 4, pp. 39-42 (with Gregory J. Werden).
54. “Can Event Studies Detect Anticompetitive Mergers?,” Economics Letters, (1988) vol. 28,
no. 2, pp. 199-203 (with R. Preston McAfee). 55. “An Empirical Test of Cooperative Game Solution Concepts,” Behavioral Science, (1988)
vol. 33, no. 3, pp. 224-237. 56. “Output-Inflation Tradeoffs in 34 Countries: Comment,” Journal of Economics and Business,
(1988) vol. 40, no. 1, pp. 97-101 (with Michael G. Baumann). 57. “Explaining and Predicting Airline Yields With Nonparametric Regression Trees,”
Economics Letters, (1987) vol. 24, no. 1, pp. 99-105 (with Andrew S. Joskow, Richard L. Johnson, and Gloria J. Hurdle).
58. “Rankings of Economics Departments By Field,” American Economist, (1987) vol. 31, no. 1,
pp. 56-61 (with Michael G. Baumann and Gregory J. Werden). 91.

57
59. “International Evidence on Output-Inflation Tradeoffs: A Bootstrap Analysis,” Economics
Letters, (1986) vol. 21, no. 2, pp. 149-153 (with Michael G. Baumann). 60. “An Economic Application of Bootstrap Statistical Methods: Addyston Pipe Revisited,”
American Economist (1986) vol. 30, no. 2, pp. 52-58.
61. “Bootstrap Statistical Analysis of Time-Series Regressions,” SAS Communications, (1986) vol. 11, no. 3 (with Michael G. Baumann).
62. “On the Demise of the Telephone Network and Why It Happened,” Public Utilities
Fortnightly, (1986) vol. 118, no. 5, p. 6.
CONTRIBUTIONS, U.S. DEPARTMENT OF JUSTICE REPORTS 1. Reply Comments of the U.S. Department of Justice Before the Federal Communications
Commission, “Policy and Rules Concerning Rates for Dominant Carriers,” Docket No. 87-313, December 11, 1987.
2. Comments of the U.S. Department of Justice Before the Federal Communications
Commission, “The Bell Atlantic Telephone Companies’ Offer of Comparably Efficient Interconnection to Enhanced Service Providers,” Docket No. 85-229, June 15, 1987.
3. Comments of the U.S. Department of Justice Before the Federal Communications
Commission, “Decreased Regulation of Certain Basic Telecommunications Services,” Docket No. 86-421, March 6, 1987.
4. Comments of the U.S. Department of Justice Before the Securities and Exchange
Commission, “Self-Regulatory Organizations: Proposed Rule Change by New York Stock Exchange, Inc. Relating to Amendments to the Exchange’s Voting Rights Listing Standards for Domestic Companies,” File No. SR-NYSE-86-17, December 5, 1986.
5. Comments of the U.S. Department of Justice Before the Securities and Exchange
Commission, “Concept Release on Takeovers and Contests for Corporate Control,” File No. 57-18-86, October 17, 1986.
6. Comments of the U.S. Department of Justice Before the Federal Communications
Commission, “Amendment of Section 64.702 of the Commission’s Rules and Regulations (Third Computer Inquiry),” Docket No. 85-229 Phase II, August 8, 1986.
7. Comments of the U.S. Department of Justice Before the Federal Communications
Commission, “Separation of Costs of Nonregulated Activities,” Docket No. 86-111, July 30, 1986.

58
8. Comments of the U.S. Department of Justice Before the United States Postal Service, “Restrictions on Private Carriage of Letters; Proposed Suspension of the Private Express Statutes; International Remailing,” July 17, 1986.
9. Comments of the U.S. Department of Justice Before the Federal Communications
Commission, “Separation of Costs of Regulated Telephone Service From Costs of Nonregulated Activities,” Docket No. 86-111, June 30, 1986.
10. Comments of the U.S. Department of Justice Before the United States Postal Service,
“International Priority Airmail Service,” June 9, 1986. 11. Comments of the U.S. Department of Justice Before the United States Postal Service,
“Restrictions on Private Carriage of Letters; Proposed Clarification and Modification of Definition and of Regulations on Extremely Urgent Letters,” December 12, 1985.
12. Notice of Intervention of the U.S. Department of Justice as a Limited Participator and
Opposition to USPS Motion for Waiver, “Destination–BMC Parcel Post Classification and Rate Changes (Experiment),” November 22, 1985.
13. Comments of the U.S. Department of Justice Before the Federal Communications
Commission, “Investigation of Access and Divestiture Related Tariffs,” Docket No. 83-1145, April 8, 1985.

59
WEI ZHAO
BERKELEY RESEARCH GROUP, LLC 2200 Powell Street, Suite 1200 | Emeryville, CA 94608
Direct: 510-550-7147
SUMMARY
Wei Zhao specializes in analyses involving price-fixing, mergers, and product-liability matters. He has been a consultant to the US Department of Justice, Federal Trade Commission, and Canadian Competition Bureau, as well as many leading law firms in the United States. He has testified in the United States District Court, Northern District of Georgia. He holds a Ph.D. in economics from the Johns Hopkins University. He has published articles in a number of academic journals, including RAND Journal of Economics, Mathematical Social Sciences, Review of Industrial Organization, Physica A, Virginia Law & Business Review, University of Cincinnati Law Review, ABA Economics Committee Newsletter, Financial Theory and Practice, and Journal of Henan University of Finance and Economics. He taught courses for M.A. in Applied Economics at Johns Hopkins University in 2011-2013.
PRESENT EMPLOYMENT Director, Berkeley Research Group, LLC
PREVIOUS POSITIONS Director, Competition Economics, LLC
PUBLICATIONS 1. “Dynamic Efficiencies of the 1997 Boeing-McDonnell Douglas Merger” (with Yonghong
An), RAND Journal of Economics, 50 (2019), pp. 666-694. 2. “Vertical Contracts That Reference Rivals” (with David Sibley and Fan Liu), Review of
Industrial Organization (2019). 3. “Masters of the Universe: Bid Rigging by Private Equity Firms in Multibillion Dollar LBOs”
(with Christopher M. Burke, Stephanie A. Hackett, David W. Mitchell, Simon J. Wilke, Melanie Stallings Williams, and Michael A. Williams), University of Cincinnati Law Review, 87(2018), pp. 29-76.

60
4. “The OPEC of Potatoes: Should Collusive Agricultural Production Restrictions Be Immune From Antitrust Law Enforcement?” (with Melanie Stallings Williams and Michael A. Williams), Virginia Law & Business Review, 11(2017), vol. 2, pp. 399-450.
5. “Global Evidence on the Distribution of GDP Growth Rates” (with Grace Baek, Yiyang Li,
Leslie Y. Park and Michael A. Williams), Physica A (2017), vol. 468, pp. 750-758. 6. “Global Evidence on the Distribution of Economic Profit Rates” (with Grace Baek, Leslie Y.
Park and Michael A. Williams), Physica A (2016), vol. 458, pp. 356-363. 7. “Counterintuitive Signs in Reduced Form Price Regressions” (with Yonghong An and
Michael A. Williams), ABA Economics Committee Newsletter (2016), vol. 16, pp. 7-19 (lead article).
8. “Signaling and Tacit Collusion in an Infinitely Repeated Prisoners’ Dilemma” (with Joseph
E. Harrington, Jr.), Mathematical Social Sciences, 64(2012), pp. 277-289. 9. “An Empirical Framework for Exclusive Discount”, working paper. 10. “Price-Match Guarantees and Margin Protection Programs” (with Xiao Fu, Guofu Tan, and
Michael A. Williams), working paper. 11. “How Much is Access to Employer-Provided Health Insurance Worth? Household Joint
Decision-Making in a Job-Search Framework” (with Yiyang Li), working paper. 12. “A Generalized Framework for Correction Term Method with an Application to Chain Store
Mergers” (with Yonghong An, Yizao Liu, and Michael A. Williams), in progress. 13. “Feasibility Study of Launching Short Selling Mechanism in China Stock Market” (with
Yiyang Li), Financial Theory and Practice, (2006) Vol. 319. 14. “A New Approach to Analyzing the Financing Problem of Small and Medium Size
Enterprises in China Based on Information Asymmetry” (with Yiyang Li), Journal of Henan University of Finance and Economics, 2006(2)
SELECTED CASE WORK 1. UNITED STATES DISTRICT COURT, MIDDLE DISTRICT OF FLORIDA
In Re: Disposable Contact Lens Antitrust Litigation (2017-2019).
2. THE NETHERLANDS, AMSTERDAM DISTRICT COURT Unilever et al./Smurfit Kappa, DS Smith et al. (Cardboard) (2019).
3. THE NETHERLANDS, AMSTERDAM DISTRICT COURT Follow-on-damages proceeding further to decisions of the European Commission (AT.39824 –Trucks) (2019).

61
4. UNITED STATES DISTRICT COURT FOR THE NORTHERN DISTRICT OF ILLINOIS In Re: Dealer Management Systems Antitrust Litigation (2019).
5. UNITED STATES DISTRICT COURT, NORTHERN DISTRICT OF CALIFORNIA In Re: Capacitors Antitrust Litigation (2019).
6. UNITED STATES DISTRICT COURT, DISTRICT OF MASSACHUSETTS Malden Transportation, Inc., et al., v. Uber Technologies, Inc., and Rasier, LLC (2019).
7. UNITED STATES DISTRICT COURT, SOUTHERN DISTRICT OF CALIFORNIA In Re: Packaged Seafood Products Antitrust Litigation (2018-2019).
8. UNITED STATES DISTRICT COURT, EASTERN DISTRICT OF MICHIGAN, SOUTHERN DIVISION In Re: FCA US LLC Monostable Electronic Gearshift Litigation (2018-2019)
9. UNITED STATES DISTRICT COURT, EASTERN DISTRICT OF MICHIGAN, SOUTHERN DIVISION Health Alliance Plan of Michigan, et al., v. BCBS of Michigan (2018-2019)
10. UNITED STATES DISTRICT COURT, CENTRAL DISTRICT OF CALIFORNIA Grasshopper House, LLC v. Clean & Sober Media LLC, et al. (2018-2019).
11. UNITED STATES DISTRICT COURT, SOUTHERN DISTRICT OF ILLINOIS Brian Flynn et al. v. FCA US LLC and Harmon International Industries, Inc. (2017-2019).
12. UNITED STATES DISTRICT COURT, SOUTHERN DISTRICT OF NEW YORK Alaska Electrical Pension Fund, et al., v. Bank of America, N.A., et al. (2017-2018).
13. AMERICAN ARBITRATION ASSOCIATION, COMMERCIAL PANEL CVS Health Corporation, et al. v. HMC, LLC f/k/a HM Compounding Services,) LL, et al. (2018).
14. UNITED STATES DISTRICT COURT, NORTHERN DISTRICT OF CALIFORNIA, SAN JOSE DIVISION Christina Grace and Ken Potter, et al. v. Apple, Inc. (2018).
15. UNITED STATES DISTRICT COURT, NORTHERN DISTRICT OF OHIO, EASTERN DIVISION
Greg Herrick et al., v. National Football League, National Football Museum, Inc. dba Pro Football Hall of Fame (2017).
16. UNITED STATES DISTRICT COURT, SOUTHERN DISTRICT OF NEW YORK In Re Aluminum Warehousing Antitrust Litigation (2016-2019).
17. UNITED STATES DISTRICT COURT, NORTHERN DISTRICT OF GEORGIA United States of America v. Godfrey Ilonzo, et al. (2016-2017).
62
18. UNITED STATES DISTRICT COURT, EASTERN DISTRICT OF TENNESSEE In Re Cast Iron SOIL PIPE and Fittings Antitrust Litigation (2016-2017).
19. UNITED STATES DISTRICT COURT, CENTRAL DISTRICT OF CALIFORNIA Bahamas Surgery Center, LLC, Rep et al. v. Kimberly-Clark Corporation and Halyard Health, Inc. (2016-2017).
20. UNITED STATES DISTRICT COURT, WESTERN DISTRICT OF TEXAS Marissa Maderazo, et al., v. VHS San Antonio Partners, et al. (2015-2016).
21. UNITED STATES DISTRICT COURT, CENTRAL DISTRICT OF CALIFORNIA Zenith Electronics, LLC, Panasonic Corporation, and U.S. Phillips Corporation v. Sceptre, Inc. (2015-2016).
22. UNITED STATES DISTRICT COURT, DISTRICT OF MINNESOTA The Valspar Corporation and Valspar Sourcing, Inc. v. Millennium Inorganic Chemicals, et al. (2014-2015).
23. UNITED STATES DISTRICT COURT, DISTRICT OF NEW JERSEY Gary Marchese, et al. v. Cablevision Systems Corp. (2014-2015).
24. UNITED STATES DISTRICT COURT, WESTERN DISTRICT OF OKLAHOMA Richard Healy, et al. v. Cox Communications, Inc. (2013-2015).
25. UNITED STATES DISTRICT COURT, DISTRICT OF IDAHO In Re Fresh and Process Potatoes Antitrust Litigation (2013-2015).
26. UNITED STATES DISTRICT COURT, DISTRICT OF MASSACHUSETTS Kirk Dahl, et al., v. Bain Capital Partners, LLC, et al. (2013-2014).
27. CANADIAN COMPETITION BUREAU Economic analysis of Loblaws’ proposed acquisition of Shoppers Drug Mart Corporation (2013).
28. U.S. FEDERAL TRADE COMMISSION Economic Analysis of Community Health Services’ proposed acquisition of Health Management Services, Inc. (2013).
29. CANADIAN COMPETITION BUREAU Economic analysis of Canadian Tire Corporation’s proposed acquisition of Pro Hockey Life Sporting Goods, Inc. (2013).
30. STATE OF NEW MEXICO, SECOND JUDICIAL DISTRICT Guidance Endodontics, LLC and Dr. Charles Goodis v. Modrall, Sperling, Harris & Sisk, P.A., Olshan, Grundman, Frome, Rosenzweig & Wolosky, LLP (2013).

63
APPENDIX II: SURVEY DESIGN
Survey Questionnaire
2019 USF Survey
This questionnaire format follows the convention that any skip patterns are indicated immediately to the right of the code for each response. When no question number is indicated to the right of a code, the interview just proceeds to the next-numbered question. Instructions in italics are shown to the respondent, while subheads like this and instructions in bold italics are intended for the programmer alone; like the question numbers, they do not appear on the screen. Similarly, the numeric response codes shown in this version will be replaced by an appropriate selection mechanism (e.g., checkboxes, radio buttons, drop-down lists). And except where otherwise indicated, each question appears as a separate screen.
Screener section
Sampling criteria are specified in the file “Sample criteria.xlsx.” Emailed invitations to participate are to be sent only to those members of the host panel (“HP”) who meet all of the criteria. Following this screener, HP will also control sample outgo by sex, age, region, and HH income to reflect Census distributions.
Verifying qualifications
Ask all [Qs.S1-S3 may appear consecutively on the same page]:
S1 What is your gender? [select one only]
Male, 1 Female 2
S2 What is your age?[Can ask as open end or in groupings – if open end, create hidden question to bucket age groups]
Less than 18 --TERMINATE 18-24 1 25-34 2 35-44 3 45-54 4 55-64 5
65+ 6 S3 What is your 5-digit zip code? [Hidden: Please add variables for state and census region based on the zip
code.]
Five-digit zip code: ____ S4 CAPTCHA challenge question, per HP usual practice.
Check Q.S1-S3 responses for consistency with known characteristics of this individual panel member. If age calculated based on 22 is under 18, then terminate respondent. Allow for three attempts to succeed at the CAPTCHA challenge. If inconsistent within any other agreed tolerances, or fails CAPTCHA challenge more than three times, skip to Q.S18. Otherwise, continue with Q.S9.

64
Ask all passing Q.S1-S3 checks:
S5 Which of these statements best describes your employment status? [select one only]
Employed full-time 1 Employed part-time 2 Self-employed 3 A full-time homemaker 4 Unemployed 5 Retired 6 A student 7
S6 Are you of Hispanic or Latino origin? [select one only]
Yes, I am of Hispanic or Latino origin 1 No 2
S7 What is your race or ethnic background? [select one only]
White or Caucasian 1 Black or African American 2 Asian or Asian American 3 American Indian, Alaska Native, Native Hawaiian or other Pacific Islander 4 Some other ethnicity X
S8 Which of the following best represents your annual household income last year (before taxes)? [select one only]
Less than $25,000 1 $25,000 to $49,999 2 $50,000 to $75,999 3 $75,000 to $100,999 4 $100,000 to $149,999 5 $150,000 to $199,999 6 $200,000+ 7
S9 Including yourself, how many people live in your household?
(S9a) Adults, aged 18 or older: ____ [RANGE 1-15] (S9b) Aged 17 or younger: ____ [RANGE 0-15] (S9c) [Insert self-totaling entry] Total: ____
Check Q.S9c>0 before continuing, and have respondent correct if necessary.

65
S10 Which of the options below best describes the place where you live? [select one only]
A large metropolitan area (over 1 million people) 1 A large city (100,000 up to 1 million people) 2 A small city or town (10,000 to 100,000 people) 3 A very small town or rural area (under 10,000 people) 4 I’m not sure X
S11 Do you [Q.S9a>1: (or any other adult in your household)] work in any of the following industries? [Select all that apply.] [Randomize the order of codes 1-7.]
Agriculture; farming 1 [below] Food preparation; restaurants 2 [below]
Building; construction; housing 3 [below] Advertising; marketing; market research 4 [Q.S18]
Telecommunication service providers 5 [Q.S18] Electronic equipment manufacture, sales, or repair 6 [below]
Retailing 7 [below] [No other codes] None of the above industries 8 [below]
If the answer to Q.S11 contains either 4 or 5, skip to Q.S18. Otherwise, continue with Q.S12.
Display the information below:
This survey is about the voice services and broadband internet/data services to which [Q.S9c>1: your household currently subscribes./Q.S9c=1: you currently subscribe.].
By “voice services,” we mean
any in-home landline or VoIP telephone voice service, or any cellphone voice service.
By “broadband internet/data services,” we mean
any in-home broadband internet service (including DSL, Fiber, Cable, fixed wireless, and satellite), or any cellphone internet/data service (including cellphone data plans and wireless hotspots).
If respondent is the sole household adult [Q.S9a=1], set Q.S12 =1 without asking, and skip now to Q.S14. Ask all remaining respondents in households with more than one adult [Q.S9a>1]:
S12 For your household’s current in-home or cellphone internet/data services, which of these statements best describes your own role in that decision? [Select one only.] [Reverse the presentation order of codes 1-3 for alternate respondents.]
I was the primary decision maker for at least one of the internet/data services 1
I shared in the decision, with other household members, for at least one of the internet/data services 2 I was not personally involved in the decision for any internet/data services 3 I’m not sure X
If Q.S12 =3 or X, continue to Q.S18. Otherwise, skip now to Q.8a.
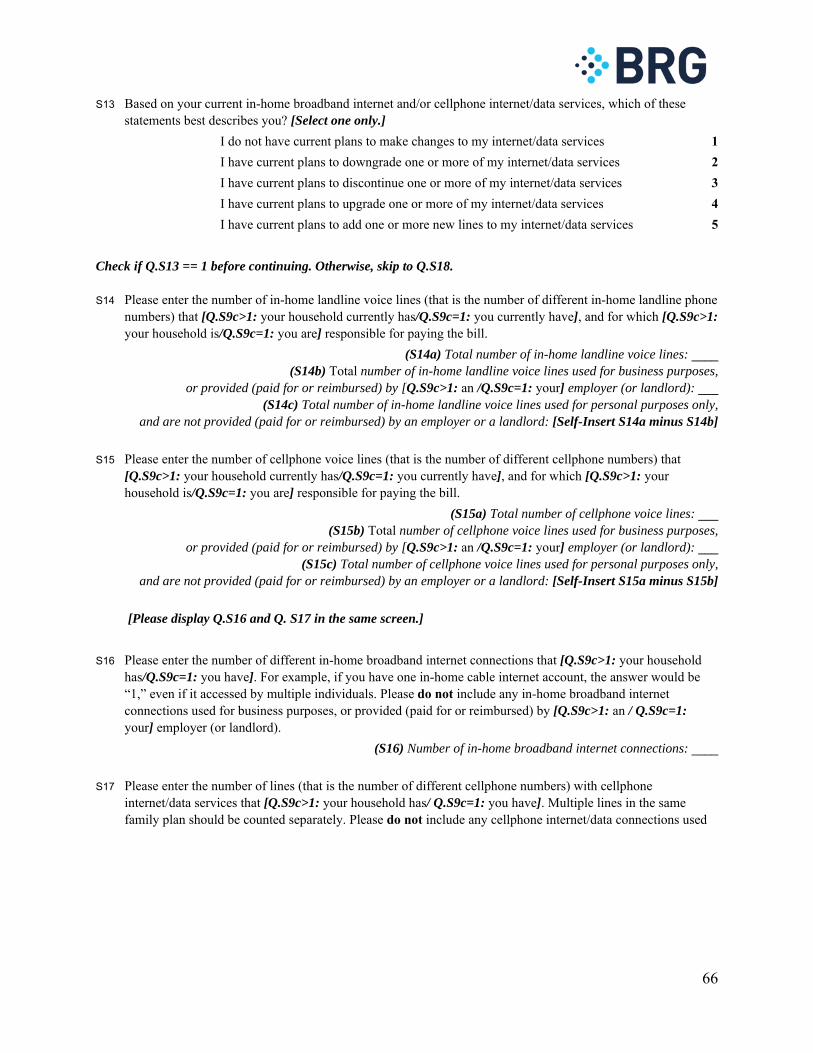
66
S13 Based on your current in-home broadband internet and/or cellphone internet/data services, which of these statements best describes you? [Select one only.]
I do not have current plans to make changes to my internet/data services 1
I have current plans to downgrade one or more of my internet/data services 2
I have current plans to discontinue one or more of my internet/data services 3
I have current plans to upgrade one or more of my internet/data services 4
I have current plans to add one or more new lines to my internet/data services 5
Check if Q.S13 == 1 before continuing. Otherwise, skip to Q.S18. S14 Please enter the number of in-home landline voice lines (that is the number of different in-home landline phone
numbers) that [Q.S9c>1: your household currently has/Q.S9c=1: you currently have], and for which [Q.S9c>1: your household is/Q.S9c=1: you are] responsible for paying the bill.
(S14a) Total number of in-home landline voice lines: ____ (S14b) Total number of in-home landline voice lines used for business purposes,
or provided (paid for or reimbursed) by [Q.S9c>1: an /Q.S9c=1: your] employer (or landlord): ___ (S14c) Total number of in-home landline voice lines used for personal purposes only,
and are not provided (paid for or reimbursed) by an employer or a landlord: [Self-Insert S14a minus S14b]
S15 Please enter the number of cellphone voice lines (that is the number of different cellphone numbers) that [Q.S9c>1: your household currently has/Q.S9c=1: you currently have], and for which [Q.S9c>1: your household is/Q.S9c=1: you are] responsible for paying the bill.
(S15a) Total number of cellphone voice lines: ___ (S15b) Total number of cellphone voice lines used for business purposes,
or provided (paid for or reimbursed) by [Q.S9c>1: an /Q.S9c=1: your] employer (or landlord): ___ (S15c) Total number of cellphone voice lines used for personal purposes only,
and are not provided (paid for or reimbursed) by an employer or a landlord: [Self-Insert S15a minus S15b]
[Please display Q.S16 and Q. S17 in the same screen.]
S16 Please enter the number of different in-home broadband internet connections that [Q.S9c>1: your household has/Q.S9c=1: you have]. For example, if you have one in-home cable internet account, the answer would be “1,” even if it accessed by multiple individuals. Please do not include any in-home broadband internet connections used for business purposes, or provided (paid for or reimbursed) by [Q.S9c>1: an / Q.S9c=1: your] employer (or landlord).
(S16) Number of in-home broadband internet connections: ____
S17 Please enter the number of lines (that is the number of different cellphone numbers) with cellphone internet/data services that [Q.S9c>1: your household has/ Q.S9c=1: you have]. Multiple lines in the same family plan should be counted separately. Please do not include any cellphone internet/data connections used
67
for business purposes, or provided (paid for or reimbursed) by [Q.S9c>1: an / Q.S9c=1: your] employer (or landlord).
(S17a) Number of lines (that is the number of different cellphone numbers) with cellphone internet/data services: ____
(S17b) [Insert total of S16 and S17a] Total broadband internet lines/connections: ____
Check Q. S14c + Q.S15c + S17b>0 before continuing. Otherwise, skip to Q.S18.
Termination for unqualified respondents Show to all unqualified respondents (tailoring to HP practice and language):
S18 Our survey has already interviewed enough people in your category, so we’re sorry that you do not qualify to complete this particular survey. Thank you for your time. [Terminate, and retain all screener responses in a “not qualified” file.]

68
Main section SV details
Timestamp here. Show to all qualifying for the survey:
1 From what you have told us, you qualify for our survey. The survey will take you approximately 5 to 10 minutes to complete. As always, your answers will be kept strictly confidential and you will not be individually identified.
Please think about the monthly voice and/or broadband bills that [Q.S9c>1: your household is./ Q.S9c=1: you are] responsible for paying for personal (non-business) sevices. [Don’t count any bill that covers only voice or broadband services provided to a business.]
In total, how many different bills do you have to pay each month that include voice or broadband services for personal use?
(1) Total number of different bills: ____
If Q.1<1 display error message “You have previous indicated that [Q.S9c>1: your household has./ Q.S9c=1: you have] at least one voice or internet/data services that [Q.S9c>1: your household is./ Q.S9c=1: you are] responsible for paying for personal (non-business) sevices. Please enter a positive number of bills associated with these services” and do not allow them to proceed to the next question until Q.1>0 or the maximum number of errors is reached. If the maximum number of errors is reached, set 1 to -99 and proceed to the next question.
2 You have previously indicated that [Q.S9c>1: your household is/ Q.S9c=1: you are] personally responsible
for
[Q.S14c = 1: one in-home landline voice line,] [Q.S14c > 1: [insert Q.S14c] in-home landline voice lines,] [Q.S15c =1: one cellphone voice line, ] [Q.S15c > 1: [insert Q.S15c] cellphone voice lines, ] [Q.S16 =1: one in-home broadband internet connection, ] [Q.S16 > 1: [insert Q.S16] in-home broadband internet connections, ] [Q.S17a =1: one line with cellphone internet/data service.] [Q.S17a > 1: [insert Q.S17a] lines with cellphone internet/data services.]
You had also indicated that in the most recent month for which you had no one-time charges, you received [Q.1 =1: one bill/Q.1 >1: [insert Q.1] bills] relating to these services.

69
For [Q.1=1: your most recent monthly bill/ Q.1>1: the most recent copy of each monthly bill you pay], we would like to know how much your monthly charges were. [If your most recent bill had one-time charges (for example, to pay for equipment or special one-time services, for example), please provide information for your most recent bill that is more typical of what you pay most months.] In the grid below, please provide the following information:
For [Q.1=1: your recent monthly bill/ Q.1>1: each monthly bill you pay], consider the information on which you’re relying to recall the bill amount and then choose one of the drop-down responses that best describes how sure you are about the amount you will provide.
Enter the total bill amount, including taxes and fees [Q.1>1: for each of your monthly bills]. If you share in a family plan with other people who do not live in your own household, please enter just the amount for which [Q.S9c>1: your household was/Q.S9c=1: you were] responsible.
Provide the grid below, showing as many entry rows as the Q.1 response.
Data entry using drop-down boxes for Q.2a. Entries for “How sure are you about the amount you will enter?” are (Reverse for alternate respondents, but don’t randomize) “I can give you an accurate amount for this bill.” “I can give you an approximate amount for this bill.” “I can’t give you an amount for this bill, but I can tell you approximately how much this bill is each month,” “I don’t remember the bill amount and cannot give you a reasonable estimate.” Prompt for any incompletions in the grid before allowing the respondent to move to the next question, unless Q.2a. =“I don’t remember the bill amount and cannot give you a reasonable estimate.”
Data entry using drop-down boxes for Q.2b. Entries for “Total bill amount” are: “$0 - $50,” “$51 - $100,” “$101 - $150,” “$151 - $200,” “$201 - $300,” “$301 - $400,” and “$400+.”
Grid for use when [Q.1 =1]:
How sure are you
about the amount you will enter? [Q.2a]
Total bill amount [Q.2b]
1 Your one bill [Q.2a1] [Q.2b1]
Grid for use when [Q.1 >1]:
How sure are you about the amount you will enter? [Q.2a]
Total bill amount [Q.2b]
1 First monthly bill [Q.2a1] [Q.2b1] 2 Second monthly
bill [Q.2a2] [Q.2b2]
Etc.

70
3 [Q.S9c>1: Has your household/Q.S9c=1: Have you] ever discontinued a home broadband internet service (including DSL, Fiber, Cable, fixed wireless and satellite) because of an increase in the monthly cost?
Yes 1
No 2
I’m not sure X
4 [Q.S9c>1: Has your household/Q.S9c=1: Have you] ever discontinued a cellphone internet/data service (including mobile data plans and wireless hotspots) or reduced the number of lines with service because of an increase in the monthly cost?
Yes 1
No 2
I’m not sure X
Continue with all qualifying for the survey:
5 You have previously indicated that [Q.S9 c>1: your household is/ Q.S9c=1: you are] personally responsible for
[Q.S14c = 1: one in-home landline voice line,] [Q.S14c > 1: [insert Q.S14c] in-home landline voice lines,] [Q.S15c =1: one cellphone voice line, ] [Q.S15c > 1: [insert Q.S15c] cellphone voice lines, ] [Q.S16 =1: one in-home broadband internet connection, ] [Q.S16 > 1: [insert Q.S16] in-home broadband internet connections, ] [Q.S17a =1: one line with cellphone internet/data service.] [Q.S17a > 1: [insert Q.S17a] lines with cellphone internet/data services.]
You had also indicated that in the most recent month for which you had no one-time charges, you received [Q.1 =1: one bill/Q.1 >1: [insert Q.1] bills] relating to these services.
Now we are going to ask you to think how a change on [Q.1 =1: your monthly bill/ Q.1 >1: each of your monthly bill] would impact your use of voice and broadband internet/data services. Suppose [Q.S16 + Q.S17a >0: the bill amount per month increases by {Internet Bill Increase} for each line/connection of your internet/data services, and the / Q.S16+ Q.S17a =0: the] bill amount per month decreases by {Voice Bill Decrease } for each line of your voice services.
Hide calculation: (5a) [(Q.S16 + Q.S17a) * {Internet Bill Increase}]
(5b) [(QS14c + QS15c) * {Voice Bill Decrease}]
(5c) = [Q.5a – Q.5b]
[Q.S16 + Q.S17a >0: Since [Q.S9c>1: your household is/ Q.S9c=1: you are] personally responsible for [insert Q.S16 + Q.S17a] lines of internet\data services, your total monthly bill for internet\data services would increase by [insert Q.5a]]. [QS14c + QS15c >0: Since [Q.S9c>1: your household is/ Q.S9c=1: you are] personally responsible for [insert QS14c + QS15c] lines of voice services, your total monthly bill for voice services would decrease by [insert 5b]] [Q.S16 + Q.S17a =0: In addition, [Q.S9c>1: your household is/ Q.S9c=1: you are] not personally responsible for any internet\data services. / QS14c + QS15c =0: In

71
addition, [Q.S9c>1: your household is/ Q.S9c=1: you are] not personally responsible for any voice services.] This means that your total monthly bills for voice and internet\data services would [Q.5c > 0: increase by [5c]/ Q.5c < 0: decrease by [Insert abs (Q.5c)] / Q.5c = 0: remain the same].
Please assume that the same change in bill amount is applied by all voice service providers, and the the same change in bill amount is applied by all internet service providers. The change would not be to the providers’ base prices, but would show up as a “surcharge” associated with the base monthly charge (which most providers show separately from the base amounts). Changes in the bill amount for one service does not depend on whether or not you subscribe to other services. For example, changes to your voice bill amount is are not affected by whether or not you discontinue your internet/data services.
Based on your current voice and internet/data services and your knowledge of the market, which of these statements best describes you? [Select one only.]
By “downgrade,” we mean that you would replace [Q.S9c = 1: your existing service with a cheaper service \Q.S9c > 1: one or more of your existing services with cheaper services], offered by either the same carrier or a different carrier, that has reduced download and upload speeds for your internet connection and/or a reduced monthly data limit.
By “upgrade,” we mean that you would replace [Q.S9c = 1: your existing service with a more expensive service /Q.S9c > 1: one or more of your existing services with more expensive services], offered by either the same carrier or a different carrier, that has increased download and upload speeds for your internet connection and/or an increased monthly data limit. [If Q.S12b= 0, do not show option 2 and option 3]
I would make no changes to my voice and internet/data services 1
I would downgrade my in-home internet services and/or my cellphone internet/data services 2
I would discontinue one or more lines of my in-home internet services and/or my cellphone internet/data services 3
I would upgrade my in-home internet services and/or my cellphone internet/data services 4
I would add one or more new lines of in-home internet services and/or cellphone internet/data services 5
Other (please describe in detail) 6
[For each respondent repeat Q5-Q9 using the values for {Internet Bill Increase} and {Voice Bill Decrease} in the table below. Reverse the order for alternate respondents, but don’t randomize.]
Table 1
Internet Bill Increase Per Line Voice Bill Decrease Per Line
1 $0.80 $0.76
2 $0.89 $0.67
3 $0.73 $0.83

72
Check the answer to Q5. If Q5. = 2, continue to Q6; else if Q5. = 3, continue to Q7; else if Q5. = 4, continue to Q8; else if Q5. = 5, continue to Q9. Otherwise, continue to Q21
6 You indicated that you would downgrade your in-home internet services and/or your cellphone internet/data services. Please fill in:
(6a) Number of in-home internet services you would downgrade: ___
(6b) Number of cellphone internet/data services you would downgrade: ___
Check Q.6a+Q.6b > 0. Else, remind respondent “You had previously indicated that [Q.S9c>1: your household /Q.S9c=1: you] would downgrade at least one in-home internet service or cellphone internet/data service.” Ask the respondent to choose to change either their answer to Q5 or Q.6.
If Q.6a >Q.S16, please display the error message: “You have previously indicated that [Q.S9c>1: your household is/ Q.S9c=1: you are] personally responsible for [insert Q.S16 value] in-home internet connections. The number of lines you would like to downgrade exceeds the number of lines you have. Please check and revise your answers.”
If Q.6b >Q.S17a, please display the error message: “You have previously indicated that [Q.S9c>1: your household is/ Q.S9c=1: you are] personally responsible for [insert Q.S17a value] cellphone internet/data connections. The number of lines you would like to downgrade exceeds the number of lines you have. Please revise your answers accordingly.”
[If Q.S16 = 0 and Q.S17a > 0, Set Q.6a and Q.7a both to zero and do not show question.] [If Q.S16 > 0 and Q.S17a = 0, Set Q.6a and Q.7a both to zero and do not show question.]] After looping through the rows in Table 1, continue to Q21.
7 You indicated that you would discontinue your in-home internet services and/or your cellphone internet/data services. Please fill in:
(7a) Number of in-home internet services you would discontinue: ___
(7b) Number of cellphone internet/data services you would discontinue: ___
Check Q.7a+Q.7b > 0. Else, remind respondent “You had previously indicated that [Q.S9c>1: your household /Q.S9c=1: you] would discontinue at least one in-home internet service or cellphone internet/data service.” Ask the respondent to choose to change either her answer to Q.5 or Q.7. If Q.7a >Q.S16, please display the error message: “You have previously indicated that [Q.S9c>1: your household is/ Q.S9c=1: you are] personally responsible for [insert Q.S16 value] in-home internet connections. The number of lines you would like to discontinue exceeds the number of lines you have. Please check and revise your answers.”
If Q.7b >Q.S17a, please display the error message: “You have previously indicated that [Q.S9c>1: your household is/ Q.S9c=1: you are] personally responsible for [insert Q.S17a value] cellphone internet/data connections. The number of lines you would like to discontinue exceeds the number of lines you have. Please revise your answers accordingly.”
[If Q.S16 = 0 and Q.S17a > 0, Set Q.6a and Q.7a both to zero and do not show question.] [If Q.S16 > 0 and Q.S17a = 0, Set Q.6a and Q.7a both to zero and do not show question.]]
After looping through the rows in Table 1, continue to Q21.
73
8 You indicated that you would upgrade your in-home internet services and/or your cellphone internet/data services. Please fill in:
(8a) Number of in-home internet services you would upgrade: ___
(8b) Number of cellphone internet/data services you would upgrade: ___
Check Q. 8a+Q. 8b > 0. Else, remind respondent “You had previously indicated that [Q.S9c>1: your household /Q.S9c=1: you] would upgrade at least one in-home internet service or cellphone internet/data service.” Ask the respondent to choose to change either her answer to Q5 or Q.8. After looping through the rows in Table 1, continue to Q21.
9 You indicated that you would add new in-home internet services and/or cellphone internet/data services. Please fill in:
(9a) Number of in-home internet services you would add: ___
(9b) Number of cellphone internet/data services you would your: ___
Check Q. 9a+Q. 9b > 0. Else, remind respondent “You had previously indicated that [Q.S9c>1: your household /Q.S9c=1: you] would add at least one new in-home internet service or cellphone internet/data service.” Ask the respondent to choose to change either her answer to Q.5 or Q.9.
After looping through the rows in Table 1, continue to Q20.
20 Under the Lifeline program, the federal government supports discounted communications service prices for qualifying low-income consumers. The program ensures that all Americans have the opportunities and security that phone service brings, including being able to connect to jobs, family, and emergency services.
[Q.S9c>1: Does your household/Q.S9c=1: Do you] currently receive a discount in your communications charges as a beneficiary of the Lifeline program?
Yes 1 No 2 I’m not sure X

74
Debriefing questions Continue with all qualifying for the survey:
21 We’re almost done now, but we just have a few more questions about what things were important to you as you made your choices about a new voice line / internet connection [Q.S9c>1: for your household]. Different people go about answering questions like these in different ways. On the screens that follow, we will show a number of statements that other people have made about how and why they answered the questions in the way that they did.
When each statement appears, please select a number between 1 and 5 to indicate how well that statement describes the way in which you personally thought about your own answers to those questions. A “5” answer means that the statement “describes me perfectly,” and a “1” answer means the statement “doesn’t describe me at all.” [Present only one statement at a time, varying the colors of the statements as the respondent moves from one screen to the next. Ask List A and List B in that order, but randomize the order of presentation of statements within the List A]
Doesn’t describe me
at all
Describes me perfectly
I’m not sure
1 2 3 4 5 X
List A:
a. “I tend not to react to changes in the monthly bills I pay unless they are greater than $5.”
b. “I didn’t fully understand the question about change in bill amount that I was being asked.”
c. “When asked, people always exaggerate the effect of price increases on their monthly purchasing decisions.”
List B:
d. To confirm attention, please select “Doesn’t describe me at all” for this question.
22 In what year were you born? [INSERT DROPDOWN (DEFAULT LIST)]
[Flag completed respondents as “hAgeFlag” who have coded YOB contradicting to the age provided at S2.]
Timestamp here. Ask all:
23 Thank you very much for your time and cooperation; you’ve been very helpful.