2019:20 - strålsäkerhetsmyndigheten
TRANSCRIPT
Research
Report number: 2019:20 ISSN: 2000-0456Available at www.stralsakerhetsmyndigheten.se
Assessment of structures subjectto concrete pathologies (ASCET),phase 3
2019:20
Author: Torulf NilssonErik Larsson
Scanscot Technology AB, Lund

SSM 2019:20

SSM 2019:20
SSM perspective
Background ASCET is an international research project initiated by WGIAGE1 OECD2 / NEA3. WGIAGE Concrete subgroup is a working group within the OECD / NEA whose task is to address issues concerning
• the maintenance of the integrity of concrete structures,
• proposals for general principles to optimally handle the challenges of integrity, especially with regard to ageing of concrete structures.
The aim of the ASCET project is to create a basis for general recommen-dations regarding management of ageing related concrete degradation in nuclear facilities. The goal is to produce comprehensive recommen-dations for numerical simulations of concrete degradation mechanisms. In ASCET phase 3 the participants were able to perform numerical simulations with access to test results from previous experiments with degraded concrete structures.
ResultsA bond-slip model was used for numerical simulations with a finite ele-ment program. The bond-slip model used bond-slip laws to connect the reinforcement to the concrete.
The numerical simulations showed that the
• model can have a significant impact on crack-pattern, failure mode and ductility,
• failure load capacity is relatively independent of the bond interac-tion between the concrete and the reinforcement,
• model was very sensitive with regard to the stiffness of the bond-slip. Cliff-edge effects in the load-displacement curve were found for small changes of the stiffness. These effects were, in each case, accompanied by a changed failure mode and crack-pattern.
• Alkali Silica Reaction (ASR) effects on the bond itself were not studied. But, it was shown that a more successful simulation of a ASR-affected shear wall was obtained if a lower-than-average bond stiffness was used.
RelevanceDegradation of concrete structures important to safety have been identified by SSM as a potential problem area since the Swedish nuclear facilities are getting older. The results from this research project are therefore valuable when it comes to ageing management and radiation safety assessments of degraded concrete structures in nuclear facilities.
1 Working Group on Integrity and Ageing of Components and Structures2 Organization for Economic Co-operation and Development3 Nuclear Energy Agency

SSM 2019:20
Project informationContact person SSM: Sofia Lillhök Reference: SSM2015-1013/ 7030221-00
2019:20
Author:
Date: January 2018Report number: 2019:20 ISSN: 2000-0456Available at www.stralsakerhetsmyndigheten.se
Torulf NilssonErik Larsson
Scanscot Technology AB, Lund
Assessment of structures subjectto concrete pathologies (ASCET),phase 3

SSM 2019:20
This report concerns a study which has been conducted for the Swedish Radiation Safety Authority, SSM. The conclusions and view-points presented in the report are those of the author/authors and do not necessarily coincide with those of the SSM.
Executive summary This report summarizes the work carried out by the independent consultancy company Scanscot Technology (SCTE) within the framework of Phase 3 of the OECD/NEA/CSNI CAPS called ASCET.
The official purpose of the ASCET (Assessment of Nuclear Structures Subject to Concrete Pathologies) initiative is to study the non-linear behavior of concrete structures subjected to material degradation mechanisms. This subject is of great interest for the nuclear industry internationally, as concrete degradation mechanisms (e.g. alkali-aggregate reaction, delayed ettringite formation, irradiated concrete, sulfate attack, rebar steel corrosion, freezing and thawing cycles) have been detected in nuclear facilities in several OECD member states [1] and might very likely affect structural performance and residual lifetime in the future. However, as ASR has never been reported for Swedish nuclear structures this issue is not particularly relevant for Swedish conditions. ASR is covered in this report but focus is on non-linear response in normal non-reactive concrete structures, which is more relevant for Swedish nuclear facility owners and authorities.
The content of the ASCET phase 3 benchmark is simulations of shear wall structures affected by alkali-silica reactions (ASR), tested under cyclic loading until failure. Several specimens with different levels of advanced ASR, as well as reference specimens with sound aggregate, were experimentally tested to compare the ultimate capacity, displacements and failure modes.
Unlike ASCET phase 2, which was blind simulations, the participants of the phase 3 had access to all the test data prior to the benchmark. Focus was to improve predictions from phase 2 with respect to wall failure mode, ductility and crack pattern.
The base numerical model presented in this paper was developed and used in phase 2 on behalf of SCTE [2]. An identified weakness in the model was the absence of bond-slip interaction between the reinforcement and the concrete at the interface, as they were completely tied together. The SCTE participation of the ASCET phase 3 benchmark focused on improving this point by implementing a bond-slip model, allowing for relative slips between the concrete and the reinforcement.
The general-purpose finite element program ABAQUS [3] was used for the numerical simulations. The bond-slip model presented in this report uses connector elements, governed by bond-slip laws, to connect the reinforcement (beam elements) with the concrete (solid elements). The embedded element technique provided by the software [3] was used as a mapping tool for connection points in the concrete.
In summary, the results presented in this report reveals that:
1. Bond-slip can have a significant impact on crack-pattern, failure mode and ductility in numerical models.
2. The failure load capacity is relatively independent of the bond interaction between the concrete and the reinforcement.
ii
3. The implemented bond-slip model was very sensitive to the bond-stiffness. Cliff-edge effects in the load-displacement curve were found for small changes of this parameter. These effects were in each case accompanied by change in failure mode and crack-pattern.
4. ASR effects on the bond itself was not studied. However, it was shown that some lower-than-average bond stiffness was more successful for the simulation of ASR-affected shear wall.
iii
Sammanfattning Den här rapporten sammanfattar arbetet som utförts av det oberoende konsultföretaget Scanscot Technology (SCTE) inom ramen av fas 3 för ASCET-programmet.
Det officiella syftet med ASCET-programmet (Assessment of Nuclear Structures Subject to Concrete Pathologies) är att studera degraderade (ASR/AAR) betongkonstruktioners beteende under starkt olinjär och cyklisk last (jordbävning). För flera medlemsländer av OECD [1] är detta högst relevant men bedöms dock mindre intressant för svenska förhållanden, eftersom svenska kärnkraftverk inte rapporterats skadade av ASR [4]. Vinklingen undersöks, men tonvikten inom projektet ligger på att undersöka förmåga att simulera oskadade (normala) betongkonstruktioner som utsätts för cyklisk skjuvande belastning och svarar med olinjär respons i materialet. Detta för att kunna tillgodose de behov svensk myndighet och anläggningsägare kan komma att ha.
Den tredje fasen av ASCET innefattar simuleringar av väggar som utsatts för ASR-degradering och som skjuvats till brott under cyklisk last. Flera provväggar med olika nivåer av ASR, samt icke-reaktiva väggar, har testats under laboratorieförsök där skjuvkapacitet, förskjutningar och brottmoder har jämförts.
Till skillnad från fas 2, där deltagarna fick tillgång till testresultaten först efter simuleringarna, hade nu deltagarna av ASCET benchmarken tillgång till samtliga testresultat. Benchmarken fokuserade på att förbättra tidigare resultat med avseende på brottmoder, duktilitet och sprickmönster.
Den numeriska bas-modellen som presenteras i den här rapporten utvecklades inför den andra fasen av ASCET [2]. En brist som identifierats med modellen är att armeringen var stelt kopplad till betongen. SCTE:s medverkan i den tredje fasen av ASCET fokuserade på att förbättra samverkan mellan armeringen och betongen i den numeriska modellen. En vidhäftningsmodell implementerades så att armeringen tillåts glida relativt betongen.
Finita element-mjukvaran ABAQUS [3] användes vid simuleringarna. Vidhäftningsmodellen som presenteras i den här rapporten använder kopplingselement, som styrs av vidhäftningslagar och som sedan används för att koppla armeringen till inbäddade noder i betongen. Inbäddningstekniken tillhandahålls av mjukvaran [3].
Sammanfattningsvis så presenteras följande resultat i rapporten:
1. Vidhäftningen kan ha en stor påverkan på sprickmönster, brottmod och duktilitet i numeriska modeller.
2. Brottlasten är relativt oberoende vidhäftningsmodellen mellan armeringen och betongen.
3. Vidhäftningsmodellen som implementerades var väldigt känsligt med avseende på vidhäftningens styvhet. Tröskeleffekter upptäcktes för små ändringar i styvheten. Denna effekt åtföljdes alltid av en förändrad brottmod och sprickmönster.

iv
4. ASR-effekter på vidhäftningen studerades explicit inte. Men det visades en tendens att vissa lite lägre styvheter på vidhäftningen gav bättre resultat för den simulerade väggen med ASR-degraderad betong.
v
Content 1. INTRODUCTION .................................................................................. 1
1.1. BACKGROUND OF THE ASCET CAPS ............................................................ 1
1.2. AIM AND SCOPE OF ASCET PHASE 3 ............................................................ 2
1.3. AIM AND SCOPE OF THIS REPORT ................................................................. 3
1.4. NUMERICAL MODELLING OF SQUAT CONCRETE WALLS ..................................... 4
1.5. AAR FROM A SWEDISH NUCLEAR SAFETY PERSPECTIVE .................................... 4
1.6. CONTENT OF ASCET PHASE 3 ..................................................................... 5
2. LABORATORY SHEAR WALL EXPERIMENTS ........................................... 6
2.1. INTRODUCTION ......................................................................................... 6
2.2. SHEAR WALL SPECIMENS............................................................................. 6
2.3. CONCRETE MATERIAL PROPERTIES ................................................................ 7
2.4. REINFORCEMENT STEEL PROPERTIES ........................................................... 12
2.5. EXPERIMENTAL SHEAR WALL TEST SETUP ..................................................... 13
2.6. EXPERIMENTAL RESULTS ........................................................................... 16
2.7. ASPECTS OF THE EXPERIMENTAL TESTS COMPARED TO ACTUAL STRUCTURES ...... 41
3. NUMERICAL MODEL ...........................................................................42
3.1. GENERAL ............................................................................................... 42
3.2. USED NUMERICAL SIMULATION SOFTWARE .................................................. 42
3.3. CONSTITUTIVE CONCRETE MODEL .............................................................. 43
3.4. BASE NUMERICAL MODEL OVERVIEW .......................................................... 46
3.5. MODEL OF STEEL REINFORCEMENT BARS ..................................................... 47
3.6. BOND-SLIP MODEL FOR REINFORCEMENT .................................................... 48
3.7. LOADS AND BOUNDARY CONDITIONS .......................................................... 54
3.8. SIMULATION TYPES AND PROCEDURES ........................................................ 55
3.9. MODELLING OF ASR EFFECTS .................................................................... 56
4. RESULTS AND COMPARISONS ............................................................57
4.1. REGULAR CONCRETE REG A ...................................................................... 58
4.2. REACTIVE CONCRETE ASR A1 .................................................................... 63
5. CONCLUSIONS ...................................................................................68 6. ACKNOWLEDGEMENT ........................................................................70 7. REFERENCES ......................................................................................71

vi
Nomenclature
𝑑𝑡 concrete tension damage [-]
E modulus of elasticity [MPa]
𝐸0 initial modulus of elasticity used in ABAQUS [MPa]
𝑓𝑐 compressive cylinder strength of concrete [MPa]
𝑓𝑐𝑘 characteristic compressive cylinder strength of concrete [MPa]
𝑓𝑐𝑚 mean value of concrete cylinder compressive strength [MPa]
𝑓𝑐,𝑐𝑢𝑏𝑒 compressive cube strength of concrete [MPa]
𝑓𝑐𝑘,𝑐𝑢𝑏𝑒 characteristic compressive cube strength of concrete [MPa]
𝑓𝑐𝑚,𝑐𝑢𝑏𝑒 mean value of concrete cube compressive strength [MPa]
𝑓𝑐𝑡 tensile strength of concrete [MPa]
𝑓𝑐𝑡𝑘 characteristic tensile strength of concrete [MPa]
𝑓𝑐𝑡𝑚 mean value of tensile strength of concrete [MPa]
𝐺𝐹 fracture energy [N/m]
𝑢𝑡𝑐𝑘 cracking displacement [m]
𝑢𝑡0𝑐𝑘 cracking displacement at which complete loss of strength takes place [m]
𝜖 flow potential eccentricity used in ABAQUS
𝜀𝑐 total strain [-]
𝜀0𝑐𝑒𝑙 elastic strain corresponding to undamaged material [-]
𝜀𝑐𝑖𝑛 inelastic strain [-]
𝜀𝑚𝑎𝑥 maximum strain [-]
viscosity parameter or coefficient of friction [-]
Poisson’s ratio [-]
dilation angle [deg]
density [kg/m3]
𝜎𝑐𝑢 ultimate compressive stress used in ABAQUS [MPa]
vii
𝜎𝑐0 uniaxial initial compressive yield stress used in ABAQUS [MPa]
𝜎𝑏0 initial equibiaxial compressive yield stress used in ABAQUS [MPa]
𝜎𝑡0 failure stress in tension used in ABAQUS [MPa]
viii
List of acronyms
AAR Alkali Aggregate Reaction
ASCET Assessment of Nuclear Structures Subject to Concrete Pathologies
ASR Alkali Silica Reaction
CAPS CSNI Activity Proposal Sheet (OECD)
CDP Concrete Damaged Plasticity (ABAQUS)
CEA Alternative Energies and Atomic Energy Commission (France)
CNSC Canadian Nuclear Safety Commission
CRP Co-ordinated Research Programme/Projects
CSNI Committee on the Safety of Nuclear Installations (OECD)
DEF Delayed Ettringite Formation
EDF Electricity of France
IAEA International Atomic Energy Agency
IRSN Radioprotection and Nuclear Safety Institute (France)
LTO Long Term Operation
NEA Nuclear Energy Agency (OECD)
NPP Nuclear Power Plant
OECD Organization for Economic Co-operation and Development
ORNL Oak Ridge National Lab (USA)
RC Reinforced Concrete
SSC Systems, Structures and Components
SSM Swedish Radiation Safety Authority (Sweden)
STUK Radiation and Nuclear Safety Authority (Finland)
VTT Technical Research Centre of Finland
WGIAGE Working Group on Integrity and Ageing of Components and Structures
1
1. Introduction
1.1. Background of the ASCET CAPS
Many Nuclear Power Plants (NPP) around the world are at the moment approaching, or in, their Long-Term Operation (LTO) stage of their operational life time. In addition, several NPPs have recently been carrying out uprate and life extension projects and comprehensive maintenance work including the exchange of components important to safety, in order to extend their lifetime. As a result, aging management has emerged as one of the main concerns of the nuclear community.
For concrete structures, material degradation due to Alkali Aggregate Reactions (AAR) is one focus area. Concrete swelling is a consequence of several concrete degradation mechanisms of concrete structures (alkali aggregate reaction, delayed ettringite formation, irradiated concrete) and it is important to asses and to quantify the ultimate and serviceability limit states of structures built with such a concrete. The chemical reactions are concluded to be reasonably well understood [5], however the changes in structural mechanical properties, and implications for structural assessments, are yet to be established. At present time, neither established industry standards, nor regulatory requirements, address this type of material degradation. In particular, in the case of concrete with degradation mechanisms, current design code equations, using material properties based on concrete samples, are not in accordance with structural element testing [1].
In addition, there is a need for reliable numerical tools to predict the structural behavior of structures with concrete degradation mechanisms. There is also a need to establish recommendations for reliable numerical simulations of concrete structures, with and without concrete material degradations, up to the load level leading to structural failure [1]. This information is essential in order to get a high level of confidence in simulation for load levels lower than failure level. Developing guidelines on numerical modelling of reinforced concrete structures loaded in shear, for the purpose of structural verification, is consequently of interest. Therefore, validation of numerical models should be performed using structural testing. In many cases reduced scale test structures cannot provide correct information related to the full-scale structures in normal conditions, therefore it is necessary to continue with both reduced and full-scale testing. In addition, there is a need for model validation and quantification of uncertainties in input data and the results.
The ASCET (Assessment of Nuclear Structures Subject to Concrete Pathologies) CAPS were proposed by the OECD/NEA/CSNI in 2013, and is an international research initiative targeted at degradation of the concrete material in nuclear facilities. The ASCET initiative aims to create a basis for general recommendations regarding management of aging issues in nuclear facilities exposed to concrete pathologies (material degradation mechanisms). The type of investigations necessary to understand and
2
evaluate relevant concrete degradations are determined by each member country, based on research needs and damage sensitivity. To survey member status and needs in the area of concrete pathologies, an initial phase of the ASCET initiative was dedicated to summarize the current situation [1]. The safety significance of the CAPS is described as: “Determination of the
impact of concrete degradation on serviceability and ultimate limit state of nuclear facilities taking into account long term operation, especially containment structures and interim storage buildings.” The ASCET lead and coordination organizations are the Canadian Nuclear Safety Commission (CNSC) and the United States Nuclear Regulatory Commission (US NRC). The CSNI technical goals covered are; to promote the safe operation of current nuclear installations; to understand and quantify the mechanisms of ageing of components and structures; to assess and predict their impact on the safety of nuclear installations and; to identify the corresponding means of detection and control.
1.2. Aim and scope of ASCET Phase 3
Following the initial phase of ASCET, a second phase was proposed to serve as a blind simulation benchmark for validation of numerical models to be used in assessments of AAR affected structures.
An experimental campaign, including several nominally identical shear wall specimens with various stages of advanced AAR, were manufactured and tested at the University of Toronto. The aim was assessing effects of Alkali-Silica Reactions on in-plane shear resistance of reinforced concrete walls. The experimental campaign was carried out as a part of a CNSC financed research program. The same transverse cyclic loading (simulating horizontal seismic loading), up to the wall failure, were applied to all of the structures. Reference wall specimens with regular concrete were tested as well, in order to compare the ultimate capacity, displacements and failure modes.
As described in the CSNI Activity Proposal Sheet, ASCET phase 2 blind simulation benchmark revealed that the wall ultimate capacity was generally well predicted by all participants. However, the failure mode, displacements, the wall ductility and energy absorption as well as the crack pattern were much more difficult to simulate. The workshop conclusion was to propose a new round of simulation benchmark on the same experiments but with disclosure of all available test data.
The third phase of ASCET aims at calibrating simulation models with respect to the test result. The participants in the benchmark will have access to all the test result performed at University of Toronto. Test result from similar tests performed at Institut Radioprotection Sûreté Nucléaire (IRSN) of France at CEBTP (French Center for Experimental Research and Studies of Building and Construction) in Paris in 2001 is also provided.
The general goal of ASCET Phase 3 is to understand and quantify the mechanisms of ageing of components and structures; to assess and predict their impact on the safety of nuclear installations and; to identify the corresponding means of detection and control.
3
The technical goal of the ASCET Phase 3 benchmark is to improve the prediction of the behavior, in terms of force versus displacement curve and ultimate capacity, of the walls tested after 30 months of accelerating curing.
Programme goals of the Phase 3 benchmark is to study;
1) ability to predict the behavior of concrete elements with ASR, 2) the difference in failure modes between ASR and sound specimen, 3) the difference in ultimate shear capacity, 4) the difference in ultimate displacements.
The expected results and deliverables of the ASCET Phase 3, from participating teams in the simulation benchmark, is a series of simulations using a range of approaches and software. The ASCET initiative will summarize the results, and provide recommendation for numerical simulation of concrete pathologies/degradation mechanisms, which result in concrete swelling as a function of time, based on the deliverables of the benchmark teams. ASCET Phase 3 participants (individuals and organizations) include IAGE member/organizations including CNSC, US NRC, IRSN, EDF, CEA, STUK, VTT, ORNL, and Scanscot Technology.
1.3. Aim and scope of this report
The primary aim of the work summarized in this report is to, from a Swedish nuclear industry need perspective, study the behavior of a reinforced concrete squat wall affected by shear load. The term squat is here used as the studied walls has low height to width ratio. A secondary aim is to do this for concrete having degraded mechanical material properties, which here means ASR reactive concrete. The motivation for decreased interest of the official ASCET aim, given in section 1.2, is given in section 1.5. A third aim of this work is to increase the understanding of how structural assessment of the ultimate capacity of squat reinforced concrete walls can be performed, using the chosen example structure. Issues of particular interest are major contributing circumstances to the structural capacity. An additional outcome of this work is comparisons of experimental results to selected relevant design codes.
The main activities within the participation of the ASCET Phase 2 benchmark included;
1. Material issues concerning degraded concrete, including relationships of structural capacity compared to regular concrete.
2. Structural issues including evaluation of structural performance compared to regular concrete.
3. Summarize the experimental data given to the benchmark participants, and estimate of actual conditions at the experimental tests.
4. Numerical simulations of the experiments carried out.
ASCET Phase 3 shares the main activities with phase 2. The main difference is that the interaction between reinforcement and concrete is improved.
The main purpose of the simulations performed is to study how well the used numerical method may simulate and predict the example shear wall problem
4
chosen for the University of Toronto experiments. Comparisons and sensitivity studies related to existing design codes, for regular concrete, are also considered important.
The scope of the numerical simulations in this report are limited to macro scale finite element analyses. The term macro scale is used here to describe that concrete material properties are set as static input, and not derived in the simulations through an evolution of chemical changes over time, due to the environmental conditions. The reason for this approach is due to the fact that treating material properties as more or less predefined values is the standard procedure used by engineers in a design or requalification process. The numerical tool used within this work is the explicit ABAQUS solver [3].
1.4. Numerical modelling of squat concrete walls
For safety related concrete structures, ultimate capacity predictions of shear loaded walls may be of interest in assessments of severe earthquakes with low probability of occurrence. The structural response of squat reinforced concrete walls is complex, and numerical modelling of such structures subjected to primary shear loading is still an open research area. Experimental research in this area have been active for several decades, often in combination with cyclic (seismic) loading. Numerical simulations of nonlinear responses of shear wall structures are still partly without established consensus, mainly due to a combination of very little structural ductility, in combination with nonlinear concrete material modeling challenges, and important and complex interactions between the concrete and the reinforcement.
A large part of this report is dedicated to sensitivity studies, and comparisons between numerical simulations and experimental data, with the final purpose to aid in developing guidelines for use of the numerical engineering tools in structural assessments.
1.5. AAR from a Swedish nuclear safety perspective
The effects of AAR on the concrete material, as well as structural capacity effects, are currently active research areas, and have been so for many years for large scale structures as roads, bridges and dams. There are on the other hand very few publicly available reports regarding the effects from this material degradation that are also applicable to safety related nuclear type of structures. However, some examples are reports on seismic assessments [6], experimental structures [7], numerical studies [8] and summary reports [9] regarding AAR. The focus area of the work presented within this report is ultimate structural capacity, however in real structures effects on durability may be very important.
For Swedish conditions, compiled operational experiences [4] for nuclear reactor containments include only one instance of confirmed ASR, which was found at the decommissioned Barsebäck NPP. As a consequence, with current knowledge, AAR related problems are likely of no practical concern for nuclear reactor containments in Sweden. However, LTO programs

5
aiming at concrete material assessments are currently being implemented, and historically reported instances of degraded concrete material to the regulator are few. In addition, concrete material property changes over time are natural processes, and degradation processes may exist or develop. The studies carried out on degradations of the concrete material, and the reinforced concrete composite, within the ASCET program are therefore interesting from a Swedish nuclear industry safety perspective. A continued observation of international activity and development within this field is therefore relevant for nuclear safety.
1.6. Content of ASCET Phase 3
This report constitutes the third part of ASCET. Model-descriptions and related information is published in the ASCET Phase 2 technical report [2]. To make this report coherent, some of the information in [2] are directly reproduced here, as the work presented in this report is an extension to the previous efforts to simulate the shear wall experiments [2].
6
2. Laboratory shear wall experiments
2.1. Introduction
In this chapter information given to the ASCET Phase 3 benchmark participants concerning the experimental tests, carried out at the University of Toronto, are compiled.
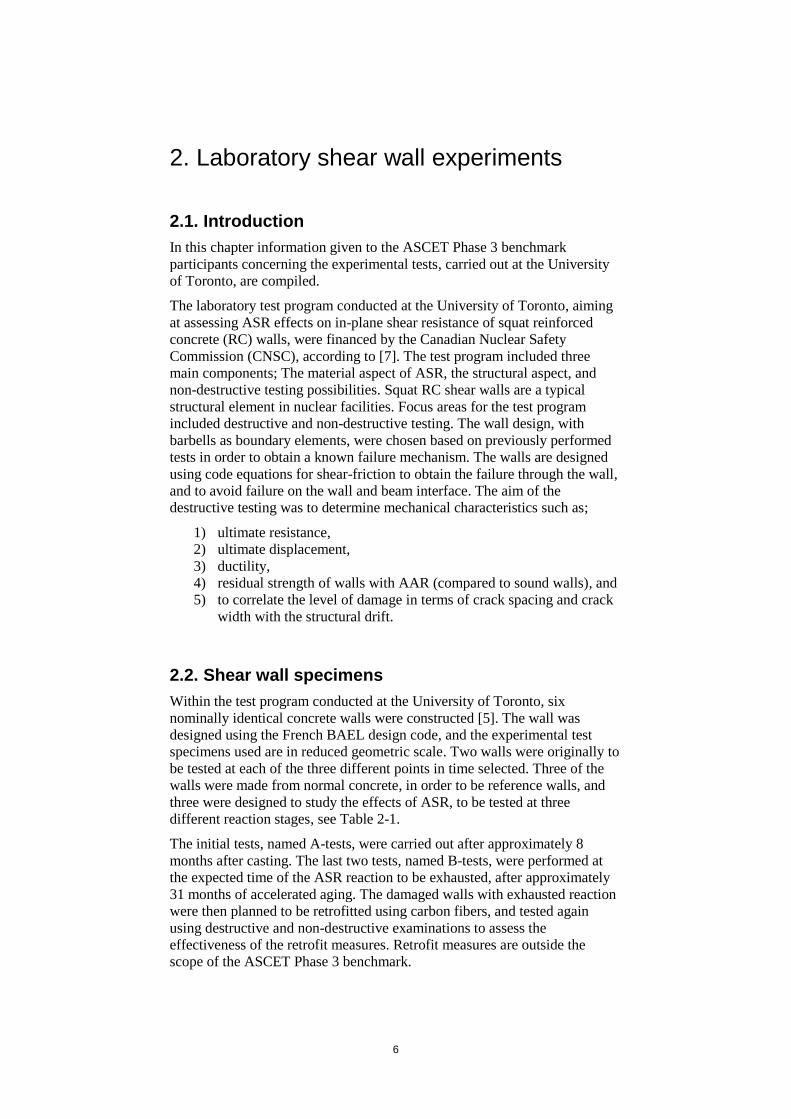
The laboratory test program conducted at the University of Toronto, aiming at assessing ASR effects on in-plane shear resistance of squat reinforced concrete (RC) walls, were financed by the Canadian Nuclear Safety Commission (CNSC), according to [7]. The test program included three main components; The material aspect of ASR, the structural aspect, and non-destructive testing possibilities. Squat RC shear walls are a typical structural element in nuclear facilities. Focus areas for the test program included destructive and non-destructive testing. The wall design, with barbells as boundary elements, were chosen based on previously performed tests in order to obtain a known failure mechanism. The walls are designed using code equations for shear-friction to obtain the failure through the wall, and to avoid failure on the wall and beam interface. The aim of the destructive testing was to determine mechanical characteristics such as;
1) ultimate resistance, 2) ultimate displacement, 3) ductility, 4) residual strength of walls with AAR (compared to sound walls), and 5) to correlate the level of damage in terms of crack spacing and crack
width with the structural drift.
2.2. Shear wall specimens
Within the test program conducted at the University of Toronto, six nominally identical concrete walls were constructed [5]. The wall was designed using the French BAEL design code, and the experimental test specimens used are in reduced geometric scale. Two walls were originally to be tested at each of the three different points in time selected. Three of the walls were made from normal concrete, in order to be reference walls, and three were designed to study the effects of ASR, to be tested at three different reaction stages, see Table 2-1.
The initial tests, named A-tests, were carried out after approximately 8 months after casting. The last two tests, named B-tests, were performed at the expected time of the ASR reaction to be exhausted, after approximately 31 months of accelerated aging. The damaged walls with exhausted reaction were then planned to be retrofitted using carbon fibers, and tested again using destructive and non-destructive examinations to assess the effectiveness of the retrofit measures. Retrofit measures are outside the scope of the ASCET Phase 3 benchmark.

7
Table 2-1 Test series and age of 5 of the 6 test specimens according to [5], and informal information. Testing times mentioned in [5] seem to have been revised.
Test Description Time (after casting)
tested
A REG A; Control specimen 240 days (in 2014)
ASR A1; ASR reactive concrete specimen
(Initial damage)
260 days (in 2014)
B ASR B1; ASR reactive concrete specimen
(Moderate damage)
615 days (in 2016)
ASR B2; ASR reactive concrete specimen
(Severe damage, exhausted reaction)
985 days (in 2017)
REG B; Control specimen 985 days (in 2017)
Test specimens consist of the central wall of primary interest, stabilizing end columns, and bottom and top massive beams for anchoring of floor support and jack equipment. The central wall is 100 mm thick. Geometric dimensions of the test specimen are visualized in Figure 2-1. Construction sequence, if any, and division into casting parts, is unknown.
Figure 2-1 Shear wall test specimen geometry [10].
2.3. Concrete material properties
According to [10] and [7], small size concrete test specimens cast at the same time as the larger test wall specimens included; concrete cylinders (42), bending prisms (6), dog bone specimens (12), and expansion prisms (6). Mechanical properties of the concrete are shown in Table 2-2. The regular concrete material is concluded to, in all measured aspects (stiffness, and compressive and tensile strength), have superior mechanical properties

8
to the ASR reactive concrete in these material tests. Figure 2-2 show concrete properties evolution of time.
Mix design for concrete walls are described in [11]. Concrete mix design was required to be based at ASTM C1293, with maximum aggregate size 19 mm. However, no actual aggregate curves are available from the concrete supplier [11]. Cement content for all concretes were 420 kg/m3, with a w/c ratio of 0.44 and 0.46 for the ASR and regular concrete.
In using the material properties of the ASR concrete from the small test specimens listed here for the purpose of numerical simulations, it must be remembered that properties of the concrete are affected by the level of confinement, which is not included in Table 2-2 nor Figure 2-2.

9
Table 2-2 Measured mechanical properties of small size concrete specimens [12], casted simultaneously as the REG A and ASR A1 shear wall specimens.
Specimen /
Type of test
Type of test specimen REG A ASR A1
Age
(Days)
- 240 260
Compressive strength
(MPa)
100 x 200 mm cylinder 79.0 63.7
Tensile strength
(MPa)
Dog bone 4.76 3.24
Fracture energy
(N/m)
Dog bone 179.3 120.2
Modulus of rupture
(MPa)
150 x 150 x 520 mm
According to ASTM-C78
7.26 4.64
Modulus of elasticity
(GPa)
100 x 200 mm cylinder 47.15 35.75
Expansion
(Length change in %)
75 x 75 x 285 mm
According to ASTM-C1260
0.0332 0.185
Figure 2-2 Concrete properties evolution over time [13].

10
2.3.1. Environmental curing conditions
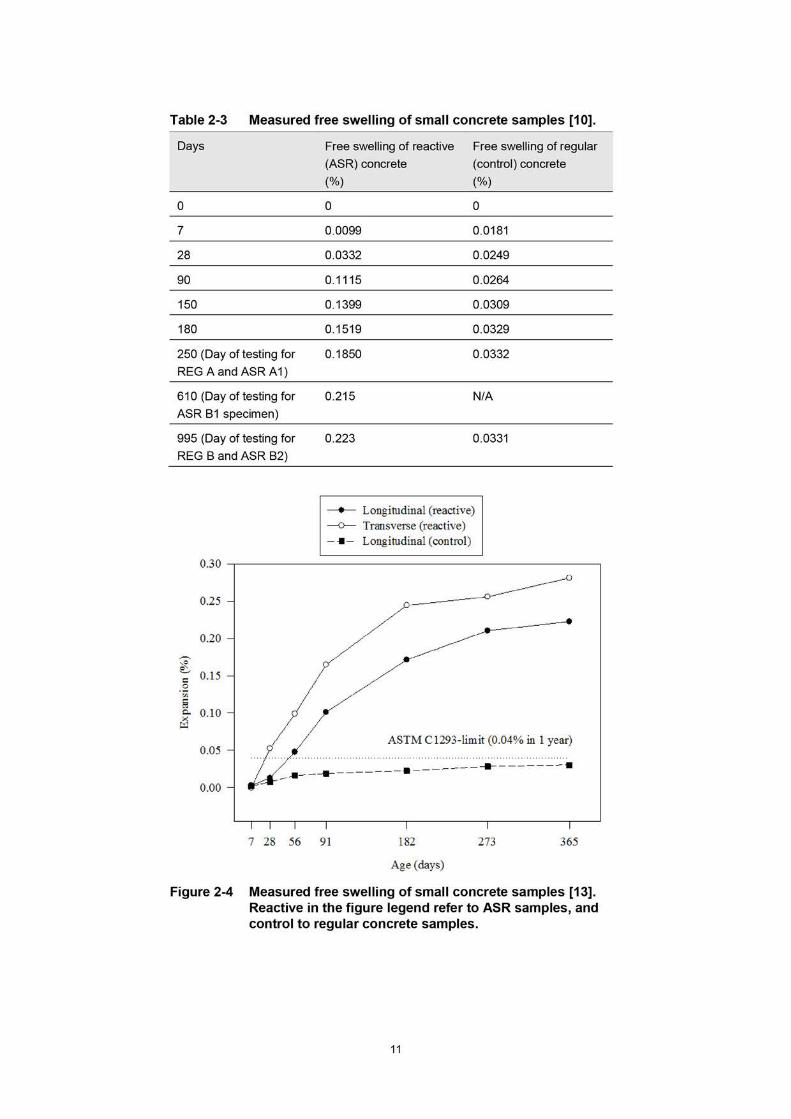
Up to 28 days after casting the walls were assumed to be exposed to temperature 20 °C and relative humidity 100 % [13]. After that ASR walls were subjected to accelerated conditions in a specially built environmental chamber with temperature 50 °C and 95 % - 100 % relative humidity, see Figure 2-3. Figure 2-4 and Table 2-3 show delivered data of measured free swelling for small, unconfined, concrete samples. Table 2-1 list testing times, after casting, for the different specimens.
Figure 2-3 ASR test specimens in the acceleration chamber with increased temperature and humidity [14].
11
Table 2 - 3 Measured free swelling of small concrete samples [10] .
Days Free swelling of reactive
( ASR ) concrete
(%)
Free swelling of r egular
(control) concrete
(%)
0 0 0
7 0.0099 0.0181
28 0.0332 0.0249
90 0.1115 0.0264
150 0.1399 0.0309
180 0.1519 0.0329
250 (Day of testing for
REG A and ASR A1 )
0.1850 0.0332
610 (Day of testing for
ASR B1 specimen)
0. 215 N/A
995 (Day of testing for
REG B and ASR B2 )
0. 223 0.033 1
Figure 2 - 4 Measured free swelling of small concrete samples [13] .Reactive in the figure legend refer to ASR samples, andcontrol to regular concrete samples .
12
2.4. Reinforcement steel properties
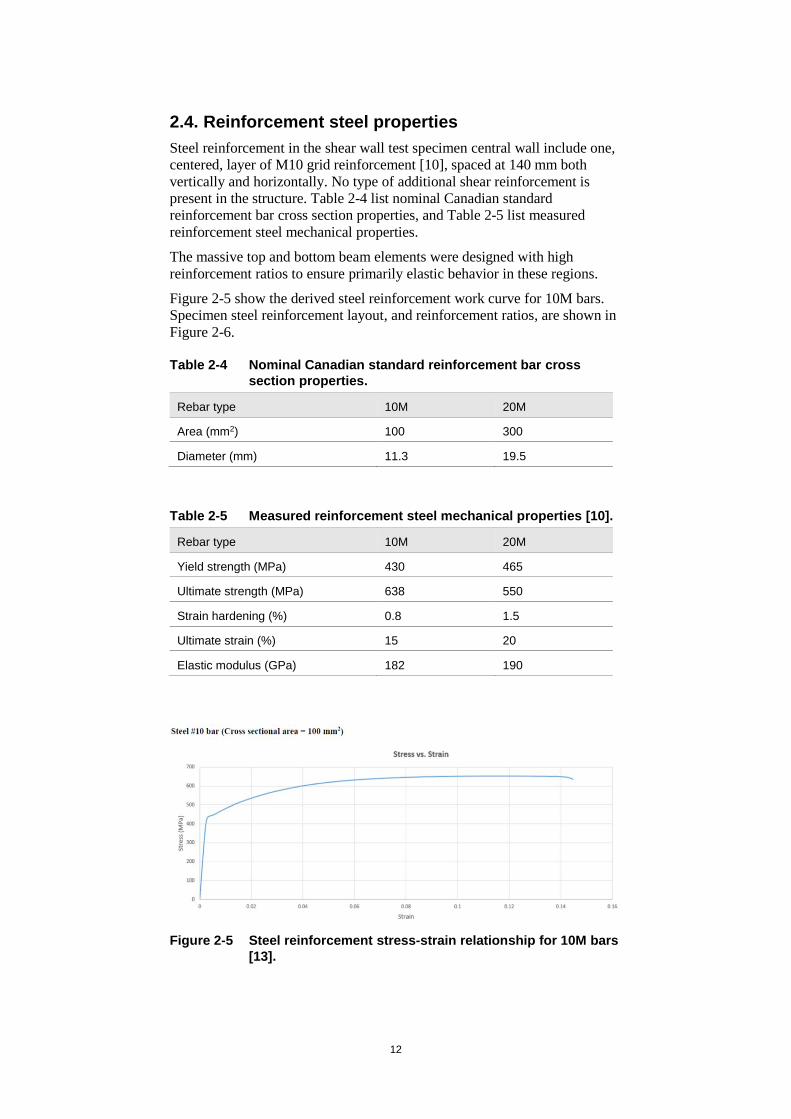
Steel reinforcement in the shear wall test specimen central wall include one, centered, layer of M10 grid reinforcement [10], spaced at 140 mm both vertically and horizontally. No type of additional shear reinforcement is present in the structure. Table 2-4 list nominal Canadian standard reinforcement bar cross section properties, and Table 2-5 list measured reinforcement steel mechanical properties.
The massive top and bottom beam elements were designed with high reinforcement ratios to ensure primarily elastic behavior in these regions.
Figure 2-5 show the derived steel reinforcement work curve for 10M bars. Specimen steel reinforcement layout, and reinforcement ratios, are shown in Figure 2-6.
Table 2-4 Nominal Canadian standard reinforcement bar cross section properties.
Rebar type 10M 20M
Area (mm2) 100 300
Diameter (mm) 11.3 19.5
Table 2-5 Measured reinforcement steel mechanical properties [10].
Rebar type 10M 20M
Yield strength (MPa) 430 465
Ultimate strength (MPa) 638 550
Strain hardening (%) 0.8 1.5
Ultimate strain (%) 15 20
Elastic modulus (GPa) 182 190
Figure 2-5 Steel reinforcement stress-strain relationship for 10M bars [13].
13
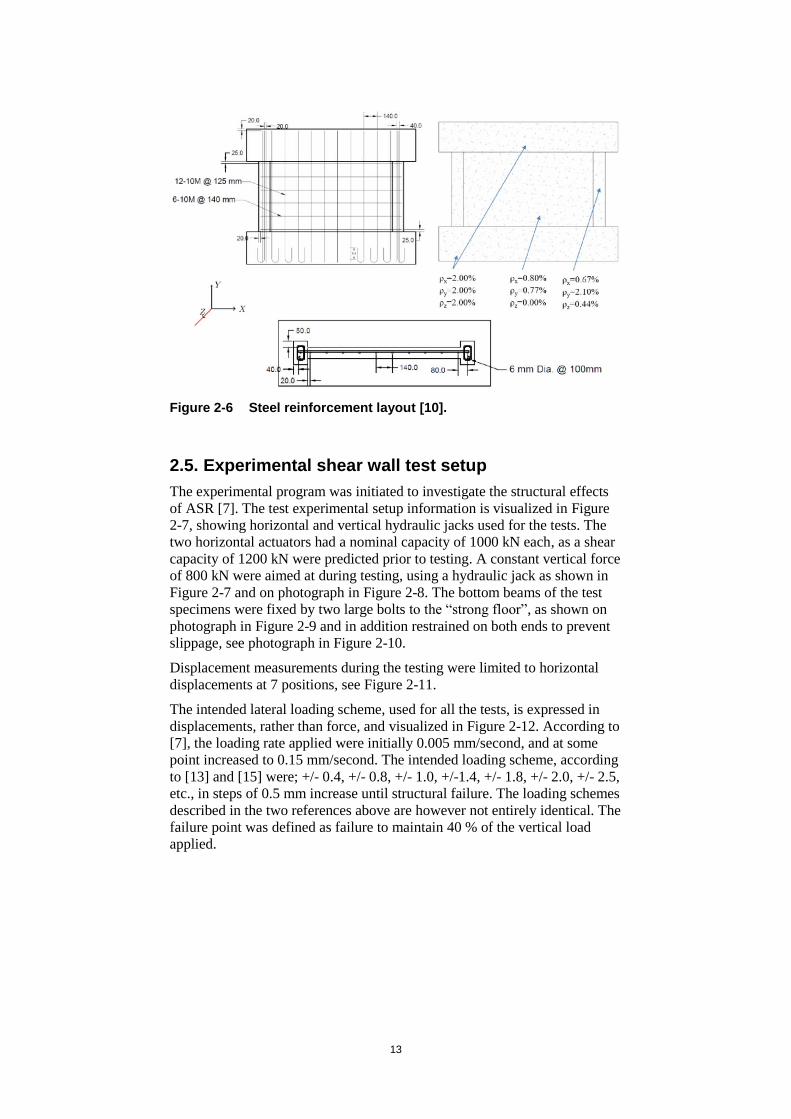
Figure 2-6 Steel reinforcement layout [10].
2.5. Experimental shear wall test setup
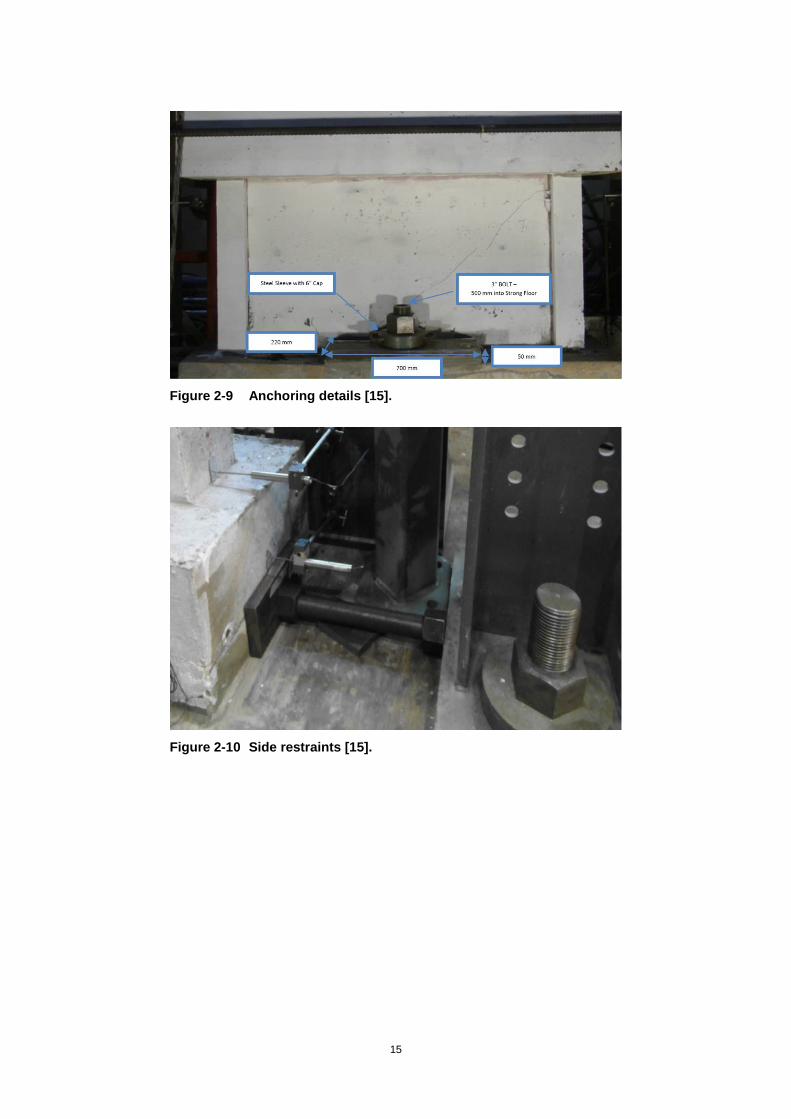
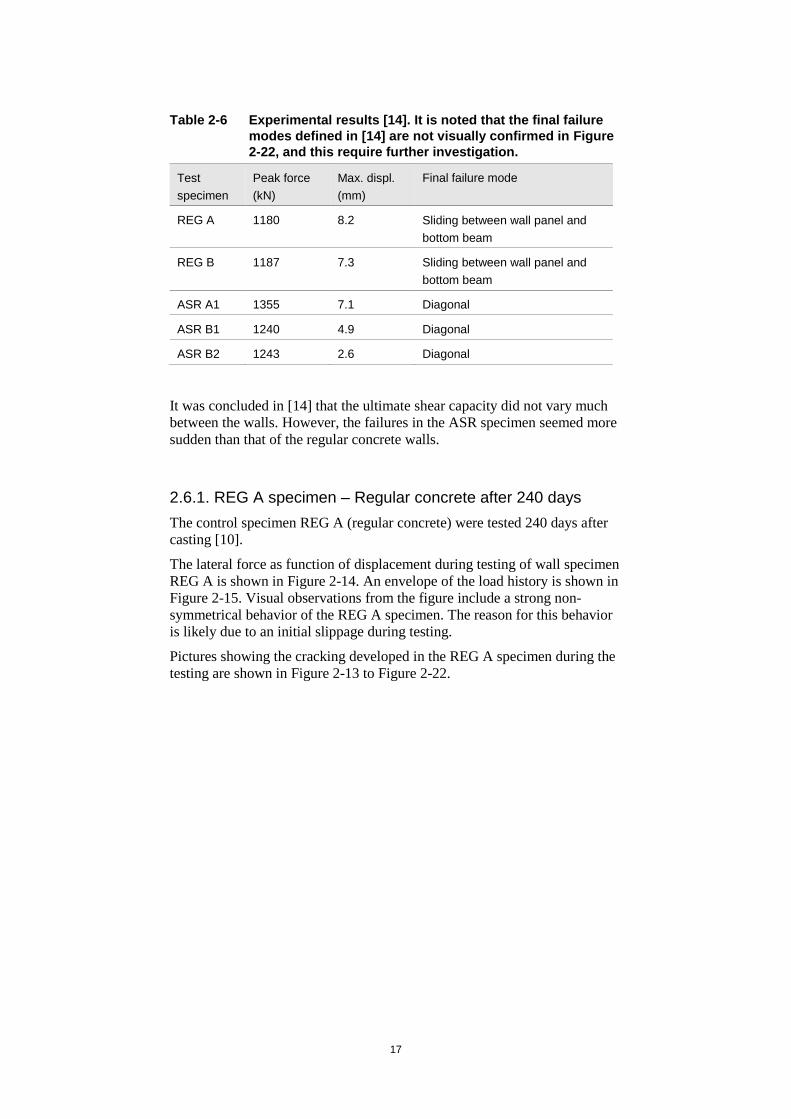
The experimental program was initiated to investigate the structural effects of ASR [7]. The test experimental setup information is visualized in Figure 2-7, showing horizontal and vertical hydraulic jacks used for the tests. The two horizontal actuators had a nominal capacity of 1000 kN each, as a shear capacity of 1200 kN were predicted prior to testing. A constant vertical force of 800 kN were aimed at during testing, using a hydraulic jack as shown in Figure 2-7 and on photograph in Figure 2-8. The bottom beams of the test specimens were fixed by two large bolts to the “strong floor”, as shown on photograph in Figure 2-9 and in addition restrained on both ends to prevent slippage, see photograph in Figure 2-10.
Displacement measurements during the testing were limited to horizontal displacements at 7 positions, see Figure 2-11.
The intended lateral loading scheme, used for all the tests, is expressed in displacements, rather than force, and visualized in Figure 2-12. According to [7], the loading rate applied were initially 0.005 mm/second, and at some point increased to 0.15 mm/second. The intended loading scheme, according to [13] and [15] were; +/- 0.4, +/- 0.8, +/- 1.0, +/-1.4, +/- 1.8, +/- 2.0, +/- 2.5, etc., in steps of 0.5 mm increase until structural failure. The loading schemes described in the two references above are however not entirely identical. The failure point was defined as failure to maintain 40 % of the vertical load applied.

14
Figure 2-7 Overview visualization of the experimental shear wall test setup [13].
Figure 2-8 Set-up for axial loading [15].
15
Figure 2-9 Anchoring details [15].
Figure 2-10 Side restraints [15].

16
Figure 2-11 Experimental lateral displacement measurements [14].
Figure 2-12 Experimental lateral loading scheme, according to [7].
2.6. Experimental results
In ASCET Phase 3, relevant test data was provided for the benchmark participants. The following description of test result is a compilation of [15].
From the test data presented below, and the tested mechanical material properties shown in section 2.3, it can be concluded that even though the material properties of the ASR reactive concrete seem negatively affected by the reactions, the ASR A1 wall test specimen showed a higher structural capacity (approximately 15 %) than the control specimen with regular concrete, REG A.
In addition, the initial whole structure elastic stiffness of the ASR reactive concrete specimen, were also higher than the specimen with regular concrete. This is contradictory to the material properties specified shown in Table 2-2. The reason for this is without explanation at present time.
The experimental results from each specimen are summarized in Table 2-6, showing peak force, maximum displacement and final failure mode.
17
Table 2-6 Experimental results [14]. It is noted that the final failure modes defined in [14] are not visually confirmed in Figure 2-22, and this require further investigation.
Test
specimen
Peak force
(kN)
Max. displ.
(mm)
Final failure mode
REG A 1180 8.2 Sliding between wall panel and
bottom beam
REG B 1187 7.3 Sliding between wall panel and
bottom beam
ASR A1 1355 7.1 Diagonal
ASR B1 1240 4.9 Diagonal
ASR B2 1243 2.6 Diagonal
It was concluded in [14] that the ultimate shear capacity did not vary much between the walls. However, the failures in the ASR specimen seemed more sudden than that of the regular concrete walls.
2.6.1. REG A specimen – Regular concrete after 240 days
The control specimen REG A (regular concrete) were tested 240 days after casting [10].
The lateral force as function of displacement during testing of wall specimen REG A is shown in Figure 2-14. An envelope of the load history is shown in Figure 2-15. Visual observations from the figure include a strong non-symmetrical behavior of the REG A specimen. The reason for this behavior is likely due to an initial slippage during testing.
Pictures showing the cracking developed in the REG A specimen during the testing are shown in Figure 2-13 to Figure 2-22.

18
Figure 2-13 Reg A shear wall [15].
Figure 2-14 Load versus displacement curve of Reg A, digital data obtained from [16].
-1500
-1000
-500
0
500
1000
1500
-10 -5 0 5 10
Forc
e (k
N)
Displacement (mm)
REG A

19
Figure 2-15 Load-envelope versus displacement curve of Reg A [15].
Figure 2-16 First crack at a load of 761 kN and a displacement of 1.4 mm [15].
20
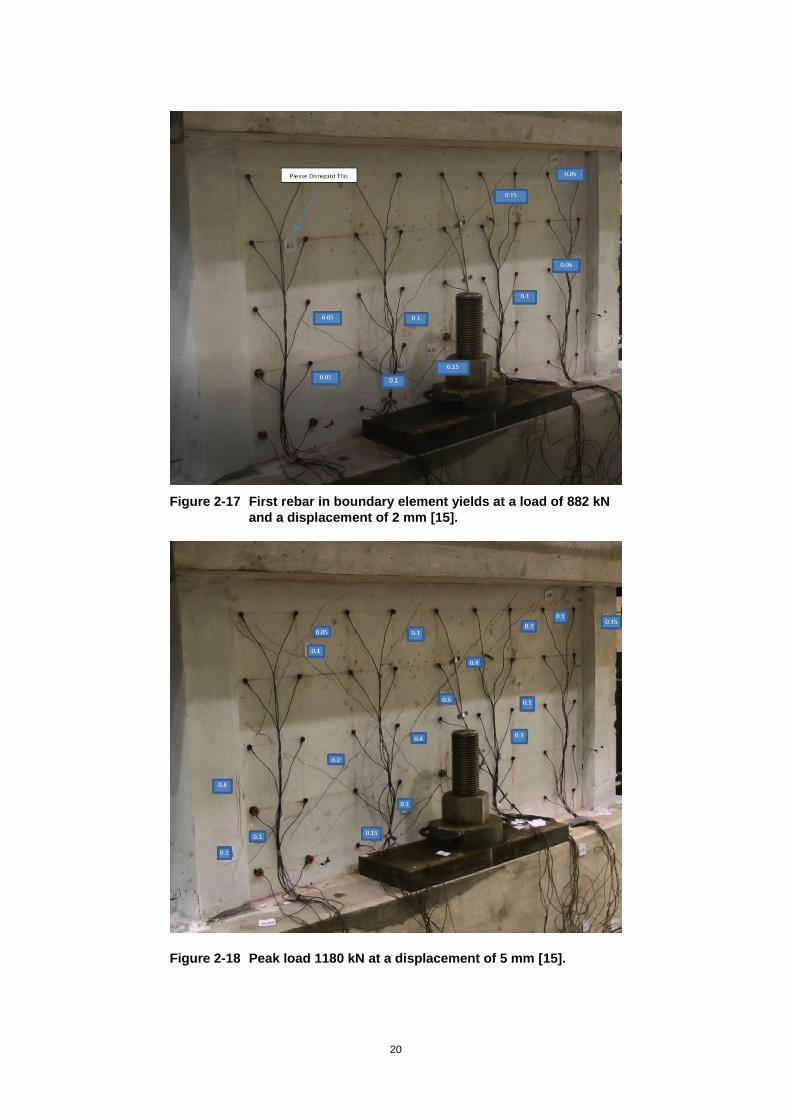
Figure 2-17 First rebar in boundary element yields at a load of 882 kN and a displacement of 2 mm [15].
Figure 2-18 Peak load 1180 kN at a displacement of 5 mm [15].
21
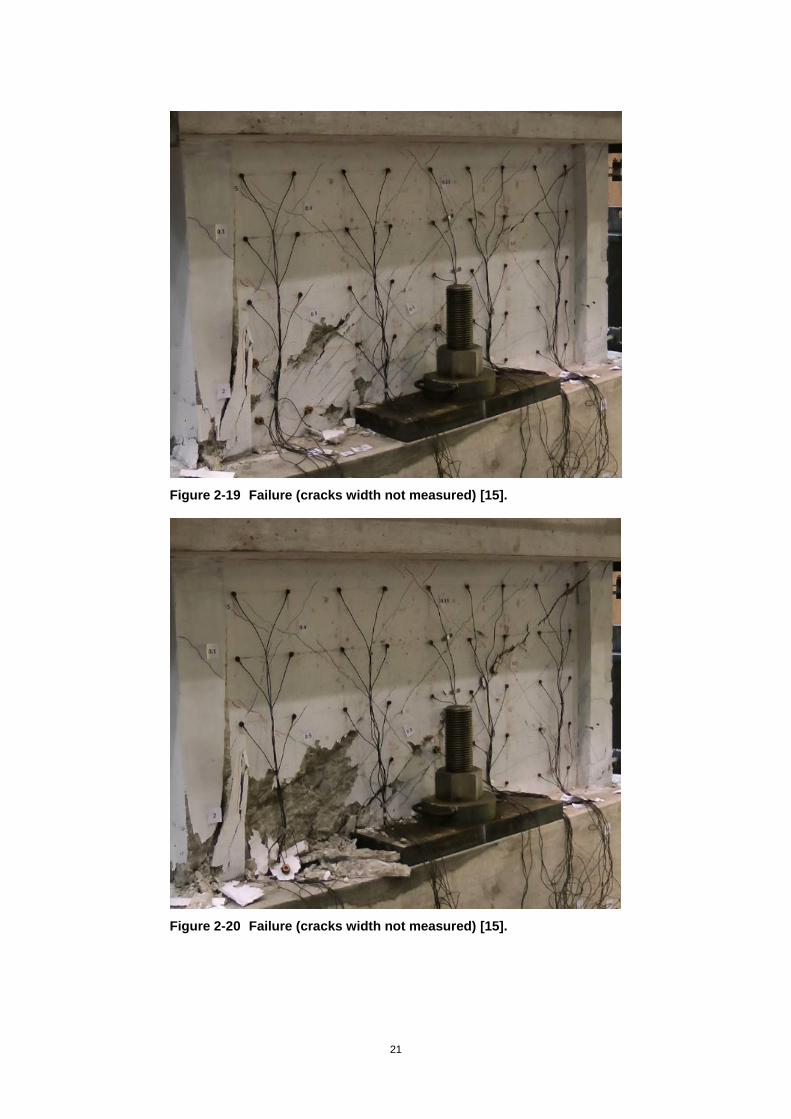
Figure 2-19 Failure (cracks width not measured) [15].
Figure 2-20 Failure (cracks width not measured) [15].
22
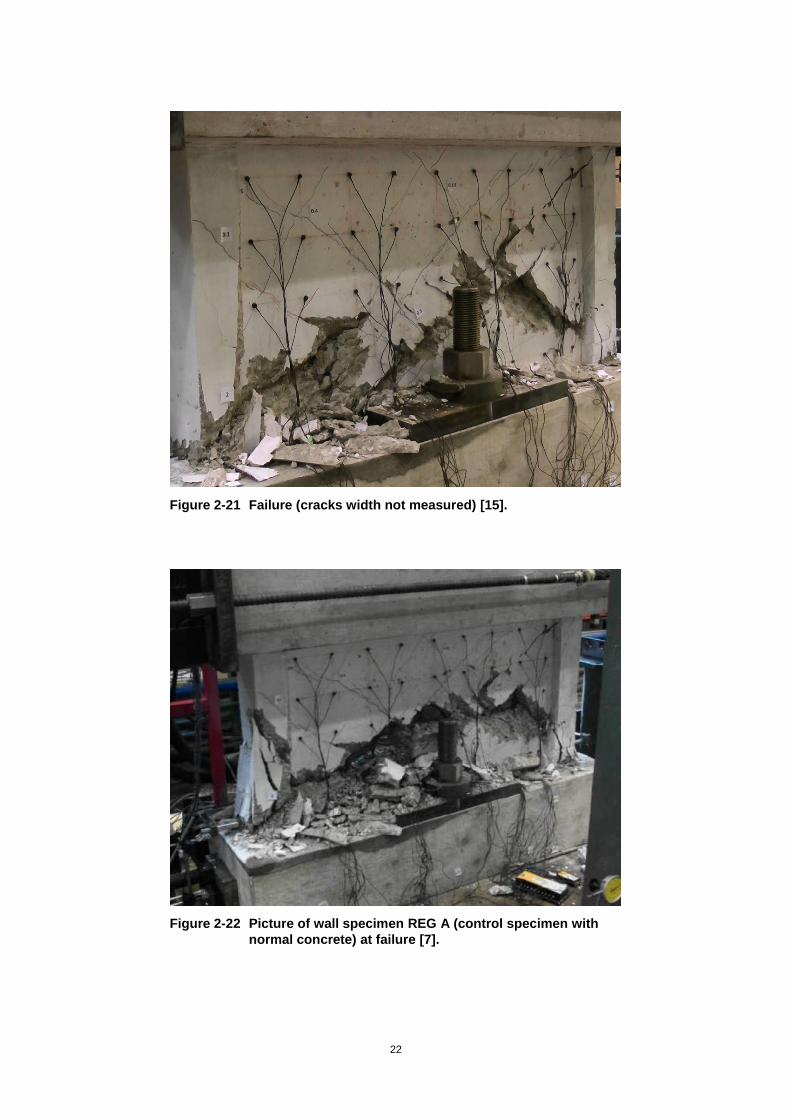
Figure 2-21 Failure (cracks width not measured) [15].
Figure 2-22 Picture of wall specimen REG A (control specimen with normal concrete) at failure [7].
23
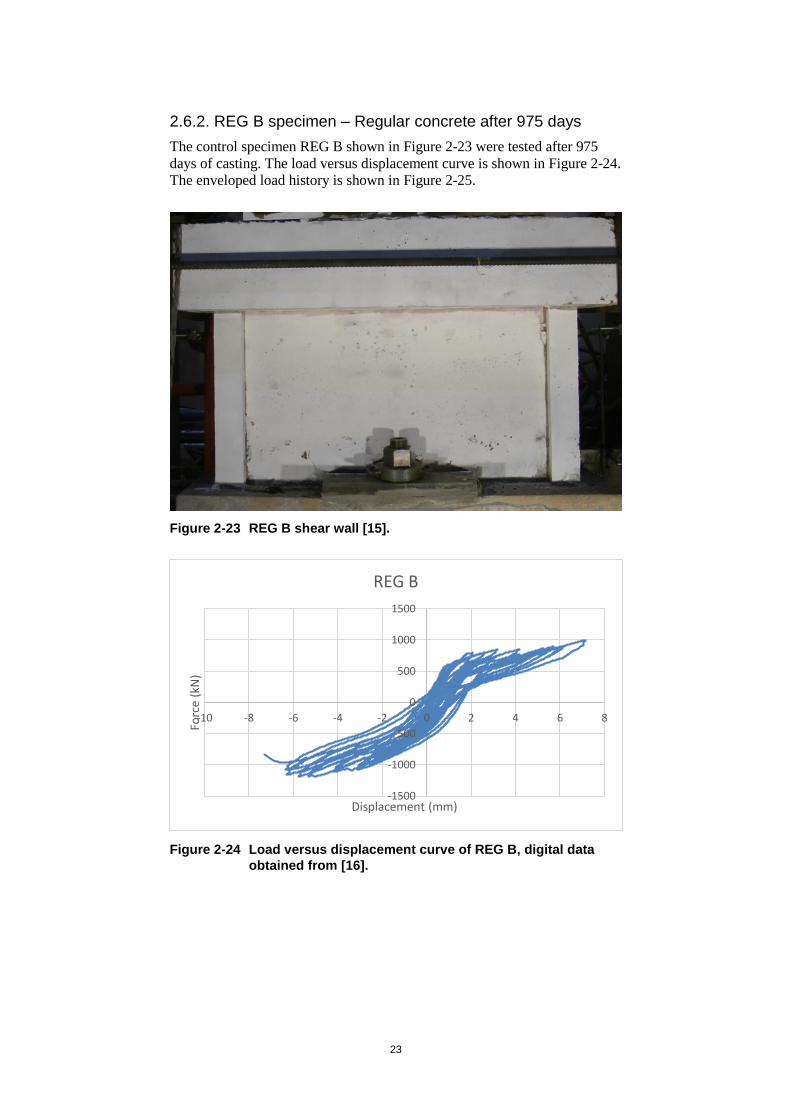
2.6.2. REG B specimen – Regular concrete after 975 days
The control specimen REG B shown in Figure 2-23 were tested after 975 days of casting. The load versus displacement curve is shown in Figure 2-24. The enveloped load history is shown in Figure 2-25.
Figure 2-23 REG B shear wall [15].
Figure 2-24 Load versus displacement curve of REG B, digital data obtained from [16].
-1500
-1000
-500
0
500
1000
1500
-10 -8 -6 -4 -2 0 2 4 6 8
Forc
e (k
N)
Displacement (mm)
REG B

24
Figure 2-25 Load-envelope versus displacement curve of Reg B shear wall [15].
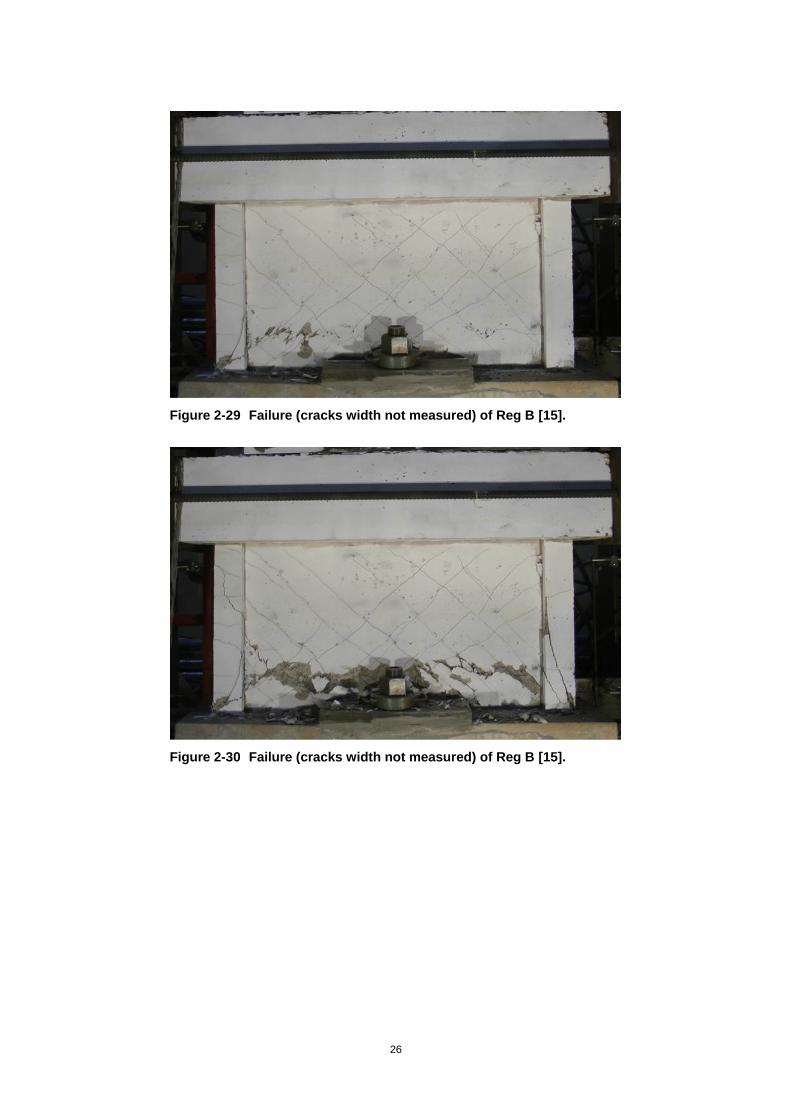
Pictures showing the cracking developed in the REG B specimen during the testing are shown in Figure 2-26 to Figure 2-31.
Figure 2-26 First crack at a load of 780 kN and a displacement of 1.4 mm of Reg B shear wall [15].

25
Figure 2-27 First rebar in boundary element yields at a load of 915 kN
and a displacement of 2 mm Reg B shear wall [15].
Figure 2-28 Peak load 1181 kN and a displacement of 5 mm of Reg B
shear wall [15].
26
Figure 2-29 Failure (cracks width not measured) of Reg B [15].
Figure 2-30 Failure (cracks width not measured) of Reg B [15].

27
Figure 2-31 Failure (cracks width not measured) of Reg B [15].
2.6.3. ASR A1 specimen – ASR reactive concrete after 260 days
The concrete specimen ASR A1 were tested 260 days after casting [10]. The lateral force as function of displacement during testing of wall specimen ASR A1 is shown in Figure 2-33. The enveloped load history is shown in Figure 2-34.
Pictures showing the cracking developed in the ASR A1 specimen during the testing are shown in Figure 2-35 to Figure 2-41.

28
Figure 2-32 ASR A1 shear wall [15].
Figure 2-33 Load versus displacement curve of ASR A1, digital data obtained from [16].
-1500
-1000
-500
0
500
1000
1500
-8 -6 -4 -2 0 2 4 6 8 10
Forc
e (k
N)
Displacement (mm)
ASR A1

29
Figure 2-34 Load-envelope versus displacement curve of ASR A1 shear wall [15].
Figure 2-35 First crack at a load of 784 kN and a displacement of 1 mm of ASR A1 shear wall [15].

30
Figure 2-36 First rebar in boundary element yields at a load of 885 kN and a displacement of 1.4 mm ASR A1 shear wall [15].
Figure 2-37 Peak load 1354 kN and a displacement of 5.2 mm of ASR A1 shear wall [15].

31
Figure 2-38 Failure (cracks width not measured) of ASR A1 [15].
Figure 2-39 Failure (cracks width not measured) of ASR A1 [15].

32
Figure 2-40 Failure (cracks width not measured) of ASR A1 [15].
Figure 2-41 Picture of wall specimen ASR A1 (specimen with ASR reactive concrete) at failure [7].
33
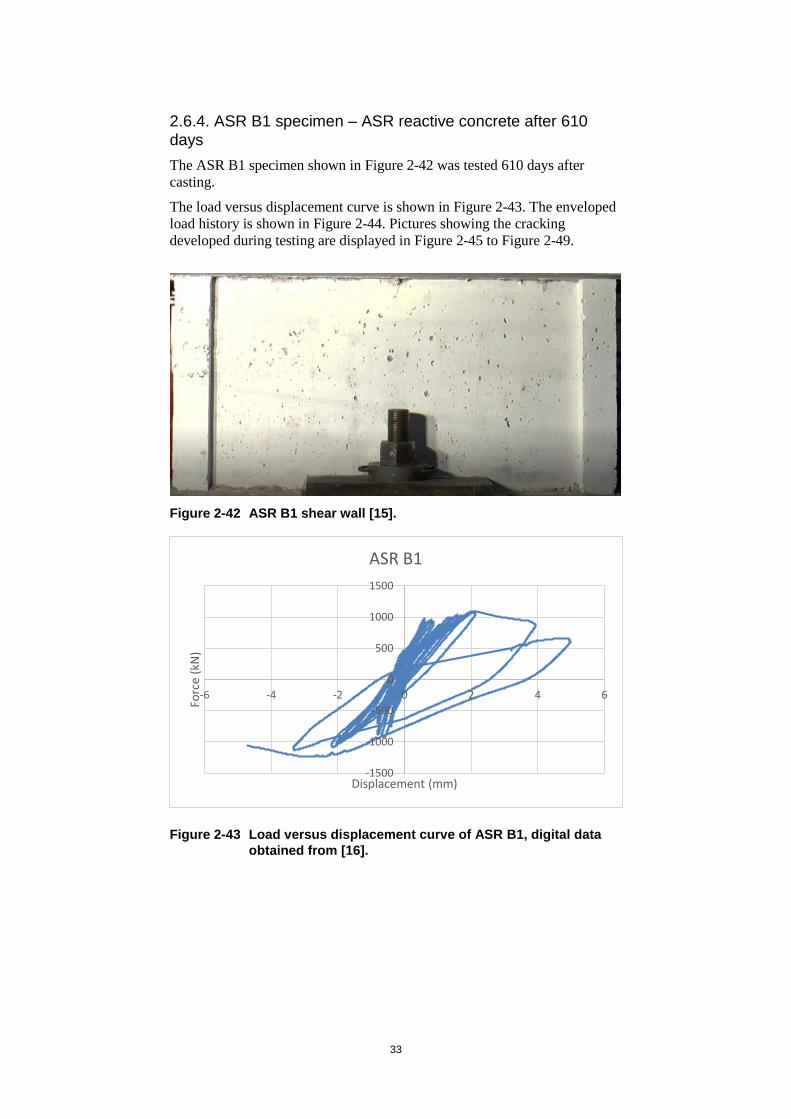
2.6.4. ASR B1 specimen – ASR reactive concrete after 610 days
The ASR B1 specimen shown in Figure 2-42 was tested 610 days after casting.
The load versus displacement curve is shown in Figure 2-43. The enveloped load history is shown in Figure 2-44. Pictures showing the cracking developed during testing are displayed in Figure 2-45 to Figure 2-49.
Figure 2-42 ASR B1 shear wall [15].
Figure 2-43 Load versus displacement curve of ASR B1, digital data obtained from [16].
-1500
-1000
-500
0
500
1000
1500
-6 -4 -2 0 2 4 6
Forc
e (k
N)
Displacement (mm)
ASR B1

34
Figure 2-44 Load-envelope versus displacement curve of ASR B1 shear wall [15].
Figure 2-45 First crack at a load of 945 kN and a displacement of 0.8 mm of ASR B1 shear wall [15].
35
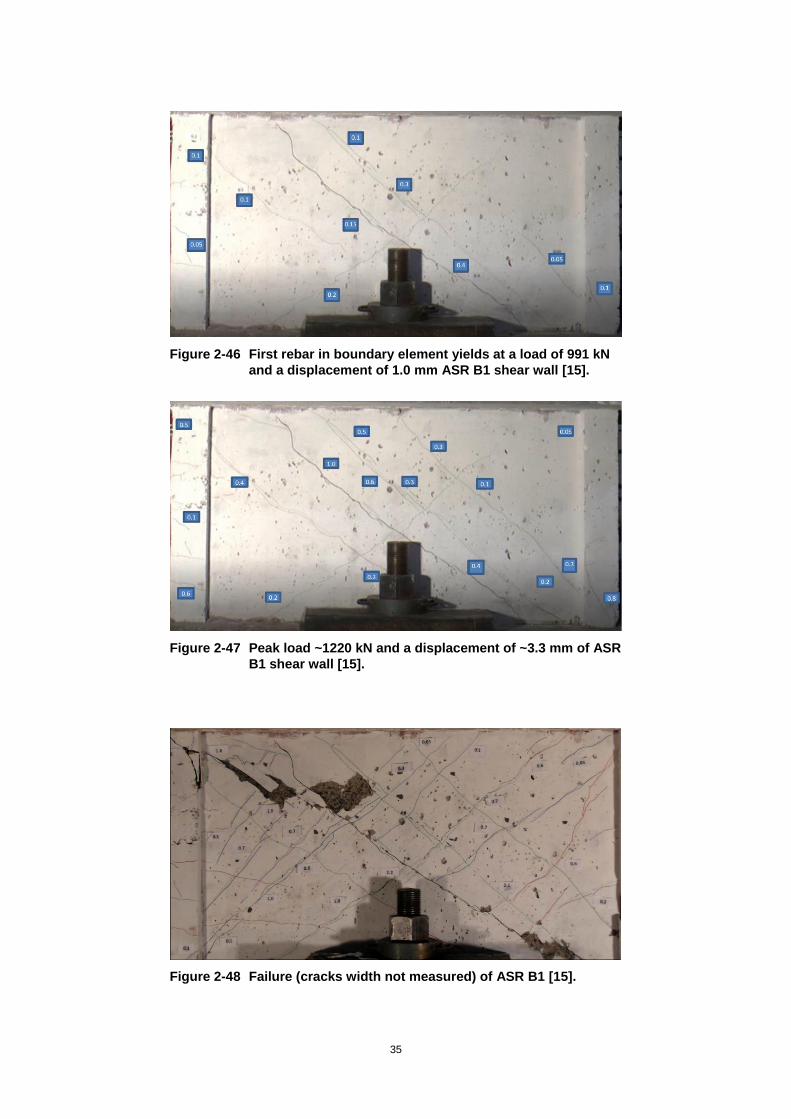
Figure 2-46 First rebar in boundary element yields at a load of 991 kN and a displacement of 1.0 mm ASR B1 shear wall [15].
Figure 2-47 Peak load ~1220 kN and a displacement of ~3.3 mm of ASR B1 shear wall [15].
Figure 2-48 Failure (cracks width not measured) of ASR B1 [15].

36
Figure 2-49 Failure (cracks width not measured) of ASR B1 [15].
2.6.5. ASR B2 specimen – ASR reactive concrete after 995 days
The ASR B2 specimen shown in Figure 2-50 was tested 995 days after casting.
The load versus displacement curve is shown in Figure 2-51. The enveloped load history is shown in Figure 2-52. Pictures showing the cracking developed during testing are displayed in Figure 2-53 to Figure 2-58.
Figure 2-50 ASR B2 shear wall [15].
37
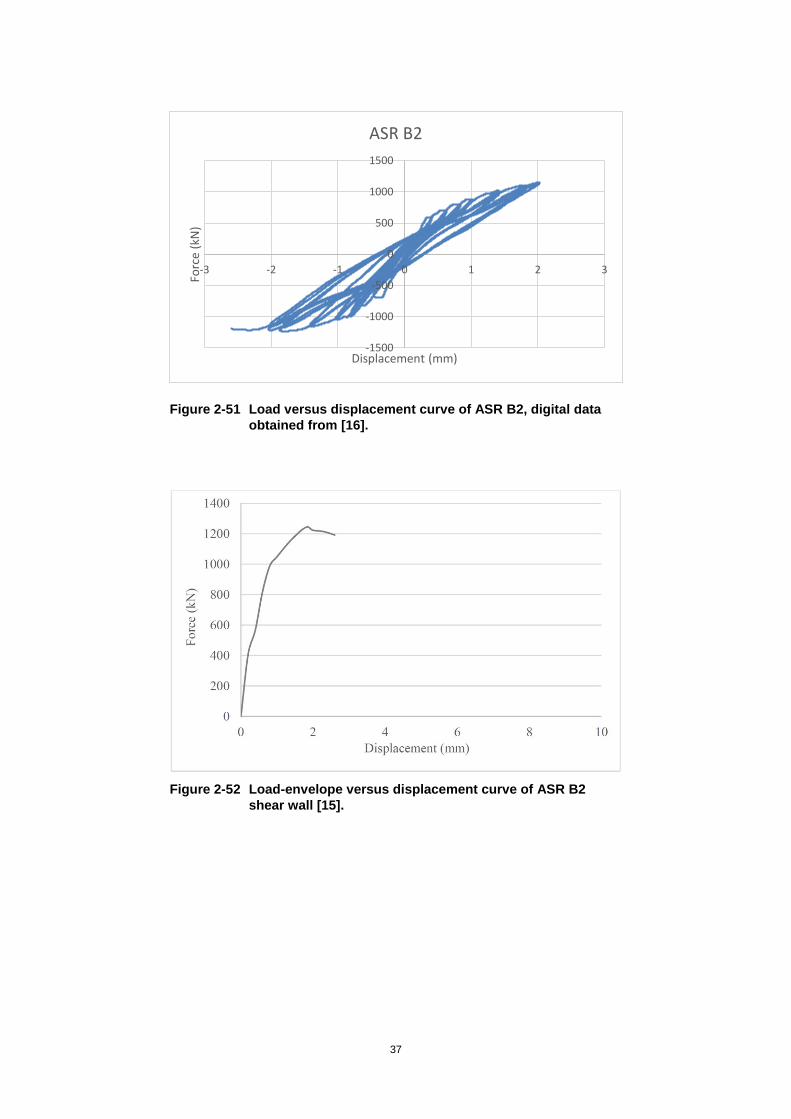
Figure 2-51 Load versus displacement curve of ASR B2, digital data obtained from [16].
Figure 2-52 Load-envelope versus displacement curve of ASR B2 shear wall [15].
-1500
-1000
-500
0
500
1000
1500
-3 -2 -1 0 1 2 3
Forc
e (k
N)
Displacement (mm)
ASR B2
38
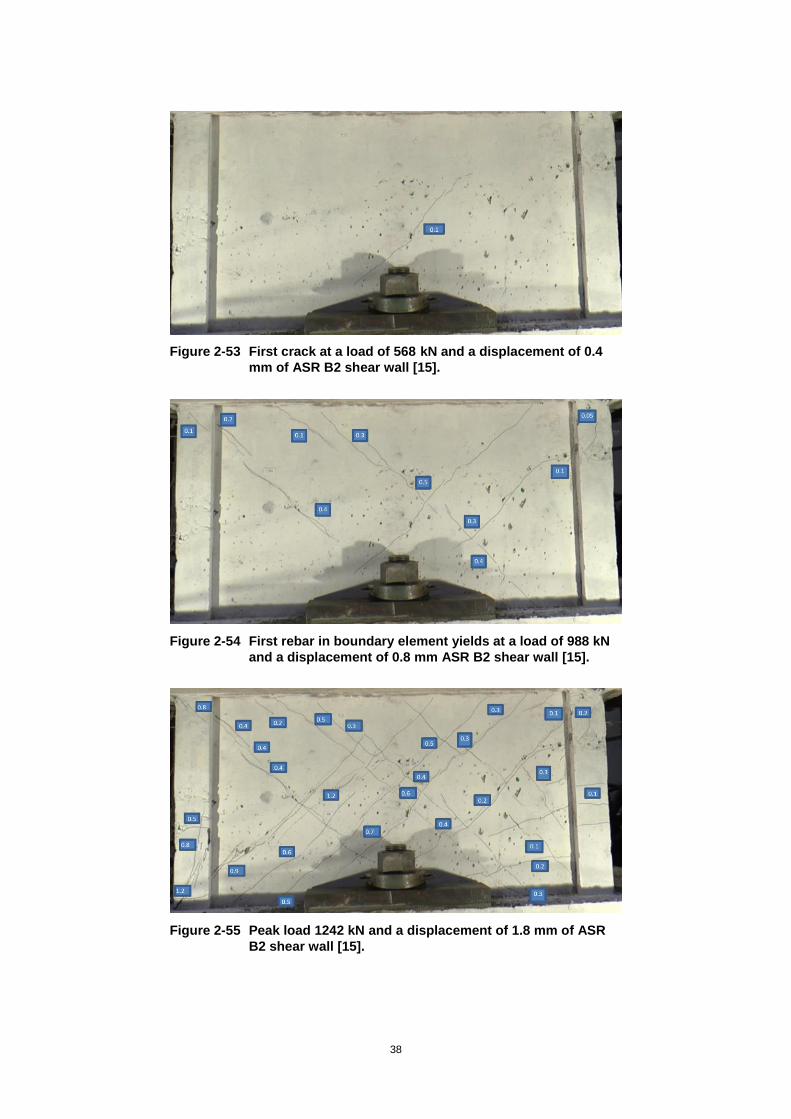
Figure 2-53 First crack at a load of 568 kN and a displacement of 0.4 mm of ASR B2 shear wall [15].
Figure 2-54 First rebar in boundary element yields at a load of 988 kN and a displacement of 0.8 mm ASR B2 shear wall [15].
Figure 2-55 Peak load 1242 kN and a displacement of 1.8 mm of ASR B2 shear wall [15].

39
Figure 2-56 Failure (cracks width not measured) of ASR B2 [15].
Figure 2-57 Failure (cracks width not measured) of ASR B2 [15].
Figure 2-58 Failure (cracks width not measured) of ASR B2 [15].

40
2.6.6. Experimental result discussion
To clarify differences in the experimental data between the different concrete configurations, in Figure 2-59 a comparison of enveloped experimental results for lateral load versus displacement relationship of both the Regular A and ASR A1 shear wall specimen are made. The experimental data in the figure is envelope force-displacement relations graphically interpreted from [7].
According to [17], it is common for ASR-affected reinforced concrete structures to have un-affected load bearing capacity, despite large expansions, extensive cracking, and decreased stiffness and strength. The effect is accredited the confinement effect of the structure as the concrete material expands, and the steel reinforcement act as a post tensioning system. However, the fact that the ASR affected wall in these particular experiments otherwise nominally identical to the wall with regular concrete, had stiffer structural behavior for the initial primarily elastic responses, despite the lower elastic material stiffness as shown in Table 2-2, raise the question of statistically determined results; Would this relation persist in case an ensemble of specimens of each type had been tested? Variations in de facto construction, as a result of workmanship and methods used, type of aggregates, material variability, and actual experimental conditions, are outside the scope of this experiment, as only one specimen of each kind (regular concrete, ASR concrete, and three different points in time) were fabricated and tested. Such variations may however be important and are not captured in idealized numerical models created using nominal data. Testing of concrete specimens, particularly when loaded in shear, may result in a large result scatter, and statistical experimental aspects should not be neglected.
Figure 2-59 Comparison of experimental results for lateral load versus displacement relationship of Regular A and ASR A1 shear wall specimen. Envelope data from [7].
41
2.7. Aspects of the experimental tests compared to actual structures
The aim of the experimental campaign is, in the end, to study the structural effect of ASR with respect to actual structures in the nuclear industry. In this perspective, it should be mentioned that the studied scale models, 100 mm thick shear walls, used in the experiments include only a single layer of orthogonal web reinforcement, located at the wall center surface. No shear reinforcement, stirrups, are included in the test specimen structure due to this thin (scaled) wall thickness. For the ASR affected concrete walls in the experiments this may mean no, or very little, confining pressure in the wall thickness direction. This may differ from conventional concrete shear wall design in nuclear power plants.
It should also be noted that the laboratory experiments conducted do not include any environment or combined effects related to durability issues, as for example ASR in combination with repeated cycles of freeze-thaw. The experimental results may consequently be valid as indicators on the structural capacity due to material degradation due to ASR only, which is indeed already complex. However, this note is included to draw attention to the fact that concrete structures residing outside (PWR containments) may experience important combined effects, and conclusions based on the experimental results, directly applied and valid to actual structures, may not be possible.

42
3. Numerical model
3.1. General
This chapter describes the numerical models used in the simulations of the reinforced concrete shear wall experiments presented in the previous chapter. The intention is to present reasonable transparent modelling assumptions.
Numerical simulations within this work are performed using the Finite Element (FE) solver ABAQUS/Explicit, which is a well-known and, for many types of problems, thoroughly tested general purpose finite element program [3].
The concrete material model used in the numerical simulations is called Concrete Damaged Plasticity (CDP). A brief presentation of this constitutive model is given in section 3.3. Both concrete (specimen central wall) and reinforcement are modelled using non-linear behavior.
It was decided to base the material parameter input on experimental derived values, as was done in phase 2 [2]. As such, the used material model can be referred to previous work carried out in phase 2 of this benchmark [2].
In phase 3, a model for the interaction at the interface between the reinforcement and the concrete was implemented, allowing the reinforcement to “slip” relative to the concrete. In phase 2, the reinforcement was completely tied to concrete, which was identified as a weakness in the numerical model [2]. The bond-slip model is presented in section 3.6.
An important observation from phase 2 was that the response from cyclic loading was less satisfactory [2] compared to monotonic loading. Hence, it was decided to only analyze the response from monotonic loading in phase 3.
3.2. Used numerical simulation software
The Finite Element software used for the numerical simulations are limited to the explicit wave front solver ABAQUS/Explicit [3]. The software is widely used, and well proven and validated, for a wide range of problems in many different industries.
The explicit solver is favored here, instead of the implicit solver, due to the large deformations, and highly non-linear material behavior. The implicit solver is concluded to give similar results for low level deformations, up to a certain limit where numerical convergence difficulties interrupt calculations.

43
3.3. Constitutive concrete model
Numerical simulations presented in this report has been carried out using the Concrete Damaged Plasticity (CDP) material model implementation in ABAQUS. The CDP model provides a general capability for modelling concrete (quasi-brittle) materials in all types of structure elements, e.g. beams, trusses, shells, and solids. The material model is described in detail in the software documentation [3] and in the ASCET phase 2-report [2].
3.3.1. Used material model input
Concrete material parameters for the base model used in simulations of the normal concrete test specimen, REG A (see Table 2-1), are summarized in Table 3-1. Some input parameters listed in the table are more or less to be considered as standard concrete material parameters, here either taken from the Eurocode 2 design standard [18], or experimentally measured values (presented in sections 2.3), whereas some of the input parameters are related to the specific implementation of the constitutive model. General motivations for each parameter are therefore included in the table. Since the analyses are performed with the ABAQUS/Explicit solver, the viscosity parameter μ is not in effect.

44
Table 3-1 Concrete material model input used in simulations of the intended normal (regular) concrete test specimen, REG A.
Parameter Description Value (@ T=20°C)
E Initial, undamaged, modulus of elasticity (experimentally
measured)
47.15 GPa
ʋ Poisson’s ratio (standard value) 0.2
ρ Density (standard value without reinforcement steel) 2250 kg/m3
ψ Dilation angle, in degrees (chosen based on previous
studies and [3])
38
𝜖 Flow potential eccentricity (default program value) 0.1
σb0/σc0 Ratio of initial equibiaxial compressive yield stress to
initial uniaxial compressive yield stress (default program
value)
1.16
Kc Ratio of the second stress invariant on the tensile
meridian to that on the compressive meridian at initial
yield for any given value of the pressure invariant such
that the maximum principal stress is negative (default
program value)
0.667
σcu Ultimate compressive stress, here set to stress at
concrete crushing strain, 3.5‰ (experimentally
measured)
79.0 MPa
σt0 Failure tensile stress (experimentally measured) 4.76 MPa
GF Fracture energy (experimentally measured) 179.3 N/m
dc Concrete compression damage Figure 3-2
wt Recovery of tension after concrete compression damage
(0 mean that after compressive failure, no matter the
size, no tensional forces are transmitted through the
crack)
0.0
- Maximum value of concrete tension damage (default
program value)
0.9 (linear
variation from 0)
𝑢𝑡0𝑐𝑘 Crack displacement at maximum value of concrete
tension damage
0.18 mm
wc Recovery of compression capability after concrete
tension damage (1 mean that after failure initiation in
tension, compressive forces are still transmitted through
the crack)
1.0

45
Figure 3-1 Concrete model behavior in uniaxial compression. The function is defined linear up to 40 % of the ultimate compression value, according to EC2 [18].
Figure 3-2 Concrete model compression damage definition (dc).
Figure 3-3 Concrete model behavior in uniaxial tension for the two different options; Two parameter (TYPE=GFI) definition, and Tabular definition. Ultimate tension stress and fracture energy are here identical for the two definition options shown in the figure.

46
3.4. Base numerical model overview
The base model used in the simulations presented in this report is visualized in Figure 3-4 below. The upper and lower beams are modeled using 8-node hexagonal reduced integration elements, C3D8R [3], with default hourglass stiffness. These elements have linear only material properties. The wall part, and stabilizing vertical end columns, are modeled using 10-node modified tetrahedron elements, type C3D10M [3]. The model of the wall is tied to the model of the lower and upper beams, to couple not only the end nodes of the C3D10M elements, but also the mid-point nodes. The characteristic element side length is 25 mm for all elements in the base model.
The actual specimen construction sequence, and whether a division into different casting parts were made during construction, is unknown. It is therefore assumed that the specimens each were casted at one time, and no casting joints are present in the specimens. In the numerical model, no weak sections are included between the lower and upper beam and the wall section, and the concrete model is considered homogenous without considering differential casting effects.
Additional masses from equipment are assumed to weigh half a metric ton (500 kg). This mass is applied and evenly distributed at the top surface of the upper beam.
Figure 3-4 Visualization of concrete solid element model, created using the nominal measures in [10].
47
3.5. Model of steel reinforcement bars
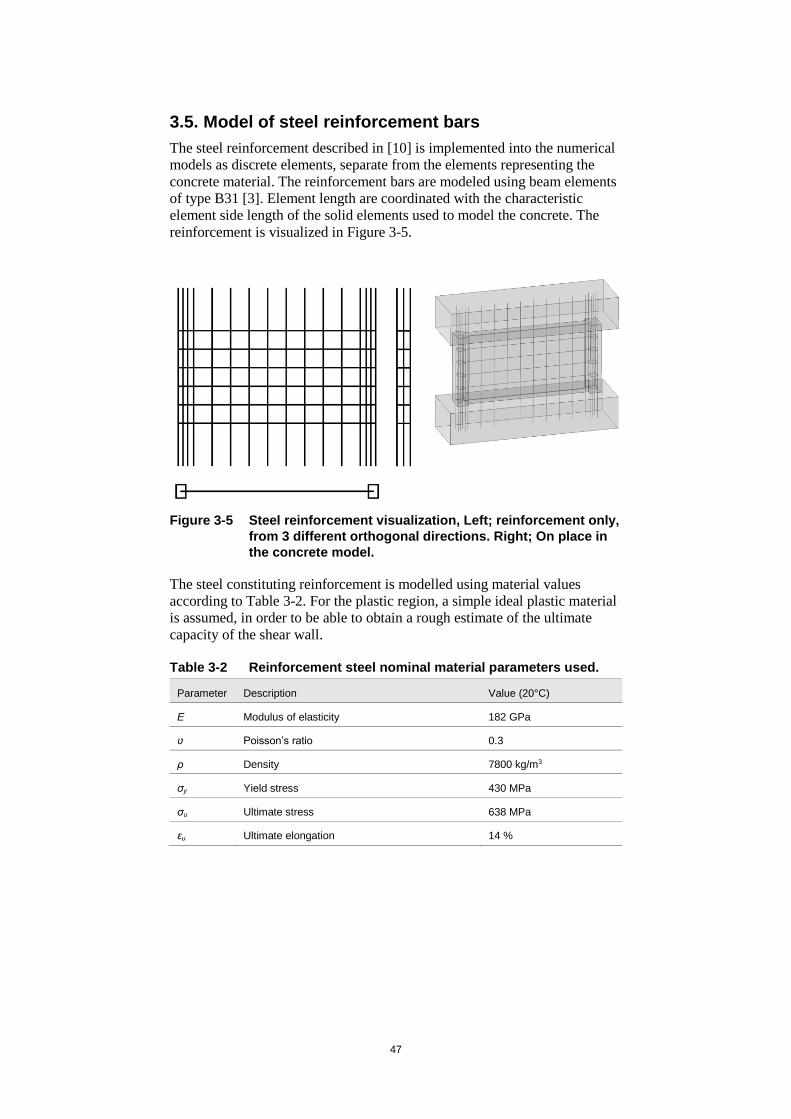
The steel reinforcement described in [10] is implemented into the numerical models as discrete elements, separate from the elements representing the concrete material. The reinforcement bars are modeled using beam elements of type B31 [3]. Element length are coordinated with the characteristic element side length of the solid elements used to model the concrete. The reinforcement is visualized in Figure 3-5.
Figure 3-5 Steel reinforcement visualization, Left; reinforcement only, from 3 different orthogonal directions. Right; On place in the concrete model.
The steel constituting reinforcement is modelled using material values according to Table 3-2. For the plastic region, a simple ideal plastic material is assumed, in order to be able to obtain a rough estimate of the ultimate capacity of the shear wall.
Table 3-2 Reinforcement steel nominal material parameters used.
Parameter Description Value (20°C)
E Modulus of elasticity 182 GPa
ʋ Poisson’s ratio 0.3
ρ Density 7800 kg/m3
σy Yield stress 430 MPa
σu Ultimate stress 638 MPa
εu Ultimate elongation 14 %

48
3.6. Bond-slip model for reinforcement
In phase 2, the concrete and the reinforcement elements were completely tied together without any coupling describing the non-linear effects at the interface. This was an identified limitation of the used numerical model [2].
When reinforced concrete experiences cracking, the reinforcement “slips”
towards the crack. It does so because the reinforcement transfers tension forces across the cracked cross-section. As such, bond-forces also emerge at the interface a certain transmission length from both sides of the crack. The relationship between the slip and bond-force is known as bond-slip.
Bond-slip, as a phenomenon, is fundamental for reinforced concrete to work as a composite material, however it is often not considered in numerical models. In other words, a perfect bond between the reinforcement and the concrete is normally assumed. This assumption could be valid in un-cracked concrete regions but in order to explain crack widths, the concrete and the reinforcement must experience different strains and ultimately a slip must be present.
While the slip is a real phenomenon, is it an important parameter to include in a numerical model? It is likely to be an important parameter for ductile behavior since the crack propagation affects the stiffness of the structure and maybe even more so in ASR affected concrete if the bond is deteriorated.
The material model in Abaqus, Concrete Damaged Plasticity, is independent of the rebar, i.e. there is no consideration to the bond interface in the material itself. Although, it is possible to mimic post-cracking behavior by introducing tension stiffening to the plain concrete. The bond-slip model presented here maintains an independent material model where the bond interface is explicitly considered using connector elements between the concrete and the reinforcement. Each connector element is governed by a force-displacement curve, derived from a local bond-slip relationship 𝜏𝑏(𝑠) where the local bond stress 𝜏𝑏 is a function of the local slip 𝑠. The connector elements are of type CONN3D2 in Abaqus.
While the beam nodes of the reinforcement are natural connection points for the connector elements, the connection points in the solid concrete mesh are less obvious. In order to connect the reinforcement to the solid concrete mesh, a “dummy” mesh with identical topology as the reinforcement was
first “embedded” in the solid mesh. This embedded element technique in
Abaqus is used for constraining translational degrees of freedom of an embedded node to follow interpolated values of corresponding degrees of freedom in a host element. The dummy elements are modelled as very thin bars without any significant stiffness.
The reinforcement is connected to the dummy mesh, node-by-node, using the connector elements describing the local bond-slip relationship. On a macro level this is visualized in Figure 3-6 where the embedded dummy mesh is shown to the left together with a piece of the solid concrete host. The reinforcement mesh is shown to the right as superimposed on the embedded mesh. The connector elements have zero length and are shown as Cartesian coordinate systems below.

49
Figure 3-6 Embedded dummy elements (left) and reinforcement elements (right).
Figure 3-7 Connector elements connecting embedded dummy nodes with reinforcement nodes.
The slip 𝑠 is in the numerical model defined as the relative displacement component, parallel with the reinforcement, between the embedded node and the reinforcement node. The bond-stress 𝜏𝑏(𝑠) is assumed to be uniform over one bar element length. As such, the bond force 𝐹𝑏 in one connector element is the bond stress multiplied with the interfacial area 𝐴𝑠 of the reinforcement element:
𝐹𝑏(𝑠) = 𝜏𝑏(𝑠) ⋅ 𝐴𝑠
General local bond-slip relationship 𝜏𝑏(𝑠) can be determined from pull-out tests where a reinforcement bar is pulled through a concrete specimen. In Figure 3-8, such experiment is visualized.
50
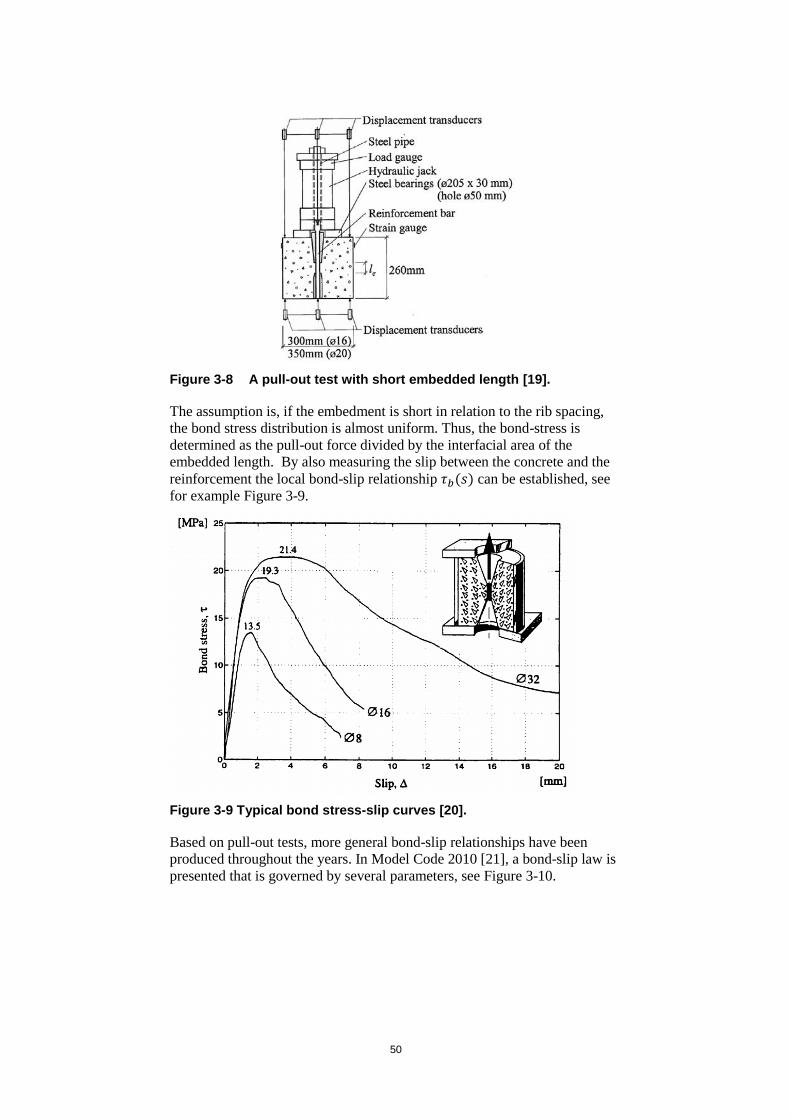
Figure 3-8 A pull-out test with short embedded length [19].
The assumption is, if the embedment is short in relation to the rib spacing, the bond stress distribution is almost uniform. Thus, the bond-stress is determined as the pull-out force divided by the interfacial area of the embedded length. By also measuring the slip between the concrete and the reinforcement the local bond-slip relationship 𝜏𝑏(𝑠) can be established, see for example Figure 3-9.
Figure 3-9 Typical bond stress-slip curves [20].
Based on pull-out tests, more general bond-slip relationships have been produced throughout the years. In Model Code 2010 [21], a bond-slip law is presented that is governed by several parameters, see Figure 3-10.

51
Figure 3-10 Parameterized bond-slip relationship [21].
The essential information in Figure 3-10 is that the bond-slip relationship takes different shapes depending on the failure mode. If for example the reinforcement is poorly confined by a thin concrete cover one could expect a splitting failure, i.e. cracks emerging radially from the reinforcement across the whole concrete thickness. Such failures are characterized as sudden and abrupt, i.e. almost all bond strength is lost immediately at the interface.
If the radial cracks can be confined inside a smaller radius around the reinforcement, it is possible to pull out the reinforcement without splitting the concrete completely. A pull-out failure is a much slower deterioration of the bond-strength as it remains relatively high despite increasing slips. The concrete in front of the ribs are either crushed or sheared off and when the slip has reached one rib-spacing, 𝑠3 in Figure 3-10, the residual bond is carried by friction.
The bond-slip model used in this benchmark adopts the Model Code 2010 [21] bond-slip model but neglects the descending branch of the bond-slip relationship. This means the bond reaches a maximum bond-stress 𝜏𝑏𝑚𝑎𝑥 at a slip 𝑠1 and remains at a constant stress level until un-loaded. The rationale behind this decision was the fact that the slips were very small, in general smaller than 𝑠1. Also, introducing bond-failure was considered as a very uncertain parameter to an already sensitive bond-slip model.
The ascending branch of the bond-slip relationship in Model Code 2010 [21] is defined as:
𝜏𝑏 = 𝜏𝑏𝑚𝑎𝑥 (𝑠
𝑠1)
𝛼 for 𝑠 ≤ 𝑠1
The parameter 𝜏𝑏𝑚𝑎𝑥 is the highest possible bond-stress. It is common for standardized bond-slip relationships to relate this parameter to the mean compressive strength of the concrete. In Model Code 2010 [21] the parameter is also related to the bond conditions, which is only defined as either “good bond conditions” or “all other bond conditions”. It is unknown
how to precisely evaluate which of these, seemingly broad definitions, the

52
bond conditions apply. However, assuming the casting direction of the concrete squat wall was perpendicular to the reinforcement, the bond condition can be evaluated as “good” according to SS-EN 1992-1-1:2005 clause 8.4.2 [18]. Since the wall thickness is less than 250 mm, good bond conditions were ultimately chosen.
Figure 3-11 Good bond conditions apply to casting situation a and b [18].
For good bond conditions, the maximum bond stress 𝜏𝑏𝑚𝑎𝑥 is related to the mean compressive strength of the concrete, according to Model Code 2010 [21], as:
𝜏𝑏𝑚𝑎𝑥 = 2.5 ⋅ √𝑓𝑐𝑚
Besides “good bond conditions”, the following assumptions and
simplifications are also made:
1. Splitting failure is avoided through well confined concrete. 2. The bond stress is independent of the reinforcement yield strain.
The influence of splitting has already been discussed. From the experiments, there are no visual evidence of splitting failures occurring and the assumption appears to be valid without a detailed analysis of the confinement. Furthermore, bond-failure was, as mentioned, considered a too uncertain parameter to introduce.
When the reinforcement enters the plastic range, its ability to transfer bond-stress is reduced. This effect is not included, although it should be recognized as an important parameter for a general bond-slip model.
It follows from the Model Code 2010 [21] bond-slip relationship that the maximum bond stress is reached at 1mm slip given all conditions presented above. The implemented bond-slip curve is given below.
𝜏𝑏 = 2.5 ⋅ √𝑓𝑐𝑚 ⋅ (𝑠
1 𝑚𝑚)
𝛼 for 𝑠 ≤ 1mm
53
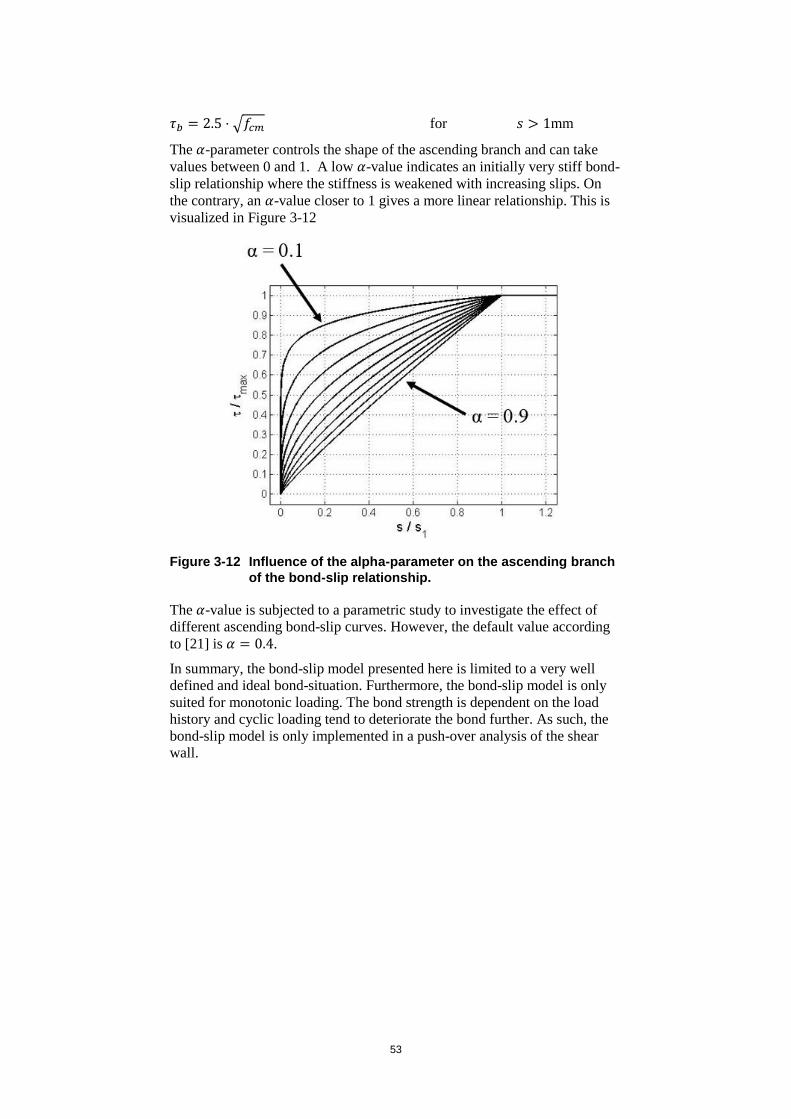
𝜏𝑏 = 2.5 ⋅ √𝑓𝑐𝑚 for 𝑠 > 1mm
The 𝛼-parameter controls the shape of the ascending branch and can take values between 0 and 1. A low 𝛼-value indicates an initially very stiff bond-slip relationship where the stiffness is weakened with increasing slips. On the contrary, an 𝛼-value closer to 1 gives a more linear relationship. This is visualized in Figure 3-12
Figure 3-12 Influence of the alpha-parameter on the ascending branch of the bond-slip relationship.
The 𝛼-value is subjected to a parametric study to investigate the effect of different ascending bond-slip curves. However, the default value according to [21] is 𝛼 = 0.4.
In summary, the bond-slip model presented here is limited to a very well defined and ideal bond-situation. Furthermore, the bond-slip model is only suited for monotonic loading. The bond strength is dependent on the load history and cyclic loading tend to deteriorate the bond further. As such, the bond-slip model is only implemented in a push-over analysis of the shear wall.

54
3.7. Loads and boundary conditions
The testing set up is visualized in Figure 3-13.
Figure 3-13 Overview visualization of the experimental shear wall test setup [13].
The applied vertical load of 800 kN is modelled as a pressure load on the top beam. There are no modelling efforts to constrain in-plane rotations of the top beam. The effects of in-plane rotation constraints were however investigated in phase 2 [2] showing the failure mode and capacity is very dependent on the in-plane rotation of the top beam, see Figure 3-14.
Figure 3-14 Comparison of whole wall horizontal push over capacity functions for the two different upper beam rotation capabilities.
The bottom beam was held at place using contact interaction with friction between the bottom beam and three rigid surfaces; one simulating the floor and two simulating the hold-down plates, see Figure 3-15. Surface friction is kept low during the ASR-expansion (to allow stress free expansion) and then ramped to very high at the beginning of the loading step to simulate an essentially slip-free surface. Contact surface definitions allow for separation after contact.

55
Figure 3-15 Visualization of model. Contact surfaces used for the bottom beam are marked light red. Nodes used for application of prescribed horizontal displacement are highlighted in dark red color.
The horizontal movements of the top beam, by the two horizontal jacks, having each a nominal capacity of 1000 kN [7], are modeled using displacement controlled boundary conditions of the top beam geometric center position in the x-y plane. See Figure 3-15 for model orientation with coordinate system, and the row of nodes used for application of prescribed horizontal displacement (highlighted in dark red color).
Gravity loading in the vertical direction has also been applied on all elements, including an assumed additional equivalent equipment mass of 500 kg to account for steel equipment at the top beam. The actual mass of equipment on top of the top beam is not known.
3.8. Simulation types and procedures
The model is simulated with the ABAQUS/Explicit solver [3]. The actual event can be considered quasi-static and the displacements were applied sufficiently slowly, including only a minimal amount of kinetic energy.
The simulations were divided into two subsequent simulation steps. An initial step, which include application of gravity load and the vertical force, and a subsequent step simulating the experiment. For the ASR simulations, the expansion was also included in the first simulation step.
The event was simulated as a monotonic push-over. This type of procedure was chosen due to a few reasons:
Monotonic push-over gave favorable results compared to cyclic load in phase 2 [2].

56
The bond-slip model made CPU-parallelization impossible and analyzing the cyclic event was infeasible within the time frame.
A cyclic bond-slip model was never fully developed due to reasons above.
3.9. Modelling of ASR effects
The approach to modeling the ASR effects are no different from that in phase 2 [2]. Two aspects of the ASR-effects are considered: the material expansion and the material property changes.
3.9.1. Material expansion
Material expansion in the concrete is modelled using an equivalent isotropic thermal expansion. The expansion is modelled uniform in the entire test specimen, as a simplification and in absence of other information, which is likely not the case for any real structure. Conceptual explanations of material expansion due to ASR are described further in [7].
Experimentally measured free swelling of small concrete samples related to the shear wall studied here are presented in [10], and accounted for in Table 2-3. Based on this the free expansion at the ASR A1 test 250 days after casting is assumed to be 0.185 %.
Although not explicitly stated in any of the ASCET reference documents, the entire test specimen, including upper and lower beam elements, are assumed to be of the same reactive concrete type in the numerical models.
3.9.2. Material property changes
According to [6] and [7], the tensile strength and stiffness of the concrete is more affected by AAR than the compressive material strength, which is consistent with the conclusions in the literature study [9], and in [17].
Material property changes due to ASR include stiffness and strength parameter reductions, which in the numerical simulations of the ASR test specimens are selected according to the given values, specified in Table 2-2.
57
4. Results and comparisons In this chapter, some selected results from the numerical work performed within the benchmark participation are presented. The ASCET phase 3 was focused on improving the numerical analyses obtained from phase 2 with respect to:
1) Ductility 2) Failure mode 3) Crack pattern
Improvements made from phase 2 was the implementation of a bond-slip model taking interaction between the concrete and reinforcement into account. Analysis results obtained in phase 3 will be compared and discussed in light of this adjustment.
In the experiments [14] failure was considered when the shear wall was no longer capable of taking 40 percent of the applied vertical load. It is not possible to verify this in the numerical model, as the vertical force is kept constant. Failure is instead considered as when the shear load drops to half of the shear walls full capacity. This definition is not in line with the numerical failure definition from phase 2 [2] where failure was based on crack formation. Due to discrepancies in failure definition between testing and numerical predictions, “ultimate displacement” is not quantifiably compared.
Due to numerical issues simulations including ASR effects for other specimen than A1 has not been accomplished.
Displacements are magnified with a factor of 20, unless stated otherwise, in figures presented in this chapter.
58
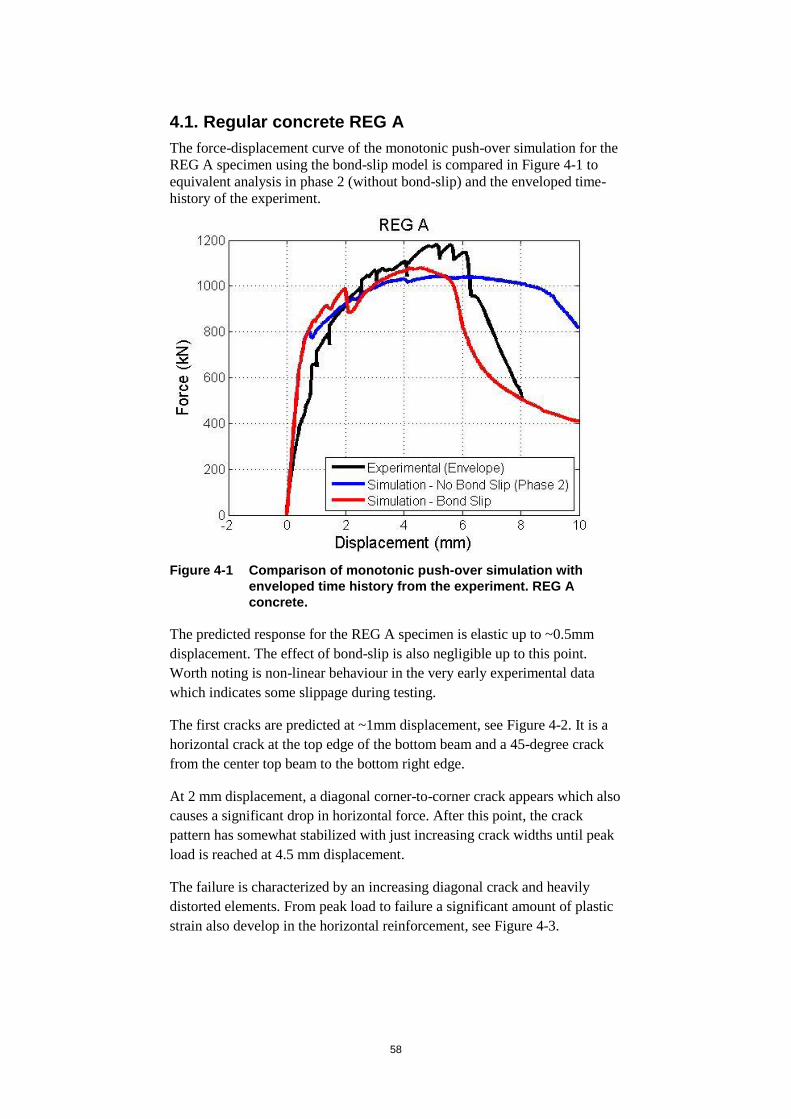
4.1. Regular concrete REG A
The force-displacement curve of the monotonic push-over simulation for the REG A specimen using the bond-slip model is compared in Figure 4-1 to equivalent analysis in phase 2 (without bond-slip) and the enveloped time-history of the experiment.
Figure 4-1 Comparison of monotonic push-over simulation with enveloped time history from the experiment. REG A concrete.
The predicted response for the REG A specimen is elastic up to ~0.5mm displacement. The effect of bond-slip is also negligible up to this point. Worth noting is non-linear behaviour in the very early experimental data which indicates some slippage during testing.
The first cracks are predicted at ~1mm displacement, see Figure 4-2. It is a horizontal crack at the top edge of the bottom beam and a 45-degree crack from the center top beam to the bottom right edge.
At 2 mm displacement, a diagonal corner-to-corner crack appears which also causes a significant drop in horizontal force. After this point, the crack pattern has somewhat stabilized with just increasing crack widths until peak load is reached at 4.5 mm displacement.
The failure is characterized by an increasing diagonal crack and heavily distorted elements. From peak load to failure a significant amount of plastic strain also develop in the horizontal reinforcement, see Figure 4-3.

59
Figure 4 - 2 Different crack ing stages in REG A - simulation .
Figure 4 - 3 Plastic strains in reinforcement at peak load (left) andfailure (right) .
T his failure mode is caused by an insufficient amount of horizontalreinforcement which is not able to carry the tension forces across thediagonal crack once plasticity is reached for all horizontal rebars . Thisfailure mode is different from the phase 2 simulation [2] which seemed to bea combined shear mode, wher e the compression struts finally sequentiallyjoined (forming a diagonal crack) and collapse d , see Figure 4 - 4 .
1 mm: First cracks 2 mm: Diagonal crack forming
4.5 mm: Peak load 9 mm: Failure

60
Figure 4-4 Visualization of (close to) ultimate crack pattern and failure mode for the REG A specimen, obtained from phase 2 [2]. Left figure show tension damage, and right figure show compression damage, at 8.2 mm horizontal displacement.
The plastic strains in the reinforcement obtained from phase 2 [2] are displayed in Figure 4-5. It can be seen that plasticity was mainly developed in the vertical reinforcement.
Figure 4-5 Predicted reinforcement equivalent plastic strain at 10 mm horizontal displacement, for the REG A specimen obtained from phase 2 [2].
In the phase 3 simulation, the relative displacement between the reinforcement and the concrete was very small. The maximum slip obtained was ~1.0 mm and on average the slip around cracked regions was around 0.05 to 0.1 mm, see Figure 4-6.

61
Figure 4-6 Relative displacement (slip) in connector elements at failure. REG A specimen.
Despite very small slips, the bond-slip model introduced a significantly different stress distribution and ultimately, a completely changed failure mode. Consequently, a sensitivity analysis of the initial bond stiffness was carried out. The initial stiffness is controlled by the alpha parameter, which had a default value of 0.4 according to [21]. A set of 5 alpha values were tested, between 0.2 and 0.6, see Figure 4-7.
Figure 4-7 Bond-slip alpha values used in sensitivity analyses.
The results from the analyses are gathered in Figure 4-8.

62
Figure 4 - 8 Comparison of analyses using different bond stiffnessparameter alpha. REG A specimen.
An apparent cliff - edge was found between alpha values 0.3 and 0.4completely changing the load curve in Figure 4 - 8 . For alpha values of 0.2and 0.3 the load curve is reminiscent of that from phase 2, i.e. very ductilewithout any sudden drop in force. The cliff - edge effect is also related to thecrack - pat tern, see Figure 4 - 9 . For alpha values 0.4 and higher diagonalcracks were obtained ultimately resulting in diagonal tension failures.
Figure 4 - 9 Ultimate crack - patterns with varying bond stiffness .
Alpha = 0. 2 Alpha = 0.3
Alpha = 0.4 Alpha = 0.5 Alpha = 0.6
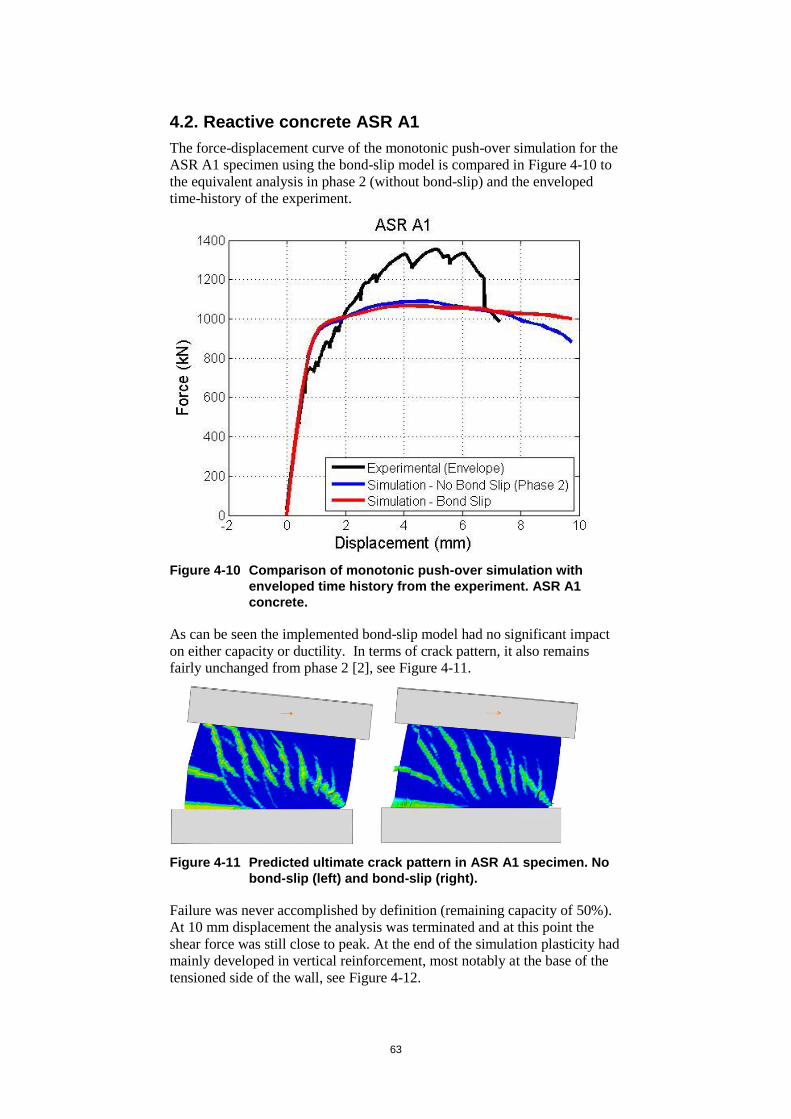
63
4.2. Reactive concrete ASR A1
The force-displacement curve of the monotonic push-over simulation for the ASR A1 specimen using the bond-slip model is compared in Figure 4-10 to the equivalent analysis in phase 2 (without bond-slip) and the enveloped time-history of the experiment.
Figure 4-10 Comparison of monotonic push-over simulation with enveloped time history from the experiment. ASR A1 concrete.
As can be seen the implemented bond-slip model had no significant impact on either capacity or ductility. In terms of crack pattern, it also remains fairly unchanged from phase 2 [2], see Figure 4-11.
Figure 4-11 Predicted ultimate crack pattern in ASR A1 specimen. No bond-slip (left) and bond-slip (right).
Failure was never accomplished by definition (remaining capacity of 50%). At 10 mm displacement the analysis was terminated and at this point the shear force was still close to peak. At the end of the simulation plasticity had mainly developed in vertical reinforcement, most notably at the base of the tensioned side of the wall, see Figure 4-12.
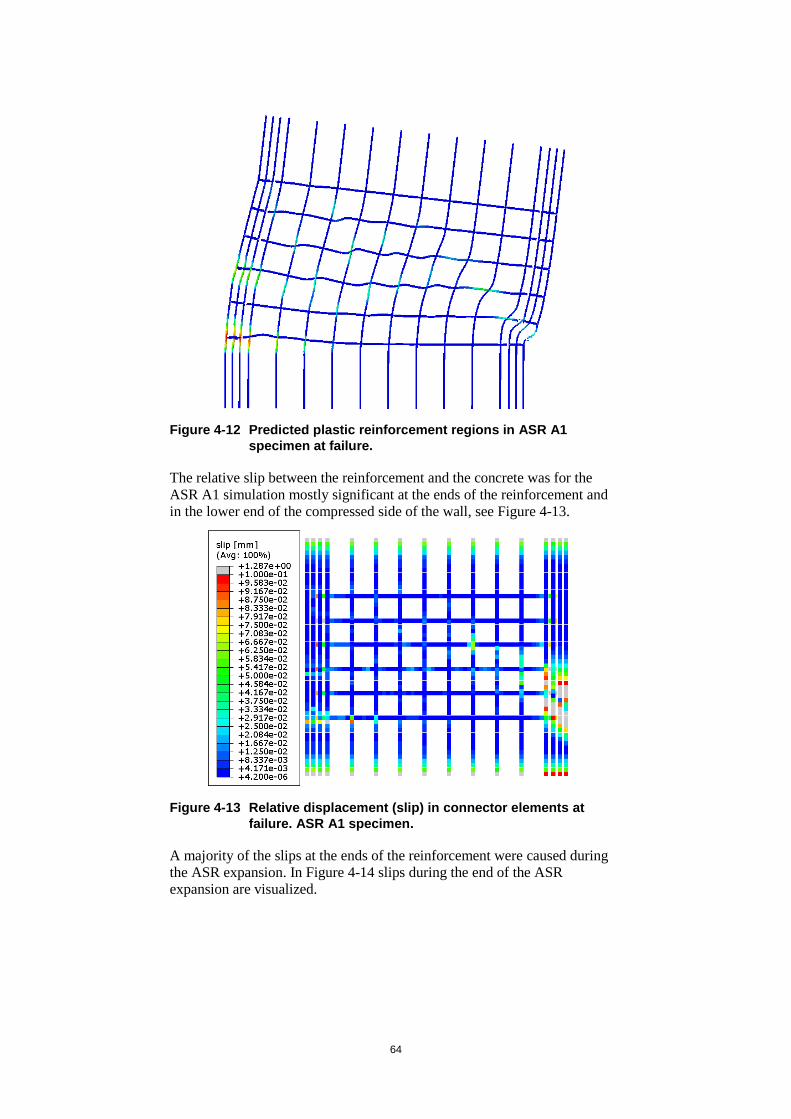
64
Figure 4-12 Predicted plastic reinforcement regions in ASR A1 specimen at failure.
The relative slip between the reinforcement and the concrete was for the ASR A1 simulation mostly significant at the ends of the reinforcement and in the lower end of the compressed side of the wall, see Figure 4-13.
Figure 4-13 Relative displacement (slip) in connector elements at failure. ASR A1 specimen.
A majority of the slips at the ends of the reinforcement were caused during the ASR expansion. In Figure 4-14 slips during the end of the ASR expansion are visualized.
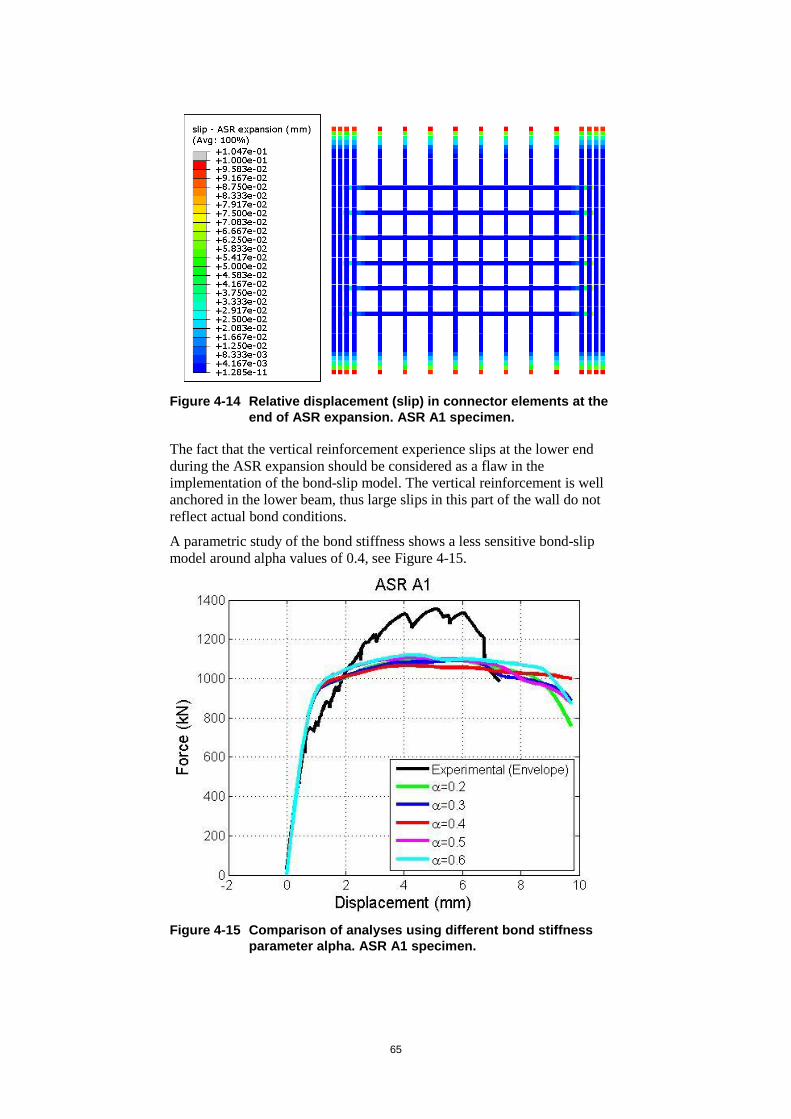
65
Figure 4-14 Relative displacement (slip) in connector elements at the end of ASR expansion. ASR A1 specimen.
The fact that the vertical reinforcement experience slips at the lower end during the ASR expansion should be considered as a flaw in the implementation of the bond-slip model. The vertical reinforcement is well anchored in the lower beam, thus large slips in this part of the wall do not reflect actual bond conditions.
A parametric study of the bond stiffness shows a less sensitive bond-slip model around alpha values of 0.4, see Figure 4-15.
Figure 4-15 Comparison of analyses using different bond stiffness parameter alpha. ASR A1 specimen.

66
However, expanding the alpha-parameter to even higher values allowing initally softer bond, see Figure 4-16, brittle failure modes can be obtained.
Figure 4-16 Higher end of alpha values used in sensitivity analyses.
The force-displacement curves for the high-end sensitivity analysis of the alpha spectrum is shown in Figure 4-17.
Figure 4-17 Comparison of analyses using different bond stiffness parameter alpha. ASR A1 specimen.
A first cliff-edge is found between alpha values of 0.6 and 0.7 with a sudden drop in ductility for larger alpha-values. This is on the other hand reversed for a second cliff-edge of alpha values 0.9 and higher where a ductile load curve is obtained again.

67
Similar to the REG A simulation the cliff - edge effects relates to crackpattern and failure mode , see Figure 4 - 18 . For alpha values of 0.7 and 0.8diag onal tension failures were obtained.
Figure 4 - 18 Ultimate crack - patterns with varying bond stiffness. ASRA1 specimen.
Alpha = 0.6 Alpha = 0.7
Alpha = 0.8 Alpha = 0.9 Alpha = 1.0

68
5. Conclusions The ability of the Concrete Damaged Plasticity material model in ABAQUS to simulate the behavior of the studied shear wall was investigated in phase 2 [2] of the ASCET project. In this phase thorough testing of the material model input parameters, element types and boundary conditions were performed. A base numerical model was established and proceeded into phase 3 where a bond-slip model was developed taking interaction between the concrete and the reinforcement into account.
Some key observations from phase 2 [2] regarding simulation results were:
Simulations confirm experimental observation that the ASR effected walls possessed higher ultimate capacity than regular walls, despite lower nominal material properties. This is a result of pre-stressing effect in the reinforcement due to the ASR expansion.
Simulations consequently underestimated the capacity of the shear walls.
The implemented bond-slip model in phase 3 did not seem to have a significant effect on these points. However, in some cases the capacity was increased marginally. This effect was always accompanied with a decreased ductility and a diagonal failure mode.
The shear walls ability to undergo plastic deformation seemed to be overestimated in the predictions of phase 2. In phase 3 the predicted force-displacement curve for the regular concrete REG A was more brittle and in good agreement with the registered curve, both in terms of ultimate capacity and ductility. A cliff-edge was on the other hand found for stiffer bond-slip relationships, resulting in ductile failures reminiscent of the phase 2 predictions. In the phase 2 simulations, a perfect bond was used (no bond-slip). As such, a stiffer bond-slip model converging towards these results is not surprising.
For the ASR affected concrete specimen, ASR A1, the predicted response was very ductile in relation to observations. The bond strength was on the other hand not reduced with respect to ASR effects. It was shown that a lower bond-stiffness could result in a more realistic and brittle load curve, but this response was due to minor tweaks of the bond-stiffness. Furthermore, it was shown that even lower bond-stiffness resulted in flat ductile load curve. This fact complicates the analysis of the bond-mechanism since it produced these vastly different structural behaviors.
Failure mode is a non-trivial mechanism to evaluate. In this shear wall experiment the failure modes have been described as either of the following:
Sliding between wall panel and bottom beam Diagonal
Diagonal tension failures were predicted in several numerical analyses. A diagonal corner-to-corner crack combined with yielding in horizontal reinforcement across the crack was the identified mechanism for this type of failure. This was also the only predicted brittle failure mode. It was on the other hand difficult to identify other failure mechanisms other than this. Those that were not diagonal tension failures never collapsed as they were

69
very ductile. It is also questionable whether a sliding failure is even possible to obtain from a monotonic pushover. The reason is one side of the base is in constant tension and the other side is in constant compression. Thus, horizontal cracks will only form at the tensioned side of the wall and not along the whole base.
Due to the cliff-edge effects it is difficult to draw any definite conclusions regarding bond-slip as a parameter in numerical analyses of shear walls. Although, the findings in this report suggests that bond-slip should not be ignored when analyzing serviceability demands in numerical models, given the impact bond-slip can have on ductility and crack formation. However, a couple of questions should be raised:
How does the bond-laws obtained from pull-out tests apply to an arbitrary section in the analyzed structure? The bond-conditions in pull-out tests are well defined but they may or may not be in an actual structure. Furthermore, confinement may be different depending on section and direction. It is therefore difficult to evaluate if e.g. splitting failure can be avoided.
Given that the correct bond-law is known, how should this be implemented in a numerical model? It is important to point out that there are many possible ways to account for bond interaction in numerical models. Using discrete connector elements, as implemented in this study, turned out to be insufficient with respect to computing time. As a consequence, bond-slip became a cumbersome parameter to evaluate.
With regards to the last point, the implemented bond-slip model has room for improvements. It is known that plasticity in a reinforcement section reduces the bond strength in that same section. In order to account for this effect some sort of update mechanism to the bond-law is required. It is unknown how this would have affected the results presented in this paper.
Further improvements include consideration of bond deterioration due to cyclic loading. The bond-slip model was only implemented for monotonic loading, but it should be known that actual bond strength is dependent on load history.
ASR effects, or other degradation mechanisms, on the bond itself has not been explicitly considered in this paper. Only through parametric study of the bond stiffness it was concluded that some lower-than-average bond stiffness values was more successful for the ASR-affected specimen. However, ASR-effects on the bond should be investigated and understood before bond-degradation is implemented in numerical models. As bond-slip is not a material parameter, rather a structural parameter (confinement, bond conditions, material, etc.), it is probably challenging to make sense of ASR-degradation on the bond strength from laboratory tests.

70
6. Acknowledgement Our participation in the OECD/NEA/CSNI ASCET CAPS is financially supported by the Swedish Radiation Safety Authority (SSM). This support is much appreciated.
71
7. References
[1] OECD/NEA/CSNI, Final Report of ASCET Phase 1, 2016.
[2] Björn Thunell, "SSM 2018:17 Assessment of structures subject to concrete pathologies (ASCET), phase 2," Swedish Radiation Safety Authority, 2018.
[3] Dassault Systémes, "Abaqus Documentation, Version 6.14," 3DS Simulia, 2015.
[4] B. Thunell, "CONSAFESYS - Barsebäck NPP, Main Project Summary Report," Report SCTE/09416/B1:R-06, Revision 0, 2015-10-20.
[5] N. Orbovic, D. Panesar, S. Sheikh, F. Vecchio, C. Lamarche and A. Blahoianu, "Alkali Aggregate Reaction in Nuclear Concrete Structures, Part 1: A Holistic Approach," Transactions SMiRT-23, Division I, Paper ID 202, Manchester, United Kingdom, August 10-14, 2015.
[6] J. Tcherner and T. S. Aziz (Atomic Energy of Canada Limited), Effects of AAR on Seismic Assessments of Nuclear Power Plants for Life Extensions, Division 7, Paper 1789, SMiRT 20, Augist 9-14 2009.
[7] Anca-Cristina Jurcut, "Modelling of alkali-aggregate reaction effects in reinforced concrete structures (Master thesis)," University of Toronto, Department of Civil Engineering, 2015.
[8] Saouma, V.E., et al., Effect of alkali–silica reaction on the shear strength of reinforced concrete structural members. A numerical and statistical study, Nucl. Eng. Des. (2016), http://dx.doi.org/10.1016/j.nucengdes.2016.10.012.
[9] A. Farhang, Inverkan av ASR på betongens bärförmåga En litteraturstudie, Energiforsk rapport 2016:256, 2016.
[10] D. Panesar, S. A. Sheikh and F. J Vecchio, "Details of two walls tested under axial load and lateral cyclic excursion," E-DOCS-#5015738-v1-ASCET_Phase_II_Input_Data.pdf, SAS20160605.
[11] D. Panesar, S. A. Sheikh and F. J. Vecchio, "Mix Design for concrete shear walls," SAS20160609.
[12] D. Panesar, S. A. Sheikh and F. J Vecchio, "Addendum to Report SAS20160605 related to sizes of specimens for material properties," June 26, 2016.

72
[13] A. Sellier (Université de Toulouse), V. Saouma (University of Colorado, Boulder), S. Multon (Université de Toulouse), Y. Le Pape (Oak Ridge National Laboratory), N. Orbovic (Canadian Nuclear Safety Commission), "RILEM Technical Committee 259-ISR, ASR Prognosis of deterioration and loss of serviceability in structures affected by alkali-silica reactions, WG 2 Benchmark/Round Robin Analyses," v. 1, January 2016.
[14] S.A.Sheikh (University of Toronto), Shear Wall Elements (Presentation at ASCET Phase 2 Workshop in Ottawa), May 8 2017.
[15] F. Habibi, D. Panesar, S. Sheikh and F. Vecchio, Shear Wall Tests – Information on Loading Protocol; Boundary Conditions and Cracking, University of Toronto, January 12, 2018.
[16] ASCET project admin, "Digital load-displacement data of cyclic loading," 2018.
[17] Center for Transportation Research at the University of Texas at Austin, Non-Destructive Evaluation of In-Service Concrete Structures Affected by Alkali-Silika Reaction (ASR, or Delayed Ettringite Formation (DEF) - Final Report , Part I, Report FHWA/TX-13/0-6491-1, 2012.
[18] Swedish Standards Institute, SS-EN 1992-1-1:2005, Eurocode 2: Design of concrete structures - Part 1-1: General rules and rules for buildings, 2005 with corrections and national amendments.
[19] J. Magnusson, "Bond and Anchorage of Deformed Bars in High-Strength Concrete.," Chalmer University, 1997.
[20] CEB-FIP bulletin 10, "Bond of reinforcement in concrete," International Federation for Structural Concrete (fib) , 2000.
[21] CEB-FIP bulletin 65, "Mode Code 2010, Final Draft, Volume 1.," International Federation for Structural Concrete (fib), 2010.

SSM 2019:20

StrålsäkerhetsmyndighetenSwedish Radiation Safety Authority
SE-171 16 Stockholm Tel: +46 8 799 40 00 E-mail: [email protected] strandväg 96 Fax: +46 8 799 40 10 Web: stralsakerhetsmyndigheten.se
2019:20 The Swedish Radiation Safety Authority has a comprehensive responsibility to ensure that society is safe from the effects of radiation. The Authority works to achieve radiation safety in a number of areas: nuclear power, medical care as well as commercial products and services. The Authority also works to achieve protection from natural radiation and to increase the level of radiation safety internationally.
The Swedish Radiation Safety Authority works proactively and preventively to protect people and the environment from the harmful effects of radiation, now and in the future. The Authority issues regulations and supervises compliance, while also supporting research, providing training and information, and issuing advice. Often, activities involving radiation require licences issued by the Authority. The Swedish Radiation Safety Authority maintains emergency preparedness around the clock with the aim of limiting the aftermath of radiation accidents and the unintentional spreading of radioactive substances. The Authority participates in international co-operation in order to promote radiation safety and finances projects aiming to raise the level of radiation safety in certain Eastern European countries.
The Authority reports to the Ministry of the Environment and has around 300 employees with competencies in the fields of engineering, natural and behavioural sciences, law, economics and communications. We have received quality, environmental and working environment certification.
Ale
Try
ckte
am A
B, B
ohus
, 201
9