2019 ra-iv societal aspects of hurricanes wind storm
TRANSCRIPT
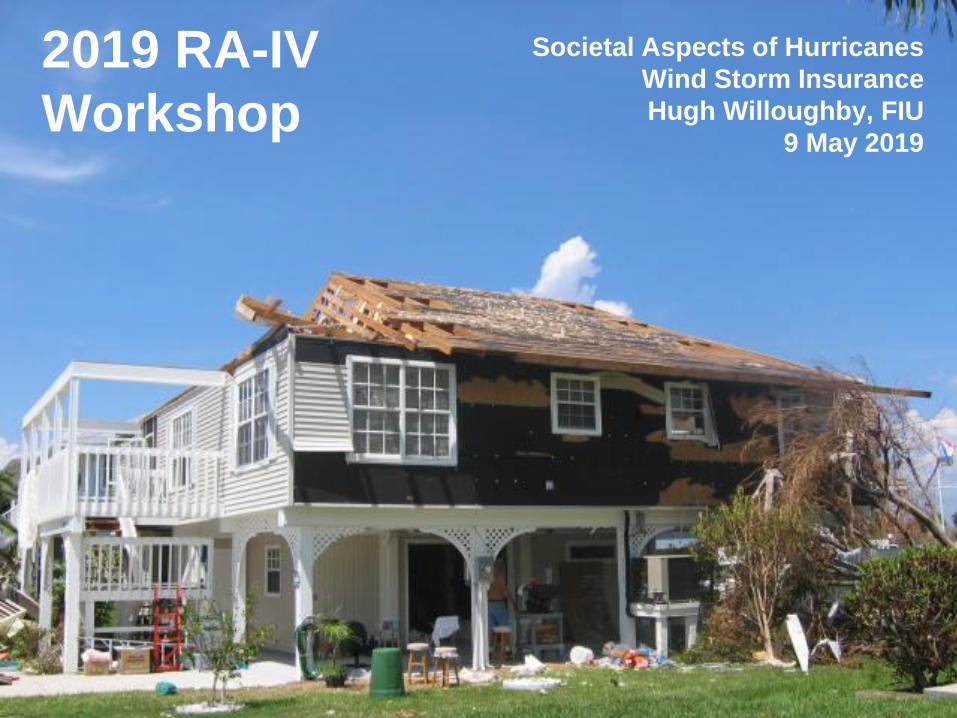
2019 RA-IV
Workshop
Societal Aspects of Hurricanes
Wind Storm Insurance
Hugh Willoughby, FIU
9 May 2019
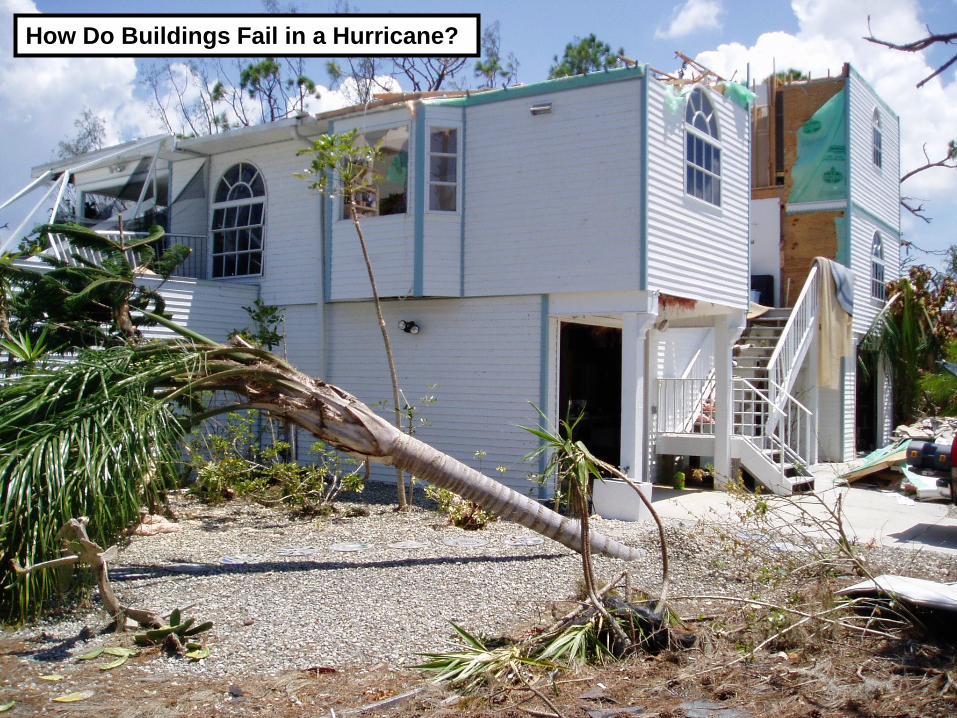
How Do Buildings Fail in a Hurricane?

Total damage normalized to
2018 for economic changes
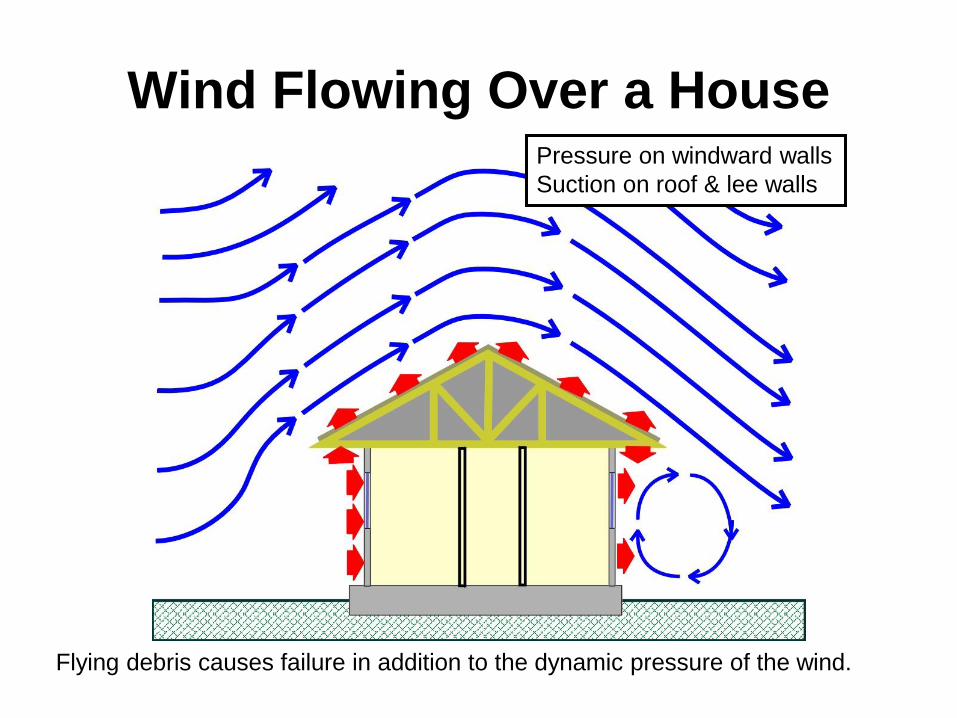
Wind Flowing Over a House Pressure on windward walls
Suction on roof & lee walls
Flying debris causes failure in addition to the dynamic pressure of the wind.
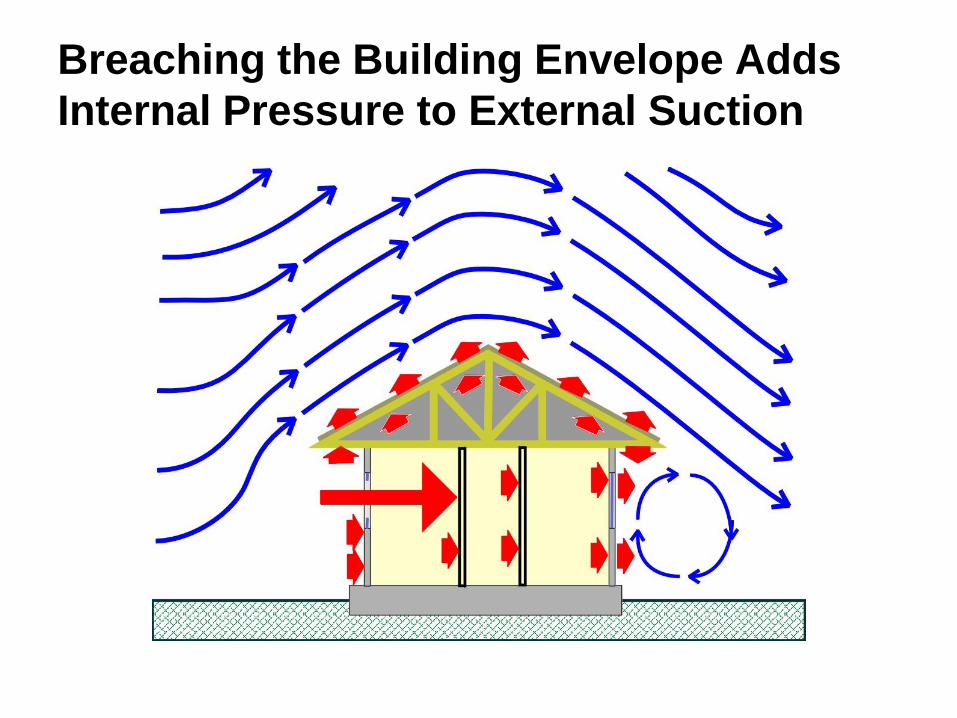
Breaching the Building Envelope Adds
Internal Pressure to External Suction

Structural Failure(s)
• Shingles or roof tiles fail
• Rainwater enters
• Windows, entryway doors & garage doors fail3
• Soffits blow upward
• Interior walls collapse
• Roof sheathing blows off
• More rainwater enters
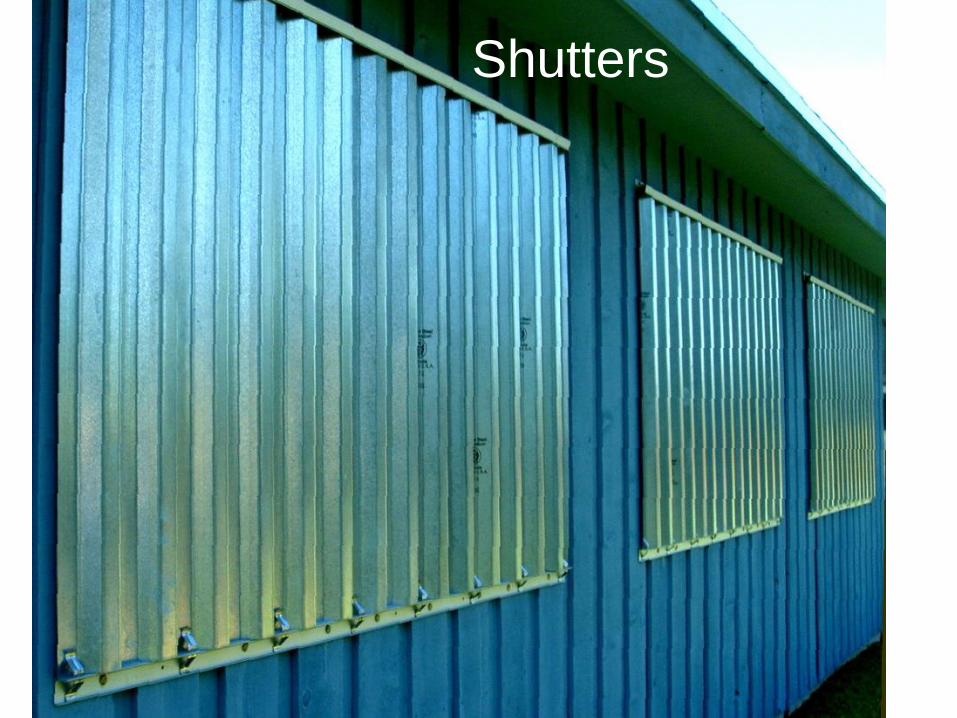
Shutters

High Velocity Hurricane Zone Building Code
Negative Load
Path to Ground
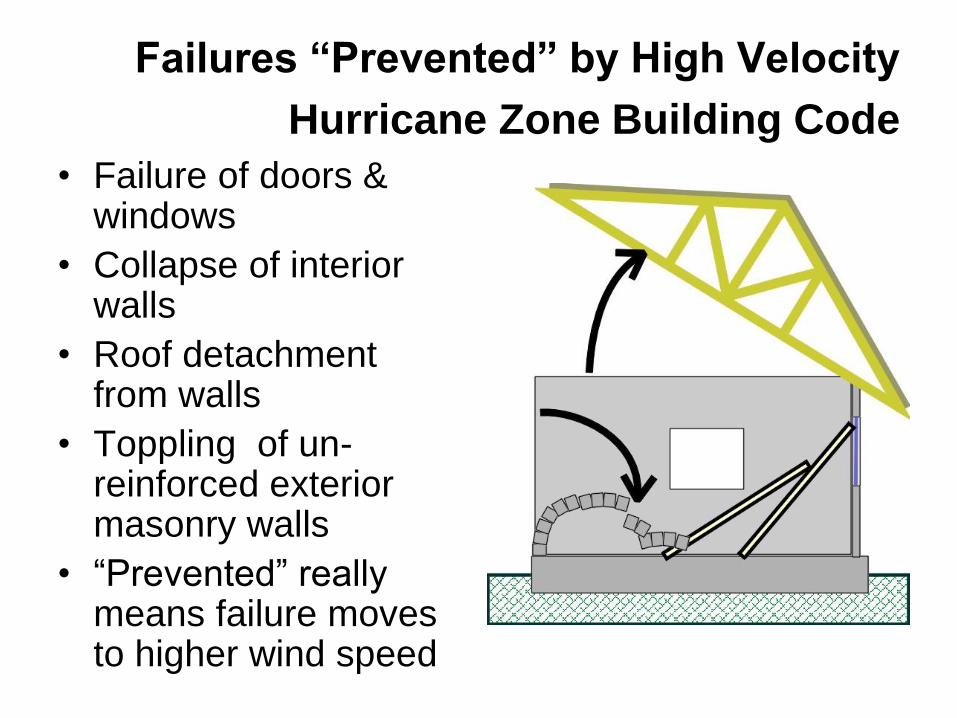
Failures “Prevented” by High Velocity
Hurricane Zone Building Code • Failure of doors &
windows
• Collapse of interior walls
• Roof detachment from walls
• Toppling of un-reinforced exterior masonry walls
• “Prevented” really means failure moves to higher wind speed
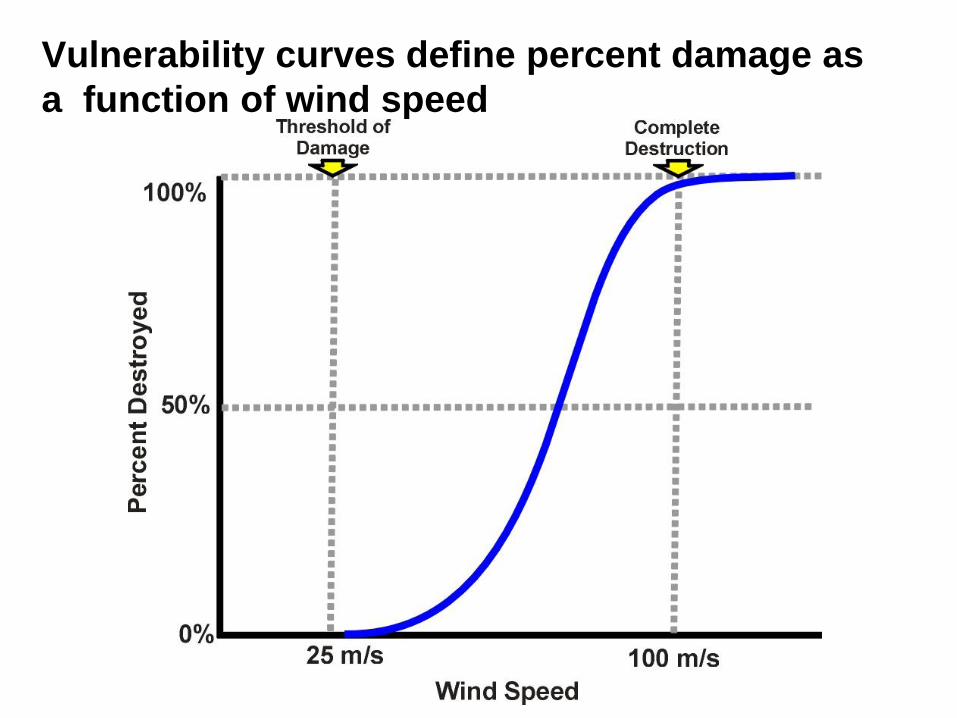
Vulnerability curves define percent damage as
a function of wind speed
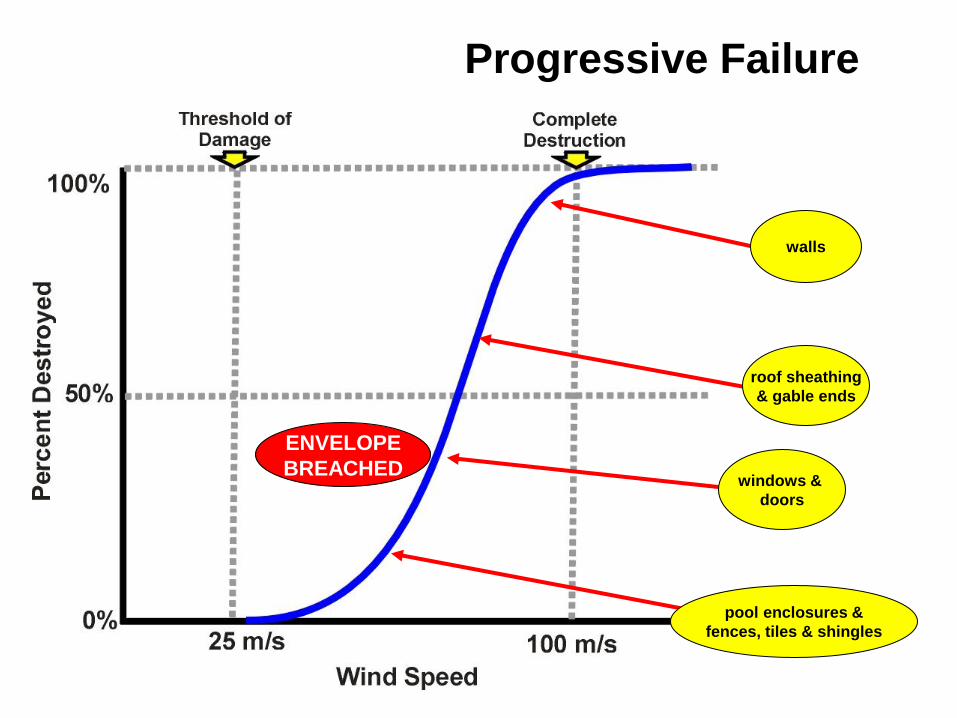
Progressive Failure
windows &
doors
pool enclosures &
fences, tiles & shingles
roof sheathing
& gable ends
walls
ENVELOPE
BREACHED
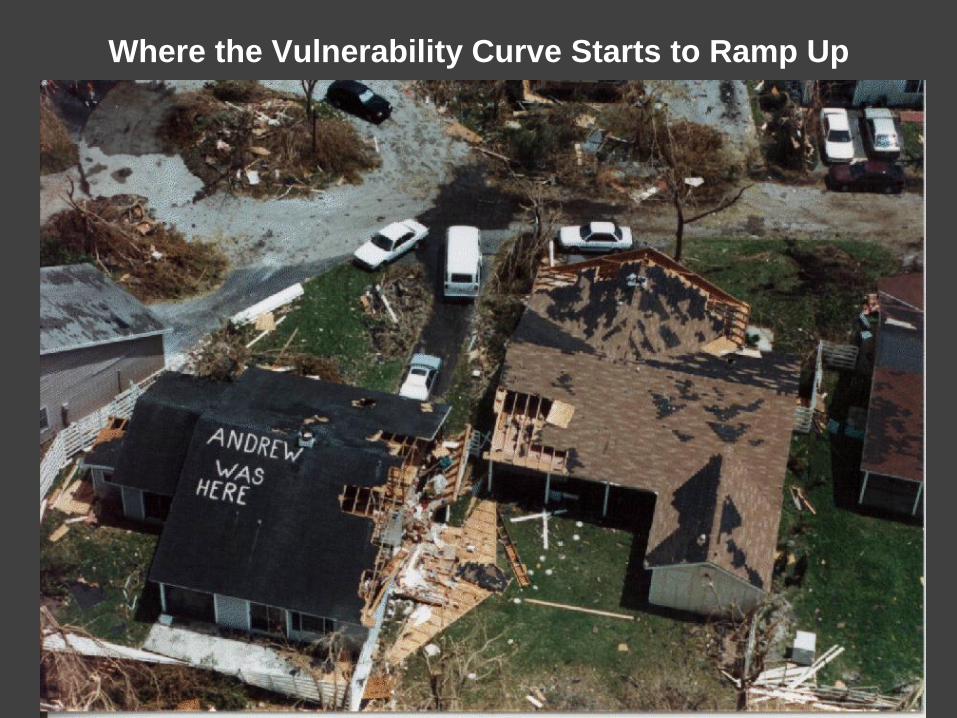
Where the Vulnerability Curve Starts to Ramp Up

Farther Up the Curve
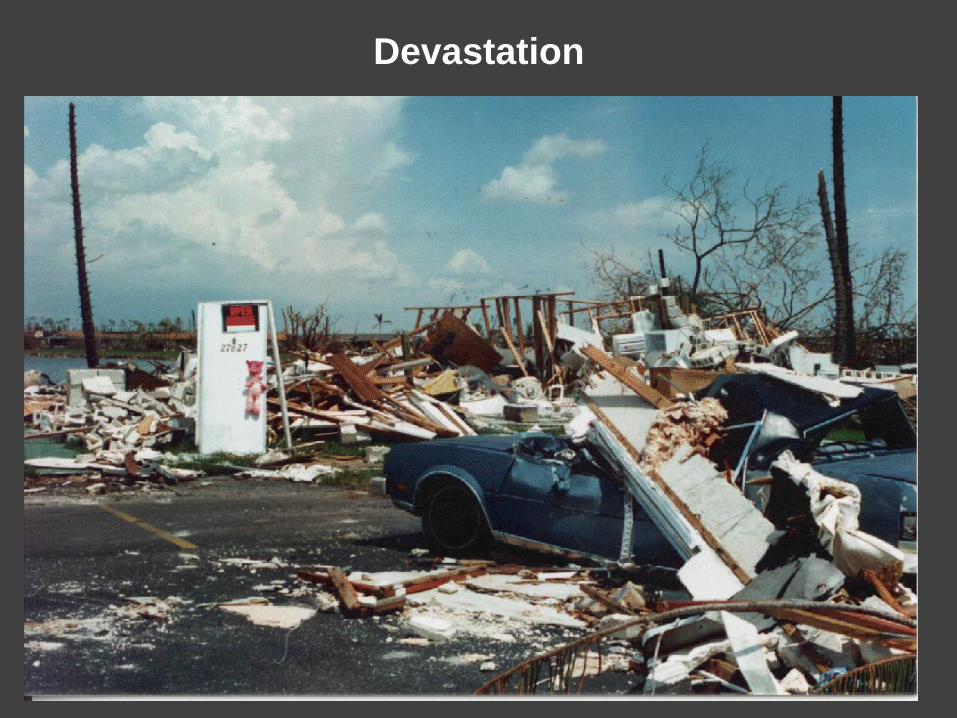
Devastation
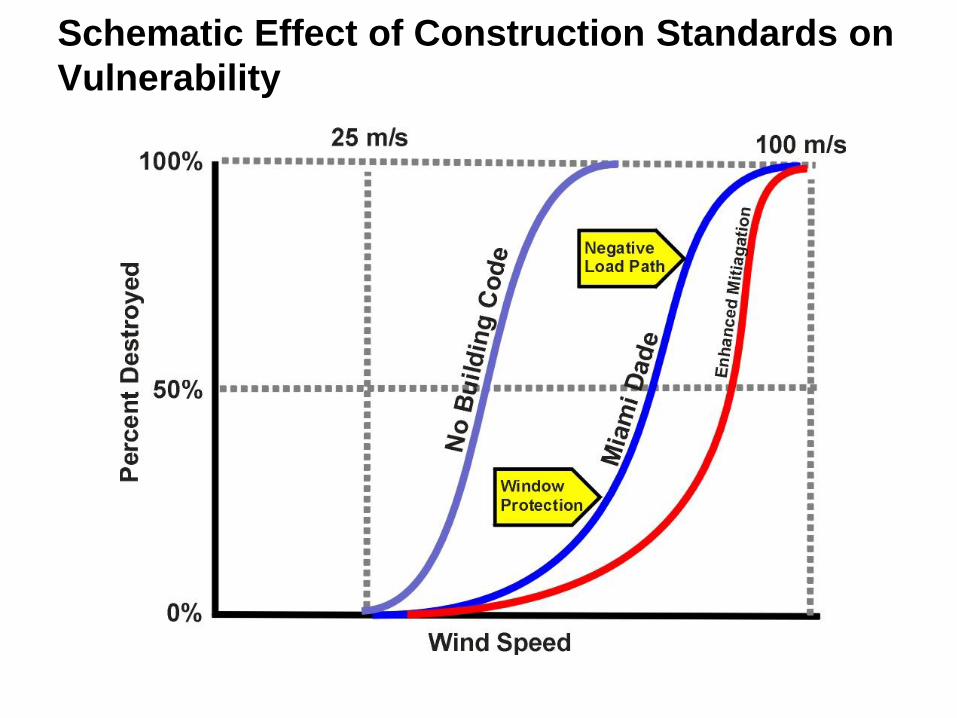
Schematic Effect of Construction Standards on
Vulnerability
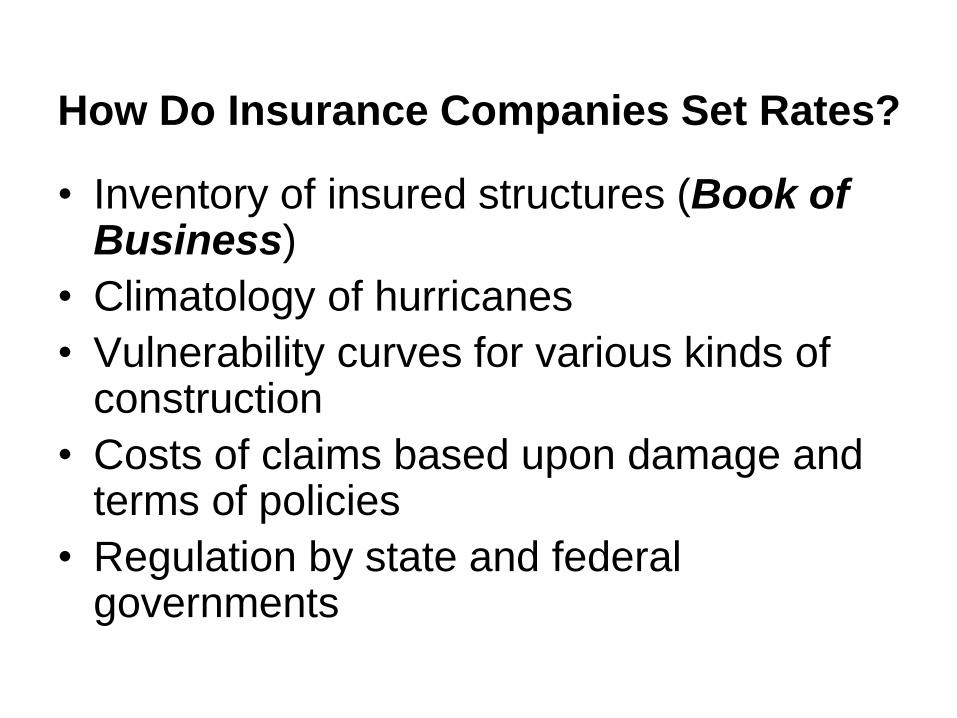
How Do Insurance Companies Set Rates?
• Inventory of insured structures (Book of Business)
• Climatology of hurricanes
• Vulnerability curves for various kinds of construction
• Costs of claims based upon damage and terms of policies
• Regulation by state and federal governments

Structure of a Catastrophe
(CAT) Model
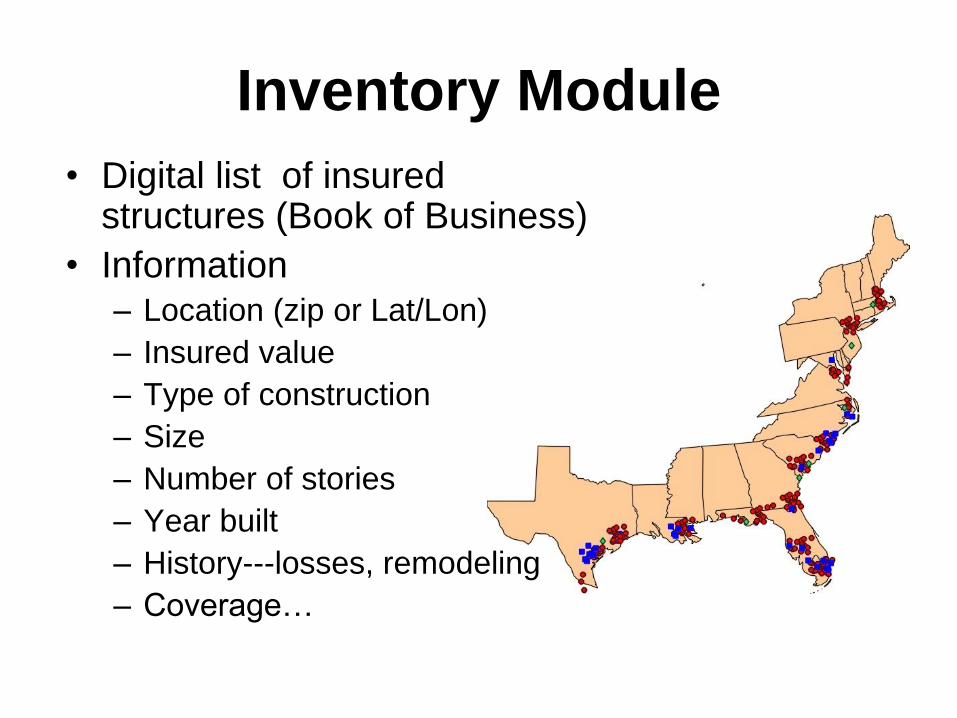
Inventory Module
• Digital list of insured structures (Book of Business)
• Information – Location (zip or Lat/Lon)
– Insured value
– Type of construction
– Size
– Number of stories
– Year built
– History---losses, remodeling
– Coverage…

Hazard Modules are Based Upon
the Redfield-Reid Paradigm
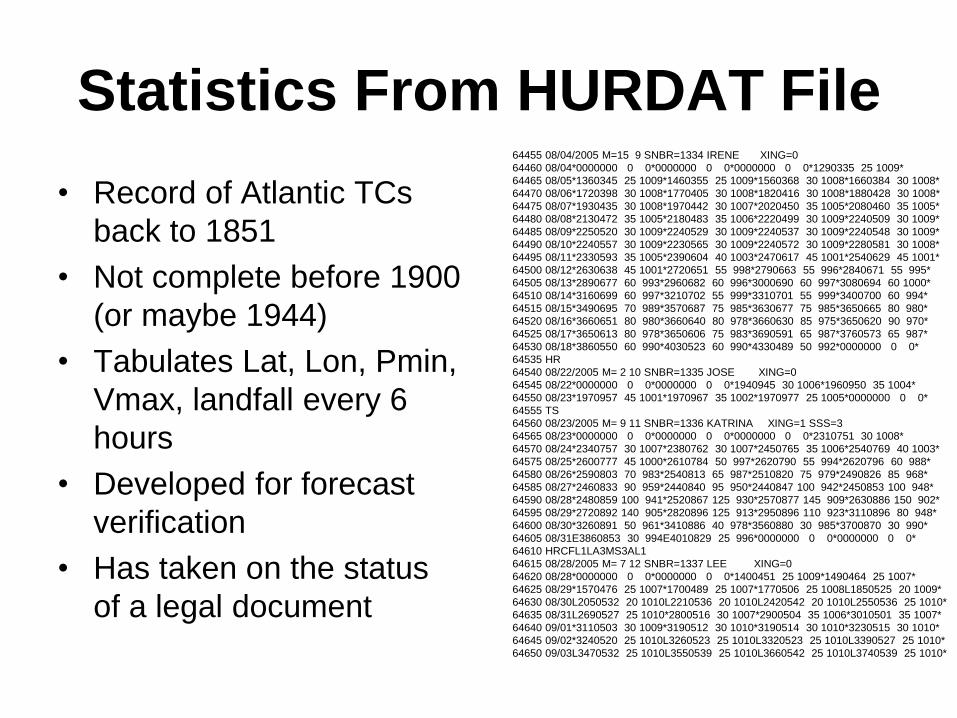
Statistics From HURDAT File
• Record of Atlantic TCs
back to 1851
• Not complete before 1900
(or maybe 1944)
• Tabulates Lat, Lon, Pmin,
Vmax, landfall every 6
hours
• Developed for forecast
verification
• Has taken on the status
of a legal document
64455 08/04/2005 M=15 9 SNBR=1334 IRENE XING=0
64460 08/04*0000000 0 0*0000000 0 0*0000000 0 0*1290335 25 1009*
64465 08/05*1360345 25 1009*1460355 25 1009*1560368 30 1008*1660384 30 1008*
64470 08/06*1720398 30 1008*1770405 30 1008*1820416 30 1008*1880428 30 1008*
64475 08/07*1930435 30 1008*1970442 30 1007*2020450 35 1005*2080460 35 1005*
64480 08/08*2130472 35 1005*2180483 35 1006*2220499 30 1009*2240509 30 1009*
64485 08/09*2250520 30 1009*2240529 30 1009*2240537 30 1009*2240548 30 1009*
64490 08/10*2240557 30 1009*2230565 30 1009*2240572 30 1009*2280581 30 1008*
64495 08/11*2330593 35 1005*2390604 40 1003*2470617 45 1001*2540629 45 1001*
64500 08/12*2630638 45 1001*2720651 55 998*2790663 55 996*2840671 55 995*
64505 08/13*2890677 60 993*2960682 60 996*3000690 60 997*3080694 60 1000*
64510 08/14*3160699 60 997*3210702 55 999*3310701 55 999*3400700 60 994*
64515 08/15*3490695 70 989*3570687 75 985*3630677 75 985*3650665 80 980*
64520 08/16*3660651 80 980*3660640 80 978*3660630 85 975*3650620 90 970*
64525 08/17*3650613 80 978*3650606 75 983*3690591 65 987*3760573 65 987*
64530 08/18*3860550 60 990*4030523 60 990*4330489 50 992*0000000 0 0*
64535 HR
64540 08/22/2005 M= 2 10 SNBR=1335 JOSE XING=0
64545 08/22*0000000 0 0*0000000 0 0*1940945 30 1006*1960950 35 1004*
64550 08/23*1970957 45 1001*1970967 35 1002*1970977 25 1005*0000000 0 0*
64555 TS
64560 08/23/2005 M= 9 11 SNBR=1336 KATRINA XING=1 SSS=3
64565 08/23*0000000 0 0*0000000 0 0*0000000 0 0*2310751 30 1008*
64570 08/24*2340757 30 1007*2380762 30 1007*2450765 35 1006*2540769 40 1003*
64575 08/25*2600777 45 1000*2610784 50 997*2620790 55 994*2620796 60 988*
64580 08/26*2590803 70 983*2540813 65 987*2510820 75 979*2490826 85 968*
64585 08/27*2460833 90 959*2440840 95 950*2440847 100 942*2450853 100 948*
64590 08/28*2480859 100 941*2520867 125 930*2570877 145 909*2630886 150 902*
64595 08/29*2720892 140 905*2820896 125 913*2950896 110 923*3110896 80 948*
64600 08/30*3260891 50 961*3410886 40 978*3560880 30 985*3700870 30 990*
64605 08/31E3860853 30 994E4010829 25 996*0000000 0 0*0000000 0 0*
64610 HRCFL1LA3MS3AL1
64615 08/28/2005 M= 7 12 SNBR=1337 LEE XING=0
64620 08/28*0000000 0 0*0000000 0 0*1400451 25 1009*1490464 25 1007*
64625 08/29*1570476 25 1007*1700489 25 1007*1770506 25 1008L1850525 20 1009*
64630 08/30L2050532 20 1010L2210536 20 1010L2420542 20 1010L2550536 25 1010*
64635 08/31L2690527 25 1010*2800516 30 1007*2900504 35 1006*3010501 35 1007*
64640 09/01*3110503 30 1009*3190512 30 1010*3190514 30 1010*3230515 30 1010*
64645 09/02*3240520 25 1010L3260523 25 1010L3320523 25 1010L3390527 25 1010*
64650 09/03L3470532 25 1010L3550539 25 1010L3660542 25 1010L3740539 25 1010*


1982 Hurricane Season

Synthetic Hurricane Seasons
• Generate ~1000 virtual
hurricane seasons
• Go through each season
day-by-day
• For each 10o (or 5o)
square generate (or not)
a random starting
intensity and motion
• Generate history of track,
intensity & size
• Combine the cyclones
and repeat for another
virtual season
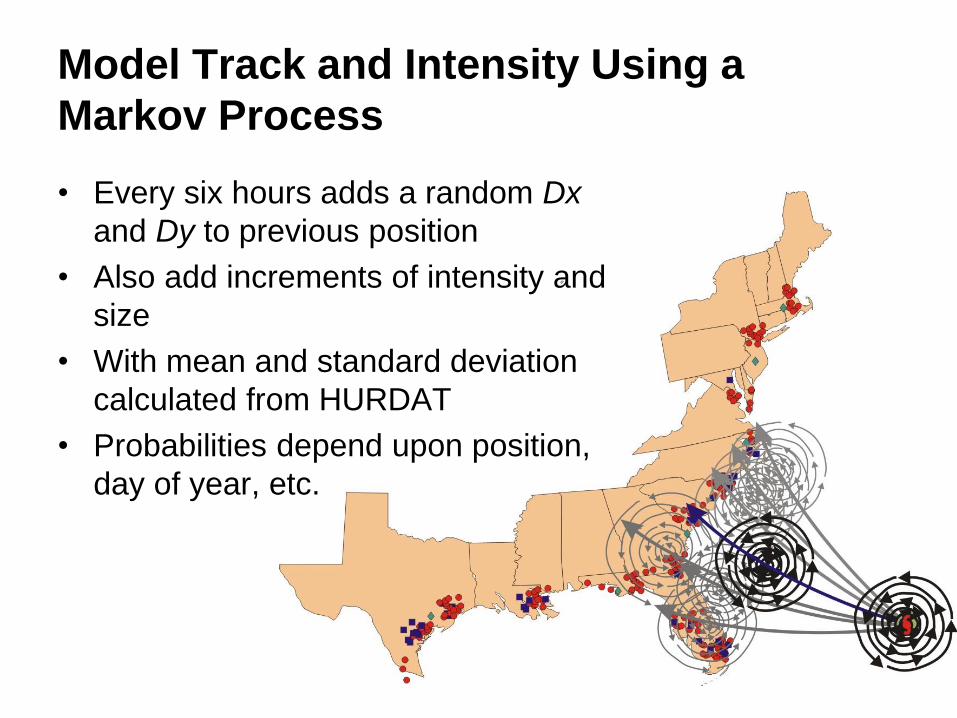
Model Track and Intensity Using a
Markov Process
• Every six hours adds a random Dx
and Dy to previous position
• Also add increments of intensity and
size
• With mean and standard deviation
calculated from HURDAT
• Probabilities depend upon position,
day of year, etc.
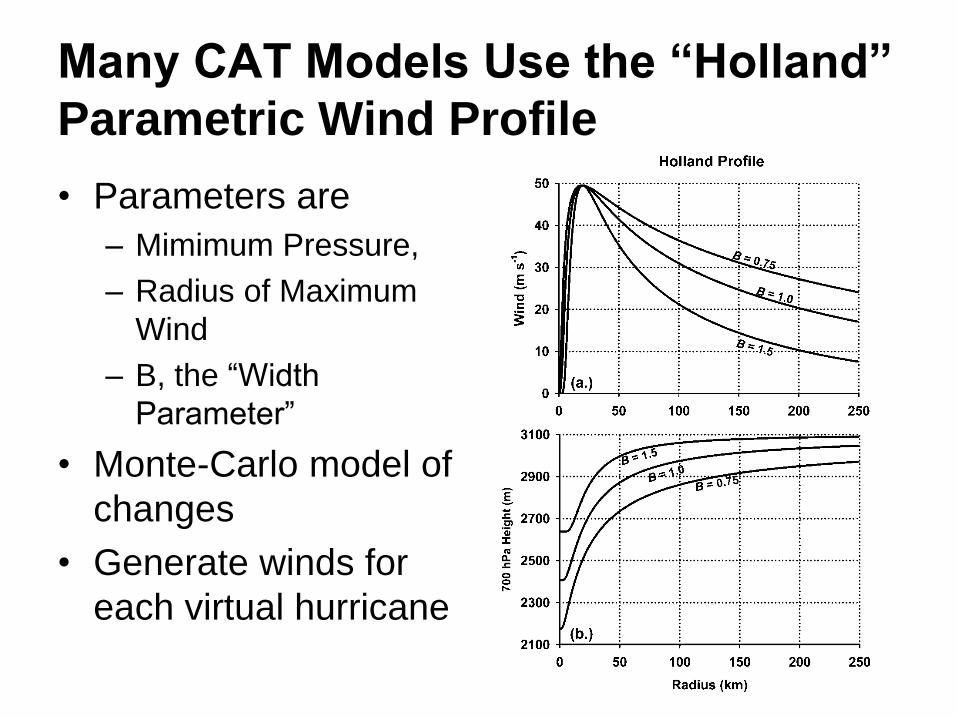
Many CAT Models Use the “Holland”
Parametric Wind Profile
• Parameters are
– Mimimum Pressure,
– Radius of Maximum
Wind
– B, the “Width
Parameter”
• Monte-Carlo model of
changes
• Generate winds for
each virtual hurricane
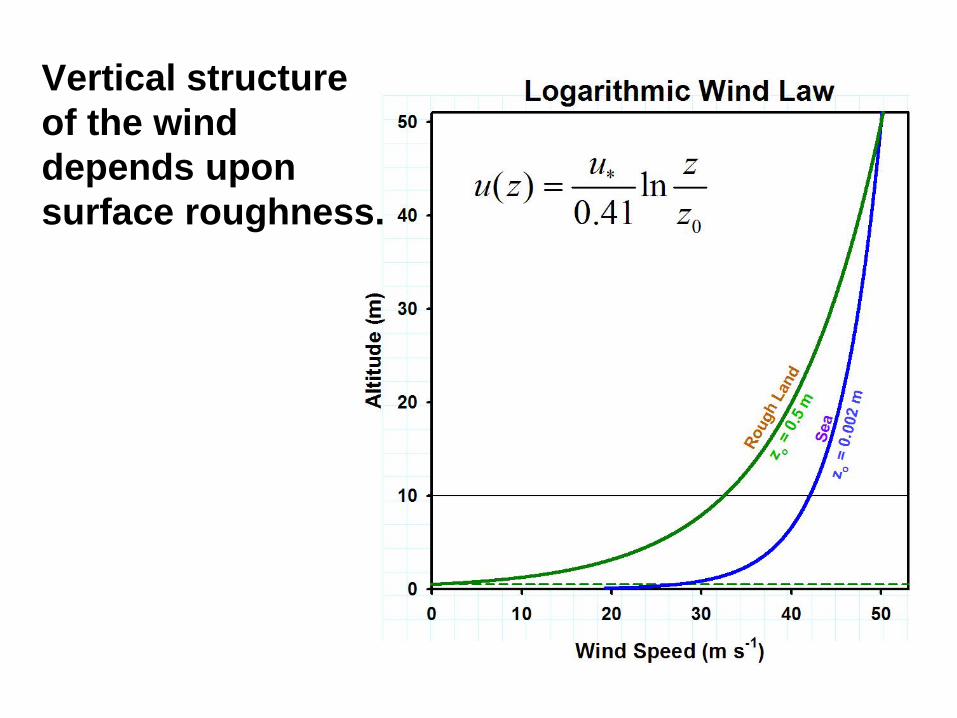
Vertical structure
of the wind
depends upon
surface roughness.

Virtual Storms Impact on Actual
Insured Property
Need to consider only
landfalling storms
Cost Module
• Converts damage to repair/replacement costs---i.e. to claims
• Depends upon
– Kind and extent of damage
– Cost of labor and materials
– Post-storm demand surge
• Generally includes
– Structure contents
– Temporary accommodations
CAT Model Summary
• Generate many (~1000) random hurricane seasons with the same climatology as HURDAT
• Calculate damage and claims for the company’s Book of Business
• Count from most damaging to least damaging and sort from leat damaging to most damaging
• Divide count by number of seasons and tabulate as a function of predicted claims to get Exceedance Probability curve
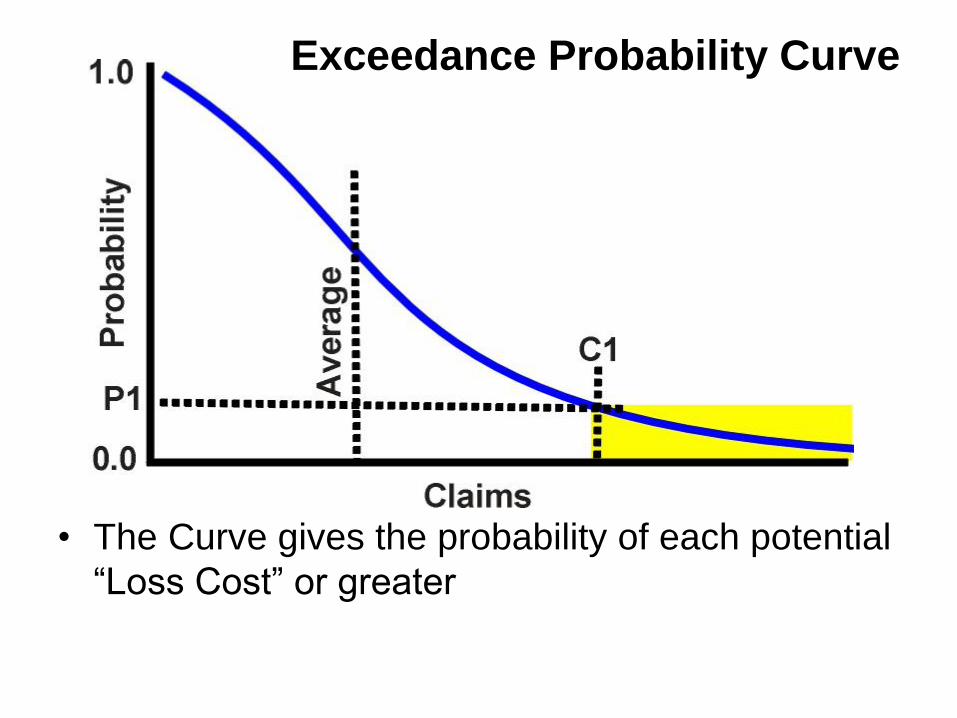
Exceedance Probability Curve
• The Curve gives the probability of each potential
“Loss Cost” or greater
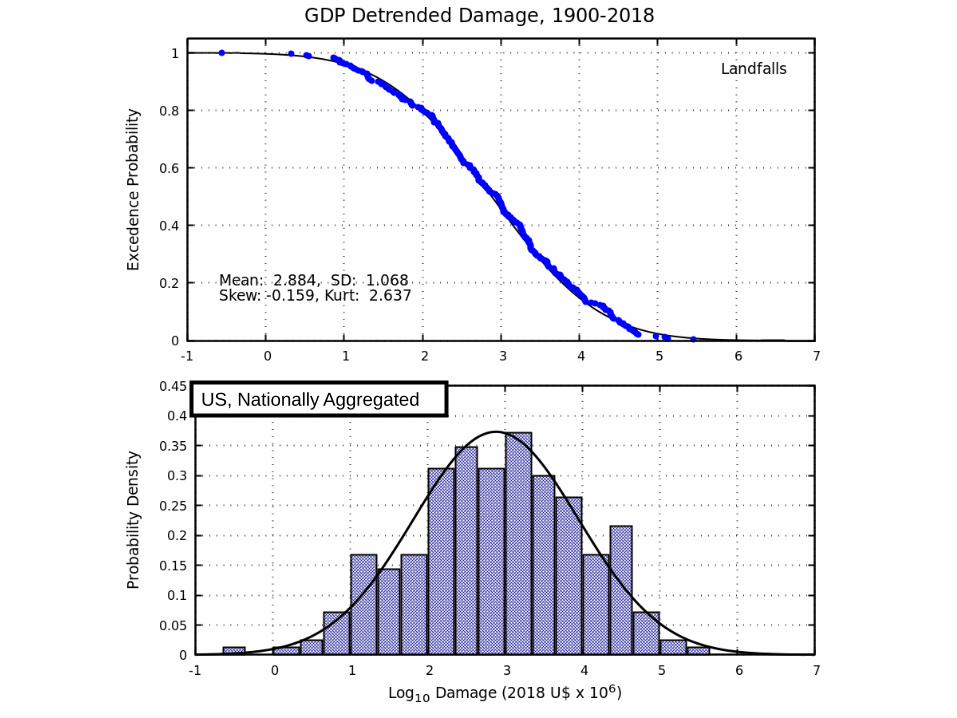
US, Nationally Aggregated
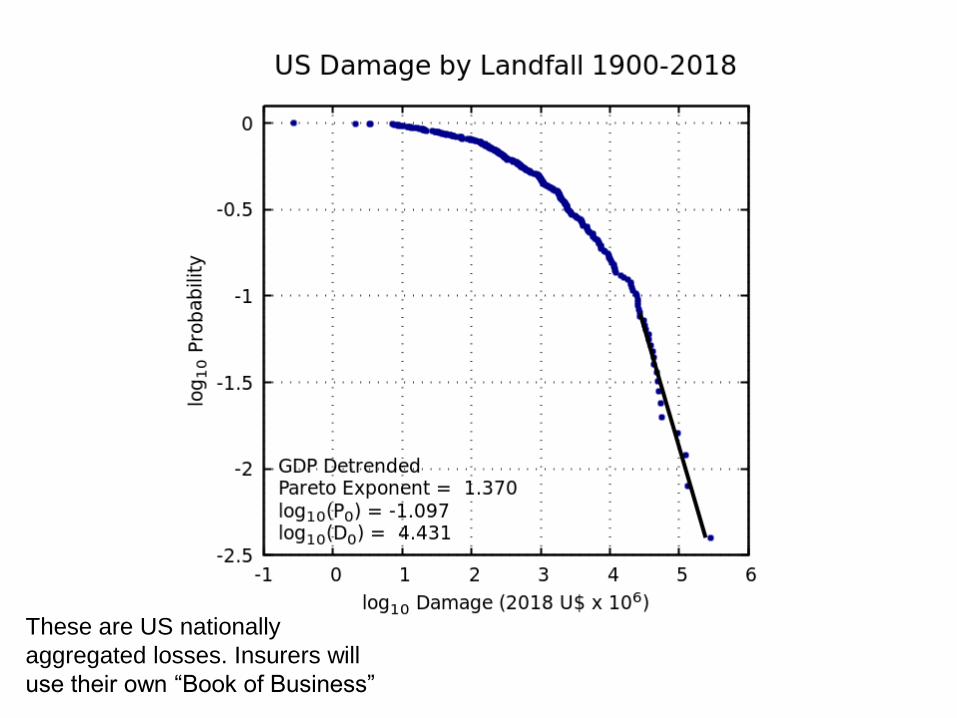
These are US nationally
aggregated losses. Insurers will
use their own “Book of Business”
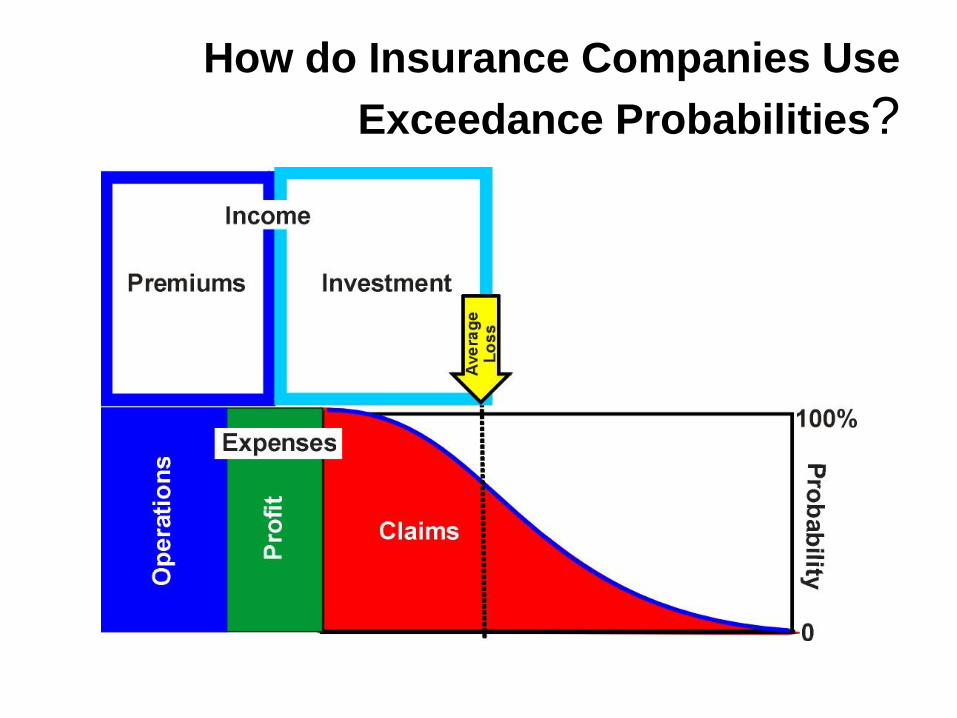
How do Insurance Companies Use
Exceedance Probabilities?

Reinsurance is Used to Transfer
Risk
1%-0.5%
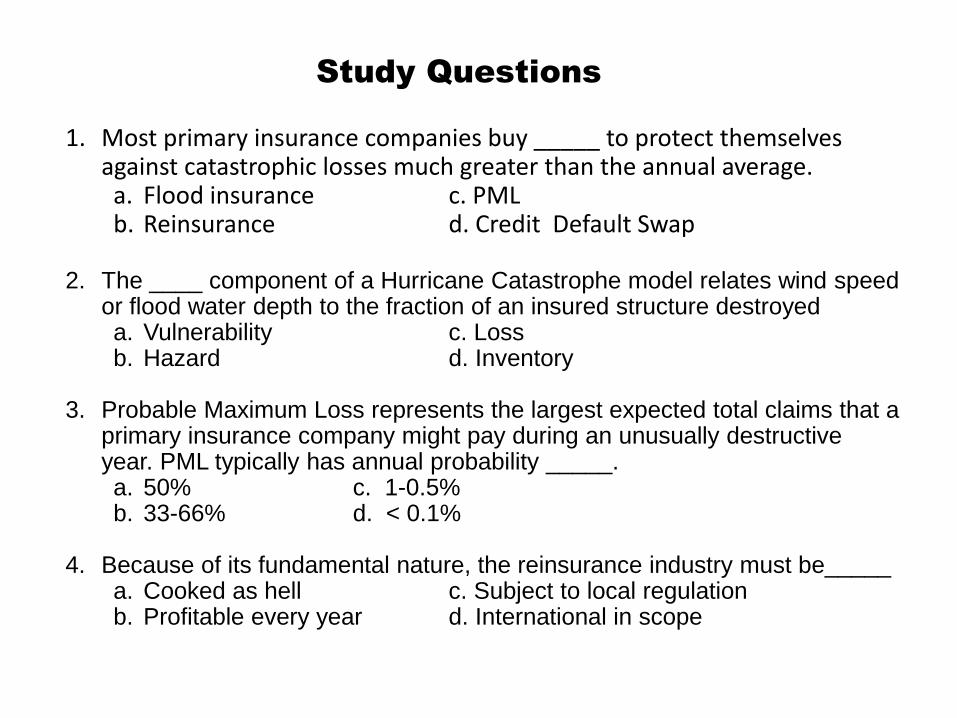
1. Most primary insurance companies buy _____ to protect themselves against catastrophic losses much greater than the annual average. a. Flood insurance c. PML b. Reinsurance d. Credit Default Swap
2. The ____ component of a Hurricane Catastrophe model relates wind speed or flood water depth to the fraction of an insured structure destroyed a. Vulnerability c. Loss b. Hazard d. Inventory
3. Probable Maximum Loss represents the largest expected total claims that a primary insurance company might pay during an unusually destructive year. PML typically has annual probability _____. a. 50% c. 1-0.5% b. 33-66% d. < 0.1%
4. Because of its fundamental nature, the reinsurance industry must be_____ a. Cooked as hell c. Subject to local regulation b. Profitable every year d. International in scope
Study Questions
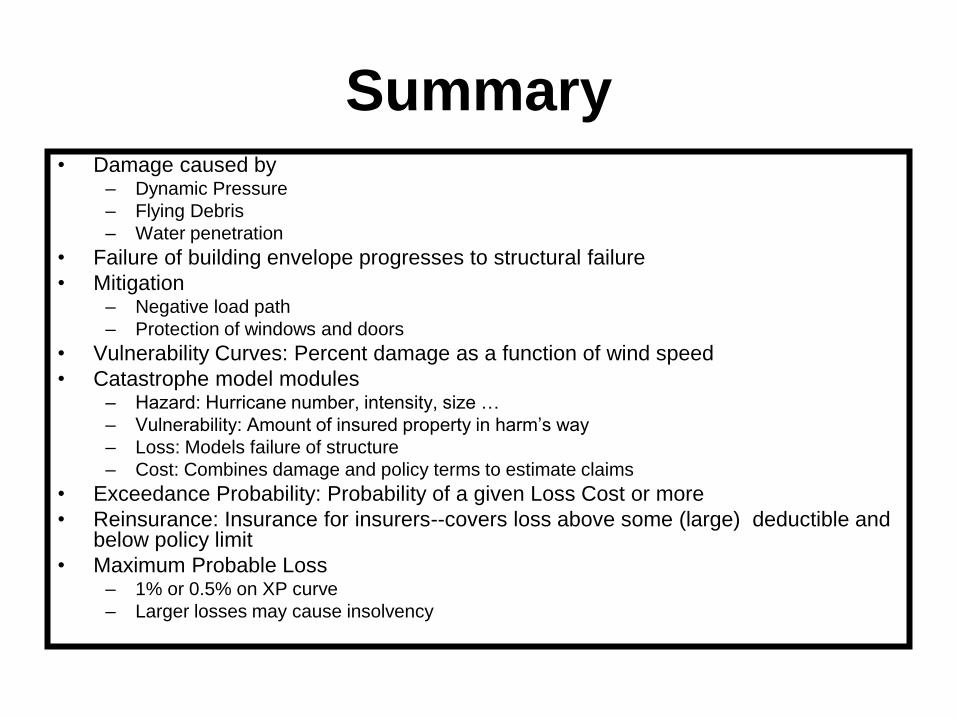
Summary • Damage caused by
– Dynamic Pressure
– Flying Debris
– Water penetration
• Failure of building envelope progresses to structural failure
• Mitigation – Negative load path
– Protection of windows and doors
• Vulnerability Curves: Percent damage as a function of wind speed
• Catastrophe model modules – Hazard: Hurricane number, intensity, size …
– Vulnerability: Amount of insured property in harm’s way
– Loss: Models failure of structure
– Cost: Combines damage and policy terms to estimate claims
• Exceedance Probability: Probability of a given Loss Cost or more
• Reinsurance: Insurance for insurers--covers loss above some (large) deductible and below policy limit
• Maximum Probable Loss – 1% or 0.5% on XP curve
– Larger losses may cause insolvency
Thank you for
your attention.
Questions?