2019 kn investor day presentation - september 17 2019...
TRANSCRIPT

Knowles Corporation2019 Analyst & Investor Day
September 17, 2019

Forward Looking Statements
This presentation contains forward-looking statements within the meaning of the safe harbor provisions of the United States Private Securities Litigation Reform Act of 1995. The words “believe,” “expect,” “anticipate,” “project,” “estimate,” “budget,” “continue,” “could,” “intend,” “may,” “plan,” “potential,” “predict,” “seek,” “should,” “will,” “would,” “objective,” “forecast,” “goal,” “guidance,” “outlook,” “effort,” “target,” and similar expressions, among others, generally identify forward-looking statements, which speak only as of the date the statements were made. The statements in this presentation are based on currently available information and the current expectations, forecasts, and assumptions of Knowles’ management concerning risks and uncertainties that could cause actual outcomes or results to differ materially from those outcomes or results that are projected, anticipated, or implied in these statements. These risks and uncertainties include, but are not limited to: unforeseen changes in MEMS microphone demand from our largest customers, in particular, two North American, a Korean, and Chinese OEM customers; the success and rate of multi-microphone and smart microphone adoption and proliferation of our “intelligent audio” solutions, including our audio edge processors, to high volume platforms; our ongoing ability to execute our strategy to diversify our end markets and customers; our ability to stem or overcome price erosion in our segments; fluctuations in our stock's market price; fluctuations in operating results and cash flows; our ability to prevent or identify quality issues in our products or to promptly remedy any such issues that are identified; the timing of OEM product launches; risks associated with increasing our inventories in advance of anticipated orders by customers; global economic instability including the recent economic slowdown in China; the impact of changes to laws and regulations that affect the Company’s ability to offer products or services to customers in different regions; risks associated with shareholder activism, including proxy contests; our ability to achieve continued reductions in our operating expenses; our ability to obtain, enforce, defend or monetize our intellectual property rights; increases in the costs of critical raw materials and components; availability of raw materials and components; managing new product ramps and introductions for our customers; our dependence on a limited number of large customers; our ability to maintain and expand our existing relationships with leading OEMs in order to maintain and increase our revenue; increasing competition and new entrants in the market for our products; our ability to develop new or enhanced products or technologies in a timely manner that achieve market acceptance; our reliance on third parties to manufacture, assemble, and test our products and sub-components; escalating international trade tensions, new or increased tariffs and trade wars among countries; financial risks, including risks relating to currency fluctuations, credit risks and fluctuations in the market value of the Company; and changes in tax laws, changes in tax rates and exposure to additional tax liabilities; and other risks, relevant factors, and uncertainties identified in our Annual Report on Form 10-K for the fiscal year ended December 31, 2018, subsequent Reports on Forms 10-Q and 8-K and our other filings we make with the U.S. Securities and Exchange Commission. Knowles disclaims any intention or obligation to update or revise any forward-looking statements, whether as a result of new information, future events or otherwise, except as required by law.
Non-GAAP Financial Measures
Unless otherwise indicated, all financial results included in this presentation are on a non-GAAP, continuing operations basis, including gross profit, earnings before interest and income taxes, adjusted earnings before interest and income taxes, diluted earnings per share, operating expenses, as well as other metrics that exclude certain amounts that are included in the most directly comparable GAAP measure to facilitate evaluation of Knowles’ operating performance. Non-GAAP results are not presented in accordance with GAAP. Non-GAAP information should be considered a supplement to, and not a substitute for, financial statements prepared in accordance with GAAP. In addition, the non-GAAP financial measures included in this presentation do not have standard meanings and may vary from similarly titled non-GAAP financial measures used by other companies. Knowles believes that non-GAAP measures are useful as supplements to its GAAP results of operations to evaluate certain aspects of its operations and financial performance, and its management team primarily focuses on non-GAAP items in evaluating Knowles’ performance for business planning purposes. Knowles also believes that these measures assist it with comparing its performance between various reporting periods on a consistent basis, as these measures remove from operating results the impact of items that, in Knowles’ opinion, do not reflect its core operating performance including, for example, stock-based compensation, certain intangibles amortization expense, fixed asset impairment charges, restructuring, production transfer costs, and other charges which management considers to be outside our core operating results. Knowles believes that its presentation of these non-GAAP financial measures is useful because it provides investors and securities analysts with the same information that Knowles uses internally for purposes of assessing its core operating performance. For a reconciliation of these non-GAAP financial measures to the most directly comparable GAAP financial measures, see the reconciliation tables included in the Appendix to this presentation.
When we provide our expectation for non-GAAP diluted EPS, adjusted earnings before interest and income taxes, and non-GAAP gross profit margin, operating expenses, on a forward-looking basis, a reconciliation of the differences between the non-GAAP expectations and the corresponding GAAP measures generally is not available without unreasonable effort due to potentially high variability, complexity and low visibility as to the items that would be excluded from the GAAP measure in the relevant future period, such as unusual gains and losses, the impact and timing of potential acquisitions and divestitures, and other structural changes or their probable significance. The variability of the excluded items may have a significant, and potentially unpredictable, impact on our future GAAP results.
Safe Harbor
2

3
Agenda
9:00 Introduction Mike Knapp — Vice President, Investor Relations
Company Overview Jeffrey S. Niew — President, Chief Executive Officer
MEMS Microphones Christian Scherp — President, Performance Audio
Balanced Armature Speakers Jon Kiachian — Vice President, Hearing Health Technologies
Audio Edge Processors Mike Polacek — President, Intelligent Audio
Break
High Performance Capacitors Sam Vinci — Vice President, Precision Devices
RF Filtering Solutions Chris Dugan — President, Precision Devices
Financial Overview John Anderson — Senior Vice President, Chief Financial Officer
Key Takeaways Jeffery S. Niew — President, Chief Executive Officer
11:00 Q&A

Jeffrey S. NiewPresident and CEO
Company Overview & Key Takeaways
4

5
Differentiated Solutions for Growing Markets
Large, attractive, and growing end markets
Innovative product portfolio sustains differentiation
Driving accelerated revenues and margin expansion

6
Portfolio Transformation is Delivering Results
Key Portfolio Moves
• Acquisition of Audience Inc.
• Attained DSP and algorithm capabilities
TAM Expansion
• Speaker / Receiver divestiture
• End market diversification
• Footprint optimization
• New product innovation
Gross Margin Improvement
• Timing business divestiture proceeds
• Strong free cash flow
Reduced Leverage Diversification
+$1B 29% to 40% 2.5x to 1.0x
Mobile51%
Other49%
Mobile35%
Other65%
2014
2019E
FY 2014 financials reflect discontinued operations including Speakers, Receivers, and Timing Devices (GAAP to Non-GAAP Reconciliation can be found in the Appendix). FY2019E represent results on a continued operations basis.Leverage represents Consolidated Total Indebtedness to Consolidated EBITDA as defined in our Revolving Credit Facility.
12/31/14 2019E2014 2019E

7
Leading Provider of High-Performance Audio, Audio Processing and Precision Device Solutions
Headquartered:
Itasca, IL
Listed:
KN
Countries:
11 KN is a market leader in:
Balanced Armature Speakers
Edge Processors
RF Filtering Solutions
MEMS Microphones
High Performance Capacitors

8
Large End Markets with Attractive Growth Rates
Multiple sources were used in compiling KN’s addressable market size including industry databases, third party research reports, industry/trade reports, and KN competitive research. Refer to each segment’s SAM for source notes.
SAM
$3.7B2022 SAM
$2.1B2019 SAM
Ear Telecom Infrastructure
IndustrialsMobile
MedTech Defense
IoT Electric Vehicle

9
Capitalizing on Diverse, Attractive End Markets
MedTech includes Hearing Health & Implantables
MedTech
IoT
Mobile
Ear
MedTech
MEMS Microphones
Audio Edge Processors
RF Filtering Solutions
Balanced Armature Speakers
High Performance Capacitors
Telecom InfrastructureEar
IoT
Ear
Mobile
CO
RE
GR
OW
TH
MedTech
Industrials
Defense
Electric Vehicle
Telecom Infrastructure
Defense

$1.6B to $1.7B SAM by 2022
47% of 2022 SAM
10
Diversified Core Markets Provide Consistent Growth
MedTech
• Deep customer relationships
• Transitioning to MEMS mics
• Aging global population
• Enabling mission-critical applications
4%SAM CAGR2019-2022
Mobile
• Market share leader
• 5G upgrade cycle
• Multi-mic adoption
2%SAM CAGR2019-2022
Defense
• Radar and communication system upgrades
• Multi-year program commitments
4%SAM CAGR2019-2022
Industrial
• Broad customer base
• Differentiated capacitors
• High performance voltage and temperature
4%SAM CAGR2019-2022
Multiple sources were used in compiling KN’s addressable market size including industry databases, third party research reports, industry/trade reports, and KN competitive research. Refer to each segment’s SAM for source notes.
0.6% Mobile Phone Unit Growth CAGR
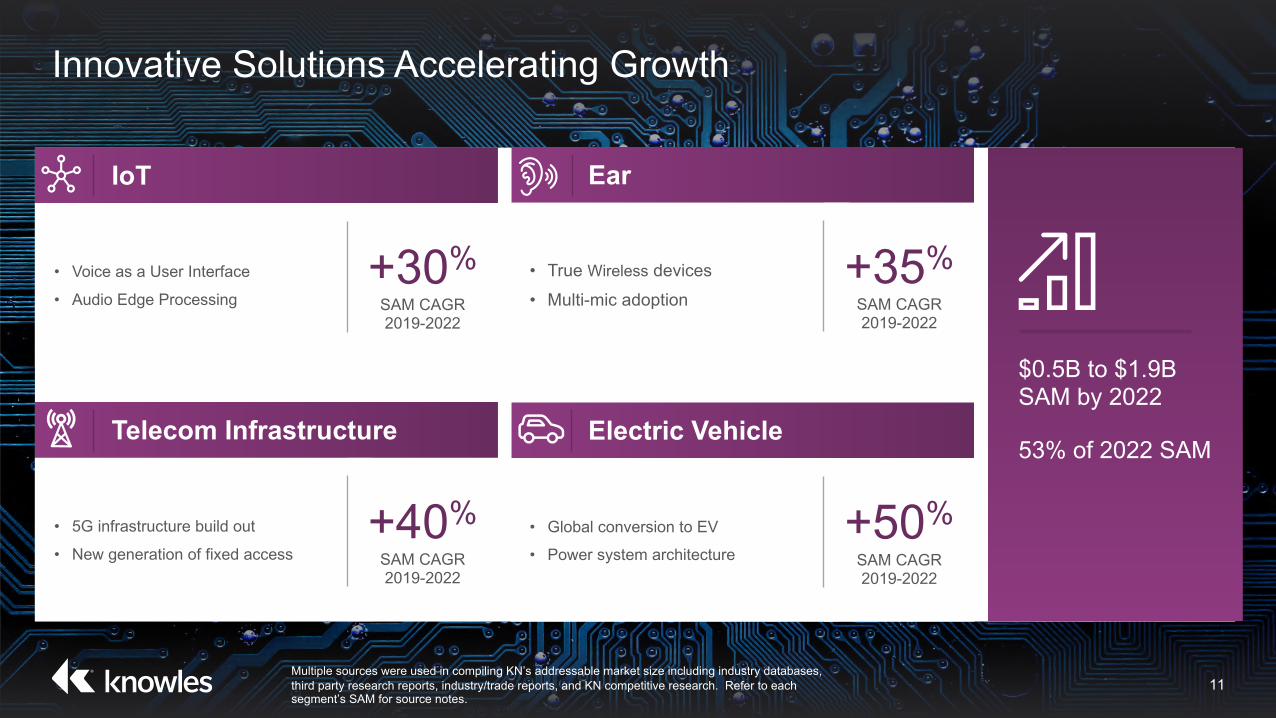
IoT
• Voice as a User Interface
• Audio Edge Processing
+30%SAM CAGR2019-2022
Telecom Infrastructure
• 5G infrastructure build out
• New generation of fixed access
+40%SAM CAGR2019-2022
Ear
• True Wireless devices
• Multi-mic adoption+35%
SAM CAGR2019-2022
Electric Vehicle
• Global conversion to EV
• Power system architecture
+50%
SAM CAGR2019-2022
11
Innovative Solutions Accelerating Growth
$0.5B to $1.9B SAM by 2022
53% of 2022 SAM
Multiple sources were used in compiling KN’s addressable market size including industry databases, third party research reports, industry/trade reports, and KN competitive research. Refer to each segment’s SAM for source notes.

MEMS MicrophonesSmallest with the highest signal to noise ratio at the lowest power
Balanced Armature SpeakersSmallest speaker with the greatest output at the lowest power
Edge ProcessorsSuperior audio and machine learning optimization with lowest power and latency
High Performance CapacitorsHigh voltage, temp, reliability and capacitance/size
RF Filtering SolutionsHigh frequency filtering for next generation communication
12
Innovation Expands Gross Margin
13
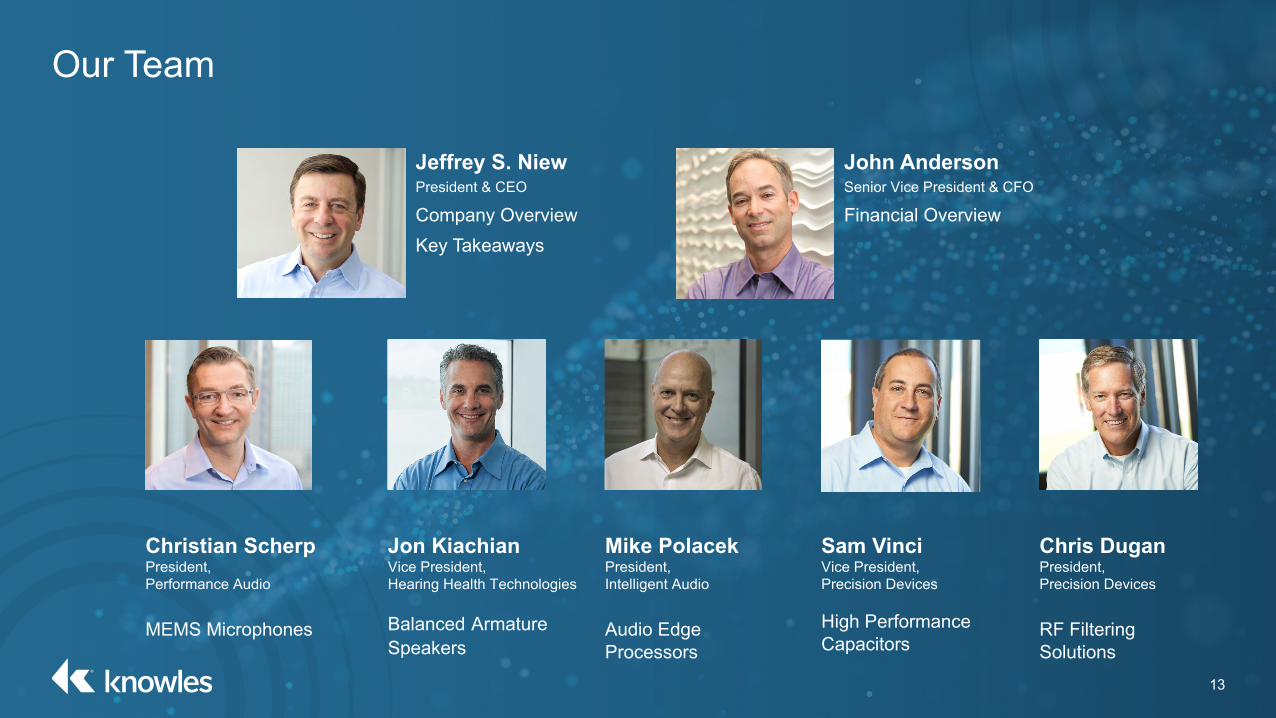
Our Team
Jeffrey S. NiewPresident & CEO
Company Overview Key Takeaways
John AndersonSenior Vice President & CFO
Financial Overview
Chris DuganPresident, Precision Devices
RF Filtering Solutions
Mike PolacekPresident, Intelligent Audio
Audio Edge Processors
Christian ScherpPresident, Performance Audio
MEMS Microphones
Jon KiachianVice President,Hearing Health Technologies
Balanced ArmatureSpeakers
Sam VinciVice President,Precision Devices
High Performance Capacitors

Christian ScherpPresident, Performance Audio
14
MEMS MicrophonesVoice as the User Interface
15
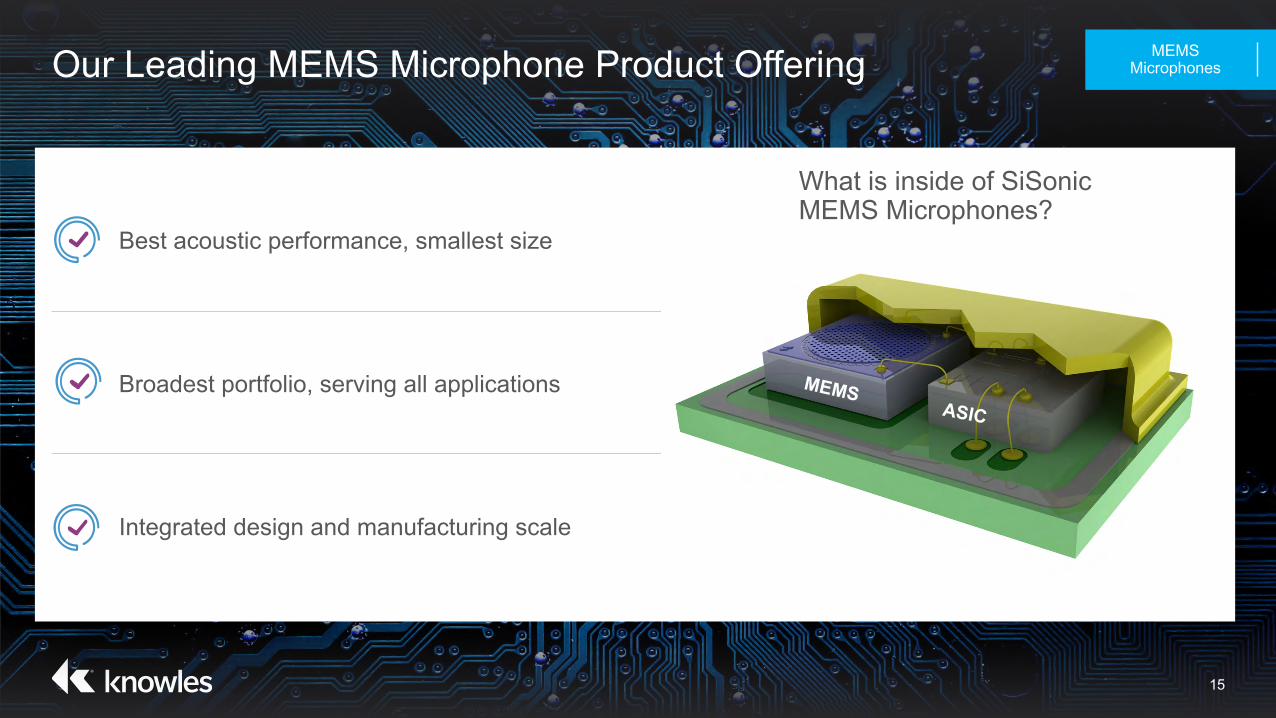
Our Leading MEMS Microphone Product Offering MEMS Microphones
Best acoustic performance, smallest size
Broadest portfolio, serving all applications
Integrated design and manufacturing scale
What is inside of SiSonic MEMS Microphones?
ASICMEMS

16
MEMS Microphones Market Overview
Primary SAM Sources: IHS, Yole, SAR Insights, IDC, US Hearing Industry Association, Futuresource and KN competitive research.
MEMS Microphones
$1.2B2022 SAMLeading market
share
Strong growth across diverse end market applications
Growth
Core
Mobile
MedTech
IoT
Ear
$1.0B2019 SAM

555M585M
2019 2022
17
Mobile MEMS
Primary SAM Sources: IHS, Yole, KN competitive research.
MEMS Microphones
Mobile SAM ($)
Voice Communications ● Voice User Interface ●Video Recording Sound ● Selfie-mode Recording Sound ● Digital Shift
Flagship• 5G
• Best-in-class audio
• New features
– Context awareness
– Multi-media focus
Mainstream• Audio feature expansion
• Multi-mic adoption
• Conversion to digital
Entry• Improved 4G feature phones
– Quality
– Robustness
– Battery life
2% CAGR
Mobile Use Cases and Market Drivers

IoT SAM ($) IoT Use Cases and Market Drivers
Voice as the User Interface Driving “Microphones Everywhere”
18
...IoT Market Trends
Primary SAM Sources: IHS, SAR Insights, IDC, and KN competitive research.
MEMS Microphones
TVs
Home IoTOther / Non-Home IoT
Wearables
Automotive
105M
190M
2019 2022
Smart Speakers
22% CAGR

19
…Ear Market Trends MEMS Microphones
Primary SAM Sources: Futuresource and KN competitive research.
Ear SAM ($) Ear Use Cases and Market Drivers
160M
250M
2019 2022
16% CAGR
True Wireless
Voice as a User Interface
Active Noise Cancellation
Increased content and higher consumer value
Wireless Over the Ear Wired

45M
65M
2019 2022
20
…and MedTech Market TrendsMEMS
Microphones
Primary SAM Sources: US Hearing Industry Association and KN competitive research.
MedTech SAM ($) MedTech Use Case and Market Drivers
13% CAGR
Electret Microphone to MEMS
conversion
Aging population with a
willingness to pay for features
Developing over the counter
(OTC) market
Hearing Aids

21
Why We Win in MEMS Core Market MEMS Microphones
Well-positioned with market leaders
Top supplier across all Mobile tiers
Global manufacturing scale and support
Investing to meet market trends
Growth Above the Market Rate
Margin Expansion

22
Why We Win in MEMS Growth Markets MEMS Microphones
Growth at Market Rate
Gross Margins Above Corporate Average
IoT
Aligning with key IoT ecosystems
MEMS and ASIC capabilities
Ear
Lowest power and smallest microphones
Enabling cutting edge features
MedTech
Leveraging MEMS leadership with our deep customer partnerships

23
MEMS Microphones Key Takeaways MEMS Microphones
Voice as a User Interface
Market leading share and scale with diversity of end market applications
Profitable growth through technological differentiation

Jon KiachianVice President,Hearing Health Technologies
24
Balanced Armature SpeakersEnabling Superior Portable Audio

25
Our Leading Balanced Armature Product Offering Balanced Armature Speakers
World’s smallest speaker
Lowest power
Superior audio
Balanced Armature is the Worlds Smallest Speaker Technology
Coil
Electrical Output
Yoke
Permanent Magnets
Reed
Acoustic Output
Diaphragm
Drive Rod
Balanced Armature Dynamic Speaker
What is inside a Balanced Armature Speaker?
Less than½
the size
26
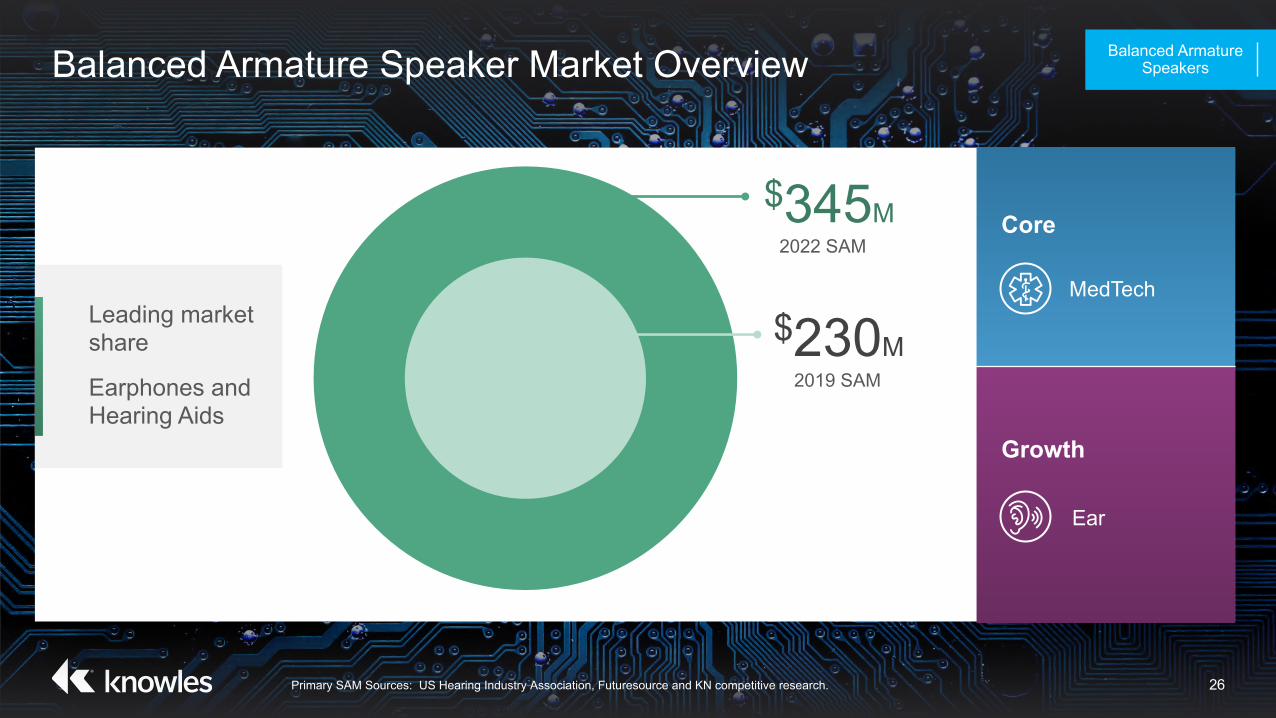
Balanced Armature Speaker Market Overview Balanced Armature Speakers
Primary SAM Sources: US Hearing Industry Association, Futuresource and KN competitive research.
$345M2022 SAM
Growth
Ear
Core
MedTech
$230M2019 SAM
Leading market share
Earphones and Hearing Aids

27
Differentiated Balanced Armature Speakers Enable Growth
Across Ear Use Cases…
Balanced Armature
Speakers
Ear SAM ($) Ear Use Cases and Market Drivers
Primary SAM Sources: Futuresource and KN competitive research.
40M
130M
2019 2022
48% CAGR
• Customers demanding
full range sound with
open fit
• Dual driver with
premium tweeter
Hybrid
Earphones
Premium
Earphones
True Wireless
Earphones
• Small size enables multiple
drivers for superior audio
quality
• 2 to 8 speakers per ear
• High quality audio
• Space for other sensors
• Longer battery life

28
…and MedTech Balanced Armature Speakers
Primary SAM Sources: US Hearing Industry Association and KN competitive research.
Hearing Health Use Case and Market DriversMedTech SAM ($)
190M215M
2019 2022
4% CAGR
Aging population willing to pay for advanced features
Developing over the counter (OTC) market
Hearing Aids
Social acceptance of in-ear devices Full range of output options allows customers to address mild to severe hearing loss

29
Why We Win in Balanced Armature Markets Balanced Armature Speakers
Track record of innovation and delivering premium performance to customers
Broad suite of high performance solutions
Manufacturing capability and scale
Growth at Market Rate
Gross Margins Above Corporate Average
30
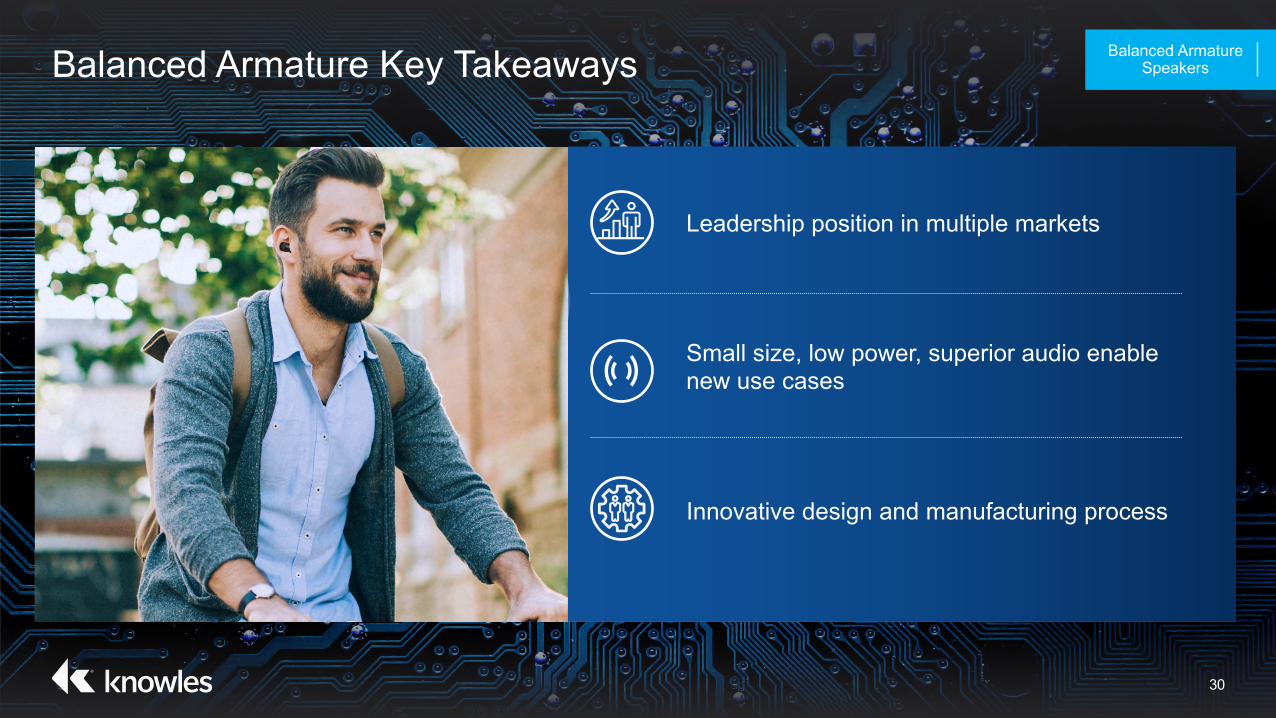
Balanced Armature Key Takeaways Balanced Armature Speakers
Leadership position in multiple markets
Small size, low power, superior audio enable new use cases
Innovative design and manufacturing process

Mike PolacekPresident,Intelligent Audio
31
Audio Edge ProcessorsEnabling Use Cases Beyond a Continuous Cloud Connection

32
What is Edge Processing? Edge Processors
Advantages of Edge Processing • Off load cloud
• Latency to cloud
• Privacy
• Reduced reliance on connection
• Always on use cases
• Efficiency
• AP platform independence
• Development efficiency
• Device differentiation
From Edge Sensors to the Centralized CloudThe Edge Computing Ecosystem Primary Segments
Centralized Cloud
Edge Devices
Knowles AISonic Solutions
Quad Core Audio Edge Processors
Dual Core Audio Edge Processors
Smart Microphones

33
Audio Edge Processing Business and Market Overview
Primary SAM Sources: IHS, Futuresource, SAR and KN competitive research.
Edge Processors
$960M2022 SAM
Growth
IoT
Ear
Mobile
$95M2019 SAM
Leader in the emerging Audio Edge Processing market

34
Advantages of AISonic Audio Edge Processors Edge Processors
Enables always on use cases
Deployable across different models and application processors
Open DSP allowing for use case customization
OPEN
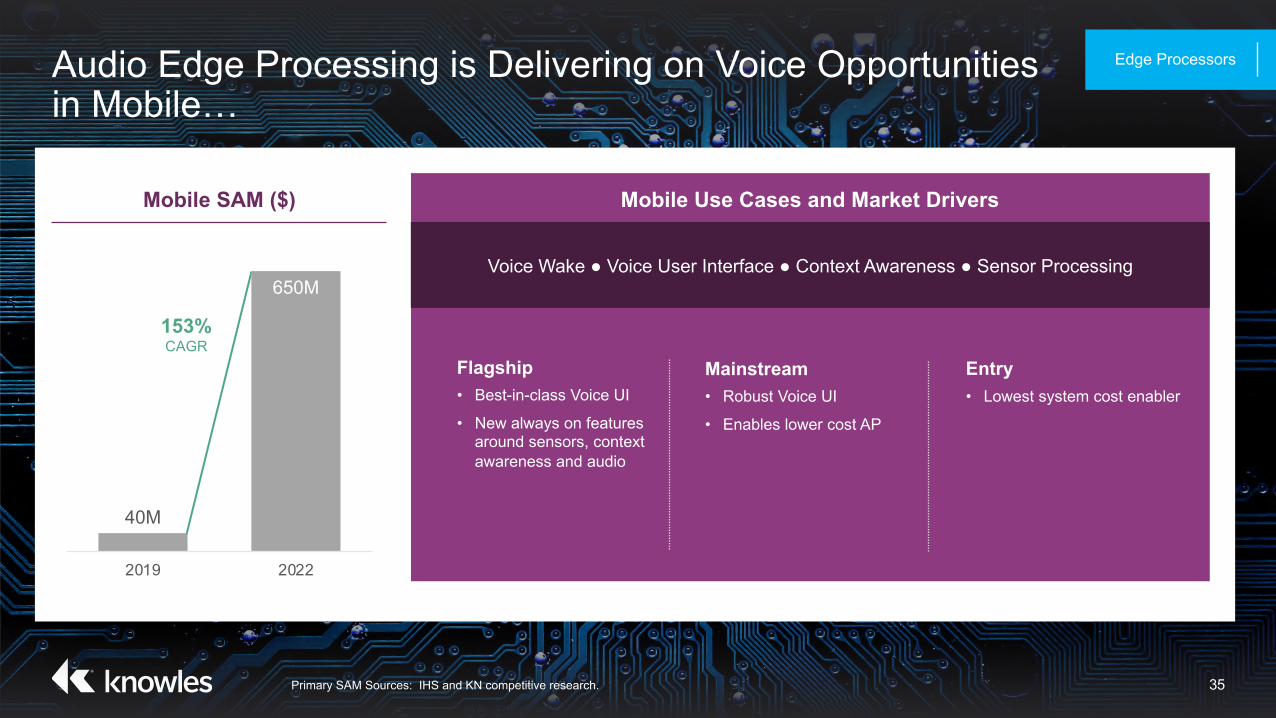
40M
650M
2019 2022
35
Audio Edge Processing is Delivering on Voice Opportunities in Mobile…
Edge Processors
Primary SAM Sources: IHS and KN competitive research.
Mobile SAM ($)
Voice Wake ● Voice User Interface ● Context Awareness ● Sensor Processing
Flagship• Best-in-class Voice UI
• New always on features around sensors, context awareness and audio
Mainstream• Robust Voice UI
• Enables lower cost AP
Entry• Lowest system cost enabler
Mobile Use Cases and Market Drivers
153% CAGR

36
…the Rapidly Expanding IoT and Ear Markets Edge Processors
Primary SAM Sources: IHS, Futuresource, SAR and KN competitive research
Ear and IoT SAM ($)
55M
310M
2019 2022
78% CAGR
Voice User Interface ● Voice Communications ● Premium Earphone Features
IoT and Ear Use Cases and Market Drivers
Smart TVs
• Low power voice wake
• Accurate voice capture
Smart Speaker
• Low power voice control for portables
• Seamless Voice UI with the ecosystem leaders
Smart Home
• Low power voice wake
• Accurate voice capture
• Longer battery life
Ear• Voice control
• Seamless Voice UI with the ecosystem leaders
• Low power edge processing
37
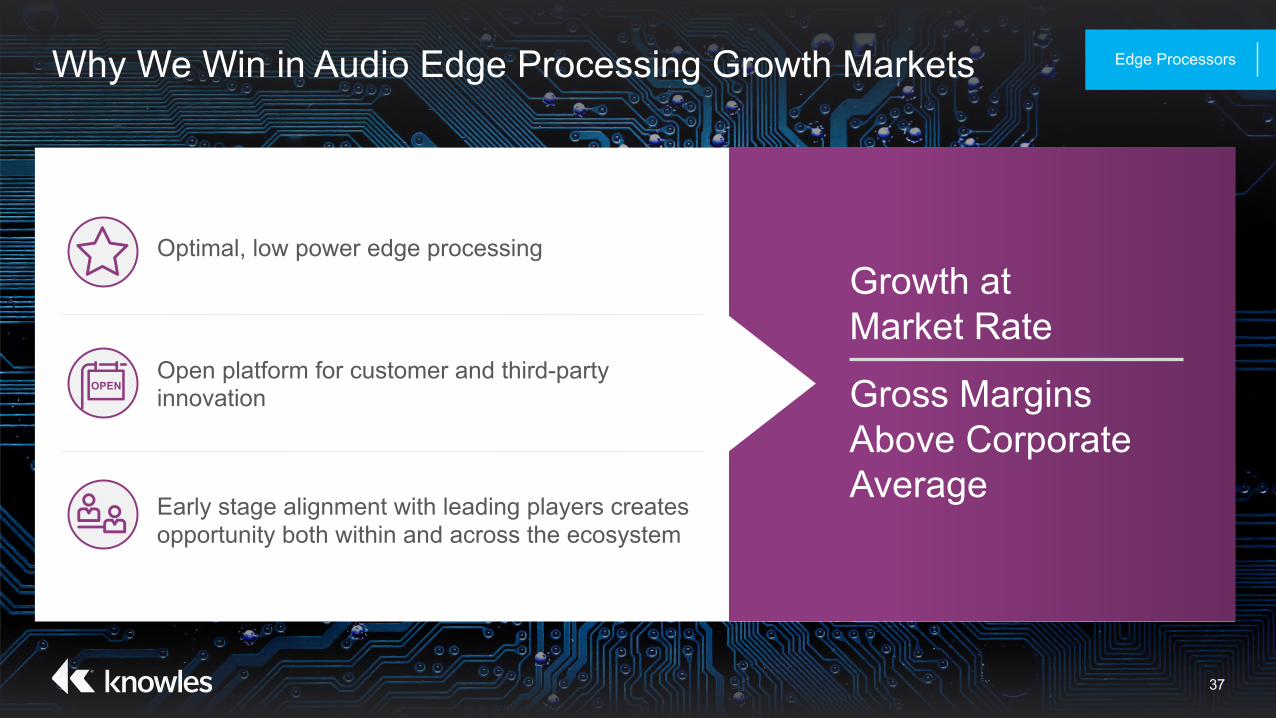
Why We Win in Audio Edge Processing Growth Markets Edge Processors
Growth at Market Rate
Gross Margins Above Corporate Average
Optimal, low power edge processing
Open platform for customer and third-party innovation
Early stage alignment with leading players creates opportunity both within and across the ecosystem
OPEN

38
Audio Edge Processing Key Takeaways Edge Processors
Explosion of voice/audio/sensor data
Unique low power, high performance platform
Open platform enables full participation across ecosystems

Knowles Corporation2019 Analyst & Investor Day
September 17, 2019

Chris DuganPresident, Precision Devices
40
Sam VinciVice President, Precision Devices
41
High Performance CapacitorsCreating Solutions for the Most Demanding Applications
42
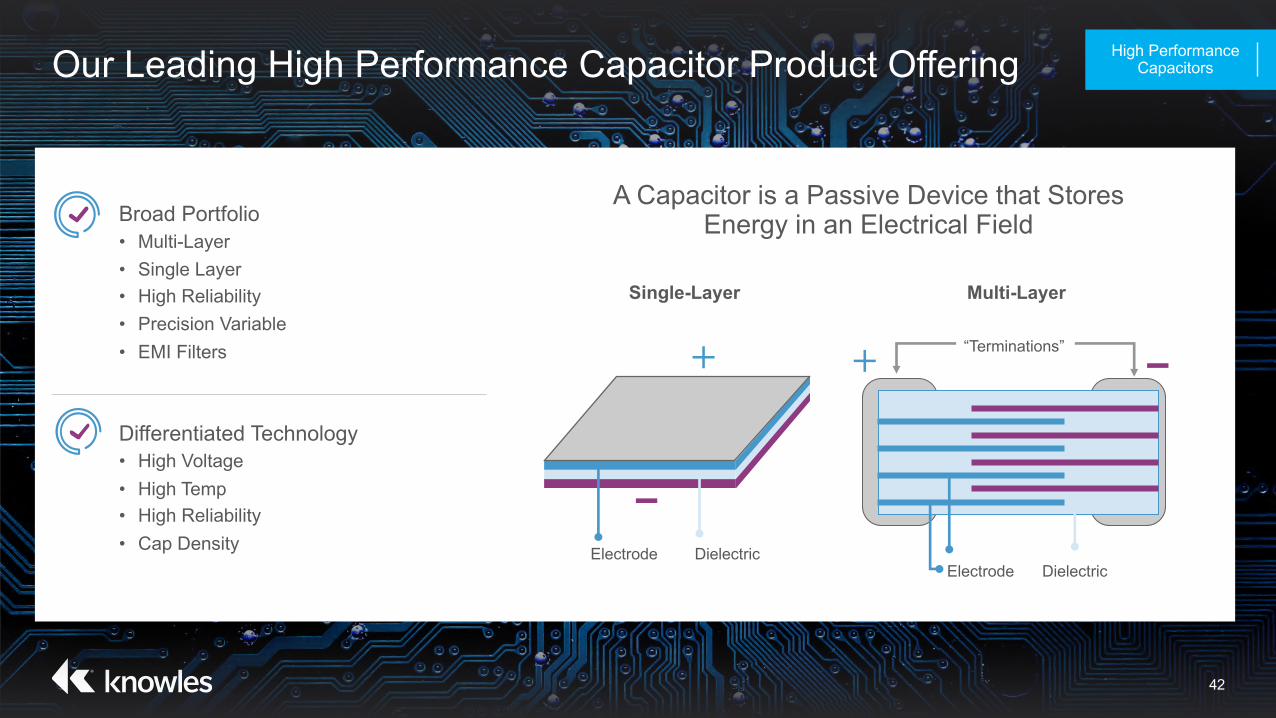
Our Leading High Performance Capacitor Product Offering High Performance Capacitors
Broad Portfolio• Multi-Layer• Single Layer• High Reliability• Precision Variable• EMI Filters
Differentiated Technology• High Voltage• High Temp• High Reliability• Cap Density
A Capacitor is a Passive Device that Stores Energy in an Electrical Field
DielectricElectrode
“Terminations”
DielectricElectrode
Single-Layer Multi-Layer

43
High Performance Capacitors Market Overview High Performance Capacitors
Primary SAM Sources: Paumanok and KN competitive research.
Growth
Core
MedTech$805M
2022 SAM
$530M2019 SAM
Electric Vehicle
Telecom Infrastructure
Industrials
Defense
Leader in High Reliability / High Performance

400M
450M
2019 2022
44
Broad Portfolio of Solutions Driving Steady Demand in Core…High Performance
Capacitors
Primary SAM Sources: Paumanok and KN competitive research.
Capacitor Core SAM ($)
Delivering high performance in unique form factors to address broad range of applications
Core Market Use Cases and Market Drivers
4% CAGR
MedTechMRIs and implantable
medical devices
IndustrialsAdvanced power supply and
motor control systems
DefenseElectronics and power systems
upgrades across multiple
programs
45
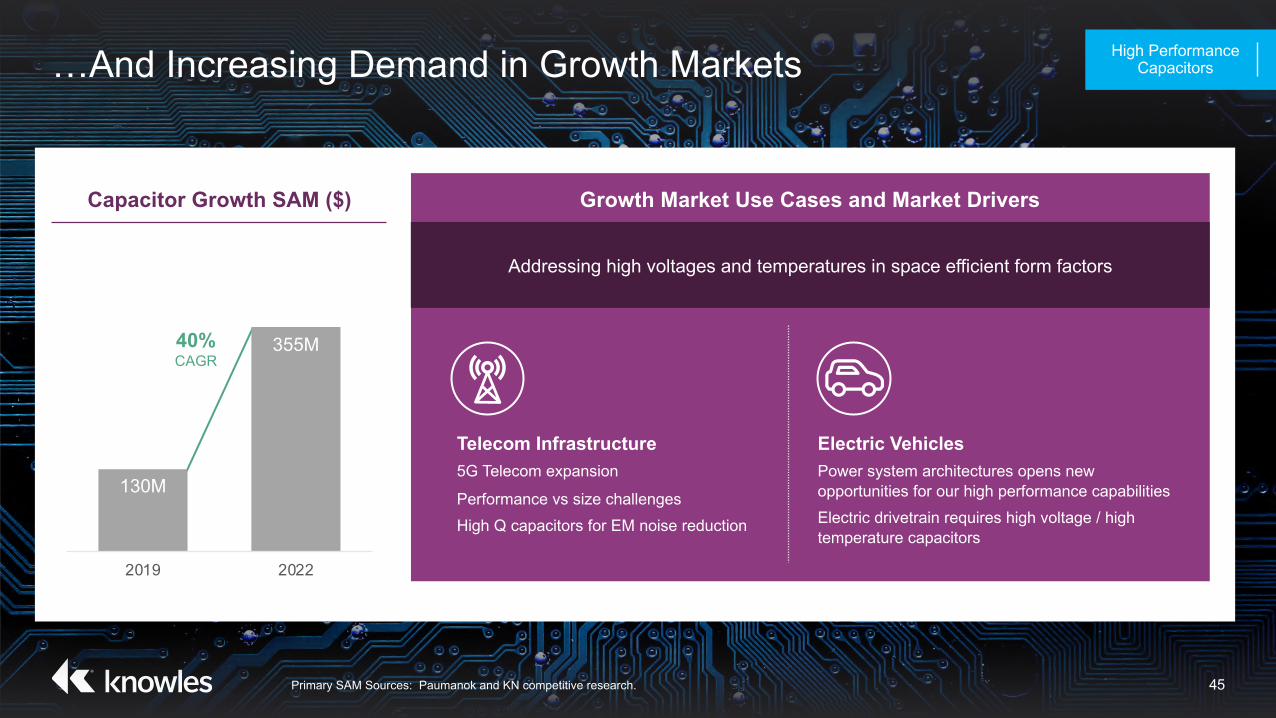
…And Increasing Demand in Growth Markets High Performance Capacitors
Primary SAM Sources: Paumanok and KN competitive research.
Capacitor Growth SAM ($)
Addressing high voltages and temperatures in space efficient form factors
Growth Market Use Cases and Market Drivers
130M
355M
2019 2022
Telecom Infrastructure5G Telecom expansion
Performance vs size challengesHigh Q capacitors for EM noise reduction
Electric VehiclesPower system architectures opens new opportunities for our high performance capabilitiesElectric drivetrain requires high voltage / high temperature capacitors
40% CAGR

46
Electric Vehicles Presents High Growth Opportunity High Performance Capacitors
Accelerating EV adoption• 500M+ EVs on the road globally
by 2040
EV powertrain requirements driving demand for our high performance products
DC/DC
PCU
DC/DC
EV ECU
ECU
BMS AC/DC DC/AC
On-Board AC/DC ChargerBattery Management Systems
DC/DC Converter
DC/AC ConverterPTC Heater Controller
BloombergNEF.

47
Why We Win in High Performance Capacitors High Performance Capacitors
Ability to solve complex challenges
Resources aligned to key markets
Application customization through closecollaboration with customers
Unique ceramic formulations
Demonstrated reliability commands premium pricing
Growth at Market Rate
Gross Margins In Line With Corporate Average

48
High Performance Capacitors Key Takeaways High Performance Capacitors
Well-established technology leader in specialty markets
Positioned to win by leveraging established high-performance capabilities
Electric Vehicle growth and 5G tailwinds

Chris DuganPresident, Precision Devices
49
RF Filtering Solutions Designing Filters for the Future of Connectivity

50
Spectrum Summary RF Filtering Solutions
Broad Deployment Dense Area Deployment
Knowles Participation
Existing Mobile Spectrum New Mobile Spectrum
Coverage & Capacity Low Latency High Capacity
Below 1GHz 1-6 GHz 30 GHz mmWave Bands 100 GHz
Macro Cells
Existing MobileTVWiFi
Macro & Small Cells
Fixed Links and Satellites
Small Cells
Microwave Bands

51
Our Leading RF Filter Product Offering RF Filtering Solutions
Most compact filters
Unique ceramic formulations
Custom designs
An RF Filter Permits the Passage of Select Frequencies
mmWave Communications
5G
Public Safety Weather Satellite
Knowles RF Filter

52
RF Filtering Solutions Market Overview
Primary SAM Sources: Small Cell Forum: Small Cells Market Status Report and KN competitive research.
RF Filtering Solutions
$300M2022 SAM
Growth
Telecom Infrastructure
Core
Defense
$155M2019 SAM
Market Leader in compact microwave / mmWave Filtering

53
Leveraging First Mover Advantage Across RF Filtering Markets
RF Filtering Solutions
Primary SAM Sources: Small Cell Forum: Small Cells Market Status Report and KN competitive research.
Use Cases and Market Drivers
RadarDefense upgrades of radar and communications systems
Defense CommunicationsAdvanced detection and jamming
Core SAM ($) Growth SAM ($)
5G Base Stations 5G mmWave deployment
15M125M
2019 2022
140M 175M
2019 2022
103% CAGR
8% CAGR

54
Enabling the Transition to 5G RF Filtering Solutions
= Widespread Commercial Deployment (Mobile Experts)● = License/Auction Activity (GSA)
mmWave Deployment Schedule
2018 2019 2020 2021 2022 2023 2024 2025
US ●
Japan ●
Australia ●
South Korea ●
China ●
Europe ● ● ●
Base Station Estimates4 – 16 filters mmWave Antenna Point Deployment Expectations
5G mmWave
Seamless Mobility and Performance
5G mmWave
mmWaveAntenna
mmWaveAntenna
Sub-6GHz 5G

55
Why We Win in RF RF Filtering Solutions
Technology widely deployed and proven in critical environments
Proprietary substrate materials and processing techniques
Unique in-house design and testing capabilities
Investing in high-volume manufacturing line to meet 5G demand
Growth at Market Rate
Gross Margins Above Corporate Average

56
RF Filtering Solutions Key Takeaways RF Filtering Solutions
Leveraging historical defense technology leadership
Only technology that can achieve filtering and size requirements
Leader in 5G mmWave filtering

John AndersonSenior Vice President & CFO
57
Financial Overview
58
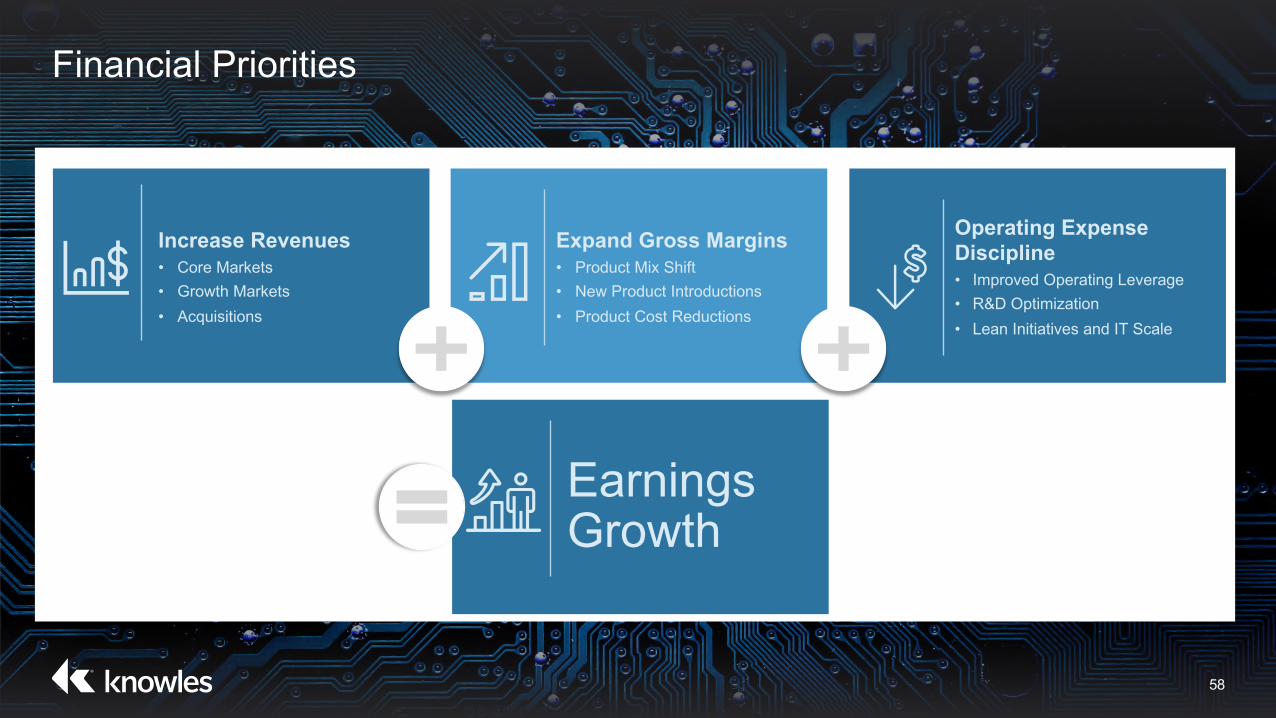
Financial Priorities
Operating Expense Discipline• Improved Operating Leverage• R&D Optimization• Lean Initiatives and IT Scale
Expand Gross Margins• Product Mix Shift• New Product Introductions• Product Cost Reductions
Increase Revenues • Core Markets• Growth Markets• Acquisitions
Earnings Growth

59
Driving Results: 2017-2019 Financial Performance
2017 2018 2019E CAGR(2017-2019)
Revenues $744M $827M $845 - 870M 7.4%
Non-GAAP Gross Profit(as % of revenue)
$300M40.3%
$327M39.5%
$330 - 356M39% - 41%
Adjusted EBIT(as % of revenue)
$111M14.9%
$117M14.2%
$128 - 138M15% - 16%
Non-GAAP Diluted EPS $0.88 $1.01 $1.09 - $1.17 13.3%
Leverage Ratio 1.4x 1.2x 1.0x
GAAP to Non-GAAP Reconciliation can be found in the Appendix for 2017 and 2018 Results.Leverage Ratio represents Consolidated Total Indebtedness to Consolidated EBITDA as defined in our Revolving Credit Facility.

60
Grow Revenues Mid to High Single Digits
Revenue Drivers
• 5G infrastructure: RF Filtering Solutions
• Ear/true wireless: Mics/BAs/Audio Edge Processors
• IoT/smart home: Mics/Audio Edge Processors
• Electric Vehicles: High Performance Capacitors
• Increased smartphone content (multi-mic, analog to digital, 5G)
• OTC hearing aids, favorable demographic trends (aging baby boomers, middle class in developing markets)
• Stable trends in MedTech, Defense and Industrial
Strong Core Enhanced by Significant Growth Opportunities
2018 2019E 3-4 Years
Core Growth
$827M
$1-$1.1B
$845-$870M Mid to HighSingle Digit Growth+
Low SingleDigit Growth

61
Expand Gross Profit Margin
Non-GAAP Gross Profit Margin Drivers
• Multiple Growth Opportunities at Above Average Gross Margins
• MEMS Microphone Product Mix (Analog to Digital)
• Product Cost Reductions, Net of ASP Erosion
• Productivity Gains
Improved Gross Margin though Growth in High Value New Products, Favorable Mix Shifts and Product Cost Reductions
GAAP to Non-GAAP Reconciliation can be found in the Appendix for 2018 Results.
2018 2019E New Products Mix Cost 3 - 4 Years
39-41%39.5%
42% or higher

62
Operating Expense Discipline
Non-GAAP Operating Expenses Expense Management
SG&A• Operational Leverage with Revenue Growth
• IT Optimization
• Lean Back Office
R&D• Investing in Product Roadmaps
• Leveraging Low Cost Regions
• Ongoing Portfolio ROI Review Process
Significant Operating Leverage through Disciplined Cost Controls
2018 2019E 3-4 Years
SG&A R&D
11.2% 10.5%10-11%
14.3% 14.0% 11-12%
GAAP to Non-GAAP Reconciliation can be found in the Appendix for 2018 Results.

63
Disciplined Capital Allocation Strategy
Invest in the Business Maintenance and Growth CapEx
• Invest in Innovation
• Next Generation Manufacturing Technology
• Acquisitions
• Pay Down Bank Revolver
Today
Selective Investment to Maintain Leadership and GrowthMaintain Investment Grade Credit Metrics
• Debt Reduction
• Acquisitions
• Consider Options for Excess Cash
Future

64
Financial Target Model
2018 2019E Target Model (3-4 Years)
Revenues $827M $845 – $870M Mid to high single digit growth
Non
-GAA
P M
argi
ns Gross Profit 39.5% 39-41% 42% or higher
Adjusted EBIT 14.2% 15-16% 20% or higher
GAAP to Non-GAAP Reconciliation can be found in the Appendix for 2018 Results.

Key Takeaways
65

66
Powering Sustainable Growth
Large, attractive, and growing end markets
Innovative product portfolio sustains differentiation
Driving accelerated revenues and margin expansion
Strong financial foundation and disciplined capital allocation
On path to exceed $1B in revenue and achieve 50% increase in operating income

Appendix
67

68
GAAP to Non-GAAP Gross Profit Reconciliation
($M's) December 31, 2014
Revenues $1,141.3
Gross profit $232.7
Gross profit as % of revenues 20.4%
Stock-based compensation expense 0.8
Fixed asset and other related charges 39.5
Restructuring charges 23.3
Production transfer costs1 24.5
Other2 15.0
Non-GAAP gross profit $335.8
Non-GAAP gross profit as % of revenues 29.4%
1. Production transfer costs represent duplicate costs incurred to migrate manufacturing to facilities primarily in Asia. These amounts are included in the corresponding Gross profit and Earnings from continuing operations before interest and income taxes for each period presented.
2. Other represents a charge related to the resolution of customer claims for products no longer produced.
69
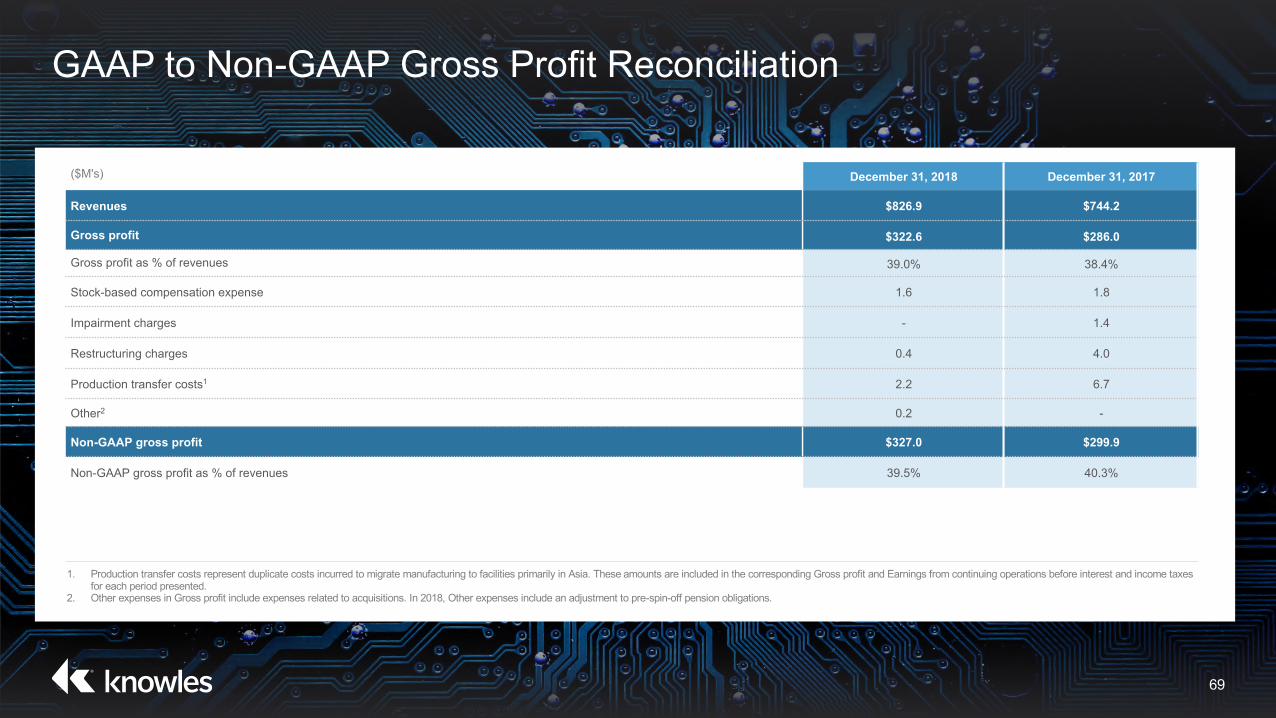
GAAP to Non-GAAP Gross Profit Reconciliation
($M's) December 31, 2018 December 31, 2017
Revenues $826.9 $744.2
Gross profit $322.6 $286.0
Gross profit as % of revenues 39.0% 38.4%
Stock-based compensation expense 1.6 1.8
Impairment charges - 1.4
Restructuring charges 0.4 4.0
Production transfer costs1 2.2 6.7
Other2 0.2 -
Non-GAAP gross profit $327.0 $299.9
Non-GAAP gross profit as % of revenues 39.5% 40.3%
1. Production transfer costs represent duplicate costs incurred to migrate manufacturing to facilities primarily in Asia. These amounts are included in the corresponding Gross profit and Earnings from continuing operations before interest and income taxes for each period presented.
2. Other expenses in Gross profit include expenses related to acquisitions. In 2018, Other expenses include an adjustment to pre-spin-off pension obligations.

70
Earnings from Continuing Operations to
Adjusted EBIT Reconciliation
($M's) December 31, 2018 December 31, 2017
Revenues $826.9 $744.2
Earnings from continuing operations before interest and income taxes $77.1 $40.0
Stock-based compensation expense 27.0 24.7
Intangibles amortization expense 6.5 7.3
Impairment charges - 21.3
Restructuring charges 2.1 10.2
Production transfer costs (1) 2.6 6.8
Other (2) 1.9 0.3
Adjusted earnings from continuing operations before interest and income taxes $117.2 $110.6
Adjusted earnings from continuing operations before interest and income taxes as % of revenues 14.2% 14.9%
1. Production transfer costs represent duplicate costs incurred to migrate manufacturing to facilities primarily in Asia. These amounts are included in the corresponding Gross profit and Earnings from continuing operations before interest and income taxes
for each period presented.
2. Other expenses in Gross profit include expenses related to acquisitions. In 2018, Other expenses include an adjustment to pre-spin-off pension obligations.

71
GAAP to Non-GAAP Diluted EPS Reconciliation
($M's) December 31, 2018 December 31, 2017
Earnings from continuing operations $65.6 $6.5
Non-GAAP reconciling adjustments (1) 40.1 70.6
Interest expense, net non-GAAP reconciling adjustments (2) 6.3 6.1
Income tax effects of non-GAAP reconciling adjustments (3) 17.5 2.0
Non-GAAP net earnings $94.5 $81.2
Diluted earnings per share from continuing operations $0.72 $0.07
Earnings per share non-GAAP reconciling adjustment 0.29 0.81
Non-GAAP diluted earnings per share $1.01 $0.88
Diluted average shares outstanding 91,194,747 90,490,007
Non-GAAP adjustment (4) 2,046,989 1,959,801
Non-GAAP diluted average shares outstanding (4) 93,241,736 92,449,808
1. The non-GAAP reconciling adjustments are those adjustments made to reconcile Earnings from continuing operations before interest and income taxes to Adjusted earnings from continuing operations before interest and income taxes.
2. Under GAAP, certain convertible debt instruments that may be settled in cash (or other assets) upon conversion are required to be separately accounted for as liability (debt) and equity (conversion option) components of the instrument in a manner that
reflects the issuer’s nonconvertible debt borrowing rate. Accordingly, for GAAP purposes we are required to recognize imputed interest expense on the Company’s $172.5 million of convertible senior notes due 2021 that were issued in a private
placement in May 2016. The imputed interest rate is 8.12% for the convertible notes due 2021, while the actual coupon interest rate of the notes was 3.25%. The difference between the imputed interest expense and the coupon interest expense is
excluded from management’s assessment of the Company’s operating performance because management believes that this non-cash expense is not indicative of its core, ongoing operating performance.
3. Income tax effects of non-GAAP reconciling adjustments are calculated using the applicable tax rates in the jurisdictions of the underlying adjustments. Adjustments are also made to exclude certain impacts of the Tax Reform Act and the resulting
consequences that were accounted for as uncertain tax positions.
4. The number of shares used in the diluted per share calculations on a non-GAAP basis excludes the impact of stock-based compensation expense expected to be incurred in future periods and not yet recognized in the financial statements, which would
otherwise be assumed to be used to repurchase shares under the GAAP treasury stock method.

72
GAAP to Non-GAAP Operating Expense Reconciliation
($M's) December 31, 2018 December 31, 2017
Revenues $826.9 $744.2
Research and development expenses $100.6 $93.4 Stock-based compensation expense (7.8) (6.1)Production transfer costs (1) (0.4) -Non-GAAP research and development expenses $92.4 $87.3 Non-GAAP R&D Expenses as % of revenues 11.2% 11.7%Selling and administrative expenses $142.5 126.6 Stock-based compensation expense (17.6) (16.8)Intangibles amortization expense (6.5) (7.3)Production transfer costs (1) - (0.1)Other (2) (0.4) (0.3)Non-GAAP selling and administrative expenses $118.0 $102.1 Non-GAAP SG&A expenses as % of revenues 14.3% 13.7%Operating expenses $ 244.8 $246.1 Stock-based compensation expense (25.4) (22.9)Intangibles amortization expense (6.5) (7.3)Impairment charges - (19.9)Restructuring charges (1.7) (6.2)Production transfer costs (1) (0.4) (0.1)Other (2) (0.4) (0.3)Non-GAAP operating expenses $210.4 $189.4 Non-GAAP operating expenses as % of revenues 25.4% 25.5%
1. Production transfer costs represent duplicate costs incurred to migrate operations to facilities primarily in Asia. 2. Other expenses include expenses related to acquisitions. In 2018, Other expenses also include an adjustment to pre-spin-off pension obligations.