2019 - integrated workforce strategies | sullivancotter
TRANSCRIPT

Survey data effective January 1, 2019
2019Medical Group Executive Compensation Survey Report
© 2019 SullivanCotter, Inc. All rights reserved.200 W. Madison Street, Suite 2450Chicago, IL 60606-3416

2019
MEDICAL GROUP
EXECUTIVE
COMPENSATION
SURVEY REPORT
Survey data effective January 1, 2019

LICENSE AGREEMENT

LICENSE AGREEMENT
By accessing or downloading the Survey Report files online or by opening the
packaging for this Survey Report, you agree to the terms of this License
Agreement (this “Agreement”). If you do not agree to these terms and have not
yet accessed or downloaded the Survey Report files or opened the packaging
for this Survey Report, you may cancel your online purchase or download at this
time or you may return this Survey Report to SullivanCotter, Inc. for a full refund
within thirty (30) days of receipt, but you may not access or download the Survey
Report files or open the packaging for, or otherwise use, this Survey Report.
Accessing or downloading the Survey Report files or opening the packaging, or
otherwise using, this Survey Report binds you to this Agreement.
This Agreement is entered into by and between SullivanCotter, Inc. ("SullivanCotter") and the purchaser or
participant of this Survey Report (the “Licensee”). In consideration of the mutual covenants in this Agreement,
SullivanCotter and the Licensee agree as follows:
Grant of License. This Survey Report contains the aggregation of compensation data and other data provided to
SullivanCotter by its survey participants, statistics, tables, reports, research, aggregations, calculations, data
analysis, formulas, summaries, content, text and other information and materials provided to the Licensee by
SullivanCotter through any other means, whether digital or hard copy, related thereto (the “Aggregated Data”).
SullivanCotter hereby grants the Licensee a nonexclusive, nontransferable, nonassignable (in connection with a
sale of assets, merger, change of control, reorganization or by operation of law), nonsublicensable, revocable,
limited license to use the Aggregated Data as expressly permitted by this Agreement. The Licensee has the right
to use the Aggregated Data and to reproduce excerpts of them in reports of memoranda created by the Licensee
in the regular course of its own internal business or in the regular course of providing consulting services to its
customers, so long as the Aggregated Data are properly cited as provided by SullivanCotter, Inc. “Regular course
of providing consulting services to its customers or in the regular course of its own internal business” exclusively
means (a) to copy and distribute internally to officers and employees of the Licensee in accordance with
SullivanCotter’s additional copy policy, (b) to prepare reports for internal business discussions and analysis and
(c) if the Licensee is a consultant or consulting firm, to use limited portions of the Aggregated Data in conjunction
with other data and information to provide custom analyses and reports for the Licensee's clients’ own internal
business purposes.
iii

LICENSE AGREEMENT
Limitations on Use. Notwithstanding anything to the contrary, Aggregated Data must not be resold or used, in
whole or in part, in stand-alone product, including externally available research, reports, models, tools, programs
and algorithms, whether such products are provided or used free or for a fee, and even if the Aggregated Data are
combined with other data sources. Except as expressly provided in this Agreement, or as expressly permitted in a
prior written consent from SullivanCotter or other agreement with SullivanCotter, the Licensee must not (a) copy or
distribute the Aggregated Data for any other use, including, without limitation, marketing or sales activities, website
posts, use by any third party or distribution of the Survey Report in part or in its entirety, (b) reproduce, store in a
retrieval system or transmit in any form or by any means, electronic, mechanical, photocopying, recording or
otherwise the Aggregated Data, (c) authorize any other parties, whether contractors, clients or agents who are not
direct employees of the Licensee to access the Aggregated Data or (d) permit, assist or encourage (directly or
indirectly) any unauthorized public or third-party access to or use of the Aggregated Data. The Licensee may not
use the name SullivanCotter, Inc. in any type of marketing or sales activities.
Rights in Data. The Aggregated Data are the proprietary information of SullivanCotter and are based on the
confidential information of SullivanCotter. The Aggregated Data are highly valuable to SullivanCotter and
SullivanCotter takes steps to protect its Aggregated Data. The Licensee agrees to treat the Aggregated Data
and all other proprietary information of SullivanCotter as confidential and take steps to protect the Aggregated
Data from unauthorized disclosure and use. The Licensee agrees that the Survey Report and the Aggregated
Data are protected by the U.S. Copyright Act and other intellectual property laws and international treaties. The
Licensee agrees not to challenge SullivanCotter’s rights or ownership in the Aggregated Data or to challenge the
proprietary nature of the Aggregated Data. This Agreement does not convey to the Licensee any proprietary
interest in or other ownership of the Aggregated Data or the underlying compensation data or other information.
The Licensee acknowledges that SullivanCotter owns the Aggregated Data, including all copyrights, patents, trade
secrets and other proprietary rights therein. There is no joint venture, partnership, agency or fiduciary relationship
existing between the parties and the parties do not intend to create any such relationship by this Agreement.
The Licensee does not have the authority to act for or to bind SullivanCotter in any respect whatsoever. The
Aggregated Data may not be used by any individual or company without first obtaining a license from
SullivanCotter.
Warranties Disclaimed and Limitation of Liability. THE AGGREGATED DATA ARE PROVIDED “AS IS.”
SULLIVANCOTTER DISCLAIMS ALL RESPONSIBILITY OF ANY KIND, ORAL OR WRITTEN, EXPRESS OR
IMPLIED, INCLUDING, BUT NOT LIMITED TO, FITNESS FOR A PARTICULAR PURPOSE, AVAILABILITY,
ACCURACY, OMISSIONS, COMPLETENESS OR CORRECTNESS OF INFORMATION OR
NON-INFRINGEMENT, INTEGRATION, SECURITY OR ANY OTHER WARRANTY IN CONNECTION WITH
ANYTHING DONE OR SUPPLIED BY SULLIVANCOTTER PURSUANT TO THIS AGREEMENT.
SULLIVANCOTTER SHALL IN NO EVENT WHATSOEVER BE LIABLE TO THE LICENSEE OR ANY OTHER
PARTY FOR ANY INDIRECT, SPECIAL, CONSEQUENTIAL, INCIDENTAL OR SIMILAR DAMAGES,
INCLUDING DAMAGES FOR LOST DATA OR ECONOMIC LOSS EVEN IF SULLIVANCOTTER HAS BEEN
NOTIFIED OF THE POSSIBILITY OF SUCH LOSS. SOME JURISDICTIONS DO NOT ALLOW THE EXCLUSION
OR LIMITATION OF IMPLIED WARRANTIES OR LIABILITY FOR INCIDENTAL OR CONSEQUENTIAL
DAMAGES, IN WHICH CASE THESE PROVISIONS MAY NOT BE FULLY APPLICABLE. THIS PARAGRAPH
SHALL SURVIVE THE TERMINATION OF THIS AGREEMENT. IN NO EVENT WILL THE LIABILITY OF
SULLIVANCOTTER EXCEED THE TOTAL AMOUNT PAID BY THE LICENSEE UNDER THIS AGREEMENT OR,
IF NONE, THEN THE AMOUNT OF ONE THOUSAND DOLLARS. IF THE LICENSEE IS DISSATISFIED WITH
THE AGGREGATED DATA OR ANYTHING ELSE DONE OR SUPPLIED BY SULLIVANCOTTER PURSUANT
TO THIS AGREEMENT, THE LICENSEE’S SOLE REMEDY IS TO TERMINATE THIS AGREEMENT. This
paragraph shall be enforceable to the maximum extent permitted by law.
iv

LICENSE AGREEMENT
Indemnification. The Licensee agrees to indemnify, hold harmless and defend SullivanCotter from and against any
action, cause, claim, damage, debt, demand or liability, including reasonable costs and attorneys' fees, asserted
by any person, arising out of or relating to (a) the Licensee's authorized or unauthorized use of the Aggregated
Data or (b) the Licensee's breach of this Agreement.
Term and Termination. The term of this Agreement is perpetual, subject to this section. SullivanCotter reserves
the right to terminate this Agreement upon written notice to the Licensee if the Licensee breaches any of the
terms of this Agreement. In addition, if SullivanCotter, in its sole judgment, believes that the Aggregated Data are
being used for a purpose not approved by SullivanCotter, SullivanCotter’s rights are being jeopardized, the
Licensee is using the Aggregated Data in any way that is adverse to SullivanCotter’s proprietary rights or to
directly compete with SullivanCotter or the Licensee is in default under this Agreement, SullivanCotter may
immediately terminate this Agreement. Upon termination of this Agreement, the Licensee shall return to
SullivanCotter, delete or destroy all copies of all confidential information, including, without limitation, all
documents and electronically stored information (ESI). “ESI” refers to any information that requires electrical
power to store or to retrieve, including, but not limited to, information stored in or obtainable from email servers,
active and archived email accounts, databases, network storage devices, network drives, file servers, legacy
systems, backup tapes, Internet applications, desktop or laptop computer hard drives, electronic data storage
media (e.g., CDs, DVDs and floppy disks), electronic data storage devices (e.g., USB flash drives, external hard
drives and memory cards) and electronic handheld devices (e.g., cell phones, personal digital assistants and
Blackberrys or similar devices). “Document” means printed or recorded matter or writings, including, without
limitation, correspondence, agreements, memoranda, notes, notebooks, diaries, interoffice or intraoffice
communications, minutes, telegrams, letters, photographs, drawings, sketches, drafts, ESI, emails, tapes or
recordings, computer disks, computer tapes, data stored on a computer, digital or electronic data in any form,
reports, charts, bulletins, circulars, advertisements, catalogs, publications, work assignments, work sheets and
instructions, in the possession, custody or control of the Licensee.
Remedies. The Licensee acknowledges and agrees that SullivanCotter will suffer irreparable harm if the Licensee
breaches the terms of this Agreement and that monetary damages would not be adequate remedy for any such
breach.
Order Form. SullivanCotter may require the Licensee to submit an order form or other written confirmation prior to
obtaining certain Aggregated Data, which may define the Aggregated Data licensed, further limit the purpose for
use of the Aggregated Data and specify payment terms.
Notices. Any notices permitted or required hereunder will be in writing, delivered to the parties at their addresses
set forth in the order form (or as otherwise notified in writing) by personal delivery, registered mail, express courier
service or email. Either party may update its contact information for the purposes of this section by providing
written notice to the other party of such changes.
Governing Law. This Agreement shall be governed by and construed in accordance with the laws of the state of
Illinois.
v

LICENSE AGREEMENT
Modification and Entire Agreement. SullivanCotter (and not the Licensee) shall have the right, at any time, to add
to or modify the terms of this Agreement. The Licensee's continued access to or use of the Aggregated Data
after the date of delivery of the notice or a click wrap agreement to such amended terms is deemed to constitute
acceptance of the amendment. If the Licensee disagrees with any new or modified terms of this Agreement, the
Licensee may elect to terminate this Agreement and its access to the Aggregated Data as its sole and exclusive
remedy. Any failure of one party to comply with any obligation hereunder may be expressly waived in writing by
the other party, but such waiver or failure to insist upon strict compliance with such obligation will not operate as
a waiver of, or estoppel with respect to, any subsequent failure. This Agreement and any order form(s) constitute
the entire understanding between the parties. If a court of competent jurisdiction determines that any restriction
in this Agreement is overbroad or unreasonable under the circumstances, such restriction shall be modified or
revised by such court to include the maximum reasonable restriction allowed by law. This Agreement supersedes
any and all prior agreements, understandings or other communications between the parties concerning the subject
matter of this Agreement. If any provision of this Agreement is declared to be invalid, such provision shall be
severed from this Agreement and the other provisions hereof shall be in full force and effect.
vi

TABLE OF CONTENTS

TABLE OF CONTENTS
Section
I Introduction ……………………………………………………………………………………………………… 2
II Characteristics of Survey Participants ……………………………………………………………………………………………………… 5
Organization Classification ……………………………………………………………………………………………………… 5
Size and Scope ……………………………………………………………………………………………………… 5
Regional Distribution ……………………………………………………………………………………………………… 5
III Base Salary and Total Cash Compensation ……………………………………………………………………………………………………… 7
IV Total Direct Compensation ……………………………………………………………………………………………………… 12
V Regressions ……………………………………………………………………………………………………… 17
Appendix
A Survey Participants ……………………………………………………………………………………………………… A-2
B Job List and Summaries ……………………………………………………………………………………………………… A-10
C Terms and Definitions ……………………………………………………………………………………………………… A-15
D Using Regression Equations ……………………………………………………………………………………………………… A-19
E About SullivanCotter ……………………………………………………………………………………………………… A-23
viii

SECTION I:
INTRODUCTION

INTRODUCTION
SullivanCotter, Inc. (SullivanCotter) is pleased to present the 2019 Medical
Group Executive Compensation Survey Report. Survey participants submitted
data from January 2019 to April 2019. Data were reported by 236 medical
groups across the United States. Compensation data reflect 1,355 incumbents.
The survey participants are listed in appendix A.
SullivanCotter ensures that all organization-specific data remain strictly confidential. While individual organization
names appear in the survey participant list, no correlation to an organization's data is provided.
The data are effective as of January 1, 2019.
This report is organized into five sections:
Section I presents general information regarding this survey report.
Section II presents general survey participant characteristics.
Section III presents national base salary and total cash compensation (TCC) for all medical group executive
positions by physician full-time equivalents (FTEs).
Section IV presents national total direct compensation (TDC) for all medical group executive positions by
physician FTEs.
Section V presents regression equations and trend line graphs for all medical group executive positions by
physician FTEs.
The supplemental Excel file Medical Group Executive Compensation Survey Report Data Table Results
(included as part of the survey report) is available via online download from the SullivanCotter Client Portal. For
more information on how to access the file, contact the Center for Information, Analytics and Insights by email at
The following guidelines are used in this report:
● Data that are insufficient to include in the report are noted in tables as isd. Conditions for insufficient data
include the following:
– When fewer than five organizations provided data.
– When one organization represented more than 25% of the sample.
– In section V, trend line graphs are reported for medical group executive positions. For some of these
positions, the data collected were insufficient to perform this type of statistical analysis due to a small
number of responses or a poor correlation between compensation levels and providers.
● Participant counts (n) listed are based on the number of organizations that responded to each corresponding
question unless otherwise noted.
P 2 SECTION I
Medical Group Executive Compensation Survey Report
© 2019 SullivanCotter, Inc. All rights reserved.

INTRODUCTION
There are five regional designations included in this report: North Central, Northeast, South Central, Southeast
and West.
TABLE 1.1 – Regional Designations Included in This Report
South Central Arkansas, Colorado, Kansas, Louisiana, Missouri, New Mexico,
Oklahoma and Texas
Southeast Alabama, Florida, Georgia, Kentucky, Mississippi, North Carolina,
South Carolina, Tennessee, Virginia and West Virginia
West Alaska, Arizona, California, Hawaii, Nevada, Oregon, Utah and
Washington
Northeast
Connecticut, Delaware, District of Columbia, Maine, Maryland,
Massachusetts, New Hampshire, New Jersey, New York,
Pennsylvania, Rhode Island and Vermont
Regional Designations Included in This Report
Region States Included
North Central
Idaho, Illinois, Indiana, Iowa, Michigan, Minnesota, Montana,
Nebraska, North Dakota, Ohio, South Dakota, Wisconsin and
Wyoming
P 3 SECTION I
Medical Group Executive Compensation Survey Report
© 2019 SullivanCotter, Inc. All rights reserved.

SECTION II:
CHARACTERISTICS
OF SURVEY
PARTICIPANTS

CHARACTERISTICS OF SURVEY PARTICIPANTS
ORGANIZATION CLASSIFICATION
TABLE 2.1 – Medical Group Type
SIZE AND SCOPE
TABLE 2.2 – Medical Group Physician FTEs
TABLE 2.3 – Medical Group Net Revenue
REGIONAL DISTRIBUTION
TABLE 2.4 – Medical Group Distribution
Northeast
n = 236
Southeast
South Central
West
All Medical Groups
Region Percentage
North Central
Medical Group Distribution
Less Than 200 Providers 65
200 to 600 Providers 75
Greater Than 600 Providers 46
(1)Net revenue is displayed in millions.
188
200 to 600 Physician FTEs 86
Greater Than 600 Physician FTEs 63
Medical Group Net Revenue(1)
Category n Mean Median
All Medical Groups 234
Less Than 200 Physician FTEs 85
n = 236
Medical Group Physician FTEs
Category n Mean Median
Independent or Affiliated 4%
Medical Group Type
Type Percentage
Owned 96%
P 5 SECTION II
Medical Group Executive Compensation Survey Report
© 2019 SullivanCotter, Inc. All rights reserved.
SECTION III:
BASE SALARY AND
TOTAL CASH
COMPENSATION

BASE SALARY AND TOTAL CASH COMPENSATION
TABLE 3.1 – All Medical Groups
25th %ile Mean Median 75th %ile Eligible Receiving Mean Median 25th %ile Mean Median 75th %ile
7220 Medical Group Chief Executive Officer/Executive Director (MD), All 94 104
7220Medical Group Chief Executive Officer/Executive Director (MD),
Independent or Affiliated3 3 isd isd isd isd isd isd isd isd isd isd isd isd
7220 Medical Group Chief Executive Officer/Executive Director (MD), Owned 91 101
7221 Medical Group Chief Executive Officer/Executive Director (Non-MD), All 63 65
7221Medical Group Chief Executive Officer/Executive Director (Non-MD),
Independent or Affiliated4 4 isd isd isd isd isd isd isd isd isd isd isd isd
7221Medical Group Chief Executive Officer/Executive Director (Non-MD),
Owned59 61
7222 Medical Group Chief Operating Officer, All 99 107
7222 Medical Group Chief Operating Officer, Independent or Affiliated 3 3 isd isd isd isd isd isd isd isd isd isd isd isd
7222 Medical Group Chief Operating Officer, Owned 96 104
7223 Medical Group Chief Financial Officer, All 75 76
7223 Medical Group Chief Financial Officer, Independent or Affiliated 6 6 isd isd
7223 Medical Group Chief Financial Officer, Owned 69 70
7224 Medical Group Chief Medical Officer, All 62 82
7224 Medical Group Chief Medical Officer, Independent or Affiliated 7 8
7224 Medical Group Chief Medical Officer, Owned 55 74
7225 Medical Group Chief Administrative Officer 12 12
7226 Medical Group Top Quality Position 22 23
7227 Medical Group Chief Nursing Officer/Top Patient Care Executive 12 12
7228 Medical Group Population Health Executive 10 10
7268 Medical Group Top Operations Executive 40 77
7269 Medical Group Top Information Services Position 14 16
7274 Medical Group Top Human Resources Position 25 29
7279 Medical Group Top Facilities Position 8 8 isd isd
7406 Medical Group Controller 39 45
7558 Medical Group Head of Operations 46 182
7900 Practice Administrator 33 507
All Medical Groups
Code Jobn
Orgs
n
Incumbents
Base SalarySTI
TCCPercentage Amount Paid
Medical Group Executive Compensation Survey Report
© 2019 SullivanCotter, Inc. All rights reserved. P 7 SECTION III

SECTION IV:
TOTAL DIRECT
COMPENSATION

TOTAL DIRECT COMPENSATION
TABLE 4.1 – All Medical Groups
25th %ile Mean Median 75th %ile Eligible Receiving Mean Median 25th %ile Mean Median 75th %ile
7220 Medical Group Chief Executive Officer/Executive Director (MD), All 94 104
7220Medical Group Chief Executive Officer/Executive Director (MD),
Independent or Affiliated3 3 isd isd isd isd isd isd isd isd isd isd isd isd
7220 Medical Group Chief Executive Officer/Executive Director (MD), Owned 91 101
7221 Medical Group Chief Executive Officer/Executive Director (Non-MD), All 63 65
7221Medical Group Chief Executive Officer/Executive Director (Non-MD),
Independent or Affiliated4 4 isd isd isd isd isd isd isd isd isd isd isd isd
7221Medical Group Chief Executive Officer/Executive Director (Non-MD),
Owned59 61
7222 Medical Group Chief Operating Officer, All 99 107
7222 Medical Group Chief Operating Officer, Independent or Affiliated 3 3 isd isd isd isd isd isd isd isd isd isd isd isd
7222 Medical Group Chief Operating Officer, Owned 96 104
7223 Medical Group Chief Financial Officer, All 75 76 isd isd
7223 Medical Group Chief Financial Officer, Independent or Affiliated 6 6 isd isd
7223 Medical Group Chief Financial Officer, Owned 69 70 isd isd
7224 Medical Group Chief Medical Officer, All 62 82
7224 Medical Group Chief Medical Officer, Independent or Affiliated 7 8 isd isd
7224 Medical Group Chief Medical Officer, Owned 55 74
7225 Medical Group Chief Administrative Officer 12 12 isd isd
7226 Medical Group Top Quality Position 22 23 isd isd
7227 Medical Group Chief Nursing Officer/Top Patient Care Executive 12 12 isd isd
7228 Medical Group Population Health Executive 10 10 isd isd
7268 Medical Group Top Operations Executive 40 77 isd isd
7269 Medical Group Top Information Services Position 14 16 isd isd
7274 Medical Group Top Human Resources Position 25 29 isd isd
7279 Medical Group Top Facilities Position 8 8 isd isd
7406 Medical Group Controller 39 45 isd isd
7558 Medical Group Head of Operations 46 182 isd isd
7900 Practice Administrator 33 507 isd isd
All Medical Groups
Code Jobn
Orgs
n
Incumbents
TCCCash-Based LTI
TDCPercentage Amount Paid
Medical Group Executive Compensation Survey Report
© 2019 SullivanCotter, Inc. All rights reserved. P 12 SECTION IV

SECTION V:
REGRESSIONS

REGRESSIONS
Size Measure n Orgs n Incumbents Slope Intercept r SEE
Log (Physician FTEs) 89 99
Log (Physician FTEs) 89 99
7220
Log (Base Salary)
Log (TCC)
(1)Annual compensation, base salary and TCC are displayed in thousands.
Compensation
Physician
FTEs
Base
Salary(1) TCC
(1)
7220MEDICAL GROUP CHIEF EXECUTIVE OFFICER/EXECUTIVE
DIRECTOR (MD), ALL
$0
$100
$200
$300
$400
$500
$600
$700
$800
10 100 1,000
An
nu
al
Co
mp
en
sati
on
(1)
Physician FTEs
Base TCC
Medical Group Executive Compensation Survey Report
© 2019 SullivanCotter, Inc. All rights reserved. P 17 SECTION V
APPENDIX A:
SURVEY
PARTICIPANTS

SURVEY PARTICIPANTS
ORGANIZATION CITY STATE
Advocate Medical Group Oak Brook IL
Allegheny Clinic Pittsburgh PA
AMITA Health Medical Group Bolingbrook IL
Anne Arundel Medical Group Annapolis MD
Aria Health Physician Services Philadelphia PA
Ascension Health Medical Group St. Louis MO
Ascension Health Medical Group Gulf Coast Ministry Market Pensacola FL
Ascension Health Medical Group Indiana Ministry Market Indianapolis IN
Ascension Health Medical Group Jacksonville Ministry Market Jacksonville FL
Ascension Health Medical Group Kansas Ministry Market Wichita KS
Ascension Health Medical Group Mid-Michigan Ministry Market Saginaw MI
Ascension Health Medical Group Tennessee Ministry Market Nashville TN
Ascension Health Medical Group Texas Ministry Market Austin TX
Ascension Health Medical Group Tulsa Ministry Market Tulsa OK
Ascension Health Medical Group Wisconsin Ministry Market Milwaukee WI
Ascension Medical Group Southeast Michigan Warren MI
Atlantic Medical Group Morristown NJ
Atrium Health Medical Group Charlotte NC
Atrius Health Newton MA
Aultman Medical Group Canton OH
Austin Regional Clinic Austin TX
Baptist Health Medical Group Louisville KY
BayCare Clinic Green Bay WI
BayCare Medical Group Clearwater FL
Baylor St. Luke's Medical Group Houston TX
Beacon Medical Group South Bend IN
Beaumont Medical Group Troy MI
Benefis Medical Group Great Falls MT
Blanchard Valley Medical Practices Findlay OH
Blessing Physician Services Quincy IL
Boston University Medical Group Boston MA
Brigham and Women's Physician Group Chestnut Hill MA
Bronson Medical Group Battle Creek MI
Bryan Physician Network Lincoln NE
Butler Medical Providers Butler PA
Note: This list does not include one organization that wished to remain anonymous.
P A-2 APPENDIX A
Medical Group Executive Compensation Survey Report
© 2019 SullivanCotter, Inc. All rights reserved.

SURVEY PARTICIPANTS
ORGANIZATION CITY STATE
Capital Health Medical Group Trenton NJ
Care New England Medical Group Providence RI
CaroMont Medical Group Gastonia NC
Carson Tahoe Medical Group Carson City NV
Catawba Valley Medical Group Hickory NC
Cedars-Sinai Medical Network Beverly Hills CA
CentraCare Clinic St. Cloud MN
Centra Medical Group Lynchburg VA
Centura Health Physician Group Englewood CO
ChenMed Miami Gardens FL
ChenMed – Georgia Miami FL
ChenMed – Illinois Miami FL
ChenMed – Louisiana Miami FL
ChenMed – South Florida Miami FL
ChenMed – Virginia Miami FL
CHI Health – Alegent Creighton Clinic Omaha NE
Children's Health Care Associates Philadelphia PA
Children's Medical Group Milwaukee WI
Children's National Health System Medical Group Washington DC
Children's Specialty Group Milwaukee WI
CHI St. Vincent Medical Group Little Rock AR
Christiana Care Quality Partners Willmington DE
CHRISTUS Physician Group Irving TX
CHRISTUS St. Vincent Medical Group Santa Fe NM
CHRISTUS Trinity Clinic Tyler TX
C. L. Brumback Primary Care Clinics Palm Springs FL
Colquitt Regional Medical Center Physicians Moultrie GA
Columbus Regional Health Physicians Columbus IN
Combined Medical Group New Brunswick NJ
Cone Health Medical Group Greensboro NC
Covenant Medical Group Lubbock TX
Dartmouth-Hitchcock Clinic Lebanon NH
Deaconess Clinic Evansville IN
Facey Medical Group Mission Hills CA
Fairview Physician Associates Network Edina MN
Note: This list does not include one organization that wished to remain anonymous.
P A-3 APPENDIX A
Medical Group Executive Compensation Survey Report
© 2019 SullivanCotter, Inc. All rights reserved.

SURVEY PARTICIPANTS
ORGANIZATION CITY STATE
FirstHealth Physician Group Pinehurst NC
First Physicians Group Sarasota FL
Foundation Medical Partners Nashua NH
Franciscan Medical Group Tacoma WA
Franklin Community Health Network Farmington ME
GBMC Health Partners Baltimore MD
Geisinger Clinic Danville PA
Genesis Medical Group Zanesville OH
Graham Medical Group Canton IL
Guthrie Medical Group Sayre PA
Hackensack Meridian Health Medical Group Edison NJ
Hartford Healthcare Medical Group Hartford CT
HealthChoice Memphis TN
Health Leaders Network Baton Rouge LA
HealthPartners Medical Group Bloomington MN
HealthTexas Provider Network Dallas TX
Heart Clinic Arkansas Little Rock AR
Henry Ford Allegiance Medical Group Jackson MI
Henry Ford Medical Group Detroit MI
Horizon Healthcare Fairfield IL
Houston Methodist Specialty Physician Group Houston TX
HSHS Medical Group Springfield IL
HSS Medical Group New York NY
Inova Medical Group Falls Church VA
Inspira Medical Group Bridgeton NJ
Intermountain Medical Group Salt Lake City UT
IU Health Physicians Indianapolis IN
Jefferson University Physicians Philadelphia PA
John Muir Physician Network Walnut Creek CA
Johns Hopkins Community Physicians Baltimore MD
KentuckyOne Medical Group Louisville KY
Lancaster General Medical Group Lancaster PA
Lehigh Valley Physician Group Allentown PA
Lexington Medical Center Physician Network West Columbia SC
Lifespan Physicians Group Providence RI
Note: This list does not include one organization that wished to remain anonymous.
P A-4 APPENDIX A
Medical Group Executive Compensation Survey Report
© 2019 SullivanCotter, Inc. All rights reserved.
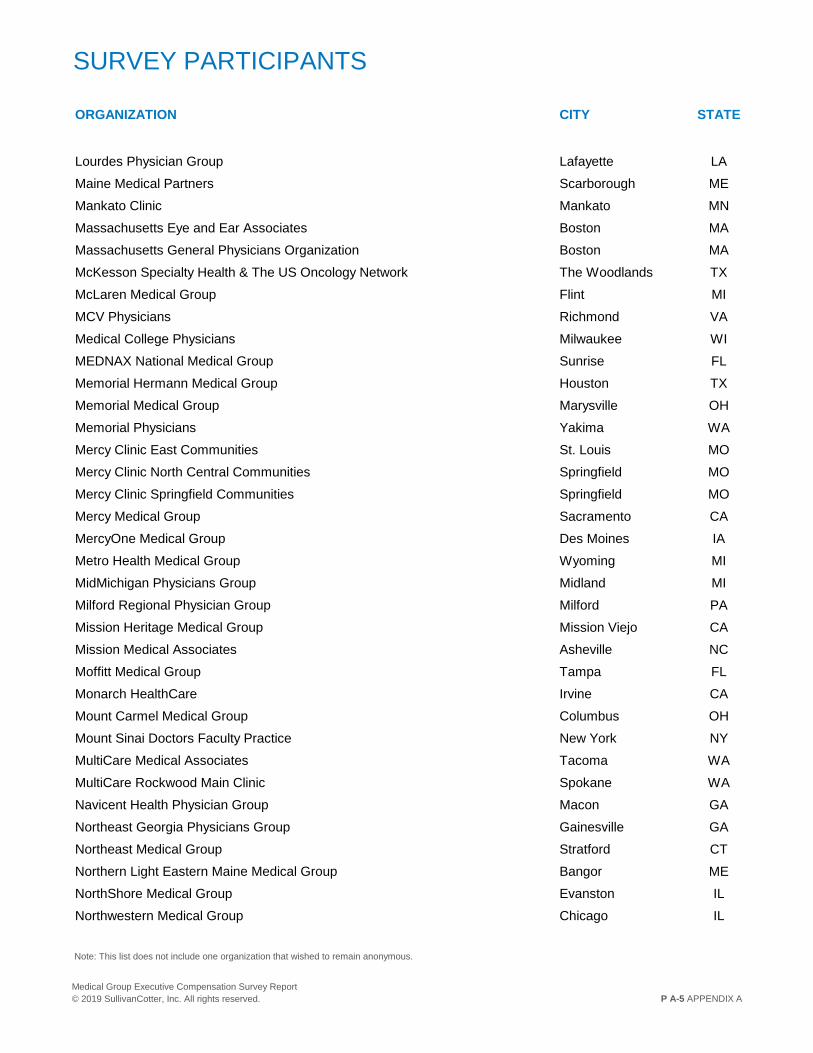
SURVEY PARTICIPANTS
ORGANIZATION CITY STATE
Lourdes Physician Group Lafayette LA
Maine Medical Partners Scarborough ME
Mankato Clinic Mankato MN
Massachusetts Eye and Ear Associates Boston MA
Massachusetts General Physicians Organization Boston MA
McKesson Specialty Health & The US Oncology Network The Woodlands TX
McLaren Medical Group Flint MI
MCV Physicians Richmond VA
Medical College Physicians Milwaukee WI
MEDNAX National Medical Group Sunrise FL
Memorial Hermann Medical Group Houston TX
Memorial Medical Group Marysville OH
Memorial Physicians Yakima WA
Mercy Clinic East Communities St. Louis MO
Mercy Clinic North Central Communities Springfield MO
Mercy Clinic Springfield Communities Springfield MO
Mercy Medical Group Sacramento CA
MercyOne Medical Group Des Moines IA
Metro Health Medical Group Wyoming MI
MidMichigan Physicians Group Midland MI
Milford Regional Physician Group Milford PA
Mission Heritage Medical Group Mission Viejo CA
Mission Medical Associates Asheville NC
Moffitt Medical Group Tampa FL
Monarch HealthCare Irvine CA
Mount Carmel Medical Group Columbus OH
Mount Sinai Doctors Faculty Practice New York NY
MultiCare Medical Associates Tacoma WA
MultiCare Rockwood Main Clinic Spokane WA
Navicent Health Physician Group Macon GA
Northeast Georgia Physicians Group Gainesville GA
Northeast Medical Group Stratford CT
Northern Light Eastern Maine Medical Group Bangor ME
NorthShore Medical Group Evanston IL
Northwestern Medical Group Chicago IL
Note: This list does not include one organization that wished to remain anonymous.
P A-5 APPENDIX A
Medical Group Executive Compensation Survey Report
© 2019 SullivanCotter, Inc. All rights reserved.

SURVEY PARTICIPANTS
ORGANIZATION CITY STATE
Novant Health Medical Group Winston-Salem NC
NYU Langone Faculty Group Practice New York NY
OhioHealth Physician Group Columbus OH
One Medical San Francisco CA
OptumCare Arvada CO
OptumHealth Eden Prairie MN
Orlando Health Physician Group Orlando FL
OSF Medical Group Peoria IL
Our Lady of the Lake Physician Group Baton Rouge LA
Pacific Medical Centers Seattle WA
Palo Alto Medical Foundation Mountain View CA
Pediatric Physicians' Organization at Children's Brookline MA
Pediatric Specialists of America Miami FL
Peninsula Regional Medical Group Salisbury MD
Penn State Medical Group Hershey PA
Phoebe Physician Group Albany GA
Phoenix Children's Medical Group Phoenix AZ
PinnacleHealth Medical Group Lemoyne PA
Platte Valley Medical Group Brighton CO
Premier Physician Network Dayton OH
Presbyterian Medical Group Albuquerque NM
ProHealth Physicians Farmington CT
ProMedica Physician Group Sylvania OH
ProMedica Physicians & Continuum Services Sylvania OH
Providence Medical Group Beaverton OR
Providence Medical Group – Washington Walla Walla WA
Pulse Heart Institute Tacoma WA
Reliant Medical Group Worcester MA
Renown Medical Group Reno NV
Rochester General Medical Group Rochester NY
Rush University Medical Group Chicago IL
Saint Luke's Primary Care-Barry Road Kansas City MO
Sanford Clinic Sioux Falls SD
SCL Health Medical Group – Montana Billings MT
SCL Physicians – Denver Denver CO
Note: This list does not include one organization that wished to remain anonymous.
P A-6 APPENDIX A
Medical Group Executive Compensation Survey Report
© 2019 SullivanCotter, Inc. All rights reserved.

SURVEY PARTICIPANTS
ORGANIZATION CITY STATE
Scott & White Clinic – Temple Temple TX
Sentara RMH Medical Group Harrisonburg VA
Sharon Hospital Medical Practice Sharon CT
Sharp Community Medical Group San Diego CA
Sharp Rees-Stealy San Diego CA
Shore Physicians Group Somers Point NJ
SIH Medical Group Carbondale IL
Southcoast Physicians Group Fairhaven MA
Southwest Medical Associates Las Vegas NV
Spectrum Health Medical Group Grand Rapids MI
Spirit Physician Services Camp Hill PA
Springfield Clinic Springfield IL
SSM Health Dean Medical Group Madison WI
SSM Health Medical Group – St. Louis St. Louis MO
St. Charles Medical Group Bend OR
St. Elizabeth Physicians Crestview Hills KY
Steward Health Care Network Brighton MA
Steward Medical Group Boston MA
St. Francis Medical Group Monroe LA
St. James Medical Group Butte MT
St. Joseph Heritage Healthcare Anaheim CA
St. Mary's Medical Group Grand Junction CO
St. Vincent Physicians Billings MT
Summa Health Medical Group Akron OH
Sutter Pacific Medical Foundation San Francisco CA
Swedish Medical Group Seattle WA
Tanner Medical Group Carrollton GA
Texas Children's Pediatrics Houston TX
The Chattanooga Heart Institute at Memorial Chattanooga TN
The Emory Clinic Atlanta GA
The Gould Medical Group Modesto CA
The Physician Network Lincoln NE
The Polyclinic Seattle WA
THIPA Torrance CA
TMHPP Tallahassee FL
Note: This list does not include one organization that wished to remain anonymous.
P A-7 APPENDIX A
Medical Group Executive Compensation Survey Report
© 2019 SullivanCotter, Inc. All rights reserved.

SURVEY PARTICIPANTS
ORGANIZATION CITY STATE
TriHealth Primary Care Cincinnati OH
Tufts Medical Center Community Care Medford MA
UCHealth Medical Group Loveland CO
UC San Diego Health Physician Network San Diego CA
UHS Medical Group Johnson City NY
UMass Memorial Medical Group Worcester MA
U-M Medical Group Ann Arbor MI
UnityPoint Clinic Johnston IA
University Health Associates Morgantown WV
University Hospitals Medical Group Shaker Heights OH
University of Chicago Medicine Care Network Chicago IL
University of Maryland Community Medical Group Linthicum MD
University of Minnesota Physicians Minneapolis MN
UNM Medical Group Albuquerque NM
UT Methodist Physicians Cordova TN
UT Regional One Physicians Memphis TN
Valley Children's Medical Group Madera CA
Valley Physician Enterprise Winchester VA
Vidant Medical Group Greenville NC
Virtua Medical Group Marlton NJ
WakeMed Physician Practices Raleigh NC
WellMed Medical Group San Antonio TX
WellSpan Medical Group York PA
WellStar Medical Group Marietta GA
Willis-Knighton Physician Network Shreveport LA
Note: This list does not include one organization that wished to remain anonymous.
P A-8 APPENDIX A
Medical Group Executive Compensation Survey Report
© 2019 SullivanCotter, Inc. All rights reserved.

APPENDIX B:
JOB LIST AND
SUMMARIES

JOB LIST AND SUMMARIES
MEDICAL GROUP EXECUTIVE
7220 Medical Group Chief Executive Officer/Executive Director (MD)
7221 Medical Group Chief Executive Officer/Executive Director (Non-MD)
7222 Medical Group Chief Operating Officer
7223 Medical Group Chief Financial Officer
7224 Medical Group Chief Medical Officer
7225 Medical Group Chief Administrative Officer
7226 Medical Group Top Quality Position
7227 Medical Group Chief Nursing Officer/Top Patient Care Executive
7228 Medical Group Population Health Executive
7268 Medical Group Top Operations Executive
7269 Medical Group Top Information Services Position
7274 Medical Group Top Human Resources Position
7279 Medical Group Top Facilities Position
7406 Medical Group Controller
7558 Medical Group Head of Operations
7900 Practice Administrator
P A-10 APPENDIX B
Medical Group Executive Compensation Survey Report
© 2019 SullivanCotter, Inc. All rights reserved.

APPENDIX C:
TERMS AND
DEFINITIONS

APPENDIX D:
USING REGRESSION
EQUATIONS

USING REGRESSION EQUATIONS
The regression equations in this report estimate base salary and TCC based on
organization size as measured by number of physician FTEs.
COMPENSATION LEVELS
To estimate compensation levels using the regression equations (Example C.1 below is based on 300 physician
FTEs, a slope of 0.2938 and an intercept of 1.1289), the following steps should be used:
● Step One. Obtain your organization's number of physician FTEs (300 in Example C.1) for the size measure
shown in the x-axis of the graph for the most recently completed fiscal year.
● Step Two. Take the logarithm of your organization's size measure value. All logarithmic values are base 10
logarithms.(1)
● Step Three. Multiply the logarithm of the value (2.4771 in Example C.1) by the slope (0.2938 in Example C.1).
The value of which is 0.7277 in Example C.1.
● Step Four. Add the intercept from the regression equation (1.1289 in Example C.1) to the answer to step
three. The sum of which is 1.8567 in Example C.1. There are always two regression equations: one for
base salary and another for TCC.
● Step Five. Take the antilogarithm of the answer to step four (1.8567 in Example C.1). The value of which is
71.8952 in Example C.1.(2)
● Step Six. Multiply the answer to step five (71.8952 in Example C.1) by 1,000. This is the estimated market
median base salary or TCC level for executives in comparably sized organizations ($71,900 in Example C.1).
EXAMPLE C.1 – Compensation Levels
Log(300) = 2.4771 Step Two
2.4771 x 0.2938 = 0.7277 Step Three
0.7277 + 1.1289 = 1.8567 Step Four
Antilog(1.8567) = 71.8952 Step Five
71.8952 x 1,000 = $71,900 Step Six
(1)For spreadsheet users, in step two, the logarithmic value may be calculated to produce the base 10 logarithm of the net revenue (e.g., LOG10(300) = 0.7277).
(2)For spreadsheet users, in step five, the antilogarithm of a value may be calculated by raising 10 to the value obtained in step four (e.g., 10 [̂1.8567] = 71.8952).
P A-19 APPENDIX D
Medical Group Executive Compensation Survey Report
© 2019 SullivanCotter, Inc. All rights reserved.

USING REGRESSION EQUATIONS
COMPENSATION LEVELS continued
The regression equations can be interpreted by referencing values of the correlation coefficient r, which measures
the strength of the linear relationship between compensation levels and the organization size measure and the
standard error of the estimate (SEE), which measures the dispersion in compensation levels around the
regression line and may be used to estimate a range of compensation levels, reported in the regression graphs
and tables. R squared is the percentage of the variance in the distribution of base salary and TCC that is
“explained” by the organization size measure (e.g., an r of 0.75 yields an r squared of 0.56). This means that just
over one-half of the variance in the compensation levels may be explained by the size measure.
25TH AND 75TH PERCENTILES
To estimate the 25th and 75th percentiles using the regression equations (Example C.2 on the following page is
based on 300 physician FTEs, a SEE of 0.061 and the value obtained in step four from Example C.1 [1.8567]),
the following steps should be used:
● Step One. Multiply the SEE (0.061 in Example C.2) by 0.675. The value of which is 0.0412 in Example C.2.
● Step Two. Subtract 0.0412 from 1.8567 (the value obtained in step four in Example C.1). The value of which
is 1.8155 in Example C.2.
● Step Three. Take the antilogarithm of the answer to step two (1.8155 in Example C.2). The value of which is
65.3883 in Example C.2.
● Step Four. Multiply the answer to step three (65.3883 in Example C.2) by 1,000. This is the estimated 25th
percentile value based on the organization's size measure of 300 physician FTEs ($65,388 in Example C.2).
● Step Five. Add 0.0412 to 1.8567 (the value obtained in step four in Example C.1). The value of which is
1.8979 in Example C.2.
● Step Six. Take the antilogarithm of the answer to step five (1.8979 in Example C.2). The value of which is
79.0497 in Example C.2.
● Step Seven. Multiply the answer to step six (79.0497 in Example C.2) by 1,000. This is the estimated 75th
percentile value based on the organization's size measure of 300 physician FTEs ($79,049 in Example C.2).
P A-20 APPENDIX D
Medical Group Executive Compensation Survey Report
© 2019 SullivanCotter, Inc. All rights reserved.

USING REGRESSION EQUATIONS
25TH AND 75TH PERCENTILES continued
EXAMPLE C.2 – 25th and 75th Percentiles
0.061 x 0.675 = 0.0412 Step One
1.8567 - 0.0412 = 1.8155 Step Two
Antilog(1.8155) = 65.3883 Step Three
65.3883 x 1,000 = $65,388 Step Four
1.8567 + 0.0412 = 1.8979 Step Five
Antilog(1.8979) = 79.0497 Step Six
79.0497 x 1,000 = $79,049 Step Seven
P A-21 APPENDIX D
Medical Group Executive Compensation Survey Report
© 2019 SullivanCotter, Inc. All rights reserved.

APPENDIX E:
ABOUT
SULLIVANCOTTER

ABOUT SULLIVANCOTTER
SullivanCotter partners with health care and other not-for-profit organizations to
drive performance and improve outcomes through the development and
implementation of integrated workforce strategies. Using our time-tested
methodologies and industry-leading research and information, we provide
data-driven insights and expertise to help organizations align business strategy
and performance objectives – enabling our clients to deliver on their mission,
vision and values.
For more information, visit www.sullivancotter.com or call 888.739.7039.
SullivanCotter has offices in Atlanta, Boston, Chicago, Denver, Detroit,
Eau Claire, Minneapolis, New York, Parsippany, Philadelphia, Pittsburgh and
San Francisco.
P A-23 APPENDIX E
Medical Group Executive Compensation Survey Report
© 2019 SullivanCotter, Inc. All rights reserved.