2019 higher education research digest - act.org · 4 | 2019 higher education research digest....
TRANSCRIPT

2019 Higher Education Research Digest | 3
2019 Higher EducationRESEARCH DIGEST
2 Reworking Remediation: Streamlining Student Pathways to College-Level Coursework
6 Demography is Not Destiny: Introducing the Prospective Student Mindset
9 From Application to Enrollment: Putting the Student Mindset to Work at Your Institution
12 Why do Females Perform Better in College than Test Scores and Grades Predict? The Importance of Social and Emotional Learning Skills
15 Looking Beyond the Domestic Applicant Pool: The Value of ACT Scores for Identifying International Students who are Prepared to Succeed in College
18 Rating (Not Ranking) Student Success
22 Explore ACT Data to Help Inform Recruitment, Enrollment, and Success Strategies: Three Publicly Available ACT Databases

| 2019 Higher Education Research Digest2
REWORKING REMEDIATION:STREAMLINING STUDENT PATHWAYS TO COLLEGE-LEVEL COURSEWORKTy Cruce, Principal Research ScientistKrista Mattern, Senior Director of Validity and Efficacy Research
Many students graduate from high school lacking the foundational knowledge needed for college-level coursework. The majority of students from the ACT-tested high school graduating class of 2018 did not meet the ACT® College Readiness Benchmarks in reading, mathematics, and science.1 The results were slightly more promising for English where 60% met the ACT College Readiness Benchmark. The ACT College Readiness Benchmarks are important indicators of early college success, as they represent the level of academic achievement required for students to have a 50% chance of obtaining a B or higher in a corresponding credit-bearing first-year college course.
A lack of readiness for college-level coursework results in a large number of students entering college who require remediation in English and mathematics prior to (or in conjunction with) their college-level coursework. Although remedial courses can be offered for college credit, those credits rarely count toward a student’s graduation requirements. This means that students in need of remediation potentially take more time to earn a college degree, increasing both their direct cost to attend college and their foregone earnings. Not only are there additional costs to students and their families when taking remedial coursework in college, research evaluating the efficacy of formal remediation on subsequent college success has been mixed at best.
results of two case studies of the effectiveness of using EdReady—now offered through ACT as CollegeReady™—as a system for delivering remediation prior to college to improve students’ course performance and early academic success. In both of these case studies, we find that students who elected to skill-up with EdReady to the point where they avoided formal remedial coursework performed comparably (and sometimes better than) their peers in their first credit-bearing courses in English and mathematics.
In response, there has been a growing call for colleges to redesign how they deliver initial and ongoing academic support to students who require remediation. In this article, we share the
CollegeReady is a low-stakes college readiness system that assesses students’ knowledge in English and mathematics and then provides a personalized learning path to help the students fill in the gaps in their knowledge and skills at their own pace. When the students reach a milestone score set by the college, they may advance to college-level coursework without the need for formal remedial coursework. CollegeReady may be administered in addition to or in lieu of formal placement testing; it can also be used as an outreach tool between colleges and targeted school districts to help support college readiness initiatives at the high school level.
1 ACT (2018). The condition of college and career readiness. Iowa City, IA: ACT

2019 Higher Education Research Digest | 3
Figure 1.Suggested Math Placement at JSU by EdReady Mathematics Score
Case Study 1: Jacksonville State UniversityIn partnership with Jacksonville State University (JSU), ACT researchers examined the relationship between incoming students’ readiness for college-level mathematics (as measured by their EdReady mathematics score) and their course outcomes. In the fall of 2015, JSU offered just under 1,200 incoming students the opportunity to use EdReady during the summer prior to the start of their first semester with the purpose of helping students to prepare for their first math course. For placement purposes, JSU set two target scores within EdReady: (a) a lower target score for placement into lower-level credit-bearing math courses as opposed todevelopmental math, and (b) a higher target scorefor placement into higher-level as opposed to lower-level credit-bearing math courses.
target score placing them in developmental math, and almost half (48%) of the students were scoring at a level that would place them into an upper-level math course (refer to the orange bars in Figure 1).
Of the students who were offered the opportunity to use EdReady, 753 (63%) took the initial diagnostic. Of this group, 20% initially scored below the lower target score which placed them in the recommended category of developmental math; 68% placed in a lower-level math course; and 12% placed in an upper-level math course (refer to the blue bars in Figure 1). As students progressed through their individualized learning path, their scores improved. By the time of the students’ most recent score, only 13% were still scoring below the
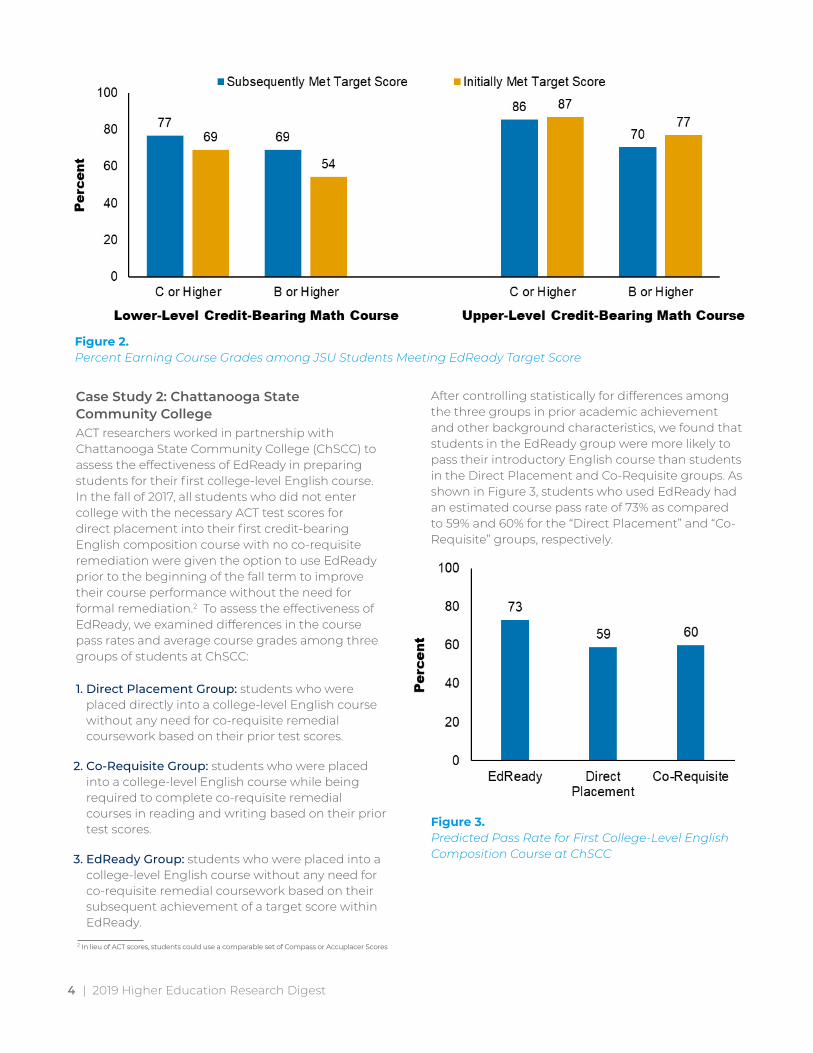
In addition to having an increased opportunity to enter into credit-bearing coursework without the need for formal remediation, students who used the personalized study path within EdReady also performed on par with or better than their peers who were placed based on their initial EdReady scores. The left side of Figure 2 shows the percentage of students earning particular letter grades in their first lower-level credit-bearing mathematics course at JSU. Compared to students who initially met or exceeded the target score for lower-level mathematics, those students who skilled-up through their individual learning path had higher chances of earning a course grade of C or higher (77% vs 69%) or a B or higher (69% vs 54%). The right side of Figure 2 shows these same outcomes for students entering their first upper-level credit-bearing mathematics course at JSU. Compared to students who initially scored at or above the target score for upper-level mathematics, students who skilled up using EdReady had similar chances of earning a C or higher (86% vs 87%) and somewhat lower chances of earning a B or higher (70% vs 77%). For more information, the full report is available at https://www.act.org/content/dam/act/unsecured/documents/R1689-jsu-edready-case-study-2018-01.pdf.
4 | 2019 Higher Education Research Digest
Figure 2.Percent Earning Course Grades among JSU Students Meeting EdReady Target Score
Case Study 2: Chattanooga State Community CollegeACT researchers worked in partnership with Chattanooga State Community College (ChSCC) to assess the effectiveness of EdReady in preparing students for their first college-level English course. In the fall of 2017, all students who did not enter college with the necessary ACT test scores for direct placement into their first credit-bearing English composition course with no co-requisite remediation were given the option to use EdReady prior to the beginning of the fall term to improve their course performance without the need for formal remediation.2 To assess the effectiveness of EdReady, we examined differences in the course pass rates and average course grades among three groups of students at ChSCC:
1. Direct Placement Group: students who wereplaced directly into a college-level English coursewithout any need for co-requisite remedialcoursework based on their prior test scores.
2. Co-Requisite Group: students who were placedinto a college-level English course while beingrequired to complete co-requisite remedialcourses in reading and writing based on their priortest scores.
3. EdReady Group: students who were placed into acollege-level English course without any need forco-requisite remedial coursework based on theirsubsequent achievement of a target score withinEdReady.
After controlling statistically for differences among the three groups in prior academic achievement and other background characteristics, we found that students in the EdReady group were more likely to pass their introductory English course than students in the Direct Placement and Co-Requisite groups. As shown in Figure 3, students who used EdReady had an estimated course pass rate of 73% as compared to 59% and 60% for the “Direct Placement” and “Co-Requisite” groups, respectively.
Figure 3.Predicted Pass Rate for First College-Level English Composition Course at ChSCC
2 In lieu of ACT scores, students could use a comparable set of Compass or Accuplacer Scores

In addition to higher pass rates, students in the EdReady group also had significantly higher course grades. Figure 4 provides the average course grade for all three groups after holding constant prior academic achievement and other background characteristics. As the figure shows, students who used EdReady had an estimated average course grade of 2.29 (on a 4.0 numeric scale), compared to an estimated average course grade of 1.80 and 1.78 for the Direct Placement and Co-Requisite groups, respectively.
For more information, the full report is available at https://www.act.org/content/dam/act/unsecured/documents/pdfs/R1722-cr-chatt-2018-10.pdf.
Figure 4.Predicted Grade (4-Point Scale) for First College-Level English Composition Course at ChSCC
2019 Higher Education Research Digest | 5
MAKE YOUR STUDENTSUNSTOPPABLE Nearly half of all incoming students are not ready for college-level coursework in math or English.
Most of these students will not graduate.
Isn’t it time to rethink the traditional approach to placement and remediation?
ACT® CollegeReady™ was created in partnership with NROC.
LEARN MORE ATact.org/collegeready
| 2019 Higher Education Research Digest6
DEMOGRAPHY IS NOT DESTINY:INTRODUCING THE PROSPECTIVE STUDENT MINDSETSKim Reid, Eduventures Principal Analyst
You might say that enrollment leaders are in the business of filling buckets. One bucket might be for female students, for example, another for engineers, and another for first-generation students.
The problem is the so-called targeted marketing used to fill these buckets makes assumptions about students based on demographic characteristics. As a result, marketing messages intended to appeal to all women or all first-generation students—as if members of these demographic groups are monolithic in their attitudes about college—tend to be unintentionally university-centric, rather than truly student-centric.
Based on data from Eduventures’ annual Prospective Student Survey of college-bound juniors and seniors, we have developed a behavioral and attitudinal market segmentation, the Prospective Student Mindsets™ (Mindsets), which help institutions understand the dreams and desires students have for their college education. Eduventures research indicates that by segmenting the market like this, schools can transcend a purely demographic view of their prospective students. They can then tailor messaging to behavioral and attitudinal segments of the market.
an institution attracts—or wants to attract—can enable schools to think differently about strategic marketing, communications, and recruitment. A better understanding of Mindsets also enables institutions to think about how they will serve students who imagine specific pathways to success in college.
This approach begins with the fact that all great colleges and universities serve many kinds of students who expect to get to and through college in different ways. With this understanding, institutions must tell the story of how they offer relevant pathways to students who fall into each Mindset. Knowing the types of students
Eduventures developed the Mindsets by applying a cluster analysis technique to the answers students provided to three key questions (paraphrased here): What outcomes do you expect from your college education? What experiences do you want to have? How do you plan to make your enrollment decision? Figure 5 displays each Mindset.
David Scott to suggest/select a photo
Underst lege
search s on.
Particip urvey™.
Visit: ht
Eduventures Research
David Scott to suggest/select an ad or photo
and Student Mindsets™ during col
o your messaging will inspire acti
ate in the Prospective Student S
tps://encoura.org/pss

Eduventures Research
Six Prospective Student Mindsets™
12%
Exploration & Meaning
17%
Career Pragmatists
14%
Grad School Bound
17%
Experiential Interests
20%
Social Focus
19%
Career Through Academics
Figure 5.Eduventures Prospective Student Mindsets
Mindsets in Brief
Social Focus students seek to gain lasting friendships from college, but a job would be nice, too. They expect to be highly involved in every aspect of social life as well as internships and study abroad. The quality of the social environment is their singular focus as an application driver.
Experiential Interest students want to get hands on in college with internships and their own employment. They are sensitive to affordability and their primary goal is to obtain to a good career.
Career Through Academics students desire preparation for a life-long career. They believe that strong academics integrated with career preparation will get them there. These students often select majors that lead to specific careers. They balance academic strength, career preparation, and affordability in their application decisions.
Grad School Bound students are the rare 17- or 18-year olds that see their undergraduate educationas a stepping stone to graduate or professionalschools. They desire the scientific, research-based,and technical skills necessary to get there. Academicstrength is their number one priority in applicationdecisions.
Career Pragmatist students desire immediate return on investment (ROI). Highly sensitive to affordability, they are more focused on getting a job upon graduation than on a long-term career. These students want to obtain their degrees in strong communities and value opportunities to serve and lead.
Exploration & Meaning students want to use their skills to benefit others. They are “global butterflies” who are open to traditional liberal arts outcomes and are wide open to a variety of majors and careers.
72019 Higher Education Research Digest |

Critically, these Mindsets represent how students think at a particular point in time during their college search, at the point of application. Thus, we consider them as part of the developmental arc that high school students traverse during college search, in making their ultimate decision, and into their enrollment experience.
Applying the MindsetsEduventures has shared this research with more than 100 institutions in dozens of cities across the country. These in-depth discussions identified four areas of immediate opportunity for schools to apply the Prospective Student Mindsets:
Bursting recruiter bubbles: Sharing the Mindset research with recruiting stakeholders helps them learn about a data-driven typology of students. When recruiters interact with students, they will be more likely to step out of their own perspective about college or parrot back the party line of the institution they represent. They will better empathize with the viewpoint of the student and help foster a real personal connection to them.
Revitalizing communications with relevance: By prioritizing which Mindsets your institution should target, enrollment marketing and communications professionals can add content-driven relevance to messaging and communications planning. With a clear sense of who to message to, these professionals can: develop institutional stories, balance the messaging to speak directly to the Mindsets you desire to reach, and use the right technology to target the messaging.
Rethinking campus visits: A relatively simple pre-visit Mindset assessment can differentiate campus visits. A visit that could provide experiences relevant to certain student Mindsets can elevate that visit above other campus visits that do not differentiate content to individual student interests or needs.
Help academic colleagues see their students: The final, and potentially most fruitful area, is the ability to impact the faculty recruiting partnership and the way faculty think about student support and academic programs. If faculty can see data describing the dreams and desires of the students in their programs and majors, they can be more informed participants in recruiting. They can also use the information to consider curricular and co-curricular student opportunities and the advising ecosystem that supports these students.
The 2019 Prospective Student SurveyTM data set is available in Encoura™ Data Lab, a powerful, easy-to-use, custom visualization app, putting survey results directly in the hands of institutions. Schools who can provide inquiry lists by October 25, 2019 may also use the Prospective Student Survey to survey their own prospects and compare the results to peers. Contact us at [email protected] for more information.
Great outcomes start with data-driven decisions.
encoura.org
| 2019 Higher Education Research Digest8
FROM APPLICATION TO ENROLLMENT:USING MINDSETS TO SEGMENT THE STUDENT MARKETKim Reid, Eduventures Principal Analyst
Eduventures research suggests that adopting a Mindset-based approach to student recruitment can help institutions move beyond a demographics-based view of the market (see page 9 of this publication for Demography is Not Destiny: Introducing the Prospective Student Mindsets). Critically, the Six Prospective Student MindsetsTM (Mindsets)—Experiential Interests, Career Pragmatists, Social Focus, Exploration & Meaning, Career through Academics, and Grad School Bound—represent how students think at a particular point in time during their college search, at the point of application.
These may be their desires for now, you might say, but how will they change? How will interactions with their enrollment school help prospective students negotiate a meaningful path that is relevant to their emerging interests and the unknowns?
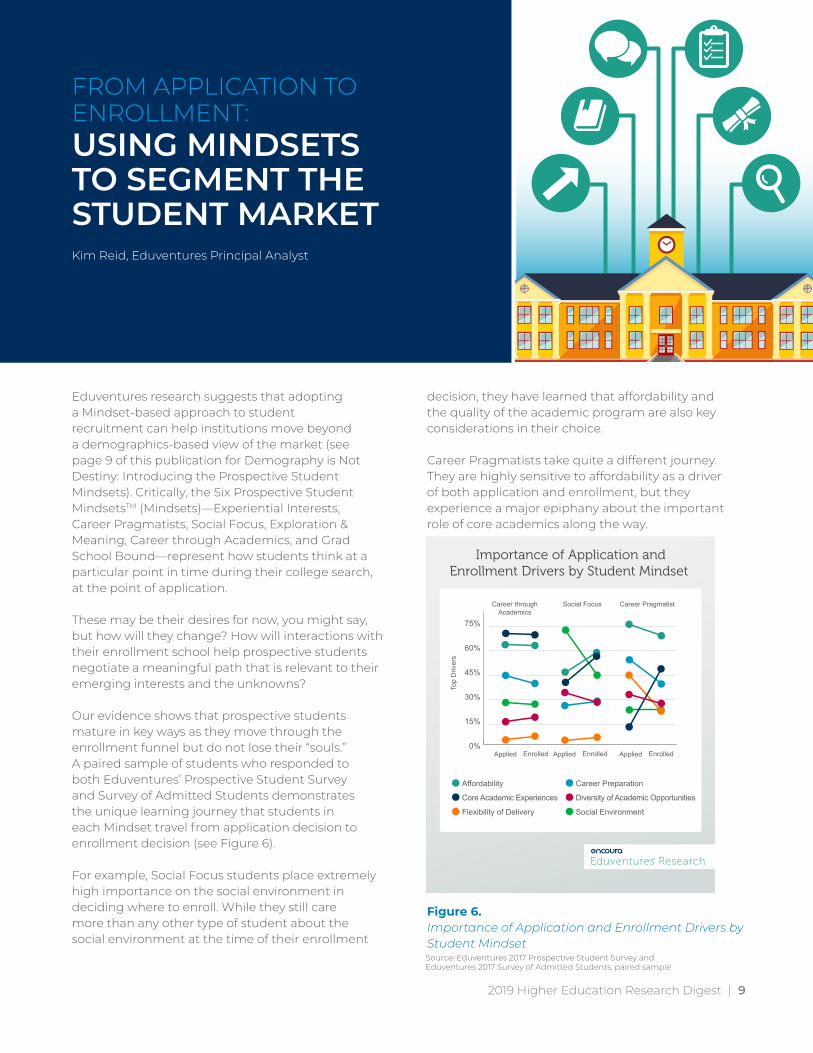
Our evidence shows that prospective students mature in key ways as they move through the enrollment funnel but do not lose their “souls.” A paired sample of students who responded to both Eduventures’ Prospective Student Survey and Survey of Admitted Students demonstrates the unique learning journey that students in each Mindset travel from application decision to enrollment decision (see Figure 6).
For example, Social Focus students place extremely high importance on the social environment in deciding where to enroll. While they still care more than any other type of student about the social environment at the time of their enrollment
decision, they have learned that affordability and the quality of the academic program are also key considerations in their choice.
Career Pragmatists take quite a different journey. They are highly sensitive to affordability as a driver of both application and enrollment, but they experience a major epiphany about the important role of core academics along the way.
Eduventures Research
Importance of Application andEnrollment Drivers by Student Mindset
Affordability
Core Academic Experiences
Flexibility of Delivery
Career Preparation
Diversity of Academic Opportunities
Social Environment
0%
15%
30%
45%
60%
75%
EnrolledApplied EnrolledApplied EnrolledApplied
Career throughAcademics
Top
Driv
ers
Social Focus Career Pragmatist
Figure 6.Importance of Application and Enrollment Drivers by Student Mindset Source: Eduventures 2017 Prospective Student Survey and Eduventures 2017 Survey of Admitted Students, paired sample
2019 Higher Education Research Digest | 9

| 2019 Higher Education Research Digest10
In one final example, Career through Academic students show themselves to be entirely levelheaded. They make their enrollment decision in exactly the same manner as they made their application decision. Recruiters can take them at face value as they enter and proceed through the enrollment funnel.
In the end, all students recognize that they must make an enrollment decision based on core academic strength and affordability, but they arrive at that understanding along different paths. The question is: How can enrollment professionals successfully navigate students along those pathways?
We recommend that enrollment leaders approach prospective undergraduates in different Mindsets through a three-part framework. The framework takes into consideration the reality that students are maturing throughout the enrollment cycle. They begin with a specific viewpoint and are on a particular learning journey related to that viewpoint:
1. Opening Conversations: Focus on maximizingrelevance to a student’s desired path as they enterthe top of the enrollment funnel. Institutionsmust spark imagination. These are early stagemarketing and recruitment conversations thatcapture the attention of students in the hope thatthey will want to learn more.
2. Blind Spots: Once an institution has aprospective student’s attention, it should ensureeach student has the right information to makean informed enrollment decision. Students willsoak up information they naturally care about,but what else do they need to know? Think aboutthese as mid-recruitment cycle conversationsthat cover important ground that students ineach Mindset might overlook in their passion tofollow their own path.
3. Opportunities for Support: Once studentsmake the decision to enroll, institutions shouldrecognize the unique, long-term opportunitiesto support students in each Mindset related totheir outcome goals, approach to academics,personality characteristics, and concerns aboutwork and affordability.
Sample Mindsets DossiersTo put this framework to work, we offer here two examples of a short dossier of the essential information necessary to understand what makes each Mindset stand out from the others. Institutions can use these dossiers to train recruitment and communications staff to develop recruiting strategies or draft content for students in different Mindsets.
Experiential Interests Experiential Interest students want to get hands on in college with internships and their own employment combined with academic coursework. They are sensitive to affordability, and their primary goal is to obtain a good career.
§ Opening conversation. An Experiential Intereststudent will respond well to an institutionthat can articulate how experiential learningopportunities lead to career-focused outcomes.These students appreciate clearly laid outprograms and degree plans. Value will matter inthe conversation.
§ Blind spots. Experiential Interest students canpush academic coursework into secondarystatus when hands-on experiences likeinternships and employment come into play.Help them think about the right balance andintegration of these experiences.
§ Opportunities for support. Experiential Intereststudents describe themselves as conscientiousbut not open to new experiences. They have aplan and intend to stick to it. Thus, they mayrun into trouble if they find themselves off theirintended program path. More so than otherstudents, they may need help navigating toanother academic major if their first choice doesnot work out. Their advising should address theirdesire to integrate their experiential learningopportunities and their academic coursework toachieve their career goals.
2019 HighHigher Eer Education Reseducation Researarcch Digesth Digest | 1111
Social Focus Social Focus students seek to gain lasting friendships from college, but a job would be nice, too. They expect to be highly involved in every aspect of social life as well as internships and study abroad. The quality of the social environment is their singular focus as an application driver.
§ Opening conversation. For Social Focusstudents, showcase the defining aspects of yoursocial environment. Demonstrate how yourinstitution not only creates lasting friendships,but also develops connections and builds thesocial facility that drives success in the workplace.
§ Blind spots. It seems that the Social Focusstudent might believe they will get that good jobafter graduation almost by osmosis. At the timeof application, they are not primarily concernedwith academics and career preparation. Duringthe recruitment cycle, institutions must bringSocial Focus student along to understand thesecritical elements of the experience.
§ Opportunities for support. Social Focusstudents are extroverts who recognize inthemselves a lesser degree of emotional stabilityand conscientiousness. They may need helpgetting on track with academic or career plans.Moreover, these students are highly invested inthe social aspect of your campus. If their socialexperience goes south, they are at high risk forattrition. Thus, advisors, coaches, and mentorsshould pay close attention to how thesestudents are connecting to campus.
The Bottom LineUnderstanding the inherent differences among the Mindsets can allow institutions to speak with students using their language and meet them where they are on their college journeys. Understanding how their viewpoint changes throughout the enrollment funnel provides a roadmap for how schools can adapt both recruiting and onboarding practices to better support student success.
A full set of dossiers is included in the 2018 Prospective Student Survey Report, available in the Encoura Data Lab Research app.
WHY DO FEMALES PERFORM BETTER IN COLLEGE THAN TEST SCORES AND GRADES PREDICT?
THE IMPORTANCE OF SOCIAL AND EMOTIONAL LEARNING SKILLSKrista Mattern, Senior Director of Validity and Efficacy ResearchEdgar Sanchez, Senior Research Scientist
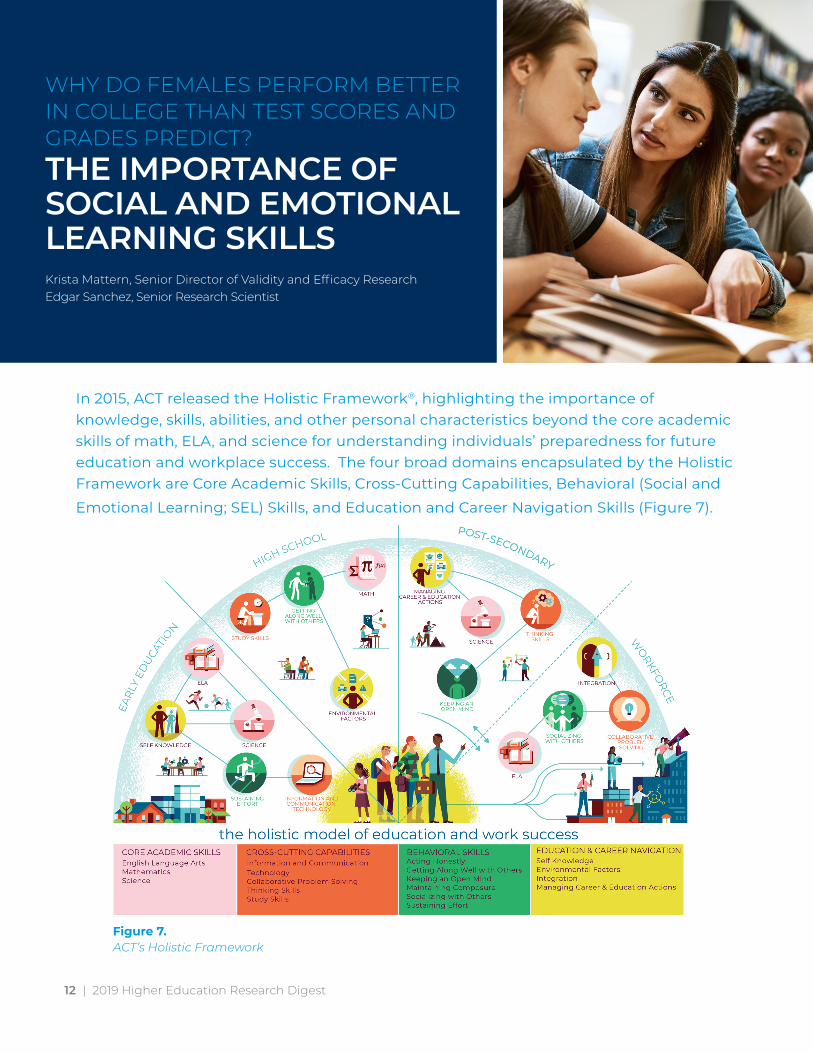
In 2015, ACT released the Holistic Framework®, highlighting the importance of knowledge, skills, abilities, and other personal characteristics beyond the core academic skills of math, ELA, and science for understanding individuals’ preparedness for future education and workplace success. The four broad domains encapsulated by the Holistic Framework are Core Academic Skills, Cross-Cutting Capabilities, Behavioral (Social and
Emotional Learning; SEL) Skills, and Education and Career Navigation Skills (Figure 7).
Figure 7.ACT’s Holistic Framework
| 2019 Higher Education Research Digest12

Ignoring these additional skills can paint an inaccurate picture of a student’s likelihood of future success. We have seen this time and again when we evaluate the performance of models to predict college success, and in particular how well these models are performing for student subgroups. Specifically, prediction models that rely solely on test scores and high school grades underpredict the college performance of females and over-predict the college performance of males. Recent findings from an ACT study3 highlight this point and underscore the utility of taking a more holistic approach when evaluating students’ readiness for college. Namely, information about students’ behavioral or SEL skills allows one to more accurately predict students’ likelihood of future success. However, its benefits are not limited to issues of validity but also extend to fairness: Females tend to exhibit higher levels of academic discipline, an SEL domain which other research shows is related to higher academic outcomes. This helps explain why females do better in college than their test scores and/or high school grades would predict. Information on students’ SEL skills provides valuable insight to those who work in higher education as it allows educators and administrators to more accurately identify students that are ready for college-level work and those that may benefit from additional resources and supports.
BackgroundA good deal of research has been conducted evaluating whether traditional college admission measures systematically over- or underpredict future college performance for various subgroups. The findings consistently show that admission test scores—ACT® and SAT—and high school grade point average (HSGPA) underpredict college performance for women (i.e., women tend to earn higher grades in college than what is predicted based on test scores and HSGPA). A review of prior studies on the topic found that females earned college grades that were 0.08 points higher on a four-point scale, on average, as compared to predicted, whereas males’ grades were 0.09 points lower than predicted—an overall difference of 0.17. Even though the effect is not large, it is important to understand why this pattern of results is consistently found.
Study OverviewAlong those lines, a recent study examined whether underprediction of first-year grade point average (FYGPA) for females could be explained by factors not typically included in these prediction models.4 Specifically, a model that includes only cognitive measures does not cover all the knowledge, skills, and personal attributes that one needs to be successful in college. To earn good grades, students not only need to master the course material but they also need to show up to class, turn in their homework, and make good choices outside the classroom (such as studying and not staying out too late). Additionally, if these other factors that have been omitted from previous prediction models are also related to gender, then the model will predict different results for males versus females. In such instances, differential prediction by gender isn’t signaling something wrong with the ACT or HSGPA but rather pointing to the fact that additional factors, namely SEL, should be included in the prediction model.
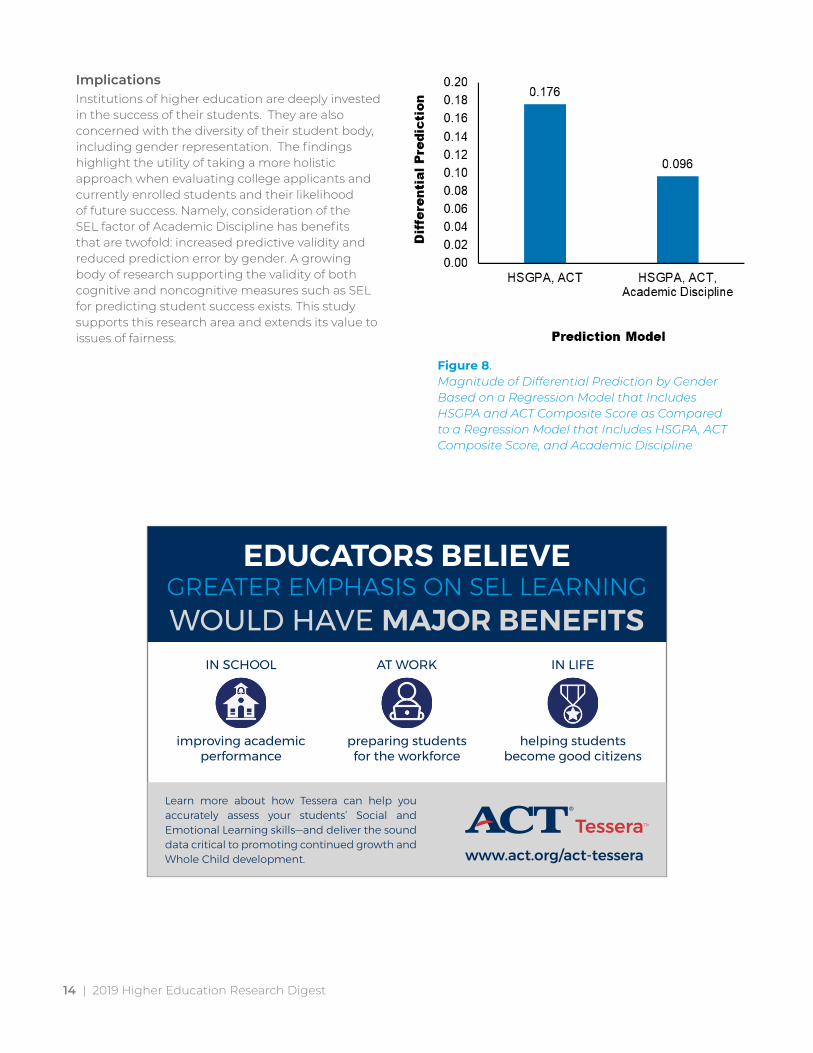
Drawing from earlier research, we know that Academic Discipline (the amount of effort a student puts into schoolwork and the degree to which a student sees him/herself as hardworking and conscientious) improves accuracy when attempting to predict college grades. Given that women tend to exhibit higher levels of Academic Discipline, this study sought to evaluate the impact on prediction accuracy by gender when Academic Discipline is considered. Based on nearly 10,000 college students who took ACT® Engage® College, the results show that underprediction of female performance is reduced by nearly half when Academic Discipline is added to a model that already includes HSGPA and ACT Composite score. In particular, we found that, based on a model that only included ACT Composite score and HSGPA, females tend to earn a FYGPA that is 0.176 higher (on a 4.0 grading scale) than males with the same ACT Composite score and HSGPA, on average. However, after adding Academic Discipline to the prediction model, we find that females earn FYGPAs that are only 0.096 higher than males with the same ACT Composite score, HSGPA, and Academic Discipline (as graphically displayed in Figure 8). The results underscore the value of understanding students’ SEL skills on forecasting future success.
3 Mattern, K., Sanchez, E. & Ndum, E. (2017), Why do achievement measures underpredict female academic performance? Educational Measurement: Issues and Practice, 36(1).doi:10.1111/emip/121384 Ibid.
2019 Higher Education Research Digest | 13
| 2019 Higher Education Research Digest14
ImplicationsInstitutions of higher education are deeply invested in the success of their students. They are also concerned with the diversity of their student body, including gender representation. The findings highlight the utility of taking a more holistic approach when evaluating college applicants and currently enrolled students and their likelihood of future success. Namely, consideration of the SEL factor of Academic Discipline has benefits that are twofold: increased predictive validity and reduced prediction error by gender. A growing body of research supporting the validity of both cognitive and noncognitive measures such as SEL for predicting student success exists. This study supports this research area and extends its value to issues of fairness.
Figure 8.Magnitude of Differential Prediction by Gender Based on a Regression Model that Includes HSGPA and ACT Composite Score as Compared to a Regression Model that Includes HSGPA, ACT Composite Score, and Academic Discipline
Learn more about how Tessera can help you accurately assess your students’ Social and Emotional Learning skills—and deliver the sound data critical to promoting continued growth and Whole Child development.
EDUCATORS BELIEVEGREATER EMPHASIS ON SEL LEARNING WOULD HAVE MAJOR BENEFITS
IN SCHOOL
improving academic performance
AT WORK
preparing students for the workforce
IN LIFE
helping students become good citizens
www.act.org/act-tessera

2019 Higher Education Research Digest | 3 15
LOOKING BEYOND THE DOMESTIC APPLICANT POOL:THE VALUE OF ACT SCORES FOR IDENTIFYING INTERNATIONAL STUDENTS WHO ARE PREPARED TO SUCCEED IN COLLEGEJustine Radunzel, Principal Research Scientist
Every year, a growing number of high school graduates residing in countries or territories outside the US (international students) take the ACT® test, and many request that their scores be sent to US colleges and universities. Approximately 60% of international students from the 2011 to 2015 ACT-tested high school graduating cohorts requested that their scores be sent to at least one US postsecondary institution. Institutions use these scores to make admissions decisions and to identify those most likely to struggle academically, be at risk of dropping out, and who among them is likely to benefit from institutional services and supports.5
A recent study using two different data sources provides validity evidence supporting the use of ACT scores for these purposes. More specifically, the study found that ACT Composite scores earned by international students can be used to predict short- and long-term academic and success metrics that include first-year grade point average (GPA), retention, and degree completion. This is increasingly relevant for practice as the number of international students taking the ACT continues to increase. To support this growing market segment, ACT is dedicated to building research partnerships with higher education institutions to provide assistance in conducting local validity studies and evaluating the use of ACT scores for college admissions decisions among international students.
First-year Academic PerformanceBased on results from a local study for a university state system, international students entering better prepared academically as measured by their ACT Composite score had greater chances of performing well in their college courses (Figure 9). For example, the typical chances of earning a first-year GPA of 3.0 or higher for international students increased from 46% for those with a score of 20 to 72% for those with a score of 32 (as illustrated with the yellow line in Figure 9). ACT scores were also found to be positively related to students’ chances of achieving other first-year GPA success levels (e.g., 2.5 or higher (blue line) and 3.5 or higher (orange line) in Figure 9), as well as greater chances of achieving GPA success levels of 3.0 or higher in subsequent years (data not shown).
Figure 9.Typical Chances of First-Year GPA Success Levels by ACT Composite Score for International Students Attending a State University System6
5 Clinedinst, M., & Patel, P. (2018). State of college admission. Arlington, VA: National Association for College Admission Counseling.6 The model statistically controlled for the institution attended, high school GPA, gender, major category, and country of origin. Results based on data provided for international students from the 2010 to 2012 freshman cohorts attending one of eight four-year institutions from a state university system. The distribution of geographic location for international students from the university system according to ACT region classifications was as follows: 10% Americas, 85% East Asia and Southeast Asia, 1% Europe and United Kingdom, 1% Middle East and North Africa, 3% South Asia, < 1% Sub Saharan Africa, and < 1% US territories.

Retention and Degree Completion International students often encounter barriers that can reduce their chances of persisting and completing a degree when matriculating to US universities.7 Results based on an ACT and National Student Clearinghouse (NSC) matched sample of international students who immediately enrolled in a US four-year postsecondary institution after graduating from high school suggest that better academic preparation is associated with positive and longer-term benefits for these students.8
The typical rate for ACT-tested international students returning to their initial institution in year two was relatively high at 86% and decreased to 76% in year 3 and 71% in year 4.9 But, as illustrated in Figure 10, retention rates varied by students’ ACT Composite score with greater attrition occurring for international students entering less academically prepared. For example, 82% of international students with an ACT Composite score of 20 returned in year two, 70% in year three, and 65% in year four. In comparison, the corresponding percentages for those with a score of 27 were 90%, 83%, and 79%, respectively.
GET THE BEST STUDENTS FROM AROUND THE GLOBE
The Global Assessment Certificate™ (GAC) helps your university recruit highly qualified students who are committed to study in the United States. The GAC credential signifies university readiness for non-English-speaking students.
The American Council for Education recommends the GAC curriculum for up to 51 transfer credits at the undergraduate level!
Learn more at: act.org/gac.
Figure 10.Typical Chances of Returning to the Same Institution Over Time for International Students by ACT Composite Score10
7 Mamiseishvili, K. (2012). International student persistence in US postsecondary institutions. Higher Education, 64(1), 1–17. DOI 10.1007/s10734-011-9477-08 The sample consisted of ACT-tested international students who graduated from high school in 2011 or 2012 and enrolled in fall 2011 or fall 2012, respectively, at one of 717 four-year postsecondary institutions located in the US or other jurisdictions of Puerto Rico or Virgin Islands, according to NSC data. Including postsecondary enrollment in US territories is consistent with reporting by the Integrated Postsecondary Education Data System (IPEDS) which collects institution-level data from postsecondary institutions in the US and other jurisdictions located in US territories. Only 4% of the enrollments were at an institution located in Puerto Rico or the Virgin Islands. The distribution of geographic location for the international students in the sample according to ACT region classifications was as follows: 23% Americas, 22% East Asia and Southeast Asia, 20% Europe and United Kingdom, 6% Middle East and North Africa, 7% South Asia, and 4% Sub-Saharan Africa, and 18% US territories (predominantly from Puerto Rico and the Virgin Islands). The enrolled study sample represented 23% of the original sample of international ACT test-takers who graduated from high school in 2011 or 2012. The immediate college enrollment rate at a US four-year postsecondary institution for international students varied by the number of ACT College Readiness Benchmarks met (from 16% for those meeting none to 29% for those meeting all four)..9 Retention was evaluated as fall to subsequent fall enrollment at the same institution, requiring students to be continuously enrolled across fall terms up to the term of interest. Students who completed a degree and were continuously enrolled in years prior to degree completion were considered to be continuously enrolled in the years following degree completion.10 The model statistically controlled for the institution attended. ACT Composite Scores of 20, 24, And 27 corresponded to the 25th, 50th, and 75th percentiles of the distribution of scores for enrolled international students in the ACT and NSC matched sample.
| 2019 Higher Education Research Digest16
Become a GAC Pathway University
Global Assessment Certificate

Additionally, based on the same enrolled sample of ACT-tested international students, Figure 11 illustrates the positive relationship between academic readiness and bachelor’s degree completion rates. From the figure, we see that international students’ chances of earning a bachelor’s degree within:
§ Four years (or 100% of normal time) increasedfrom 37% for those with a score of 20 to 72% forthose with a score of 32 (orange line).
§ Six years (or 150% of normal time) increasedfrom 62% for those with a score of 20 to 90% forthose with a score of 32 (blue line).
Figure 11.Typical Chances of Earning a Bachelor’s Degree from any US Postsecondary Institution for International Students by ACT Composite Score11
SummaryThese findings highlight the positive effect that academic achievement has on college outcomes for international students and provides validity evidence supporting the use of ACT scores for helping to inform college admissions decisions for international applicants. Comparable statistics for these same types of relationships between ACT scores and college outcomes have been reported elsewhere for domestic students.12 For example, we find that international students have comparable degree completion rates to domestic students with the same ACT Composite score. Clearly, there are other cognitive and non-cognitive factors that are also related to students’ likelihood of succeeding in college and should be considered in the admissions process.13
Institutions can learn more about their incoming international students by participating in the ACT International Student Initiative. Conducting local studies of this nature can provide insights on how to tailor campus services and supports to best meet the needs of international students.
11 The model statistically controlled for the initial institution attended.12 For example check out the ACT College Completion database, Figure 16 from the 2018 Higher Education Research Digest, and Figure 1 from an ACT Technical Brief entitled Relating ACT Composite Score to Different Levels of First-Year College GPA.13 Camera, W., O’Connor, R., Mattern, K., & Hanson, M. (2015). Beyond academics: A holistic framework for enhancing education and workplace success. Iowa City, IA: ACT.
SUPERSCORING:IS IT FAIR?FREE WEBINAR ABOUT THE TRUTH AND VALIDITY OF SUPERSCORING
Discover how superscoring in your recruiting process can have positive impacts and predict college outcomes in this free webinar. Our experts will be sharing empirical evidence based on the latest research from ACT.
CLICK HERE TO VIEW THE WEBINAR
| 2019 Higher Education Research Digest18
RATING (NOT RANKING) STUDENT SUCCESSKim Reid, Eduventures Principal Analyst
What do Massachusetts Maritime Academy, University of South Florida, and Mount Saint Mary’s University have in common?
Over the past three years, they have consistently over-performed on student success according to Eduventures® Student Success Ratings. Our ratings present a solution to a common problem in best practice research: It’s hard to identify true best practice. Thus, we end up with “practices” research.
More than a decade ago, this problem spurred Eduventures to develop a means for identifying true best practice institutions. Today, this method has evolved into the Student Success Ratings.
Let’s start by making some subtle distinctions. To be true to their original purpose, we quite purposely call them “ratings” and not “rankings.” Rather than bestow a crown upon a victor, we hope to encourage the practice of self-reflection balanced with competitive comparison.
Our Student Success Ratings (for traditional undergraduates) serve as a key data point for institutional self-management, allowing institutions to measure themselves against their own efforts within the context of their peers. They also play a growing role in how high school students and their families evaluate which college they want to go to, based on where they might be most successful.
Using these ratings, an institution should be able to ask and answer:
§ Are we doing well given who we are?
§ Who among our peers and aspirants is doingwell?
§ To whom can we look for advice and counsel onstudent success?
In short, the Student Success Ratings measure the ability of an institution to make demonstrated improvements in student retention and graduation rates (evidence of success) while overcoming contextualized institutional circumstance (performance model).
By “contextualized institutional circumstance,” we mean the types of students an institution serves and the inherent characteristics of the institution. We can explain 75% of student success with these variables alone. It is a powerful model in and of itself; taken together with trend scores, it creates an even stronger composite rating of student success.
RANKINGS
STUDENTSUCCESS
EduventuresResearch
R A T I N G S
2019 Higher Education Research Digest | 3 19
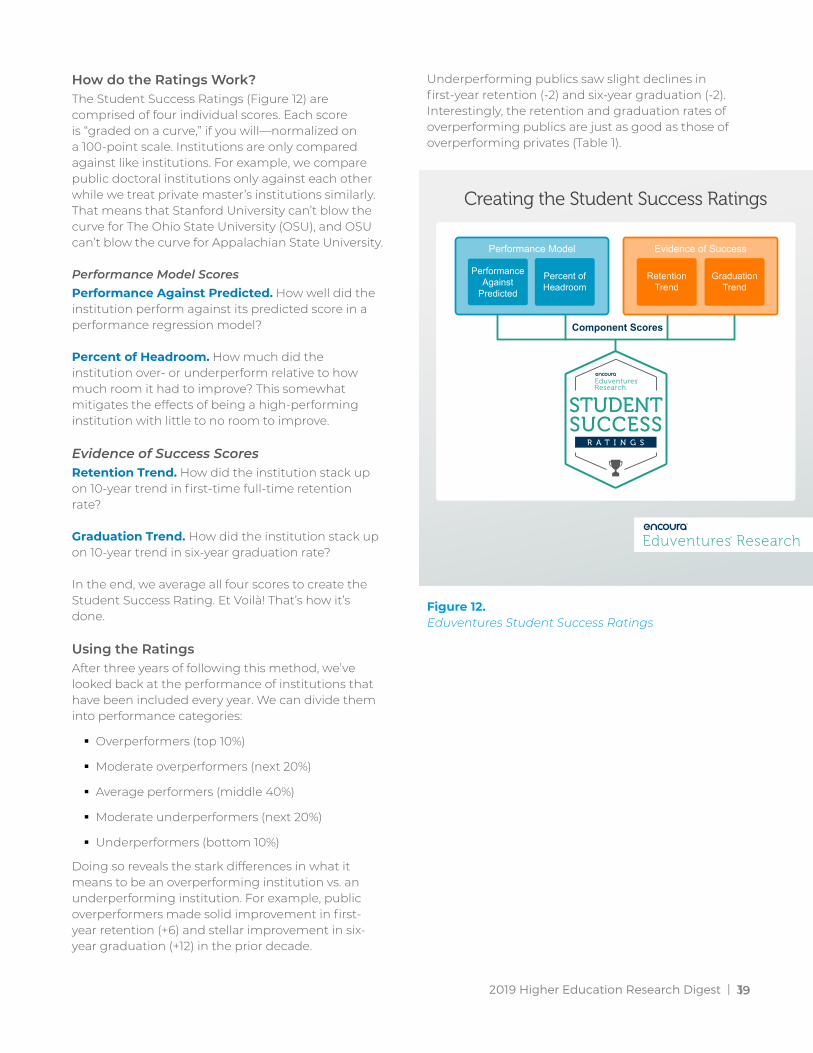
How do the Ratings Work?The Student Success Ratings (Figure 12) are comprised of four individual scores. Each score is “graded on a curve,” if you will—normalized on a 100-point scale. Institutions are only compared against like institutions. For example, we compare public doctoral institutions only against each other while we treat private master’s institutions similarly. That means that Stanford University can’t blow the curve for The Ohio State University (OSU), and OSU can’t blow the curve for Appalachian State University.
Performance Model Scores Performance Against Predicted. How well did the institution perform against its predicted score in a performance regression model?
Percent of Headroom. How much did the institution over- or underperform relative to how much room it had to improve? This somewhat mitigates the effects of being a high-performing institution with little to no room to improve.
Evidence of Success Scores Retention Trend. How did the institution stack up on 10-year trend in first-time full-time retention rate?
Graduation Trend. How did the institution stack up on 10-year trend in six-year graduation rate?
In the end, we average all four scores to create the Student Success Rating. Et Voilà! That’s how it’s done.
Using the RatingsAfter three years of following this method, we’ve looked back at the performance of institutions that have been included every year. We can divide them into performance categories:
§ Overperformers (top 10%)
§ Moderate overperformers (next 20%)
§ Average performers (middle 40%)
§ Moderate underperformers (next 20%)
§ Underperformers (bottom 10%)
Doing so reveals the stark differences in what it means to be an overperforming institution vs. an underperforming institution. For example, public overperformers made solid improvement in first-year retention (+6) and stellar improvement in six-year graduation (+12) in the prior decade.
Underperforming publics saw slight declines in first-year retention (-2) and six-year graduation (-2).Interestingly, the retention and graduation rates of overperforming publics are just as good as those of overperforming privates (Table 1).
Eduventures Research
Creating the Student Success Ratings
Performance Model Evidence of Success
RetentionTrend
Percent ofHeadroom
PerformanceAgainst
Predicted
Component Scores
GraduationTrend
STUDENTSUCCESS
EduventuresResearch
R A T I N G S
Figure 12.Eduventures Student Success Ratings
| 2019 Higher Education Research Digest20
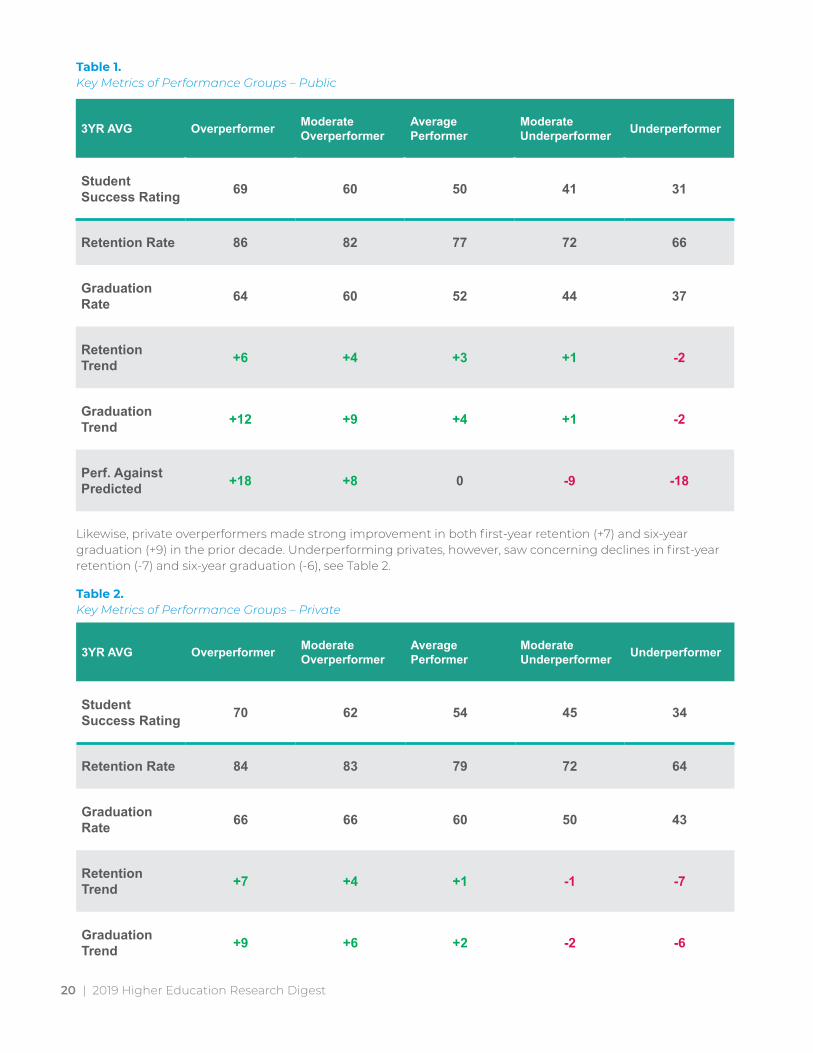
Table 1.Key Metrics of Performance Groups – Public
3YR AVG Overperformer Moderate Overperformer
Average Performer
Moderate Underperformer Underperformer
Student Success Rating 69 60 50 41 31
Retention Rate 86 82 77 72 66
Graduation Rate 64 60 52 44 37
Retention Trend +6 +4 +3 +1 -2
Graduation Trend +12 +9 +4 +1 -2
Perf. Against Predicted +18 +8 0 -9 -18
Likewise, private overperformers made strong improvement in both first-year retention (+7) and six-year graduation (+9) in the prior decade. Underperforming privates, however, saw concerning declines in first-year retention (-7) and six-year graduation (-6), see Table 2.
Table 2.Key Metrics of Performance Groups – Private
3YR AVG Overperformer Moderate Overperformer
Average Performer
Moderate Underperformer Underperformer
Student Success Rating 70 62 54 45 34
Retention Rate 84 83 79 72 64
Graduation Rate 66 66 60 50 43
Retention Trend +7 +4 +1 -1 -7
Graduation Trend +9 +6 +2 -2 -6
2019 Higher Education Research Digest | 21
The Bottom LineIn both cases, public and private, overperforming institutions are strongly out-doing the performance model—stretching far beyond what institutional circumstance is saying they should be able to do. Our original hypothesis from 2007 was that best practice lies in this ability to demonstrate progress regardless of inherent institutional constraints. These institutions are pushing the practice of student success forward in some way, and true “best practice” lies in knowing how.
Interested in learning more?
Eduventures Research subscribers can read more in our recently published report, Student Success Ratings: Identifying Best Practice. Learn more about our rating method as well as how to use the Student Success Ratings to learn about your institution and how to find your most appropriate best practice examples.
WFe
Eduventures Research
Wake-Up CallThe Wake-Up Call is a weekly analysis of higher education research, news and survey data, as well as industry events, and insider perspectives – delivered to your inbox every Tuesday morning.
Subscribe:
encoura.org/wakeup
| 2019 Higher Education Research Digest22
EXPLORE ACT DATA TO HELP INFORM RECRUITMENT, ENROLLMENT, AND SUCCESS STRATEGIES:THREE PUBLICLY AVAILABLE ACT DATABASES
The inaugural Higher Education Research Digest was released in 2017 along with the Enrollment Management Database, a tool assisting enrollment managers, admissions personnel, and other college administrators with student recruitment, enrollment, and success strategies. For this third edition of the Digest, the Enrollment Management Database has been updated with the 2018 ACT®-tested graduating cohort. In 2018, ACT also launched two more databases—Ten-Year Trends Database and College Completion Database. The three databases—which are available in an interactive, Tableau environment—are described below in more detail, highlighting an example of the research insights you can capture from each tool. The three databases are available for access at: act.org/researchdigest.
Enrollment Management DatabaseThe Enrollment Management Database includes data on multiple recent ACT-tested high school graduating classes matched to college enrollment and second-year retention data obtained from the National Student Clearinghouse, enabling users to follow a graduating class from high school through the first two years of college. The database currently includes information on the 2014 through 2018 ACT-tested high school graduating classes and is structured into five topical areas—student background, college preferences, score sending behavior, enrollment, and retention and transfer behavior—allowing users to answer questions of interest to them. For example, the degree to which students’ college preferences align with actual behavior may help inform recruitment strategies at your institution. An Enrollment Management Database User Guide is also provided on the database landing page.
Example Scenario Use CasePerhaps you work in the office of enrollment management at a public university in Missouri and are interested in examining the relationship between students’ college location preferences and actual enrollment behavior to help refine your student search criteria and recruitment strategies. Filtering by state and grad class year for students who directly enrolled in college, the tool provides the count and percentage of ACT-tested students in Missouri who indicated a preference to attend college out-of-state, in-state, and missing, as well
2019 Higher Education Research Digest | 3 23
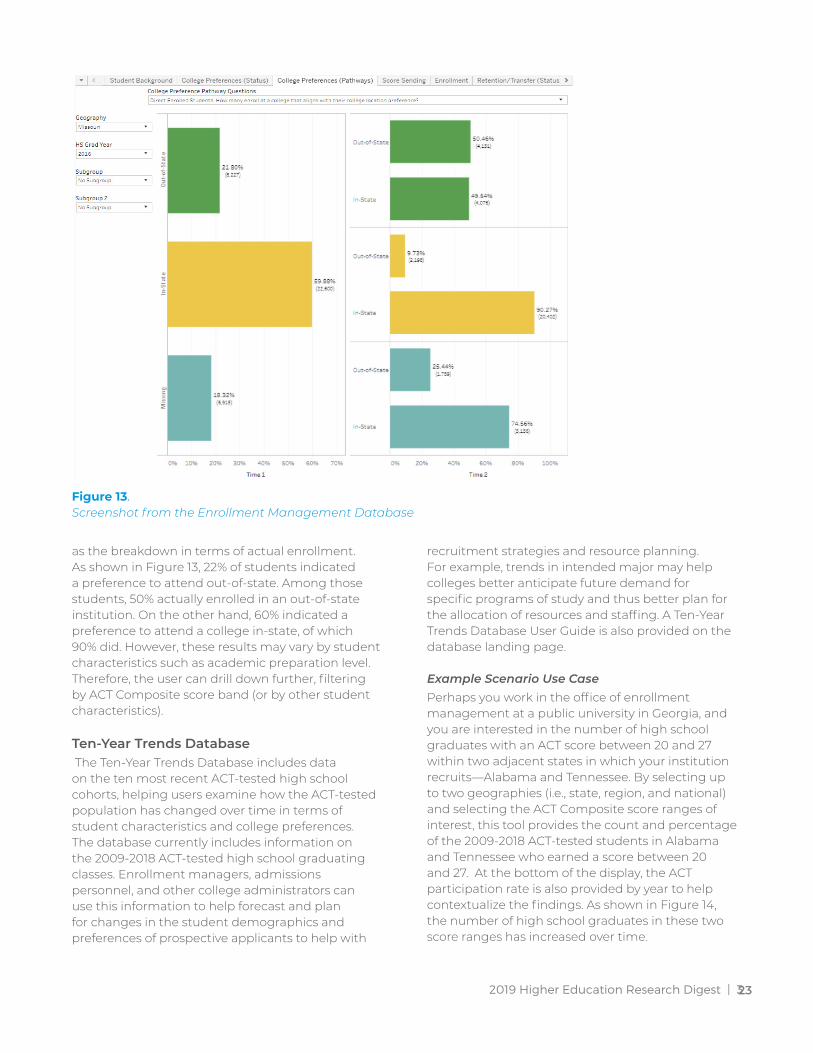
Figure 13.Screenshot from the Enrollment Management Database
as the breakdown in terms of actual enrollment. As shown in Figure 13, 22% of students indicated a preference to attend out-of-state. Among those students, 50% actually enrolled in an out-of-state institution. On the other hand, 60% indicated a preference to attend a college in-state, of which 90% did. However, these results may vary by student characteristics such as academic preparation level. Therefore, the user can drill down further, filtering by ACT Composite score band (or by other student characteristics).
Ten-Year Trends Database The Ten-Year Trends Database includes data on the ten most recent ACT-tested high school cohorts, helping users examine how the ACT-tested population has changed over time in terms of student characteristics and college preferences. The database currently includes information on the 2009-2018 ACT-tested high school graduating classes. Enrollment managers, admissions personnel, and other college administrators can use this information to help forecast and plan for changes in the student demographics and preferences of prospective applicants to help with
recruitment strategies and resource planning. For example, trends in intended major may help colleges better anticipate future demand for specific programs of study and thus better plan for the allocation of resources and staffing. A Ten-Year Trends Database User Guide is also provided on the database landing page.
Example Scenario Use CasePerhaps you work in the office of enrollment management at a public university in Georgia, and you are interested in the number of high school graduates with an ACT score between 20 and 27 within two adjacent states in which your institution recruits—Alabama and Tennessee. By selecting up to two geographies (i.e., state, region, and national) and selecting the ACT Composite score ranges of interest, this tool provides the count and percentage of the 2009-2018 ACT-tested students in Alabama and Tennessee who earned a score between 20 and 27. At the bottom of the display, the ACT participation rate is also provided by year to help contextualize the findings. As shown in Figure 14, the number of high school graduates in these two score ranges has increased over time.

| 2019 Higher Education Research Digest24
Figure 14.Screenshot from the Ten-Year Trends Database
College Completion DatabaseThe College Completion Database includes data on the 2010 ACT-tested high school graduating class matched to six years of college enrollment and graduation data obtained from the National Student Clearinghouse, letting users follow a graduating class from high school through the completion of college. Users can examine how student characteristics relate to degree completion within 100% and 150% of normal time to degree. For example, the extent to which students with higher academic preparation levels are more likely to earn a degree in a timely manner can be explored. A College Completion Database User Guide is also provided on the database landing page.
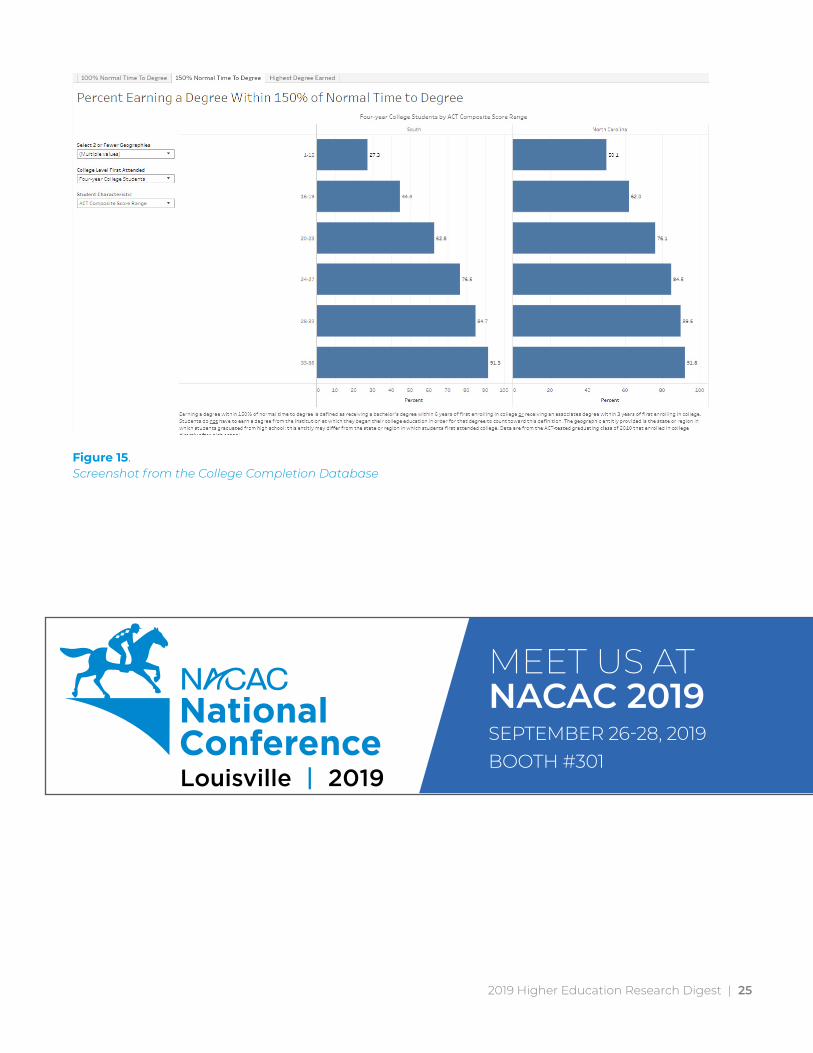
Example Scenario Use CasePerhaps you work in the office of enrollment management at a university in North Carolina. You are interested in examining the relationship between students’ ACT Composite scores and their probability of earning a degree within 150% of normal time to degree for four-year college students from your state and across all southern states. By selecting “South” and “North Carolina” from among the geographic entities that you want to compare, filtering your selection to “Four-year College Students” and selecting “ACT Composite Score Range” as your student characteristic of interest, you see the display in Figure 15. As the dashboard illustrates, in all ACT Composite score ranges except 33-36, ACT-tested students from North Carolina who began their college education at a four-year institutions were more likely to earn a degree within a 150% of normal time to degree compared to their peers from across all southern states (including North Carolina). This gap between North Carolina and the South decreases as the ACT Composite score range increases.
2019 Higher Education Research Digest | 25
Figure 15.Screenshot from the College Completion Database
MEET US AT NACAC 2019SEPTEMBER 26-28, 2019BOOTH #301
| 2019 Higher Education Research Digest2626
Join ACT and other postsecondary institutions in one or more research opportunities:
HIGHER EDUCATION STUDYExamine the use of ACT scores for predicting students’ grades. Participating institutions and students will receive stipends.
NATIONAL ACT COLLEGE SUCCESS RESEARCH PARTNERSHIPCollaborate on a broad research agenda related to student success and the use of ACT data.
ACT ENGLISH LANGUAGE ARTS (ELA) AND WRITING INITIATIVEExamine relationships between scores and performance in postsecondary reading- and writing-intensive courses.
INTERNATIONAL STUDENT SUCCESS INITIATIVEExamine relationships between ACT scores and first-year college performance for international students.
WORKKEYS/NCRC 2.0 EFFICACY STUDY Examine relationships between ACT WorkKeys 2.0 scores and relevant performance outcomes (job performance ratings, productivity, grades, etc.).
T
DON'T MISS OU !
availability
Limited
Sign up by Aug. 15
COLLABORATIVE RESEARCH PARTNERSHIP [email protected]