2019 employee engagement report - icma.org
TRANSCRIPT

2019 Employee Engagement ReportIntegrity • Innovation • Accountability • Commitment to Excellence • Teamwork

Introduction .................................................................................................................................................... 3The Gallup Q12 ................................................................................................................................................................................ 5Organization of the Report ......................................................................................................................................................... 6Reading the Survey Results ......................................................................................................................................................... 7
Overall Results ................................................................................................................................................ 9
Results by Department .................................................................................................................................. 12City Manager's Office .................................................................................................................................................................... 13City Secretary's Office and HR .................................................................................................................................................... 14Community Services ...................................................................................................................................................................... 15Finance and Technology .............................................................................................................................................................. 16Fire Department .............................................................................................................................................................................. 17Library ................................................................................................................................................................................................. 18Planning and Development ........................................................................................................................................................ 19Police Department ......................................................................................................................................................................... 20Public Works ..................................................................................................................................................................................... 21
Engagement Insights ..................................................................................................................................... 22
Taking Action .................................................................................................................................................. 27
Table of Contents

32019 Employee Engagement Report
In late September and early October of 2019, the City of Southlake conducted its fourth Employee Engagement Survey using Gallup’s Q12. During the two weeks that the survey was open, 374 employees, or about 79% of the City’s staff, participated and provided valuable insights on their experience working for the City of Southlake.
In the past year, the City of Southlake has seen a significant increase in its number of employees, primarily as a result of the opening of Champions Club in the spring of 2019. The participation rate among these new employees was low. Many were unaware of the Q12. As new employees are able to see how the survey is used, participation is likely to increase in future surveys.
The survey was followed by a series of State of the Team meetings where employees had an opportunity to view the results for their department, share their personal experiences, and discuss ideas for improving the workplace —as an overall organization, within each department, and as individuals.
The foundation of the City’s employee engagement work is based on research conducted by the Gallup organization. Gallup has spent decades researching engagement in the workplace and is considered to be one of the leading experts in the field. Over the past 35 years, they have interviewed and surveyed over 25 million employees in 195 different countries and in 70 languages.
Gallup defines engaged employees as those who are highly involved in and enthusiastic about their work. They feel a connection to their workplace and a sense of ownership in everything they do. They drive performance and innovation —and
move the organization forward. Workers are defined as “engaged” based on their responses to key workplace elements that, in turn, predict important organizational performance outcomes.
In 2016, Gallup completed the 9th analysis of the Q12 Employee Engagement Survey. This iteration included nearly 82,000 organizations and 1.8 million employees and the study confirmed Gallup’s well-established connection between employee engagement and nine performance outcomes:
• Customer Loyalty• Productivity• Safety• Absenteeism• Quality• Profitability• Turnover• Shrinkage/Theft• Patient Safety
High engagement increases the organization’s odds of success. In fact, organizations who have very high engagement scores at the 99th percentile had four times the success rate than those with scores at the 1st percentile.
Engagement has also been shown to affect each employee’s health and wellbeing. In addition to reducing safety incidents in the workplace, engagement factors can influence the levels of stress, anxiety, depression, blood pressure, and heart disease among employees.
Employee engagement is important because it helps the City attract and retain talented employees, improves their daily workplace experience, improves wellness, and boosts the organization’s ability to serve the community in measurable ways.
The survey results show that 53% of employees were engaged or fully invested in their work. 42% were not engaged and 5% were actively disengaged. This placed the City of Southlake at the 81st percentile overall, when compared to Gallup’s local government database.
Overall satisfaction is in the 85th percentile. And, of the 12 elements of engagement, the following items were identified as the top strengths for the City, in the 75th percentile or higher:
• Q02 Materials and Equipment (84th)• Q03 Opportunity to do Best (83rd)• Q12 Learn and Grow (79th)• Q05 Development (76th)• Q01 Know What's Expected (75th)
Introduction
Introduction
2017
2019
2015
2013
Engagement IndexEngaged Not Engaged Actively Disengaged
48%
42%
38%
42%
13%
10%
9%
5%
39%
48%
53%
53%
.064.15
81st
Percentile Rank79%374 of 475
Participation GrandMeanFull Time
Part Time
94%
42%
317 of 338
57 of 137

42019 Employee Engagement Report
Some of the lower elements identified by employees as areas for improvement, in the 70th percentile or below, included:
• Q11 Progress (64th)• Q04 Recognition (68th)• Q10 Best Friend (69th)• Q07 Opinions Count (70th)• Q08 Mission/Purpose (70th)
This report provides a view of the survey results along with feedback from employees in the City of Southlake. Individuals in each department and shared unique insights and concerns that impact them where they sit in the organization. The report attempts to capture these diverse perspectives and highlight the experiences that are driving engagement.
As leaders review and seek to understand the results and feedback received from this survey, it will be a valuable opportunity for them to work with the teams in each of their departments to decide what to do to continue to enhance the workplace culture.
Introduction
Making Better Best
CITY OF SOUTHLAKEEMPLOYEES IN 2019
TEXAS STATE & LOCAL GOVERNMENT EMPLOYEES IN 2017
U.S. STATE & LOCAL GOVERNMENT EMPLOYEES IN 2017
53%
29%
42%
54%
5%
17%
ENGAGEMENT IMPACTS PERFORMANCE
HIGHLY ENGAGED ORGANIZATIONS
EXPERIENCE:
THE CITY OF SOUTHLAKE’S OVERALL RANKING IS IN THE
81ST PERCENTILE THIS PUTS SOUTHLAKE IN THE
TOP 20% OF LOCAL GOVERNMENTS
ACCORDING TO GALLUP’S COMPARATIVE DATABASE
83%OF EMPLOYEES WERE SATISFIED OR EXTREMELY SATISFIED WITH SOUTHLAKE AS A PLACE TO WORK

52019 Employee Engagement Report
The Gallup Q12 consists of twelve actionable workplace elements that create a positive productive work environment and are scientifically proven to have links to performance outcomes. Gallup states that its employee engagement metric is distinct in that it is:
1. Backed by rigorous science 2. Linked to integral performance outcomes (customer loyalty, profitability, productivity, turnover, safety, shrinkage / theft, absenteeism and work quality) 3. Actionable at the local level
Gallup’s Q12 elements represent four levels of employee needs. Each level builds on the previous. If an element in one of the lower levels is weak, then the other elements that are built upon that particular element may be weakened as a result.
BASIC NEEDSEmployees need to have a clear understanding of what success in their role looks like. They need to be equipped with all the right resources.
INDIVIDUAL NEEDSEmployees need to understand how to optimize their contributions. They need to know that others value their best efforts, they need to develop trusting relationships, and they need to know someone is there to support them in their role.
TEAMWORKEmployees need to feel they are part of a team. They need to trust the people they work with, and know that others trust and value them.
GROWTHEmployees need to be challenged to learn something new and find better ways to do their job.
Q01: I know what is expected of me at work.
Q02: I have the materials and equipment I need to do my work right.
Q03: At work, I have the opportunity to do what I do best every day.
Q04: In the last seven days, I have received recognition or praise for doing good work.
Q05: My supervisor, or someone at work, seems to care about me as a person.
Q06: There is someone at work who encourages my development.
Q07: At work, my opinions seem to count.
Q08: The mission or purpose of my company makes me feel my job is important.
Q09: My associates or fellow employees are committed to doing quality work.
Q10: I have a best friend at work.
Q11: In the last six months, someone at work has talked to me about my progress.
Q12: This last year, I have had opportunities at work to learn and grow.
Introduction
The Gallup Q12

62019 Employee Engagement Report Introduction
Organization of the Report
Since the last survey, the City of Southlake has experienced quite a bit of growth and movement of divisions and departments. New department groupings have been created to reflect these changes in the engagement survey. This year, the City has also decided to participate in the Q12 through a new platform called Gallup Access. This significantly expands the information and resources available from Gallup to support engagement. This changes the format for the report, and allows the City to compare itself specifically to Gallup's local government database. These changes make it more difficult to track trends across the past four surveys. For a summary of past results, please reference the 2018 Employee Engagement Report.
The report for this year has been divided into five sections:
• Overall Results• Results by Department• What Employees Said• Engagement Insights• Taking Action
The Overall Results section provides information about the results for the City as a whole, taking all respondents answers into account. It also includes a heat map that summarize the scores and provides an overall look at the percentile rankings according to department.
The Results by Department section includes the results for each of the City’s departments. In order to have reliable survey results, Gallup requires that there are a minimum number of participants in each
data set. To meet this need, some departments or divisions were combined, particularly if they work closely together. Below is the breakdown of this year's department groupings:
• City Manager's Office• City Secretary's Office and HR• Community Services• Finance and Technology• Fire Department• Library• Planning and Development• Pollice Department• Public Works
Following the data results, the report captures What Employees Said. This section summarizes information obtained through the State of the Team Meetings. During these meetings, employees reviewed the survey results in detail and provided additional insight and recommendations for making Southlake a better place to work. These meetings not only help us interpret the meaning behind all of the numbers in this report, but they also help us understand the experiences of the employees throughout the organization.
Engagement Insights provides information from Gallup to help leaders understand the significance of each element and identify key questions that can help them take action on the items affecting their team.
The final section, Taking Action, highlights steps from Gallup that can be used by any team in the organization who wants to do something to improve engagement.

72019 Employee Engagement Report
The survey included 12 engagement questions, plus an introductory question regarding overall satisfaction. Employees were asked to respond to each statement on a scale of 1 to 5, with 1 being strongly disagree and 5 being strongly agree.
GrandMean
As you look through the survey results, at the top of each page is the GrandMean. The GrandMean provides a 'Current Mean' score of all of the elements. It essentially highlights the overall level of engagement within the organization or work group. Southlake’s overall GrandMean was 4.15, which placed the City in the 81st percentile among other local governments in Gallup’s Comparative Database.
Participation
It is the City’s goal to get 100% participation from all employees. Participation for the City as a whole decreased from 90% in 2017 to 79% in 2019. 374 surveys were taken. Voluntary participation in itself can be a reflection of the level of engagement within an organization. Participation appears to be impacted significantly by the number of new part-time employees recently hired at Champions Club.
Respondents
The left column describes the 'Total N' or number of respondents for each item.
Score
The second column describes the 'Current Mean' for each item. This tells us what employees said, or how they responded to each question on a scale of “Strongly Agree” to “Strongly Disagree.”
Topbox
The third column describes the 'Current Topbox' for each item. This tells us the percentage of respondents who “Strongly Agree,” which gives an idea about the overall distribution of the scores for each item.
Percentile Rank
In the right hand column, a 'Mean Percentile Rank' is shown for each item based on Gallup’s Comparative Database. This shows us how we are doing relative to other local governments, city, county, or state.
Engagement Index
The 'Engagement Index' tells us the percentage of employees who are engaged, not engaged, or actively disengaged. Gallup defines these three categories by the following:
EngagedEmployees who work with passion and feel a profound connection to their company/organization. They drive innovation and move the organization forward.
Not EngagedEmployees who are essentially “checked out.” They’re sleepwalking through their workday, putting time — but not energy or passion — into their work.
Actively DisengagedEmployees who aren’t just unhappy at work; they’re busy acting out their unhappiness. Every day, these workers undermine what their engaged coworkers accomplish.
A good way to think about this concept is to imagine a row boat. There are some employees in the front of the boat rowing toward a destination. These are your engaged employees. They work with passion and feel a profound connection to the organization. They drive innovation and move the organization forward.
Gallup’s most recent research found that 29% of local government employees in the U. S. were actively engaged. Southlake is currently at 53%. So, half of everyone who comes to work each day is excited to be here, doing what they do best.
Introduction
Reading the Survey Results
Q12 Mean Total N Current Mean Last Mean Change Engagement Index
The Gallup Q12 score represents the average of the scores of 12 items that Gallup has consistently found to measure employee engagement as linked to business outcomes.
374 * * Engaged: 53% Not Engaged: 42%
Actively Disengaged: 5%
Total N Current Mean Current Topbox Mean Percentile Rank - Industry - Government - Local (City / County / State)
Q00: On a five-point scale, where 5 means extremely satisfied and 1 means extremely dissatisfied, how satisfied are you with your organization as a place to work?
369 4.24 43 85
Q01: I know what is expected of me at work. 374 4.52 62 75
Q02: I have the materials and equipment I need to do my work right. 374 4.41 54 84
Q03: At work, I have the opportunity to do what I do best every day. 372 4.29 51 83
Q04: In the last seven days, I have received recognition or praise for doing good work. 364 3.70 39 68
Q05: My supervisor, or someone at work, seems to care about me as a person. 372 4.40 60 71
Q06: There is someone at work who encourages my development. 370 4.18 51 76
Q07: At work, my opinions seem to count. 373 3.89 37 70
Q08: The mission or purpose of my organization makes me feel my job is important. 373 4.23 49 70
Q09: My coworkers are committed to doing quality work. 374 4.24 47 71
Q10: I have a best friend at work. 359 3.70 38 69
Q11: In the last six months, someone at work has talked to me about my progress. 358 3.94 46 64
Q12: This last year, I have had opportunities at work to learn and grow. 366 4.33 57 79
* - Scores are not available due to data suppression. Not shown if n < 4 for Mean, Top Box, Verbatim Responses, and Sentiment, n < 10 for Frequency, or data is unavailable. Mean Percentile Rank is being calculated against other workgroup scores in the Industry - Government - Local (City / County / State) database.
EMPLOYEE ENGAGEMENT REPORT | 2019 EMPLOYEE ENGAGEMENT SURVEY
ALL - ALL | SEP 27, 2019 - OCT 12, 2019
Copyright 2018 Gallup, Inc. All rights reserved.Copyright © 1993-1998 Gallup, Inc. All rights reserved. The Gallup Q12 items are Gallup proprietary information and are protected by law. You may notadminister a survey with the Q12 items or reproduce them without consent from Gallup.
1
79%374 of 475
Participation

82019 Employee Engagement Report
In the middle of the boat, you will see employees who are not engaged. These employees may be productive, They come to work, do their job, but they don’t feel connected to the organization. They are more likely to miss workdays and leave the organization. According to Gallup, 54% of local government employees in the U. S. are not engaged. Southlake is at 42%.
And finally, there are employees who are actively disengaged. They are metaphorically dragging the anchor behind the boat. These employees are physically present, but psychologically absent. They are unhappy with their work situation and insist on sharing this unhappiness with their colleagues. According to Gallup, 17% of local government employees in the U. S are actively disengaged, while Southlake is at 5%.
It is important to note that a person is not innately engaged or disengaged. Their level of engagement is impacted by their environment, coworkers, and leaders, as well as their own personal choices.
Through the use of this report as a diagnostic tool, the City can gain insight on how engagement is impacting individual performance and measure progress as it works toward building an engaging workplace culture.
Reading the Survey Results

Overall Results

Q12 Mean Total N Current Mean Last Mean Change Engagement Index
The Gallup Q12 score represents the average of the scores of 12 items that Gallup has consistently found to measure employee engagement as linked to business outcomes.
374 * * Engaged: 53% Not Engaged: 42%
Actively Disengaged: 5%
Total N Current Mean Current Topbox Mean Percentile Rank - Industry - Government - Local (City / County / State)
Q00: On a five-point scale, where 5 means extremely satisfied and 1 means extremely dissatisfied, how satisfied are you with your organization as a place to work?
369 4.24 43 85
Q01: I know what is expected of me at work. 374 4.52 62 75
Q02: I have the materials and equipment I need to do my work right. 374 4.41 54 84
Q03: At work, I have the opportunity to do what I do best every day. 372 4.29 51 83
Q04: In the last seven days, I have received recognition or praise for doing good work. 364 3.70 39 68
Q05: My supervisor, or someone at work, seems to care about me as a person. 372 4.40 60 71
Q06: There is someone at work who encourages my development. 370 4.18 51 76
Q07: At work, my opinions seem to count. 373 3.89 37 70
Q08: The mission or purpose of my organization makes me feel my job is important. 373 4.23 49 70
Q09: My coworkers are committed to doing quality work. 374 4.24 47 71
Q10: I have a best friend at work. 359 3.70 38 69
Q11: In the last six months, someone at work has talked to me about my progress. 358 3.94 46 64
Q12: This last year, I have had opportunities at work to learn and grow. 366 4.33 57 79
* - Scores are not available due to data suppression. Not shown if n < 4 for Mean, Top Box, Verbatim Responses, and Sentiment, n < 10 for Frequency, or data is unavailable. Mean Percentile Rank is being calculated against other workgroup scores in the Industry - Government - Local (City / County / State) database.
EMPLOYEE ENGAGEMENT REPORT | 2019 EMPLOYEE ENGAGEMENT SURVEY
ALL - ALL | SEP 27, 2019 - OCT 12, 2019
Copyright 2018 Gallup, Inc. All rights reserved.Copyright © 1993-1998 Gallup, Inc. All rights reserved. The Gallup Q12 items are Gallup proprietary information and are protected by law. You may notadminister a survey with the Q12 items or reproduce them without consent from Gallup.
1
10Overall Results2019 Employee Engagement Report
Overall Results - City of SouthlakePercentile range in Gallup Database | | | |<25 ≥9025-49 50-74 75-89
79%374 of 475
Participation

Gran
d M
ean
Q00
. Ove
rall
Satis
facti
on
Q01
. Kno
w W
hat’s
Ex
pect
ed
Q02
. Mat
eria
ls an
d Eq
uipm
ent
Q03
. Opp
ortu
nity
to
do
Best
Q04
. Rec
ogni
tion
Q05
. Car
es A
bout
Me
Q06
. Dev
elop
men
t
Q07
. Opi
nion
s Cou
nt
Q08
. Miss
ion/
Purp
ose
Q09
. Com
mitt
ed
to Q
ualit
y
Q10
. Bes
t Frie
nd
Q11
. Pro
gres
s
Q12
. Lea
rn a
nd G
row
Overall 4.15 4.24 4.52 4.41 4.29 3.70 4.40 4.18 3.89 4.23 4.24 3.70 3.94 4.33
City Manager's Office 4.29 4.25 4.50 4.44 4.31 3.75 4.56 4.56 4.00 4.06 4.44 3.81 4.40 4.67
City Secretary's Office and HR 4.56 4.50 4.90 4.70 4.50 4.80 4.80 4.50 4.60 4.70 4.60 4.00 4.10 4.50
Community Services 4.01 4.22 4.51 4.44 4.32 3.38 4.26 4.02 3.83 3.96 4.01 3.53 3.53 4.32
Finance and Technology 3.98 4.03 4.30 4.00 4.09 3.58 4.36 3.88 3.70 4.00 4.21 3.81 3.88 3.94
Fire Department 3.91 3.90 4.26 4.40 3.81 3.46 4.19 3.90 3.33 4.19 3.96 3.41 3.89 4.10
Library 4.30 4.15 4.62 4.08 4.08 4.00 4.46 4.85 4.15 4.31 4.08 4.00 4.50 4.46
Planning and Development 4.29 4.56 4.83 4.61 4.67 3.76 4.50 4.00 3.94 4.44 4.83 3.82 3.82 4.28
Police Department 4.43 4.59 4.66 4.53 4.65 3.94 4.59 4.43 4.36 4.57 4.53 4.15 4.14 4.60
Public Works 4.26 4.24 4.66 4.40 4.40 4.00 4.52 4.42 3.98 4.36 4.34 3.48 4.14 4.42
.
11Overall Results2019 Employee Engagement Report
Overall Results - Heat Map by DepartmentPercentile range in Gallup Database | | | |<25 ≥9025-49 50-74 75-89

Results by Department

Q12 Mean Total N Current Mean Last Mean Change Engagement Index
The Gallup Q12 score represents the average of the scores of 12 items that Gallup has consistently found to measure employee engagement as linked to business outcomes.
16 * *
Engagement Index is unavailable for the currently selected scorecard.
Total N Current Mean Current Topbox Mean Percentile Rank - Industry - Government - Local (City / County / State)
Q00: On a five-point scale, where 5 means extremely satisfied and 1 means extremely dissatisfied, how satisfied are you with your organization as a place to work?
16 4.25 44 88
Q01: I know what is expected of me at work. 16 4.50 56 75
Q02: I have the materials and equipment I need to do my work right. 16 4.44 50 86
Q03: At work, I have the opportunity to do what I do best every day. 16 4.31 44 83
Q04: In the last seven days, I have received recognition or praise for doing good work. 16 3.75 38 72
Q05: My supervisor, or someone at work, seems to care about me as a person. 16 4.56 75 80
Q06: There is someone at work who encourages my development. 16 4.56 63 92
Q07: At work, my opinions seem to count. 16 4.00 38 79
Q08: The mission or purpose of my organization makes me feel my job is important. 16 4.06 38 60
Q09: My coworkers are committed to doing quality work. 16 4.44 50 83
Q10: I have a best friend at work. 16 3.81 38 77
Q11: In the last six months, someone at work has talked to me about my progress. 15 4.40 60 84
Q12: This last year, I have had opportunities at work to learn and grow. 15 4.67 73 92
* - Scores are not available due to data suppression. Not shown if n < 4 for Mean, Top Box, Verbatim Responses, and Sentiment, n < 10 for Frequency, or data is unavailable. Mean Percentile Rank is being calculated against other workgroup scores in the Industry - Government - Local (City / County / State) database.
EMPLOYEE ENGAGEMENT REPORT | 2019 EMPLOYEE ENGAGEMENT SURVEY
DEPARTMENT - CITY MANAGER'S OFFICE | SEP 27, 2019 - OCT 12, 2019
Copyright 2018 Gallup, Inc. All rights reserved.Copyright © 1993-1998 Gallup, Inc. All rights reserved. The Gallup Q12 items are Gallup proprietary information and are protected by law. You may notadminister a survey with the Q12 items or reproduce them without consent from Gallup.
1
13Overall Results2019 Employee Engagement Report
City Manager's OfficePercentile range in Gallup Database | | | |<25 ≥9025-49 50-74 75-89
94%16 of 17
Participation

Q12 Mean Total N Current Mean Last Mean Change Engagement Index
The Gallup Q12 score represents the average of the scores of 12 items that Gallup has consistently found to measure employee engagement as linked to business outcomes.
10 * *
Engagement Index is unavailable for the currently selected scorecard.
Total N Current Mean Current Topbox Mean Percentile Rank - Industry - Government - Local (City / County / State)
Q00: On a five-point scale, where 5 means extremely satisfied and 1 means extremely dissatisfied, how satisfied are you with your organization as a place to work?
10 4.50 60 96
Q01: I know what is expected of me at work. 10 4.90 90 96
Q02: I have the materials and equipment I need to do my work right. 10 4.70 70 94
Q03: At work, I have the opportunity to do what I do best every day. 10 4.50 60 92
Q04: In the last seven days, I have received recognition or praise for doing good work. 10 4.80 80 98
Q05: My supervisor, or someone at work, seems to care about me as a person. 10 4.80 80 93
Q06: There is someone at work who encourages my development. 10 4.50 80 91
Q07: At work, my opinions seem to count. 10 4.60 80 96
Q08: The mission or purpose of my organization makes me feel my job is important. 10 4.70 70 93
Q09: My coworkers are committed to doing quality work. 10 4.60 80 92
Q10: I have a best friend at work. 10 4.00 40 86
Q11: In the last six months, someone at work has talked to me about my progress. 10 4.10 50 72
Q12: This last year, I have had opportunities at work to learn and grow. 10 4.50 80 88
* - Scores are not available due to data suppression. Not shown if n < 4 for Mean, Top Box, Verbatim Responses, and Sentiment, n < 10 for Frequency, or data is unavailable. Mean Percentile Rank is being calculated against other workgroup scores in the Industry - Government - Local (City / County / State) database.
EMPLOYEE ENGAGEMENT REPORT | 2019 EMPLOYEE ENGAGEMENT SURVEY
DEPARTMENT - CITY SECRETARY'S OFFICE AND HR | SEP 27, 2019 - OCT 12, 2019
Copyright 2018 Gallup, Inc. All rights reserved.Copyright © 1993-1998 Gallup, Inc. All rights reserved. The Gallup Q12 items are Gallup proprietary information and are protected by law. You may notadminister a survey with the Q12 items or reproduce them without consent from Gallup.
1
14Overall Results2019 Employee Engagement Report
City Secretary's Office and HRPercentile range in Gallup Database | | | |<25 ≥9025-49 50-74 75-89
100%10 of 10
Participation

Q12 Mean Total N Current Mean Last Mean Change Engagement Index
The Gallup Q12 score represents the average of the scores of 12 items that Gallup has consistently found to measure employee engagement as linked to business outcomes.
91 * * Engaged: 44%
Total N Current Mean Current Topbox Mean Percentile Rank - Industry - Government - Local (City / County / State)
Q00: On a five-point scale, where 5 means extremely satisfied and 1 means extremely dissatisfied, how satisfied are you with your organization as a place to work?
89 4.22 36 85
Q01: I know what is expected of me at work. 91 4.51 65 75
Q02: I have the materials and equipment I need to do my work right. 91 4.44 57 86
Q03: At work, I have the opportunity to do what I do best every day. 91 4.32 49 83
Q04: In the last seven days, I have received recognition or praise for doing good work. 86 3.38 31 54
Q05: My supervisor, or someone at work, seems to care about me as a person. 91 4.26 56 63
Q06: There is someone at work who encourages my development. 89 4.02 46 72
Q07: At work, my opinions seem to count. 90 3.83 31 68
Q08: The mission or purpose of my organization makes me feel my job is important. 91 3.96 38 48
Q09: My coworkers are committed to doing quality work. 91 4.01 44 59
Q10: I have a best friend at work. 88 3.53 36 62
Q11: In the last six months, someone at work has talked to me about my progress. 81 3.53 35 47
Q12: This last year, I have had opportunities at work to learn and grow. 87 4.32 55 78
* - Scores are not available due to data suppression. Not shown if n < 4 for Mean, Top Box, Verbatim Responses, and Sentiment, n < 10 for Frequency, or data is unavailable. Mean Percentile Rank is being calculated against other workgroup scores in the Industry - Government - Local (City / County / State) database.
EMPLOYEE ENGAGEMENT REPORT | 2019 EMPLOYEE ENGAGEMENT SURVEY
DEPARTMENT - COMMUNITY SERVICES | SEP 27, 2019 - OCT 12, 2019
Copyright 2018 Gallup, Inc. All rights reserved.Copyright © 1993-1998 Gallup, Inc. All rights reserved. The Gallup Q12 items are Gallup proprietary information and are protected by law. You may notadminister a survey with the Q12 items or reproduce them without consent from Gallup.
1
15Overall Results2019 Employee Engagement Report
Community ServicesPercentile range in Gallup Database | | | |<25 ≥9025-49 50-74 75-89
51%91 of 179
Participation

Q12 Mean Total N Current Mean Last Mean Change Engagement Index
The Gallup Q12 score represents the average of the scores of 12 items that Gallup has consistently found to measure employee engagement as linked to business outcomes.
33 * * Engaged: 42%
Total N Current Mean Current Topbox Mean Percentile Rank - Industry - Government - Local (City / County / State)
Q00: On a five-point scale, where 5 means extremely satisfied and 1 means extremely dissatisfied, how satisfied are you with your organization as a place to work?
33 4.03 33 77
Q01: I know what is expected of me at work. 33 4.30 45 53
Q02: I have the materials and equipment I need to do my work right. 33 4.00 30 63
Q03: At work, I have the opportunity to do what I do best every day. 33 4.09 48 69
Q04: In the last seven days, I have received recognition or praise for doing good work. 33 3.58 33 64
Q05: My supervisor, or someone at work, seems to care about me as a person. 33 4.36 64 67
Q06: There is someone at work who encourages my development. 33 3.88 42 61
Q07: At work, my opinions seem to count. 33 3.70 36 58
Q08: The mission or purpose of my organization makes me feel my job is important. 33 4.00 45 59
Q09: My coworkers are committed to doing quality work. 33 4.21 42 70
Q10: I have a best friend at work. 31 3.81 45 77
Q11: In the last six months, someone at work has talked to me about my progress. 33 3.88 48 63
Q12: This last year, I have had opportunities at work to learn and grow. 33 3.94 48 55
* - Scores are not available due to data suppression. Not shown if n < 4 for Mean, Top Box, Verbatim Responses, and Sentiment, n < 10 for Frequency, or data is unavailable. Mean Percentile Rank is being calculated against other workgroup scores in the Industry - Government - Local (City / County / State) database.
EMPLOYEE ENGAGEMENT REPORT | 2019 EMPLOYEE ENGAGEMENT SURVEY
DEPARTMENT - FINANCE & TECHNOLOGY | SEP 27, 2019 - OCT 12, 2019
Copyright 2018 Gallup, Inc. All rights reserved.Copyright © 1993-1998 Gallup, Inc. All rights reserved. The Gallup Q12 items are Gallup proprietary information and are protected by law. You may notadminister a survey with the Q12 items or reproduce them without consent from Gallup.
1
16Overall Results2019 Employee Engagement Report
Finance and TechnologyPercentile range in Gallup Database | | | |<25 ≥9025-49 50-74 75-89
97%33 of 34
Participation

Q12 Mean Total N Current Mean Last Mean Change Engagement Index
The Gallup Q12 score represents the average of the scores of 12 items that Gallup has consistently found to measure employee engagement as linked to business outcomes.
70 * * Engaged: 39%
Total N Current Mean Current Topbox Mean Percentile Rank - Industry - Government - Local (City / County / State)
Q00: On a five-point scale, where 5 means extremely satisfied and 1 means extremely dissatisfied, how satisfied are you with your organization as a place to work?
70 3.90 26 65
Q01: I know what is expected of me at work. 70 4.26 41 50
Q02: I have the materials and equipment I need to do my work right. 70 4.40 50 84
Q03: At work, I have the opportunity to do what I do best every day. 70 3.81 27 48
Q04: In the last seven days, I have received recognition or praise for doing good work. 70 3.46 27 58
Q05: My supervisor, or someone at work, seems to care about me as a person. 69 4.19 45 55
Q06: There is someone at work who encourages my development. 70 3.90 34 62
Q07: At work, my opinions seem to count. 70 3.33 16 40
Q08: The mission or purpose of my organization makes me feel my job is important. 70 4.19 47 66
Q09: My coworkers are committed to doing quality work. 70 3.96 27 49
Q10: I have a best friend at work. 69 3.41 20 55
Q11: In the last six months, someone at work has talked to me about my progress. 70 3.89 36 63
Q12: This last year, I have had opportunities at work to learn and grow. 70 4.10 43 66
* - Scores are not available due to data suppression. Not shown if n < 4 for Mean, Top Box, Verbatim Responses, and Sentiment, n < 10 for Frequency, or data is unavailable. Mean Percentile Rank is being calculated against other workgroup scores in the Industry - Government - Local (City / County / State) database.
EMPLOYEE ENGAGEMENT REPORT | 2019 EMPLOYEE ENGAGEMENT SURVEY
DEPARTMENT - FIRE DEPARTMENT | SEP 27, 2019 - OCT 12, 2019
Copyright 2018 Gallup, Inc. All rights reserved.Copyright © 1993-1998 Gallup, Inc. All rights reserved. The Gallup Q12 items are Gallup proprietary information and are protected by law. You may notadminister a survey with the Q12 items or reproduce them without consent from Gallup.
1
17Overall Results2019 Employee Engagement Report
Fire DepartmentPercentile range in Gallup Database | | | |<25 ≥9025-49 50-74 75-89
97%70 of 72
Participation
Q12 Mean Total N Current Mean Last Mean Change Engagement Index
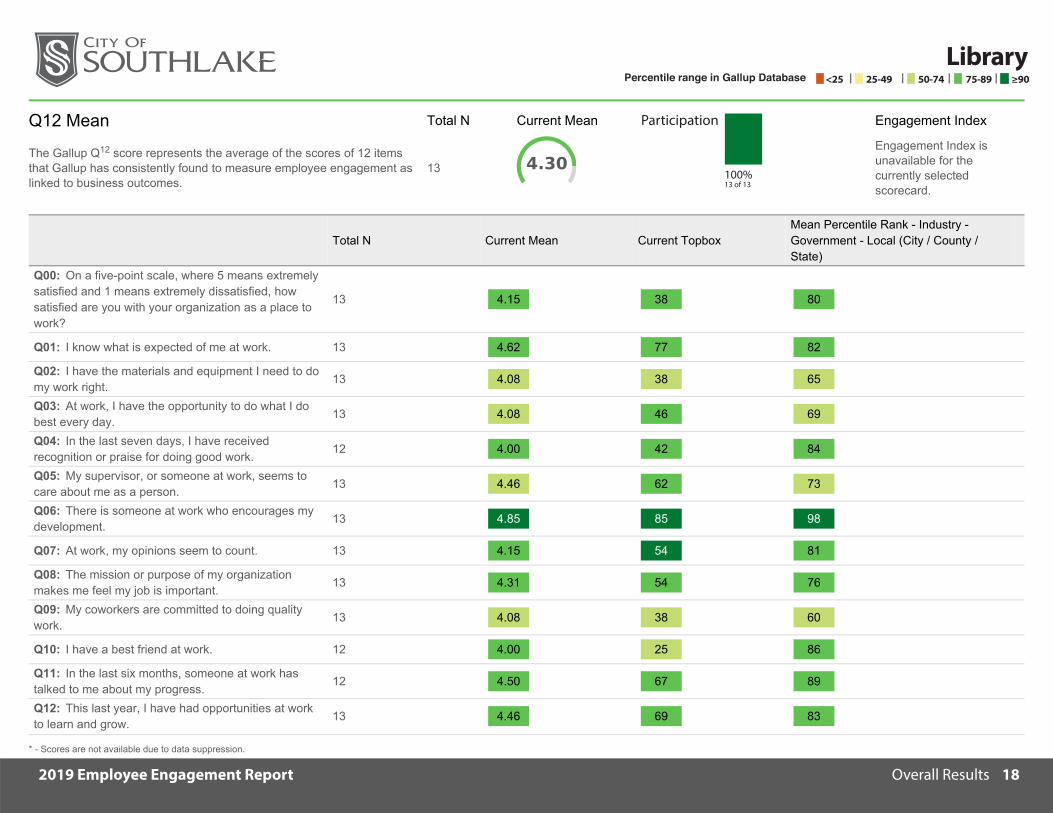
The Gallup Q12 score represents the average of the scores of 12 items that Gallup has consistently found to measure employee engagement as linked to business outcomes.
13 * *
Engagement Index is unavailable for the currently selected scorecard.
Total N Current Mean Current Topbox Mean Percentile Rank - Industry - Government - Local (City / County / State)
Q00: On a five-point scale, where 5 means extremely satisfied and 1 means extremely dissatisfied, how satisfied are you with your organization as a place to work?
13 4.15 38 80
Q01: I know what is expected of me at work. 13 4.62 77 82
Q02: I have the materials and equipment I need to do my work right. 13 4.08 38 65
Q03: At work, I have the opportunity to do what I do best every day. 13 4.08 46 69
Q04: In the last seven days, I have received recognition or praise for doing good work. 12 4.00 42 84
Q05: My supervisor, or someone at work, seems to care about me as a person. 13 4.46 62 73
Q06: There is someone at work who encourages my development. 13 4.85 85 98
Q07: At work, my opinions seem to count. 13 4.15 54 81
Q08: The mission or purpose of my organization makes me feel my job is important. 13 4.31 54 76
Q09: My coworkers are committed to doing quality work. 13 4.08 38 60
Q10: I have a best friend at work. 12 4.00 25 86
Q11: In the last six months, someone at work has talked to me about my progress. 12 4.50 67 89
Q12: This last year, I have had opportunities at work to learn and grow. 13 4.46 69 83
* - Scores are not available due to data suppression. Not shown if n < 4 for Mean, Top Box, Verbatim Responses, and Sentiment, n < 10 for Frequency, or data is unavailable. Mean Percentile Rank is being calculated against other workgroup scores in the Industry - Government - Local (City / County / State) database.
EMPLOYEE ENGAGEMENT REPORT | 2019 EMPLOYEE ENGAGEMENT SURVEY
DEPARTMENT - LIBRARY | SEP 27, 2019 - OCT 12, 2019
Copyright 2018 Gallup, Inc. All rights reserved.Copyright © 1993-1998 Gallup, Inc. All rights reserved. The Gallup Q12 items are Gallup proprietary information and are protected by law. You may notadminister a survey with the Q12 items or reproduce them without consent from Gallup.
1
18Overall Results2019 Employee Engagement Report
LibraryPercentile range in Gallup Database | | | |<25 ≥9025-49 50-74 75-89
100%13 of 13
Participation

Q12 Mean Total N Current Mean Last Mean Change Engagement Index
The Gallup Q12 score represents the average of the scores of 12 items that Gallup has consistently found to measure employee engagement as linked to business outcomes.
18 * *
Engagement Index is unavailable for the currently selected scorecard.
Total N Current Mean Current Topbox Mean Percentile Rank - Industry - Government - Local (City / County / State)
Q00: On a five-point scale, where 5 means extremely satisfied and 1 means extremely dissatisfied, how satisfied are you with your organization as a place to work?
18 4.56 61 96
Q01: I know what is expected of me at work. 18 4.83 83 95
Q02: I have the materials and equipment I need to do my work right. 18 4.61 67 93
Q03: At work, I have the opportunity to do what I do best every day. 18 4.67 72 95
Q04: In the last seven days, I have received recognition or praise for doing good work. 17 3.76 59 72
Q05: My supervisor, or someone at work, seems to care about me as a person. 18 4.50 61 80
Q06: There is someone at work who encourages my development. 18 4.00 50 71
Q07: At work, my opinions seem to count. 18 3.94 33 71
Q08: The mission or purpose of my organization makes me feel my job is important. 18 4.44 67 83
Q09: My coworkers are committed to doing quality work. 18 4.83 89 98
Q10: I have a best friend at work. 17 3.82 53 77
Q11: In the last six months, someone at work has talked to me about my progress. 17 3.82 53 60
Q12: This last year, I have had opportunities at work to learn and grow. 18 4.28 44 76
* - Scores are not available due to data suppression. Not shown if n < 4 for Mean, Top Box, Verbatim Responses, and Sentiment, n < 10 for Frequency, or data is unavailable. Mean Percentile Rank is being calculated against other workgroup scores in the Industry - Government - Local (City / County / State) database.
EMPLOYEE ENGAGEMENT REPORT | 2019 EMPLOYEE ENGAGEMENT SURVEY
DEPARTMENT - PLANNING & DEVELOPMENT | SEP 27, 2019 - OCT 12, 2019
Copyright 2018 Gallup, Inc. All rights reserved.Copyright © 1993-1998 Gallup, Inc. All rights reserved. The Gallup Q12 items are Gallup proprietary information and are protected by law. You may notadminister a survey with the Q12 items or reproduce them without consent from Gallup.
1
19Overall Results2019 Employee Engagement Report
Planning and DevelopmentPercentile range in Gallup Database | | | |<25 ≥9025-49 50-74 75-89
86%18 of 21
Participation

Q12 Mean Total N Current Mean Last Mean Change Engagement Index
The Gallup Q12 score represents the average of the scores of 12 items that Gallup has consistently found to measure employee engagement as linked to business outcomes.
70 * * Engaged: 70%
Total N Current Mean Current Topbox Mean Percentile Rank - Industry - Government - Local (City / County / State)
Q00: On a five-point scale, where 5 means extremely satisfied and 1 means extremely dissatisfied, how satisfied are you with your organization as a place to work?
69 4.59 62 97
Q01: I know what is expected of me at work. 70 4.66 70 83
Q02: I have the materials and equipment I need to do my work right. 70 4.53 60 90
Q03: At work, I have the opportunity to do what I do best every day. 68 4.65 72 95
Q04: In the last seven days, I have received recognition or praise for doing good work. 69 3.94 51 78
Q05: My supervisor, or someone at work, seems to care about me as a person. 70 4.59 70 81
Q06: There is someone at work who encourages my development. 69 4.43 61 87
Q07: At work, my opinions seem to count. 70 4.36 56 89
Q08: The mission or purpose of my organization makes me feel my job is important. 69 4.57 61 89
Q09: My coworkers are committed to doing quality work. 70 4.53 57 89
Q10: I have a best friend at work. 68 4.15 54 87
Q11: In the last six months, someone at work has talked to me about my progress. 69 4.14 61 73
Q12: This last year, I have had opportunities at work to learn and grow. 67 4.60 70 90
* - Scores are not available due to data suppression. Not shown if n < 4 for Mean, Top Box, Verbatim Responses, and Sentiment, n < 10 for Frequency, or data is unavailable. Mean Percentile Rank is being calculated against other workgroup scores in the Industry - Government - Local (City / County / State) database.
EMPLOYEE ENGAGEMENT REPORT | 2019 EMPLOYEE ENGAGEMENT SURVEY
DEPARTMENT - POLICE DEPARTMENT | SEP 27, 2019 - OCT 12, 2019
Copyright 2018 Gallup, Inc. All rights reserved.Copyright © 1993-1998 Gallup, Inc. All rights reserved. The Gallup Q12 items are Gallup proprietary information and are protected by law. You may notadminister a survey with the Q12 items or reproduce them without consent from Gallup.
1
20Overall Results2019 Employee Engagement Report
Police DepartmentPercentile range in Gallup Database | | | |<25 ≥9025-49 50-74 75-89
97%70 of 72
Participation
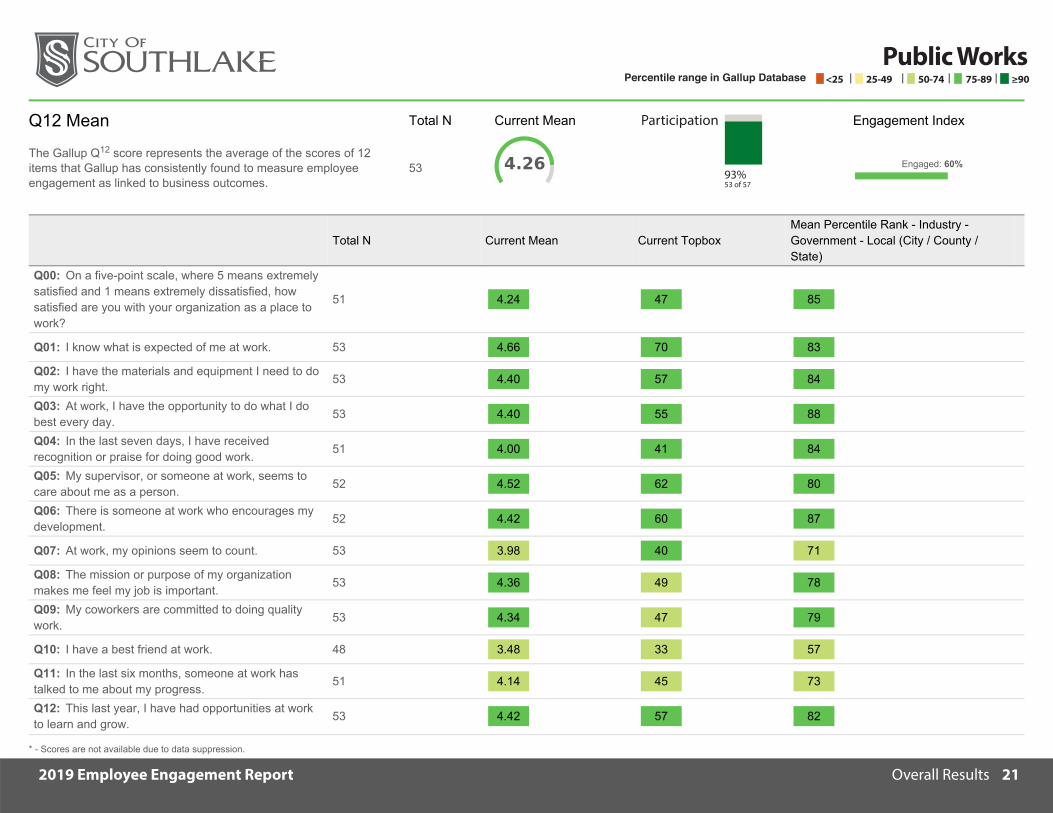
Q12 Mean Total N Current Mean Last Mean Change Engagement Index
The Gallup Q12 score represents the average of the scores of 12 items that Gallup has consistently found to measure employee engagement as linked to business outcomes.
53 * * Engaged: 60%
Total N Current Mean Current Topbox Mean Percentile Rank - Industry - Government - Local (City / County / State)
Q00: On a five-point scale, where 5 means extremely satisfied and 1 means extremely dissatisfied, how satisfied are you with your organization as a place to work?
51 4.24 47 85
Q01: I know what is expected of me at work. 53 4.66 70 83
Q02: I have the materials and equipment I need to do my work right. 53 4.40 57 84
Q03: At work, I have the opportunity to do what I do best every day. 53 4.40 55 88
Q04: In the last seven days, I have received recognition or praise for doing good work. 51 4.00 41 84
Q05: My supervisor, or someone at work, seems to care about me as a person. 52 4.52 62 80
Q06: There is someone at work who encourages my development. 52 4.42 60 87
Q07: At work, my opinions seem to count. 53 3.98 40 71
Q08: The mission or purpose of my organization makes me feel my job is important. 53 4.36 49 78
Q09: My coworkers are committed to doing quality work. 53 4.34 47 79
Q10: I have a best friend at work. 48 3.48 33 57
Q11: In the last six months, someone at work has talked to me about my progress. 51 4.14 45 73
Q12: This last year, I have had opportunities at work to learn and grow. 53 4.42 57 82
* - Scores are not available due to data suppression. Not shown if n < 4 for Mean, Top Box, Verbatim Responses, and Sentiment, n < 10 for Frequency, or data is unavailable. Mean Percentile Rank is being calculated against other workgroup scores in the Industry - Government - Local (City / County / State) database.
EMPLOYEE ENGAGEMENT REPORT | 2019 EMPLOYEE ENGAGEMENT SURVEY
DEPARTMENT - PUBLIC WORKS | SEP 27, 2019 - OCT 12, 2019
Copyright 2018 Gallup, Inc. All rights reserved.Copyright © 1993-1998 Gallup, Inc. All rights reserved. The Gallup Q12 items are Gallup proprietary information and are protected by law. You may notadminister a survey with the Q12 items or reproduce them without consent from Gallup.
1
21Overall Results2019 Employee Engagement Report
Public WorksPercentile range in Gallup Database | | | |<25 ≥9025-49 50-74 75-89
93%53 of 57
Participation

Engagement Insights

232019 Employee Engagement Report
Q00 - Overall SatisfactionHow satisfied are you with the City of Southlake as a place to work?
Gallup Says
People who are satisfied with their companies are proud, are more likely to stay, and are advocates of their companies as places to work and of their products and services. Overall satisfaction relates to outcomes such as retention, productivity, profitability, and, to varying degrees, customer engagement.
The two Q12 items most consistently related to satisfaction with one’s company are mission/purpose (Q08) and opinions count (Q07).
If scores for this item are high, employees feel connected to the company. They may be proud of what the company stands for or what it produces or proud of the company’s reputation. These people may stay with the job longer because of their satisfaction with or loyalty to the company.
If scores are low, employees will need an accumulation of positive experiences before their perceptions of the company will change.
Q01 - Know What’s ExpectedI know what’s expected of me at work.
Gallup Says
A clear set of expectations is the most basic of both an employee’s needs and a manager’s responsibilities. It is also critical to performance. Yet approximately half of American workers are unclear about what they are supposed to do at work.
Knowing what is expected should transcend a job description. Ideally, expectations should be a detailed understanding of how one employee’s duties fit in with what everyone else does and how those expectations shift when circumstances change.
Gallup’s research has indicated that knowing expectations predicts future patterns of turnover, customer engagement, safety incidents, and productivity. Groups that have high scores on this item are more productive, more profitable, more creative, they have more happy customers, and fewer on-the-job accidents. A set of clearly defined expectations positively correlates with outstanding performance.
Leaders focused on this element can ask themselves:
• Are my team members always clear about what to do and when to do it?
• What do I hope for beyond the basics?
• How do I measure my teams’ basic expectations?
• How often do I sit down with my team members to discuss their progress?
Q02 - Materials and EquipmentI have the materials I need to do my job right.
Gallup Says
When managers ask employees to accomplish a goal but do not provide them with the necessary resources, credibility is lost. Great managers discover the needs of each person in relation to the outcomes they are attempting to achieve and position resources accordingly.
One of the strongest predictors of customer engagement, this element also predicts employee retention, safety, and productivity. Employee health also is impacted by this
element. Having the right tools for the job means that employees will be safer and healthier.
The secret lies in the involvement, judgment and action of frontline managers. Getting people the tools they need shows employees that their work is valued and that the organization supports them. Great managers help employees see how their requests for materials and equipment connect to important organizational outcomes.
Leaders focused on this element can ask themselves:
• Do my team members have all of the things they need to meet the expectations that I have set for them?
• Does my team understand how to handle requests for materials and equipment when the business case is strong?
• Do I provide honest and acceptable explanations when requests cannot be fulfilled?
Q03 - Opportunity to do BestAt work, I have the opportunity to do what I do best every day.
Gallup Says
One of the most powerful benefits a manager can offer their employees is to place them in roles that allow them to apply their greatest strengths, skills, and knowledge to their work every day. Managers should strive to help employees mold their jobs around the way they work most naturally and maximize the frequency of optimal experiences in which they “lose themselves” in their work.
This management strategy is a powerful motivational tool and will often see employees excelling at their
Engagement Insights
ENGAGEMENT INSIGHTS

242019 Employee Engagement Report
tasks. When an employee’s talents are aligned with their job demands, the organization reaps the benefits of more revenue, fewer unscheduled absences, and lower employee turnover.
Helping people get into roles in which they can most fully use their inherent talents and strengths is the ongoing work of great managers. Learning about individual differences through experience and assessment can help the manager position people efficiently within and across roles and remove barriers to high performance.
Leaders focused on this element can ask themselves:
• Do I know what each individual enjoys most about his or her work every day?
• Are there things that are keeping or distracting individuals from being as productive as they could be?
• Have I aligned each person to do what he or she does best in the role every day?
• What can I do to make it easier for individuals to do what they do best every day?
Q04 - Recognition In the last seven days, I have received recognition or praise for doing good work.
Gallup Says
Gallup’s data reveal that the key to effective recognition is that it is honest and based on outcomes that are measurable. Employees who are praised and recognized tend to increase their individual productivity, boost engagement among their colleagues, are more likely to stay with their
organization, and receive higher customer loyalty and customer satisfaction.
Managers should see recognition as a communication tool. Offering employees praise and recognition can demonstrate what is important and help an employee see their value within the scope of the larger organization.
An ongoing management challenge is to understand how each person prefers to be recognized, to make recognition objective and real by basing it on performance, and to do it frequently.
Leaders focused on this element can ask themselves:
• Do I regularly praise my employees for their efforts?
• Have I created an environment in which my employees are encouraged to recognize one another for doing good work?
• Do I know how each employee likes to receive recognition? Given this knowledge, do I individualize my approach to providing that recognition?
• How often do I celebrate my team’s success? Do I make it a priority?
Q05 - Cares About MeMy supervisor, or someone at work, seems to care about me as a person.
Gallup Says
“Caring means setting each person up for success.” It is important for employees to know that they are more than just a number in the system. They must hold the perception that their managers view them as people first, employees second.
Managers should strive to create a caring environment in which their employees feel safe enough to be innovative, to share information, to trust and support one another. Gallup has observed that employees generally don’t leave organizations; they leave managers and supervisors. Organizations that score higher in this element often have a low-turnover rate.
Leaders focused on this element can ask themselves:
• Do my employees believe I care about them as people?
• What am I doing to increase my understanding and appreciation of each individual on the team?
• How do I let team members know that I am here to support them?
Q06 - Development There is someone at work who encourages my development.
Gallup Says
Development is an element that requires commitment from both manager and employee. Employees set personal goals for their development and managers invest in their employees by fostering a culture of mentorship. This element requires that managers personally invest in their employees. Gallup reports that 9 out of 10 employees who report having someone at work who encourages their development are classified as “engaged.”
How employees are coached can influence how they perceive their future. If the manager is helping the employee improve as an individual by providing opportunities that are in sync with the employee’s talents, both the employee and the company will benefit.
Engagement Insights
ENGAGEMENT INSIGHTS

252019 Employee Engagement Report
Leaders focused on this element can ask themselves:
• Do I understand which development opportunities are most important to each team member?
• Do I understand which opportunities are most relevant to each team member’s career growth?
• Have I created shared goals and established expectations with my team?
• Do I regularly celebrate my employees’ successes and achievements?
Q07 - Opinions CountAt work, my opinions seem to count.
Gallup Says
This element largely relates to an employee’s sense of belonging. Employees want to know that their opinions are valued and that they are making significant contributions to the organization. It is also strongly tied to innovation. Asking for employee input often leads to better decision making, and an open exchange of ideas can help the organization find more effective or efficient ways to serve the Southlake community.
Gallup’s research has found that there is no significant correlation between compensation and employee productivity or engagement, but there is a positive correlation between acknowledging employee opinions and these particular outcomes. When employees feel valued and listened to, organizations will find lower levels of absenteeism, fewer safety incidents, and improved efficiency and quality of work.
Asking for the employee’s input and considering that input can often lead to better decision-making. This is because employees are often closer to many factors that affect the overall system than the manager is,
whether that is the customer or the products they are producing every day. In addition, when employees feel they are involved in decisions, they take greater ownership of the outcomes.
Leaders focused on this element can ask themselves:
• How do I show my appreciation for employees’ opinions and ideas?
• What do I do with my employees’ ideas or opinions?
• How do I follow up on my employees’ feedback?
• How often do I ask how my employees feel about their work?
• How am I making sure my team members feel comfortable sharing their feedback or ideas with me?
Q08 - Mission/PurposeThe mission or purpose of my organization makes me feel my job is important.
Gallup Says
If a job were just a job, it really wouldn’t matter where someone worked. A good paycheck, decent benefits, reasonable hours, and comfortable working conditions would be enough. However, having large proportions of employees who are there just to draw a paycheck and who don’t care about the larger purpose of the business can be a tremendous drag on retention, customer attitudes, safety, and productivity.
When people work for an organization, they want that organization’s mission to resonate with their world-view. As a rule of thumb, most individuals want to do something they believe in and look forward to doing every day. Employees are motivated to work for an organization that shares their values.
Strong managers can motivate employees by clarifying the organization’s mission and connecting it directly to the work that they do on a daily basis. By doing this, employees will see how their work contributes to the organization and to society as a whole.
Leaders focused on this element can ask themselves:
• Does my team understand the organization’s mission or purpose?
• How does my team live out the organization’s purpose on a daily basis?
• How am I living the organization’s mission or purpose?
• How am I setting priorities based on the organization’s mission or purpose?
Q09 - Committed to QualityMy coworkers are committed to doing quality work.
Gallup Says
It is important for employees to know that their coworkers share a commitment to quality. If one person on a team is dragging their feet, it will dramatically impact the effectiveness, performance and morale of the whole team.
When standards are clearly defined, team members gain a greater sense of accountability in their work ethic and will trust each other more. Managers should strive to provide common goals and metrics for quality as well as increasing opportunities for team members to work together as a team.
The end result will be an environment that fosters honest and open communication. Organizations that do well in this element will excel with internal and external customers, will be less likely to have turnover, and will be more productive overall.
Engagement Insights
ENGAGEMENT INSIGHTS

262019 Employee Engagement Report
Leaders focused on this element can ask themselves:
• How am I selecting and recognizing hardworking employees?
• How do I define quality work? Does my team know what quality looks like?
• Have I talked with my team members individually about their quality goals?
Q10 - Best FriendI have a best friend at work.
Gallup Says
Human interaction is a human need. When employees have trusted relationships at work, their lives are enriched. Some people feel that friendship is something that should be restricted to their personal life outside the workplace. If friendship is a gateway to trust, then it will lead to collaboration and teamwork.
Managers can encourage people to get to know one another. This can influence communication, trust, and affect other outcomes.
This element is noted to be one of the more unique elements within the Q12. Some employers have asked to administer the Q12 without this question. Gallup however maintains that this element is important to employee engagement, as it has clear ties to customer loyalty, productivity, and safety.
Leaders focused on this element can ask themselves:
• Do my employees trust one another and me?
• Does my team work well together?
• How am I building friendships at work?
• How do I create more opportunities to foster friendships?
Q11 - ProgressIn the last six months, someone at work has talked to me about my progress.
Gallup Says
Employees need to understand how they are doing and where they could improve. Managers should seek to provide employees with objective feedback that helps them develop their skills and enhance their strengths in order to become more productive.
Once a manager identifies an employee’s strength, they can work together to create a development plan that supports the individual’s full potential. Performance reviews and personal development plans can enable employees to make their greatest contribution to the organization.
When individuals receive regular feedback on their progress, they are more likely to believe that they are properly compensated for their work, they are more likely to stay with the organization, and more than twice as likely to recommend the organization to their friends.
Providing a structured time to discuss each employee’s progress, achievements and goals is important for managers and employees. Great managers regularly meet with individuals, both to learn from them and to give them guidance. This give-and-take helps managers and employees make better decisions.
Leaders focused on this element can ask themselves:
• Do I regularly show my team members how far they have come in their professional development?
• How do I lead conversations about progress? Do I lead with positive intent and emphasize the employee is doing well, or do I tend to focus only on weaknesses?
• Am I helping my team understand its progress? How so?
Q12 - Learn and GrowThis last year, I have had opportunities at work to learn and grow.
Gallup Says
When employees feel they are learning and growing, they work harder and more efficiently. Encouraging team members to receive formal or informal educational opportunities enhances their performance particularly when these opportunities are based on each individual’s strengths and career aspirations. Furthermore, an organization’s growth hinges on employees’ capacity to learn and grow. Great managers choose training that will benefit the individual and the organization.
Teams should be encouraged to always strive to find more efficient or effective ways to work. Innovation comes with growth. Teams that score high on this element produce more innovative ideas, cultivate superior customer relationships, and have better financial metrics.
Leaders focused on this element can ask themselves:
• How am I creating an environment in which my employees can grow and develop?
• What have I done in the last six months to help my team learn and grow?
• What are my employees’ goals? Do I know them, and am I helping them actively achieve those goals?
Engagement Insights
ENGAGEMENT INSIGHTS

Taking Action

282019 Employee Engagement Report
Design an Action PlanStep 1: Identify a team performance goal.Any team throughout the City can decide to act on the Q12 results. The team can start by collaboratively identify their most important performance goal or challenge. This could be something like "reducing turnover," "creating a safer work environment," or "building trust and collaboration."
Use the following questions to direct the team conversation as you select a performance goal together:
• What are the three most important goals or challenges we face today?
• How would you prioritize these from most to least important to our team?
• Which goal should we focus on as a team? Where are we as a team relative to this goal?
Step 2: Select an engagement item. Considering survey results and the feedback received from employees, select the engagement item to focus on and identify actions and owners. Once the team has identified a performance goal to focus on, they will need to select the engagement item that, if acted on, will help them reach their performance goal.
For example, if a team has a goal to improve trust and collaboration and their score for Q10 (“I have a best friend at work.”) was relatively low, then this engagement item would be a great area of focus.
After selecting an engagement item, the team should brainstorm actions that they can take to improve on this engagement item and decide who can take ownership of these actions to keep the team aware of progress.
Use the following questions to guide this step of the conversation:
• Which engagement item do you think we should focus on to help us reach our performance goal?
• What actions do we need to take to have an effect on this engagement item?
• What three to four immediate actions should we focus on first? Who can take ownership of these actions? When can we complete these actions?
Recording action items and owners is critical for maintaining accountability.
Step 3: Review and recalibrate.Recurring conversations about the team’s engagement are a must. Managers should regularly follow up to evaluate progress, maintain accountability, and recalibrate as necessary.
Use the following questions during these discussions:
• Did we complete the action items we said we would?
• Did completing them make a difference?
Adjust your actions and owners as needed to ensure that your team is on track for success. Track performance measures that relate to your specific goals or engagement elements and measure engagement again using the Q12 survey to get a clearer picture of the team’s progress.
Taking Action
TAKING ACTION