2019-2021 interim financial report final
TRANSCRIPT

Interim Financial Report – 9 Months Ended March 31, 2020
Page 1
Executive Summary
On June 25, 2019 the City Council adopted Resolution CC 2019-38 approving a two-year budget for
the Fiscal Years 2019-2021 and appropriating the funds for the Fiscal Year ending June 30, 2020.
This interim financial report is prepared by the City of Glendora Finance division and contains
information related to the first year of the two-year budget on revenues/resources and
expenditures/uses for the 9 months ending March 31st, 2020.
Below are highlights of key changes impacting the presentation of this report compared to prior
years:
Transaction and Use Tax (Measure E): On March 5, 2019, Measure E was passed by the
residents of Glendora and became effective July 1, 2019. This 0.75% transaction and use tax is
estimated to raise approximately $5 million this fiscal year. This revenue source will be used to
maintain service levels and supplement capital outlay.
City Manager’s Reorganization Plan:
Approved in March 2019 and implemented with
the adopted budget and with subsequent
council action. The staffing reorganization
centralizes similar functions to improve
efficiencies and take advantage of upcoming
opportunities (e.g. Gold Line, future
development).
Pension Obligation Bond (POB): In
September 2019, the City issued approximately $64.4 million in POBs that provide long-term
cash flow savings over the next 25-years, when compared to the City’s annual payment to
CalPERS for the City’s’ unfunded accrued liability (UAL). Cash flow savings on the POB are
estimated at approximately $31.5 million over the life of the bonds and are included in the City’s
General Fund Five-Year Plan.
COVID-19 Pandemic: On March 17, Glendora issued a Local Emergency declaration in
response to the COVID-19 pandemic. As of March 19, all City of Glendora facilities were ordered
to temporarily close to protect the public and City staff, while still providing essential services.
This was preceded by the Governor’s Safe-At-Home orders, closing all non-essential retail
businesses within the definition of essential business. The impact of COVID-19 has caused
significant financial impacts to the City. Based on the information currently available the City
anticipates revenue shortfalls over the next two fiscal years of approximately $1.5-$3 million each
year. The current fiscal year impacts will be discussed throughout the report and will be more
prominent in the 4th quarter interim report.

Interim Financial Report – 9 Months Ended March 31, 2020
Page 2
Report Overview and Contents
The order in which the reports are presented goes from the most summarized perspective to the
most detailed. Below is a listing of the reports:
All Fund Types Summary of Revenues and Expenditures – This report provides
information in the most summarized format by types of funds.
General Fund Summary of Revenues and Expenditures – This report provides the
General Fund budget to actual status. The information is summarized showing the revenues
by major revenue category and expenditures by department/service area.
Activity Report by Fund – This report lists all the funds and shows the amended budget,
the actual activity and the percentage of the budget received or expended both revenues and
expenditures.
Revenue Detail Report (All Funds) – This report provides the status of all revenues in the
City comparing actual revenues to the approved budget. The report shows the prior year-to-
date (YTD) actual revenues for comparison with the current year.
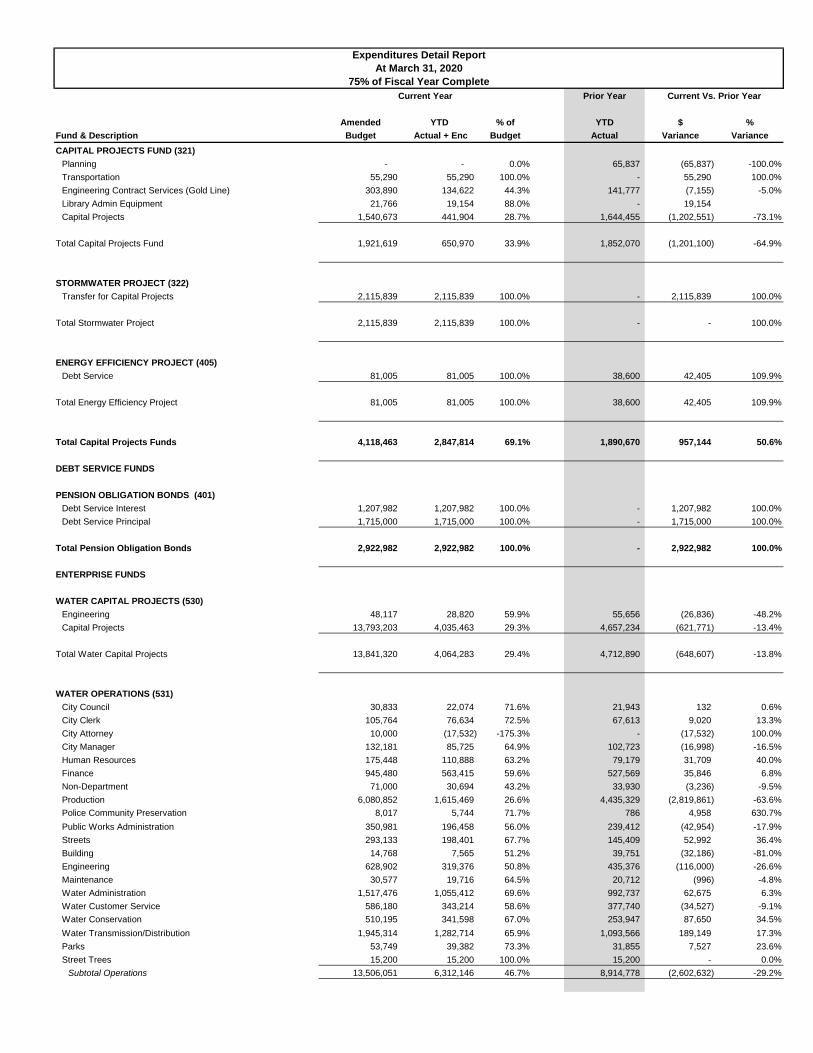
Expenditure Detail Report (All Funds) – This report provides the status of all expenditures
in the City comparing year to date (YTD) expenditures to the approved budget. The report
shows the prior YTD actual expenditures for comparison with the current year.
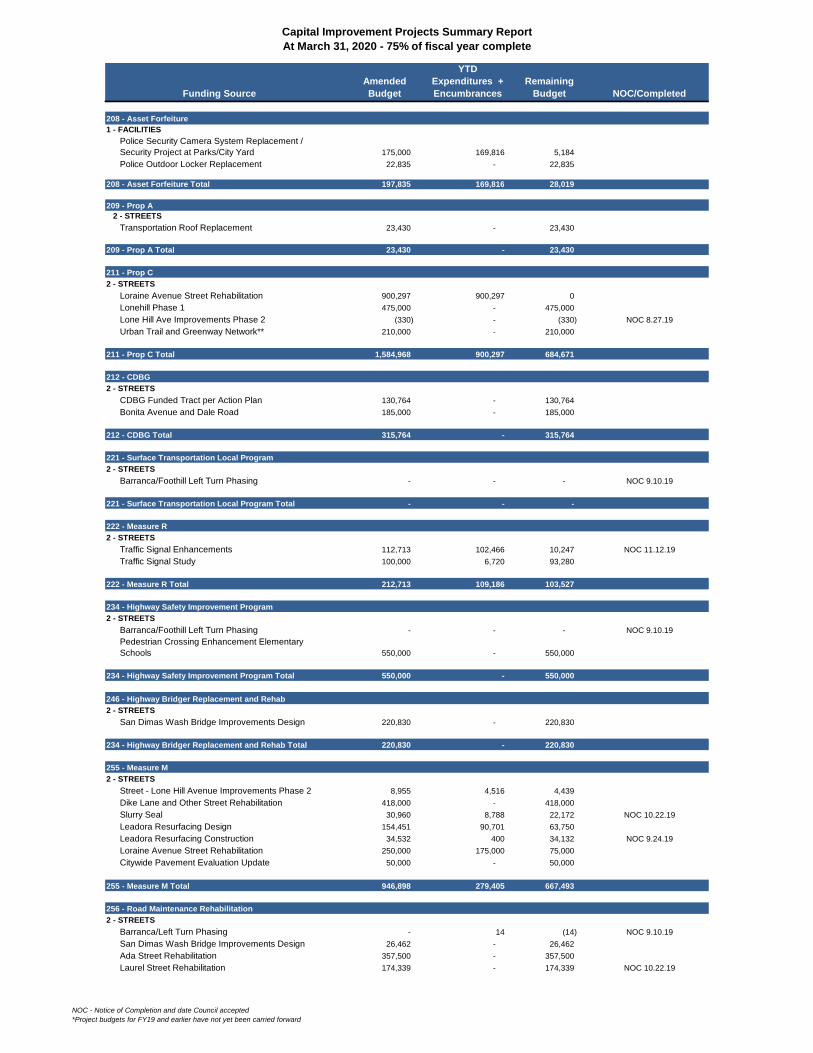
Capital Improvements Project Summary – This report lists the projects, the funding source,
authorized budget, YTD expenditures, percentage of budget spent and if either a Notice of
Completion (NOC) was issued or the staff indicates the project is substantially complete.
Street and Water Type Projects by Fund – This report lists street and water type projects
by fund, it will include the funding source, authorized budget and YTD expenditures.
The reports are presented based on the general ledger balances as of March 31, 2020. As noted in
the “Good to Know” section of this report, at the end of the fiscal year the accrual basis of accounting
is applied to all governmental accounts. As a result, many revenues received or expenditures
occurring in July and August are accrued to the month of June to comply with the Generally Accepted
Accounting Standard (GAAP) that matches the transaction to the period in which the revenue was
earned, or the expenditure occurred.
General Fund Observations
eneral Fund – The General Fund is the largest and most flexible of the City’s funds. It is
the depository for all unrestricted revenues and has the most discretion for expenditures.
Major General Fund revenue sources include, property taxes, sales taxes, transaction
and use taxes, franchise fees, service fees, and permit fees. The General Fund provides
the majority of the services received by the community, which include police services,
public works, community services,
and general government.
The General Fund Overview table provides a
snapshot of budgeted revenues compared to
GGeneral Fund
Overview
Adjusted
Budget
Actual
Activity %
Revenues 37,101,404 23,070,823 62%
Expenditures 34,586,120 24,705,871 71%
Excess (Deficit) 2,515,284 (1,635,048)
9 Months Ended March 31, 2020

Interim Financial Report – 9 Months Ended March 31, 2020
Page 3
the budgeted expenditures. As of March 31, 2019, the adjusted expenditure budget reflects the
following: reserves set aside to offset carry forward budgets and prior year encumbrances, and the
adjustment accounting for the issuance of the POB. This period reflects the midyear adjustments
made for both revenue and expenditure budgets approved in February 2020 and are further
referenced in this report.
Expenditures are typically higher than revenues at this time of year due to the modified cash basis
of accounting used for the General Fund.
General Fund Revenues
The General Fund revenues are summarized in the table below with additional discussion on the
major revenue categories:
A comparison of the adopted vs. adjusted budget shows any adjustments having occurred
since the adoption of the budget. Adjustments totaling $1,636,000 to increase general fund
revenue were approved in February 2020 during the mid-year budget review. However, with
the recent economic impacts related to the COVID-19 pandemic staff is projecting actual
revenues will be closer to the adopted budget levels.
A comparison of the Adjusted Budget to the YTD Actual revenues provides an overview of
how actual revenues compare to the budget. Tax revenues are not received by the City in
monthly installments. The top major three revenues (Property taxes, Sales taxes and
Franchise fees) are primarily received in the second half of the year.
Overall, actual revenues are at 62.2% of the budget and up 22.7% from the prior year due
primarily to the addition of the Transaction and Use Tax (Measure E). Discussed below are
specific changes within the revenue line items.
Property Taxes – The City of Glendora receives approximately 10 cents on the dollar through
property taxes. Property tax revenues as of March 31, 2020 are up 6% compared to last year with
an increase of $432,507. The majority of property tax revenue is received in December, April, and
May. A mid-year adjustment was approved to increase this budget by $500,000. This revenue
currently remains unaffected by the recent economic events and typically doesn’t show any decrease
in the year the event occurs, but rather in the subsequent years based on property valuations.
Prior Year
YTD Actual YTD Actual
Adopted Adjusted March 2020 March 2019
Property Taxes 13,546,135 14,046,135 7,923,031 (6,123,104) 56% 7,490,524 432,507 6%
Sales Taxes 9,589,050 9,589,050 5,889,244 (3,699,806) 61% 5,917,405 (28,161) 0%
Transaction and Use Tax 4,175,000 5,000,000 3,588,487 (1,411,513) 72% - 3,588,487
Franchise/Other Taxes 2,825,860 2,825,860 1,449,566 (1,376,294) 51% 1,320,622 128,944 10%
Licenses/Permits 1,056,850 1,103,550 878,057 (225,493) 80% 871,858 6,199 1%
Fines & Forfeitures 302,000 302,000 203,647 (98,353) 67% 185,385 18,262 10%
Money & Property 920,100 1,160,100 783,660 (376,440) 68% 760,722 22,937 3%
Intergovernmental 63,000 97,000 125,648 28,648 130% 81,046 44,602 55%
Charges for Services 2,647,465 2,634,965 1,794,870 (840,095) 68% 1,650,985 143,885 9%
Miscellaneous 64,050 67,450 57,190 (10,260) 85% 200,571 (143,381) -71%
Transfers In 275,294 275,294 377,423 102,129 137% 322,192 55,231 17%
Total 35,464,804 37,101,404 23,070,823 (14,030,581) 62.2% 18,801,309 4,269,514 22.7%
Change over
Prior Year
Annual Budget %
RealizedDifference
ComparisonFiscal Year 2019 - 2020
General Fund Revenues% Change
Interim Financial Report – 9 Months Ended March 31, 2020
Page 4
Sales Taxes – The Sales Tax source of revenue is typically responsive to economic circumstances.
The City analyzes sales tax revenues regularly through contracted services with HdL Companies.
Sales tax revenues show a decrease of $28,161 compared to prior year. Due to COVID-19, HdL is
currently projecting local sales & use tax declines to continue through the end of Fiscal Year 2020
and into 2021. Major industry types such as auto/transportation, fuel/service stations, restaurants,
building/construction, and general consumer goods have calculated an average decline of 50%
compared to last year. California is allowing small businesses, with less than $1,000,000 in tax
liability, to defer payment of sales and use taxes for 90 days and to apply for an interest-free 12-
month loan program for up to $50,000 of sales and use tax liability. These State sales and use tax
deferral/loan programs could impact Glendora cash flows up to approximately $2,100,000. More
importantly, based on the assumption that the economy will be able to open again by June 1st, the
City anticipates a sales tax revenue loss of approximately $1,020,000 through Fiscal Year 2020 and
$1,620,000 in Fiscal Year 2021.
Transaction and Use Tax (Measure E) – The Transaction and Use Tax became effective July 1,
2019 and is levied on any taxable event where goods are consumed, delivered, or registered in/to
the City of Glendora. The City began to receive tax distributions from Measure E in September 2019.
As of March 31st, the City has received $3,588,487. A mid-year adjustment was approved to increase
the budget by $825,000, for a total of $5 million. This City has not experienced a full cycle of this
revenue and now with COVID-19 impacts, it is unclear how much Measure E will be affected. For
now, indications are that the $5 million is still a reasonable budget estimate.
Franchise Taxes/Other – The City receives franchise payments from sources like The Gas Company,
SCE, Verizon, Time Warner, Athens and Jan’s Towing. The Gas Company and SCE typically make
their annual payments in April. Compared to last year, even with a revenue timing difference with
an accrual, this franchise fees are up 10%, due to the increase in fees from Athens, as well as timely
receipts from Jan’s Towing. The services that are taxed and remitted to the City in this category fall
under the essential guidelines and we are not expecting a decrease in this revenue related to COVID-
19.
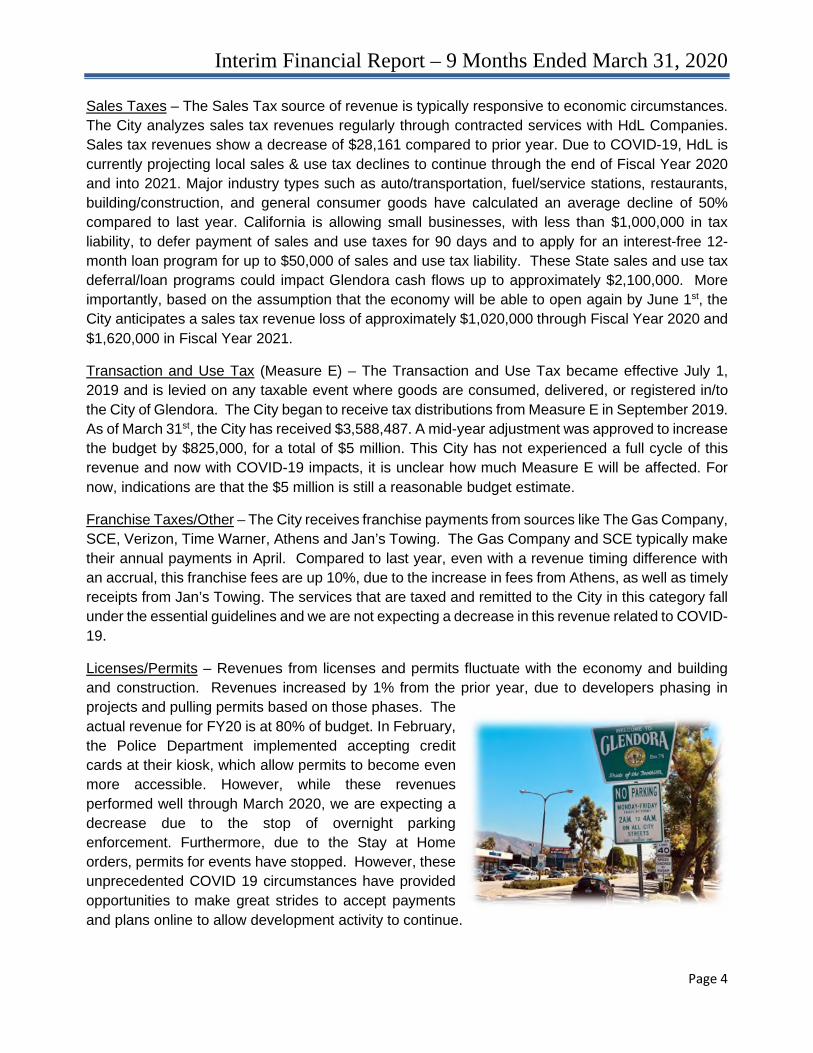
Licenses/Permits – Revenues from licenses and permits fluctuate with the economy and building
and construction. Revenues increased by 1% from the prior year, due to developers phasing in
projects and pulling permits based on those phases. The
actual revenue for FY20 is at 80% of budget. In February,
the Police Department implemented accepting credit
cards at their kiosk, which allow permits to become even
more accessible. However, while these revenues
performed well through March 2020, we are expecting a
decrease due to the stop of overnight parking
enforcement. Furthermore, due to the Stay at Home
orders, permits for events have stopped. However, these
unprecedented COVID 19 circumstances have provided
opportunities to make great strides to accept payments
and plans online to allow development activity to continue.
Interim Financial Report – 9 Months Ended March 31, 2020
Page 5
Fines & Forfeitures – This revenue category captures revenues from parking citations and vehicle
and municipal code fines. FY20 receipts have increased 10% from F19, with the majority increases
from parking citations and municipal code fines.
Money & Property – Revenue from this function represents investment income received through City
owned property either leased or cash invested. The majority of the rental income is represented
through cell tower leases and the golf course. Interest income is received from investment of cash,
which can be reviewed more thoroughly in the monthly investment report available on the City’s
website. Overall, revenue is up 2% compared to last year, a $22,937 increase. However, the impact
of the Governor’s orders limiting gatherings and to stay home, rentals of City facilities have been
postponed until restrictions are lifted. Many reservations were cancelled and refunded to customers.
In addition, rental income has been impacted due to the closure of the Golf Course.
Intergovernmental – This category captures revenues from other government agencies. In
Glendora, this includes revenues received from the State of California for Motor Vehicle in Lieu, SB
90 State Mandates and the Partners Contribution. Of the adjusted budget of $97,000, 129% of this
revenue is already realized, an increase of 55% from last year. These revenues are mainly
represented by a large amount of SB90 State Mandate reimbursements received.
Charges for Services –This revenue reflects cost recovery for services provided to external
customers. These services include police special services, inspections, zoning fees, recreation
classes, plan check and other development fees. Revenues have increased by 8.7% since FY19,
with an increase in plan checks and other engineering fees. However, throughout the next quarter
the City is expecting a major decrease in revenue due to the impact of COVID-19. The projected
loss is expected to be approximately $583,450. While the City is still offering essential services such
as plan checks or other services online or by appointment only, Community Services contract classes
and other recreational activities as well as Library classes have completely ceased.
Miscellaneous – This revenue category captures items that are not fee or service related and often
one-time or non-recurring in nature. This was seen in FY19 when the City received a $172,152
forfeited bail bond, which is why FY20 receipts are not comparable. However, this line item budget
is 84.8% realized.
Transfers In – The budget of $275,294 represents the amount paid through the Successor Agency
($250,000) for the administrative costs of managing the dissolution of the Redevelopment
Agency/Successor Agency matters and continuing closure of the AB109 Realignment Fund
($27,423).

Interim Financial Report – 9 Months Ended March 31, 2020
Page 6
General Fund Expenditures
The General Fund expenditures are summarized in the table below by Service Area based on the
new organizational structure and department names.
A comparison of the adopted vs. adjusted budget shows adjustments made since the budget
was adopted. The major adjustments are due to carry forward budgets and purchase orders
for specific projects or contracts in progress, adjustments implementing negotiated
agreements and the adjustments needed to account for the issuance of the POB. A
comparison of the Adjusted Budget to the YTD Actual expenditures shows two Department’s
expenditures have exceeded or met 75.0% of the budget. Additional comments are below:
o Non-Departmental – this division’s activity is largely represented by the up-front
payment required for the 2009 Pension Obligation Bond. The 2009 POB will be
defeased/paid in full by 2021.
o Transfers – This line item represents planned transfers out supporting other funds.
Majority of the transfer budget relates to the 2019 Pension Obligation Bond debt
service payment.
Overall expenditures are at 71% of the budget, which is an increase of 19.2% compared to
the prior year. The largest contributing factor to this increase is the transfer out to the Pension
Obligation Bond Fund to support the 2019 Pension Obligation Bond debt service payment.
All Other Fund Types – Observations
Special Revenue Funds - These funds are restricted by legislation or other external sources. There
may be Special Revenue funds where the expenditures exceed the revenues budgeted, which
indicates there are available resources in the fund balance for these expenditures/projects. The rules
for each fund vary based on external legislation or guidelines. There are a couple funds being
highlighted in this report:
Asset Forfeiture Fund – was previously funding Police personnel related overtime operating
costs. However, due to the vulnerable nature of receiving these revenues due to Federal and
State actions, Police overtime has been moved to the General Fund. To illustrate this
Prior Year Comparison
YTD Actual YTD Actual
Adopted Adjusted March 2020 March 2019
General Administration 1,694,538 1,701,544 1,007,248 694,296 59% 973,010 34,238
Administrative Services
Finance 702,297 702,905 508,015 194,890 72% 492,247 15,768
Human Resources 483,044 463,161 256,618 206,543 55% 158,431 98,187
Non Departmental 2,486,636 1,610,415 1,213,946 396,469 75% 1,065,277 148,668
Police 18,540,444 17,065,602 12,147,340 4,918,262 71% 11,342,682 804,659
Community Development 1,942,786 2,178,549 1,559,114 619,435 72% 1,213,368 345,746
Public Works 4,223,447 4,043,905 2,676,944 1,366,961 66% 2,404,694 272,250
Library 2,108,038 2,106,189 1,386,200 719,989 66% 1,330,547 55,654
Community Services 2,501,951 2,484,395 1,720,992 763,403 69% 1,704,986 16,006
Transfers 51,214 2,229,455 2,229,455 - 100% 44,776 2,184,679
Total 34,734,395 34,586,120 24,705,871 9,880,248 71% 20,730,016 3,975,855
% Increase/(Decrease) Over Prior Year 19.2%
Change over
Prior Year
Fiscal Year 2019 - 2020
General Fund Expenditures
Annual Budget
Difference
%
Realized

Interim Financial Report – 9 Months Ended March 31, 2020
Page 7
vulnerability, the City received $677K less in asset forfeiture revenues than the same time
last year.
Gas tax – Increases in this fund are primarily due to changes pursuant to section 2103 of
California legislation. Overall, the fund experienced an approximately $150K increase
compared to the same period last year. Majority of the increase is attributable to the increase
in the motor vehicle fuel excise tax. However, in response to COVID-19, fuel consumption
will be suppressed through April and most likely into June. Per California City Finance, cities
are looking at a reduction of 15 to 30 percent in local funding.
Funds expected to be impacted by COVID-19:
o Park & Recreation Facilities – Revenue is received through the collection of park in-
lieu fees. These fees are collected through permits and activity is online and by
appointment only.
o Proposition A & C, Measure R & M – Funding is 0.25% of base sales tax rate, with
sales tax extremely affected by the pandemic, cities are anticipating a decrease in
revenues.
o SB1 – Allocations are from portions of excise (per gallon) taxes on gasoline and diesel
and vehicle registrations taxes. Per California City Finance, cities are looking at a
reduction of 10 to 20 percent in local funding and a delay in receiving the funds.
o The Affordable Housing Fund is being used to fund temporary housing for the
homeless at local hotels/motels.
Capital Projects – The Capital Improvement Projects Summary within this report provides a fiscalupdate on the status of the various projects in progress. Projects completed or where a Notice ofCompletion has been approved has been identified. The report is organized by funding source.Projects may have multiple funding sources where one funding source is fully expended whileanother is not.
Debt Service – The debt service fund was established this fiscal year to account for the issuance ofthe 2019 Pension Obligation Bond. This fund will include activity for the debt service payments andtransfers-in from other funds to fund the payments. It will also account for the Pension StabilizationReserves.
Water Enterprise Funds – An Enterprise fund typically operates like a business. Operations arefunded through fees. The accrual method of accounting is applied throughout the year rather thanusing the modified accrual accounting method used with the General Fund.
The table shows revenuesare just below 70% at 9months. Revenues haveincreased compared to thesame period in fiscal year2019 due to the water rateincrease effective January 1,2019. It is important to note the City is not currently charging late fees/penalties or disconnectingservice and charging the related fee during the COVID 19 emergency. There is some impact to cashflow where payments are not be received in a timely manner. The decrease noted in expendituresfrom prior year is due to a timing difference with purchased and replenishment water. Waterpurchased early in fiscal year 2019 had more advantageous rates than the beginning of the calendaryear.
March 2019
Water Operations
Overview
Adjusted
Budget
Actual
Activity %
Actual
Activity
Revenues 21,055,133 14,275,926 68% 13,059,939
Expenditures 20,988,646 8,794,741 42% 10,929,114
Excess (Deficit) 66,487 5,481,185 2,130,825
9 Months Ended March 31, 2020

Interim Financial Report – 9 Months Ended March 31, 2020
Page 8
Internal Service Funds – These funds provide services to other City funds. Revenues come fromcharging various benefiting departments through an allocation process. Expenditures across allInternal Service Funds are at 69.3%.
Housing Authority Funds – The Housing Authority revenues are dependent on rehabilitation loanpayments. Previously, the City operated a program in which home loans were granted to low- ormoderate-income households. This program is no longer available due to the dissolution of theredevelopment agency. However, when any of the homes in the program are sold, the Authorityreceives a portion of the sale per the agreement terms. Expenditures are consistent with prior yearand cover administrative costs.
Successor Agency Funds (SA) – In January 2011, the Governor and legislature passed ABx1 26eliminating all California redevelopment agencies (RDAs). Effective January 31st, RDAs ceased toexist. Effective February 1st, the Successor Agency was established to carry on the CRA functions.The budget and expenditures are established through the annual Successor Agency budget processand the Recognized Obligation Payment Schedule (ROPs). The ROPs covers a one-year period andis approved by the County Oversight Board before being submitted to the State Department ofFinance (DOF) for final approval. The major transactions in the Successor Agency are debt servicepayments. The Agency no longer has a lease agreement with the Blue Key Group as of November2018, therefore, we won’t be expecting any more lease revenue. Since their departure, the Agencyhas taken over the electric utilities for the parking lot associated with this property. Expenditures areat 99.4% of the budget due to the timing of principal and interest payments on the outstanding debt.
Good to Know: Government Accounting and Budgeting
Most government funds and budgets are managed using a method called “modified accrual” accounting.
This means the governmental funds are managed on a cash basis throughout the year. At year-end,
accruals are made to ensure revenues and expenditures are recorded in the applicable fiscal year in
which the transactions occurred. This method applies to all funds (i.e. the General Fund, Special
Revenue funds, Housing Authority, Internal Service funds and Successor Agency fund) with the
exception of Enterprise funds.
To illustrate, revenue is recorded as it is received throughout the year (cash basis). The majority of
General Fund revenues come in sporadically throughout the year and most of it is received or accrued
in the last 9 months of the fiscal year. Meanwhile, the expenditures are continuing each month
regardless of when the revenues are received. This circumstance highlights the importance of
maintaining a reserve allowing for cash flow needs during the lean months when there are no revenues.
The Enterprise Funds are considered like a business. The accrual method of accounting is used. These
business type funds charge customers a fee to cover the cost of services provided. This method applies
to the Water Fund.
Description
Amended
Estimated
Revenue
YTD
Actual %
Prior Year
Actual
Increase/
(Decrease)
Over Prior Year
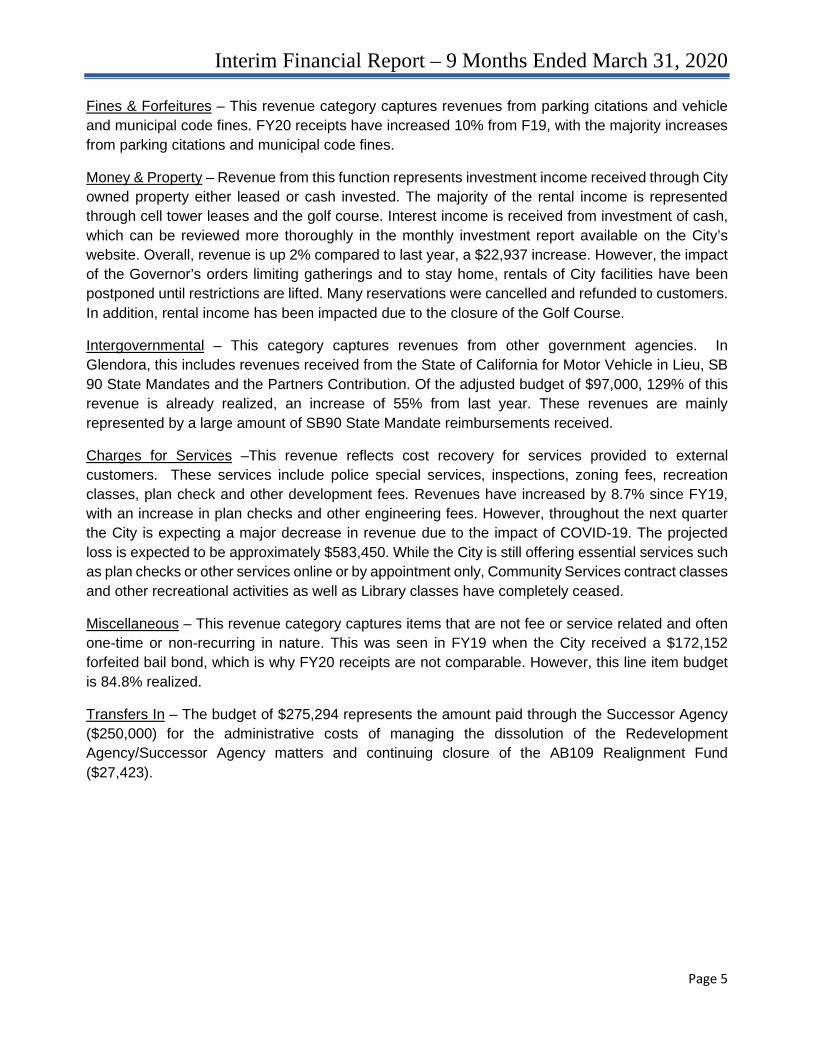
General Fund 37,101,404 23,070,823 62.2% 18,801,309 4,269,514Pension Stabilization - 33,659 100.0% - 33,659Special Revenue Funds 11,083,275 5,223,159 47.1% 5,880,449 (657,290)Capital Projects Funds 2,196,844 2,202,211 100.2% 104,804 2,097,407Debt Service Funds 2,922,982 2,922,982 100.0% - 2,922,982Enterprise Funds 26,195,133 14,406,549 55.0% 13,173,537 1,233,013Internal Service Funds 6,103,782 4,449,682 72.9% 4,037,095 412,587Housing Authority 32,000 46,084 144.0% 180,231 (134,147)Successor Agency 2,195,527 393,089 17.9% 466,860 (73,771)
Total All Revenues 87,830,947 52,748,238 60.1% 42,644,285 10,103,953
% Revenue Increase / (Decrease) Over Prior Year 23.7%
Description Amended Budget
YTD
Actual %
Prior Year
Actual
Increase/
(Decrease)
Over Prior Year
General Fund 34,586,120 24,705,871 71.4% 20,730,016 3,975,855Pension Stabilization - 100,000 100.0% - 100,000Special Revenue Funds 12,270,252 5,398,644 44.0% 6,014,400 (615,757)
Capital Projects Funds 4,118,463 2,847,814 69.1% 1,890,670 957,144Debt Service Funds 2,922,982 2,922,982 100.0% - 2,922,982Enterprise Funds 34,829,966 12,859,024 36.9% 15,642,005 (2,782,980)Internal Service Funds 6,846,367 4,744,632 69.3% 4,602,193 142,440Housing Authority 253,002 148,823 58.8% 141,227 7,596Successor Agency 2,317,029 2,303,851 99.4% 2,296,792 7,059
Total All Expenses 98,144,180 56,031,642 57.1% 51,317,301 4,714,340
% Expenditure Increase / (Decrease) Over Prior Year 9.2%
City of Glendora
All Fund Types75% of Fiscal Year Complete
Revenue Summary
Expenditure Summary

Description
Estimated
Revenue
YTD
Actual %
Prior Year
Actual
Increase/
(Decrease)
Over Prior Year
Taxes 31,461,045 18,850,328 59.9% 14,728,550 4,121,777Licenses & Permits 1,103,550 878,057 79.6% 871,858 6,199Fines & Forfeitures 302,000 203,647 67.4% 185,385 18,262Money & Property 1,160,100 783,660 67.6% 760,722 22,937Intergovernmental 97,000 125,648 129.5% 81,046 44,602Charges for Services 2,634,965 1,794,870 68.1% 1,650,985 143,885Miscellaneous 67,450 57,190 84.8% 200,571 (143,381)Transfers In 275,294 377,423 137.1% 322,192 55,231
Total General Fund 37,101,404 23,070,823 62.2% 18,801,309 4,269,514
% Revenue Increase / (Decrease) Over Prior Year 22.7%
Description Amended Budget
YTD
Actual %
Prior Year
Actual
Increase/
(Decrease)
Over Prior Year
General Administration 1,701,544 1,007,248 59.2% 973,010 34,238Administrative Services
Finance 702,905 508,015 72.3% 492,247 15,768Human Resources 463,161 256,618 55.4% 158,431 98,187Non-Departmental 1,610,415 1,213,946 75.4% 1,065,277 148,668
Police 17,065,602 12,147,340 71.2% 11,342,682 804,659Community Development 2,178,549 1,559,114 71.6% 1,213,368 345,746Public Works 4,043,905 2,676,944 66.2% 2,404,694 272,250Library 2,106,189 1,386,200 65.8% 1,330,547 55,654Community Services 2,484,395 1,720,992 69.3% 1,704,986 16,006Transfers 2,229,455 2,229,455 100.0% 44,776 2,184,679
Total General Fund 34,586,120 24,705,871 71.4% 20,730,016 3,975,855
% Expenditure Increase / (Decrease) Over Prior Year 19.2%
City of Glendora
General Fund75% of Fiscal Year Complete
Revenue Summary by Category
Expenditure Summary by Service Area

Fund#
FUND NAMEAmended
Revenue BudgetActual Revenues
YTD%
AmendedExpenditure Budget
Actual ExpendituresYTD +
Encumbrances%
The General Fund
001 General Fund 37,101,404 23,070,823 62.2% 34,586,120 24,705,871 71.4%
Pension Stabilization
002 Pension Stabilization - 33,659 - 100,000
Special Revenue Funds
202 Street Lighting Assessment Dist. 372,500 248,134 66.6% 366,311 245,679 67.1%
202A Street Improvement Assessment Dist. 440 362 82.2% - -
202B Landscape Maintenance Asmt. Dist. 44,073 28,756 65.2% 44,073 36,384 82.6%
203 Transportation Development Act 6,000 - 0.0% 6,000 6,000 100.0%
205 Gas Tax 1,319,444 881,145 66.8% 1,133,850 787,220 69.4%
206 Park Development 130,500 51,680 39.6% - -
207 Grant Fund 318,977 9,373 2.9% 280,739 106,583 38.0%
208 Asset Forfeiture 460,000 89,322 19.4% 291,835 205,616 70.5%
209 Prop A Transit 1,536,383 874,308 56.9% 1,617,129 1,325,849 82.0%
210 Suppl. Law Enforcement (COPS) 146,800 159,253 108.5% 108,302 10,777 10.0%
211 Prop C Transit 906,684 707,708 78.1% 1,884,968 900,297 47.8%
212 Community Develop. Block Grant 370,764 - 0.0% 370,764 33,677 9.1%
213 HOME-State Grant 1,900 2,263 119.1% - -
214 Used Oil Block Grant 14,550 314 2.2% 14,200 74 0.5%
215 Air Quality Improvement (AQMD) 119,810 35,037 29.2% 186,942 180,797 96.7%
217 Park Proposition 231,630 24,981 10.8% 97,024 43,326 44.7%
218 Prop 1C - Cal-Home Housing 600 567 94.4% - -
219 Prop 1B - Local Streets & Roads - 468 - -
221 Surface Transportation Local Program 2,700 2,524 93.5% 3,288 3,287 100.0%
222 Measure R 675,479 521,989 77.3% 801,170 524,090 65.4%
228 Beverage Recycling Grant 12,600 13,946 110.7% 12,000 - 0.0%
229 Friends Foundation 188,001 96,452 51.3% 188,001 93,447 49.7%
230 Public, Educ. and Govt TV (PEG) 123,000 65,086 52.9% 127,517 84,282 66.1%
231 Glendora Village Business District 100,550 79,394 79.0% 99,100 56,602 57.1%
234 Highway Safety Improvement Program 594,622 45,097 7.6% 550,000 - 0.0%
244 State AB109 Realignment - - 25,294 27,423 108.4%
246 Highway Bridge Replacement 220,835 435 0.2% 220,830 - 0.0%
254 Selective Traffic Enforcement Grant 104,752 31,300 29.9% 103,208 47,279 45.8%
255 Measure M 755,931 587,486 77.7% 1,316,997 344,047 26.1%
256 Road Maintenance Rehab. (SB1) 963,049 576,754 59.9% 1,530,426 211,347 13.8%
257 Active Transportation Program 268,000 - 0.0% 268,000 - 0.0%
258 Measure W 470,000 - 0.0% 128,053 - 0.0%
259 Prop 68 200,000 - 0.0% - -
260 Plan Maintenance Fees 87,000 67,273 77.3% 70,749 27,884 39.4%
261 Measure H 305,700 - 0.0% 305,700 - 0.0%
285 Affordable Housing 30,000 21,754 72.5% 117,785 96,676 82.1%
Special Revenue Funds - Subtotal 11,083,275 5,223,159 47.1% 12,270,252 5,398,644 44.0%
Capital Projects Funds
321 Capital Projects 2,115,839 2,121,206 100.3% 1,921,619 650,970 33.9%
322 Stormwater Project - - 2,115,839 2,115,839 100.0%
405 Energy Efficient Project 81,005 81,005 100.0% 81,005 81,005 100.0%
Capital Projects Fund - Subtotal 2,196,844 2,202,211 100.2% 4,118,463 2,847,814 69.1%
Debt Service Funds
401 Pension Obligation Bonds 2,922,982 2,922,982 100.0% 2,922,982 2,922,982 100.0%
Debt Service Funds - Subtotal 2,922,982 2,922,982 100.0% 2,922,982 2,922,982 100.0%
Enterprise Funds
530 Water Capital Projects 5,140,000 130,624 2.5% 13,841,320 4,064,283 29.4%
531 Water Operations 21,055,133 14,275,926 67.8% 20,988,646 8,794,741 41.9%
Enterprise Funds - Subtotal 26,195,133 14,406,549 55.0% 34,829,966 12,859,024 36.9%
City of GlendoraActivity Report by Fund
Revenues ExpendituresFund
75% of Fiscal Year Complete

City of GlendoraActivity Report by Fund
75% of Fiscal Year CompleteInternal Service Funds
541 Workers Compensation 1,018,272 670,799 65.9% 1,039,120 808,114 77.8%
542 General Liability 1,752,203 1,314,152 75.0% 1,748,148 1,607,311 91.9%
548 Technology 1,970,960 1,478,220 75.0% 2,023,725 1,468,419 72.6%
549 Vehicle Replacement 1,362,347 986,510 72.4% 2,035,374 860,788 42.3%
Internal Service Funds - Subtotal 6,103,782 4,449,682 72.9% 6,846,367 4,744,632 69.3%
Total City Funds 85,603,420 52,309,065 61.1% 95,574,149 53,578,968 56.1%
The Glendora Housing Authority
290 Housing Authority 32,000 46,084 144.0% 253,002 148,823 58.8%
Total City & Housing Authority 85,635,420 52,355,149 61.1% 95,827,151 53,727,791 56.1%
Fiduciary Funds - The Glendora CRA Successor Agency
400 Successor Agency 2,195,527 393,089 17.9% 2,317,029 2,303,851 99.4%
Total Successor Agency 2,195,527 393,089 17.9% 2,317,029 2,303,851 99.4%
Grand Total - ALL FUNDS 87,830,947 52,748,238 60.1% 98,144,180 56,031,642 57.1%

Prior Year
Amended YTD % of YTD $ %
Fund & Description Budget Actual Budget Actual Variance Variance
001 The General Fund
Taxes
Property Tax 14,046,135 7,923,031 56.4% 7,490,524 432,507 5.8%
Sales Tax 9,589,050 5,889,244 61.4% 5,917,405 (28,161) -0.5%
Transaction and Use Tax 5,000,000 3,588,487 71.8% - 3,588,487 100.0%
Franchise Taxes 2,222,660 1,078,239 48.5% 934,227 144,012 15.4%
Business License Taxes 445,000 249,293 56.0% 260,003 (10,710) -4.1%
Transient Occupancy Taxes 158,200 122,034 77.1% 126,392 (4,358) -3.4%
Total Taxes 31,461,045 18,850,328 59.9% 14,728,550 4,121,777 28.0%
Licenses & Permits
Swap Meet Vendors 45,000 30,135 67.0% 23,376 6,759 28.9%
Overnight Parking Machines 251,500 221,625 88.1% 208,044 13,581 6.5%
Building Permits 550,000 427,524 77.7% 500,299 (72,775) -14.5%
All Other Licenses & Permits 257,050 198,773 77.3% 140,138 58,634 41.8%
Total Licenses & Permits 1,103,550 878,057 79.6% 871,858 6,199 0.7%
Fines & Forfeitures
Parking Citations 200,000 143,816 71.9% 117,003 26,813 22.9%
Vehicle Code Fines 94,000 50,866 54.1% 62,578 (11,712) -18.7%
Municipal Code Fines 8,000 8,966 112.1% 5,805 3,161 54.5%
Total Fines & Forfeitures 302,000 203,647 67.4% 185,385 18,262 9.9%
Money & Property
Interest Income 500,000 286,471 57.3% 241,644 44,827 18.6%
Rental Income 427,100 326,965 76.6% 333,073 (6,109) -1.8%
Golf Course Rental Income 95,600 53,900 56.4% 65,015 (11,115) -17.1%
Rental of City Facilities 137,400 116,324 84.7% 120,990 (4,666) -3.9%
Total Money & Property 1,160,100 783,660 67.6% 760,722 22,937 3.0%
Intergovernmental
Motor Veh In-Lieu 23,000 41,252 179.4% 25,298 15,955 63.1%
Other Intergovernmental 74,000 84,396 114.0% 55,748 28,648 51.4%
Total Intergovernmental 97,000 125,648 129.5% 81,046 44,602 55.0%
Charges for Service
Administration 104,900 60,346 57.5% 68,328 (7,982) -11.7%
Police DepartmentSpecial Services 72,000 30,149 41.9% 67,225 (37,076) -55.2%
School Resources Officer 70,000 35,000 50.0% 93,201 (58,201) -62.4%
Crossing Guards 32,000 16,000 50.0% 16,000 - 0.0%
Vehicle Impounds 12,000 7,440 62.0% 7,335 105 1.4%
All Other Police 58,000 50,802 87.6% 51,927 (1,126) -2.2%
Subtotal Police 244,000 139,391 57.1% 235,689 (96,298) -40.9%
Public Works, Planning & Econ. Devel.NPDES Industrial Insp 18,500 18,900 102.2% 18,900 - 0.0%
Grading & Permit Inspection 12,500 5,926 47.4% 10,426 (4,500) -43.2%
Plan Checks 350,000 292,867 83.7% 174,087 118,780 68.2%
Zoning & Subdivision 90,000 67,929 75.5% 82,311 (14,382) -17.5%
Street Repair Admin Chrg 240,000 180,000 75.0% 180,000 - 0.0%
All Other PW, PL & E 813,365 528,686 65.0% 342,259 186,427 54.5%
Subtotal PW, PL & Econ. Devel. 1,524,365 1,094,309 71.8% 807,984 286,326 35.4%
At March 31, 2020
75% of Fiscal Year Complete
Revenue Detail Report
Current Vs. Prior YearCurrent Year

Prior Year
Amended YTD % of YTD $ %
Fund & Description Budget Actual Budget Actual Variance Variance
At March 31, 2020
75% of Fiscal Year Complete
Revenue Detail Report
Current Vs. Prior YearCurrent Year
LibraryLibrary Admin/Fees 37,500 21,699 57.9% 26,099 (4,400) -16.9%
Library Copy Center 14,000 12,409 88.6% 11,748 661 5.6%
Subtotal Library 51,500 34,108 66.2% 37,847 (3,739) -9.9%
Community ServicesRecreation Fees 46,000 19,976 43.4% 15,956 4,020 25.2%
Administrative Fees 70,000 48,887 69.8% 44,256 4,631 10.5%
Contract Classes 374,000 216,322 57.8% 228,054 (11,733) -5.1%
Youth Basketball Program 80,000 70,646 88.3% 69,284 1,362 2.0%
Human Svcs Trips & Tours 57,500 53,028 92.2% 53,643 (615) -1.1%
Extended Trips & Tours 15,000 8,876 59.2% 8,109 767 9.5%
All Other CSD 67,700 48,981 72.3% 81,835 (32,854) -40.1%
Subtotal Community Services 710,200 466,716 65.7% 501,138 (34,422) -6.9%
Total Charges for Service 2,634,965 1,794,870 68.1% 1,650,985 143,885 8.7%
Miscellaneous Revenue
Miscellaneous Revenue 67,450 57,190 84.8% 200,571 (143,381) -71.5%
Total Miscellaneous 67,450 57,190 84.8% 200,571 (143,381) -71.5%
Transfers In
AB109 Realignment 25,294 27,423 108.4% 72,192 (44,769) -62.0%Successor Agency Admin 250,000 250,000 100.0% 250,000 - 0.0%
Pension Stabilization - 100,000 100.0% - 100,000 100.0%
Total Transfers In 275,294 377,423 137.1% 322,192 55,231 17.1%
Total General Fund 37,101,404 23,070,823 62.2% 18,801,309 4,269,514 22.7%
Pension Stabilization
002 Pension Stabilization Interest - 33,659 100.0% - 33,659 100.00%Total Pension Stabilization - 33,659 100.0% - 33,659 100.0%
Special Revenue Funds
202 Street Lighting Assessment Dist. 372,500 248,134 66.6% 241,625 6,509 2.7%
202A Street Improvement Assessment Dist. 440 362 82.2% 319 43 13.5%
202B Landscape Maintenance Asmt. Dist. 44,073 28,756 65.2% 21,494 7,262 33.8%
203 Transportation Development Act 6,000 - 0.0% - - 0.0%
205 Gas Tax 1,319,444 881,145 66.8% 730,963 150,183 20.5%
206 Park Development 130,500 51,680 39.6% 98,356 (46,676) -47.5%
207 Grant Fund 318,977 9,373 2.9% 59,397 (50,024) -84.2%
208 Asset Forfeiture 460,000 89,322 19.4% 766,858 (677,535) -88.4%
209 Prop A Transit 1,536,383 874,308 56.9% 856,646 17,662 2.1%
210 Suppl. Law Enforcement (COPS) 146,800 159,253 108.5% 150,891 8,362 5.5%
211 Prop C Transit 906,684 707,708 78.1% 697,625 10,083 1.4%
212 Community Develop. Block Grant 370,764 - 0.0% 44,429 (44,429) -100.0%
213 HOME-State Grant 1,900 2,263 119.1% 93,852 (91,589) -97.6%
214 Used Oil Block Grant 14,550 314 2.2% 9,149 (8,835) -96.6%
215 Air Quality Improvement (AQMD) 119,810 35,037 29.2% 34,539 498 1.4%
217 Park Proposition 231,630 24,981 10.8% 168 24,813 14786.2%
218 Prop 1C - Cal-Home Housing 600 567 94.4% 499 67 13.5%
219 Prop 1B - Local Streets & Roads - 468 100.0% 370 98 26.5%
221 Surface Transportation Local Program 2,700 2,524 93.5% 2,870 (346) -12.1%
222 Measure R 675,479 521,989 77.3% 510,441 11,548 2.3%
228 Beverage Recycling Grant 12,600 13,946 110.7% 340 13,606 4000.7%
229 Friends Foundation 188,001 96,452 51.3% 86,498 9,954 11.5%
230 Public, Educ. and Govt TV (PEG) 123,000 65,086 52.9% 72,398 (7,312) -10.1%
231 Glendora Village Business District (BID) 100,550 79,394 79.0% 71,733 7,661 10.7%
234 Highway Safety Improvement Program 594,622 45,097 7.6% 55,915 (10,818) -19.3%
244 State AB109 Realignment - - 0.0% 673 (673) -100.0%
246 Highway Bridge Replacement 220,835 435 0.2% 382 54 14.1%
254 Selective Traffic Enforcement Grant 104,752 31,300 29.9% 47,163 (15,864) -33.6%
255 Measure M 755,931 587,486 77.7% 575,455 12,031 2.1%
256 Road Maintenance Rehab. (SB1) 963,049 576,754 59.9% 558,641 18,114 3.2%
257 Active Transportation Program 268,000 - 0.0% - - 0.0%

Prior Year
Amended YTD % of YTD $ %
Fund & Description Budget Actual Budget Actual Variance Variance
At March 31, 2020
75% of Fiscal Year Complete
Revenue Detail Report
Current Vs. Prior YearCurrent Year
258 Measure W 470,000 - 0.0% - - 0.0%
259 Prop 68 200,000 - 0.0% - - 0.0%
260 Plan Maintenance Fees 87,000 67,273 77.3% 70,427 (3,155) -4.5%
261 Measure H 305,700 - 0.0% - - 0.0%
285 Affordable Housing 30,000 21,754 72.5% 20,334 1,420 7.0%
Total Special Revenue Funds 11,083,275 5,223,159 47.1% 5,880,449 (657,290) -11.2%
Capital Projects Funds
321 Capital Projects 2,115,839 2,121,206 100.3% 27,604 2,093,602 7584.5%
405 Energy Efficiency Project 81,005 81,005 100.0% 77,200 3,805 4.9%
Total Capital Projects Funds 2,196,844 2,202,211 100.2% 104,804 2,097,407 2001.3%
Debt Service Funds
401 Pension Obligation Bonds
Transfers in General Fund 2,167,417 2,167,417 100.0% - 2,167,417 100.0%
Transfers in Special Revenue Fund 99,673 99,673 100.0% - 99,673 100.0%
Transfers in Housing 33,145 33,145 100.0% - 33,145 100.0%
Transfers in Enterprise Fund 465,945 465,945 100.0% - 465,945 100.0%
Transfers in Internal Service Fund 156,802 156,802 100.0% - 156,802 100.0%
Total Pension Obligation Bonds 2,922,982 2,922,982 100.0% - 2,922,982 100.0%
Enterprise Funds
530 Water Capital Projects
Interest Income 140,000 130,624 93.3% 97,938 32,686 33.4%
Water Rights Fee - - 0.0% 15,660 (15,660) -100.0%
Transfer Water Operations 5,000,000 - 0.0% - - 0.0%Subtotal Capital Projects 5,140,000 130,624 2.5% 113,597 17,026 15.0%
531 Water Operations
Interest Income 190,000 219,526 115.5% 170,670 48,857 28.6%
Damage to Property Recovery - 1,373 100.0% 21,573 (20,200) -93.6%
Rev Miscellaneous Receipts - 2,607 100.0% 4,092 (1,485) -36.3%
Returned Check Charges 1,500 1,421 94.7% 1,901 (480) -25.2%
Misc Receipts - 1,973 100.0% (448) 2,421 -540.8%
Eng & Reinspection 18,000 9,070 50.4% 3,640 5,430 149.2%
Backflow Plan Check 700 250 35.7% 50 200 400.0%
Energy Usage Charge 1,436,465 899,800 62.6% 847,263 52,537 6.2%
Purchased Water 2,346,615 1,383,631 59.0% 1,298,048 85,583 6.6%
Uniform Base 8,823,676 6,543,337 74.2% 5,278,648 1,264,688 24.0%Readiness to Serve 7,944,390 5,013,553 63.1% 5,215,470 (201,917) -3.9%
Fire Service Charge 27,715 22,808 82.3% 21,322 1,485 7.0%
Hydrant Meter Sales 10,000 5,200 52.0% 13,730 (8,530) -62.1%
Sales to Other Utilities 6,000 4,081 68.0% 1,966 2,114 107.5%
Meter Installation Fees 19,230 11,893 61.8% 12,643 (750) -5.9%
Front Footage Charges 5,000 2,710 54.2% 1,247 1,463 117.3%
Water Acreage Charges 13,110 6,009 45.8% 8,569 (2,560) -29.9%
Reconnect Fees 13,372 10,489 78.4% 9,970 519 5.2%
Billing Penalties 199,360 136,196 68.3% 149,585 (13,389) -9.0%
Subtotal Operations 21,055,133 14,275,926 67.8% 13,059,939 1,215,986 9.3%
Total Water Enterprise 26,195,133 14,406,549 55.0% 13,173,537 1,233,013 9.4%
Total Enterprise Funds 26,195,133 14,406,549 55.0% 13,173,537 1,233,013 9.4%
Internal Service Funds
541 Workers' Compensation Fund
Miscellaneous Receipts - 12,470 100.0% - 12,470 100.0%
Chargebacks 1,018,272 658,329 64.7% 603,494 54,835 9.1%
Total WC 1,018,272 670,799 65.9% 603,494 67,305 11.2%

Prior Year
Amended YTD % of YTD $ %
Fund & Description Budget Actual Budget Actual Variance Variance
At March 31, 2020
75% of Fiscal Year Complete
Revenue Detail Report
Current Vs. Prior YearCurrent Year
542 General Liability
Chargebacks 1,752,203 1,314,152 75.0% 1,378,125 (63,973) -4.6%
Total Liability 1,752,203 1,314,152 75.0% 1,378,125 (63,973) -4.6%
548 Technology Fund
ITS Charges 1,970,960 1,478,220 75.0% 1,233,750 244,470 19.8%
Total Technology 1,970,960 1,478,220 75.0% 1,233,750 244,470 19.8%
549 Vehicle Replacement
Damage to City Property - - 0.0% 5,176 (5,176) -100.0%
Sale of Equipment/Disp of Asset 47,000 - 0.0% 46,750 (46,750) -100.0%
Vehicle Chargebacks 1,315,347 986,510 75.0% 769,800 216,710 28.2%
Total Vehicles 1,362,347 986,510 72.4% 821,727 164,784 20.1%
Total Internal Service Funds 6,103,782 4,449,682 72.9% 4,037,095 412,587 10.2%
Glendora Housing Authority
290 Glendora Housing Authority
Interest Income 32,000 26,083 81.5% 24,545 1,538 6.3%
Misc Income - - 0.0% 5,000 (5,000) -100.0%
Rental Income - 20,001 100.0% - 20,001 100.0%
Program Income - - 0.0% 150,686 (150,686) -100.0%
Total Housing Authority 32,000 46,084 144.0% 180,231 (134,147) -74.4%
Glendora Successor Agency
400 Successor Agency
ROPS Distribution 2,185,527 387,535 17.7% 422,638 (35,103) -8.3%
Interest Income 10,000 5,554 55.5% 1,419 4,135 291.5%
Rental Income - - 0.0% 42,804 (42,804) -100.0%
Total Successor Agency Funds 2,195,527 393,089 17.9% 466,860 (73,771) -15.8%
Total All Revenue 87,830,947 52,748,238 60.1% 42,644,285 10,103,953 23.7%

Prior Year
Amended YTD % of YTD $ %
Fund & Description Budget Actual + Enc Budget Actual Variance Variance
THE GENERAL FUND (001)
City Council 119,101 75,692 63.6% 85,643 (9,951) -11.6%
City Clerk 406,996 290,639 71.4% 271,909 18,730 6.9%
Municipal Elections 124,300 4,049 3.3% 2,868 1,181 41.2%
Passport Services 66,616 34,643 52.0% 75 34,568 46029.8%
Public Information 126,163 91,455 72.5% 94,908 (3,453) -3.6%
City Attorney 563,000 276,488 49.1% 289,655 (13,167) -4.5%
City Manager 295,368 234,281 79.3% 227,951 6,330 2.8%
Administrative Services
Finance 702,905 508,015 72.3% 492,247 15,768 3.2%
Human Resources 463,161 256,618 55.4% 158,431 98,187 62.0%
Non-Departmental 1,610,415 1,213,946 75.4% 1,065,277 148,668 14.0%
Police
Administration 3,296,939 2,450,927 74.3% 2,198,747 252,180 11.5%
Patrol 8,909,730 6,436,753 72.2% 6,138,237 298,516 4.9%
Investigation 2,585,028 1,570,035 60.7% 1,404,291 165,744 11.8%
Traffic Control 713,473 568,794 79.7% 566,640 2,154 0.4%
DARE/SRO 308,768 226,177 73.3% 174,545 51,632 29.6%
Records 529,092 314,202 59.4% 343,764 (29,561) -8.6%
Jail Maintenance 394,939 292,767 74.1% 237,097 55,670 23.5%
Community Preservation 327,634 287,684 87.8% 279,361 8,324 3.0%
Community Development
Planning 759,632 639,530 84.2% 450,101 189,429 42.1%
Economic Development 133,090 83,366 62.6% 119,380 (36,014) -30.2%
Successor Agency 291,198 229,780 78.9% 212,528 17,252 8.1%
Building 994,629 606,438 61.0% 431,359 175,079 40.6%
Public Works
Administration 1,015,267 676,184 66.6% 466,938 209,246 44.8%
Environmental Services 162,668 66,760 41.0% 80,423 (13,663) -17.0%
Streets 20,700 14,656 70.8% 9,048 5,608 62.0%
Engineering 238,520 103,328 43.3% 91,904 11,424 12.4%
Facilities Maintenance 372,701 271,453 72.8% 262,082 9,372 3.6%
NPDES 249,500 85,167 34.1% 194,857 (109,690) -56.3%
Parks 1,263,004 789,571 62.5% 710,847 78,724 11.1%
Street Trees 721,544 669,824 92.8% 588,596 81,228 13.8%
Library
Administration 841,575 553,282 65.7% 574,267 (20,985) -3.7%
Circulation/Technical Services 542,435 351,892 64.9% 273,284 78,608 28.8%
Youth Services 215,335 150,142 69.7% 148,988 1,153 0.8%
Adult Services 438,794 282,678 64.4% 258,257 24,421 9.5%
Development Office 68,050 48,206 70.8% 75,751 (27,545) -36.4%
Community Services
Administration 762,809 577,161 75.7% 609,700 (32,539) -5.3%
Recreation 768,258 548,229 71.4% 540,049 8,180 1.5%
Human Services 565,182 388,094 68.7% 299,511 88,584 29.6%
Teen Center 388,146 207,508 53.5% 255,727 (48,219) -18.9%
Transfers 2,229,455 2,229,455 100.0% 44,776 2,184,679 4879.1%
Total General Fund 34,586,120 24,705,871 71.4% 20,730,016 3,975,855 19.2%
PENSION STABILIZATION FUND
Transfers - 100,000 100.0% - 100,000 100.0%
Total Pension Stabilization - 100,000 100.0% - 100,000 100.0%
Current Vs. Prior Year
Expenditures Detail Report
At March 31, 2020
75% of Fiscal Year Complete
Current Year

Prior Year
Amended YTD % of YTD $ %
Fund & Description Budget Actual + Enc Budget Actual Variance Variance
Current Vs. Prior Year
Expenditures Detail Report
At March 31, 2020
75% of Fiscal Year Complete
Current Year
SPECIAL REVENUE FUNDS
STREET LIGHTING ASSESSMENT (202)
Public Works Admin 17,958 2,291 12.8% 4,867 (2,576) -52.9%
Public Works Streets 347,800 242,834 69.8% 226,731 16,103 7.1%
Transfers 553 553 100.0% - 553 100.0%
Total Special Assessments 366,311 245,679 67.1% 231,598 14,081 6.1%
LANDSCAPE MAINTENANCE ASSESSMENT (202B)
CSD Street Trees 44,073 36,384 82.6% 42,561 (6,177) -14.5%
Total Landscape Maintenance Assessment 44,073 36,384 82.6% 42,561 (6,177) -14.5%
TRANSPORTATION DEVELOPMENT ACT (203)
Transportation 6,000 6,000 100.0% - 6,000 100.0%
Total Transportation Development Act 6,000 6,000 100.0% - 6,000 100%
GAS TAX (205)
PW Streets 971,625 685,961 70.6% 672,106 13,855 2.1%
PW Street Trees 162,225 101,259 62.4% 131,393 (30,134) -22.9%
Capital Projects - - 0.0% 25,539 (25,539) -100.0%
Total Gas Tax 1,133,850 787,220 69.4% 829,037 (41,817) -5.0%
PARK DEVELOPMENT (206)
Capital Projects - - 0.0% 295 (295) -100.0%
Total Park Development - - 0.0% 295 (295) -100.0%
GRANT FUND (207)
Police Bullet Proof Vest FY17 - - 0.0% 17,772 (17,772) -100.0%
Police Bullet Proof Vest FY18 5,110 6,328 123.8% - 6,328 100.0%
Alcohol Beverage Control FY20 31,718 16,303 51.4% - 16,303 100.0%
Homeland Security Grant 83,911 83,952 100.0% - 83,952 100.0%
Planning Grant 160,000 - 0.0% - - 0.0%
CA Initiative Y. Services - - 0.0% 4,781 (4,781) -100.0%
CA Initiative A. Services - - 0.0% 2,695 (2,695) -100.0%
Total Grant Fund 280,739 106,583 38.0% 25,248 81,335 322.1%
ASSET FORFEITURE (208)
Patrol 49,000 800 1.6% 268,140 (267,340) -99.7%
Police Administration 35,000 35,000 100.0% 35,000 - 0.0%
Investigations 10,000 - 0.0% 165,353 (165,353) -100.0%
Info Systems - - 0.0% 120,099 (120,099) -100.0%
Capital Projects 197,835 169,816 85.8% - 169,816 100.0%
Total Asset Forfeiture 291,835 205,616 70.5% 588,592 (382,976) -65.1%

Prior Year
Amended YTD % of YTD $ %
Fund & Description Budget Actual + Enc Budget Actual Variance Variance
Current Vs. Prior Year
Expenditures Detail Report
At March 31, 2020
75% of Fiscal Year Complete
Current Year
PROPOSITION A TRANSIT (209)
City Attorney 3,000 - 0.0% - - 0.0%
Finance Dept 1,714 1,243 72.5% 1,098 145 13.2%
PW Public Transit 244,098 110,853 45.4% - 110,853 100.0%
CD Public Transit 1,282,969 1,170,195 91.2% 1,364,574 (194,379) -14.2%
CSD Public Transit 31,894 13,534 42.4% - 13,534 100.0%
Transfers 30,025 30,025 100.0% - 30,025 100.0%
Capital Projects 23,430 - 0.0% - - 0.0%
Total Proposition A Transit 1,617,129 1,325,849 82.0% 1,365,672 (39,822) -2.9%
SUPPLEMENTAL LAW ENFORCEMENT SERVICES (210)
Police Admin 97,524 - 0.0% - - 0.0%
Patrol - - 0.0% 10,931 (10,931) -100.0%
Information Systems - - 0.0% 84,533 (84,533) -100.0%
Transfers 10,777 10,777 100.0% - 10,777 100.0%
Total Supplemental Law Enforcement Services 108,302 10,777 10.0% 95,464 (84,687) -88.7%
PROPOSITION C TRANSIT (211)
Transfers to Other Funds 300,000 - 0.0% - - 0.0%
Capital Projects 1,584,968 900,297 56.8% 700,075 200,222 28.6%
Total Proposition C Fund 1,884,968 900,297 47.8% 700,075 200,222 28.6%
COMMUNITY DEVELOPMENT BLOCK GRANT (212)
General Admin 55,000 33,677 61.2% 33,460 217 0.6%
Capital Projects 315,764 - 0.0% 237,800 (237,800) -100.0%
Total Community Development Block Grant 370,764 33,677 9.1% 271,260 (237,583) -87.6%
USED OIL BLOCK GRANT (214)
Environmental Services 14,200 74 0.5% 9,555 (9,480) -99.2%
Total Used Oil Block Grant 14,200 74 0.5% 9,555 (9,480) -99.2%
AIR QUALITY IMPROVEMENT (215)
Human Resources - - 0.0% 6.09 (6) -100.0%
Finance 1,886 1,475 78.2% 916 559 61.0%
Public Transit 184,535 178,801 96.9% 9,151 169,650 1853.9%
Transfers 521 521 100.0% - 521 100.0%
Total Air Quality Improvement 186,942 180,797 96.7% 10,073 170,724 1694.9%
PARK PROPOSITION (217)
Human Services 1,080 - 0.0% 1,730 (1,730) -100.0%
Teen Center 95,944 43,326 45.2% 48,861 (5,535) -11.3%
Total Park Proposition 97,024 43,326 44.7% 50,591 (7,265) -14.4%
PROP 1B LOCAL STREETS (219)
Capital Projects - - 0.0% 37,209 (37,209) -100.0%
Total PROP 1B LOCAL STREETS - - 0.0% 37,209 (37,209) -100.0%

Prior Year
Amended YTD % of YTD $ %
Fund & Description Budget Actual + Enc Budget Actual Variance Variance
Current Vs. Prior Year
Expenditures Detail Report
At March 31, 2020
75% of Fiscal Year Complete
Current Year
SURFACE TRANSPORTATION LOCAL PROGRAM (221)
Transfer 3,288 3,287 100.0% - 3,287 100.0%
Capital Projects - - 0.0% 95,075 (95,075) -100.0%
Total Surface Transportation Local Program 3,288 3,287 100.0% 95,075 (91,788) -96.5%
MEASURE R (222)
Streets 520,708 354,556 68.1% 335,833 18,723 5.6%
Parks 12,546 5,146 41.0% 8,236 (3,090) -37.5%
Transfers 55,202 55,202 100.0% - 55,202 100.0%
Capital Projects 212,713 109,186 51.3% 414,691 (305,505) -73.7%
Total Measure R 801,170 524,090 65.4% 758,760 (234,670) -30.9%
BEVERAGE RECYCLING GRANT (228)
Environmental Services 12,000 - 0.0% 2,124 (2,124) -100.0%
Total Beverage Recycling Grant 12,000 - 0.0% 2,124 (2,124) -100.0%
FRIENDS FOUNDATION (229)
Library Admin 12,700 384 3.0% 900 (515) -57.3%
Youth Services 70,630 38,281 54.2% 41,042 (2,761) -6.7%
Adult Services 104,671 54,781 52.3% 32,583 22,198 68.1%
Development Office - - 0.0% 30,868 (30,868) -100.0%
Total Friends Foundation 188,001 93,447 49.7% 105,392 (11,945) -11.3%
PUBLIC, EDUCATION AND GOVERNMENT TV (230)
Public Information 88,946 45,711 51.4% 34,493 11,218 32.5%
Capital Projects 38,571 38,571 100.0% 168,657 (130,086) -77.1%
Total Public, Education and Government TV (PEG) 127,517 84,282 66.1% 203,150 (118,868) -58.5%
GLENDORA VILLAGE BUSINESS DISTRICT (231)
Glendora Village Business District 99,100 56,602 57.1% 70,086 (13,484) -19.2%
Total Glendora Village Business District 99,100 56,602 57.1% 70,086 (13,484) -19.2%
HIGHWAY SAFETY IMPROVEMENT PROGRAM (234)
Capital Projects 550,000 - 0.0% 123,000 (123,000) -100.0%
Total Highway Safety Improvement Program 550,000 - 0.0% 123,000 (123,000) -100.0%
STATE AB109 REALIGNMENT (244)
Operating Cont. & Grants (Investigation) - - 0.0% - - 0.0%
Transfers 25,294 27,423 108.4% 72,192 (44,769) -62.0%
Total State AB109 Realignment 25,294 27,423 108.4% 72,192 (44,769) -62.0%
HIGHWAY BRIDGE REPLACEMENT AND REHAB (246)
Lonehill Bridge 220,830 - 0.0% - - 0.0%
Total Highway Bridge Replacement and Rehab 220,830 - 0.0% - - 0.0%

Prior Year
Amended YTD % of YTD $ %
Fund & Description Budget Actual + Enc Budget Actual Variance Variance
Current Vs. Prior Year
Expenditures Detail Report
At March 31, 2020
75% of Fiscal Year Complete
Current Year
SELECTIVE TRAFFIC ENFORCEMENT GRANT (254)
OTS Grants 103,208 47,279 45.8% 69,631 (22,351) -32.1%
Total Selective Traffic Enforcement Grant 103,208 47,279 45.8% 69,631 (22,351) -32.1%
MEASURE M (255)
Transportation 67,505 62,049 91.9% 8,290 53,758 648.5%
Transfers 302,594 2,594 0.9% - 2,594 100.0%
Capital Projects 946,898 279,405 29.5% 53,777 225,628 419.6%
Total Measure M 1,316,997 344,047 26.1% 62,067 281,980 454.3%
ROAD MAINTENANCE REHABILITATION (256)
Transfer 1,334 1,334 100.0% - 1,334 100.0%
Capital Projects 1,529,092 210,013 13.7% 76,666 133,346 173.9%
Total Road Maintenance Rehabilitation 1,530,426 211,347 13.8% 76,666 134,680 175.7%
ATP GRANT (257)
Capital Projects 268,000 - 0.0% - - 0.0%
Total ATP 268,000 - 0.0% - - 0.0%
MEASURE W (258)
Contract Services 128,053 - 0.0% - - 0.0%
Total Measure W 128,053 - 0.0% - - 0.0%
PLAN FILE MAINTENANCE (260)
Public Works Admin 30,000 - 0.0% - - 0.0%
Building Contract Services 40,749 27,884 68.4% 55,222 (27,338) -49.5%
Total Plan File Maintenance 70,749 27,884 39.4% 55,222 (27,338) -49.5%
MEASURE H (261)
Homeless Services 305,700 - 0.0% - - 0.0%
Total Measure H 305,700 - 0.0% - - 0.0%
Affordable Housing (FUND 285)
City Manager 13,707 12,179 88.9% 10,932 1,247 11.4%
Finance 20,903 17,041 81.5% 15,351 1,689 11.0%
Planning 71,000 55,281 77.9% 32,843 22,438 68.3%
Environmental Services - - 0.0% 4,680 (4,680) -100.0%
Transfers 12,175 12,175 100.0% - 12,175 100.0%
. .
Total Affordable Housing Fund 117,785 96,676 82.1% 63,807 32,869 51.5%
Total Special Revenue Funds 12,270,252 5,398,644 44.0% 6,014,400 (615,757) -10.2%
CAPITAL PROJECTS FUNDS
Prior Year
Amended YTD % of YTD $ %
Fund & Description Budget Actual + Enc Budget Actual Variance Variance
Current Vs. Prior Year
Expenditures Detail Report
At March 31, 2020
75% of Fiscal Year Complete
Current Year
CAPITAL PROJECTS FUND (321)
Planning - - 0.0% 65,837 (65,837) -100.0%
Transportation 55,290 55,290 100.0% - 55,290 100.0%
Engineering Contract Services (Gold Line) 303,890 134,622 44.3% 141,777 (7,155) -5.0%
Library Admin Equipment 21,766 19,154 88.0% - 19,154
Capital Projects 1,540,673 441,904 28.7% 1,644,455 (1,202,551) -73.1%
Total Capital Projects Fund 1,921,619 650,970 33.9% 1,852,070 (1,201,100) -64.9%
STORMWATER PROJECT (322)
Transfer for Capital Projects 2,115,839 2,115,839 100.0% - 2,115,839 100.0%
Total Stormwater Project 2,115,839 2,115,839 100.0% - - 100.0%
ENERGY EFFICIENCY PROJECT (405)
Debt Service 81,005 81,005 100.0% 38,600 42,405 109.9%
Total Energy Efficiency Project 81,005 81,005 100.0% 38,600 42,405 109.9%
Total Capital Projects Funds 4,118,463 2,847,814 69.1% 1,890,670 957,144 50.6%
DEBT SERVICE FUNDS
PENSION OBLIGATION BONDS (401)
Debt Service Interest 1,207,982 1,207,982 100.0% - 1,207,982 100.0%
Debt Service Principal 1,715,000 1,715,000 100.0% - 1,715,000 100.0%
Total Pension Obligation Bonds 2,922,982 2,922,982 100.0% - 2,922,982 100.0%
ENTERPRISE FUNDS
WATER CAPITAL PROJECTS (530)
Engineering 48,117 28,820 59.9% 55,656 (26,836) -48.2%
Capital Projects 13,793,203 4,035,463 29.3% 4,657,234 (621,771) -13.4%
Total Water Capital Projects 13,841,320 4,064,283 29.4% 4,712,890 (648,607) -13.8%
WATER OPERATIONS (531)
City Council 30,833 22,074 71.6% 21,943 132 0.6%
City Clerk 105,764 76,634 72.5% 67,613 9,020 13.3%
City Attorney 10,000 (17,532) -175.3% - (17,532) 100.0%
City Manager 132,181 85,725 64.9% 102,723 (16,998) -16.5%
Human Resources 175,448 110,888 63.2% 79,179 31,709 40.0%
Finance 945,480 563,415 59.6% 527,569 35,846 6.8%
Non-Department 71,000 30,694 43.2% 33,930 (3,236) -9.5%
Production 6,080,852 1,615,469 26.6% 4,435,329 (2,819,861) -63.6%
Police Community Preservation 8,017 5,744 71.7% 786 4,958 630.7%
Public Works Administration 350,981 196,458 56.0% 239,412 (42,954) -17.9%
Streets 293,133 198,401 67.7% 145,409 52,992 36.4%
Building 14,768 7,565 51.2% 39,751 (32,186) -81.0%
Engineering 628,902 319,376 50.8% 435,376 (116,000) -26.6%
Maintenance 30,577 19,716 64.5% 20,712 (996) -4.8%
Water Administration 1,517,476 1,055,412 69.6% 992,737 62,675 6.3%
Water Customer Service 586,180 343,214 58.6% 377,740 (34,527) -9.1%
Water Conservation 510,195 341,598 67.0% 253,947 87,650 34.5%
Water Transmission/Distribution 1,945,314 1,282,714 65.9% 1,093,566 189,149 17.3%
Parks 53,749 39,382 73.3% 31,855 7,527 23.6%
Street Trees 15,200 15,200 100.0% 15,200 - 0.0%
Subtotal Operations 13,506,051 6,312,146 46.7% 8,914,778 (2,602,632) -29.2%

Prior Year
Amended YTD % of YTD $ %
Fund & Description Budget Actual + Enc Budget Actual Variance Variance
Current Vs. Prior Year
Expenditures Detail Report
At March 31, 2020
75% of Fiscal Year Complete
Current Year
Debt Service Interest 746,662 746,663 100.0% 796,913 (50,250) -6.3%
Debt Service Principal 1,235,000 1,235,000 100.0% 1,185,000 50,000 4.2%
Subtotal Debt Service 1,981,662 1,981,663 100.0% 1,981,913 (250) 0.0%
Transfer to DS - Energy Efficiency 34,022 34,022 100.0% 32,424 1,598 4.9%
Transfer to Capital Projects Fund 5,000,000 - 0.0% - - 0.0%
Transfer to LMD 965 965 100.0% - 965 100.0%
Transfer to POB 465,945 465,945 100.0% - 465,945 100.0%
Subtotal Transfers 5,500,932 500,932 9.1% 32,424 2,563 7.9%
Total Water Operations 20,988,646 8,794,741 41.9% 10,929,114 (2,134,373) -19.5%
Total Enterprise Funds 34,829,966 12,859,024 36.9% 15,642,005 (2,782,980) -17.8%
INTERNAL SERVICE FUNDS
WORKERS' COMPENSATION (541)
Human Resources 139,820 78,112 55.9% 80,482 (2,370) -2.9%
Finance 65,772 18,197 27.7% 7,529 10,668 141.7%
Risk Management 815,320 693,597 85.1% 557,533 136,064 24.4%
Transfers 18,208 18,208 100.0% - 18,208 100.0%
Total Workers' Compensation Fund 1,039,120 808,114 77.8% 645,544 162,570 25.2%
GENERAL LIABILITY (542)
City Attorney 30,000 6,205 20.7% 13,637 (7,432) -54.5%
Human Resources - - 0.0% 80,481 (80,481) -100.0%
Finance 155,028 68,185 44.0% 54,159 14,026 25.9%
Risk Management 1,546,000 1,515,800 98.0% 1,337,231 178,568 13.4%
Transfers 17,121 17,121 100.0% - 17,121 100.0%
Total General Liability 1,748,148 1,607,311 91.9% 1,485,509 121,803 8.2%
TECHNOLOGY (548)
City Clerk 25,323 - 0.0% - - 0.0%
Finance 7,760 5,815 74.9% 21,181 (15,366) -72.5%
Information Systems 1,415,776 1,032,267 72.9% 667,705 364,562 54.6%
Police Info Systems 483,597 339,068 70.1% 422,868 (83,800) -19.8%
Transfers 91,268 91,268 100.0% - 91,268 100.0%
Total Technology Fund 2,023,725 1,468,419 72.6% 1,111,754 356,665 32.1%
VEHICLE REPLACEMENT (549)
Finance 5,219 3,846 73.7% 3,671 175 4.8%
Vehicles Operations 901,391 713,329 79.1% 702,774 10,556 1.5%
Vehicle Purchases 1,098,560 113,408 10.3% 652,941 (539,533) -82.6%
Capital Projects 30,204 30,204 100.0% - 30,204 100.0%
Total Vehicle Replacement 2,035,374 860,788 42.3% 1,359,386 (498,598) -36.7%
TOTAL INTERNAL SERVICE 6,846,367 4,744,632 69.3% 4,602,193 142,440 3.1%
GLENDORA HOUSING AUTHORITY (290)
Housing Authority 253,002 148,823 58.8% 141,227 7,596 5.4%
Total Glendora Housing Authority 253,002 148,823 58.8% 141,227 7,596 5.4%

Prior Year
Amended YTD % of YTD $ %
Fund & Description Budget Actual + Enc Budget Actual Variance Variance
Current Vs. Prior Year
Expenditures Detail Report
At March 31, 2020
75% of Fiscal Year Complete
Current Year
SUCCESSOR AGENCY (400)
Planning, CRA, Housing 21,200 8,022 37.8% 4,969 3,054 61.5%
Transfer to General Fund 250,000 250,000 100.0% 250,000 - 0.0%
Debt Service 2,045,829 2,045,829 100.0% 2,041,823 4,006 0.2%
Total Successor Agency 2,317,029 2,303,851 99.4% 2,296,792 7,059 0.3%
Total Successor Agency Funds 2,317,029 2,303,851 99.4% 2,296,792 7,059 0.3%
GRAND TOTAL ALL FUNDS 98,144,180 56,031,642 57.1% 51,317,301 7,637,322 14.9%
Funding Source
Amended
Budget
YTD
Expenditures +
Encumbrances
Remaining
Budget NOC/Completed
208 - Asset Forfeiture
1 - FACILITIES
Police Security Camera System Replacement /
Security Project at Parks/City Yard 175,000 169,816 5,184
Police Outdoor Locker Replacement 22,835 - 22,835
208 - Asset Forfeiture Total 197,835 169,816 28,019
209 - Prop A
2 - STREETS
Transportation Roof Replacement 23,430 - 23,430
209 - Prop A Total 23,430 - 23,430
211 - Prop C
2 - STREETS
Loraine Avenue Street Rehabilitation 900,297 900,297 0
Lonehill Phase 1 475,000 - 475,000
Lone Hill Ave Improvements Phase 2 (330) - (330) NOC 8.27.19
Urban Trail and Greenway Network** 210,000 - 210,000
211 - Prop C Total 1,584,968 900,297 684,671
212 - CDBG
2 - STREETS
CDBG Funded Tract per Action Plan 130,764 - 130,764
Bonita Avenue and Dale Road 185,000 - 185,000
212 - CDBG Total 315,764 - 315,764
221 - Surface Transportation Local Program
2 - STREETS
Barranca/Foothill Left Turn Phasing - - - NOC 9.10.19
221 - Surface Transportation Local Program Total - - -
222 - Measure R
2 - STREETS
Traffic Signal Enhancements 112,713 102,466 10,247 NOC 11.12.19
Traffic Signal Study 100,000 6,720 93,280
222 - Measure R Total 212,713 109,186 103,527
234 - Highway Safety Improvement Program
2 - STREETS
Barranca/Foothill Left Turn Phasing - - - NOC 9.10.19
Pedestrian Crossing Enhancement Elementary
Schools 550,000 - 550,000
234 - Highway Safety Improvement Program Total 550,000 - 550,000
246 - Highway Bridger Replacement and Rehab
2 - STREETS
San Dimas Wash Bridge Improvements Design 220,830 - 220,830
234 - Highway Bridger Replacement and Rehab Total 220,830 - 220,830
255 - Measure M
2 - STREETS
Street - Lone Hill Avenue Improvements Phase 2 8,955 4,516 4,439
Dike Lane and Other Street Rehabilitation 418,000 - 418,000
Slurry Seal 30,960 8,788 22,172 NOC 10.22.19
Leadora Resurfacing Design 154,451 90,701 63,750
Leadora Resurfacing Construction 34,532 400 34,132 NOC 9.24.19
Loraine Avenue Street Rehabilitation 250,000 175,000 75,000
Citywide Pavement Evaluation Update 50,000 - 50,000
255 - Measure M Total 946,898 279,405 667,493
256 - Road Maintenance Rehabilitation
2 - STREETS
Barranca/Left Turn Phasing - 14 (14) NOC 9.10.19
San Dimas Wash Bridge Improvements Design 26,462 - 26,462
Ada Street Rehabilitation 357,500 - 357,500
Laurel Street Rehabilitation 174,339 - 174,339 NOC 10.22.19
Capital Improvement Projects Summary Report
At March 31, 2020 - 75% of fiscal year complete
NOC - Notice of Completion and date Council accepted
*Project budgets for FY19 and earlier have not yet been carried forward

Funding Source
Amended
Budget
YTD
Expenditures +
Encumbrances
Remaining
Budget NOC/Completed
Leadora Resurfacing Construction 20,791 - 20,791 NOC 9.24.19
Cullen Avenue Street Rehabilitation 130,000 - 130,000
Loraine Avenue Street Rehabilitation 220,000 209,999 10,001
Sunflower Avenue Street Rehabilitation 600,000 - 600,000
256 - Road Maintenance Rehabilitation Total 1,529,092 210,013 1,319,079
257 - Active Transportation Program
2 - STREETS
Glendora Urban Trail & Greenway Network 268,000 - 268,000
257 - Active Transportation Program 268,000 - 268,000
321 - Capital Projects
1 - FACILITIES
Goldline 146,890 134,622 12,268
Police Parking Lot Perimeter Security - - - NOC 8.27.19
City Hall Door Security 30,000 26,500 3,500 Complete
City Hall/Legion/Police La Fetra HVAC Thermostat
Replace 41,754 13,918 27,836 Complete
City Hall Sewer line replacement 16,975 - 16,975
Marquee for PD/Library area 39,500 - 39,500
City Hall Elevator timer upgrade 8,700 - 8,700
Chamber of Commerce Roof Replacement 13,230 580 12,650
Police Replace Secure Doors 43,000 - 43,000
Streets Yard Replace Security System 25,000 - 25,000
Library Fire Alarm System 20,075 - 20,075
Library Elevator Modernization 87,460 84,785 2,675 NOC 8.27.19
Library HVAC - AC Controller 75,573 75,573 - NOC 10.8.19
Police Replace Security System (Obracom) - - -
Library ADA Signage 6,500 6,318 182
Teen Center Replace HVAC 129,760 128,950 810 NOC 12.10.19
Teen Center Replace Roof 34,463 36,577 (2,114)
City Hall Signage 85,000 - 85,000
IT Workspace Remodel 40,000 - 40,000
City wide ERP & Land Management IT Assessment
Plan 75,000 - 75,000
Citywide Security Analysis and Implementation 100,000 - 100,000
Citywide Space Planning Assessment 50,000 200 49,800
Citywide Facility Assessments 50,000 - 50,000
Library Roof Repairs 26,000 - 26,000
Library-Office Space for Admin 24,595 - 24,595
La Fetra Demo and Rebuild Exterior Stairs 15,000 - 15,000
Legion Building ADA Front Door Replacement 6,500 - 6,500
1 - FACILITIES Total 1,190,974 508,023 682,951
2 - STREETS
Parking Lot Rehabilitation Project 221,587 68,503 153,084
2 - STREETS Total 221,587 68,503 153,084
3 - PARKS
Gladstone Water Park + Splashpad 275,000 - 275,000
3 - PARKS Total 275,000 - 275,000
321 - Capital Projects Total 1,687,562 576,526 1,111,036
530 - Water Capital Projects
2 - STREETS
Loraine Avenue Street Rehabilitation 280,000 266,000 14,000
Cullen Avenue Street Improvement 40,000 - 40,000
Sunflower Avenue Street Improvement 100,000 - 100,000
2 - STREETS Total 420,000 266,000 154,000
4 - WATER TRANS & DIST
Water Main Replacement Live Oak 7,223 - 7,223
Gladstone Reservoir (8) and Booster Demolition 949,290 2,908 946,382
Loraine Ave Water Main Replacement 1,186,597 1,139,799 46,799
Well 7 Sampling Study 45,565 - 45,565 NOC 8.27.19
Water Yard NPDES Plan Survey & Design 118,500 - 118,500
Ada Water Main Replacement 542,574 472,932 69,642
Alley 1 Water Main Replacement 607,132 334,931 272,202
Alley 2 Water Main Replacement 575,703 342,783 232,920
Dike Lane & Others Water Main Replacement 1,460,849 1,076,926 383,922
Route 66 Water Main Replacement 268,000 340 267,660
Wick Lane Water Main Replacement 213,000 - 213,000
Zara & Sellers Water Main Replacement 720,000 4,523 715,477
NOC - Notice of Completion and date Council accepted
*Project budgets for FY19 and earlier have not yet been carried forward

Funding Source
Amended
Budget
YTD
Expenditures +
Encumbrances
Remaining
Budget NOC/Completed
San Gabriel River Inlet Structure 78 - 78 Completed
Bluebird Booster & Distribution System 647,558 365,764 281,794
Big Dalton Pump Station 1,000,000 - 1,000,000
Hook Canyon Booster Station Generator Correction
Panel 55,000 - 55,000
San Gabriel Plant Emergency Generator Power Load
Reallocation and Management 330,000 - 330,000
Silent Ranch Boosters Upgrade 70,000 - 70,000
Water Yard Booster Pump Panel 170,000 - 170,000
Arrow Highway and Sunflower Water Main 550,000 - 550,000
Bender Carter Sante Fe Newburgh Water Main 2,212,600 - 2,212,600
Cossacks Water Main 269,100 - 269,100
Cullen Water Main 209,300 - 209,300
Donnington Water Main 358,800 - 358,800
Gordon Resevoirs Cathodic Protection 35,000 - 35,000
North Gordon Reserviors Coating 150,000 70 149,930
Country Club Reservoir 8,100 8,048 52
Main Replacement 543,234 - 543,234
4 - WATER TRANS & DIST Total 13,373,203 3,749,023 9,624,180
530 - Water Capital Projects Total 13,793,203 4,015,023 9,778,180
Grand Total 21,330,294 6,260,266 15,070,028
NOC - Notice of Completion and date Council accepted
*Project budgets for FY19 and earlier have not yet been carried forward

Project Description
Budget FY 2019-
20
YTD Actual +
Encumb.
Remaining
Budget
2 - STREETS
Ada Street Rehabilitation
256 357,500 - 357,500
Ada Street Rehabilitation Total 357,500 - 357,500
Barranca/Foothill Left Turn Phasing
221 - - -
234 - - -
Barranca/Foothill Left Turn Phasing Total - - -
Barranca/Left Turn Phasing
256 - 14 (14)
Barranca/Left Turn Phasing Total - 14 (14)
Bonita Avenue and Dale Road
212 185,000 - 185,000
Bonita Avenue and Dale Road Total 185,000 - 185,000
CDBG Funded Tract per Action Plan
212 130,764 - 130,764
CDBG Funded Tract per Action Plan Total 130,764 - 130,764
Citywide Pavement Evaluation Update
255 50,000 - 50,000
Citywide Pavement Evaluation Update Total 50,000 - 50,000
Cullen Avenue Street Improvement
530 40,000 - 40,000
Cullen Avenue Street Improvement Total 40,000 - 40,000
Capital Improvement Projects Report
Street and Water Type Projects by Fund
As of March 31, 2020

Project Description
Budget FY 2019-
20
YTD Actual +
Encumb.
Remaining
Budget
Capital Improvement Projects Report
Street and Water Type Projects by Fund
As of March 31, 2020
Cullen Avenue Street Rehabilitation
256 130,000 - 130,000
Cullen Avenue Street Rehabilitation Total 130,000 - 130,000
Dike Lane and Other Street Rehabilitation
255 418,000 - 418,000
Dike Lane and Other Street Rehabilitation Total 418,000 - 418,000
Glendora Urban Trail & Greenway Network
257 268,000 - 268,000
Glendora Urban Trail & Greenway Network Total 268,000 - 268,000
Leadora Resurfacing Construction
255 34,532 400 34,132
256 20,791 - 20,791
Leadora Resurfacing Construction Total 55,323 400 54,923
Leadora Resurfacing Design
255 154,451 90,701 63,750
Leadora Resurfacing Design Total 154,451 90,701 63,750
Lone Hill Ave Improvements Phase 2
211 (330) - (330)
Lone Hill Ave Improvements Phase 2 Total (330) - (330)
Lonehill Phase 1
211 475,000 - 475,000
Lonehill Phase 1 Total 475,000 - 475,000

Project Description
Budget FY 2019-
20
YTD Actual +
Encumb.
Remaining
Budget
Capital Improvement Projects Report
Street and Water Type Projects by Fund
As of March 31, 2020
Loraine Avenue Street Rehabilitation
211 900,297 900,297 0
255 250,000 175,000 75,000
256 220,000 209,999 10,001
530 280,000 266,000 14,000
Loraine Avenue Street Rehabilitation Total 1,650,297 1,551,296 99,001
Parking Lot Rehabilitation Project
321 221,587 68,503 153,084
Parking Lot Rehabilitation Project Total 221,587 68,503 153,084
Pedestrian Crossing Enhancement Elementary Schools
234 550,000 - 550,000
Pedestrian Crossing Enhancement Elementary Schools Total 550,000 - 550,000
San Dimas Wash Bridge Improvements Design
246 220,830 - 220,830
256 26,462 - 26,462
San Dimas Wash Bridge Improvements Design Total 247,292 - 247,292
Slurry Seal
255 30,960 8,788 22,172
Slurry Seal Total 30,960 8,788 22,172
Street - Lone Hill Avenue Improvements Phase 2
255 8,955 4,516 4,439
Street - Lone Hill Avenue Improvements Phase 2 Total 8,955 4,516 4,439
Sunflower Avenue Street Improvement
530 100,000 - 100,000
Sunflower Avenue Street Improvement Total 100,000 - 100,000

Project Description
Budget FY 2019-
20
YTD Actual +
Encumb.
Remaining
Budget
Capital Improvement Projects Report
Street and Water Type Projects by Fund
As of March 31, 2020
Sunflower Avenue Street Rehabilitation
256 600,000 - 600,000
Sunflower Avenue Street Rehabilitation Total 600,000 - 600,000
Traffic Signal Enhancements
222 112,713 102,466 10,247
Traffic Signal Enhancements Total 112,713 102,466 10,247
Traffic Signal Study
222 100,000 6,720 93,280Traffic Signal Study Total 100,000 6,720 93,280
Transportation Roof Replacement209 23,430 - 23,430
Transportation Roof Replacement Total 23,430 - 23,430
Urban Trail and Greenway Network211 210,000 - 210,000
Urban Trail and Greenway Network Total 210,000 - 210,000
Laurel Street Rehabilitation256 174,339 - 174,339
Laurel Street Rehabilitation Total 174,339 - 174,339
2 - STREETS Total 6,293,282 1,833,404 4,459,878

Project Description
Budget FY 2019-
20
YTD Actual +
Encumb.
Remaining
Budget
Capital Improvement Projects Report
Street and Water Type Projects by Fund
As of March 31, 2020
4 - WATER TRANS & DIST
Ada Water Main Replacement530 542,574 472,932 69,642
Ada Water Main Replacement Total 542,574 472,932 69,642
Alley 1 Water Main Replacement530 607,132 334,931 272,202
Alley 1 Water Main Replacement Total 607,132 334,931 272,202
Alley 2 Water Main Replacement530 575,703 342,783 232,920
Alley 2 Water Main Replacement Total 575,703 342,783 232,920
Arrow Highway and Sunflower Water Main530 550,000 - 550,000
Arrow Highway and Sunflower Water Main Total 550,000 - 550,000
Bender, Carter, Sante Fe, Newburgh Water Main530 2,212,600 - 2,212,600
Bender, Carter, Sante Fe, Newburgh Water Main Total 2,212,600 - 2,212,600
Big Dalton Pump Station530 1,000,000 - 1,000,000
Big Dalton Pump Station Total 1,000,000 - 1,000,000
Bluebird Booster & Distribution System530 647,558 365,764 281,794
Bluebird Booster & Distribution System Total 647,558 365,764 281,794

Project Description
Budget FY 2019-
20
YTD Actual +
Encumb.
Remaining
Budget
Capital Improvement Projects Report
Street and Water Type Projects by Fund
As of March 31, 2020
Cossacks Water Main530 269,100 - 269,100
Cossacks Water Main Total 269,100 - 269,100
Country Club Reservoir530 8,100 8,048 52
Country Club Reservoir Total 8,100 8,048 52
Cullen Water Main530 209,300 - 209,300
Cullen Water Main Total 209,300 - 209,300
Dike Lane & Others Water Main Replacement530 1,460,849 1,076,926 383,922
Dike Lane & Others Water Main Replacement Total 1,460,849 1,076,926 383,922
Donnington Water Main530 358,800 - 358,800
Donnington Water Main Total 358,800 - 358,800
Gladstone Reservoir (8) and Booster Demolition530 949,290 2,908 946,382
Gladstone Reservoir (8) and Booster Demolition Total 949,290 2,908 946,382
Hook Canyon Booster Station Generator Correction Panel530 55,000 - 55,000
Hook Canyon Booster Station Generator Correction Panel Total 55,000 - 55,000
Loraine Ave Water Main Replacement530 1,186,597 1,139,799 46,799
Loraine Ave Water Main Replacement Total 1,186,597 1,139,799 46,799
Main Replacement

Project Description
Budget FY 2019-
20
YTD Actual +
Encumb.
Remaining
Budget
Capital Improvement Projects Report
Street and Water Type Projects by Fund
As of March 31, 2020
530 543,234 - 543,234Main Replacement Total 543,234 - 543,234
Route 66 Water Main Replacement530 268,000 340 267,660
Route 66 Water Main Replacement Total 268,000 340 267,660
San Gabriel Plant Emergency Generator Power Load Reallocation and
Management
530 330,000 - 330,000San Gabriel Plant Emergency Generator Power Load Reallocation and
Management Total 330,000 - 330,000
San Gabriel River Inlet Structure530 78 - 78
San Gabriel River Inlet Structure Total 78 - 78
Silent Ranch Boosters Upgrade530 70,000 - 70,000
Silent Ranch Boosters Upgrade Total 70,000 - 70,000
Water Main Replacement Live Oak530 7,223 - 7,223
Water Main Replacement Live Oak Total 7,223 - 7,223
Water Yard Booster Pump Panel530 170,000 - 170,000
Water Yard Booster Pump Panel Total 170,000 - 170,000
Water Yard NPDES Plan Survey & Design530 118,500 - 118,500
Water Yard NPDES Plan Survey & Design Total 118,500 - 118,500

Project Description
Budget FY 2019-
20
YTD Actual +
Encumb.
Remaining
Budget
Capital Improvement Projects Report
Street and Water Type Projects by Fund
As of March 31, 2020
Well 7 Sampling Study530 45,565 - 45,565
Well 7 Sampling Study Total 45,565 - 45,565
Wick Lane Water Main Replacement530 213,000 - 213,000
Wick Lane Water Main Replacement Total 213,000 - 213,000
Zara & Sellers Water Main Replacement530 720,000 4,523 715,477
Zara & Sellers Water Main Replacement Total 720,000 4,523 715,477
Gordon Reservoirs Cathodic Protection530 35,000 - 35,000
Gordon Reservoirs Cathodic Protection Total 35,000 - 35,000
North Gordon Reservoirs Coating530 150,000 70 149,930
North Gordon Reservoirs Coating Total 150,000 70 149,930
Vosberg Well 7 Feasibility530 70,000 - 70,000
Vosberg Well 7 Feasibility Total 70,000 - 70,000
4 - WATER TRANS & DIST Total 13,373,203 3,749,023 9,624,180