2019-20 annual statistical report - earth resources
TRANSCRIPT

Earth Resources Regulation
2019-20 Annual Statistical Report

Earth Resources Regulation 2019-20 Annual Statistical Report Page 2
Acknowledgement of Victoria’s Traditional Owners
The Victorian Government proudly acknowledges Victorian Traditional Owners as Victoria’s first peoples and pays its respects to their Elders past and present.
We recognise the intrinsic connection of the first peoples to their Country for countless generations and their inherent obligation to maintain and strengthen their distinct cultural rights and responsibilities to care for their Country.
We value Traditional Owners’ role in the management of land, water and biodiversity and acknowledge the ongoing contribution this makes to our earth resources.
We have distinct legislative obligations to Traditional Owner groups that are paramount in our responsibilities in managing Victoria’s resources.
We support the need for genuine and lasting partnerships with Aboriginal people and communities to understand culture and connections to Country in the way we plan for and regulate our earth resources.
Disclaimer
The information contained in this report is provided for general guidance and assistance only and is not intended as advice. You should make your own enquiries as to the appropriateness and suitability of the information provided. While every effort has been made to ensure the currency, accuracy or completeness of the content we endeavour to keep the content relevant and up to date and reserve the right to make changes as required. The Victorian Government, authors and presenters do not accept any liability to any person for the information (or the use of the information) which is provided or referred to in the report.
Authorised by the Victorian Government Department of Jobs, Precincts and Regions 1 Spring Street Melbourne Victoria 3000 Telephone (03) 9651 9999
© Copyright State of Victoria, Department of Jobs, Precincts and Regions 2020
Except for any logos, emblems, trademarks, artwork and photography this document is made available under the terms of the Creative Commons Attribution 3.0 Australia licence.
For more information see the Earth Resources Regulation website www.earthresources.vic.gov.au/earth-resources-regulation
This document is also available in PDF and accessible Word format at http://earthresources.vic.gov.au/earth-resources-regulation/about-us/regulator-and-industry-reporting/earth-resources-regulation-annual-statistical-report/

Earth Resources Regulation 2019-20 Annual Statistical Report Page 3
TABLE OF CONTENTS
1 Introduction ............................................................................................................................. 4
2 Extractives ............................................................................................................................... 5
2.1 Production ......................................................................................................................................5
2.2 Work Authority ...............................................................................................................................8
2.3 Extractive work plans and administrative updates by notification .........................................8
3 Minerals .................................................................................................................................... 9
3.1 Mineral exploration and mining expenditure..............................................................................9
3.2 Mineral production....................................................................................................................... 13
3.3 Mineral tenements ....................................................................................................................... 15
3.4 Mineral work plans and administrative updates by notification ............................................ 18
4 Petroleum, geothermal, offshore pipelines and greenhouse gas .................................. 19
4.1 Gas production and storage ....................................................................................................... 19
4.2 Drilling ........................................................................................................................................... 20
4.3 Petroleum, offshore pipelines, geothermal and greenhouse gas licences .......................... 21
5 Revenue ................................................................................................................................. 22
5.1 Royalties Payable ........................................................................................................................ 22
5.2 Regulatory Fees ........................................................................................................................... 23
6 Rehabilitation Bonds ............................................................................................................ 24
6.1 Bonds Held ................................................................................................................................... 24
6.2 Bond Reviews .............................................................................................................................. 25
7 Compliance ............................................................................................................................ 26
7.1 Industry annual returns submission rate ................................................................................. 27

Earth Resources Regulation 2019-20 Annual Statistical Report Page 4
1 Introduction
Earth Resources Regulation, within the Department of Jobs, Precincts and Regions (DJPR), is responsible for the regulation of minerals, extractives, petroleum, geothermal and carbon storage activities in Victoria and offshore Victorian waters and offshore pipelines in Victorian waters1. Earth Resources Regulation’s role includes granting rights to access resources, assessing works and setting controls for the extraction of resources, conducting compliance operations to ensure that authority holders fulfil their regulatory obligations, setting site rehabilitation bonds and ensuring that authority holders rehabilitate their sites, engaging with communities and stakeholders, and collecting regulatory fees and royalties. We are committed to being an effective regulator. Earth Resources Regulation administers the following Acts:
• Mineral Resources (Sustainable Development) Act 1990 (MRSDA) (mineral exploration mining and quarrying)
• Petroleum Act 1998 (petroleum exploration and development onshore)
• Offshore Petroleum and Greenhouse Gas Storage Act 2010 (OPGGSA) (petroleum exploration and development, greenhouse gas storage and pipelines in the Victorian offshore waters)
• Geothermal Energy Resources Act 2005 (geothermal energy exploration and development)
• Greenhouse Gas Geological Sequestration Act 2008 (greenhouse gas storage onshore)
• Extractive Industries (Lysterfield) Act 1986
• Nuclear Activities (Prohibitions) Act 1983
• Underseas Mineral Resources Act 1963
• Mines (Aluminium Agreement) Act 1961
Key observations and statistics from the 2019-20 returns include: Extractive operations
• Rock production increased 0.4% from 62.9 to 63.1 million tonnes (Table 2.1)
• Value of sales increased 3.7% from $1,023.3 million to $1061.3 million (Table 2.1)
• Work Plan Approvals increased by 5 from 15 to 20 (Table 2.2.1)
• Administrative updates by notification acknowledgements increased by 3 from 14 to 17 (Table 2.2.3) Minerals Exploration and Mining operations
• Exploration expenditure increased 22.7% from $101.1.0 to $124.0 million (Table 3.1.1)
• Mining expenditure increased 13.8% from $734.9 to $836.3 million (Table 3.1.1)
• Gold exploration expenditure increased 42.3% from $57.2 to $81.4 million (Table 3.1.2)
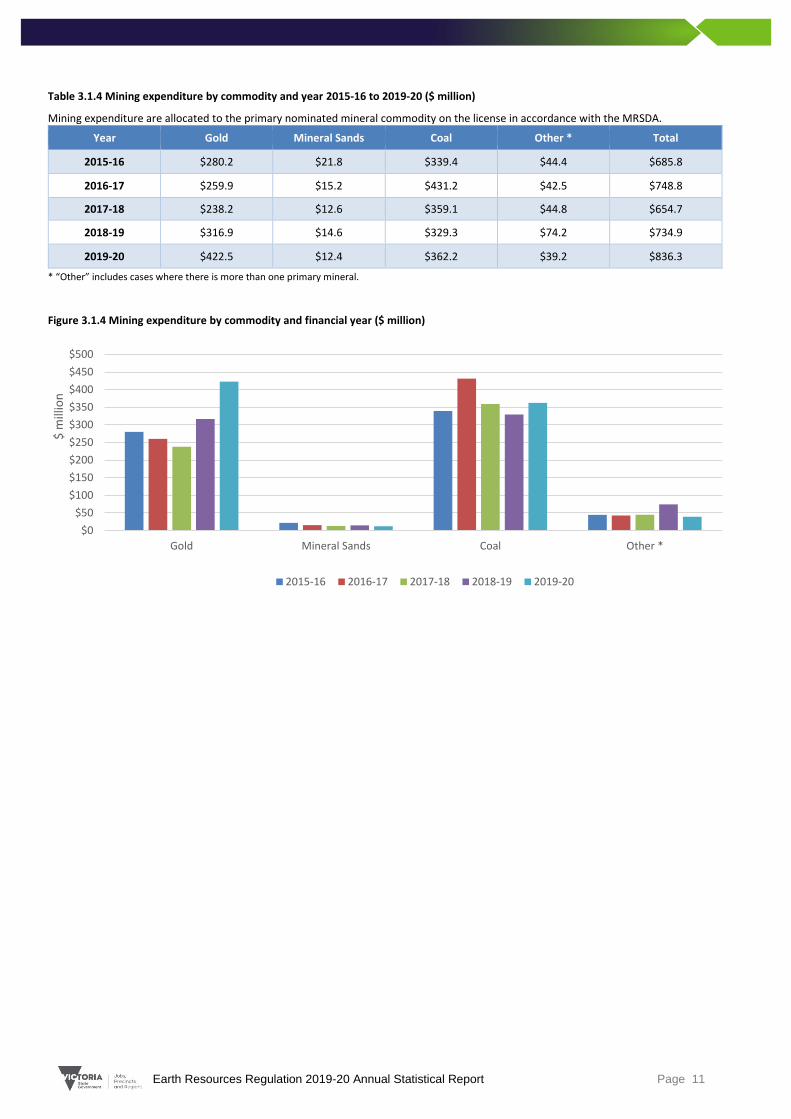
• Gold mining expenditure increased 33.3% from $316.9 to $422.5 million (Table 3.1.4)
• Gold production increased 39.6% from 567,501 to 792,267 ounces (Table 3.2.1)
• Licence applications increased by 75.0% from 88 to 154 (Table 3.2.1) Petroleum
• Gas production decreased 37.6% from 14,523 (~15.40 petajoules of energy) to 9,069 million standard cubic feet (~9.83 petajoules of energy) (Table 4.1.1)
Royalties and Regulatory Fees
• Royalties payable increased 19.9% from $96.4 to $115.6 million (Table 5.1.1)
• Gold royalties accounted for 22.0% of total royalties payable ($25.4 out of $115.6 million) (Table 5.1.1)
• Revenue from regulatory fees was $6.2 million (Table 5.2.1) Rehabilitation bonds
• Total value of rehabilitation bonds held under the MRSDA was approximately $814.1 million. (Table 6.1.1)
The Earth Resources Regulation 2019-20 Statistical Report presents a compilation of data as reported by authority holders to Earth Resources Regulation. All production and expenditure figures are certified by authority holders. As at 07 December 2020, 88 per cent of MRSDA licence holders have submitted an annual Production & Royalty / Expenditure & Activity report. The annual statistical report may be updated in the future as more Production & Royalty / Expenditure & Activity reports are received from the industry.
1 Victorian waters are within three nautical miles of the coastline.

Earth Resources Regulation 2019-20 Annual Statistical Report Page 5
2 Extractives Quarries predominantly produce hard rock, clay, sand and gravel, which are mostly used for constructing houses, public infrastructure and private sector developments.
2.1 Production
As at 30 June 2020, there were 860 quarries with a current work authority under the MRSDA. The number has remained relatively stable over the last seven years. As at 07 December 2020, a total of 506 quarries reported production in 2019-20. The production volume increased from 62.86.to 63.11 million tonnes and the value of sale increased from $1023.31 million to $1,061.29 million. Sales of quarry products fluctuate based on the demand from the domestic building and construction sector.
Table 2.1 Production and value of sales by financial year
2013-14 2014-15 2015-16 2016-17 2017-18 2018-19 2019-20
Current quarries at EOFY
884 884 888 888 881 873 860
Quarries with production
485 554 542 544 552 539 506
Production (million tonnes)
40.33 50.69 54.09 58.05 61.16 62.86 63.11
Value of sale ($million)
$676.55 $767.3 $801.01 $854.67 $989.17 $1,023.31 $1,061.29
Figure 2.1 Production and value of sales by financial year
$0
$200
$400
$600
$800
$1,000
$1,200
0
10
20
30
40
50
60
70
2013-14 2014-15 2015-16 2016-17 2017-18 2018-19 2019-20
Val
ue
of
sale
$ m
illio
n
Pro
du
ctio
n m
illio
n t
on
nes
Production (Tonnes) Value of Sales

Earth Resources Regulation 2019-20 Annual Statistical Report Page 6
Table 2.2 Extractive industry production and value of sales by product type last five financial years
Product Group Product Type Groups
FY2015-16 FY 2016-17 FY 2017-18 FY 2018-19 FY 2019-20
Production Volume (million tonnes)
Value of Sales
($ million)
Production Volume (million tonnes)
Value of Sales
($ million)
Production Volume (million tonnes)
Value of Sales
($ million)
Production Volume (million tonnes)
Value of Sales
($ million)
Production Volume (million tonnes)
Value of Sales
($ million)
Clay products
Brick 1.53 $2.97 1.07 $3.09 0.99 $3.02 0.94 $2.71 0.76 $2.08
Stoneware Pottery 0.0004 $0.01 0.001 $0.03 0.001 $0.04 0.004 $0.05 0.001 $0.02
Tile/Pipe 0.03 $0.07 0.03 $0.08 0.02 $0.08 - - - -
Clay products Total 1.56 $3.04 1.10 $3.20 1.01 $3.14 0.94 $2.75 0.77 $2.10
Limestone products
Agriculture 0.59 $17.40 0.52 $14.14 0.65 $17.46 0.62 $16.25 0.61 $17.43
Cement 0.04 $0.84 0.03 $0.57 0.08 $1.70 0.03 $0.72 0.03 $0.61
Lime 0.11 $1.87 0.15 $2.43 0.08 $1.57 0.07 $1.28 0.09 $1.63
Limestone products Total 0.74 $20.11 0.69 $17.15 0.80 $20.73 0.71 $18.26 0.73 $19.67
Miscellaneous
Dimension Stone 0.01 $0.83 0.07 $1.00 0.01 $0.25 0.00 $0.12 0.01 $0.29
Soil 0.03 $0.39 0.03 $0.42 0.05 $0.60 0.05 $0.59 0.02 $0.10
Unspecified 5.49 $62.03 3.57 $44.25 5.28 $61.44 2.86 $31.47 4.60 $70.69
Miscellaneous Total 5.53 $63.25 3.67 $45.66 5.33 $62.29 2.91 $32.18 4.63 $71.08
Multi size products
Fill 2.70 $27.37 3.33 $29.96 3.92 $38.97 3.79 $38.38 4.84 $46.41
Road Base 7.06 $98.15 6.48 $86.44 6.09 $104.25 7.62 $122.33 5.46 $90.89
Road Sub-Base 8.84 $109.03 10.56 $126.65 11.95 $144.31 12.88 $160.52 12.89 $175.22
Multi size products Total 18.60 $234.54 20.37 $243.05 21.96 $287.53 24.28 $321.22 23.18 $312.53
Sand products
Concrete Sand 9.82 $130.21 8.94 $124.40 7.20 $132.49 9.25 $151.73 8.00 $144.58
Fine Sand 1.95 $30.67 1.70 $16.95 2.50 $39.67 1.61 $19.33 3.01 $43.48
Foundry Sand 0.01 $0.06 0.74 $17.22 0.003 $0.04 0.86 $19.11 0.002 $0.10
Industrial Filters 0.05 $0.42 0.03 $0.31 0.02 $0.12 0.02 $0.20 - -
Sand products Total 11.82 $161.37 11.41 $158.88 9.72 $172.33 11.74 $190.37 11.01 $188.15
Single size products Aggregate 15.76 $317.49 20.70 $385.08 22.27 $441.86 21.36 $427.62 22.73 $466.01
Armour 0.08 $1.21 0.10 $1.64 0.07 $1.30 0.92 $30.90 0.06 $1.73
Single size products Total 15.84 $318.70 20.80 $386.72 22.33 $443.15 22.28 $458.53 22.80 $467.75
Financial Year Total 54.09 $801.01 58.05 $854.67 61.16 $989.17 62.86 $1,023.31 63.11 $1,061.29
Note: The numbers shown in this table may vary from previous reports due to the inclusions of data from late legislative report submissions

Earth Resources Regulation 2019-20 Annual Statistical Report Page 7
Table 2.3 Extractive industries production and value of sales by rock type last five financial years
Rock Group Rock Type
FY 2015-16 FY 2016-17 FY 2017-18 FY 2018-19 FY 2019-20
Production (million tonnes)
Value of Sales
($ million)
Production (million tonnes)
Value of Sales
($ million)
Production (million tonnes)
Value of Sales
($ million)
Production (million tonnes)
Value of Sales
($ million)
Production (million tonnes)
Value of Sales
($ million)
Hard Rock
Basalt 18.53 $312.52 20.78 $333.98 23.33 $382.01 25.46 $435.24 25.91 $444.57
Dolerite - - - - 0.02 $0.23 0.001 $0.01 - -
Gneiss - - 0.03 $0.00 0.01 $0.01 0.01 $0.00 0.08 $1.92
Granite 5.37 $99.86 5.92 $104.98 5.37 $123.00 5.35 $117.65 7.06 $138.80
Hornfels 4.20 $59.30 5.01 $73.10 5.23 $85.85 5.22 $86.87 5.27 $89.60
Quartzite 0.08 $0.66 0.07 $0.54 0.03 $0.64 0.03 $0.75 0.01 $0.60
Rhyodacite 1.59 $35.83 1.80 $38.03 1.78 $43.64 1.51 $33.52 1.54 $35.53
Schist 0.24 $3.67 0.22 $4.04 0.27 $5.86 0.48 $9.31 0.43 $8.32
Slate 0.00 $0.64 0.03 $0.98 0.04 $1.25 0.04 $1.17 0.04 $1.36
Trachyte 0.02 $0.48 0.03 $0.54 0.04 $0.80 0.03 $0.70 0.03 $0.51
Hard Rock Total 30.04 $512.95 33.89 $556.19 36.13 $643.28 38.13 $685.22 40.37 $721.22
Soft Rock
Clay and Clay Shale 1.85 $3.67 1.37 $3.54 1.48 $3.90 1.20 $3.49 1.31 $4.83
Limestone 1.84 $31.04 1.78 $25.58 1.80 $28.62 1.98 $28.91 1.93 $30.87
Sand and Gravel 16.49 $212.31 16.62 $217.02 16.89 $253.79 16.67 $248.87 14.70 $246.23
Scoria 0.74 $11.01 0.69 $11.41 1.15 $18.07 0.76 $12.97 0.92 $15.09
Sedimentary* 2.77 $26.86 2.95 $37.09 3.09 $36.13 3.76 $39.75 3.41 $39.10
Soil 0.03 $0.41 0.03 $0.42 0.05 $0.60 0.05 $0.62 0.06 $0.10
Tuff 0.33 $2.76 0.72 $3.44 0.58 $4.79 0.32 $3.48 0.41 $3.84
Soft Rock Total 24.05 $288.06 24.16 $298.48 25.04 $345.89 24.73 $338.09 22.73 $340.06
Financial Year Total 54.09 $801.01 58.05 $854.67 61.16 $989.17 62.86 $1,023.31 63.11 $1,061.29
*Sedimentary (usually rippable rocks including sandstone, shale, siltstone, chert, mudstone, claystone) Note: The numbers shown in this table may vary from previous reports due to the inclusions of data from late legislative report submissions

Earth Resources Regulation 2019-20 Annual Statistical Report Page 8
2.2 Work Authority
Table 2.4 Work authorities granted
2013-14 2014-15 2015-16 2016-17 2017-18 2018-19 2019-20
Work Authority
Granted 15 18 15 10 13 11 4
2.3 Extractive work plans and administrative updates by notification
A work plan is the primary document describing the permitted activities to be undertaken on a work authority. Work plan variation is to change the scope of work from an existing work plan.
Table 2.2.1 Extractive work plans and work plan variations submitted and approvals
2013-14 2014-15 2015-16 2016-17 2017-18 2018-19 2019-20
WP/WPV Submitted
21 21 31 35 16 21 28
WP/WPV Approved
13 8 19 16 20 15 20
Statutory Endorsement - Earth Resources Regulation have assessed and endorsed the work plan or work plan variations as having met the requirements under the MRSDA.
Table 2.2.2 Extractive work plans and work plan variations statutory endorsed
2013-14 2014-15 2015-16 2016-17 2017-18 2018-19 2019-20
WP/WPV Endorsed
* * 23 14 12 12 21
*Data not readily available
Administrative updates by notification are minor changes to the existing work plan with no significant increase in risk arising from the new or changing work. Administrative updates do not require statutory endorsement (no further planning permission required). The administrative updates by notification process was introduced at the end of FY2017-18.
Table 2.2.3 Extractive administrative updates by notifications received and acknowledged
2013-14 2014-15 2015-16 2016-17 2017-18 2018-19 2019-20
Received - - - - 3 14 29
Acknowledged - - - - 2 14 17

Earth Resources Regulation 2019-20 Annual Statistical Report Page 9
3 Minerals
3.1 Mineral exploration and mining expenditure
Table 3.1.1 Expenditure on mineral exploration and mining development ($ million)
2013-14 2014-15 2015-16 2016-17 2017-18 2018-19 2019-20
Mineral Exploration
(ABS)1 $32.6 $22.9 $28.9 $40.7 $73.7 $102.2 $136.5
MRSDA Exploration2 $30.5 $47.5 $38.5 $44.3 $69.0 $101.1 $124.0
MRSDA Mining3 $650.3 $607.8 $685.8 $748.8 $654.7 $734.9 $836.3
Source: Figures collated from activity reports forwarded to DJPR required under the MRSDA, and ABS, Actual and Expected Private
Mineral Exploration (https://www.abs.gov.au/statistics/industry/mining/mineral-and-petroleum-exploration-australia/latest-
release#data-download)
Figure 3.1.1 Expenditure on mineral exploration and mining
1 The ABS reports quarterly on private mineral exploration expenditure for all Australian states and the Northern Territory (NT). Victorian mineral exploration
and mining expenditure is also reported in accordance with the requirements of the MRSDA. The ABS exploration expenditure statistics can vary significantly
from expenditure reported under the MRSDA. The difference between these two exploration expenditure data sets is mainly due to the difference in
methodologies for data collection and the inclusion of the exploration expenditure on mining licences in the MRSDA figure. The ABS statistics are a valid basis
for comparison of Victorian expenditure with other states and territories. However, the MRSDA figures provide greater detail.
2 Change of metric - expenditure on Exploration and Retention Licences with an Expenditure Reporting Period that ends within the Financial Year.
3The MRSDA mining expenditure figure covers all expenditure on mining and prospecting licences (including capital and operating expenses), less any specified exploration expenditure on mining and prospecting licences.
0
100
200
300
400
500
600
700
800
900
2013-14 2014-15 2015-16 2016-17 2017-18 2018-19 2019-20
$ m
illio
n
Mineral Exploration (ABS) MRSDA Exploration MRSDA Mining

Earth Resources Regulation 2019-20 Annual Statistical Report Page 10
Table 3.1.2 Mineral exploration expenditure by commodity and financial year ($ million)
Exploration expenditure are allocated to the primary nominated mineral commodity on the license in accordance with the MRSDA.
Year Gold Mineral Sands Coal Other * Total
2015-16 $16.4 $6.5 $0.37 $15.3 $38.5
2016-17 $25.9 $5.1 $0.46 $12.7 $44.2
2017-18 $44.3 $8.1 $0.47 $16.1 $69.0
2018-19 $57.2 $24.2 $1.0 $18.7 $101.0
2019-20 $81.4 $23.9 $0.28 $18.5 $124.0
* “Other” includes cases where there is more than one primary mineral.
Figure 3.1.2 Mineral exploration expenditure by commodity and financial year ($ million)
Table 3.1.3 Mineral exploration expenditure by licence type and financial year ($ million)
Year Exploration Licence Mining Licence Prospecting
Licence Retention Licence Total
2015-16 $15.4 $19.8 $0.1 $3.3 $38.5
2016-17 $17.0 $24.5 $0.1 $2.7 $44.2
2017-18 $21.8 $42.4 $0.1 $4.7 $69.0
2018-19 $43.0 $41.4 $0.1 $16.6 $101.1
2019-20 $43.8 $56.2 $0.1 $23.9 $124.0
Figure 3.1.3 Mineral exploration expenditure by licence type financial year ($ million)
$0
$10
$20
$30
$40
$50
$60
$70
$80
$90
Gold Mineral Sands Coal Other *
$ m
illio
n
2015-16 2016-17 2017-18 2018-19 2019-20
$0
$10
$20
$30
$40
$50
$60
Exploration Licence Mining Licence Prospecting Licence Retention Licence
$ m
illio
n
2015-16 2016-17 2017-18 2018-19 2019-20
Earth Resources Regulation 2019-20 Annual Statistical Report Page 11
Table 3.1.4 Mining expenditure by commodity and year 2015-16 to 2019-20 ($ million)
Mining expenditure are allocated to the primary nominated mineral commodity on the license in accordance with the MRSDA.
Year Gold Mineral Sands Coal Other * Total
2015-16 $280.2 $21.8 $339.4 $44.4 $685.8
2016-17 $259.9 $15.2 $431.2 $42.5 $748.8
2017-18 $238.2 $12.6 $359.1 $44.8 $654.7
2018-19 $316.9 $14.6 $329.3 $74.2 $734.9
2019-20 $422.5 $12.4 $362.2 $39.2 $836.3
* “Other” includes cases where there is more than one primary mineral.
Figure 3.1.4 Mining expenditure by commodity and financial year ($ million)
$0
$50
$100
$150
$200
$250
$300
$350
$400
$450
$500
Gold Mineral Sands Coal Other *
$ m
illio
n
2015-16 2016-17 2017-18 2018-19 2019-20

Earth Resources Regulation 2019-20 Annual Statistical Report Page 12
Table 3.1.5 Mining expenditure by licence types and financial year ($ million)
Year Mining Licence Prospecting Licence Total
2015-16 $685.1 $0.7 $685.8
2016-17 $748.2 $0.6 $748.8
2017-18 $654. $0.7 $654.7
2018-19 $734.2 $0.7 $734.9
2019-20 $835.6 $0.8 $836.3
Figure 3.1.5 Mining expenditure for mining licences by financial year ($ million)
Figure 3.1.6 Mining expenditure for prospecting licences by financial year ($ million)
$0
$100
$200
$300
$400
$500
$600
$700
$800
$900
Mining Licence
$ m
illio
n
2015-16 2016-17 2017-18 2018-19 2019-20
$0.0
$0.1
$0.2
$0.3
$0.4
$0.5
$0.6
$0.7
$0.8
$0.9
Prospecting Licence
$ m
illio
n
2015-16 2016-17 2017-18 2018-19 2019-20

Earth Resources Regulation 2019-20 Annual Statistical Report Page 13
3.2 Mineral production
Table 3.2.1 Mineral production by financial year
Financial
Year
Gold*
(ounce)
Antimony
(tonne)
Zircon
(tonne)
Rutile
(tonne)
Ilmenite
(tonne)
Feldspar
(tonne)
Coal
(1,000
tonnes)
Gypsum
(m³)
Kaolin and
Clay
(tonne)
2013-14 225,168 5,336 128,064 243,355 563,371 44,254 58,001 454,526 167,333
2014-15 198,387 3,684 77,162 85,983 383,369 40,232 60,957 335,374 152,047
2015-16 256,653 5,945 52,026 90,318 57,763 30,730 59,757 314,759 202,229
2016-17 312,229 5,138 45,597 73,812 44,944 0 56,095 282,720 192,150
2017-18 364,294 2,570 27,515 48,381 24,390 0 45,062 399,569 171,932
2018-19 567,501 2,016 0 0 0 0 42,256 295,934 114,050
2019-20 792,267 3,141 0 0 61,197 0 40,372 282,874 154,812
*Gold reported in troy ounces, coal in thousand tonnes, gypsum in cubic meters and the remainder in tonnes.
Note: The numbers shown in this table may vary from previous reports due to the inclusions of data from late legislative report submissions
Table 3.2.2 Mineral production value by financial year ($ million)
Year Gold Antimony Mineral Sands²
Industrial Minerals³
Coal¹ Others⁴ Total
2013-14 $303.4 $12.5 $316.5 $14.1 N/A $0.2 $646.7
2014-15 $286.9 $37.8 $185.1 $10.2 N/A $0.1 $520.1
2015-16 $411.4 $30.6 $175.9 $10.0 N/A $0.6 $628.5
2016-17 $519.8 $33.6 $188.5 $8.0 N/A $0.2 $750.1
2017-18 $613.5 $28.2 $172.6 $11.7 N/A $0.2 $826.2
2018-19 $1,015.5 $21.2 $0 $10.3 N/A $0.04 $1,047.0
2019-20 $1,836.9 $24.8 $9.5 $8.9 N/A $0.3 $1,880.4
¹ No unit value is assigned to coal for the purposes of determining its production value. Coal is almost entirely used for electricity production and is largely an internal transfer within mining/generation entities. As such, there is no available market price for coal. ² Mineral Sands (zircon, rutile, ilmenite) ³ Industrial Minerals (feldspar, gypsum, kaolin & fine clay) ⁴ Others (includes silver, peat and quartz) Note: The numbers shown in this table may vary from previous reports due to the inclusions of data from late legislative report submissions

Earth Resources Regulation 2019-20 Annual Statistical Report Page 14
Figure 3.2.1 Gold production (ounces) by financial year
Gold production for 2019-20 was 792,267 ounces, the highest in the last seven years.
0
100,000
200,000
300,000
400,000
500,000
600,000
700,000
800,000
900,000
2013-14 2014-15 2015-16 2016-17 2017-18 2018-19 2019-20
ou
nce
s
Gold

Earth Resources Regulation 2019-20 Annual Statistical Report Page 15
3.3 Mineral tenements
Table 3.3.1 Number of live licences at the end of each financial year
Licence Type 2013-14 2014-15 2015-16 2016-17 2017-18 2018-19 2019-20
Exploration Licence 271 247 211 180 200 212 217
Mining Licence 191 171 170 162 156 145 141
Prospecting Licence 31 41 51 54 59 55 60
Retention Licence 1 8 11 15 20 21 27
Total 494 467 443 411 435 433 445
Figure 3.3.1 Number of live licences at the end of each financial year
Table 3.3.2 Number of licence applications submitted by financial year
Figure 3.3.2 Number of licence applications submitted by financial year
0
50
100
150
200
250
300
2013-14 2014-15 2015-16 2016-17 2017-18 2018-19 2019-20
Lice
nce
s
Exploration Licences Mining Licences Prospecting Licences Retention Licences
Licence Type 2013-14 2014-15 2015-16 2016-17 2017-18 2018-19 2019-20
Exploration Licence 28 49 32 38 72 67 132
Mining Licence 4 3 3 1 2 1 1
Prospecting Licence 17 15 14 18 17 14 7
Retention Licence 11 9 5 3 6 6 14
Total 60 76 54 60 97 88 154
0
20
40
60
80
100
120
140
2013-14 2014-15 2015-16 2016-17 2017-18 2018-19 2019-20
Lice
nce
s
Exploration Licences Mining Licences Prospecting Licences Retention Licences
Earth Resources Regulation 2019-20 Annual Statistical Report Page 16
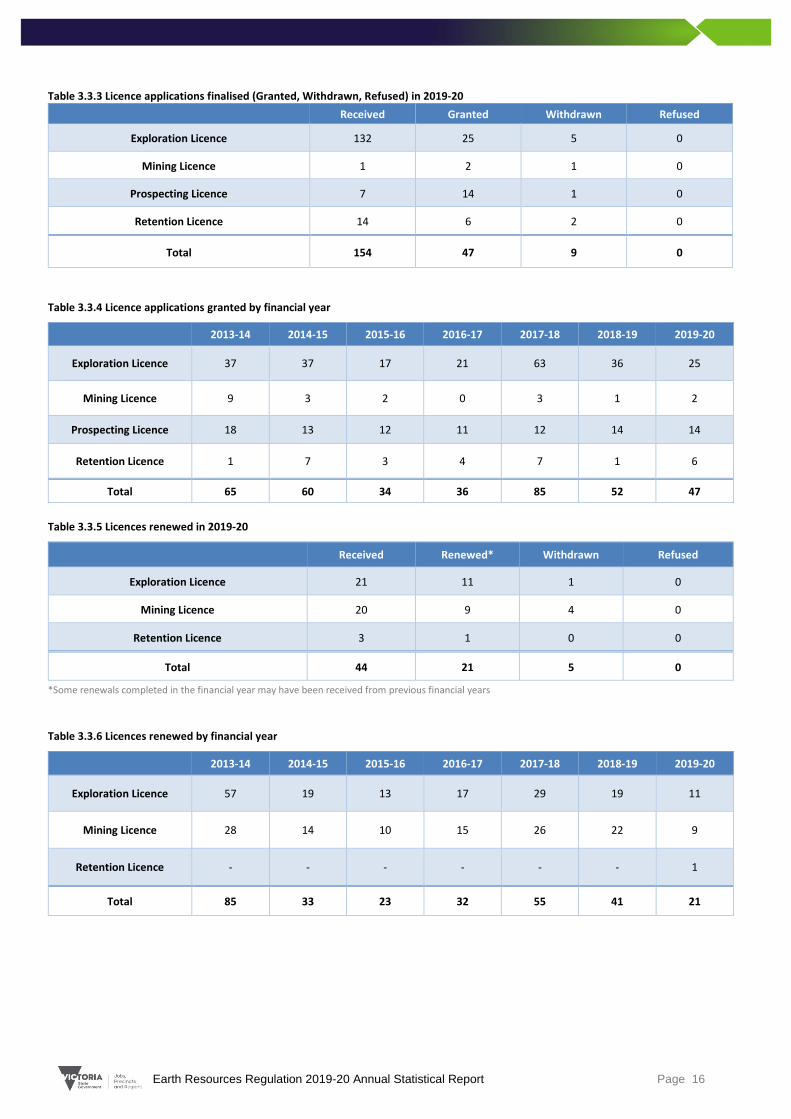
Table 3.3.3 Licence applications finalised (Granted, Withdrawn, Refused) in 2019-20 Received Granted Withdrawn Refused
Exploration Licence 132 25 5 0
Mining Licence 1 2 1 0
Prospecting Licence 7 14 1 0
Retention Licence 14 6 2 0
Total 154 47 9 0
Table 3.3.4 Licence applications granted by financial year
2013-14 2014-15 2015-16 2016-17 2017-18 2018-19 2019-20
Exploration Licence 37 37 17 21 63 36 25
Mining Licence 9 3 2 0 3 1 2
Prospecting Licence 18 13 12 11 12 14 14
Retention Licence 1 7 3 4 7 1 6
Total 65 60 34 36 85 52 47
Table 3.3.5 Licences renewed in 2019-20
Received Renewed* Withdrawn Refused
Exploration Licence 21 11 1 0
Mining Licence 20 9 4 0
Retention Licence 3 1 0 0
Total 44 21 5 0
*Some renewals completed in the financial year may have been received from previous financial years
Table 3.3.6 Licences renewed by financial year
2013-14 2014-15 2015-16 2016-17 2017-18 2018-19 2019-20
Exploration Licence 57 19 13 17 29 19 11
Mining Licence 28 14 10 15 26 22 9
Retention Licence - - - - - - 1
Total 85 33 23 32 55 41 21

Earth Resources Regulation 2019-20 Annual Statistical Report Page 17
Figure 3.3.3 Exploration licences granted and renewed by financial year
Figure 3.3.4 Mining licences granted and renewed by financial year
Figure 3.3.5 Prospecting licences granted by financial year
Figure 3.3.6 Retention licences granted by financial year
0
20
40
60
80
2012-13 2013-14 2014-15 2015-16 2016-17 2017-18 2018-19 2019-20
No
. of
Lice
nce
s
Exploration Licences Granted Exploration Licences Renewed
0
5
10
15
20
25
30
2012-13 2013-14 2014-15 2015-16 2016-17 2017-18 2018-19 2019-20
No
. of
Lice
nce
s
Mining Licences Granted Mining Licences Renewed
0
5
10
15
20
2012-13 2013-14 2014-15 2015-16 2016-17 2017-18 2018-19 2019-20
No
. of
Lice
nce
s
Prospecting Licences Granted
0
2
4
6
8
2012-13 2013-14 2014-15 2015-16 2016-17 2017-18 2018-19 2019-20
No
. of
Lice
nce
s
Retention Licences Granted Retention Licence Renewed

Earth Resources Regulation 2019-20 Annual Statistical Report Page 18
3.4 Mineral work plans and administrative updates by notification
A work plan is the primary document describing the permitted activities to be undertaken on a licence. A work plan variation is submitted by a licence holder when they want to change the scope of work from an existing work plan.
Table 3.4.1 Minerals work plans and work plan variations submitted and approvals
2013-14 2014-15 2015-16 2016-17 2017-18 2018-19 2019-20
WP Submitted 40 25 20 20 30 22 22
WP Approved 28 30 12 4 15 20 14
Statutory Endorsement - Earth Resources Regulation have assessed and endorsed the work plan or work plan variations as having met the requirements under the MRSDA.
Table 3.4.2 Extractive work plans and work plan variations statutory endorsed
2013-14 2014-15 2015-16 2016-17 2017-18 2018-19 2019-20
WP/WPV Endorsed
* * 9 1 1 5 4
*Data not readily available
Administrative updates by notification are minor changes to the existing work plan with no significant increase in risk arising from the new or changing work. Administrative updates do not require statutory endorsement (no further planning permission required). The administrative updates by notification process was introduced at the end of FY2017-18.
Table 3.4.3 Minerals administrative updates by notifications received and acknowledged
2013-14 2014-15 2015-16 2016-17 2017-18 2018-19 2019-20
Received - - - - 2 11 10
Acknowledged - - - - 2 8 9

Earth Resources Regulation 2019-20 Annual Statistical Report Page 19
4 Petroleum, geothermal, offshore pipelines and greenhouse gas
Exploration, within Victoria’s jurisdiction, for petroleum occurred in the offshore parts of the Otway and Gippsland geological basins. Production activity occurred in the Otway Basin.
Offshore activities occur within three nautical miles of the coast, according to Victorian legislation. Waters greater than three nautical miles are covered by Commonwealth legislation and reported separately by Commonwealth Government agencies.
A legislative moratorium is in place for onshore conventional gas until 30 June 2021. Hydraulic fracturing is banned under Victorian legislation.
4.1 Gas production and storage
Gas production located within Victoria’s three nautical mile zone. Table 4.1.1 Gas production 2019-20
Condensate (bbl*) Gas Production
(MMscf**) Gas Production (Petajoules^)
CO2 Prod. (tonnes)
Gas Injection (MMscf)
Comments
99,094 9,069 9.83 31,029 - Ex wellhead figures
*bbl = barrels
**MMscf = million standard cubic feet
(Unit Conversion: 1 Sm3 of oil = 6.29 bbl and 1 Sm3 of gas = 35.3 Scf)
^ Convert Gas MMscf to petajoules using online sales gas converter:
https://www.convert-me.com/en/convert/energy/mscfgas.html
Table 4.1.2 Underground gas storage 2019-20
Condensate (bbl*) Gas Storage (MMscf**)
Gas Storage (Petajoules^)
CO2 Prod. (tonnes)
Gas Injection (MMscf)
Comments
944 15,959 17.31 - 12,231 Storage
*bbl = barrels
**MMscf = million standard cubic feet
(Unit Conversion: 1 Sm3 of oil = 6.29 bbl and 1 Sm3 of gas = 35.3 Scf)
^ Convert Gas mmscf to petajoules using online sales gas converter: https://www.convert-me.com/en/convert/energy/mscfgas.html

Earth Resources Regulation 2019-20 Annual Statistical Report Page 20
4.2 Drilling
No drilling or seismic activities occurred on onshore petroleum tenements in 2019-20 Exploration, appraisal and production wells Table 4.2.1 Number of wells drilled in Victoria by financial year
Year Offshore (Vic) Gippsland Offshore (Vic) Otway Onshore Gippsland Onshore Otway Total wells
2013-14 0 0 0 0 0
2014-15 0 2 0 0 2
2015-16 0 1 0 0 1
2016-17 0 0 0 0 0
2017-18 0 0 0 0 0
2018-19 0 0 0 1 1
2019-20 0 1 0 0 1
Total 0 4 0 1 5
Figure 4.2.1 Number of exploration wells drilled by financial year
0
1
2
3
2013-14 2014-15 2015-16 2016-17 2017-18 2018-19 2019-20
No
. of
Wel
ls
Offshore (Vic) Gippsland Offshore (Vic) Otway Onshore Gippsland Onshore Otway

Earth Resources Regulation 2019-20 Annual Statistical Report Page 21
4.3 Petroleum, offshore pipelines, geothermal and greenhouse gas licences
Table 4.3.1 Overview of onshore petroleum tenements as at 30 June 2020
Onshore Petroleum Licences No. of Licences
Onshore Petroleum Production Licence 12
Onshore Petroleum Exploration Permit 10
Onshore Petroleum Special Drilling Authorisation 2
Onshore Petroleum Special Access Authorisation 1
Onshore Petroleum Retention Lease 1
Total 26
Table 4.3.2 Overview of offshore (Victorian waters) petroleum tenements as at 30 June 2020
Offshore Petroleum Licences No. of Licences
Offshore Petroleum Exploration Permit 3
Offshore Petroleum Access Authority 1
Offshore Petroleum Retention Lease 1
Offshore Petroleum Production Licence 1
Total 6
Table 4.3.3 Offshore Pipeline licences as at 30 June 2020
Offshore pipelines No. of Licences
Offshore Pipeline Licence 14
Table 4.3.4 Overview of geothermal exploration permits as at 30 June 2020
Geothermal energy No. of Licences
Geothermal Exploration Permit 1
Table 4.3.5 Offshore greenhouse gas assessment permits as at 30 June 2020
Greenhouse gas storage No. of Licences
Offshore Greenhouse Gas Assessment Permit 1

Earth Resources Regulation 2019-20 Annual Statistical Report Page 22
5 Revenue
5.1 Royalties Payable
Table 5.1.1 Royalties payable by financial year ($ million)
Year Extractive
($ million)
Gold
($ million)
Other Minerals
($ million)
Petroleum
($ million)
Coal
($ million)
Total
($ million)
2015-16 $6.2 - $5.7 $0.1 $36.6 $47.7
2016-17 $5.9 - $6.1 $4.2 $66.9 $83.1
2017-18 $6.2 - $5.6 $3.2 $84.0 $99.1
2018-19 $6.2 - $1.9 $7.9 $80.4 $96.4
2019-20 $5.7 $25.4* $1.6 $4.1 $78.7 $115.6
*From 1 January 2020, gold produced under a mining licence in Victoria is subject to a royalty. The royalty only applies to gold produced in a financial year in excess of 2,500 ounces.
Figure 5.1.1 Royalties payable by financial year ($ million)
0
10
20
30
40
50
60
70
80
90
2015-16 2016-17 2017-18 2018-19 2019-20
$ m
illio
n
Extractive Gold Other Minerals Petroleum Coal

Earth Resources Regulation 2019-20 Annual Statistical Report Page 23
5.2 Regulatory Fees
Table 5.2.1 Regulatory fees by financial year ($ million)
Year Regulatory Charges
($ million)
Rent
($ million)
Mine Stability Levy
($ million)
Total
($ million)
2015-16 $0.7 $2.0 $1.4 $4.1
2016-17 $0.7 $1.4 $1.4 $3.5
2017-18 $0.8 $2.8 $1.5 $5.1
2018-19 $0.9 $3.5 $1.5 $5.9
2019-20 $1.1 $3.6 $1.5 $6.2
Figure 5.2.1 Regulatory fees by financial year ($ million)
0
0.5
1
1.5
2
2.5
3
3.5
4
2015-16 2016-17 2017-18 2018-19 2019-20
$ m
illio
n
Regulatory Charges Rent Mine Stability Levy

Earth Resources Regulation 2019-20 Annual Statistical Report Page 24
6 Rehabilitation Bonds
6.1 Bonds Held
The total monetary value of the rehabilitation bonds held by Earth Resources Regulation under the MRSDA in 2019-20 was $814.1 million. Up to date bonds held by the state can be found on the Earth Resources Regulation Rehabilitation website: https://earthresources.vic.gov.au/community-and-land-use/rehabilitation
Table 6.1.1 Value of rehabilitation bonds by authority type by financial year ($ million)
Year Extractives
($ million)
Mining Licence
($ million)
Exploration
Licence
($ million)
Prospecting
Licence
($ million)
Retention Licence
($ million)
Total
($ million)
2013-14 $90.9 $183.4 $2.1 $0.1 $0.010 $276.5
2014-15 $85.8 $153.0 $1.9 $0.1 $0.050 $241.0
2015-16 $88.6 $239.6 $2.0 $0.2 $0.1 $330.5
2016-17 $91.7 $380.5 $2.0 $0.2 $0.1 $474.5
2017-18 $92.2 $717.7 $2.0 $0.2 $0.1 $812.2
2018-19 $91.9 $717.7 $2.6 $0.2 $0.4 $812.7
2019-20 $93.0 $717.9 $2.7 $0.2 $0.4 $814.1
Figure 6.1.1 Extractive and Mining rehabilitation bonds held by financial year ($ million)
Figure 6.1.2 Exploration, Prospecting and Retention licence rehabilitation bonds held by financial year ($ million)
0
100
200
300
400
500
600
700
800
2013-14 2014-15 2015-16 2016-17 2017-18 2018-19 2019-20
$ m
illio
n
Extractives Mining Licence
0
0.5
1
1.5
2
2.5
3
2013-14 2014-15 2015-16 2016-17 2017-18 2018-19 2019-20
$ m
illio
n
Exploration Licence Prospecting Licence Retention Licence

Earth Resources Regulation 2019-20 Annual Statistical Report Page 25
6.2 Bond Reviews
Table 6.2.1 Rehabilitation bond reviews by financial year
Year Number of bonds
reviewed Result of review -
increase Result of review - no
change
Result of review -
decrease or release
2013-14 214 66 139 9
2014-15 106 54 10 42
2015-16 100 48 6 46
2016-17 91 46 12 33
2017-18 114 49 8 57
2018-19 71 31 5 35
2019-20 65 32 3 30
Figure 6.2.1 Outcome of bond reviews by financial year
0
20
40
60
80
100
120
140
160
2013-14 2014-15 2015-16 2016-17 2017-18 2018-19 2019-20
No
. of
bo
nd
rev
iew
s
Increase No Change Decrease or Release

Earth Resources Regulation 2019-20 Annual Statistical Report Page 26
7 Compliance Earth Resources Regulation undertakes a compliance program to ensure that authority holders comply with their obligations. Monitoring, compliance and enforcement activities under the MRSDA are summarised in the table below. Inspector field activities were limited to responding to critical incidents and key preventative measures during the period of COVID-19 restrictions.
Table 7.1 Compliance activities by financial year
Activities Audits Inspections^ Meetings Enforcement Notices * Total
2015-16 186 478 199 59 922
2016-17 170 468 106 61 805
2017-18 160 533 91 8 792
2018-19 164 460 58 27 709
2019-20 108 515 69 62 754
*MRSDA s110 and s110a Notices issued
^ Inspection includes site closures and site visits
Figure 7.1 Compliance activities by financial year
0
100
200
300
400
500
600
Audit Inspections Meetings Enforement Notices
No
. of
acti
viti
es
2015-16 2016-17 2017-18 2018-19 2019-20

Earth Resources Regulation 2019-20 Annual Statistical Report Page 27
7.1 Industry annual returns submission rate
As at 07 December 2020, 88% of licences have submitted the annual Extractive Production & Royalty / Mineral Expenditure & Activity returns.
Table 7.1.1Production & Royalty / Mineral Expenditure & Activity 2019-20 report submission rate as at 07 Dec 2020
Licence Types Licences required to submit annual
returns in 2019-20
Annual Returns received by 31 Jul 2020
Submission rate
31 Jul 2020
Annual Returns received by 07 Dec 2020
Submission rate
07 Dec 2020
Annual Returns not yet received
Mining licence 147 77 52% 125 85% 22
Prospecting Licence 69 41 59% 53 77% 16
Extractives 877 575 66% 793 90% 84
Exploration Licence 236 Varying due dates
200 85% 36
Retention Licence 27 23 85% 4
1,356 1,194 88% 162

Earth Resources Regulation 2019-20 Annual Statistical Report Page 28
Department of Jobs, Precincts and Regions
1 Spring Street Melbourne Victoria 3000
Telephone 1300 366 356
© Copyright State of Victoria, Department of Jobs, Precincts and Regions 2020
Except for any logos, emblems, trademarks, artwork and photography, this document is made available under the terms of the Creative Commons Attribution 3.0 Australia licence.
This document is also available in an accessible format at
http://earthresources.vic.gov.au/earth-resources-regulation/about-us/regulator-and-industry-reporting/earth-resources-regulation-annual-statistical-report/