2019-108 university of south florida
TRANSCRIPT

Sherrill F. Norman, CPA
Auditor General
Report No. 2019-108
January 2019
UNIVERSITY OF SOUTH FLORIDA
For the Fiscal Year Ended
June 30, 2018
Finan
cial Audit
Board of Trustees and President
During the 2017-18 fiscal year, Dr. Judy L. Genshaft served as President of the University of South
Florida and the following individuals served as Members of the Board of Trustees:
Brian D. Lamb, Chair Dr. Deanna Michael a from 8-8-17 Jordan B. Zimmerman, Vice Chair Harold W. Mullis Jr. Michael Carrere Leslie M. Muma from 1-12-18 James Garey a through 8-7-17 John B. Ramil Stephanie E. Goforth Byron E. Shinn Scott L. Hopes c through 7-25-17 James Stikeleather d through Oscar J. Horton from 1-25-18 10-12-17 Moneer Kheireddine b Charles Tokarz from 1-12-18 Stanley I. Levy through 1-24-18 Nancy H. Watkins
a System faculty council president (equivalent to faculty senate chair referred to in
Section 1001.71(1), Florida Statutes). b Student Body President. c Trustee resigned 7-25-17, and Trustee position vacant through 1-11-18. d Trustee resigned 10-12-17, and Trustee position vacant through 1-11-18.
The Auditor General conducts audits of governmental entities to provide the Legislature, Florida’s citizens, public entity
management, and other stakeholders unbiased, timely, and relevant information for use in promoting government
accountability and stewardship and improving government operations.
The team leader was Elba M. Guzik, CPA, and the audit was supervised by Rachel P. Sellers, CPA.
Please address inquiries regarding this report to Jaime N. Hoelscher, CPA, Audit Manager, by e-mail at
[email protected] or by telephone at (850) 412-2868.
This report and other reports prepared by the Auditor General are available at:
FLAuditor.gov
Printed copies of our reports may be requested by contacting us at:
State of Florida Auditor General
Claude Pepper Building, Suite G74 ∙ 111 West Madison Street ∙ Tallahassee, FL 32399-1450 ∙ (850) 412-2722
UNIVERSITY OF SOUTH FLORIDA
TABLE OF CONTENTS
Page No.
SUMMARY ........................................................................................................................................... i
INDEPENDENT AUDITOR’S REPORT ................................................................................................ 1
Report on the Financial Statements ................................................................................................. 1
Other Reporting Required by Government Auditing Standards ....................................................... 3
MANAGEMENT’S DISCUSSION AND ANALYSIS .............................................................................. 4
BASIC FINANCIAL STATEMENTS
Statement of Net Position ................................................................................................................ 16
Statement of Revenues, Expenses, and Changes in Net Position .................................................. 18
Statement of Cash Flows ................................................................................................................. 20
Notes to Financial Statements ......................................................................................................... 22
OTHER REQUIRED SUPPLEMENTARY INFORMATION
Schedule of the University’s Proportionate Share of the Total Other Postemployment Benefits Liability .............................................................................................................................. 74
Schedule of the University’s Proportionate Share of the Net Pension Liability – Florida Retirement System Pension Plan ................................................................................................... 74
Schedule of University Contributions – Florida Retirement System Pension Plan .......................... 74
Schedule of the University’s Proportionate Share of the Net Pension Liability – Health Insurance Subsidy Pension Plan .................................................................................................... 75
Schedule of University Contributions – Health Insurance Subsidy Pension Plan ............................ 75
Notes to Required Supplementary Information ................................................................................ 76
INDEPENDENT AUDITOR’S REPORT ON INTERNAL CONTROL OVER FINANCIAL REPORTING AND ON COMPLIANCE AND OTHER MATTERS BASED ON AN AUDIT OF FINANCIAL STATEMENTS PERFORMED IN ACCORDANCE WITH GOVERNMENT AUDITING STANDARDS ............................................... 77
Internal Control Over Financial Reporting ........................................................................................ 77
Compliance and Other Matters ........................................................................................................ 78
Purpose of this Report ..................................................................................................................... 78

Report No. 2019-108 January 2019 Page i
SUMMARY
SUMMARY OF REPORT ON FINANCIAL STATEMENTS
Our audit disclosed that the basic financial statements of the University of South Florida (a component
unit of the State of Florida) were presented fairly, in all material respects, in accordance with prescribed
financial reporting standards.
SUMMARY OF REPORT ON INTERNAL CONTROL AND COMPLIANCE
Our audit did not identify any deficiencies in internal control over financial reporting that we consider to
be material weaknesses.
The results of our tests disclosed no instances of noncompliance or other matters that are required to be
reported under Government Auditing Standards issued by the Comptroller General of the United States.
AUDIT OBJECTIVES AND SCOPE
Our audit objectives were to determine whether the University of South Florida and its officers with
administrative and stewardship responsibilities for University operations had:
Presented the University’s basic financial statements in accordance with generally accepted accounting principles;
Established and implemented internal control over financial reporting and compliance with requirements that could have a direct and material effect on the financial statements; and
Complied with the various provisions of laws, rules, regulations, contracts, and grant agreements that are material to the financial statements.
The scope of this audit included an examination of the University’s basic financial statements as of and
for the fiscal year ended June 30, 2018. We obtained an understanding of the University’s environment,
including its internal control, and assessed the risk of material misstatement necessary to plan the audit
of the basic financial statements. We also examined various transactions to determine whether they
were executed, in both manner and substance, in accordance with governing provisions of laws, rules,
regulations, contracts, and grant agreements.
An examination of Federal awards administered by the University is included within the scope of our
Statewide audit of Federal awards administered by the State of Florida.
AUDIT METHODOLOGY
We conducted our audit in accordance with auditing standards generally accepted in the United States
of America and applicable standards contained in Government Auditing Standards, issued by the
Comptroller General of the United States.

Report No. 2019-108 January 2019 Page 1
Phone: (850) 412-2722 Fax: (850) 488-6975
Sherrill F. Norman, CPA Auditor General
AUDITOR GENERAL STATE OF FLORIDA Claude Denson Pepper Building, Suite G74
111 West Madison Street Tallahassee, Florida 32399-1450
The President of the Senate, the Speaker of the House of Representatives, and the Legislative Auditing Committee
INDEPENDENT AUDITOR’S REPORT
Report on the Financial Statements
We have audited the accompanying financial statements of the University of South Florida, a component
unit of the State of Florida, and its aggregate discretely presented component units as of and for the fiscal
year ended June 30, 2018, and the related notes to the financial statements, which collectively comprise
the University’s basic financial statements as listed in the table of contents.
Management’s Responsibility for the Financial Statements
Management is responsible for the preparation and fair presentation of these financial statements in
accordance with accounting principles generally accepted in the United States of America; this includes
the design, implementation, and maintenance of internal control relevant to the preparation and fair
presentation of financial statements that are free from material misstatement, whether due to fraud or
error.
Auditor’s Responsibility
Our responsibility is to express opinions on these financial statements based on our audit. We did not
audit the financial statements of the blended and aggregate discretely presented component units. The
financial statements of the University of South Florida Health Sciences Center Self-Insurance Program,
a blended component unit, represent 3.3 percent, 4.1 percent, and 0.7 percent, respectively, of the
assets, net position, and revenues reported for the University of South Florida. The financial statements
of the aggregate discretely presented component units represent 100 percent of the transactions and
account balances of the discretely presented component units columns. The financial statements for the
blended and aggregate discretely presented component units were audited by other auditors whose
reports have been furnished to us, and our opinions, insofar as they relate to the amounts included for
those component units are based solely on the reports of the other auditors. We conducted our audit in
accordance with auditing standards generally accepted in the United States of America and the standards
applicable to financial audits contained in Government Auditing Standards, issued by the Comptroller
Report No. 2019-108 Page 2 January 2019
General of the United States. Those standards require that we plan and perform the audit to obtain
reasonable assurance about whether the financial statements are free from material misstatement.
An audit involves performing procedures to obtain audit evidence about the amounts and disclosures in
the financial statements. The procedures selected depend on the auditor’s judgment, including the
assessment of the risks of material misstatement of the financial statements, whether due to fraud or
error. In making those risk assessments, the auditor considers internal control relevant to the entity’s
preparation and fair presentation of the financial statements in order to design audit procedures that are
appropriate in the circumstances, but not for the purpose of expressing an opinion on the effectiveness
of the entity’s internal control. Accordingly, we express no such opinion. An audit also includes
evaluating the appropriateness of accounting policies used and the reasonableness of significant
accounting estimates made by management, as well as evaluating the overall presentation of the
financial statements.
We believe that the audit evidence we have obtained is sufficient and appropriate to provide a basis for
our audit opinions.
Opinions
In our opinion, based on our audit and the reports of other auditors, the financial statements referred to
above present fairly, in all material respects, the respective financial position of the University of South
Florida and of its aggregate discretely presented component units as of June 30, 2018, and the respective
changes in financial position and, where applicable, cash flows thereof for the fiscal year then ended in
accordance with accounting principles generally accepted in the United States of America.
Emphasis of Matter
As discussed in Note 2. and 3. to the financial statements, the University implemented Governmental
Accounting Standards Board Statement No. 75, Accounting and Financial Reporting for Postemployment
Benefits Other Than Pensions, which is a change in accounting principle that addresses accounting and
financial reporting for other postemployment benefits. This affects the comparability of amounts reported
for the 2017-18 fiscal year with amounts reported for the 2016-17 fiscal year. Our opinion is not modified
with respect to this matter.
Other Matter
Required Supplementary Information
Accounting principles generally accepted in the United States of America require that MANAGEMENT’S
DISCUSSION AND ANALYSIS, the Schedule of the University’s Proportionate Share of the Total
Other Postemployment Benefits Liability, Schedule of the University’s Proportionate Share of the
Net Pension Liability – Florida Retirement System Pension Plan, Schedule of University
Contributions – Florida Retirement System Pension Plan, Schedule of the University’s
Proportionate Share of the Net Pension Liability – Health Insurance Subsidy Pension Plan,
Schedule of University Contributions – Health Insurance Subsidy Pension Plan, and Notes to
Required Supplementary Information, as listed in the table of contents, be presented to supplement
the basic financial statements. Such information, although not a part of the basic financial statements, is
required by the Governmental Accounting Standards Board who considers it to be an essential part of

Report No. 2019-108 January 2019 Page 3
financial reporting for placing the basic financial statements in an appropriate operational, economic, or
historical context. We have applied certain limited procedures to the required supplementary information
in accordance with auditing standards generally accepted in the United States of America, which
consisted of inquiries of management about the methods of preparing the information and comparing the
information for consistency with management’s responses to our inquiries, the basic financial statements,
and other knowledge we obtained during our audit of the basic financial statements. We do not express
an opinion or provide any assurance on the information because the limited procedures do not provide
us with sufficient evidence to express an opinion or provide any assurance.
Other Reporting Required by Government Auditing Standards
In accordance with Government Auditing Standards, we have also issued our report dated
January 22, 2019, on our consideration of the University of South Florida’s internal control over financial
reporting and on our tests of its compliance with certain provisions of laws, rules, regulations, contracts,
and grant agreements and other matters included under the heading INDEPENDENT AUDITOR’S
REPORT ON INTERNAL CONTROL OVER FINANCIAL REPORTING AND ON COMPLIANCE AND
OTHER MATTERS BASED ON AN AUDIT OF FINANCIAL STATEMENTS PERFORMED IN
ACCORDANCE WITH GOVERNMENT AUDITING STANDARDS. The purpose of that report is to
describe the scope of our testing of internal control over financial reporting and compliance and the results
of that testing, and not to provide an opinion on the effectiveness of the internal control over financial
reporting or on compliance. That report is an integral part of an audit performed in accordance with
Government Auditing Standards in considering the University of South Florida’s internal control over
financial reporting and compliance.
Respectfully submitted,
Sherrill F. Norman, CPA Tallahassee, Florida January 22, 2019

Report No. 2019-108 Page 4 January 2019
MANAGEMENT’S DISCUSSION AND ANALYSIS
Management’s discussion and analysis (MD&A) provides an overview of the financial position and
activities of the University for the fiscal year ended June 30, 2018 and should be read in conjunction with
the financial statements and notes thereto. The MD&A, and financial statements and notes thereto, are
the responsibility of University management. The MD&A contains financial activity of the University for
the fiscal years ended June 30, 2018, and June 30, 2017.
FINANCIAL HIGHLIGHTS
The University’s assets and deferred outflows of resources totaled $2.1 billion at June 30, 2018. This
balance reflects a $153.2 million, or 7.8 percent, increase as compared to the 2016-17 fiscal year,
resulting from increases in capital assets, investments, and other postemployment benefits (OPEB) and
pension-related deferred outflows. While assets and deferred outflows of resources grew, liabilities and
deferred inflows of resources also increased by $447 million, or 58.9 percent, totaling $1.2 billion at
June 30, 2018, as compared to $759.4 million at June 30, 2017, resulting from increases in the OPEB
and pension liabilities as well as service concession arrangement, OPEB, and pension-related deferred
inflows. As a result, the University’s net position decreased by $293.8 million, resulting in a year-end
balance of $902.4 million.
The University’s operating revenues totaled $872 million for the 2017-18 fiscal year, representing a
2.8 percent increase compared to the 2016-17 fiscal year due mainly to increases in grants and contracts.
Operating expenses totaled $1.4 billion for the 2017-18 fiscal year, representing an increase of
6.7 percent as compared to the 2016-17 fiscal year due mainly to increases in compensation and
employee benefits, services and supplies, and scholarships.
Net position represents the residual interest in the University’s assets and deferred outflows of resources
after deducting liabilities and deferred inflows of resources. The University’s comparative total net
position by category for the fiscal years ended June 30, 2018, and June 30, 2017, is shown in the
following graph:

Report No. 2019-108 January 2019 Page 5
Net Position
(In Thousands)
The following chart provides a graphical presentation of University revenues by category for the
2017-18 fiscal year:
Total Revenues 2017-18 Fiscal Year
OVERVIEW OF FINANCIAL STATEMENTS
Pursuant to GASB Statement No. 35, the University’s financial report consists of three basic financial
statements: the statement of net position; the statement of revenues, expenses, and changes in net
position; and the statement of cash flows. The financial statements, and notes thereto, encompass the
University and its component units. These component units include:
Blended Component Unit:
o University of South Florida Health Sciences Center Self-Insurance Program
‐$200,000
$200,000
$600,000
$1,000,000
Net Investment inCapital Assets
Restricted Unrestricted
$808,912
$259,326
‐$165,840
$743,215
$239,918 $213,073
2018 2017
Operating Revenues58%
Nonoperating Revenues
40%
Other Revenues2%

Report No. 2019-108 Page 6 January 2019
Discretely Presented Component Units:
o University of South Florida Foundation, Inc.
o University of South Florida Alumni Association, Inc.
o USF Health Professions Conferencing Corporation
o University of South Florida Medical Services Support Corporation
o Sun Dome, Inc.
o University of South Florida Research Foundation, Inc.
o USF Financing Corporation
o USF Property Corporation
o University Medical Service Association, Inc.
Information regarding these component units, including summaries of the blended and discretely
presented component units’ separately issued financial statements, is presented in the notes to financial
statements. This MD&A focuses on the University, excluding the discretely presented component units.
For those component units reporting under GASB standards, MD&A information is included in their
separately issued audit reports.
The Statement of Net Position
The statement of net position reflects the assets, deferred outflows of resources, liabilities, and deferred
inflows of resources of the University, using the accrual basis of accounting, and presents the financial
position of the University at a specified time. Assets, plus deferred outflows of resources, less liabilities,
less deferred inflows of resources, equals net position, which is one indicator of the University’s current
financial condition. The changes in net position that occur over time indicate improvement or deterioration
in the University’s financial condition.
The following summarizes the University’s assets, deferred outflows of resources, liabilities, deferred
inflows of resources, and net position at June 30:

Report No. 2019-108 January 2019 Page 7
Condensed Statement of Net Position at June 30
(In Thousands)
2018 2017
AssetsCurrent Assets 910,622$ 894,715$ Capital Assets, Net 957,407 852,341 Other Noncurrent Assets 72,899 71,189
Total Assets 1,940,928 1,818,245
Deferred Outflows of Resources 167,934 137,405
LiabilitiesCurrent Liabilities 201,298 212,028 Noncurrent Liabilities 873,579 541,744
Total Liabilities 1,074,877 753,772
Deferred Inflows of Resources 131,587 5,672
Net PositionNet Investment in Capital Assets 808,912 743,215 Restricted 259,326 239,918 Unrestricted (165,840) 213,073
Total Net Position 902,398$ 1,196,206$
Net capital assets for the University increased a total of $105.1 million between the two fiscal years due
mainly to increases in buildings and construction in progress. Net buildings increased $56 million
primarily due to the substantial completion of Phase I of the student housing and retail facilities
constructed as part of the service concession arrangement discussed in Note 10. as well as the
completion of the USF Health Student Union Annex and various other building improvements.
Construction in progress increased $30.3 million primarily due to the USF Morsani College of Medicine
and USF Health Heart Institute Projects.
Deferred outflows of resources increased $30.5 million relating to pension and OPEB activity, and
deferred inflows of resources decreased $125.9 million relating to OPEB, service concession
arrangement, and pension activity.
Total liabilities increased $321.1 million. Major components of this increase include an increase in OPEB
payable of $301.1 million, due to the implementation of GASB Statement No. 75, and an increase in the
GASB Statement No. 68 net pension liability of $30.4 million.
Net position is reported in three major categories. The first category, net investment in capital assets,
provides the University’s equity in property, plant, and equipment owned by the University. Restricted
net position is another category, which may be further broken down into nonexpendable and expendable.
Restricted nonexpendable net position represents funds that have been donated to the University that
are required to be invested in perpetuity. This net position component is primarily maintained within the
University of South Florida Foundation, Inc. a component unit of the University. Restricted expendable
Report No. 2019-108 Page 8 January 2019
net position is available for use by the University, but must be spent for purposes as determined by donors
or external entities that have placed time or purpose restrictions on the use of the assets. The final
category is unrestricted net position and is available to the University for any lawful purpose of the
University.
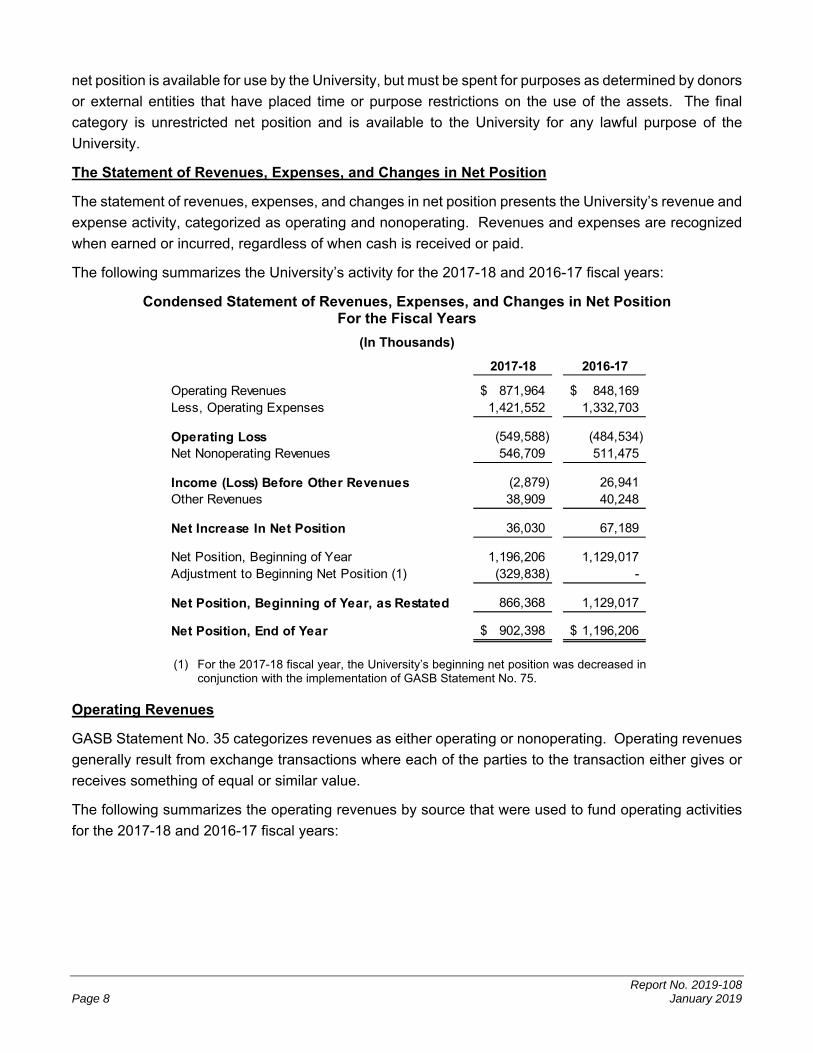
The Statement of Revenues, Expenses, and Changes in Net Position
The statement of revenues, expenses, and changes in net position presents the University’s revenue and
expense activity, categorized as operating and nonoperating. Revenues and expenses are recognized
when earned or incurred, regardless of when cash is received or paid.
The following summarizes the University’s activity for the 2017-18 and 2016-17 fiscal years:
Condensed Statement of Revenues, Expenses, and Changes in Net Position For the Fiscal Years
(In Thousands)
2017-18 2016-17
Operating Revenues 871,964$ 848,169$ Less, Operating Expenses 1,421,552 1,332,703
Operating Loss (549,588) (484,534) Net Nonoperating Revenues 546,709 511,475
Income (Loss) Before Other Revenues (2,879) 26,941 Other Revenues 38,909 40,248
Net Increase In Net Position 36,030 67,189
Net Position, Beginning of Year 1,196,206 1,129,017 Adjustment to Beginning Net Position (1) (329,838) -
Net Position, Beginning of Year, as Restated 866,368 1,129,017
Net Position, End of Year 902,398$ 1,196,206$
(1) For the 2017-18 fiscal year, the University’s beginning net position was decreased in conjunction with the implementation of GASB Statement No. 75.
Operating Revenues
GASB Statement No. 35 categorizes revenues as either operating or nonoperating. Operating revenues
generally result from exchange transactions where each of the parties to the transaction either gives or
receives something of equal or similar value.
The following summarizes the operating revenues by source that were used to fund operating activities
for the 2017-18 and 2016-17 fiscal years:

Report No. 2019-108 January 2019 Page 9
Operating Revenues For the Fiscal Years
(In Thousands)
2017-18 2016-17
Student Tuition and Fees, Net 281,289$ 293,198$ Grants and Contracts 431,601 395,692 Sales and Services of Auxiliary Enterprises 146,152 147,665 Other 12,922 11,614
Total Operating Revenues 871,964$ 848,169$
The following chart presents the University’s operating revenues for the 2017-18 and 2016-17 fiscal
years:
Operating Revenues
(In Thousands)
University operating revenues increased by $23.8 million, or 2.8 percent. This is primarily attributed to a
$35.9 million increase in grants and contracts revenues due to grants and contracts from Federal and
nongovernmental funding, offset by an $11.9 million decrease in net student tuition and fees due to a
$20.8 million increase in scholarship allowances.
Operating Expenses
Expenses are categorized as operating or nonoperating. The majority of the University’s expenses are
operating expenses as defined by GASB Statement No. 35. GASB gives financial reporting entities the
choice of reporting operating expenses in the functional or natural classifications. The University has
chosen to report the expenses in their natural classification on the statement of revenues, expenses, and
changes in net position and has displayed the functional classification in the notes to financial statements.
The following summarizes operating expenses by natural classification for the 2017-18 and 2016-17 fiscal
years:
$0 $250,000 $500,000
Other
Sales and Servicesof Auxiliary Enterprises
Grants and Contracts
Student Tuition and Fees, Net
$11,614
$147,665
$395,692
$293,198
$12,922
$146,152
$431,601
$281,289
2017‐18 2016‐17

Report No. 2019-108 Page 10 January 2019
Operating Expenses For the Fiscal Years
(In Thousands)
2017-18 2016-17
Compensation and Employee Benefits 928,092$ 882,382$ Services and Supplies 323,126 298,359 Utilities and Communications 24,512 24,412 Scholarships, Fellowships, and Waivers 90,214 70,601 Depreciation 52,588 49,082 Self-Insurance Claims 3,020 7,867
Total Operating Expenses 1,421,552$ 1,332,703$
The following chart presents the University’s operating expenses for the 2017-18 and 2016-17 fiscal
years:
Operating Expenses
(In Thousands)
Total operating expenses increased by $88.8 million, or 6.7 percent, resulting primarily from a
$45.7 million increase in compensation and employee benefits, a $24.8 million increase in services and
supplies, and a $19.6 million increase in scholarships, fellowships, and waivers. The increase in
compensation and employee benefits was primarily due to expenses associated with salary and benefit
increases, as well as increases in pension expenses. The increase in services and supplies was primarily
due to purchases associated with USF Health construction, consulting services, software and other
maintenance, and travel expenses. The increase in scholarships, fellowships, and waivers was due to
increased disbursements for Federal and State of Florida scholarship programs.
Nonoperating Revenues and Expenses
Certain revenue sources that the University relies on to provide funding for operations, including State
noncapital appropriations, Federal and State student financial aid, certain gifts and grants, and
$0 $550,000 $1,100,000
Self‐Insurance Claims
Depreciation
Scholarships, Fellowships, and Waivers
Utilities and Communications
Services and Supplies
Compensation and Employee Benefits
$7,867
$49,082
$70,601
$24,412
$298,359
$882,382
$3,020
$52,588
$90,214
$24,512
$323,126
$928,092
2017‐18 2016‐17

Report No. 2019-108 January 2019 Page 11
investment income, are defined by GASB as nonoperating. Nonoperating expenses include capital
financing costs and other costs related to capital assets. The following summarizes the University’s
nonoperating revenues and expenses for the 2017-18 and 2016-17 fiscal years:
Nonoperating Revenues (Expenses) For the Fiscal Years
(In Thousands)
2017-18 2016-17
State Noncapital Appropriations 420,566$ 387,160$ Federal and State Student Financial Aid 134,685 91,884 Noncapital Grants and Donations 21,954 23,735 Investment Income 18,289 24,952 Other Nonoperating Revenues 2,293 6,030 Gain (Loss) on Disposal of Capital Assets (840) 9,965 Interest on Capital Asset-Related Debt (736) (763) Other Nonoperating Expenses (49,502) (31,488)
Net Nonoperating Revenues 546,709$ 511,475$
Total net nonoperating revenues increased by $35.2 million, or 6.9 percent. Major contributors to this
increase include an increase in Federal and State student financial aid of $42.8 million for State of Florida
scholarship programs and Federal Pell Grants and an increase in state noncapital appropriations of
$33.4 million due to Education and General funds. These revenue increases were offset by an increase
in other nonoperating expenses of $18 million, mainly due to increased transfers to the Agency for Health
Care Administration for Medicaid payments from the University Medical Service Association (UMSA) and
increased net transfers to the USF Financing Corporation for construction at the Moffit Eye Care Institute,
and a decrease from a gain to a loss on disposal of capital assets of $10.8 million due to the FCC auction
proceeds for WUSF-TV that were recognized in the 2016-17 fiscal year.
Other Revenues
This category is composed of State capital appropriations and capital grants, contracts, donations, and
fees. The following summarizes the University’s other revenues, expenses, gains, or losses for the
2017-18 and 2016-17 fiscal years:
Other Revenues For the Fiscal Years
(In Thousands)
2017-18 2016-17
State Capital Appropriations 27,971$ 39,311$ Capital Grants, Contracts, Donations, and Fees 10,938 937
Total 38,909$ 40,248$
State capital appropriations decreased by $11.3 million, or 28.8 percent, primarily due to $12 million of
Public Educational Capital Outlay (PECO) funding for the Morsani College of Medicine for the
2017-18 fiscal year versus $22.5 million for the 2016-17 fiscal year. Capital grants, contracts, donations,
Report No. 2019-108 Page 12 January 2019
and fees increased by $10 million mainly due to the donation of Downtown Tampa land associated with
Morsani College of Medicine projects.
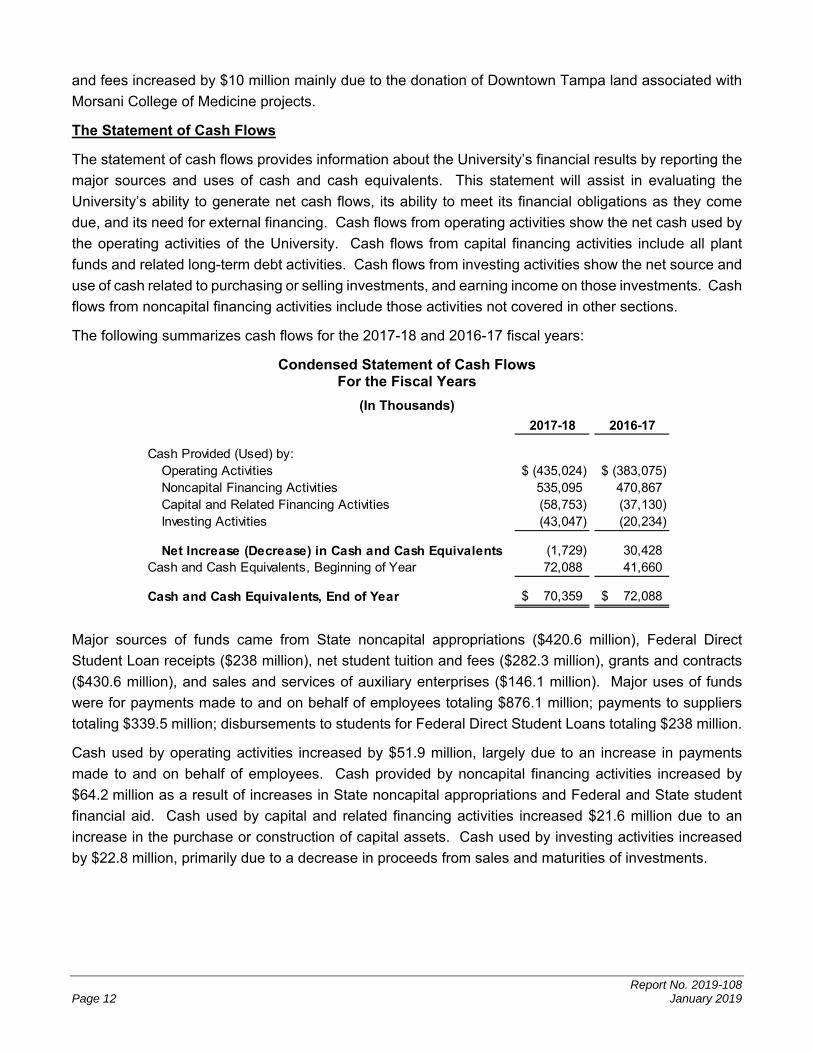
The Statement of Cash Flows
The statement of cash flows provides information about the University’s financial results by reporting the
major sources and uses of cash and cash equivalents. This statement will assist in evaluating the
University’s ability to generate net cash flows, its ability to meet its financial obligations as they come
due, and its need for external financing. Cash flows from operating activities show the net cash used by
the operating activities of the University. Cash flows from capital financing activities include all plant
funds and related long-term debt activities. Cash flows from investing activities show the net source and
use of cash related to purchasing or selling investments, and earning income on those investments. Cash
flows from noncapital financing activities include those activities not covered in other sections.
The following summarizes cash flows for the 2017-18 and 2016-17 fiscal years:
Condensed Statement of Cash Flows For the Fiscal Years
(In Thousands)
2017-18 2016-17
Cash Provided (Used) by:Operating Activities (435,024)$ (383,075)$ Noncapital Financing Activities 535,095 470,867 Capital and Related Financing Activities (58,753) (37,130) Investing Activities (43,047) (20,234)
Net Increase (Decrease) in Cash and Cash Equivalents (1,729) 30,428 Cash and Cash Equivalents, Beginning of Year 72,088 41,660
Cash and Cash Equivalents, End of Year 70,359$ 72,088$
Major sources of funds came from State noncapital appropriations ($420.6 million), Federal Direct
Student Loan receipts ($238 million), net student tuition and fees ($282.3 million), grants and contracts
($430.6 million), and sales and services of auxiliary enterprises ($146.1 million). Major uses of funds
were for payments made to and on behalf of employees totaling $876.1 million; payments to suppliers
totaling $339.5 million; disbursements to students for Federal Direct Student Loans totaling $238 million.
Cash used by operating activities increased by $51.9 million, largely due to an increase in payments
made to and on behalf of employees. Cash provided by noncapital financing activities increased by
$64.2 million as a result of increases in State noncapital appropriations and Federal and State student
financial aid. Cash used by capital and related financing activities increased $21.6 million due to an
increase in the purchase or construction of capital assets. Cash used by investing activities increased
by $22.8 million, primarily due to a decrease in proceeds from sales and maturities of investments.

Report No. 2019-108 January 2019 Page 13
CAPITAL ASSETS, CAPITAL EXPENSES AND COMMITMENTS, AND DEBT ADMINISTRATION
Capital Assets
At June 30, 2018, the University had $1.7 billion in capital assets, less accumulated depreciation of
$712.8 million, for net capital assets of $957.4 million. Depreciation charges for the current fiscal year
totaled $52.6 million. The following table summarizes the University’s capital assets, net of accumulated
depreciation, at June 30:
Capital Assets, Net at June 30
(In Thousands)
2018 2017
Land 23,649$ 16,198$ Construction in Progress 72,438 42,178 Buildings 748,316 692,290 Infrastructure and Other Improvements 29,787 32,197 Furniture and Equipment 62,471 53,071 Library Resources 15,762 11,515 Property Under Capital Leases 568 89 Works of Art and Historical Treasures 1,341 1,397 Other Capital Assets 3,075 3,406
Capital Assets, Net 957,407$ 852,341$
Additional information about the University’s capital assets is presented in the notes to financial
statements.
Capital Expenses and Commitments
The University’s construction commitments at June 30, 2018, are as follows:
Amount(In Thousands)
Total Committed 209,604$ Completed to Date (72,438)
Balance Committed 137,166$
Additional information about the University’s construction commitments is presented in the notes to
financial statements.
Debt Administration
As of June 30, 2018, the University had $18.2 million in outstanding capital improvement debt payable,
installment purchases payable, and capital leases payable, representing a decrease of $2 million, or
9.9 percent, from the prior fiscal year. The following table summarizes the outstanding long-term debt by
type for the fiscal years ended June 30:

Report No. 2019-108 Page 14 January 2019
Long-Term Debt at June 30
(In Thousands)
2018 2017
Capital Improvement Debt 17,473$ 19,956$ Installment Purchases 328 236 Capital Leases 444 60
Total 18,245$ 20,252$
Additional information about the University’s long-term debt is presented in the notes to financial
statements.
ECONOMIC FACTORS THAT WILL AFFECT THE FUTURE
The University’s economic condition is closely tied to that of the State of Florida. The budget that the
Florida Legislature adopted for the 2018-19 fiscal year provided a 2.8 percent increase for State
universities. In June 2018, the University was designated a Preeminent State Research University by
the Florida Board of Governors. This will increase the proportion of future preeminence performance
based funding allocated to the University each year.
REQUESTS FOR INFORMATION
Questions concerning information provided in the MD&A or other required supplemental information, and
financial statements and notes thereto, or requests for additional financial information should be
addressed to Jennifer Condon, Associate Vice President and Controller, University of South Florida, 4202
East Fowler Avenue ALN147, Tampa, Florida 33620-5800.

Report No. 2019-108 January 2019 Page 15
THIS PAGE INTENTIONALLY LEFT BLANK

Report No. 2019-108 Page 16 January 2019
BASIC FINANCIAL STATEMENTS
UNIVERSITY OF SOUTH FLORIDA A Component Unit of the State of Florida
Statement of Net Position
June 30, 2018 Component
University Units
ASSETSCurrent Assets:
Cash and Cash Equivalents 68,640,494$ 17,455,617$ Investments 669,949,225 119,778,650 Accounts Receivable, Net 70,724,581 91,642,339 Loans and Notes Receivable, Net 2,151,145 157,500 Due from State 85,718,548 - Due from University - 69,044,772 Due from Component Units 11,907,956 4,555,231 Inventories 268,651 12,450,000 Other Current Assets 1,261,276 6,338,147
Total Current Assets 910,621,876 321,422,256
Noncurrent Assets:Restricted Cash and Cash Equivalents 1,718,280 1,100,000 Restricted Investments 68,226,862 573,565,480 Loans and Notes Receivable, Net 2,953,651 266,013 Depreciable Capital Assets, Net 858,853,336 284,475,979 Nondepreciable Capital Assets 98,553,782 19,775,734 Other Noncurrent Assets - 16,507,719
Total Noncurrent Assets 1,030,305,911 895,690,925
Total Assets 1,940,927,787 1,217,113,181
DEFERRED OUTFLOWS OF RESOURCESOther Postemployment Benefits 11,492,000 - Pensions 156,442,037 - Interest Rate Swap Agreement - 58,610
Total Deferred Outflows of Resources 167,934,037 58,610
LIABILITIESCurrent Liabilities:
Accounts Payable 35,605,056 16,540,590 Construction Contracts Payable 7,474,189 - Salary and Wages Payable 35,279,851 8,398,338 Deposits Payable 4,621,485 797,964 Due to University - 11,907,956 Due to Component Units 69,044,772 4,555,231 Unearned Revenue 29,664,755 4,965,996 Other Current Liabilities - 31,312 Long-Term Liabilities - Current Portion:
Bonds Payable - 5,222,668 Certificates of Participation Payable - 8,695,000 Capital Improvement Debt Payable 2,538,479 - Loans and Notes Payable - 507,468 Installment Purchases Payable 138,865 - Capital Leases Payable 129,661 1,039,561 Estimated Insurance Claims Payable 1,597,571 - Compensated Absences Payable 6,694,028 - Dining Facility Fee Payable 20,865 - Other Postemployment Benefits Payable 6,279,000 - Net Pension Liability 2,209,005 -
Total Current Liabilities 201,297,582 62,662,084

Report No. 2019-108 January 2019 Page 17
UNIVERSITY OF SOUTH FLORIDA A Component Unit of the State of Florida
Statement of Net Position (Continued)
June 30, 2018 Component
University Units
LIABILITIES (Continued)Noncurrent Liabilities:
Bonds Payable - 96,911,505 Certificates of Participation Payable - 229,667,131 Capital Improvement Debt Payable 14,934,354 - Loans and Notes Payable - 4,714,152 Installment Purchases Payable 189,249 - Capital Leases Payable 314,854 1,471,358 Estimated Insurance Claims Payable 26,087,669 - Compensated Absences Payable 78,825,606 - Federal Advance Payable 2,796,390 - Other Noncurrent Liabilities - 10,326,684 Dining Fee Facility Payable 4,705,288 - Other Postemployment Benefits Payable 440,115,000 - Net Pension Liability 305,610,715 -
Total Noncurrent Liabilities 873,579,125 343,090,830
Total Liabilities 1,074,876,707 405,752,914
DEFERRED INFLOWS OF RESOURCESOther Postemployment Benefits 63,109,000 - Pensions 13,966,669 - Deferred Service Concession Arrangement Receipts 54,511,702 -
Total Deferred Inflows of Resources 131,587,371 -
NET POSITIONNet Investment in Capital Assets 808,911,963 37,815,921 Restricted for Nonexpandable:
Endowment - 646,713,731 Restricted for Expendable:
Debt Service 1,753,532 - Loans 5,051,075 - Capital Projects 91,374,371 - Other 161,146,565 -
Unrestricted (165,839,760) 126,889,225
TOTAL NET POSITION 902,397,746$ 811,418,877$
The accompanying notes to financial statements are an integral part of this statement.

Report No. 2019-108 Page 18 January 2019
UNIVERSITY OF SOUTH FLORIDA A Component Unit of the State of Florida
Statement of Revenues, Expenses, and Changes in Net Position
For the Fiscal Year Ended June 30, 2018 Component
University Units
REVENUESOperating Revenues:
Student Tuition and Fees, Net of Scholarship Allowances of $131,613,629 ($3,221,520 Pledged for the Parking System Revenue Bonds) 281,289,221$ -$ Federal Grants and Contracts 207,919,289 - State and Local Grants and Contracts 28,009,470 - Nongovernmental Grants and Contracts 195,672,801 72,779,448 Sales and Services of Auxiliary Enterprises ($10,779,794 Pledged for the Parking System Revenue Bonds) 146,151,702 - Sales and Services of Component Units - 270,225,469 Royalties and Licensing Fees - 4,034,562 Gifts and Donations - 57,927,275 Interest on Loans and Notes Receivable 202,009 - Other Operating Revenues 12,719,725 56,827,067
Total Operating Revenues 871,964,217 461,793,821
EXPENSESOperating Expenses:
Compensation and Employee Benefits 928,091,379 236,998,979 Services and Supplies 323,126,306 153,450,654 Utilities and Communications 24,512,272 1,361,197 Scholarships, Fellowships, and Waivers 90,214,079 9,798,737 Depreciation 52,588,444 15,238,223 Self-Insurance Claims 3,019,925 -
Total Operating Expenses 1,421,552,405 416,847,790
Operating Income (Loss) (549,588,188) 44,946,031
NONOPERATING REVENUES (EXPENSES)State Noncapital Appropriations 420,566,069 - Federal and State Student Financial Aid 134,685,331 - Noncapital Grants and Donations 21,953,799 - Investment Income 18,288,834 60,956,694 Other Nonoperating Revenues 2,293,561 553,347 Gain (Loss) on Disposal of Capital Assets (839,711) 10,497 Interest on Capital Asset-Related Debt (736,154) (12,972,417) Other Nonoperating Expenses (49,502,267) (18,892,663)
Net Nonoperating Revenues 546,709,462 29,655,458
Income (Loss) Before Other Revenues (2,878,726) 74,601,489
State Capital Appropriations 27,971,267 - Capital Grants, Contracts, Donations, and Fees 10,937,387 -
Increase in Net Position 36,029,928 74,601,489
Net Position, Beginning of Year 1,196,205,818 736,817,388 Adjustment to Beginning Net Position (329,838,000) -
Net Position, Beginning of Year, as Restated 866,367,818 736,817,388
Net Position, End of Year 902,397,746$ 811,418,877$
The accompanying notes to financial statements are an integral part of this statement.
Report No. 2019-108 January 2019 Page 19
THIS PAGE INTENTIONALLY LEFT BLANK

Report No. 2019-108 Page 20 January 2019
UNIVERSITY OF SOUTH FLORIDA A Component Unit of the State of Florida
Statement of Cash Flows
For the Fiscal Year Ended June 30, 2018 University
CASH FLOWS FROM OPERATING ACTIVITIESStudent Tuition and Fees, Net 282,347,825$ Grants and Contracts 430,567,675 Sales and Services of Auxiliary Enterprises 146,121,868 Interest on Loans and Notes Receivable 189,636 Payments to Employees (876,091,174) Payments to Suppliers for Goods and Services (339,522,803) Payments to Students for Scholarships and Fellowships (90,214,079) Payments on Self-Insurance Claims and Expenses (1,752,179) Loans Issued to Students (504,144) Collection on Loans to Students 1,514,587 Other Operating Receipts 12,318,683
Net Cash Used by Operating Activities (435,024,105)
CASH FLOWS FROM NONCAPITAL FINANCING ACTIVITIESState Noncapital Appropriations 420,566,069 Federal and State Student Financial Aid 134,685,331 Noncapital Grants, Contracts and Donations 21,542,758 Federal Direct Loan Program Receipts 238,042,443 Federal Direct Loan Program Disbursements (238,042,443) Operating Subsidies and Transfers 2,417,706 Net Change in Funds Held for Others (1,811,498) Other Nonoperating Receipts 20,024,408 Other Nonoperating Disbursements (62,329,465)
Net Cash Provided by Noncapital Financing Activities 535,095,309
CASH FLOWS FROM CAPITAL AND RELATED FINANCING ACTIVITIESState Capital Appropriations 32,730,759 Capital Grants, Contracts, Donations and Fees 2,149,628 Purchase or Construction of Capital Assets (90,330,903) Principal Paid on Capital Debt and Leases (2,811,035) Interest Paid on Capital Debt and Leases (491,926)
Net Cash Used by Capital and Related Financing Activities (58,753,477)
CASH FLOWS FROM INVESTING ACTIVITIESProceeds from Sales and Maturities of Investments 14,791,877 Purchases of Investments (75,480,398) Investment Income 17,641,628
Net Cash Used by Investing Activities (43,046,893)
Net Decrease in Cash and Cash Equivalents (1,729,166) Cash and Cash Equivalents, Beginning of Year 72,087,940
Cash and Cash Equivalents, End of Year 70,358,774$

Report No. 2019-108 January 2019 Page 21
UNIVERSITY OF SOUTH FLORIDA A Component Unit of the State of Florida
Statement of Cash Flows (Continued)
For the Fiscal Year Ended June 30, 2018 University
RECONCILIATION OF OPERATING LOSS TO NET CASH USED BY OPERATING ACTIVITIESOperating Loss (549,588,188)$ Adjustments to Reconcile Operating Loss to Net Cash Used by Operating Activities:
Depreciation Expense 52,588,444 Changes in Assets, Liabilities, Deferred Outflows of Resources, and Deferred Inflows of Resources:
Receivables, Net 13,189,639 Loans and Notes Receivable, Net 1,010,443 Inventories (36,613) Other Assets (571,745) Accounts Payable 8,304,010 Salaries and Wages Payable 2,488,479 Deposits Payable (481,671) Compensated Absences Payable 3,398,262 Unearned Revenue (12,717,967) Estimated Insurance Claims Payable 1,267,746 Other Postemployment Benefits Payable (34,376,000) Net Pension Liability 30,366,600 Deferred Outflows of Resources Related to Other Postemployment Benefits (5,844,000) Deferred Inflows of Resources Related to Other Postemployment Benefits 63,109,000 Deferred Outflows of Resources Related to Pensions (19,036,885) Deferred Inflows of Resources Related to Pensions 11,906,341
NET CASH USED BY OPERATING ACTIVITIES (435,024,105)$
SUPPLEMENTAL DISCLOSURE OF NONCASH INVESTING AND CAPITAL FINANCING ACTIVITIES
647,206$
(905,502)$
8,787,759$
Losses from the disposal of capital assets were recognized on the statement ofrevenues, expenses, and changes in net position, but are not cash transactionsfor the statement of cash flows.
Unrealized gains on investments were recognized as an increase to investmentincome on the statement of revenues, expenses, and changes in net position, butare not cash transactions for the statement of cash flows.
Donation of capital assets were recognized on the statement of revenues,expenses, and changes in net position, but are not cash transactions for thestatement of cash flows.
The accompanying notes to financial statements are an integral part of this statement.

Report No. 2019-108 Page 22 January 2019
NOTES TO FINANCIAL STATEMENTS
1. Summary of Significant Accounting Policies
Reporting Entity. The University is a separate public instrumentality that is part of the State university
system of public universities, which is under the general direction and control of the Florida Board of
Governors. The University is directly governed by a Board of Trustees (Trustees) consisting of
13 members. The Governor appoints 6 citizen members and the Board of Governors appoints 5 citizen
members. These members are confirmed by the Florida Senate and serve staggered terms of 5 years.
The chair of the faculty senate and the president of the student body of the University are also members.
The Board of Governors establishes the powers and duties of the Trustees. The Trustees are responsible
for setting policies for the University, which provide governance in accordance with State law and Board
of Governors’ Regulations, and selecting the University President. The University President serves as
the Executive Officer and the Corporate Secretary of the Trustees and is responsible for administering
the policies prescribed by the Trustees.
Criteria for defining the reporting entity are identified and described in the Governmental Accounting
Standards Board’s (GASB) Codification of Governmental Accounting and Financial Reporting Standards,
Sections 2100 and 2600. These criteria were used to evaluate potential component units for which the
primary government is financially accountable and other organizations for which the nature and
significance of their relationship with the primary government are such that exclusion would cause the
primary government’s financial statements to be misleading. Based on the application of these criteria,
the University is a component unit of the State of Florida, and its financial balances and activities are
reported in the State’s Comprehensive Annual Financial Report by discrete presentation.
Blended Component Unit. Based on the application of the criteria for determining component units, the
University of South Florida Health Sciences Center Self-Insurance Program is included within the
University’s reporting entity as a blended component unit. The University of South Florida Health
Sciences Center Self-Insurance Program was created in 1972 and provides medical professional liability,
covering the USF Board of Trustees and faculty, staff, and students engaged in medical programs at the
University. Condensed financial statements for the University’s blended component unit are shown in a
subsequent note.
Discretely Presented Component Units. Based on the application of the criteria for determining
component units, affiliated organizations (direct-support organizations) are included within the University
reporting entity as discretely presented component units. An annual audit of each discretely presented
component unit’s financial statements is conducted by independent certified public accountants. The
annual reports are submitted to the Auditor General and the University Board of Trustees. Additional
information on the University’s discretely presented component units, including copies of the audit
reports, is available by contacting the University Controller’s office. Condensed financial statements for
the University’s discretely component units are shown in a subsequent note.
Direct-Support Organizations. The University’s direct-support organizations are provided for in
Section 1004.28, Florida Statutes, the Board of Governors Regulation 9.011. These legally separate,
not-for-profit corporations are organized and operated exclusively to assist the University to achieve

Report No. 2019-108 January 2019 Page 23
excellence by providing supplemental resources from private gifts and bequests and valuable education
support services and are governed by separate boards. The Statute authorizes these organizations to
receive, hold, invest, and administer property and to make expenditures to or for the benefit of the
University. These organizations and their purposes are explained as follows:
The University of South Florida Foundation, Inc. accepts, invests, administers, and distributes private gifts given for the funding of activities and facilities directly related to the mission, role, and scope of the University of South Florida.
The University of South Florida Alumni Association, Inc. fosters the spirit of loyalty and fraternity among the graduates, former students, and friends of the University, and promotes their continued active interest in and on behalf of the University.
The Sun Dome, Inc. operates a multi-purpose facility on behalf of the University of South Florida to provide the students, faculty, and staff of the University, as well as the general public, an array of cultural, athletic, and other educational events and activities, including a variety of entertainment events.
The University of South Florida Research Foundation, Inc. has been established to provide a means by which inventions and works may be developed, protected, applied, and utilized so that the results of University research will be made available to the public and funds will be made available from the commercial application of inventions and works to be dedicated to the benefit of the University and shared with the inventor/author.
The USF Financing Corporation was organized and operated to receive, hold, invest, and administer property and to make expenditures to or for the benefit of the University of South Florida.
The USF Property Corporation was formed for the primary purpose of acting as lessor in connection with “lease-purchase” financings in support of the activities and educational purposes of the University of South Florida and of the USF Financing Corporation by assisting in acquiring facilities and constructing facilities on the University campus and in general, furthering the University’s education mission.
The USF Health Professions Conferencing Corporation was established to provide educational, administrative, logistical, and financial services to support the USF Health’s Office of Continuing Professional Development (OCPD). The OCPD is committed to sponsoring quality continuing educational activities to meet the needs of USF faculty, alumni, and healthcare professionals practicing throughout the State, nationally, and internationally.
The University Medical Service Association, Inc. (“UMSA”) is approved as the USF Health Faculty Practice Plan (the “Plan”) pursuant to Florida Board of Governors Regulation 9.017 and USF Regulation 9.017. UMSA specifically functions as the University’s agent for the orderly collection and administration of income generated from University faculty practice in accordance with the Plan, and employs and provides personnel to support the USF Health clinical enterprise and mission.
The University of South Florida Medical Services Support Corporation (“MSSC”) is organized and operated exclusively to receive, hold, invest, and administer property and to make expenditures to or for the benefit of the University. At the September 16, 2015, Board meeting, the Board approved the transition of MSSC’s operations to UMSA over the course of the 2015-16 fiscal year. MSSC continues to be a direct-support organization of the University but has no operations.
Basis of Presentation. The University’s accounting policies conform with accounting principles
generally accepted in the United States of America applicable to public colleges and universities as
prescribed by GASB. The National Association of College and University Business Officers (NACUBO)
Report No. 2019-108 Page 24 January 2019
also provides the University with recommendations prescribed in accordance with generally accepted
accounting principles promulgated by GASB and the Financial Accounting Standards Board (FASB).
GASB allows public universities various reporting options. The University has elected to report as an
entity engaged in only business-type activities. This election requires the adoption of the accrual basis
of accounting and entitywide reporting including the following components:
Management’s Discussion and Analysis
Basic Financial Statements:
o Statement of Net Position
o Statement of Revenues, Expenses, and Changes in Net Position
o Statement of Cash Flows
o Notes to Financial Statements
Other Required Supplementary Information
Measurement Focus and Basis of Accounting. Basis of accounting refers to when revenues,
expenses, assets, deferred outflows of resources, liabilities, and deferred inflows of resources, are
recognized in the accounts and reported in the financial statements. Specifically, it relates to the timing
of the measurements made, regardless of the measurement focus applied. The University’s financial
statements are presented using the economic resources measurement focus and the accrual basis of
accounting. Revenues, expenses, gains, losses, assets, deferred outflows of resources, liabilities, and
deferred inflows of resources resulting from exchange and exchange-like transactions are recognized
when the exchange takes place. Revenues, expenses, gains, losses, assets, deferred outflows of
resources, liabilities, and deferred inflows of resources resulting from nonexchange activities are
generally recognized when all applicable eligibility requirements, including time requirements, are met.
The University follows GASB standards of accounting and financial reporting.
The University’s blended and discretely presented component units use the economic resources
measurement focus and the accrual basis of accounting whereby revenues are recognized when earned
and expenses are recognized when incurred. Some follow GASB standards of accounting and financial
reporting, others follow FASB standards of accounting and financial reporting for not-for-profit
organizations.
Significant interdepartmental sales between auxiliary service departments and other institutional
departments have been eliminated from revenues and expenses for reporting purposes.
The University’s principal operating activities consist of instruction, research, and public service.
Operating revenues and expenses generally include all fiscal transactions directly related to these
activities as well as administration, operation and maintenance of capital assets, and depreciation of
capital assets. Nonoperating revenues include State noncapital appropriations, Federal and State
student financial aid, investment income (net of unrealized gains or losses on investments). Interest on
capital asset-related debt is a nonoperating expense. Other revenues generally include revenues for
capital construction projects.
The statement of net position is presented in a classified format to distinguish between current and
noncurrent assets and liabilities. When both restricted and unrestricted resources are available to fund
Report No. 2019-108 January 2019 Page 25
certain programs, it is the University’s policy to first apply the restricted resources to such programs,
followed by the use of the unrestricted resources.
The statement of revenues, expenses, and changes in net position is presented by major sources and is
reported net of tuition scholarship allowances. Tuition scholarship allowances are the difference between
the stated charge for goods and services provided by the University and the amount that is actually paid
by the student or the third party making payment on behalf of the student. The University applied the
“Alternate Method” as prescribed in NACUBO Advisory Report 2000-05 to determine the reported net
tuition scholarship allowances. Under this method, the University computes these amounts by allocating
the cash payments to students, excluding payments for services, using a ratio of total aid to aid not
considered third-party aid.
The statement of cash flows is presented using the direct method in compliance with GASB Statement
No. 9, Reporting Cash Flows of Proprietary and Nonexpendable Trust Funds and Governmental Entities
That Use Proprietary Fund Accounting.
Cash and Cash Equivalents. Cash and cash equivalents consist of cash on hand and cash in demand
accounts. University cash deposits are held in banks qualified as public depositories under Florida law.
All such deposits are insured by Federal depository insurance, up to specified limits, or collateralized with
securities held in Florida’s multiple financial institution collateral pool required by Chapter 280,
Florida Statutes. Cash and cash equivalents that are externally restricted to make debt service
payments, maintain sinking or reserve funds, or to purchase or construct capital or other restricted assets,
are classified as restricted.
Capital Assets. University capital assets consist of land, construction in progress, buildings,
infrastructure and other improvements, furniture and equipment, library resources, property under capital
leases, works of art and historical treasures, and other capital assets. These assets are capitalized and
recorded at cost at the date of acquisition or at acquisition value at the date received in the case of gifts
and purchases of State surplus property. Additions, improvements, and other outlays that significantly
extend the useful life of an asset are capitalized. Other costs incurred for repairs and maintenance are
expensed as incurred. The University has a capitalization threshold of $5,000 for tangible personal
property and $100,000 for new buildings and other building improvements. Depreciation is computed on
the straight-line basis over the following estimated useful lives:
Buildings – 10 to 40 years, depending on construction
Infrastructure and Other Improvements – 20 years
Furniture and Equipment – 3 to 20 years
Library Resources – 10 years
Property Under Capital Leases – 7 to 10 years
Other Capital Assets – 3 to 20 years
Works of Art and Historical Treasures – 5 years
Noncurrent Liabilities. Noncurrent liabilities include capital improvement debt payable, installment
purchases payable, capital leases payable, estimated insurance claims payable, compensated absences
payable, Federal advances payable, other postemployment benefits payable, dining facility fee payable,
Report No. 2019-108 Page 26 January 2019
and net pension liabilities that are not scheduled to be paid within the next fiscal year. Capital
improvement debt is reported net of unamortized premium or discount. The University amortizes debt
premiums and discounts over the life of the debt using the straight-line method.
Pensions. For purposes of measuring the net pension liabilities, deferred outflows of resources and
deferred inflows of resources related to pensions, and pension expense, information about the fiduciary
net positions of the Florida Retirement System (FRS) defined benefit plan and the Health Insurance
Subsidy (HIS) defined benefit plan and additions to/deductions from the FRS and HIS fiduciary net
positions have been determined on the same basis as they are reported by the FRS and the HIS plans.
Benefit payments (including refunds of employee contributions) are recognized when due and payable
in accordance with benefit terms. Investments are reported at fair value.
2. Reporting Change
Governmental Accounting Standards Board Statement No. 75. The University implemented GASB
Statement No. 75, Accounting and Financial Reporting for Postemployment Benefits Other Than
Pensions, which replaces GASB Statement No. 45, Accounting and Financial Reporting by Employers
for Postemployment Benefits Other Than Pensions, as amended. This statement addresses accounting
and financial reporting for postemployment benefits other than pensions (OPEB) provided to employees
of state and local government employers; establishes standards for recognizing and measuring liabilities,
deferred outflows of resources, deferred inflows of resources, and expenses; requires governments to
report a liability, deferred outflows of resources, deferred inflows of resources, and expenses on the face
of the financial statement for the OPEB they provide; and requires more extensive note disclosures and
supplementary information about a government’s OPEB liability.
3. Adjustments to Beginning Net Position
The beginning net position of the University was decreased by $329,838,000 due to implementation of
GASB Statement No. 75. The University’s total OPEB liability reported at June 30, 2017, increased by
$335,486,000 to $480,770,000 as of July 1, 2017, due to the transition in the valuation methods under
GASB Statement No. 45 to GASB Statement No. 75, and a beginning balance for deferred outflows
related to OPEB was established in the amount of $5,648,000.
4. Deficit Net Position in Individual Funds
The University reported an unrestricted net position which included a deficit in the current
funds – unrestricted as shown below.
Fund Net Position
Current Funds - Unrestricted (276,435,771)$ Auxiliary Funds 110,596,011
Total (165,839,760)$
As shown in the following schedule, this deficit can be attributed to the recognition of long-term liabilities
(i.e., compensated absences payable, OPEB payable, and net pension liabilities) in the current
unrestricted funds that are expected to be paid over time and financed by future appropriations:

Report No. 2019-108 January 2019 Page 27
Description University
Total Unrestricted Net Position Before Recognition of Long-Term Liabilities, Deferred Outflows of Resources, and Deferred Inflows of Resources 583,035,226$ Amount Expected to be Financed in Future Years: Compensated Absences Payable 85,519,634 Other Postemployment Benefits Payable and Related Deferred Outflows of Resources and Deferred Inflows of Resources 498,011,000 Net Pension Liability and Related Deferred Outflows of Resources and Deferred Inflows of Resources 165,344,352 Total Amount Expected to be Financed in Future Years (748,874,986)
Total Unrestricted Net Position (165,839,760)$
5. Investments
Section 1011.42(5), Florida Statutes, authorizes universities to invest funds with the State Treasury and
State Board of Administration (SBA) and requires that universities comply with the statutory requirements
governing investment of public funds by local governments. Accordingly, universities are subject to the
requirements of Chapter 218, Part IV, Florida Statutes. The Board of Trustees has adopted a written
investment policy providing that surplus funds of the University shall be invested in those institutions and
instruments permitted under the provisions of Florida Statutes. Pursuant to Section 218.415(16),
Florida Statutes, the University is authorized to invest in the Florida PRIME investment pool administered
by the SBA; Securities and Exchange Commission registered money market funds with the highest credit
quality rating from a nationally recognized rating agency; interest-bearing time deposits and savings
accounts in qualified public depositories, as defined in Section 280.02, Florida Statutes; direct obligations
of the United States Treasury; obligations of Federal agencies and instrumentalities; securities of, or
interests in, certain open end or closed end management type investment companies; and other
investments approved by the Board of Trustees as authorized by law. Investments set aside to make
debt service payments, maintain sinking or reserve funds, or to purchase or construct capital assets are
classified as restricted.
The University categorizes its fair value measurements within the fair value hierarchy established by
generally accepted accounting principles. The hierarchy is based on the valuation inputs used to
measure the fair value of the asset. Level 1 inputs are quoted prices in active markets for identical assets,
Level 2 inputs are significant other observable inputs, and Level 3 inputs are significant unobservable
inputs.
The University’s recurring fair value measurements as of June 30, 2018 are valued using the following
valuation techniques and inputs:
United States Treasury securities and Bonds and notes: These securities are valued daily by a pricing
service that uses evaluated pricing applications which incorporate available market information.
Available information is also applied through benchmarking processes, sector groupings, and matrix
pricing (Level 2 inputs).
Report No. 2019-108 Page 28 January 2019
Stocks and other equity securities: This type includes domestic and international equities valued at
quoted prices in an active market (Level 1 inputs).
Equity Mutual Funds: This category includes investments in domestic and international equities through
commingled fund structures. The investment objective of these funds is to track the performance of their
respective benchmarks. Investments in this category are valued at quoted prices in an active market
(Level 1 inputs).
Bond Mutual Funds: This category includes investments in fixed income securities through commingled
fund structures. The investment objective of these funds is to track the performance of their respective
market-weighted indices with a short-term dollar-weighted average maturity. Investments in this category
are valued at quoted prices in an active market (Level 1 inputs).
Alternative Mutual Funds: This category includes investments in stocks and industries, equity indices,
fixed income, currencies and commodities. The investment objective of these funds is to seek positive
absolute returns. The fund seeks to provide long-term returns with a low correlation to traditional asset
class returns by investing in a broad spectrum of asset classes and markets. Investments in this category
are valued at quoted prices in an active market (Level 1 inputs).
Money Market Mutual Funds: This category includes investments in high-quality money market
instruments through commingled fund structures. The investment objective of these funds is to maximize
current income, to the extent consistent with the preservation of capital, and maintain liquidity.
Investments in this category are valued at quoted prices in an active market (Level 1 inputs).
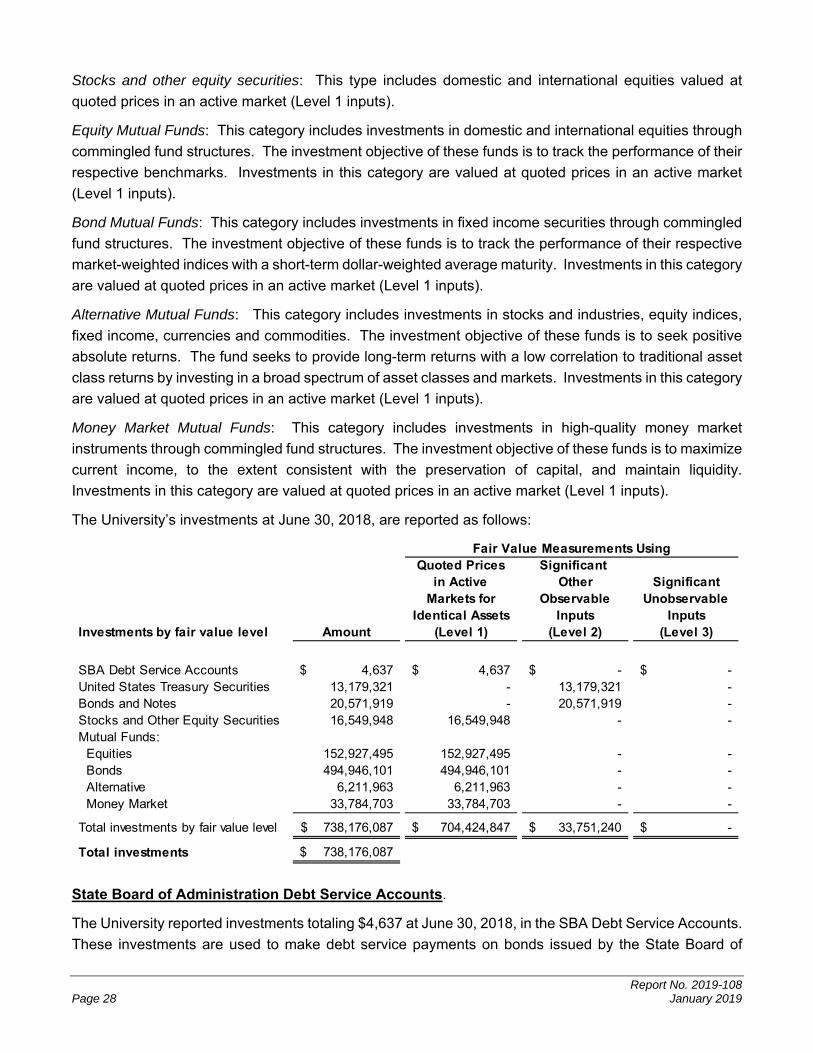
The University’s investments at June 30, 2018, are reported as follows:
Quoted Prices Significant in Active Other Significant
Markets for Observable UnobservableIdentical Assets Inputs Inputs
Investments by fair value level Amount (Level 1) (Level 2) (Level 3)
SBA Debt Service Accounts 4,637$ 4,637$ -$ -$ United States Treasury Securities 13,179,321 - 13,179,321 - Bonds and Notes 20,571,919 - 20,571,919 -
16,549,948 16,549,948 - - Mutual Funds: Equities 152,927,495 152,927,495 - - Bonds 494,946,101 494,946,101 - - Alternative 6,211,963 6,211,963 - - Money Market 33,784,703 33,784,703 - -
Total investments by fair value level 738,176,087$ 704,424,847$ 33,751,240$ -$
Total investments 738,176,087$
Stocks and Other Equity Securities
Fair Value Measurements Using
State Board of Administration Debt Service Accounts.
The University reported investments totaling $4,637 at June 30, 2018, in the SBA Debt Service Accounts.
These investments are used to make debt service payments on bonds issued by the State Board of
Report No. 2019-108 January 2019 Page 29
Education for the benefit of the University. The University’s investments consist of United States Treasury
securities, with maturity dates of 6 months or less, and are reported at fair value. The University relies
on policies developed by the SBA for managing interest rate risk and credit risk for these accounts.
Disclosures for the Debt Service Accounts are included in the notes to financial statements of the State’s
Comprehensive Annual Financial Report.
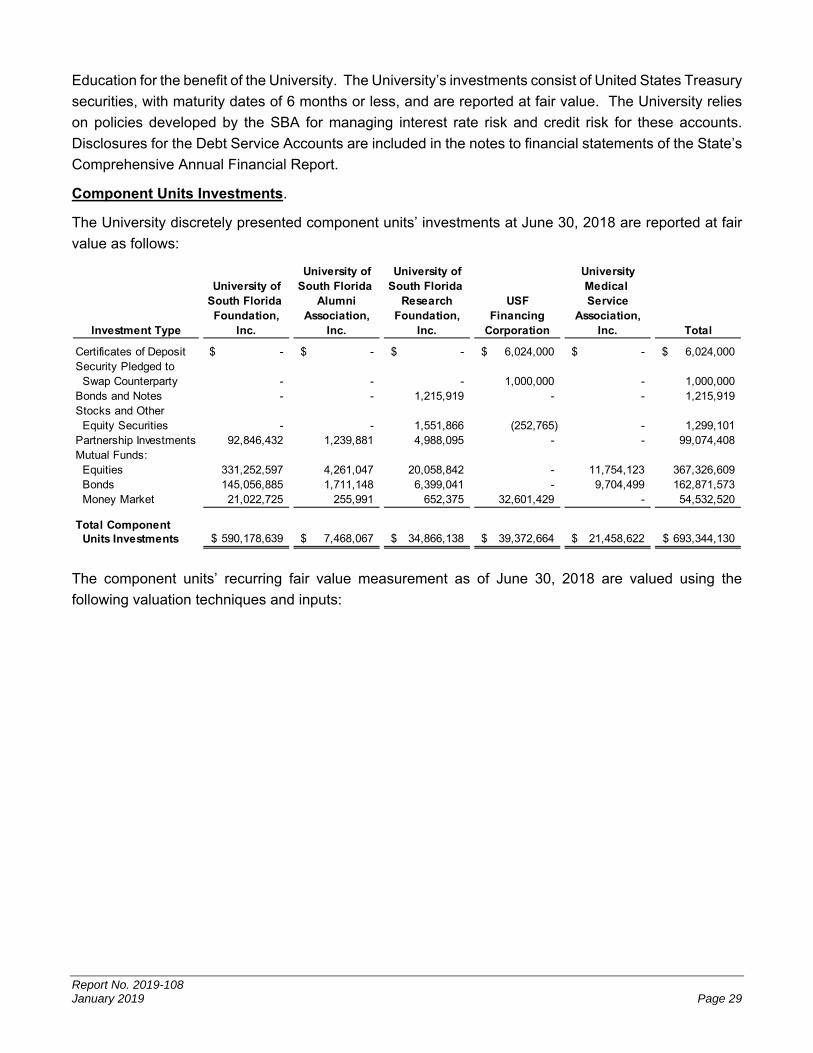
Component Units Investments.
The University discretely presented component units’ investments at June 30, 2018 are reported at fair
value as follows:
University of University of UniversityUniversity of South Florida South Florida Medical
South Florida Alumni Research USF ServiceFoundation, Association, Foundation, Financing Association,
Investment Type Inc. Inc. Inc. Corporation Inc. Total
Certificates of Deposit -$ -$ -$ 6,024,000$ -$ 6,024,000$ Security Pledged to Swap Counterparty - - - 1,000,000 - 1,000,000 Bonds and Notes - - 1,215,919 - - 1,215,919 Stocks and Other Equity Securities - - 1,551,866 (252,765) - 1,299,101 Partnership Investments 92,846,432 1,239,881 4,988,095 - - 99,074,408 Mutual Funds: Equities 331,252,597 4,261,047 20,058,842 - 11,754,123 367,326,609 Bonds 145,056,885 1,711,148 6,399,041 - 9,704,499 162,871,573 Money Market 21,022,725 255,991 652,375 32,601,429 - 54,532,520
Total Component Units Investments 590,178,639$ 7,468,067$ 34,866,138$ 39,372,664$ 21,458,622$ 693,344,130$
The component units’ recurring fair value measurement as of June 30, 2018 are valued using the
following valuation techniques and inputs:

Report No. 2019-108 Page 30 January 2019
QuotedPrices Significant
in Active Other SignificantMarkets for Observable Unobservable
Identical Assets Inputs InputsInvestments by fair value level Amount (Level 1) (Level 2) (Level 3)
Certificates of Deposit 6,024,000$ 6,024,000$ -$ -$ Bonds and Notes 1,215,919 - 1,215,919 -
1,551,866 1,551,866 - - 150,000 - - 150,000
Mutual Funds Equities 165,889,400 153,718,192 404,675 11,766,533 Bonds 84,121,424 70,724,725 1,272,945 12,123,754 Money Market 54,532,520 53,207,036 40,130 1,285,354
Total investments by fair value level 313,485,129 285,225,819$ 2,933,669$ 25,325,641$
Investments measured at the net asset value (NAV)
Partnership Investments Private Equity 37,926,069 Fixed Income 29,073,871 Real Asset 31,924,468 Mutual Funds Equities 201,437,209 Bonds 78,750,149
Total investments measured at the NAV 379,111,766
Total investments measured at fair value 692,596,895
OtherSecurity Pledged to Swap Counterparty 1,000,000 Equity Method Investment (252,765)
Total Other Investments 747,235
Total Component Unit Investments 693,344,130$
Partnership Investments
Fair Value Measurements Using
Stocks and Other Equity Securities
The valuation method for investments measured at the net asset value (NAV) per share (or its equivalent)
is presented in the following table:
Redemption RedemptionUnfunded Frequency (if Notice
Investments measured at the NAV Fair Value Commitments Currently Eligible) Period
Partnership Investment:Private Equity 37,926,069$ 10,924,486$ NA NAFixed Income 29,073,871 17,012,633 Monthy 3-5 daysReal Asset 31,924,468 9,110,073 NA NA
Mutual Funds:Equities 201,437,209 - Daily/Monthly 2-30 daysBonds 78,750,149 - Weekly 0-7 days
Total investments measured at the NAV 379,111,766$ 37,047,192$
Partnership Private Equity and Real Asset Investment. This category consists of private capital
partnerships in fund of fund underlying managers. Investments include private equity, real estate, and
real assets that are not subject to redemption. The USF Foundation instead receives distributions
Report No. 2019-108 January 2019 Page 31
through the liquidation of the underlying assets of the investees. The estimated remaining life on these
funds range from 1 to 11 years.
Partnership Fixed Income Investment. This category consists of a high-yield bond portfolio in a
commingled fund in which the manager holds publicly traded corporate bonds with some rated below
investment grade. The fair value of the investments in this category has been estimated using the net
asset value per share of the investments.
Bond Mutual Funds. This category includes investments in fixed income securities through a
commingled fund structures. The investment manager’s emphasis is on spread sectors, in particular,
puttable corporate bonds and commercial mortgage-backed securities. The fair value of the investments
in this category has been estimated using the net asset value per share of the investments.
Equity Mutual Funds. This category includes investments in domestic and international equities through
a commingled fund structure. The investment objective of these funds is to provide long-term total return
in excess of their respective benchmarks. The fair value of the investments in this category has been
estimated using the net asset value per share of the investments.
The University’s investments (which include investments of its blended component unit, the USF Health
Sciences Center Self-Insurance Program), and investments of the University of South Florida Research
Foundation, Inc. (Research Foundation), a discretely presented component unit, consisted of various
debt, equity and equity-type securities, and equity, bond, alternative, and money market mutual funds.
The University’s investment policy, the USF Health Sciences Center Self-Insurance Program’s
investment policy, and the Research Foundation’s investment policy allow investments in cash and cash
equivalents, equities, mutual funds, and fixed-income investments. The following risks apply to the
University, USF Health Sciences Center Self-Insurance Program, and Research Foundation’s
investments.
Interest Rate Risk: Interest rate risk is the risk that changes in interest rates will adversely affect the fair
value of an investment. The University, USF Health Sciences Center Self-Insurance Program, and the
Research Foundation investment policies limit the fixed-income portfolio (United States Treasury
securities, United States government agency obligations, mortgage-based securities, corporate debt,
State, and municipal securities investments) to a weighted-average duration of less than five years. For
long-term investments, the University and Research Foundation investment policies do not limit the
duration for long-term corporate notes or other direct debt obligations. The University and Research
Foundation’s investment policies provide for interest rate risk. The risk varies depending on the type of
investment.
Credit Risk: Credit risk is the risk that an insurer or other counterparty to an investment will not fulfill its
obligations. The USF Health Sciences Center Self-Insurance Program’s investment policy provides that
all fixed-income securities investments shall be rated in the top three rating classifications as defined by
both Moody’s and Standard & Poor’s. The University and Research Foundation investment policies
provide for credit risk. The risk varies depending on the type of investment.
The following interest rate and credit risks apply to the University, USF Health Sciences Center
Self-Insurance Program and Research Foundation investments in debt securities and mutual funds at
June 30, 2018:

Report No. 2019-108 Page 32 January 2019
University Debt Investment Maturity and Quality Ratings
WeightedAverage Standard Fair
Investment Type Maturities Moody's and Poor's Value
United States Treasury Securities (2) 3.64 Years (1) (1) 13,179,321$ Bonds and Notes (2) 3.44 Years Aaa - A3 AAA - A- 20,221,919 Bonds and Notes (2) 1 Day Aa2 Not Rated 350,000 Bond Mutual Funds (3) 2.93 Years Not Rated Not Rated 494,946,101 Money Market Mutual Funds (2) 35 Days Aaa-mf AAAm 1,266,644 Money Market Mutual Funds (3) 26 Days Aaa-mf AAAm 32,518,059
Total 562,482,044$
Credit Quality Rating
(1) Disclosure of credit risk is not required for this investment type.
(2) USF Health Sciences Center Self-Insurance Program.
(3) University.
University of South Florida Research Foundation, Inc. Investment Maturity
Fair Less Than More ThanInvestment Type Value 1 1-5 6-10 10Bonds and Notes 1,215,919$ 69,033$ 195,519$ 278,588$ 672,779$ Mutual Funds: Bonds 6,399,041 283,596 2,959,225 3,156,220 - Money Market 652,375 652,375 - - -
Total 8,267,335$ 1,005,004$ 3,154,744$ 3,434,808$ 672,779$
Investment Maturites (In Years)
University of South Florida Research Foundation, Inc. Quality Ratings (1)
Fair Less Than AInvestment Type Value AAA AA A or Not RatedBonds and Notes 1,215,919$ 234,432$ 93,463$ 237,414$ 650,610$ Mutual Funds: Bonds 6,399,041 265,155 411,975 1,538,057 4,183,854 Money Market 652,375 - - - 652,375
Total 8,267,335$ 499,587$ 505,438$ 1,775,471$ 5,486,839$
(1) Rated by Standard & Poor’s.
Custodial Credit Risk: Custodial credit risk is the risk that in the event of the failure of the counterparty,
the value of investments or collateral securities in the possession of an outside party will not be
recoverable. Exposure to custodial risk relates to investments that are held by someone other than the
University and not registered in their names. Investments for the University are held in counterparty
accounts as custodian. The University investment policy provides for custodial credit risk. All
investments for the USF Health Sciences Center Self-Insurance Program are held in counterparty
accounts as custodian.
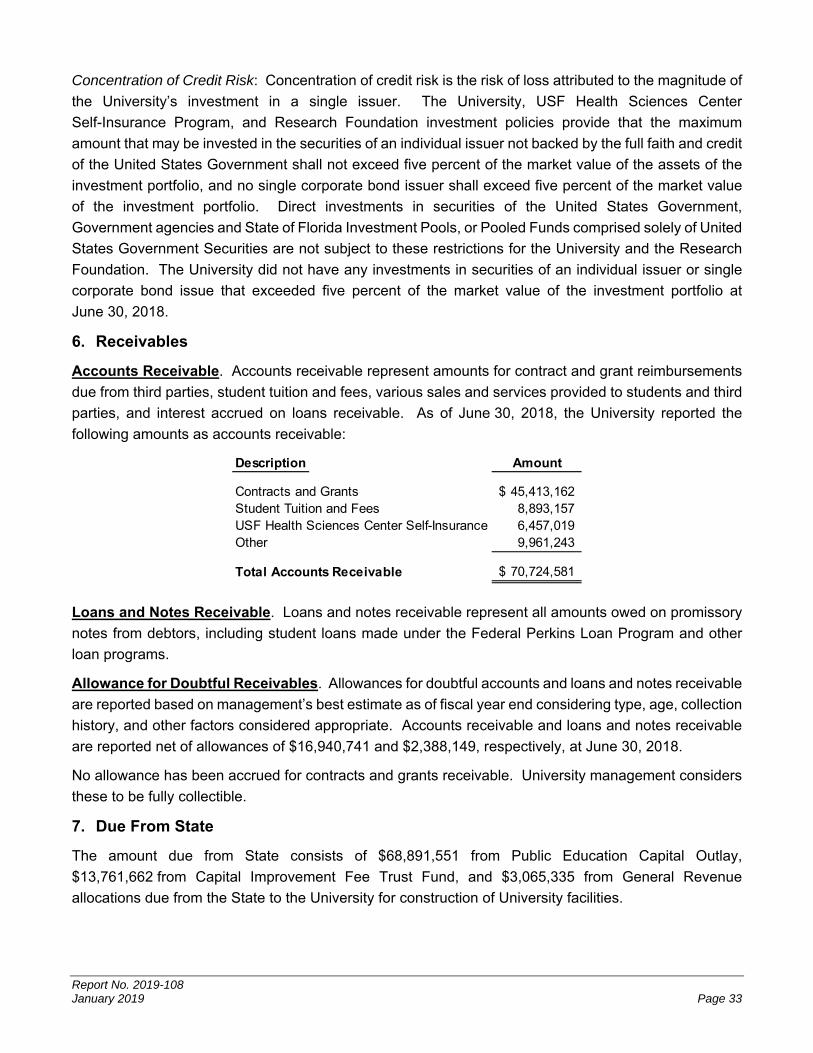
Report No. 2019-108 January 2019 Page 33
Concentration of Credit Risk: Concentration of credit risk is the risk of loss attributed to the magnitude of
the University’s investment in a single issuer. The University, USF Health Sciences Center
Self-Insurance Program, and Research Foundation investment policies provide that the maximum
amount that may be invested in the securities of an individual issuer not backed by the full faith and credit
of the United States Government shall not exceed five percent of the market value of the assets of the
investment portfolio, and no single corporate bond issuer shall exceed five percent of the market value
of the investment portfolio. Direct investments in securities of the United States Government,
Government agencies and State of Florida Investment Pools, or Pooled Funds comprised solely of United
States Government Securities are not subject to these restrictions for the University and the Research
Foundation. The University did not have any investments in securities of an individual issuer or single
corporate bond issue that exceeded five percent of the market value of the investment portfolio at
June 30, 2018.
6. Receivables
Accounts Receivable. Accounts receivable represent amounts for contract and grant reimbursements
due from third parties, student tuition and fees, various sales and services provided to students and third
parties, and interest accrued on loans receivable. As of June 30, 2018, the University reported the
following amounts as accounts receivable:
Description Amount
Contracts and Grants 45,413,162$ Student Tuition and Fees 8,893,157 USF Health Sciences Center Self-Insurance 6,457,019 Other 9,961,243
Total Accounts Receivable 70,724,581$
Loans and Notes Receivable. Loans and notes receivable represent all amounts owed on promissory
notes from debtors, including student loans made under the Federal Perkins Loan Program and other
loan programs.
Allowance for Doubtful Receivables. Allowances for doubtful accounts and loans and notes receivable
are reported based on management’s best estimate as of fiscal year end considering type, age, collection
history, and other factors considered appropriate. Accounts receivable and loans and notes receivable
are reported net of allowances of $16,940,741 and $2,388,149, respectively, at June 30, 2018.
No allowance has been accrued for contracts and grants receivable. University management considers
these to be fully collectible.
7. Due From State
The amount due from State consists of $68,891,551 from Public Education Capital Outlay,
$13,761,662 from Capital Improvement Fee Trust Fund, and $3,065,335 from General Revenue
allocations due from the State to the University for construction of University facilities.

Report No. 2019-108 Page 34 January 2019
8. Due From and To Component Units/University
The $11,907,956 reported as due from component units consists of amounts owed to the University from
the University of South Florida Research Foundation, Inc. ($7,751,530) for grant and special
project-related revenue and administrative overhead rebate; from Sun Dome, Inc. ($240,530) for
operating expenses and merchandise sales revenue; from University of South Florida Foundation, Inc.
($3,665,956), primarily for salary and operating expense support; from the USF Health Professions
Conferencing Corporation ($248,562) for program residuals; and from the University of South Florida
Alumni Association ($1,378) for payroll expenses.
The $69,044,772 reported as due to component units represents amounts owed by the University to the
USF Financing Corporation for the construction and financing of buildings and pledged revenues
($67,781,069); and to the University Medical Service Association, Inc. ($1,263,703) for deposits made to
support the funding of salaries and other operating expenses at USF Health.
9. Capital Assets
Capital assets activity for the fiscal year ended June 30, 2018, is shown in the following table:
Beginning Adjustments EndingDescription Balance (1) Additions Reductions Balance
Nondepreciable Capital Assets:Land 16,197,729$ -$ 7,451,260$ -$ 23,648,989$ Works of Art and Historical Treasures 1,312,321 - - 19,164 1,293,157 Other Capital Assets 1,173,750 - - - 1,173,750 Construction in Progress 42,177,932 - 74,390,511 44,130,557 72,437,886
Total Nondepreciable Capital Assets 60,861,732$ -$ 81,841,771$ 44,149,721$ 98,553,782$
Depreciable Capital Assets:Buildings 1,186,948,503$ 56,715,851$ 34,326,858$ 7,654,922$ 1,270,336,290$ Infrastructure and Other Improvements 69,211,858 - 169,469 - 69,381,327 Furniture and Equipment 172,463,004 - 22,825,621 6,528,850 188,759,775 Library Resources 21,301,446 - 6,106,263 - 27,407,709 Property Under Capital Leases 135,879 - 677,538 81,338 732,079 Works of Art and Historical Treasures 324,600 - - - 324,600 Other Capital Assets 14,668,495 - 116,216 38,698 14,746,013
Total Depreciable Capital Assets 1,465,053,785 56,715,851 64,221,965 14,303,808 1,571,687,793
Less, Accumulated Depreciation:Buildings 494,658,456 - 34,642,191 7,279,923 522,020,724 Infrastructure and Other Improvements 37,014,963 - 2,579,633 - 39,594,596 Furniture and Equipment 119,391,604 - 12,861,607 5,964,671 126,288,540 Library Resources 9,787,033 - 1,858,495 - 11,645,528 Property Under Capital Leases 46,563 - 163,061 45,511 164,113 Works of Art and Historical Treasures 239,433 - 37,167 - 276,600 Other Capital Assets 12,436,764 - 446,290 38,698 12,844,356
Total Accumulated Depreciation 673,574,816 - 52,588,444 13,328,803 712,834,457
Total Depreciable Capital Assets, Net 791,478,969$ 56,715,851$ 11,633,521$ 975,005$ 858,853,336$
(1) Adjustments to capital assets resulted from the substantial completion of Phase I of the student housing and retail facilities constructed as part of the service concession arrangement discussed in Note 10. The buildings constructed by the Tenant were capitalized by the University in accordance with GASB Statements No. 60 and 72.

Report No. 2019-108 January 2019 Page 35
10. Service Concession Arrangement
During the 2016-17 fiscal year, the University entered into an agreement with HSRE-Capstone Tampa,
LLC (Tenant), under which the Tenant will construct, operate and collect payments for student housing
and retail facilities through June 30 after the 45th anniversary of substantial completion of new facilities.
The University entered into this agreement in order to satisfy the current and projected needs and
demands for student housing facilities while using its resources in an efficient and effective manner.
Phase I of construction, including a dining facility and a health and wellness facility, was substantially
completed during the current fiscal year. Phase II is expected to be substantially completed during the
2018-19 fiscal year. The Tenant will transfer ownership of the new facilities to the University at the end
of the agreement. The Tenant is entitled to all revenues and other income received from the lease of the
housing facilities. The Tenant will pay the University base rent annually as a distribution of the net
operating surplus as defined in the agreement. The University will pay the Tenant a fee in the amount of
$300,000 per year for the use of the dining facility. The University retains the right to approve retail
tenants and will oversee student housing by providing administrative services. Housing resident rental
rates must be approved unanimously by an advisory committee which includes two members designated
by the University. The University reports cash in the amount of $1,439,480, construction in progress in
the amount of $1,835,520, housing facilities with a carrying amount of $55,425,209, a dining facility fee
liability in the amount of $4,726,153, and deferred inflows of resources in the amount of $54,511,702 at
year-end pursuant to the service concession arrangement.
11. Unearned Revenue
Unearned revenue at June 30, 2018, includes Alec P. Courtelis Matching Trust fund appropriations for
which the University had not yet received approval from the Florida Department of Education, as of
June 30, 2018, to spend the funds, amounts received from contracts and grants, auxiliary prepayments,
and student tuition and fees received prior to fiscal year end related to subsequent accounting periods.
As of June 30, 2018, the University reported the following amounts as unearned revenue:
Description Amount
Contracts and Grants 26,724,056$ Capital Appropriations 334,685 Auxiliary Prepayments 2,605,824 Student Tuition and Fees 190
Total Unearned Revenue 29,664,755$
12. Long-Term Liabilities
Long-term liabilities of the University at June 30, 2018, include capital improvement debt payable,
installment purchases payable, capital leases payable, estimated insurance claims payable,
compensated absences payable, Federal advance payable, dining facility fee payable, other
postemployment benefits payable, and net pension liability. Long-term liabilities activity for the fiscal year
ended June 30, 2018, is shown in the following table:

Report No. 2019-108 Page 36 January 2019
Beginning Ending CurrentDescription Balance Additions Reductions Balance Portion
Capital Improvement Debt Payable 19,956,312$ -$ 2,483,479$ 17,472,833$ 2,538,479$ Installment Purchases Payable 235,728 369,494 277,108 328,114 138,865 Capital Leases Payable 59,838 677,538 292,861 444,515 129,661 Estimated Insurance Claims Payable 26,417,494 3,019,925 1,752,179 27,685,240 1,597,571 Compensated Absences Payable 82,121,372 10,394,613 6,996,351 85,519,634 6,694,028 Federal Advance Payable 3,086,504 - 290,114 2,796,390 - Dining Facility Fee Payable - 4,886,138 159,985 4,726,153 20,865 Other Postemployment Benefits Payable (1) 480,770,000 34,381,050 68,757,050 446,394,000 6,279,000 Net Pension Liability 277,453,120 220,478,051 190,111,451 307,819,720 2,209,005
Total Long-Term Liabilities 890,100,368$ 274,206,809$ 271,120,578$ 893,186,599$ 19,607,474$
(1) The beginning balance of the Other Postemployment Benefits Payable was adjusted for adoption of GASB Statement No. 75 as described in Notes 2. and 3.
Capital Improvement Debt Payable. The University had the following capital improvement debt payable
outstanding at June 30, 2018:
Amount Amount Interest MaturityCapital Improvement Debt of Original Outstanding Rates DateType and Series Debt (1) (Percent) To
Capital Improvement Debt:2016A Parking 21,545,000$ 17,472,833$ 2.20 2026
Total Capital Improvement Debt 21,545,000$ 17,472,833$
(1) Amount outstanding includes an unamortized deferred loss on refunding.
The University has pledged a portion of future traffic and parking fees, and various student fee
assessments to repay $17,472,833 in capital improvement (parking) revenue bonds issued by the Florida
Board of Governors on behalf of the University. Proceeds from the bonds provided financing to construct
student parking garages. The bonds are payable solely from traffic and parking fees, and transportation
access fees and are payable through 2026. The University has committed to appropriate each year from
the traffic and parking fees, and transportation access fees amounts sufficient to cover the principal and
interest requirements on the debt. Total principal and interest remaining on the debt is $19,092,900 and
principal and interest paid for the current year totaled $2,936,320. During the 2017-18 fiscal year, traffic
and parking fees, and transportation access fees totaled $10,779,794 and $3,221,520, respectively.
Annual requirements to amortize all capital improvement debt outstanding as of June 30, 2018, are as
follows:

Report No. 2019-108 January 2019 Page 37
Fiscal Year Ending June 30 Principal Interest Total
2019 2,550,000$ 386,430$ 2,936,430$ 2020 2,610,000 330,330 2,940,330 2021 2,665,000 272,910 2,937,910 2022 2,715,000 214,280 2,929,280 2023 2,780,000 154,550 2,934,550 2024-2026 4,245,000 169,400 4,414,400
Subtotal 17,565,000 1,527,900 19,092,900 Deferred Loss on Refunding (92,167) - (92,167)
Total 17,472,833$ 1,527,900$ 19,000,733$
Installment Purchases Payable. The University has entered into several installment purchase
agreements for the purchase of equipment reported at $691,521. The stated interest rates ranged from
2.2 percent to 3.2 percent. Future minimum payments remaining under installment purchase agreements
and the present value of the minimum payments as of June 30, 2018, are as follows:
Fiscal Year Ending June 30 Amount
2019 147,904$ 2020 119,194 2021 39,157 2022 39,158
Total Minimum Payments 345,413 Less, Amount Representing Interest 17,299
Present Value of Minimum Payments 328,114$
Capital Leases Payable. The University has entered into capital lease agreements for equipment in the
amount of $732,079. The stated interest rates range from 5.8 percent to 7.5 percent. Future minimum
payments under the capital lease agreements and the present value of the minimum payments as of
June 30, 2018, are as follows:
Fiscal Year Ending June 30 Amount
2019 154,805$ 2020 137,725 2021 132,074 2022 75,424
Total Minimum Payments 500,028 Less, Amount Representing Interest 55,513
Present Value of Minimum Payments 444,515$
Compensated Absences Payable. Employees earn the right to be compensated during absences for
annual leave (vacation) and sick leave earned pursuant to Board of Governors’ Regulations, University
regulations, and bargaining agreements. Leave earned is accrued to the credit of the employee and
records are kept on each employee’s unpaid (unused) leave balance. The University reports a liability
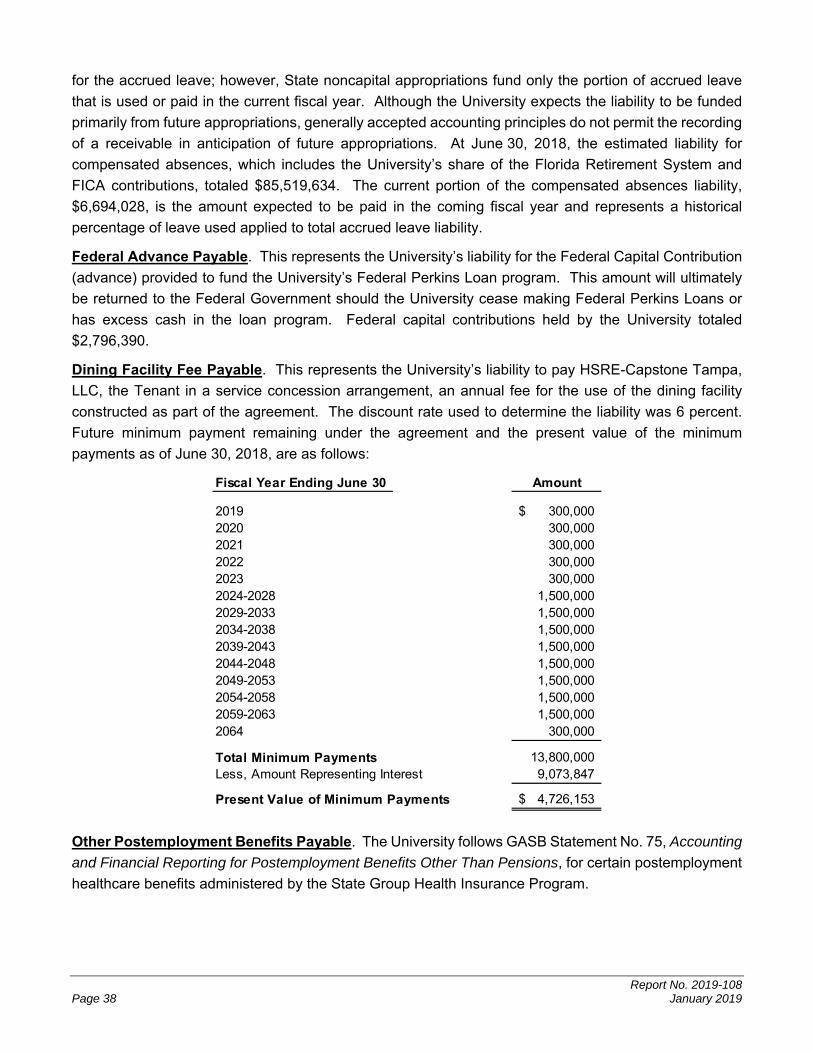
Report No. 2019-108 Page 38 January 2019
for the accrued leave; however, State noncapital appropriations fund only the portion of accrued leave
that is used or paid in the current fiscal year. Although the University expects the liability to be funded
primarily from future appropriations, generally accepted accounting principles do not permit the recording
of a receivable in anticipation of future appropriations. At June 30, 2018, the estimated liability for
compensated absences, which includes the University’s share of the Florida Retirement System and
FICA contributions, totaled $85,519,634. The current portion of the compensated absences liability,
$6,694,028, is the amount expected to be paid in the coming fiscal year and represents a historical
percentage of leave used applied to total accrued leave liability.
Federal Advance Payable. This represents the University’s liability for the Federal Capital Contribution
(advance) provided to fund the University’s Federal Perkins Loan program. This amount will ultimately
be returned to the Federal Government should the University cease making Federal Perkins Loans or
has excess cash in the loan program. Federal capital contributions held by the University totaled
$2,796,390.
Dining Facility Fee Payable. This represents the University’s liability to pay HSRE-Capstone Tampa,
LLC, the Tenant in a service concession arrangement, an annual fee for the use of the dining facility
constructed as part of the agreement. The discount rate used to determine the liability was 6 percent.
Future minimum payment remaining under the agreement and the present value of the minimum
payments as of June 30, 2018, are as follows:
Fiscal Year Ending June 30 Amount
2019 300,000$ 2020 300,000 2021 300,000 2022 300,000 2023 300,000 2024-2028 1,500,000 2029-2033 1,500,000 2034-2038 1,500,000 2039-2043 1,500,000 2044-2048 1,500,000 2049-2053 1,500,000 2054-2058 1,500,000 2059-2063 1,500,000 2064 300,000
Total Minimum Payments 13,800,000 Less, Amount Representing Interest 9,073,847
Present Value of Minimum Payments 4,726,153$
Other Postemployment Benefits Payable. The University follows GASB Statement No. 75, Accounting
and Financial Reporting for Postemployment Benefits Other Than Pensions, for certain postemployment
healthcare benefits administered by the State Group Health Insurance Program.
Report No. 2019-108 January 2019 Page 39
General Information about the OPEB Plan
Plan Description. The Division of State Group Insurance’s Other Postemployment Benefits Plan (OPEB
Plan) is a multiple-employer defined benefit plan administered by the State of Florida. Pursuant to the
provisions of Section 112.0801, Florida Statutes, all employees who retire from the University are eligible
to participate in the State Group Health Insurance Program. Retirees and their eligible dependents shall
be offered the same health and hospitalization insurance coverage as is offered to active employees at
a premium cost of no more than the premium cost applicable to active employees. A retiree means any
officer or employee who retires under a State retirement system or State optional annuity or retirement
program or is placed on disability retirement and who begins receiving retirement benefits immediately
after retirement from employment. In addition, any officer or employee who retires under the Florida
Retirement System Investment Plan is considered a “retiree” if he or she meets the age and service
requirements to qualify for normal retirement or has attained the age of 59.5 years and has the years of
service required for vesting. The University subsidizes the premium rates paid by retirees by allowing
them to participate in the OPEB Plan at reduced or blended group (implicitly subsidized) premium rates
for both active and retired employees. These rates provide an implicit subsidy for retirees because retiree
healthcare costs are generally greater than active employee healthcare costs. No assets are
accumulated in a trust that meets the criteria in paragraph 4 of GASB Statement No. 75. The OPEB Plan
contribution requirements and benefit terms necessary for funding the OPEB Plan each year is on a
pay-as-you-go basis as established by the Governor’s recommended budget and the General
Appropriations Act. Retirees are required to enroll in the Federal Medicare (Medicare) program for their
primary coverage as soon as they are eligible.
Benefits Provided. The OPEB Plan provides healthcare benefits for retirees and their dependents. The
OPEB Plan only provides an implicit subsidy as described above.
Proportionate Share of the Total OPEB Liability
The University’s proportionate share of the total OPEB liability of $446,394,000 was measured as of
June 30, 2017, and was determined by an actuarial valuation as of, July 1, 2017. At June 30, 2017, the
University’s proportionate share, determined by its proportion of total benefit payments made, was
4.13 percent, which was an increase of 0.06 from its proportionate share measured as of July 1, 2016.
Actuarial Assumptions and Other Inputs. The total OPEB liability was determined using the following
actuarial assumptions and other inputs, applied to all periods included in the measurement, unless
otherwise specified:

Report No. 2019-108 Page 40 January 2019
Inflation 2.6 percent
Salary increases 3.25 percent, average, including inflation
Discount rate 3.58 percent
Healthcare cost trend rates 7.8 percent for Preferred Provider Organizations (PPO) and 5.2 percent for Health Maintenance Organizations (HMO) for fiscal years 2017 to 2018, decreasing to an ultimate rate of 3.8 percent for fiscal year 2075 and later years.
Retirees’ share of benefit-related costs
100 percent of projected health insurance premiums for retirees
The discount rate was based on the Bond Buyer General Obligation 20-year Municipal Bond Index.
Mortality rates were based on the Generational RP-2000 with Projected Scale BB.
While an experience study had not been completed for the OPEB Plan, the actuarial assumptions that
determined the total OPEB liability for the OPEB Plan were based on certain results of the most recent
experience study for the FRS Plan.
The following changes have been made since the prior valuation:
The census data reflects changes in status for the 24-month period since July 1, 2015.
The annual per capita claim costs have been updated to reflect current age-adjusted premiums.
The premium rates have been updated to use the rates effective for 2017.
Healthcare inflation rates have been updated to reflect the recent Getzen model published by the Society of Actuaries. Additionally, the updated trend rates reflect the information from the Report on the Financial Outlook for the fiscal years ending June 30, 2017, through June 30, 2023, as adopted August 3, 2017, by the Self-Insurance Estimated Conference.
The active mortality rates have been updated to use rates mandated by Chapter 2015-157, Laws of Florida for pension plans. This law mandates the use of the assumption in either of the two most recent FRS valuations. The rates are those outlined in the Milliman’s July 1, 2016, FRS valuation report.
The discount rate as of the measurement date for GASB 75 purposes is 3.58 percent. The prior GASB 45 valuation used 4.00 percent. The GASB 75 discount rate is based on the 20-year municipal bond rate as of June 29, 2017.
Sensitivity of the University’s Proportionate Share of the Total OPEB Liability to Changes in the Discount
Rate. The following table presents the University’s proportionate share of the total OPEB liability, as well
as what the University’s proportionate share of the total OPEB liability would be if it were calculated using
a discount rate that is 1 percentage point lower (2.58 percent) or 1 percentage point higher (4.58 percent)
than the current rate:

Report No. 2019-108 January 2019 Page 41
1% Decrease
(2.58%)
Current Discount Rate (3.58%)
1% Increase
(4.58%)
University’s proportionate share of the total OPEB liability $549,805,000 $446,394,000 $366,836,000
Sensitivity of the University’s Proportionate Share of the Total OPEB Liability to Changes in the
Healthcare Cost Trend Rates. The following table presents the University’s proportionate share of the
total OPEB liability, as well as what the University’s proportionate share of the total OPEB liability would
be if it were calculated using healthcare cost trend rates that are 1 percentage point lower (6.8 percent
decreasing to 2.8 percent) or 1 percentage point higher (8.8 percent decreasing to 4.8 percent) than the
current healthcare cost trend rates:
1% Decrease
Healthcare Cost Trend Rates 1% Increase
University’s proportionate share of the total OPEB liability $360,582,000 $446,394,000 $561,538,000
OPEB Expense and Deferred Outflows of Resources and Deferred Inflows of Resources Related
to OPEB.
For the fiscal year ended June 30, 2018, the University recognized OPEB expense of $29,371,000. At
June 30, 2018, the University reported deferred outflows of resources and deferred inflows of resources
related to OPEB from the following sources:
Description
Change of assumptions or other inputs $ - $ 63,109,000 Changes in proportion and differences between University benefit payments and proportionate share of benefit payments 5,010,000 - Transactions subsequent to the measurement date 6,482,000 -
Total $ 11,492,000 $ 63,109,000
Deferred Outflowsof Resources
Deferred Inflowsof Resources
Of the total amount reported as deferred outflows of resources related to OPEB, $6,482,000 resulting
from transactions subsequent to the measurement date and before the end of the fiscal year will be
included as a reduction of the total OPEB liability and included in OPEB expense in the year ended
June 30, 2019. Other amounts reported as deferred outflows of resources and deferred inflows of
resources related to OPEB will be recognized in OPEB expense as follows:
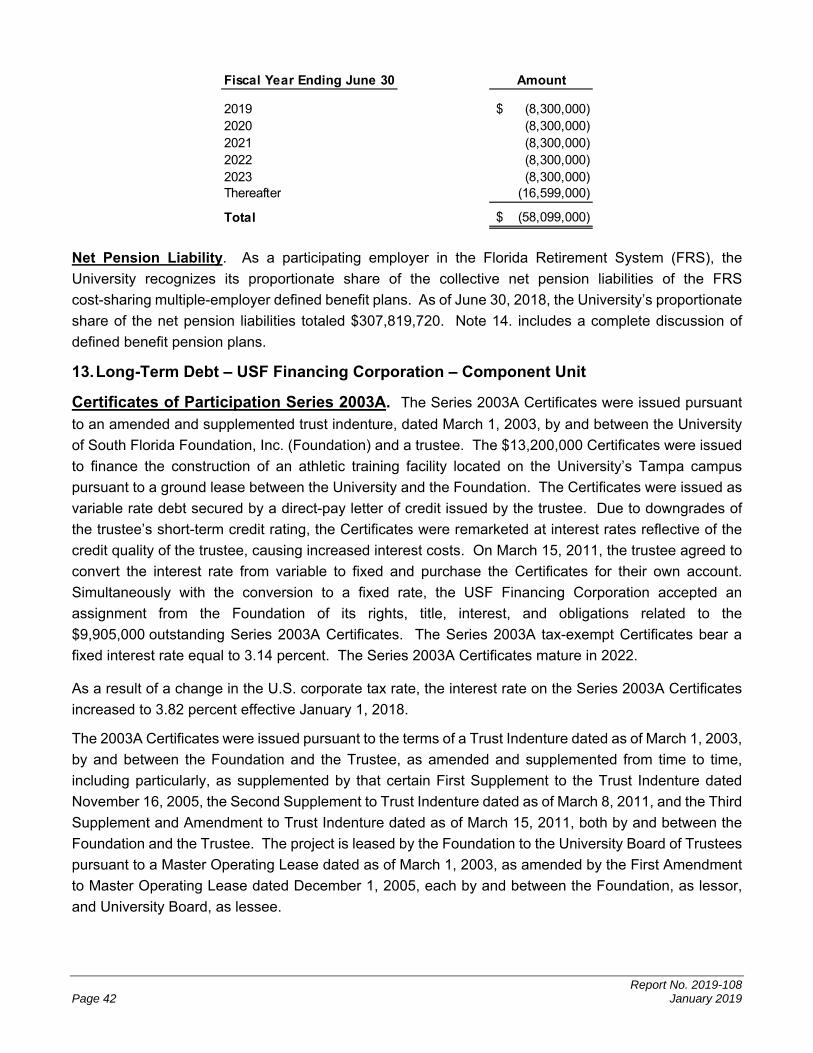
Report No. 2019-108 Page 42 January 2019
Fiscal Year Ending June 30 Amount
2019 (8,300,000)$ 2020 (8,300,000) 2021 (8,300,000) 2022 (8,300,000) 2023 (8,300,000) Thereafter (16,599,000)
Total (58,099,000)$
Net Pension Liability. As a participating employer in the Florida Retirement System (FRS), the
University recognizes its proportionate share of the collective net pension liabilities of the FRS
cost-sharing multiple-employer defined benefit plans. As of June 30, 2018, the University’s proportionate
share of the net pension liabilities totaled $307,819,720. Note 14. includes a complete discussion of
defined benefit pension plans.
13. Long-Term Debt – USF Financing Corporation – Component Unit
Certificates of Participation Series 2003A. The Series 2003A Certificates were issued pursuant
to an amended and supplemented trust indenture, dated March 1, 2003, by and between the University
of South Florida Foundation, Inc. (Foundation) and a trustee. The $13,200,000 Certificates were issued
to finance the construction of an athletic training facility located on the University’s Tampa campus
pursuant to a ground lease between the University and the Foundation. The Certificates were issued as
variable rate debt secured by a direct-pay letter of credit issued by the trustee. Due to downgrades of
the trustee’s short-term credit rating, the Certificates were remarketed at interest rates reflective of the
credit quality of the trustee, causing increased interest costs. On March 15, 2011, the trustee agreed to
convert the interest rate from variable to fixed and purchase the Certificates for their own account.
Simultaneously with the conversion to a fixed rate, the USF Financing Corporation accepted an
assignment from the Foundation of its rights, title, interest, and obligations related to the
$9,905,000 outstanding Series 2003A Certificates. The Series 2003A tax-exempt Certificates bear a
fixed interest rate equal to 3.14 percent. The Series 2003A Certificates mature in 2022.
As a result of a change in the U.S. corporate tax rate, the interest rate on the Series 2003A Certificates
increased to 3.82 percent effective January 1, 2018.
The 2003A Certificates were issued pursuant to the terms of a Trust Indenture dated as of March 1, 2003,
by and between the Foundation and the Trustee, as amended and supplemented from time to time,
including particularly, as supplemented by that certain First Supplement to the Trust Indenture dated
November 16, 2005, the Second Supplement to Trust Indenture dated as of March 8, 2011, and the Third
Supplement and Amendment to Trust Indenture dated as of March 15, 2011, both by and between the
Foundation and the Trustee. The project is leased by the Foundation to the University Board of Trustees
pursuant to a Master Operating Lease dated as of March 1, 2003, as amended by the First Amendment
to Master Operating Lease dated December 1, 2005, each by and between the Foundation, as lessor,
and University Board, as lessee.

Report No. 2019-108 January 2019 Page 43
For the Series 2003A Certificates, the Foundation has entered into a Master Ground Lease Agreement
dated as of March 1, 2003, by and between the University Board of Trustees, as ground lessor, and the
Foundation, as ground lessee.
Certificates of Participation Series 2010A and 2010B. On December 23, 2010, the USF
Financing Corporation issued $2,860,000 Certificates of Participation Series 2010A (Tax-Exempt) and
$15,140,000 Certificates of Participation Series 2010B (Build America Bonds). The proceeds of the
Series 2010A and 2010B Certificates were used to (1) finance the acquisition, construction, and
installation of a mixed-use facility that includes a student center and a student housing facility on the
University’s St. Petersburg Campus, (2) fund capitalized interest accounts, and (3) pay certain expenses
related to the issuance and sale of the Series 2010A and 2010B Certificates. The Series 2010A fixed
rate Certificates have interest rates ranging from 4 to 5 percent. As the Series 2010B fixed rate
Certificates were issued under the Build America Bonds program, the net interest cost is equal to
65 percent of the gross interest rate, which is 8.35 and 8.55 percent. Pursuant to the requirements of
the amended Balanced Budget and Emergency Deficit Control Act of 1985, during the 2017-18 fiscal
year, the direct Federal subsidy was reduced and the net interest cost equaled 67.3 percent. The
Series 2010A Certificates mature in 2020 and the Series 2010B Certificates mature in 2040.
The Series 2010A and 2010B Certificates were issued pursuant to a Master Trust Agreement dated as
of May 1, 2005, as supplemented by the Series 2010 Supplemental Trust Agreement, dated
December 1, 2010, by and among a Trustee, the USF Property Corporation, as lessor, and the USF
Financing Corporation, as lessee. For the Series 2010A and 2010B Certificates, the USF Property
Corporation has entered into a Ground Lease Agreement, dated December 1, 2010, with the University
Board of Trustees whereby the University has leased to the USF Property Corporation the land on which
the Series 2010 Projects are located. All of the rights, title, and interest of the USF Property Corporation
in the Ground Lease Agreement, including the right of the USF Property Corporation to receive lease
payments; to use, sell, and re-let property; and to exercise remedies thereunder, have been irrevocably
assigned by the USF Property Corporation to the Trustee.
Certificates of Participation Series 2012A (refunded Series 2012A Certificates). On
May 6, 2015, the USF Financing Corporation issued the $77,015,000 Series 2012A Remarketing
Certificates of Participation to convert the Series 2012A Certificates of Participation from variable rate to
fixed rate Certificates. The tax-exempt, fixed rate Remarketing Certificates have interest rates ranging
from 4 to 5 percent and mature in 2035.
The Series 2012A Certificates were originally issued on October 1, 2012, as variable rate Certificates to
refund the Series 2005B Certificates. The Series 2005B Certificates were issued on May 25, 2005, and
the proceeds were used to (1) finance the cost to lease purchase certain student housing facilities existing
on the University’s Tampa campus, (2) acquire, construct, and equip a housing facility and a related
parking facility on the University’s St. Petersburg campus, and (3) pay certain expenses related to the
issuance and sale of the Series 2005B Certificates, including the financial guaranty insurance policy
premium. On March 18 and 20, 2008, the Corporation converted the Series 2005B Certificates from
auction rate securities to variable rate demand bonds with weekly rate periods. The Certificates were
secured by an irrevocable direct pay letter of credit.

Report No. 2019-108 Page 44 January 2019
The Series 2012A variable rate Certificates were largely hedged to limit the effect of changes in interest
rates. On April 15, 2015, in connection with the reissuance of the Certificates, the USF Financing
Corporation terminated the interest rate swap agreement related to these Certificates.
The Series 2012A Remarketing Certificates were issued pursuant to a Master Trust Agreement,
dated May 1, 2005, as supplemented by the Series 2012A Supplemental Trust Agreement, dated
October 1, 2012, and amended on April 1, 2015, by and among a Trustee, the USF Property Corporation,
as lessor, and the USF Financing Corporation, as lessee.
For the Series 2012A Remarketing Certificates, the USF Property Corporation has entered into a Ground
Lease Agreement, dated May 1, 2005, and amended on May 1, 2015, with the University Board of
Trustees whereby the University has leased to the USF Property Corporation the land on which the
housing and parking facilities are located. All of the rights, title, and interest of the USF Property
Corporation in the Ground Lease Agreement, including the right of the USF Property Corporation to
receive lease payments; to use, sell, and re-let properties; and to exercise remedies thereunder, have
been irrevocably assigned by the USF Property Corporation to the Trustee.
Certificates of Participation Series 2012B (refunded Series 2007 Certificates – Housing). On October 1, 2012, the USF Financing Corporation issued the $68,975,000 Certificates of Participation
2012B to refund the Series 2007 Certificates of Participation – Housing. The tax-exempt, variable rate
Certificates are hedged to limit the effect of changes in interest rates. The Certificates have an interest
rate of 4.35 and mature in 2037.
As a result of a change in the U.S. corporate tax rate, the interest rate on the Series 2012B Housing
Certificates, increased to 4.72 percent effective January 1, 2018.
The proceeds derived from the issuance of the Series 2007 Certificates – Housing, issued on
September 25, 2007, were used to (1) finance the cost to acquire, construct, and equip a certain housing
facility on the University’s Tampa campus, (2) fund a capitalized interest account, and (3) pay certain
expenses related to the issuance and sale of the Series 2007 Certificates, including the financial guaranty
insurance policy premium. The Series 2007 Certificates – Housing initially carried interest at auction
rates for generally successive seven-day auction periods. On March 24, 2008, the USF Financing
Corporation converted the Series 2007 Certificates – Housing from auction rate securities to variable rate
demand bonds with a weekly rate period. In connection with the conversion, the USF Financing
Corporation surrendered the municipal bond insurance policy. The Series 2007 Certificates were then
secured pursuant to an irrevocable direct pay letter of credit, prior to being refunded by the
Series 2012B Certificates.
The Series 2012B Certificates were issued pursuant to a Master Trust Agreement, dated May 1, 2005,
as supplemented by the Series 2012B Supplemental Trust Agreement, dated October 1, 2012, by and
among a Trustee, the USF Property Corporation, as lessor, and the USF Financing Corporation, as
lessee. For the Series 2012B Certificates, the USF Property Corporation has entered into a Ground
Lease Agreement, dated September 1, 2007, with the University Board of Trustees whereby the
University has leased to the USF Property Corporation the land on which the Magnolia Residence Hall
is located. All of the rights, title, and interest of the USF Property Corporation in the Ground Lease
Agreement, including the right of the USF Property Corporation to receive lease payments; to use, sell,
Report No. 2019-108 January 2019 Page 45
and re-let properties; and to exercise remedies thereunder, have been irrevocably assigned by the USF
Property Corporation to the Trustee.
Certificates of Participation Series 2013A (refunded Series 2006A Certificates). On
July 1, 2016, the USF Financing Corporation converted the $37,920,000 Series 2013A Certificates from
a variable rate, hedged with an interest rate swap, to a 2.31 percent fixed rate. The Series
2013A Certificates were originally issued on September 3, 2013, to refund the Series 2006A Certificates.
The Certificates mature in 2036.
As a result of a change in the U.S. corporate tax rate, the interest rate on the Series 2013A Health
Certificates increased to 2.81 percent effective January 1, 2018.
The proceeds derived from the issuance of the Series 2006A Certificates, issued on March 16, 2006,
were used to (1) finance the acquisition and construction of two fully-equipped medical office buildings
consisting of the North Clinic Facility and the South Clinic Facility and (2) pay certain expenses related
to the issuance and sale of the Series 2006A Certificates. The Series 2006A Certificates initially carried
interest at weekly rates for generally successive seven-day weekly rate periods and were secured
pursuant to two separate irrevocable direct-pay letters of credit, prior to being refunded by the
Series 2013A Certificates.
The Series 2013A Certificates were issued pursuant to a Master Trust Agreement, dated March 1, 2006,
as supplemented by the Series 2013A Supplemental Trust Agreement, dated September 1, 2013, by and
among a Trustee, the USF Property Corporation, as lessor, and the USF Financing Corporation, as
lessee. For the Series 2013A Certificates, the USF Property Corporation has entered into a Ground
Lease Agreement, dated March 1, 2006, with the University Board of Trustees whereby the University
has leased to the USF Property Corporation interest in the lands on which the North Clinic Facility and
South Clinic Facility were constructed. With respect to the South Clinic Facility site, the University Board
of Trustees possesses sublease interest in the site pursuant to a sublease, dated March 15, 2006,
between the University and Florida Health Science Center, Inc. d/b/a Tampa General Hospital, whereby
Tampa General Hospital has subleased to the University the land on which the South Clinic Facility was
constructed. The USF Financing Corporation has subleased both the North Clinic Facility and South
Clinic Facility to the University Medical Service Association, Inc. (UMSA), a direct-support organization
of the University, pursuant to individual office building lease agreements, each dated March 1, 2006.
The USF Financing Corporation’s right to receive all payments received from UMSA under the Facility
Lease Agreements are collaterally assigned to the Trustee pursuant to one or more separate
assignments. All of the rights, title, and interest of the USF Property Corporation in the Ground Lease
Agreement, including the right of the USF Property Corporation to receive lease payments; to use, sell,
and re-let properties; and to exercise remedies thereunder, have been irrevocably assigned by the USF
Property Corporation to the Trustee.
Certificates of Participation 2013B (refunded Series 2007 Certificates – Health). On
September 3, 2013, the USF Financing Corporation issued the $20,855,000 Certificates of Participation
Series 2013B to refund the Series 2007 Health Certificates of Participation. The tax-exempt, variable
rate Certificates are hedged to limit the effect of changes in interest rates. The Certificates have an
interest rate of 4.25 and mature in 2037.
Report No. 2019-108 Page 46 January 2019
As a result of a change in the U.S. corporate tax rate, the interest rate on the Series 2013B Health
Certificates increased to 4.69 percent effective January 1, 2018.
The proceeds derived from the issuance of the Series 2007 Certificates – Health, issued on
November 19, 2007, were used to (1) provide funds for the purpose of financing the acquisition,
construction, installation and equipping of a medical office building located on the University’s Tampa
Campus, (2) fund a capitalized interest account, and (3) pay certain expenses related to the issuance
and sale of the 2007 Certificates. The Series 2007 Certificates – Health initially carried interest at weekly
rates for generally successive seven-day weekly rate periods and were secured pursuant to an
irrevocable direct-pay letter of credit, prior to being refunded by the Series 2013B Certificates.
The Series 2013B Certificates were issued pursuant to a Master Trust Agreement, dated March 1, 2006,
as supplemented by the Series 2013B Supplemental Trust Agreement, dated September 1, 2013, by and
among a Trustee, the USF Property Corporation, as lessor, and the USF Financing Corporation, as
lessee. For the Series 2013B Certificates, the USF Property Corporation has entered into a Ground
Lease Agreement, dated November 1, 2007, with the University Board of Trustees whereby the University
has leased to the USF Property Corporation the land on which the Medical Office Building is constructed.
The USF Financing Corporation has subleased the Medical Office Building to UMSA pursuant to a facility
lease agreement, dated November 1, 2007.
The USF Financing Corporation’s right to receive all payments from UMSA under the Facility Lease
Agreement are collaterally assigned to the Trustee pursuant to one or more separate assignments. All
of the rights, title, and interest of the USF Property Corporation in the Ground Lease Agreement, including
the right of the USF Property Corporation to receive lease payments; to use, sell, and re-let properties;
and to exercise remedies thereunder, have been irrevocably assigned by the USF Property Corporation
to the Trustee.
Certificates of Participation Series 2015A (refunded Series 2005A Certificates). On
May 6, 2015, the USF Financing Corporation issued the $23,640,000 Certificates of Participation Series
2015A to refund the Series 2005A Certificates of Participation. The 2015A tax-exempt, fixed rate
Certificates have interest rates ranging from 2.63 to 5 percent and mature in 2023.
The proceeds of the Series 2005A Certificates, issued on May 25, 2005, were used to (1) retire or defease
the University’s prior housing financings, and (2) pay certain expenses related to the issuance and sale
of the Series 2005A Certificates, including the financial guaranty insurance policy premium.
The Series 2015A Certificates were issued pursuant to a Master Trust Agreement, dated as of
May 1, 2005, as supplemented by the Series 2015A Supplemental Trust Agreement, dated as of
May 1, 2015, by and among a Trustee, the USF Property Corporation, as lessor, and the USF Financing
Corporation, as lessee.
For the Series 2015A Certificates, the USF Property Corporation has entered into a Ground Lease
Agreement, dated as of May 1, 2005, and amended on May 1, 2015, with the University Board of Trustees
whereby the University has leased to the USF Property Corporation the land on which the housing
facilities are located. All of the rights, title, and interest of the USF Property Corporation in the Ground
Lease Agreement, including the right of the USF Property Corporation to receive lease payments; to use,

Report No. 2019-108 January 2019 Page 47
sell, and re-let properties; and to exercise remedies thereunder, have been irrevocably assigned by the
USF Property Corporation to the Trustee.
Bonds Series 2015 – Marshall Center (refunded Series 2005C Certificates). On May 6, 2015,
the USF Financing Corporation issued the $31,595,000 Series 2015 Capital Improvement Refunding
Revenue Bonds – Marshall Center to refund the Series 2005C Certificates of Participation. The
tax-exempt, fixed rate Bonds have interest rates ranging from 3 to 5 percent and mature in 2036.
The proceeds derived from the issuance of the Series 2005C Certificates, issued on January 19, 2006,
were used to (1) finance the construction of the Marshall Center student center, and (2) pay certain
expenses related to the issuance and sale of the Series 2005C Certificates including the financial
guaranty insurance policy premium.
On May 6, 2015, in connection with the refunding of the Series 2005C Certificates with the
Series 2015 Marshall Center Bonds, the ground lease agreement related to the Housing facilities was
amended and the Marshall Center was removed from the subject parcel. The ground lease agreement
requires that any property, and improvements thereon, revert back to the University upon termination of
the ground lease. Thus, on the same date, the USF Financing Corporation transferred the Marshall
Center building and building improvements to the University at net book value.
The Series 2015 Bonds were issued pursuant to the terms of a Trust Indenture, dated as of May 1, 2015,
by and among a Trustee and the USF Financing Corporation.
Notes Series 2018A and 2018B (refunded 2010A and 2010B) Athletics. On March 9, 2018,
the USF Financing Corporation issued the $7,685,180 Series 2018A Athletics Tax Exempt Promissory
Note and the $10,486,685 Series 2018B Athletics Tax Exempt Promissory Note to refund the
Series 2010A and 2010B Athletics Taxable Promissory Notes. The tax-exempt, fixed rate Series 2018A
Note has an interest rate of 3.46 percent and matures in 2030. The tax-exempt, fixed rate Series 2018B
Note has an interest rate of 3.51 percent and matures in 2031.
The proceeds derived from the issuance of the Series 2010A and 2010B Athletics Notes, issued on
January 15 and December 15, 2010, respectively, were used to finance the acquisition, construction, and
equipping of the athletics district facilities. The Series 2010A and 2010B fixed rate Notes had gross
interest rates of 8.02 and 6.17 percent, respectively. As the Notes were issued under the Build America
Bonds program, the net interest costs were equal to 65 percent of the gross interest rates. Pursuant to
the requirements of the amended Balanced Budget and Emergency Deficit Control Act of 1985, during
the 2017-18 fiscal year, through the date of refunding, the direct Federal subsidies were reduced and the
net interest costs equaled 67.3 percent.
For the Series 2018A and 2018B Notes, the USF Financing Corporation has entered into a Ground Lease
Agreement, dated as of January 15, 2010 and amended as of March 9, 2018, with the University Board
of Trustees whereby the University has leased to the USF Financing Corporation the land on which the
athletics district facilities are located.
Note Series 2018 CAMLS (refunded Note Series 2010 CAMLS). On March 9, 2018, the USF
Financing Corporation issued the $15,535,830 Series 2018 CAMLS Tax Exempt Promissory Note to

Report No. 2019-108 Page 48 January 2019
refund the Series 2010 CAMLS Taxable Promissory Note. The tax-exempt, fixed rate Series 2018 Note
has an interest rate of 3.51 percent and matures in 2031.
The proceeds derived from the issuance of the Series 2010 CAMLS Note, issued on December 15, 2010,
were used to finance the acquisition, construction, and equipping of the USF Center for Advanced
Medical Learning and Simulation (CAMLS) facility. The Series 2010 Note had a gross interest rate of
6.17 percent. As the Note was issued under the Build America Bonds program, the net interest cost was
equal to 65 percent of the gross interest rate. Pursuant to the requirements of the amended Balanced
Budget and Emergency Deficit Control Act of 1985, during the 2017-18 fiscal year, through the date of
refunding, the direct Federal subsidy was reduced and the net interest cost equaled 67.3 percent.
For the Series 2018 CAMLS Note, the USF Financing Corporation has entered into a Ground Lease
Agreement, dated as of December 15, 2010, and amended as of June 12, 2015, and March 9, 2018, with
the University Board of Trustees whereby the University has leased to the USF Financing Corporation
the land on which the CAMLS facility is located. The USF Financing Corporation has subleased the
CAMLS facility to the USF Health Professions Conferencing Corporation, a direct-support organization
of the University, pursuant to a facility lease agreement.
Note Series 2013 Sun Dome Arena. On September 27, 2013, the USF Financing Corporation issued
the $20,000,000 Series 2013 Arena Taxable Promissory Note. The proceeds of the Note were used to
reimburse the University of South Florida for a portion of the costs undertaken by the University to
renovate the USF Sun Dome Arena. The Series 2013 Note has an interest rate of 4.78 percent and
matures in 2033.
Principal and Interest Payments. Principal and interest payment requirements on the long-term debt
outstanding as of June 30, 2018, are as follows:
Fiscal Year Ending June 30 Principal Interest Total
2019 12,197,668$ 13,767,590$ 25,965,258$ 2020 12,764,217 13,100,907 25,865,124 2021 13,333,556 12,554,442 25,887,998 2022 13,961,215 12,009,666 25,970,881 2023 14,522,760 11,426,730 25,949,490 2024-2028 78,722,691 47,229,758 125,952,449 2029-2033 90,450,588 27,803,185 118,253,773 2034-2038 71,625,000 8,058,094 79,683,094 2039-2040 3,420,000 448,770 3,868,770
Subtotal 310,997,695 146,399,142 457,396,837 Premiums 11,760,635 - 11,760,635 Cost of Issuance (1,137,027) - (1,137,027)
Total 321,621,303$ 146,399,142$ 468,020,445$
Interest Rate Swap Agreements. Effective September 25, 2007, the USF Financing Corporation
entered into an interest rate swap agreement with a counterparty to limit the effects of changes in interest
rates on the Series 2012B Certificates (refunded Series 2007 Certificates – Housing). The initial notional
amount of the swap agreement is $73,700,000. The effect of the agreement is to limit the interest
expense on the total $59,800,000 principal in variable rate Series 2012B Certificates. The interest rate

Report No. 2019-108 January 2019 Page 49
on the swap agreement, as amended on March 24, 2008, is 3.552 percent and the interest rate swap
agreement expires July 1, 2037.
Effective November 19, 2007, the USF Financing Corporation entered into an interest swap agreement
with a counterparty to limit the effects of changes in interest rates on the Series 2013B Certificates
(refunded Series 2007 Certificates – Health). The initial notional amount of the interest rate swap
agreement is $22,830,000. The effect of the agreement is to limit the interest expense on the total
$18,555,000 principal in the variable rate Series 2013B Certificates. The interest rate on the swap
agreement is 3.397 percent and the swap agreement expire July 1, 2018.
The interest rate swap agreements contain collateral provisions to mitigate counterparty credit risk. The
collateral provisions of the interest rate swap agreement relating to the Series 2012B Certificates require
the USF Financing Corporation to maintain a rating of at least Baa1 by Moody’s Investors Service or
BBB+ by Standard & Poor’s on its Housing Certificates. The provisions require the USF Financing
Corporation to post collateral, in the form of cash or securities, for the negative valuation exposure in
excess of the $10 million minimum threshold level. Additionally, the collateral provisions of the interest
rate swap agreement relating to the Series 2013B Certificates, amended August 19, 2014, require the
USF Financing Corporation to post collateral, in the form of cash or securities, totaling $1,000,000,
regardless of fluctuations in exposure. As of June 30, 2018, the total posted collateral was $1,000,000.
The fair value of the swap agreements is the estimated amount the USF Financing Corporation would
receive or pay to terminate the agreement at the reporting date, taking into account the current interest
rates and the current creditworthiness of the counterparties. As of June 30, 2018, the USF Financing
Corporation interest rate swap agreements had a cumulative negative fair value of ($9,422,148), which
represents the amount to be paid to terminate the agreements at the reporting date.
As of June 30, 2018, the USF Financing Corporation was not exposed to credit risk on its outstanding
interest rate swap agreements because the agreements had a negative fair value. However, should
interest rates change and the fair value of the swap agreements become positive, the USF Financing
Corporation would be exposed to credit risk in the amount of the derivative’s fair value.
The USF Financing Corporation is exposed to the risk (basis risk) that a mismatch occurs between the
interest cost of the underlying variable rate certificates and the variable rate payment received on the
associated interest rate swap agreement. The USF Financing Corporation mitigates the risk by analyzing
potential debt and swap interest rate index structures to ensure an effective hedge of cash flows and
tracks the spread of certificate rates paid to the hedges rates, typically a few basis points.
The USF Financing Corporation is exposed to the risk (rollover risk) that the interest rate swap
agreements or letters of credit mature prior to the termination of the variable rate debt. The USF
Financing Corporation mitigates this risk by assessing, years in advance of the maturity of these items,
the amount of variable rate debt then outstanding and makes provisions for extending these items.
Maintaining strong credit ratings for the USF Financing Corporation and the underlying bond system
plays an important role in this process.
The USF Financing Corporation is exposed to the risk (termination risk) that the interest rate swap
agreements could be terminated by the counterparty. The USF Financing Corporation mitigates this risk
with interest rate swap agreements that restrict termination by the counterparty and, if terminated, posted
Report No. 2019-108 Page 50 January 2019
collateral assets would provide a liquid offset. The USF Financing Corporation has an option to terminate
the interest rate swap agreement and, in the case of the USF Financing Corporation owing a termination
payment to the counterparty, the University would use cash balances or funds provided by the refinanced
transaction.
14. Retirement Plans – Defined Benefit Pension Plans
General Information about the Florida Retirement System (FRS).
The FRS was created in Chapter 121, Florida Statutes, to provide a defined benefit pension plan for
participating public employees. The FRS was amended in 1998 to add the Deferred Retirement Option
Program (DROP) under the defined benefit plan and amended in 2000 to provide a defined contribution
plan alternative to the defined benefit plan for FRS members effective July 1, 2002. This integrated
defined contribution pension plan is the FRS Investment Plan. Chapter 112, Florida Statutes, established
the Retiree Health Insurance Subsidy (HIS) Program, a cost-sharing multiple-employer defined benefit
pension plan to assist retired members of any State-administered retirement system in paying the costs
of health insurance. Chapter 121, Florida Statutes, also provides for nonintegrated, optional retirement
programs in lieu of the FRS to certain members of the Senior Management Service Class employed by
the State and faculty and specified employees in the State university system.
Essentially all regular employees of the University are eligible to enroll as members of the
State-administered FRS. Provisions relating to the FRS are established by Chapters 121 and
122, Florida Statutes; Chapter 112, Part IV, Florida Statutes; Chapter 238, Florida Statutes; and FRS
Rules, Chapter 60S, Florida Administrative Code; wherein eligibility, contributions, and benefits are
defined and described in detail. Such provisions may be amended at any time by further action from the
Florida Legislature. The FRS is a single retirement system administered by the Florida Department of
Management Services, Division of Retirement, and consists of two cost-sharing multiple-employer
defined benefit plans and other nonintegrated programs. A comprehensive annual financial report of the
FRS, which includes its financial statements, required supplementary information, actuarial report, and
other relevant information, is available from the Florida Department of Management Services Web site
(www.dms.myflorida.com).
The University’s FRS and HIS pension expense totaled $50,860,453 for the fiscal year ended
June 30, 2018.
FRS Pension Plan
Plan Description. The FRS Pension Plan (Plan) is a cost-sharing multiple-employer defined benefit
pension plan, with a DROP for eligible employees. The general classes of membership are as follows:
Regular Class – Members of the FRS who do not qualify for membership in the other classes.
Senior Management Service Class (SMSC) – Members in senior management level positions.
Special Risk Class – Members who are employed as law enforcement officers and meet the criteria to qualify for this class.
Employees enrolled in the Plan prior to July 1, 2011, vest at 6 years of creditable service and employees
enrolled in the Plan on or after July 1, 2011, vest at 8 years of creditable service. All vested members,

Report No. 2019-108 January 2019 Page 51
enrolled prior to July 1, 2011, are eligible for normal retirement benefits at age 62 or at any age after
30 years of creditable service, except for members classified as special risk who are eligible for normal
retirement benefits at age 55 or at any age after 25 years of creditable service. All members enrolled in
the Plan on or after July 1, 2011, once vested, are eligible for normal retirement benefits at age 65 or any
time after 33 years of creditable service, except for members classified as special risk who are eligible
for normal retirement benefits at age 60 or at any age after 30 years of creditable service. Employees
enrolled in the Plan may include up to 4 years of credit for military service toward creditable service. The
Plan also includes an early retirement provision; however, there is a benefit reduction for each year a
member retires before his or her normal retirement date. The Plan provides retirement, disability, death
benefits, and annual cost-of-living adjustments to eligible participants.
The DROP, subject to provisions of Section 121.091, Florida Statutes, permits employees eligible for
normal retirement under the Plan to defer receipt of monthly benefit payments while continuing
employment with an FRS-participating employer. An employee may participate in DROP for a period not
to exceed 60 months after electing to participate. During the period of DROP participation, deferred
monthly benefits are held in the FRS Trust Fund and accrue interest. The net pension liability does not
include amounts for DROP participants, as these members are considered retired and are not accruing
additional pension benefits.
Benefits Provided. Benefits under the Plan are computed on the basis of age, and/or years of service,
average final compensation, and credit service. Credit for each year of service is expressed as a
percentage of the average final compensation. For members initially enrolled before July 1, 2011, the
average final compensation is the average of the 5 highest fiscal years’ earnings; for members initially
enrolled on or after July 1, 2011, the average final compensation is the average of the 8 highest fiscal
years’ earnings. The total percentage value of the benefit received is determined by calculating the total
value of all service, which is based on retirement plan and/or the class to which the member belonged
when the service credit was earned. Members are eligible for in-line-of-duty or regular disability and
survivors’ benefits. The following table shows the percentage value for each year of service credit
earned:

Report No. 2019-108 Page 52 January 2019
Class, Initial Enrollment, and Retirement Age/Years of Service % Value
Regular Class members initially enrolled before July 1, 2011
Retirement up to age 62 or up to 30 years of service 1.60
Retirement at age 63 or with 31 years of service 1.63
Retirement at age 64 or with 32 years of service 1.65
Retirement at age 65 or with 33 or more years of service 1.68
Regular Class members initially enrolled on or after July 1, 2011
Retirement up to age 65 or up to 33 years of service 1.60
Retirement at age 66 or with 34 years of service 1.63
Retirement at age 67 or with 35 years of service 1.65
Retirement at age 68 or with 36 or more years of service 1.68
Senior Management Service Class 2.00
Special Risk Class
Service on and after October 1, 1974 3.00
As provided in Section 121.101, Florida Statutes, if the member was initially enrolled in the Plan before
July 1, 2011, and all service credit was accrued before July 1, 2011, the annual cost-of-living adjustment
is 3 percent per year. If the member was initially enrolled before July 1, 2011, and has service credit on
or after July 1, 2011, there is an individually calculated cost-of-living adjustment. The annual cost-of-living
adjustment is a proportion of 3 percent determined by dividing the sum of the pre-July 2011 service credit
by the total service credit at retirement multiplied by 3 percent. Plan members initially enrolled on or after
July 1, 2011, will not have a cost-of-living adjustment after retirement.
Contributions. The Florida Legislature establishes contribution rates for participating employers and
employees. Contribution rates during the 2017-18 fiscal year were:
Percent of Gross Salary
Class Employee Employer (1)
FRS, Regular 3.00 7.92
FRS, Senior Management Service 3.00 22.71
FRS, Special Risk 3.00 23.27
FRS, Plan E 6.25 11.90
Deferred Retirement Option Program (applicable to members from all of the above classes)
0.00 13.26
FRS, Reemployed Retiree (2) (2)
(1) Employer rates include 1.66 percent for the postemployment health insurance subsidy. Also, employer rates, other than for DROP participants, include 0.06 percent for administrative costs of the Investment Plan.
(2) Contribution rates are dependent upon retirement class in which reemployed.
The University’s contributions to the Plan totaled $23,643,944 for the fiscal year ended June 30, 2018.
Pension Liabilities, Pension Expense, and Deferred Outflows of Resources and Deferred Inflows of
Resources Related to Pensions. At June 30, 2018, the University reported a liability of $229,267,838 for
its proportionate share of the net pension liability. The net pension liability was measured as of

Report No. 2019-108 January 2019 Page 53
June 30, 2017, and the total pension liability used to calculate the net pension liability was determined
by an actuarial valuation as of July 1, 2017. The University’s proportionate share of the net pension
liability was based on the University’s 2016-17 fiscal year contributions relative to the total 2016-17 fiscal
year contributions of all participating members. At June 30, 2017, the University’s proportionate share
was 0.775094790 percent, which was an increase of 0.01138188 from its proportionate share measured
as of June 30, 2016.
For the year ended June 30, 2018, the University recognized pension expense of $43,966,990. In
addition, the University reported deferred outflows of resources and deferred inflows of resources related
to pensions from the following sources:
Deferred Outflows Deferred InflowsDescription of Resources of Resources
Differences between expected and actual experience 21,041,270$ 1,270,026$ Change of assumptions 77,050,180 - Net difference between projected and actual earnings on FRS Plan investments - 5,681,830 Changes in proportion and differences between University contributions and proportionate share of contributions 15,316,615 58,791 University FRS contributions subsequent to the measurement date 23,643,944 -
Total 137,052,009$ 7,010,647$
The deferred outflows of resources totaling $23,643,944, resulting from University contributions
subsequent to the measurement date, will be recognized as a reduction of the net pension liability in the
fiscal year ending June 30, 2019. Other amounts reported as deferred outflows of resources and deferred
inflows of resources related to pensions will be recognized in pension expense as follows:
Fiscal Year Ending June 30 Amount
2019 17,677,035$ 2020 37,399,837 2021 24,820,462 2022 5,119,989 2023 15,548,292 Thereafter 5,831,803
Total 106,397,418$
Actuarial Assumptions. The total pension liability in the July 1, 2017, actuarial valuation was determined
using the following actuarial assumptions, applied to all periods included in the measurement:
Inflation 2.60 percent Salary increases 3.25 percent, average, including inflation Investment rate of return 7.10 percent, net of pension plan investment
expense, including inflation

Report No. 2019-108 Page 54 January 2019
Mortality rates were based on the Generational RP-2000 with Projection Scale BB.
The actuarial assumptions used in the July 1, 2017, valuation were based on the results of an actuarial
experience study for the period July 1, 2008, through June 30, 2013.
The long-term expected rate of return on pension plan investments was not based on historical returns,
but instead is based on a forward-looking capital market economic model. The allocation policy’s
description of each asset class was used to map the target allocation to the asset classes shown below.
Each asset class assumption is based on a consistent set of underlying assumptions, and includes an
adjustment for the inflation assumption. The target allocation and best estimates of arithmetic and
geometric real rates of return for each major asset class are summarized in the following table:
Asset Class Target
Allocation (1)
Annual Arithmetic Return
Compound Annual
(Geometric) Return
Standard Deviation
Cash 1% 3.0% 3.0% 1.8% Fixed Income 18% 4.5% 4.4% 4.2% Global Equity 53% 7.8% 6.6% 17.0% Real Estate (Property) 10% 6.6% 5.9% 12.8% Private Equity 6% 11.5% 7.8% 30.0% Strategic Investments 12% 6.1% 5.6% 9.7%
Total 100%
Assumed inflation - Mean 2.6% 1.9%
(1) As outlined in the Plan’s investment policy.
Discount Rate. The discount rate used to measure the total pension liability was 7.10 percent. The
Plan’s fiduciary net position was projected to be available to make all projected future benefit payments
of current active and inactive employees. Therefore, the discount rate for calculating the total pension
liability is equal to the long-term expected rate of return. The discount rate used in the 2017 valuation
was updated from 7.60 percent to 7.10 percent.
Sensitivity of the University’s Proportionate Share of the Net Pension Liability to Changes in the Discount
Rate. The following presents the University’s proportionate share of the net pension liability calculated
using the discount rate of 7.10 percent, as well as what the University’s proportionate share of the net
pension liability would be if it were calculated using a discount rate that is 1 percentage point lower
(6.10 percent) or 1 percentage point higher (8.10 percent) than the current rate:
1% Decrease
(6.10%)
Current Discount Rate (7.10%)
1% Increase
(8.10%)
University’s proportionate share of the net pension liability $414,960,940 $229,267,838 $75,100,020
Pension Plan Fiduciary Net Position. Detailed information about the Plan’s fiduciary net position is
available in the separately issued FRS Pension Plan and Other State Administered Systems
Comprehensive Annual Financial Report.
Report No. 2019-108 January 2019 Page 55
HIS Pension Plan
Plan Description. The HIS Pension Plan (HIS Plan) is a cost-sharing multiple-employer defined benefit
pension plan established under Section 112.363, Florida Statutes. The benefit is a monthly payment to
assist retirees of State-administered retirement systems in paying their health insurance costs and is
administered by the Florida Department of Management Services, Division of Retirement.
Benefits Provided. For the fiscal year ended June 30, 2018, eligible retirees and beneficiaries received
a monthly HIS payment of $5 for each year of creditable service completed at the time of retirement with
a minimum HIS payment of $30 and a maximum HIS payment of $150 per month, pursuant to
Section 112.363, Florida Statutes. To be eligible to receive a HIS Plan benefit, a retiree under a
State-administered retirement system must provide proof of health insurance coverage, which can
include Medicare.
Contributions. The HIS Plan is funded by required contributions from FRS participating employers as set
by the Florida Legislature. Employer contributions are a percentage of gross compensation for all active
FRS members. For the fiscal year ended June 30, 2018, the contribution rate was 1.66 percent of payroll
pursuant to Section 112.363, Florida Statutes. The University contributed 100 percent of its statutorily
required contributions for the current and preceding 3 years. HIS Plan contributions are deposited in a
separate trust fund from which HIS payments are authorized. HIS Plan benefits are not guaranteed and
are subject to annual legislative appropriation. In the event the legislative appropriation or available funds
fail to provide full subsidy benefits to all participants, benefits may be reduced or canceled.
The University’s contributions to the HIS Plan totaled $4,035,035 for the fiscal year ended June 30, 2018.
Pension Liabilities, Pension Expense, and Deferred Outflows of Resources and Deferred Inflows of
Resources Related to Pensions. At June 30, 2018, the University reported a liability of $78,551,882 for
its proportionate share of the net pension liability. The current portion of the net pension liability is the
University’s proportionate share of benefit payments expected to be paid within 1 year, net of the
University’s proportionate share of the HIS Plan’s fiduciary net position available to pay that amount. The
net pension liability was measured as of June 30, 2017, and the total pension liability used to calculate
the net pension liability was determined by an actuarial valuation as of July 1, 2016, and update
procedures were used to determine liabilities as of July 1, 2017. The University’s proportionate share of
the net pension liability was based on the University’s 2016-17 fiscal year contributions relative to the
total 2016-17 fiscal year contributions of all participating members. At June 30, 2017, the University’s
proportionate share was 0.734647326 percent, which was an increase of 0.008624001 from its
proportionate share measured as of June 30, 2016.
For the fiscal year ended June 30, 2018, the University recognized pension expense of $6,893,463. In
addition, the University reported deferred outflows of resources and deferred inflows of resources related
to pensions from the following sources:
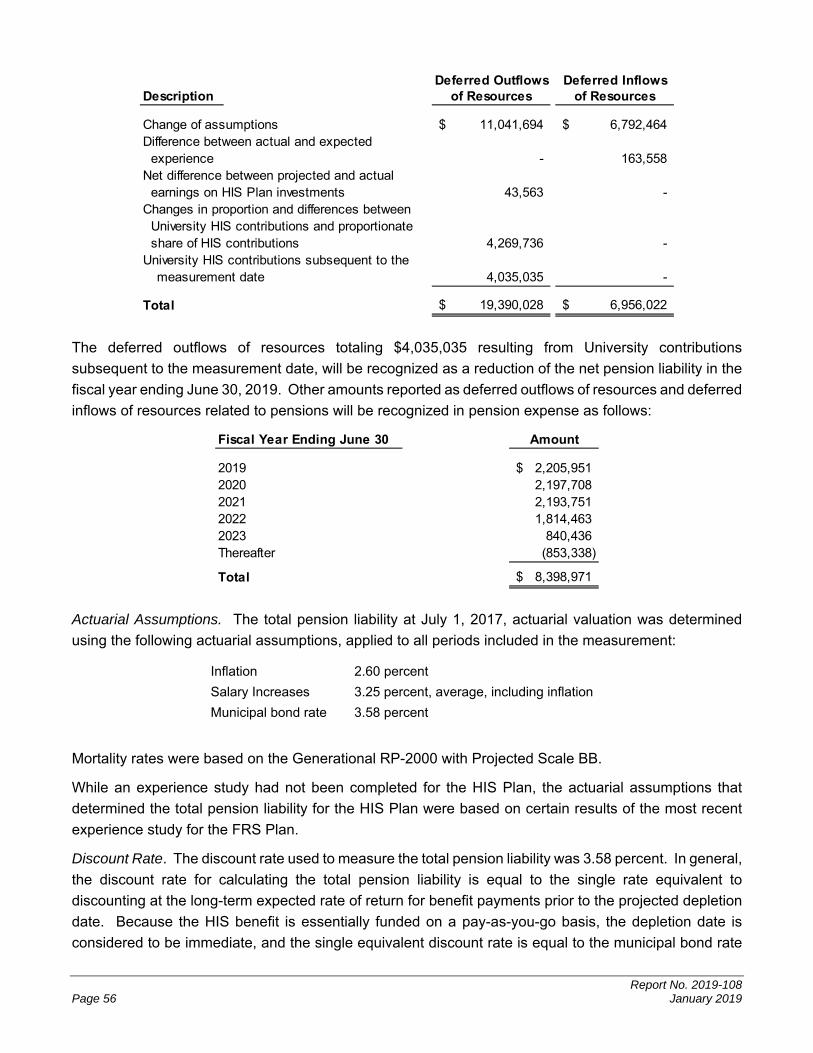
Report No. 2019-108 Page 56 January 2019
Deferred Outflows Deferred InflowsDescription of Resources of Resources
Change of assumptions 11,041,694$ 6,792,464$ Difference between actual and expected experience - 163,558 Net difference between projected and actual earnings on HIS Plan investments 43,563 - Changes in proportion and differences between University HIS contributions and proportionate share of HIS contributions 4,269,736 - University HIS contributions subsequent to the
measurement date 4,035,035 -
Total 19,390,028$ 6,956,022$
The deferred outflows of resources totaling $4,035,035 resulting from University contributions
subsequent to the measurement date, will be recognized as a reduction of the net pension liability in the
fiscal year ending June 30, 2019. Other amounts reported as deferred outflows of resources and deferred
inflows of resources related to pensions will be recognized in pension expense as follows:
Fiscal Year Ending June 30 Amount
2019 2,205,951$ 2020 2,197,708 2021 2,193,751 2022 1,814,463 2023 840,436 Thereafter (853,338)
Total 8,398,971$
Actuarial Assumptions. The total pension liability at July 1, 2017, actuarial valuation was determined
using the following actuarial assumptions, applied to all periods included in the measurement:
Inflation 2.60 percent
Salary Increases 3.25 percent, average, including inflation
Municipal bond rate 3.58 percent
Mortality rates were based on the Generational RP-2000 with Projected Scale BB.
While an experience study had not been completed for the HIS Plan, the actuarial assumptions that
determined the total pension liability for the HIS Plan were based on certain results of the most recent
experience study for the FRS Plan.
Discount Rate. The discount rate used to measure the total pension liability was 3.58 percent. In general,
the discount rate for calculating the total pension liability is equal to the single rate equivalent to
discounting at the long-term expected rate of return for benefit payments prior to the projected depletion
date. Because the HIS benefit is essentially funded on a pay-as-you-go basis, the depletion date is
considered to be immediate, and the single equivalent discount rate is equal to the municipal bond rate

Report No. 2019-108 January 2019 Page 57
selected by the plan sponsor. The Bond Buyer General Obligation 20-Bond Municipal Bond Index was
adopted as the applicable municipal bond index. The discount rate used in the 2017 valuation was
updated from 2.85 percent to 3.58 percent.
Sensitivity of the University’s Proportionate Share of the Net Pension Liability to Changes in the Discount
Rate. The following presents the University’s proportionate share of the net pension liability calculated
using the discount rate of 3.58 percent, as well as what the University’s proportionate share of the net
pension liability would be if it were calculated using a discount rate that is 1 percentage point lower
(2.58 percent) or 1 percentage point higher (4.58 percent) than the current rate:
1% Decrease
(2.58%)
Current Discount Rate (3.58%)
1% Increase
(4.58%)
University’s proportionate share of the net pension liability $89,638,099 $78,551,882 $69,317,675
Pension Plan Fiduciary Net Position. Detailed information about the HIS Plan’s fiduciary net position is
available in the separately issued FRS Pension Plan and Other State Administered Comprehensive
Annual Financial Report.
15. Retirement Plans – Defined Contribution Pension Plans
FRS Investment Plan. The SBA administers the defined contribution plan officially titled the FRS
Investment Plan (Investment Plan). The Investment Plan is reported in the SBA’s annual financial
statements and in the State’s Comprehensive Annual Financial Report.
As provided in Section 121.4501, Florida Statutes, eligible FRS members may elect to participate in the
Investment Plan in lieu of the FRS defined benefit plan. University employees already participating in
the State University System Optional Retirement Program or DROP are not eligible to participate in the
Investment Plan. Employer and employee contributions are defined by law, but the ultimate benefit
depends in part on the performance of investment funds. Service retirement benefits are based upon
the value of the member’s account upon retirement. Benefit terms, including contribution requirements,
are established and may be amended by the Florida Legislature. The Investment Plan is funded with the
same employer and employee contributions, that are based on salary and membership class (Regular
Class, Senior Management Service Class, etc.), as the FRS defined benefit plan. Contributions are
directed to individual member accounts, and the individual members allocate contributions and account
balances among various approved investment choices. Costs of administering the Investment Plan,
including the FRS Financial Guidance Program, are funded through an employer contribution of
0.06 percent of payroll and by forfeited benefits of Investment Plan members. Allocations to the
Investment Plan member accounts during the 2017-18 fiscal year were as follows:
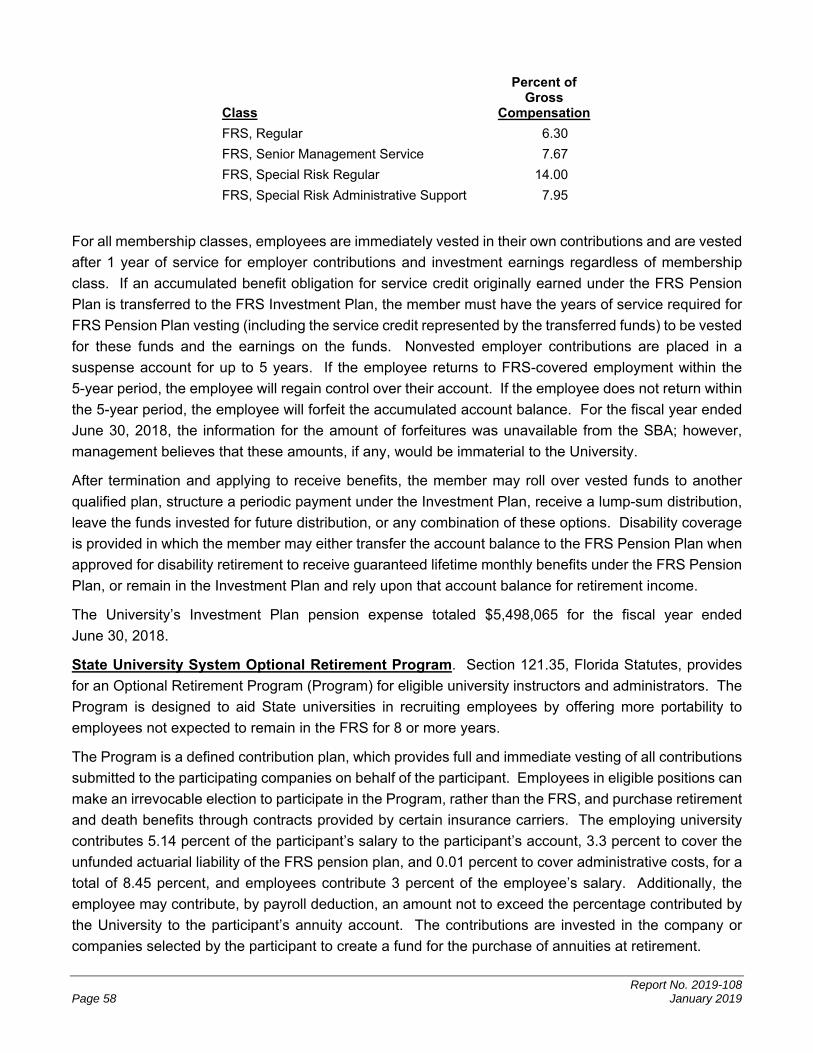
Report No. 2019-108 Page 58 January 2019
Class
Percent of Gross
Compensation
FRS, Regular 6.30
FRS, Senior Management Service 7.67
FRS, Special Risk Regular 14.00
FRS, Special Risk Administrative Support 7.95
For all membership classes, employees are immediately vested in their own contributions and are vested
after 1 year of service for employer contributions and investment earnings regardless of membership
class. If an accumulated benefit obligation for service credit originally earned under the FRS Pension
Plan is transferred to the FRS Investment Plan, the member must have the years of service required for
FRS Pension Plan vesting (including the service credit represented by the transferred funds) to be vested
for these funds and the earnings on the funds. Nonvested employer contributions are placed in a
suspense account for up to 5 years. If the employee returns to FRS-covered employment within the
5-year period, the employee will regain control over their account. If the employee does not return within
the 5-year period, the employee will forfeit the accumulated account balance. For the fiscal year ended
June 30, 2018, the information for the amount of forfeitures was unavailable from the SBA; however,
management believes that these amounts, if any, would be immaterial to the University.
After termination and applying to receive benefits, the member may roll over vested funds to another
qualified plan, structure a periodic payment under the Investment Plan, receive a lump-sum distribution,
leave the funds invested for future distribution, or any combination of these options. Disability coverage
is provided in which the member may either transfer the account balance to the FRS Pension Plan when
approved for disability retirement to receive guaranteed lifetime monthly benefits under the FRS Pension
Plan, or remain in the Investment Plan and rely upon that account balance for retirement income.
The University’s Investment Plan pension expense totaled $5,498,065 for the fiscal year ended
June 30, 2018.
State University System Optional Retirement Program. Section 121.35, Florida Statutes, provides
for an Optional Retirement Program (Program) for eligible university instructors and administrators. The
Program is designed to aid State universities in recruiting employees by offering more portability to
employees not expected to remain in the FRS for 8 or more years.
The Program is a defined contribution plan, which provides full and immediate vesting of all contributions
submitted to the participating companies on behalf of the participant. Employees in eligible positions can
make an irrevocable election to participate in the Program, rather than the FRS, and purchase retirement
and death benefits through contracts provided by certain insurance carriers. The employing university
contributes 5.14 percent of the participant’s salary to the participant’s account, 3.3 percent to cover the
unfunded actuarial liability of the FRS pension plan, and 0.01 percent to cover administrative costs, for a
total of 8.45 percent, and employees contribute 3 percent of the employee’s salary. Additionally, the
employee may contribute, by payroll deduction, an amount not to exceed the percentage contributed by
the University to the participant’s annuity account. The contributions are invested in the company or
companies selected by the participant to create a fund for the purchase of annuities at retirement.

Report No. 2019-108 January 2019 Page 59
The University’s contributions to the Program totaled $25,371,933, and employee contributions totaled
$16,176,140 for the 2017-18 fiscal year.
16. Construction Commitments
The University’s construction commitments at June 30, 2018, were as follows:
Total Completed BalanceProject Description Commitment to Date Committed
USF Morsani College of Medicine 82,964,092$ 21,411,448$ 61,552,644$ USF Health Heart Institute 37,009,163 16,615,044 20,394,119 USF Wellness Center Complex 10,894,181 - 10,894,181 Holly Residence Hall Renovations 9,001,142 5,374,084 3,627,058 Subtotal 139,868,578 43,400,576 96,468,002 Other Projects (1) 69,735,046 29,037,310 40,697,736
Total 209,603,624$ 72,437,886$ 137,165,738$
(1) Individual projects with a current balance committed of less than $4 million at June 30, 2018.
17. State Self-Insurance Programs
The University is exposed to various risks of loss related to torts; theft of, damage to, and
destruction of assets; errors and omissions; injuries to employees; and natural disasters. Pursuant to
Section 1001.72(2), Florida Statutes, the University participates in State self-insurance programs
providing insurance for property and casualty, workers’ compensation, general liability, fleet automotive
liability, Federal Civil Rights, and employment discrimination liability. During the 2017-18 fiscal year, for
property losses, the State retained the first $2 million per occurrence for all perils except named
windstorm and flood. The State retained the first $2 million per occurrence with an annual aggregate
retention of $40 million for named windstorm and flood losses. After the annual aggregate retention,
losses in excess of $2 million per occurrence were commercially insured up to $92.5 million for named
windstorm and flood through February 14, 2018, and decreased to $78 million starting February 15, 2018.
For perils other than named windstorm and flood, losses in excess of $2 million per occurrence were
commercially insured up to $225 million; and losses exceeding those amounts were retained by the State.
No excess insurance coverage is provided for workers’ compensation, general and automotive liability,
Federal Civil Rights and employment action coverage; all losses in these categories are completely
self-insured by the State through the State Risk Management Trust Fund established pursuant to Chapter
284, Florida Statutes. Payments on tort claims are limited to $200,000 per person and $300,000 per
occurrence as set by Section 768.28(5), Florida Statutes. Calculation of premiums considers the cash
needs of the program and the amount of risk exposure for each participant. Settlements have not
exceeded insurance coverage during the past 3 fiscal years.
Pursuant to Section 110.123, Florida Statutes, University employees may obtain healthcare services
through participation in the State group health insurance plan or through membership in a health
maintenance organization plan under contract with the State. The State’s risk financing activities
associated with State group health insurance, such as risk of loss related to medical and prescription
drug claims, are administered through the State Employees Group Health Insurance Trust Fund. It is the
practice of the State not to purchase commercial coverage for the risk of loss covered by this Fund.
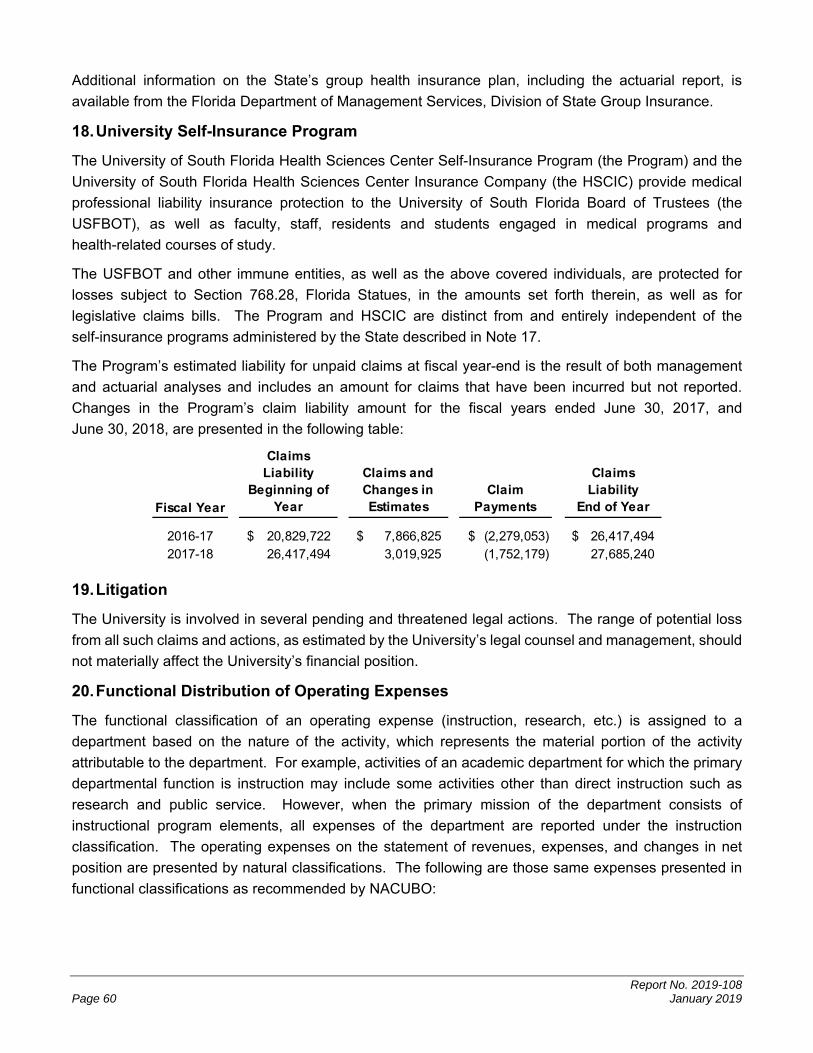
Report No. 2019-108 Page 60 January 2019
Additional information on the State’s group health insurance plan, including the actuarial report, is
available from the Florida Department of Management Services, Division of State Group Insurance.
18. University Self-Insurance Program
The University of South Florida Health Sciences Center Self-Insurance Program (the Program) and the
University of South Florida Health Sciences Center Insurance Company (the HSCIC) provide medical
professional liability insurance protection to the University of South Florida Board of Trustees (the
USFBOT), as well as faculty, staff, residents and students engaged in medical programs and
health-related courses of study.
The USFBOT and other immune entities, as well as the above covered individuals, are protected for
losses subject to Section 768.28, Florida Statues, in the amounts set forth therein, as well as for
legislative claims bills. The Program and HSCIC are distinct from and entirely independent of the
self-insurance programs administered by the State described in Note 17.
The Program’s estimated liability for unpaid claims at fiscal year-end is the result of both management
and actuarial analyses and includes an amount for claims that have been incurred but not reported.
Changes in the Program’s claim liability amount for the fiscal years ended June 30, 2017, and
June 30, 2018, are presented in the following table:
Fiscal Year
Claims Liability
Beginning of Year
Claims and Changes in Estimates
Claim Payments
Claims Liability
End of Year
2016-17 20,829,722$ 7,866,825$ (2,279,053)$ 26,417,494$ 2017-18 26,417,494 3,019,925 (1,752,179) 27,685,240
19. Litigation
The University is involved in several pending and threatened legal actions. The range of potential loss
from all such claims and actions, as estimated by the University’s legal counsel and management, should
not materially affect the University’s financial position.
20. Functional Distribution of Operating Expenses
The functional classification of an operating expense (instruction, research, etc.) is assigned to a
department based on the nature of the activity, which represents the material portion of the activity
attributable to the department. For example, activities of an academic department for which the primary
departmental function is instruction may include some activities other than direct instruction such as
research and public service. However, when the primary mission of the department consists of
instructional program elements, all expenses of the department are reported under the instruction
classification. The operating expenses on the statement of revenues, expenses, and changes in net
position are presented by natural classifications. The following are those same expenses presented in
functional classifications as recommended by NACUBO:
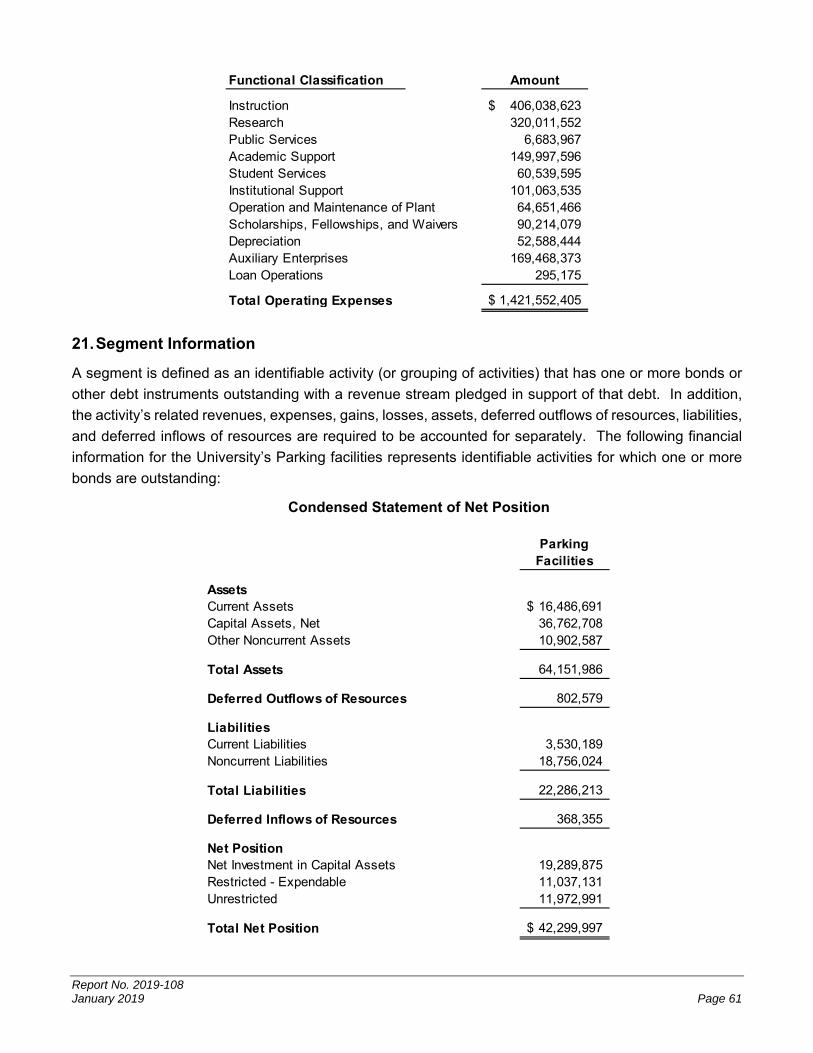
Report No. 2019-108 January 2019 Page 61
Functional Classification Amount
Instruction 406,038,623$ Research 320,011,552 Public Services 6,683,967 Academic Support 149,997,596 Student Services 60,539,595 Institutional Support 101,063,535 Operation and Maintenance of Plant 64,651,466 Scholarships, Fellowships, and Waivers 90,214,079 Depreciation 52,588,444 Auxiliary Enterprises 169,468,373 Loan Operations 295,175
Total Operating Expenses 1,421,552,405$
21. Segment Information
A segment is defined as an identifiable activity (or grouping of activities) that has one or more bonds or
other debt instruments outstanding with a revenue stream pledged in support of that debt. In addition,
the activity’s related revenues, expenses, gains, losses, assets, deferred outflows of resources, liabilities,
and deferred inflows of resources are required to be accounted for separately. The following financial
information for the University’s Parking facilities represents identifiable activities for which one or more
bonds are outstanding:
Condensed Statement of Net Position
ParkingFacilities
AssetsCurrent Assets 16,486,691$ Capital Assets, Net 36,762,708 Other Noncurrent Assets 10,902,587
Total Assets 64,151,986
Deferred Outflows of Resources 802,579
LiabilitiesCurrent Liabilities 3,530,189 Noncurrent Liabilities 18,756,024
Total Liabilities 22,286,213
Deferred Inflows of Resources 368,355
Net PositionNet Investment in Capital Assets 19,289,875 Restricted - Expendable 11,037,131 Unrestricted 11,972,991
Total Net Position 42,299,997$

Report No. 2019-108 Page 62 January 2019
Condensed Statement of Revenues, Expenses, and Changes in Net Position
ParkingFacilities
Operating Revenues 14,311,727$ Depreciation Expense (1,542,192) Other Operating Expenses (9,397,662)
Operating Income 3,371,873
Nonoperating Revenues (Expenses):Nonoperating Revenue 389,393 Interest Expense (452,841) Other Nonoperating Expense (22,679)
Net Nonoperating Expenses (86,127)
Income Before Other Revenues 3,285,746 State Capital Appropriations 3,240
Increase in Net Postion 3,288,986
Net Position, Beginning of Year 40,587,350 Adjustment to Beginning Net Position (1,576,339)
Net Position, Beginning of Year, as Restated 39,011,011
Net Position, End of Year 42,299,997$
Condensed Statement of Cash Flows
ParkingFacilities
Net Cash Provided (Used) by:Operating Activities 5,876,339$ Capital and Related Financing Activities (3,850,048) Investing Activities (1,622,923)
Net Increase in Cash and Cash Equivalents 403,368 Cash and Cash Equivalents, Beginning of Year 4,132,856
Cash and Cash Equivalents, End of Year 4,536,224$

Report No. 2019-108 January 2019 Page 63
22. Blended Component Unit
The University has one blended component unit as discussed in Note 1. The following financial
information is presented net of eliminations for the University’s blended component unit:
Condensed Statement of Net Position
USF HealthSciences Center TotalSelf-Insurance Primary
Program University Eliminations Government
Assets: Other Current Assets 13,724,328$ 896,897,548$ -$ 910,621,876$ Capital Assets, Net 17,432 957,389,686 - 957,407,118 Other Noncurrent Assets 51,198,183 21,700,610 - 72,898,793
Total Assets 64,939,943 1,875,987,844 - 1,940,927,787
Deferred Outflows of Resources - 167,934,037 - 167,934,037
Liabilities: Other Current Liabilities 1,659,020 199,638,562 - 201,297,582 Noncurrent Liabilities 26,087,669 847,491,456 - 873,579,125
Total Liabilities 27,746,689 1,047,130,018 - 1,074,876,707
Deferred Inflows of Resources - 131,587,371 - 131,587,371
Net Position: Net Investment in Capital Assets 17,432 808,894,531 - 808,911,963 Restricted - Expendable 37,175,822 222,149,721 - 259,325,543 Unrestricted - (165,839,760) - (165,839,760)
Total Net Position 37,193,254$ 865,204,492$ -$ 902,397,746$

Report No. 2019-108 Page 64 January 2019
Condensed Statement of Revenues, Expenses, and Changes in Net Position
USF HealthSciences Total
Self-Insurance PrimaryProgram University Eliminations Government
Operating Revenues 8,473,073$ 864,033,810$ (542,666)$ 871,964,217$ Depreciation Expense (11,137) (52,577,307) - (52,588,444) Other Operating Expenses (7,153,521) (1,362,353,106) 542,666 (1,368,963,961)
Operating Income (Loss) 1,308,415 (550,896,603) - (549,588,188)
Nonoperating Revenues (Expenses):Nonoperating Revenue 2,646,067 595,141,527 - 597,787,594 Interest Expense - (736,154) - (736,154) Other Nonoperating Expense - (50,341,978) - (50,341,978)
Net Nonoperating Revenues 2,646,067 544,063,395 - 546,709,462
Other Revenues - 38,908,654 - 38,908,654
Increase in Net Position 3,954,482 32,075,446 - 36,029,928
Net Position, Beginning of Year 33,238,772 1,162,967,046 - 1,196,205,818 Adjustment to Beginning Net Position (1) - (329,838,000) - (329,838,000)
Net Position, Beginning of Year, as Restated 33,238,772 833,129,046 - 866,367,818
Net Position, End of Year 37,193,254$ 865,204,492$ -$ 902,397,746$
(1) As discussed in Notes 2. and 3. to the financial statements, the University’s beginning net position was decreased in conjunction with the implementation of GASB Statement No. 75.
Condensed Statement of Cash Flows
USF HealthSciences Total
Self-Insurance PrimaryProgram University Eliminations Government
Net Cash Provided (Used) by:Operating Activities 3,718,232$ (438,742,337)$ -$ (435,024,105)$ Noncapital Financing Activities - 535,095,309 - 535,095,309 Capital and Related Financing Activities - (58,753,477) - (58,753,477) Investing Activities (2,271,422) (40,775,471) - (43,046,893)
Net Increase (Decrease) in Cash and - Cash Equivalents 1,446,810 (3,175,976) (1,729,166)
Cash and Cash Equivalents, Beginning of Year 3,955,963 68,131,977 - 72,087,940
Cash and Cash Equivalents, End of Year 5,402,773$ 64,956,001$ -$ 70,358,774$
23. Discretely Presented Component Units
The University has nine discretely presented component units as discussed in Note 1. These component
units comprise 100 percent of the transactions and account balances of the aggregate discretely
presented component units columns of the financial statements. The following financial information is
from the most recently available audited financial statements for the component units:

Report No. 2019-108 January 2019 Page 65
Condensed Statement of Net Position
USF Financing UniversityUniversity of University of Corporation Medical
University of South Florida USF Health South Florida and USF ServiceSouth Florida Alumni Professions Research Property Association,Foundation, Association, Conferencing Sun Dome, Foundation, Corporation Inc. (Faculty
Inc. Inc. Corporation Inc. Inc. (1) Practice Plan) Total
Assets: Current Assets 142,295,810$ 818,235$ 4,122,604$ 1,163,493$ 16,161,862$ 75,337,426$ 81,522,826$ 321,422,256$ Capital Assets, Net 13,791,223 - 2,930,385 637,744 40,822,360 239,679,916 6,390,085 304,251,713 Other Noncurrent Assets 507,850,696 6,954,733 6,650 - 34,040,149 33,348,664 9,238,320 591,439,212
Total Assets 663,937,729 7,772,968 7,059,639 1,801,237 91,024,371 348,366,006 97,151,231 1,217,113,181
Deferred Outflows of Resources - - - - 58,610 - - 58,610
Liabilities: Current Liabilities 6,257,735 2,224,843 2,288,087 1,452,176 11,315,382 23,699,408 15,424,453 62,662,084 Noncurrent Liabilities 4,714,152 - 649,827 - 17,213,610 318,845,784 1,667,457 343,090,830
Total Liabilities 10,971,887 2,224,843 2,937,914 1,452,176 28,528,992 342,545,192 17,091,910 405,752,914
Net Position: Net Investment in Capital Assets 8,705,639 - 1,547,312 637,744 23,047,360 - 3,877,866 37,815,921 Restricted Nonexpendable 638,967,071 1,302,942 103,718 - - - 6,340,000 646,713,731 Unrestricted 5,293,132 4,245,183 2,470,695 (288,683) 39,506,629 5,820,814 69,841,455 126,889,225
Total Net Position 652,965,842$ 5,548,125$ 4,121,725$ 349,061$ 62,553,989$ 5,820,814$ 80,059,321$ 811,418,877$
Direct-Support Organizations
(1) The USF Financing Corporation's and USF Property Corporation's financial statements were consolidated due to the USF Financing Corporation's ongoing economic interest in the USF Property Corporation and its ability to control the activities of the USF Property Corporation through common boards of directors.

Report No. 2019-108 Page 66 January 2019
Condensed Statement of Revenues, Expenses, and Changes in Net Position
USF Financing UniversityUniversity of University of Corporation Medical
University of South Florida USF Health South Florida and USF ServiceSouth Florida Alumni Professions Research Property Association,Foundation, Association, Conferencing Sun Dome, Foundation, Corporation Inc. (Faculty
Inc. Inc. Corporation Inc. Inc. (1) Practice Plan) Total
Operating Revenues 70,999,032$ 2,702,330$ 15,207,053$ 1,885,218$ 13,893,387$ 58,127,315$ 298,979,486$ 461,793,821$ Operating Expenses (64,899,288) (2,681,084) (12,856,844) (1,955,318) (11,020,571) (36,754,009) (286,680,676) (416,847,790)
Operating Income (Loss) 6,099,744 21,246 2,350,209 (70,100) 2,872,816 21,373,306 12,298,810 44,946,031 Net Nonoperating Revenues (Expenses) 51,739,443 613,957 (639,097) (543,992) 2,457,246 (20,984,874) (2,987,225) 29,655,458
Increase (Decrease) in Net Position 57,839,187 635,203 1,711,112 (614,092) 5,330,062 388,432 9,311,585 74,601,489
Net Position, Beginning of Year 595,126,655 4,912,922 2,410,613 963,153 57,223,927 5,432,382 70,747,736 736,817,388
Net Position, End of Year 652,965,842$ 5,548,125$ 4,121,725$ 349,061$ 62,553,989$ 5,820,814$ 80,059,321$ 811,418,877$
Direct-Support Organizations
(1) The USF Financing Corporation's and USF Property Corporation's financial statements were consolidated due to the USF Financing Corporation's ongoing economic interest in the USF Property Corporation and its ability to control the activities of the USF Property Corporation through common boards of directors.
Report No. 2019-108 January 2019 Page 67
24. Consolidation of Institutions
The University of South Florida was legislatively mandated to consolidate its separately accredited
institutions into one institution with two remote instructional sites effective July 1, 2020. The Southern
Association of Colleges and Schools, which establishes the accreditation requirements for institutions of
higher education, requires financial audit reports for consolidating institutions for the two most recent
years. To meet these requirements, statements of net position, revenues, expenses, and changes in net
position, cash flows are presented, as follows:

Report No. 2019-108 Page 68 January 2019
Statement of Net Position
USF USF USF Sarasota- Total USFTampa St. Petersburg Manatee System
ASSETSCurrent Assets:
Cash and Cash Equivalents 62,484,484$ 4,087,679$ 2,068,331$ 68,640,494$ Investments 604,923,386 43,139,018 21,886,821 669,949,225 Accounts Receivable, Net 68,038,768 2,229,542 456,271 70,724,581 Loans and Notes Receivable, Net 2,013,915 111,101 26,129 2,151,145 Due from State 80,196,408 4,723,699 798,441 85,718,548 Due from Component Units 11,882,143 23,348 2,465 11,907,956 Inventories 268,651 - - 268,651 Other Current Assets 1,261,276 - - 1,261,276
Total Current Assets 831,069,031 54,314,387 25,238,458 910,621,876
Noncurrent Assets:Restricted Cash and Cash Equivalents 1,614,874 103,088 318 1,718,280 Restricted Investments 67,130,646 1,092,849 3,367 68,226,862 Loans and Notes Receivable, Net 2,729,749 181,271 42,631 2,953,651 Depreciable Capital Assets, Net 757,511,761 73,698,541 27,643,034 858,853,336 Nondepreciable Capital Assets 87,311,711 8,487,274 2,754,797 98,553,782
Total Noncurrent Assets 916,298,741 83,563,023 30,444,147 1,030,305,911
Total Assets 1,747,367,772 137,877,410 55,682,605 1,940,927,787
DEFERRED OUTFLOWS OF RESOURCESOther Postemployment Benefits 10,502,818 674,682 314,500 11,492,000 Pensions 142,976,180 9,184,534 4,281,323 156,442,037
Total Deferred Outflows of Resources 153,478,998 9,859,216 4,595,823 167,934,037
LIABILITIESCurrent Liabilities:
Accounts Payable 34,281,838 1,124,561 198,657 35,605,056 Construction Contracts Payable 7,210,178 264,011 - 7,474,189 Salary and Wages Payable 32,796,628 1,739,735 743,488 35,279,851 Deposits Payable 4,457,475 157,506 6,504 4,621,485 Due to Component Units 68,917,165 127,607 - 69,044,772 Unearned Revenue 29,459,908 176,538 28,309 29,664,755 Long-Term Liabilities - Current Portion: - Capital Improvement Debt Payable 2,538,479 - - 2,538,479 Installment Purchases Payable 138,865 - - 138,865 Capital Leases Payable 129,661 - - 129,661 Estimated Insurance Claims Payable 1,597,571 - - 1,597,571 Compensated Absences Payable 6,273,254 302,523 118,251 6,694,028 Dining Facility Fee Payable 20,865 - - 20,865 Other Post Employment Benefits Payable 5,738,531 368,633 171,836 6,279,000 Net Pension Liability 2,018,863 129,688 60,454 2,209,005
Total Current Liabilities 195,579,281 4,390,802 1,327,499 201,297,582

Report No. 2019-108 January 2019 Page 69
Statement of Net Position (Continued)
USF USF USF Sarasota- Total USFTampa St. Petersburg Manatee System
Liabilities (Continued)Noncurrent Liabilities:
Capital Improvement Debt Payable 14,934,354$ -$ -$ 14,934,354$ Installment Purchases Payable 189,249 - - 189,249 Capital Leases Payable 314,854 - - 314,854 Estimated Insurance Claims Payable 26,087,669 - - 26,087,669 Compensated Absences Payable 73,870,771 3,562,366 1,392,469 78,825,606 Federal Advance Payable 2,535,659 212,306 48,425 2,796,390 Dining Facility Payable 4,705,288 - - 4,705,288 Other Postemployment Benefits Payable 402,231,796 25,838,650 12,044,554 440,115,000 Net Pension Liability 279,305,061 17,942,056 8,363,598 305,610,715
Total Noncurrent Liabilities 804,174,701 47,555,378 21,849,046 873,579,125
Total Liabilities 999,753,982 51,946,180 23,176,545 1,074,876,707
DEFERRED INFLOWS OF RESOURCESOther Postemployment Benefits 57,676,849 3,705,058 1,727,093 63,109,000 Pensions 12,764,478 819,967 382,224 13,966,669 Deferred Service Concession Arrangement Receipts 54,511,702 - - 54,511,702
Total Deferred Inflows of Resources 124,953,029 4,525,025 2,109,317 131,587,371
NET POSITIONNet Investment in Capital Assets 696,328,317 82,185,815 30,397,831 808,911,963 Restricted for Expendable:
Debt Service 1,753,532 - - 1,753,532 Loans 4,949,199 81,225 20,651 5,051,075 Capital Projects 84,955,872 5,616,373 802,126 91,374,371 Other 156,382,928 1,977,152 2,786,485 161,146,565
Unrestricted (168,230,089) 1,404,856 985,473 (165,839,760)
TOTAL NET POSITION 776,139,759$ 91,265,421$ 34,992,566$ 902,397,746$

Report No. 2019-108 Page 70 January 2019
Statement of Revenues, Expenses, and Changes in Net Position
USF USF USF Sarasota- Total USFTampa St. Petersburg Manatee System
REVENUESOperating Revenues:
Student Tuition and Fees, Net of Scholarship Allowances 249,570,221$ 21,526,593$ 10,192,407$ 281,289,221$ Federal Grants and Contracts 204,694,780 3,190,510 33,999 207,919,289 State and Local Grants and Contracts 27,351,661 657,809 - 28,009,470 Nongovernmental Grants and Contracts 195,209,531 386,164 77,106 195,672,801 Sales and Services of Auxiliary Enterprises 135,848,654 9,760,636 542,412 146,151,702 Interest on Loans and Notes Receivable 202,009 - - 202,009 Other Operating Revenues 12,718,758 967 - 12,719,725
Total Operating Revenues 825,595,614 35,522,679 10,845,924 871,964,217
EXPENSESOperating Expenses:
Compensation and Employee Benefits 851,399,510 52,793,830 23,898,039 928,091,379 Services and Supplies 302,261,728 17,540,164 3,324,414 323,126,306 Utilities and Communications 21,672,483 2,515,700 324,089 24,512,272 Scholarships, Fellowships, and Waivers 77,103,790 9,063,540 4,046,749 90,214,079 Depreciation 47,590,570 3,693,351 1,304,523 52,588,444 Self-Insurance Claims 3,019,925 - - 3,019,925
Total Operating Expenses 1,303,048,006 85,606,585 32,897,814 1,421,552,405
Operating Loss (477,452,392) (50,083,906) (22,051,890) (549,588,188)
NONOPERATING REVENUES (EXPENSES)State Noncapital Appropriations 372,736,956 32,062,745 15,766,368 420,566,069 Federal and State Student Financial Aid 116,616,279 13,052,051 5,017,001 134,685,331 Noncapital Grants and Donations 20,403,200 983,642 566,957 21,953,799 Investment Income 17,230,095 704,413 354,326 18,288,834 Other Nonoperating Revenues 2,293,200 - 361 2,293,561 Loss on Disposal of Capital Assets (715,617) (124,094) - (839,711) Interest on Capital Asset-Related Debt (736,154) - - (736,154) Other Nonoperating Expenses (46,083,537) (3,418,730) - (49,502,267)
Net Nonoperating Revenues 481,744,422 43,260,027 21,705,013 546,709,462
Income (Loss) Before Other Revenues 4,292,030 (6,823,879) (346,877) (2,878,726)
State Capital Appropriations 23,263,098 4,292,198 415,971 27,971,267 Capital Grants, Contracts, Donations, and Fees 10,888,910 48,477 - 10,937,387 Transfers to/from Other University Institutions, Net 1,346,941 (981,714) (365,227) -
Increase (Decrease) in Net Position 39,790,979 (3,464,918) (296,133) 36,029,928
Net Position, Beginning of Year 1,037,795,747 114,094,751 44,315,320 1,196,205,818 Adjustment to Beginning Net Position (301,446,967) (19,364,412) (9,026,621) (329,838,000)
Net Position, Beginning of Year, as Restated 736,348,780 94,730,339 35,288,699 866,367,818
Net Position, End of Year 776,139,759$ 91,265,421$ 34,992,566$ 902,397,746$
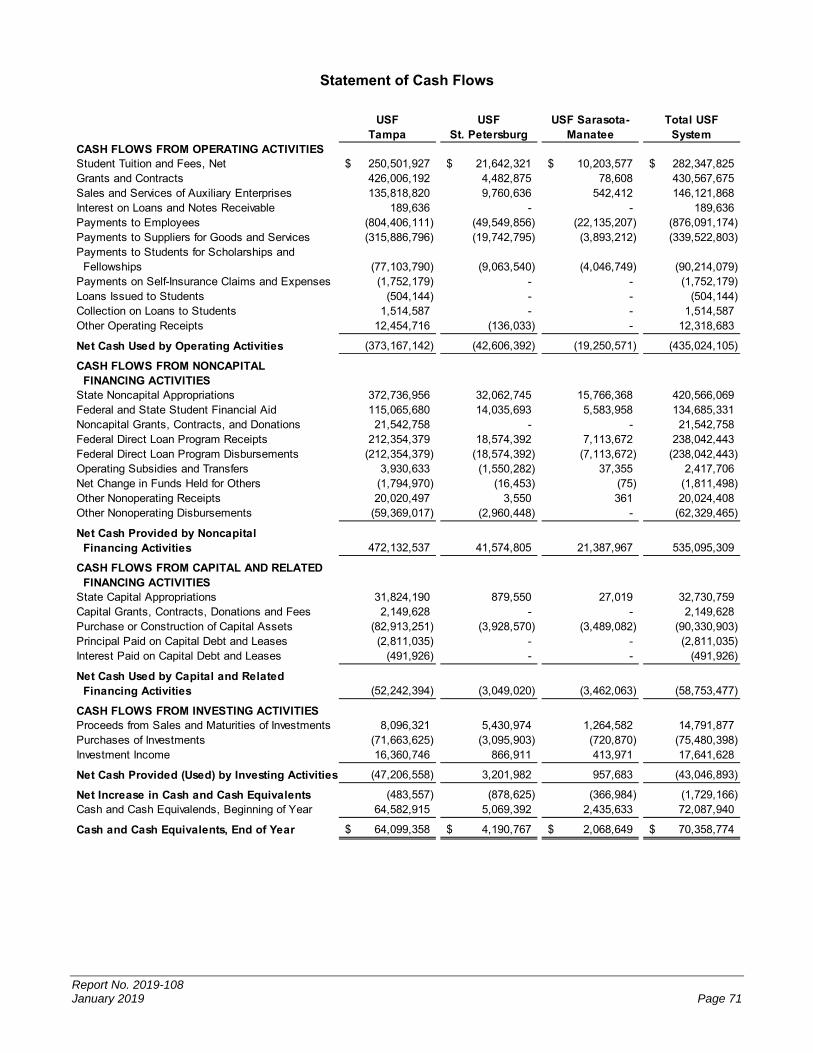
Report No. 2019-108 January 2019 Page 71
Statement of Cash Flows
USF USF USF Sarasota- Total USFTampa St. Petersburg Manatee System
CASH FLOWS FROM OPERATING ACTIVITIESStudent Tuition and Fees, Net 250,501,927$ 21,642,321$ 10,203,577$ 282,347,825$ Grants and Contracts 426,006,192 4,482,875 78,608 430,567,675 Sales and Services of Auxiliary Enterprises 135,818,820 9,760,636 542,412 146,121,868 Interest on Loans and Notes Receivable 189,636 - - 189,636 Payments to Employees (804,406,111) (49,549,856) (22,135,207) (876,091,174) Payments to Suppliers for Goods and Services (315,886,796) (19,742,795) (3,893,212) (339,522,803) Payments to Students for Scholarships and Fellowships (77,103,790) (9,063,540) (4,046,749) (90,214,079) Payments on Self-Insurance Claims and Expenses (1,752,179) - - (1,752,179) Loans Issued to Students (504,144) - - (504,144) Collection on Loans to Students 1,514,587 - - 1,514,587 Other Operating Receipts 12,454,716 (136,033) - 12,318,683
Net Cash Used by Operating Activities (373,167,142) (42,606,392) (19,250,571) (435,024,105)
CASH FLOWS FROM NONCAPITAL FINANCING ACTIVITIESState Noncapital Appropriations 372,736,956 32,062,745 15,766,368 420,566,069 Federal and State Student Financial Aid 115,065,680 14,035,693 5,583,958 134,685,331 Noncapital Grants, Contracts, and Donations 21,542,758 - - 21,542,758 Federal Direct Loan Program Receipts 212,354,379 18,574,392 7,113,672 238,042,443 Federal Direct Loan Program Disbursements (212,354,379) (18,574,392) (7,113,672) (238,042,443) Operating Subsidies and Transfers 3,930,633 (1,550,282) 37,355 2,417,706 Net Change in Funds Held for Others (1,794,970) (16,453) (75) (1,811,498) Other Nonoperating Receipts 20,020,497 3,550 361 20,024,408 Other Nonoperating Disbursements (59,369,017) (2,960,448) - (62,329,465)
Net Cash Provided by Noncapital Financing Activities 472,132,537 41,574,805 21,387,967 535,095,309
CASH FLOWS FROM CAPITAL AND RELATED FINANCING ACTIVITIESState Capital Appropriations 31,824,190 879,550 27,019 32,730,759 Capital Grants, Contracts, Donations and Fees 2,149,628 - - 2,149,628 Purchase or Construction of Capital Assets (82,913,251) (3,928,570) (3,489,082) (90,330,903) Principal Paid on Capital Debt and Leases (2,811,035) - - (2,811,035) Interest Paid on Capital Debt and Leases (491,926) - - (491,926)
Net Cash Used by Capital and Related Financing Activities (52,242,394) (3,049,020) (3,462,063) (58,753,477)
CASH FLOWS FROM INVESTING ACTIVITIESProceeds from Sales and Maturities of Investments 8,096,321 5,430,974 1,264,582 14,791,877 Purchases of Investments (71,663,625) (3,095,903) (720,870) (75,480,398) Investment Income 16,360,746 866,911 413,971 17,641,628
Net Cash Provided (Used) by Investing Activities (47,206,558) 3,201,982 957,683 (43,046,893)
Net Increase in Cash and Cash Equivalents (483,557) (878,625) (366,984) (1,729,166) Cash and Cash Equivalends, Beginning of Year 64,582,915 5,069,392 2,435,633 72,087,940
Cash and Cash Equivalents, End of Year 64,099,358$ 4,190,767$ 2,068,649$ 70,358,774$

Report No. 2019-108 Page 72 January 2019
Statement of Cash Flows (Continued)
USF USF USF Sarasota- Total USFTampa St. Petersburg Manatee System
RECONCILIATION OF OPERATING LOSS LOSS TO NET CASH USED BY OPERATING ACTIVITIESOperating Loss (477,452,392)$ (50,083,906)$ (22,051,890)$ (549,588,188)$ Adjustments to Reconcile Operating Loss to Net Cash used by Operating Activities:Depreciation Expense 47,590,570 3,693,351 1,304,523 52,588,444 Changes in Assets, Liabilities, Deferred Outflows of Resources, and Deferred Inflows of Resources:
Receivables, Net 12,877,451 308,131 4,057 13,189,639 Loans and Notes Receivable, Net 1,010,443 - - 1,010,443 Inventories (36,613) - - (36,613) Other Assets (571,745) - - (571,745) Accounts Payable 8,235,649 313,070 (244,709) 8,304,010 Salaries and Wages Payable 2,322,714 108,508 57,257 2,488,479
Deposits Payable (344,671) (137,000) - (481,671) Compensated Absences Payable 3,047,730 242,883 107,649 3,398,262 Unearned Revenue (12,748,573) 55,989 (25,383) (12,717,967) Estimated Insurance Claims Payable 1,267,746 - - 1,267,746 Other Postemployment Benefits (31,680,068) (1,924,839) (771,093) (34,376,000) Deferred Outflows of Resources Related
to Other Employment Benefits (5,340,973) (343,095) (159,932) (5,844,000) Deferred Inflows of Resources Related
to Other Employment Benefits 57,676,849 3,705,058 1,727,093 63,109,000 Net Pension Liability 27,250,505 1,961,036 1,155,059 30,366,600 Deferred Outflows of Resources Related
to Pensions (17,149,529) (1,205,909) (681,447) (19,036,885) Deferred Inflows of Resources Related
to Pensions 10,877,765 700,331 328,245 11,906,341
NET CASH USED BY OPERATING ACTIVITIES (373,167,142)$ (42,606,392)$ (19,250,571)$ (435,024,105)$
25. Subsequent Events
USF Financing Corporation – Component Unit
(a) Change in Accounting Framework Effective for Year Ending June 30, 2019
As a result of the Florida Excellence in Higher Education Act of 2018, for all universities within the State
University System (SUS) of Florida, the university board of trustees must approve all appointments to the
board of directors of any university direct support organization (DSO). This change will require all SUS
university DSOs, including USF Financing Corporation and USF Property Corporation, to follow the
Governmental Accounting Standards Board (GASB) financial accounting framework beginning in the
fiscal year ending June 30, 2019.
(b) Conversion of the Series 2013B Health Certificates
On July 2, 2018, the USF Financing Corporation converted the Series 2013B Health Certificates with an
outstanding par amount of $17,925,000, subsequent to the principal payment made on that day, from a
variable rate to a 20-year fixed rate of 3.39 percent. The associated interest rate swap expired on

Report No. 2019-108 January 2019 Page 73
July 1, 2018. The $1,000,000 in swap collateral was returned to the USF Financing Corporation on
July 9, 2018, and the Corporation subsequently returned the funds to UMSA.
(c) Amendment to Series 2012B Housing Certificates
On July 1, 2018, the USF Financing Corporation amended the continuing covenant agreement and swap
agreement related to the Series 2012B Housing Certificates to mitigate the increase in the interest rate
resulting from the change in U.S. corporate tax rate. The all-in true interest rate effective July 1, 2018, is
4.669 percent.
(d) Amendment to Series 2013A Health Certificates
On July 1, 2018, the USF Financing Corporation amended the continuing covenants agreement related
to the Series 2013A Health Certificates to mitigate the increase in the interest rate resulting from the
change in U.S. corporate tax rate, and to eliminate subjective acceleration clauses and other
bank-favorable covenants. The interest rate effective July 1, 2018, is 2.71 percent.
(e) Amendments to Series 2003A Athletics Certificates and Series 2013 Arena Note
On July 1, 2018, the USF Financing Corporation amended the credit agreement related to the
Series 2003A Athletics Certificates and the loan agreement related to the Series 2013 Arena Note to
eliminate subjective acceleration clauses and other bank-favorable covenants from the agreements.
(f) Issuance of the Series 2018 Housing Certificates
On January 16, 2019, as authorized by the University Board of Trustees in July 2018, by the Florida
Board of Governors in November 2018, and by the USF Financing Corporation Board of Directors in
November 2018, the USF Financing Corporation issued the $30,140,000 Certificates of Participation,
Series 2018 to fund the construction of the University of South Florida St. Petersburg Housing and Dining
Project. The final maturity date is 2048 and the Certificates were issued at a tax exempt all-in fixed
interest of 3.99%.
(g) Issuance of the Series 2019 Housing Certificates
On January 16, 2019, as authorized by the USF Financing Corporation Board of Directors in
November 2018, the USF Financing Corporation refunded the $15,140,000 outstanding Series 2010B
Housing Certificates of Participation with the issuance of the Series 2019 Refunding Certificates of
Participation in a par amount of $15,510,000. The final maturity date is 2040 and the Certificates were
issued at a tax-exempt all-in fixed rate of 3.68%.
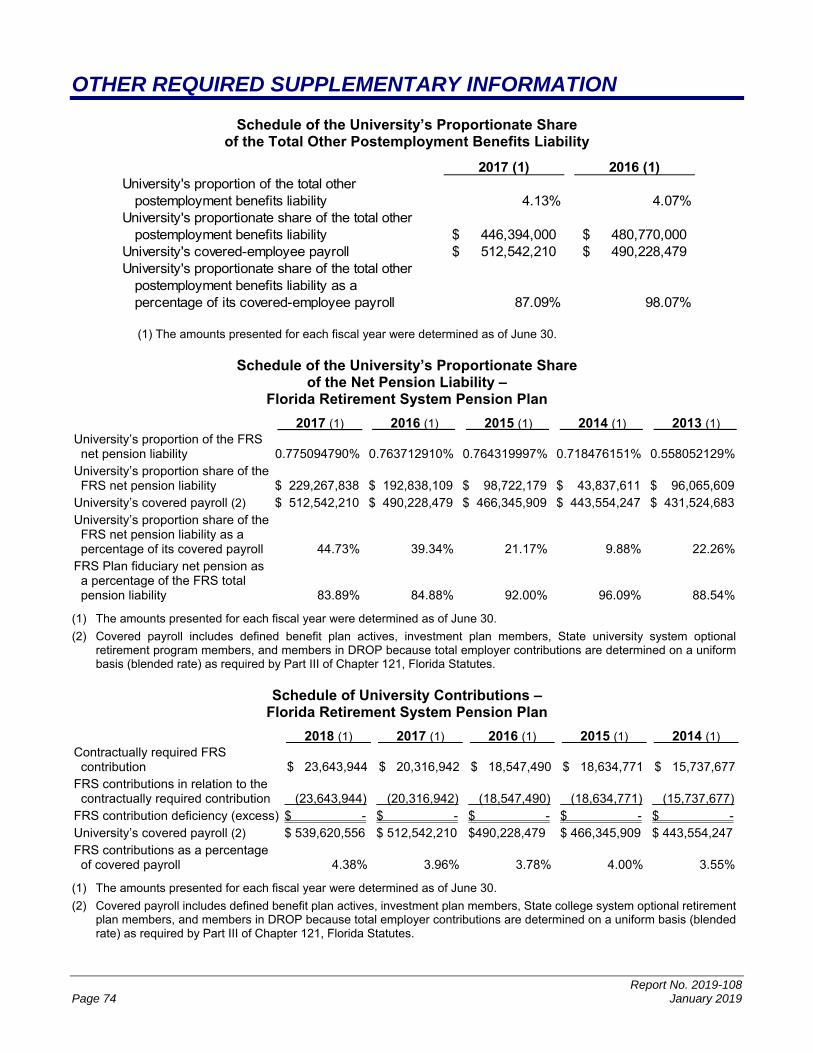
Report No. 2019-108 Page 74 January 2019
OTHER REQUIRED SUPPLEMENTARY INFORMATION
Schedule of the University’s Proportionate Share of the Total Other Postemployment Benefits Liability
2017 (1) 2016 (1)University's proportion of the total other postemployment benefits liability 4.13% 4.07%University's proportionate share of the total other postemployment benefits liability 446,394,000$ 480,770,000$ University's covered-employee payroll 512,542,210$ 490,228,479$ University's proportionate share of the total other postemployment benefits liability as a percentage of its covered-employee payroll 87.09% 98.07%
(1) The amounts presented for each fiscal year were determined as of June 30.
Schedule of the University’s Proportionate Share of the Net Pension Liability –
Florida Retirement System Pension Plan
2017 (1) 2016 (1) 2015 (1) 2014 (1) 2013 (1) University’s proportion of the FRS net pension liability 0.775094790% 0.763712910% 0.764319997% 0.718476151% 0.558052129% University’s proportion share of the FRS net pension liability $ 229,267,838 $ 192,838,109 $ 98,722,179 $ 43,837,611 $ 96,065,609 University’s covered payroll (2) $ 512,542,210 $ 490,228,479 $ 466,345,909 $ 443,554,247 $ 431,524,683 University’s proportion share of the FRS net pension liability as a percentage of its covered payroll 44.73% 39.34% 21.17% 9.88% 22.26% FRS Plan fiduciary net pension as a percentage of the FRS total pension liability 83.89% 84.88% 92.00% 96.09% 88.54%
(1) The amounts presented for each fiscal year were determined as of June 30.
(2) Covered payroll includes defined benefit plan actives, investment plan members, State university system optional retirement program members, and members in DROP because total employer contributions are determined on a uniform basis (blended rate) as required by Part III of Chapter 121, Florida Statutes.
Schedule of University Contributions – Florida Retirement System Pension Plan
2018 (1) 2017 (1) 2016 (1) 2015 (1) 2014 (1) Contractually required FRS contribution $ 23,643,944 $ 20,316,942 $ 18,547,490 $ 18,634,771 $ 15,737,677 FRS contributions in relation to the contractually required contribution (23,643,944) (20,316,942) (18,547,490) (18,634,771) (15,737,677) FRS contribution deficiency (excess) $ - $ - $ - $ - $ - University’s covered payroll (2) $ 539,620,556 $ 512,542,210 $490,228,479 $ 466,345,909 $ 443,554,247 FRS contributions as a percentage of covered payroll 4.38% 3.96% 3.78% 4.00% 3.55%
(1) The amounts presented for each fiscal year were determined as of June 30.
(2) Covered payroll includes defined benefit plan actives, investment plan members, State college system optional retirement plan members, and members in DROP because total employer contributions are determined on a uniform basis (blended rate) as required by Part III of Chapter 121, Florida Statutes.

Report No. 2019-108 January 2019 Page 75
Schedule of the University’s Proportionate Share of the Net Pension Liability –
Health Insurance Subsidy Pension Plan
2017 (1) 2016 (1) 2015 (1) 2014 (1) 2013 (1) University’s proportion of the HIS net pension liability 0.734647326% 0.726023325% 0.706815530% 0.668866670% 0.662647783% University’s proportion share of the HIS net pension liability $ 78,551,882 $ 84,615,011 $ 72,084,066 $ 62,540,666 $ 57,692,202 University’s covered payroll (2) $ 229,109,865 $ 220,376,032 $ 208,898,281 $ 194,843,828 $ 189,351,023 University’s proportion share of the HIS net pension liability as a percentage of its covered payroll 34.29% 38.40% 34.51% 32.10% 30.47% HIS Plan fiduciary net pension as a percentage of the FRS total pension liability 1.64% 0.97% 0.50% 0.99% 1.78%
(1) The amounts presented for each fiscal year were determined as of June 30.
(2) Covered payroll includes defined benefit plan actives, investment plan members, and members in DROP.
Schedule of University Contributions – Health Insurance Subsidy Pension Plan
2018 (1) 2017 (1) 2016 (1) 2015 (1) 2014 (1) Contractually required HIS contribution $ 4,035,035 $ 3,803,232 $ 3,647,462 $ 2,701,889 $ 2,291,312 HIS contributions in relation to the contractually required HIS contribution (4,035,035) (3,803,232) (3,647,462) (2,701,889) (2,291,312) HIS contribution deficiency (excess) $ - $ - $ - $ - $ - University’s covered payroll (2) $ 238,582,447 $ 229,109,865 $ 220,376,032 $ 208,898,281 $ 194,843,828 HIS contributions as a percentage of covered payroll 1.69% 1.66% 1.66% 1.29% 1.18%
(1) The amounts presented for each fiscal year were determined as of June 30.
(2) Covered payroll includes defined benefit plan actives, investment plan members, and members in DROP.
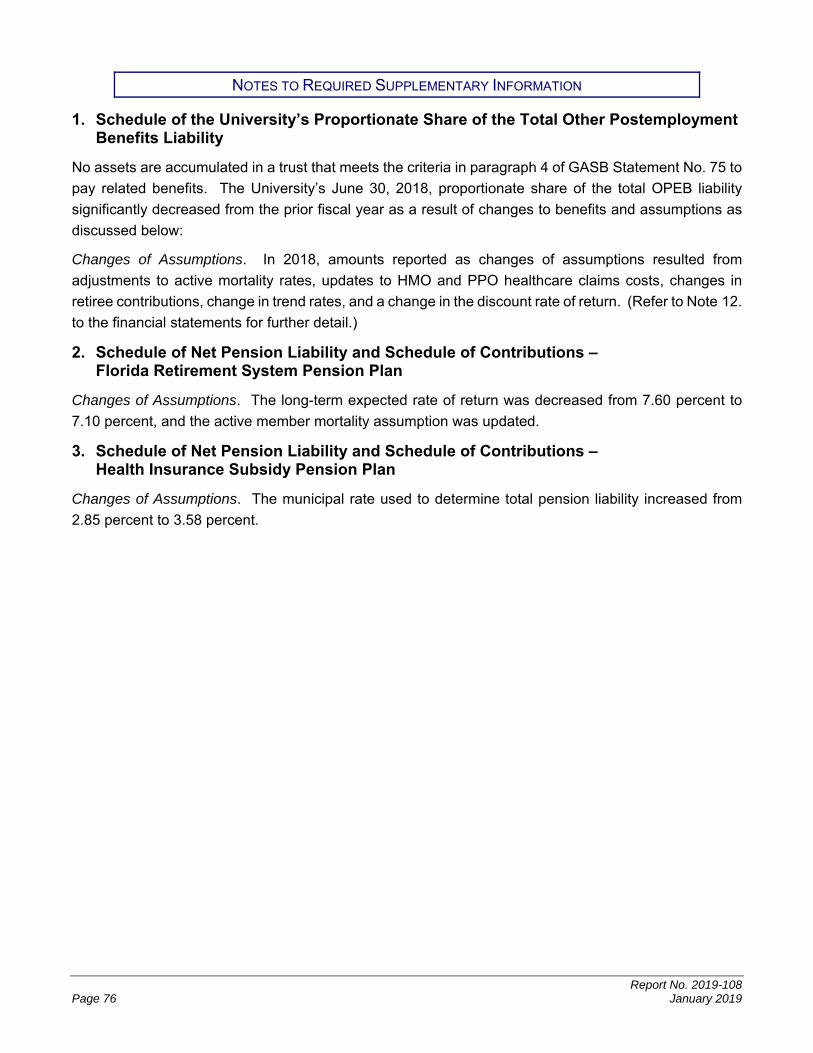
Report No. 2019-108 Page 76 January 2019
NOTES TO REQUIRED SUPPLEMENTARY INFORMATION
1. Schedule of the University’s Proportionate Share of the Total Other Postemployment Benefits Liability
No assets are accumulated in a trust that meets the criteria in paragraph 4 of GASB Statement No. 75 to
pay related benefits. The University’s June 30, 2018, proportionate share of the total OPEB liability
significantly decreased from the prior fiscal year as a result of changes to benefits and assumptions as
discussed below:
Changes of Assumptions. In 2018, amounts reported as changes of assumptions resulted from
adjustments to active mortality rates, updates to HMO and PPO healthcare claims costs, changes in
retiree contributions, change in trend rates, and a change in the discount rate of return. (Refer to Note 12.
to the financial statements for further detail.)
2. Schedule of Net Pension Liability and Schedule of Contributions – Florida Retirement System Pension Plan
Changes of Assumptions. The long-term expected rate of return was decreased from 7.60 percent to
7.10 percent, and the active member mortality assumption was updated.
3. Schedule of Net Pension Liability and Schedule of Contributions – Health Insurance Subsidy Pension Plan
Changes of Assumptions. The municipal rate used to determine total pension liability increased from
2.85 percent to 3.58 percent.

Report No. 2019-108 January 2019 Page 77
Phone: (850) 412-2722 Fax: (850) 488-6975
Sherrill F. Norman, CPA Auditor General
AUDITOR GENERAL STATE OF FLORIDA Claude Denson Pepper Building, Suite G74
111 West Madison Street Tallahassee, Florida 32399-1450
The President of the Senate, the Speaker of the House of Representatives, and the Legislative Auditing Committee
INDEPENDENT AUDITOR’S REPORT ON INTERNAL CONTROL OVER
FINANCIAL REPORTING AND ON COMPLIANCE AND OTHER MATTERS
BASED ON AN AUDIT OF FINANCIAL STATEMENTS PERFORMED
IN ACCORDANCE WITH GOVERNMENT AUDITING STANDARDS
We have audited, in accordance with the auditing standards generally accepted in the United States of
America and the standards applicable to financial audits contained in Government Auditing Standards
issued by the Comptroller General of the United States, the financial statements of the University of South
Florida, a component unit of the State of Florida, and its aggregate discretely presented component units
as of and for the fiscal year ended June 30, 2018, and the related notes to the financial statements, which
collectively comprise the University’s basic financial statements, and have issued our report thereon
dated January 22, 2019, included under the heading INDEPENDENT AUDITOR’S REPORT. Our report
includes a reference to other auditors who audited the financial statements of the blended and aggregate
discretely presented component units, as described in our report on the University’s financial statements.
This report does not include the results of the other auditors’ testing of internal control over financial
reporting or compliance and other matters that are reported on separately by those auditors.
Internal Control Over Financial Reporting
In planning and performing our audit of the financial statements, we considered the University’s internal
control over financial reporting (internal control) to determine audit procedures that are appropriate in the
circumstances for the purpose of expressing our opinions on the financial statements, but not for the
purpose of expressing an opinion on the effectiveness of the University’s internal control. Accordingly,
we do not express an opinion on the effectiveness of the University’s internal control.
A deficiency in internal control exists when the design or operation of a control does not allow
management or employees, in the normal course of performing their assigned functions, to prevent, or
detect and correct, misstatements on a timely basis. A material weakness is a deficiency, or a
combination of deficiencies, in internal control such that there is a reasonable possibility that a material
misstatement of the University’s financial statements will not be prevented, or detected and corrected on
a timely basis. A significant deficiency is a deficiency, or a combination of deficiencies, in internal control

Report No. 2019-108 Page 78 January 2019
that is less severe than a material weakness, yet important enough to merit attention by those charged
with governance.
Our consideration of internal control was for the limited purpose described in the first paragraph of this
section and was not designed to identify all deficiencies in internal control that might be material
weaknesses or significant deficiencies. Given these limitations, during our audit we did not identify any
deficiencies in internal control that we consider to be material weaknesses. However, material
weaknesses may exist that have not been identified.
Compliance and Other Matters
As part of obtaining reasonable assurance about whether the University’s financial statements are free
from material misstatement, we performed tests of its compliance with certain provisions of laws, rules,
regulations, contracts, and grant agreements, noncompliance with which could have a direct and material
effect on the determination of financial statement amounts. However, providing an opinion on compliance
with those provisions was not an objective of our audit and, accordingly, we do not express such an
opinion. The results of our tests disclosed no instances of noncompliance or other matters that are
required to be reported under Government Auditing Standards.
Purpose of this Report
The purpose of this report is solely to describe the scope of our testing of internal control and compliance
and the results of that testing, and not to provide an opinion on the effectiveness of the University’s
internal control or on compliance. This report is an integral part of an audit performed in accordance with
Government Auditing Standards in considering the University’s internal control and compliance.
Accordingly, this communication is not suitable for any other purpose.
Respectfully submitted,
Sherrill F. Norman, CPA Tallahassee, Florida January 22, 2019