2018/2_fy 2018 – 2022 capital budget.pdf, year budgets/operating budget 201… · introduction...
TRANSCRIPT

FY 2018 Capital Budget
FY 2018 – FY 2022 Capital Improvement Plan


Table of Contents Page Section 1 - Overview Introduction ........................................................................................................................ 1 Rhode Island Capital Plan Fund ........................................................................................ 4
Classification of State Debt ............................................................................................... 6 Tax Supported Debt Burden ............................................................................................ 12 General Obligation Debt Authorization .......................................................................... 16 Public Finance Management Board ................................................................................. 19 Section 2 - Executive Summary of Agency Recommendations General Government Department of Administration ......................................................................................... 21 Executive Office of Commerce ....................................................................................... 29 Department of Labor and Training .................................................................................. 31 Department of Revenue ................................................................................................... 32 Secretary of State ............................................................................................................. 33 Public Utilities Commission ............................................................................................ 34 Health and Human Services Department of Children, Youth and Families ................................................................. 35 Department of Human Services ....................................................................................... 36 Department of Behavioral Healthcare, Developmental Disabilities and Hospitals ........ 37 Education Elementary and Secondary Education ............................................................................. 40 Public Higher Education .................................................................................................. 42 Council on the Arts .......................................................................................................... 49 Atomic Energy Commission ........................................................................................... 50 Historical Preservation and Heritage Commission ......................................................... 51
Public Safety Attorney General .............................................................................................................. 52
Department of Corrections ............................................................................................... 53 Judicial ............................................................................................................................. 57 Military Staff .................................................................................................................... 59 Public Safety .................................................................................................................... 62
RI Emergency Management Agency .............................................................................. 65
Natural Resources Department of Environmental Management ................................................................... 67 Coastal Resources Management Council ........................................................................ 77 Rhode Island Infrastructure Bank .................................................................................... 79 Narragansett Bay Commission ........................................................................................ 83 Transportation Department of Transportation .......................................................................................... 85 Rhode Island Public Transit Authority ............................................................................ 93

Quasi-Public Agencies Rhode Island Airport Corporation ................................................................................... 97 Rhode Island Resource Recovery Corporation ............................................................. 101 Rhode Island Turnpike and Bridge Authority ............................................................... 103 Section 3 - Schedules Schedule 1 – Summary of Proposed Bond Issuance by Agency .................................... 105 Schedule 2 - Statewide Summary by Source of Funds ................................................... 106 Schedule 3 – Statewide Summary by Agency ................................................................ 108 Schedule 4 - Projects by Funding Source: Department of Administration ................................................................................ 110 Executive Office of Commerce .............................................................................. 114
Department of Labor and Training ......................................................................... 114 Department of Revenue .......................................................................................... 114 Secretary of State .................................................................................................... 116 Public Utilities Commission ................................................................................... 116 Department of Children, Youth and Families ........................................................ 116 Department of Human Services .............................................................................. 116 Department of Behavioral Health, Developmental Disabilities and Hospitals ...... 116 Department of Elementary and Secondary Education ........................................... 118 Higher Education .................................................................................................... 120 Council on the Arts ................................................................................................. 127 Atomic Energy Commission ................................................................................... 127 Historical Preservation and Heritage Commission ................................................. 127 Attorney General ..................................................................................................... 127 Department of Corrections ...................................................................................... 127 Judiciary .................................................................................................................. 128 Military Staff ........................................................................................................... 128 Emergency Management Agency ........................................................................... 130 Public Safety ........................................................................................................... 130 Department of Environmental Management .......................................................... 132 Coastal Resources Management Council ............................................................... 134 Clean Water Finance Agency ................................................................................. 136 Narragansett Bay Commission .............................................................................. 138 Department of Transportation ................................................................................. 138 Rhode Island Public Transit Authority ................................................................... 140 Schedule 5 – Rhode Island Capital Plan Fund Projects .................................................. 144
Schedule 6 – Quasi-Public Agency Capital Plans .......................................................... 154

Section 4 - Technical Appendices Appendices Overview ..................................................................................................... 156 Appendix A - Projected Net Tax Supported Debt .......................................................... A-1 Appendix B - Outstanding Debt & Debt Ratios ............................................................. B-1 Appendix C - Debt Service Payable by Issuer ................................................................ C-1 Appendix D - Transportation GARVEE Bonds ............................................................. D-1 Appendix E – State of Rhode Island Bond Referenda ................................................... E-1 Appendix F - Analysis of Bond Authorizations .............................................................. F-1 Appendix G – Summary of Tax Supported Debt Issuance by Fiscal Year .................... G-1 Appendix H – Capital Budget Glossary .......................................................................... H-1
Table of Contents - Appendix C – Debt Service Payable by Issuer
Outstanding Debt Service Payments for: General Obligation Bonds ............................................................................................... C-1 Shepard’s Building Certificates of Participation ............................................................ C-2 Convention Center Authority .......................................................................................... C-3 Center General Project Certificates of Participation ....................................................... C-4 Pastore Center – Power Plant Certificates of Participation ............................................ C-5 Kent County Courthouse ................................................................................................. C-6 Juvenile Training School ................................................................................................. C-7 Traffic Tribunal Court Complex ..................................................................................... C-8 School for the Deaf .......................................................................................................... C-9 Innovative Technology Certificates of Participation ................................................... C-10 Department of Administration Energy Conservation Equipment Leases .................... C-11 EDC – Transportation Motor Fuel Bonds ..................................................................... C-12
RI Economic Development Corporation – URI Power Plant ....................................... C-13 URI Energy Conservation Equipment Leases .............................................................. C-14 RIC Energy Conservation Equipment Leases ............................................................... C-15 CCRI Energy Conservation Equipment Leases ............................................................ C-16 Historic Structures Tax Credits Fund ............................................................................ C-17 EDC Job Creation Guaranty Program .......................................................................... C-18 ECD Job Creation Guaranty Program II ....................................................................... C-19 Redevelopment of I-195 Land ....................................................................................... C-20 Summary – All Outstanding Debt Service Payments. .................................................. C-21 Projected Debt Service on Proposed Debt Issuance: General Obligation Bonds ............................................................................................. C-22 Information Technology Investments ........................................................................... C-23 Nursing Education Center Equipment Certificates of Participation ............................. C-24 Statewide Energy Efficiency Projects ........................................................................... C-25 Energy Conservation – URI .......................................................................................... C-26 Confined Aquatic Disposal Cells – CRMC .................................................................. C-27 Historic Structures Tax Credits Fund ............................................................................ C-28 Summary – All Outstanding and Projected Debt Service Payments (Excluding Performance Based Agreements) ....................................... C-29

Outstanding Debt Service Payments for Performance Based State Obligations RI Economic Development Corporation – Fidelity I .................................................... C-30 RI Economic Development Corporation – Fidelity II .................................................. C-31 RI Economic Development Corporation – Fleet .......................................................... C-32 RI Economic Development Corporation – Providence Place Mall .............................. C-33 Summary – All Outstanding and Projected Debt Service Payments (Including Performance Based Agreements) ........................................ C-34

Introduction


Introduction
Governor Raimondo’s FY 2018 – FY 2022 Capital Improvement Plan and FY 2018 Capital Budget invests in key projects that focus on improving the Rhode Island economy. Proposed capital financing in Transportation ensures that Rhode Island has a safe and reliable transportation system. The capital plan includes funding for both K-12 and higher education institutions to support the Governor’s focus on building a work force for today’s economy. Continued financing in natural resources protects and preserves the important assets of our State for generations to come and investment in human services protects our most vulnerable populations. The capital improvement plan includes what are generally considered major capital projects, such as new construction, major reconstruction, remodeling, renovation, and so forth. These are projects that create new facilities or rebuild existing facilities. They would add or create value rather than protect the existing value. The plan also reflects planning funds provided to agencies to analyze the need and cost of projects proposed in later years. The capital improvement plan meets several of the criteria noted for sound practice and meets the goals of the administration concerning capital budgeting. The capital plan includes $4.919 billion from all sources of funding for projects across the State. Of the total budget a total of $2.823 billion is recommended for transportation projects, which encompasses 57.4 percent of all funding. The Governor’s capital budget recommendation continues to provide Rhode Island Capital Plan Fund (RICAP) financing in order to ensure a reliable and safe transportation system, which is critical to keeping the Rhode Island economy moving forward. RICAP provides $193.1 million or 29.7 percent of funding for Transportation. The recommendation continues to use a combination of RICAP funding and resources derived from various transportation-related licenses and fees to support the State match for the Department of Transportation’s Highway Improvement Plan (HIP), which is directed towards implementing the federal-funded capital program as identified in the Transportation Improvement Plan. A major
part of the HIP consists of the RhodeWorks plan focused on reducing the number of structurally deficient bridges in Rhode Island, from 22% in 2015 to 10% in 2025. The Governor also recommends a total of $470,588 from RICAP in FY 2018 for the Downtown Providence Transit Connector to match a discretionary Tiger Grant awarded to the Rhode Island Public Transit Authority to implement an enhanced transit corridor that will provide peak bus service through downtown Providence and connect passengers to the state’s largest employment hubs and major redevelopment area. The Governor also recommends the use of Department of Transportation gas tax funding to finance major RIPTA bus purchases in FY 2018. The Governor’s FY 2018 capital budget infuses RICAP investment in education infrastructure in both K-12 and higher education institutions. The functional area of Education is recommended to receive $552.6 million of all capital funding including $146.7 million from RICAP funds. A total of $3.7 million is recommended in FY 2018 for the creation of a new Center for Advanced Manufacturing at the William M. Davies Jr. Career and Technical High School. The Center, which will be open to all Rhode Island students, will offer multiple pathways into manufacturing and engineering careers. A total of $8.2 million is recommended in FY 2018, with additional funding through FY 2020 to continue the campus renewal project at the Knight Campus at the Community College of Rhode Island. A total of $6.1 million in FY 2018 and an additional $6.0 million in FY 2019 will allow for a phased modernization and rehabilitation of the academic buildings and $4.5 million in FY 2018 with $15.1 million through FY 2022 will modernize the infrastructure on the campus of Rhode Island College, including improving traffic circulation on campus. A total of $1.0 million FY 2018 will address the initial infrastructure needs of the Fine Arts Center of the University of Rhode Island. A total of $956.6 million from all sources is recommended for the Natural Resources function of which $36.5 million is from RICAP. Natural
1
Introduction
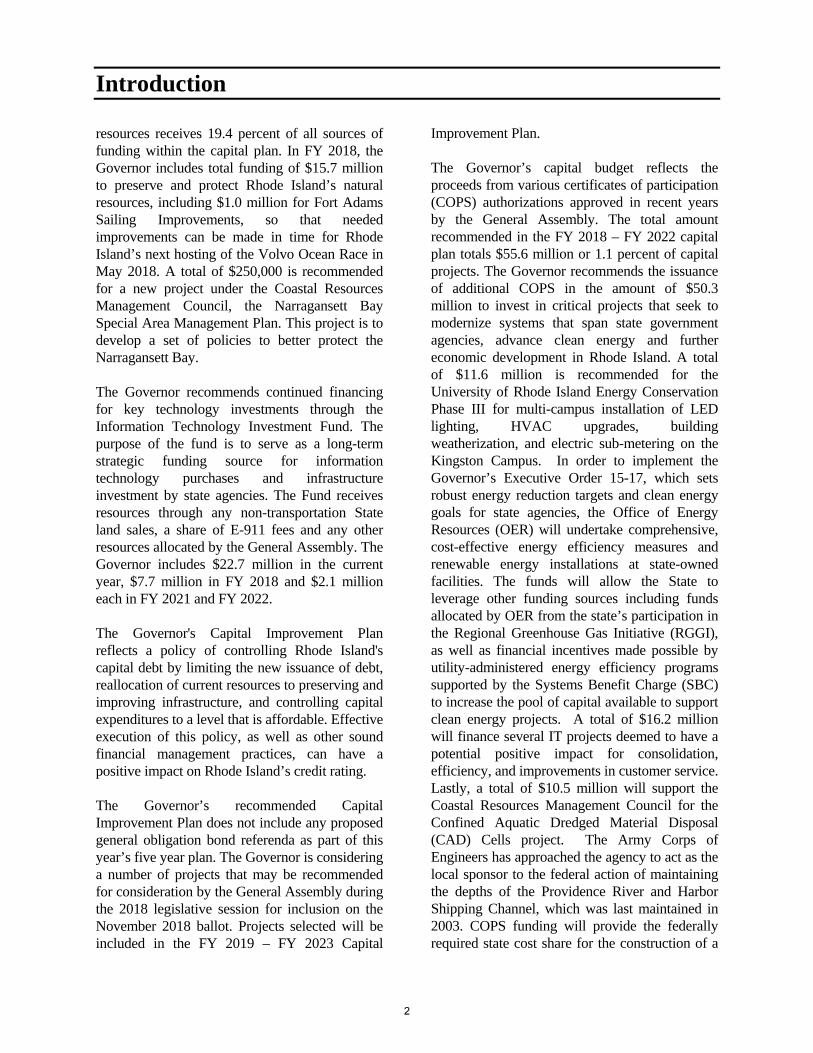
resources receives 19.4 percent of all sources of funding within the capital plan. In FY 2018, the Governor includes total funding of $15.7 million to preserve and protect Rhode Island’s natural resources, including $1.0 million for Fort Adams Sailing Improvements, so that needed improvements can be made in time for Rhode Island’s next hosting of the Volvo Ocean Race in May 2018. A total of $250,000 is recommended for a new project under the Coastal Resources Management Council, the Narragansett Bay Special Area Management Plan. This project is to develop a set of policies to better protect the Narragansett Bay. The Governor recommends continued financing for key technology investments through the Information Technology Investment Fund. The purpose of the fund is to serve as a long-term strategic funding source for information technology purchases and infrastructure investment by state agencies. The Fund receives resources through any non-transportation State land sales, a share of E-911 fees and any other resources allocated by the General Assembly. The Governor includes $22.7 million in the current year, $7.7 million in FY 2018 and $2.1 million each in FY 2021 and FY 2022. The Governor's Capital Improvement Plan reflects a policy of controlling Rhode Island's capital debt by limiting the new issuance of debt, reallocation of current resources to preserving and improving infrastructure, and controlling capital expenditures to a level that is affordable. Effective execution of this policy, as well as other sound financial management practices, can have a positive impact on Rhode Island’s credit rating. The Governor’s recommended Capital Improvement Plan does not include any proposed general obligation bond referenda as part of this year’s five year plan. The Governor is considering a number of projects that may be recommended for consideration by the General Assembly during the 2018 legislative session for inclusion on the November 2018 ballot. Projects selected will be included in the FY 2019 – FY 2023 Capital
Improvement Plan. The Governor’s capital budget reflects the proceeds from various certificates of participation (COPS) authorizations approved in recent years by the General Assembly. The total amount recommended in the FY 2018 – FY 2022 capital plan totals $55.6 million or 1.1 percent of capital projects. The Governor recommends the issuance of additional COPS in the amount of $50.3 million to invest in critical projects that seek to modernize systems that span state government agencies, advance clean energy and further economic development in Rhode Island. A total of $11.6 million is recommended for the University of Rhode Island Energy Conservation Phase III for multi-campus installation of LED lighting, HVAC upgrades, building weatherization, and electric sub-metering on the Kingston Campus. In order to implement the Governor’s Executive Order 15-17, which sets robust energy reduction targets and clean energy goals for state agencies, the Office of Energy Resources (OER) will undertake comprehensive, cost-effective energy efficiency measures and renewable energy installations at state-owned facilities. The funds will allow the State to leverage other funding sources including funds allocated by OER from the state’s participation in the Regional Greenhouse Gas Initiative (RGGI), as well as financial incentives made possible by utility-administered energy efficiency programs supported by the Systems Benefit Charge (SBC) to increase the pool of capital available to support clean energy projects. A total of $16.2 million will finance several IT projects deemed to have a potential positive impact for consolidation, efficiency, and improvements in customer service. Lastly, a total of $10.5 million will support the Coastal Resources Management Council for the Confined Aquatic Dredged Material Disposal (CAD) Cells project. The Army Corps of Engineers has approached the agency to act as the local sponsor to the federal action of maintaining the depths of the Providence River and Harbor Shipping Channel, which was last maintained in 2003. COPS funding will provide the federally required state cost share for the construction of a
2

Introduction
new CAD cell in order to store the removed sediment not suitable for ocean disposal. Increased disposal capacities from new CAD cells are needed to maintain viability of the port and maritime operations, the State’s marine trades industry, and the increased economic value of ProvPort soon-to-be derived from the newly approved 2016 Rhode Island Port Infrastructure bond authorization. A major source of state financing for capital projects is general obligation bonding. As of June 30, 2016, there were $1.051 billion in outstanding general obligation bonds. Over the five-year planning period, the recommended capital improvement plan provides for the issuance of $486.6 million of authorized debt, including the issuance of $227.5 million from the bond referenda approved by the voters in the November 2016 election. Funding from the newly authorized general obligation bonds includes financing for affordable housing, a University of Rhode Island affiliated innovation campus program, improvements to ProvPort and Quonset Davisville Port, and the completion of construction of a new Veterans Home, as well as funding from the Green Economy Bond for various natural resources improvements and initiatives. The capital budget also reflects debt issued to fund tax credits of the Historic Structures Tax Credit Program. During the 2008 Session of the General Assembly, $356.2 million of debt was authorized to be issued to pay for tax credits on Historic Structures, in order to stabilize out-year budget outlays. The Capital Budget assumes that the final debt under this authorization would be issued late in FY 2018.
3

Rhode Island Capital Plan Fund
Of the $4.919 billion recommended in the five year capital plan, a total of $650.9 million is financed by the Rhode Island Capital Plan Fund (RICAP), a pay-as-you go capital funding program, which has been a key factor in improving the state’s debt management policies.
Of the total RICAP funding in the capital improvement plan 29.7 percent finances transportation projects. A total of 5.6 percent of RICAP funding is dedicated to protecting natural resources, while 22.5 percent finances education-related projects and 23.3 percent of RICAP funding is directed towards improvements to buildings under general government agencies. A total of 14.6 percent finances public safety agency capital projects and 4.2 percent finances agency projects within human services. There are a number of projects, however that are financed under the newly created the Division of Capital Asset Management and Maintenance program (DCAMM) within the Department of Administration, which oversees projects for agencies across the different functions of government. The RI Capital Plan Fund’s resources in FY 2017 include an opening balance of $152.7 million and
current year resources flowing from the Budget Reserve Fund of $113.9 million. It is estimated that combined resources will total $266.6 million and that recommended expenditures of $180.7 million will leave a balance of $85.9 million at the end of FY 2017. For FY 2018, the opening balance of $85.9 million will be enhanced by $116.1 million flowing from the Budget Reserve Fund providing estimated resources of $202.1 million. After providing for $182.4 million of recommended expenditures, there would be an ending unallocated balance in FY 2018 of $19.6 million. In the enacted FY 2017 Budget, the Capital Projects and Property Management and Facilities Management programs were merged into the newly created Division of Capital Asset Management and Maintenance program (DCAMM). This Division has been tasked to increase the level of facility maintenance throughout the State for facilities under its purview. The merger encourages higher levels of service with more consistency and redundancy. Anticipated outcomes also entail a better alignment of staff resources and clarification of roles and responsibilities in order to support the State’s portfolio such that cost savings and efficiencies are achieved. In order to provide the flexibility this new division will need in its management of statewide projects the Governor recommends the consolidation of major RICAP funded projects under DCAMM’s oversight into five major project categories including Environmental, State Facility, Pastore Center Campus, State House Asset Protection and Capitol Hill Campus. This new consolidation is reflected in the FY 2018 Budget under the Department of Administration. Included in the consolidations is the transfer of oversight of the Shephard Building project from the University of Rhode Island to DCAMM. This capital plan addresses the Governor's desire to continue targeting current resources to infrastructure needs in the State. In order to maintain state-owned property, ensure the safety of those who use these buildings and preserve the
4

Rhode Island Capital Plan Fund
value of the properties, the Governor recommends in excess of $531.0 million over the five year capital improvement plan from the Rhode Island Capital Plan Fund for asset protection projects. Under the Governor’s plan, over $160.0 million will be dedicated from this fund in FY 2018 to infrastructure needs. Adoption of a responsible asset protection program will help reduce Rhode Island's debt burden in the future when allocated funds are available to fund not only asset protection projects, but also new construction. Schedule 4, Projects by Funding Source, includes the Governor's recommended use of resources from the Rhode Island Capital Plan Fund, as well as all other resources available for capital disbursements. Schedule 5, Rhode Island Capital Plan Fund Projects, reflects only those projects funded by RI Capital Plan Fund resources.
5

Classification of State Debt
The State of Rhode Island has traditionally classified its general obligation debt in the following four categories: direct debt, guaranteed debt, contingent debt and other obligations subject to appropriation. These fall into the broader category of tax supported debt used by investment rating agencies. Within the category of obligations subject to annual appropriations, there are certain performance-based agreements associated with debt issued to promote economic development. Generally speaking, the State’s requirement to make appropriations on these obligations is based upon achievement of certain predetermined benchmarks that would increase state tax revenues.
RI Credit Rated by Three Major Credit Agencies
The State’s general obligation debt is rated by the three major credit rating agencies. All three agencies have reviewed the State of Rhode Island on a regular basis since FY 2008, reflecting the concerns that the agencies had relating to economic and budgeting challenges facing Rhode Island. Across the nation, state credits have been under stress reflecting the economic and revenue deterioration that has strained state finances. As of January 2017, Rhode Island’s ratings were:
Moody’s Rating – Aa2 (stable)
Fitch Rating - AA (stable) Standard & Poor’s – AA (stable)
Debt Service Budgeted
Debt service and payments on long-term obligations from all fund sources, including the portion of the gas tax, and federal highway funds dedicated for debt service for FY 2017, is estimated to total $223.8 including: $95.7 million for general obligation debt service, $22.5 million for the Convention Center Authority obligations, $9.1 million for motor fuel debt service, $19.1 million for federally funded GARVEE debt service, $36.3 million for
certificates of participation and long-term obligations, $31.0 million for debt associated with the Historic Tax Credit program, $0.6 million for debt associated with the purchase of I-195 land by the I-195 District Redevelopment Commission and $7.0 million for performance-based obligations. The Governor’s recommended FY 2018 Budget includes zero dollars to restore the Capital Reserve Fund of the EDC Job Creation Guaranty (38 Studios) program because the fund is fully funded as a result of legal settlement receipts. Direct debt is authorized by the voters as general obligation bonds and notes. Current interest bonds require the State to make annual payments of principal and semi-annual payments of interest on bonds outstanding, and the capital appreciation bonds of the State require the payment of principal and interest at maturity. As of July 1, 2016, the State had $1,051.8 billion of general obligation tax supported bonds outstanding. Authorized but unissued direct debt totaled $486.6 million as of January 1, 2017. Those amounts are displayed in Appendix F, which displays authorized but unissued debt. The Governor recommends that $92.0 million be issued in FY 2017 for FY 2017 projects and $132.2 million in FY 2018 for FY 2018 projects. (See Appendix C for debt service payments). Guaranteed debt includes bonds and notes issued by, or on behalf of, certain agencies, commissions and authorities created by the General Assembly and charged with enterprise undertakings, for the payment of which debt the full faith and credit of the State are pledged in the event that the revenues of such entities may at any time be insufficient. As of January 1, 2016, there was no outstanding or authorized but unissued guaranteed debt. Contingent debts are those debts or obligations of certain Rhode Island agencies for which the state has pledged its full faith and credit. Such debt includes mortgages insured by the Rhode Island Industrial-Recreational Building Authority.
6

Classification of State Debt
Voter approval enabled the Authority to pledge the State's full faith and credit up to $80,000,000, reduced by the General Assembly in 2008 to $20,000,000 and increased back to $60,000,000 in 2010 for the following purposes: to insure eligible mortgages for new construction, acquisition, and rehabilitation or expansion of facilities used for manufacturing, processing, recreation, research, warehousing, retail, wholesale or office operations. New or used machinery, equipment, furniture, fixtures or pollution control equipment required in these facilities is also authorized for mortgage insurance. Mortgages insured by the Authority are limited to certain specified percentages of total project cost. The Authority is authorized to collect premiums for its insurance and to exercise rights of foreclosure and sale as to any project in default. As of June 30, 2015, the Authority had outstanding mortgage agreements and other commitments for $11,335,020 mainly in connection with revenue bonds issued by the Rhode Island Industrial Facilities Corporation. In accordance with Rhode Island law, all premiums received by the Authority and all amounts realized upon foreclosure or other proceeds of defaulted mortgages are payable into the Industrial Recreational Building Mortgage Insurance Fund. All expenses of the Authority and all losses on insured mortgages are chargeable to this Fund. As of June 30, 2015, the Fund had a balance of $2,555,979. The State has agreed to appropriate or borrow and pay to the Authority any amounts required to service insured loans that are in default should the Fund be insufficient. Other Obligations Subject to Appropriation Rhode Island has entered into certain contractual agreements, which although of a long-term nature, are subject to annual appropriation by the General Assembly. A brief description of such commitments for which the state has or may appropriate funds for debt payments is provided
below.
Shepard’s Building Certificates In November 1994, the State entered into a lease agreement with the Economic Development Corporation, which issued $34.1 million in long-term bonds for the renovation of the Shepard’s Building. In August 1997, the State refunded the EDC debt through the issuance of $34,805,000 in certificates of participation. In December 2007, the State refunded the outstanding balance of these certificates to achieve debt service savings. As of June 30, 2016, $2,940,000 in certificates of participation were outstanding. (See Appendix C for debt service payments.)
Department of Labor and Training
Center General Renovations The State also entered into a lease agreement with a financial institution which issued $24.0 million in certificates of participation in January 1997 to finance the renovation of a group of buildings at the State-owned John O. Pastore Center, formerly known as Howard Center in Cranston for use as an office facility for the Department of Labor and Training. In December 2007, the State refunded the outstanding balances on these certificates to achieve debt service savings. As of June 30, 2016, $930,000 of such certificates were outstanding. (See Appendix C for debt service payments.)
Pastore Center Complex Central Power Plant
In December 2000, Rhode Island entered into a lease agreement with a financial institution that issued $28.18 million in certificates of participation to rehabilitate and upgrade the Central Power Plant at the Pastore Center Complex. $3,875,000 of these certificates of participation were defeased in June 2002 from the proceeds of the securitization of revenues from the State’s tobacco master settlement. All of the remaining certificates of participation were
7
Classification of State Debt
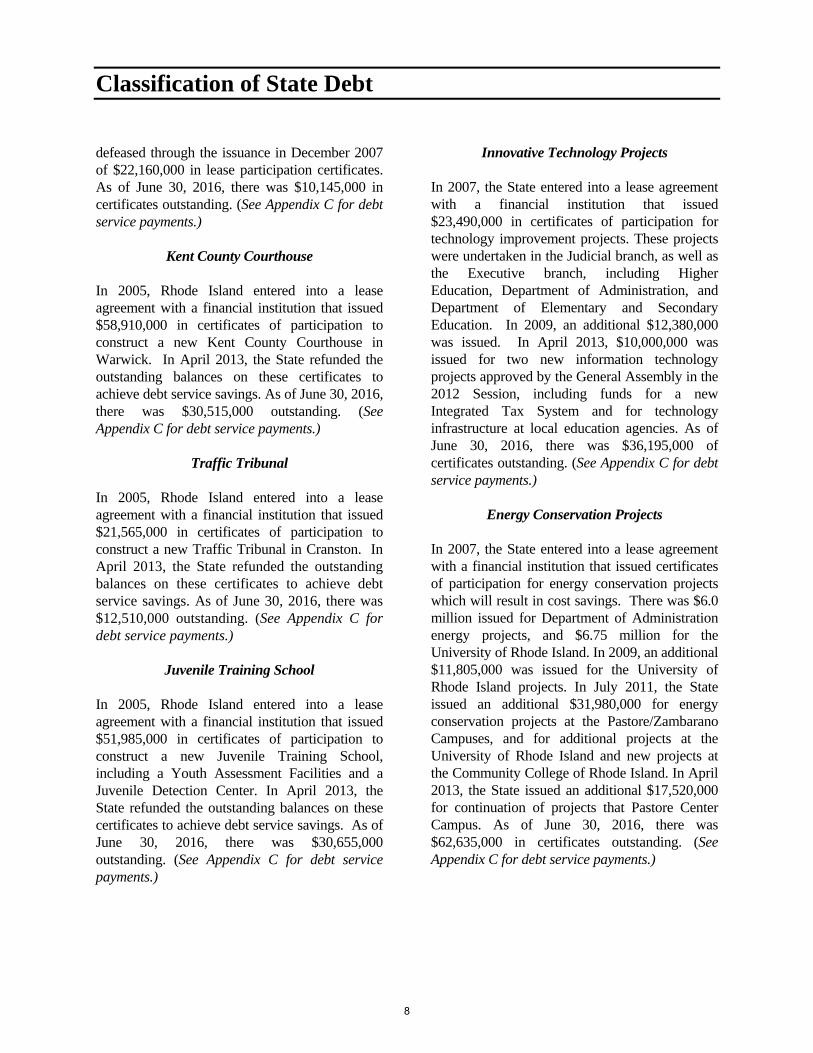
defeased through the issuance in December 2007 of $22,160,000 in lease participation certificates. As of June 30, 2016, there was $10,145,000 in certificates outstanding. (See Appendix C for debt service payments.)
Kent County Courthouse In 2005, Rhode Island entered into a lease agreement with a financial institution that issued $58,910,000 in certificates of participation to construct a new Kent County Courthouse in Warwick. In April 2013, the State refunded the outstanding balances on these certificates to achieve debt service savings. As of June 30, 2016, there was $30,515,000 outstanding. (See Appendix C for debt service payments.)
Traffic Tribunal In 2005, Rhode Island entered into a lease agreement with a financial institution that issued $21,565,000 in certificates of participation to construct a new Traffic Tribunal in Cranston. In April 2013, the State refunded the outstanding balances on these certificates to achieve debt service savings. As of June 30, 2016, there was $12,510,000 outstanding. (See Appendix C for debt service payments.)
Juvenile Training School In 2005, Rhode Island entered into a lease agreement with a financial institution that issued $51,985,000 in certificates of participation to construct a new Juvenile Training School, including a Youth Assessment Facilities and a Juvenile Detection Center. In April 2013, the State refunded the outstanding balances on these certificates to achieve debt service savings. As of June 30, 2016, there was $30,655,000 outstanding. (See Appendix C for debt service payments.)
Innovative Technology Projects In 2007, the State entered into a lease agreement with a financial institution that issued $23,490,000 in certificates of participation for technology improvement projects. These projects were undertaken in the Judicial branch, as well as the Executive branch, including Higher Education, Department of Administration, and Department of Elementary and Secondary Education. In 2009, an additional $12,380,000 was issued. In April 2013, $10,000,000 was issued for two new information technology projects approved by the General Assembly in the 2012 Session, including funds for a new Integrated Tax System and for technology infrastructure at local education agencies. As of June 30, 2016, there was $36,195,000 of certificates outstanding. (See Appendix C for debt service payments.)
Energy Conservation Projects In 2007, the State entered into a lease agreement with a financial institution that issued certificates of participation for energy conservation projects which will result in cost savings. There was $6.0 million issued for Department of Administration energy projects, and $6.75 million for the University of Rhode Island. In 2009, an additional $11,805,000 was issued for the University of Rhode Island projects. In July 2011, the State issued an additional $31,980,000 for energy conservation projects at the Pastore/Zambarano Campuses, and for additional projects at the University of Rhode Island and new projects at the Community College of Rhode Island. In April 2013, the State issued an additional $17,520,000 for continuation of projects that Pastore Center Campus. As of June 30, 2016, there was $62,635,000 in certificates outstanding. (See Appendix C for debt service payments.)
8

Classification of State Debt
School for the Deaf In June 2009, the State entered into a lease agreement with a financial institution that issued $30,425,000 of certificates of participation for the construction of a new School for the Deaf. As of June 30, 2016, there was $22,775,000 outstanding. (See Appendix C for debt service payments.) Rhode Island Convention Center Authority Rhode Island has entered into a lease agreement with the Rhode Island Convention Center Authority, a public corporation that was created for the purpose of constructing, managing and operating a convention center. Pursuant to the lease agreement, the State will be obligated to pay lease payments to the Authority sufficient to pay for the net operating expenditures and debt service on the Authority's bonds relating to the project being financed. The Authority issued bonds for project expenditures totaling $323,000,000. Including refunding bonds that were issued to save interest costs, and the issuance in June 2006 of $92.5 million of bonds to finance acquisition and renovation costs of the Dunkin Donuts Center, defeasance of $90.085 million in May 2005. In March 2009, the Authority refunded its 2001 Series A bonds with the issuance of $71.2 million of bonds. In March 2013, the Authority undertook a new refunding to achieve additional debt service savings. In FY 2017 and FY 2018, the Governor recommends a general revenue appropriation of $22.5 million and $21.6 million, respectively. This includes debt service relating to the Dunkin Donuts Center Improvements and assumes debt service savings from a refunding transaction in the Spring of 2015. Outstanding debt totaled $203,880,000 as of June 30, 2016. (See Appendix C for debt service payments)
Rhode Island Commerce Corporation (formerly Economic Development Corporation)
In 1999, the Economic Development Corporation issued revenue bonds in the amount of $16,395,000 to finance improvements to the University of Rhode Island power plant. These bonds are supported by payments to purchase steam over the life of the bonds. Debt service on these bonds is funded by the University. As of June 30, 2016, $4,585,000 of such bonds was outstanding. (See Appendix C for debt service payments.)
GARVEE/Motor Fuel Tax Revenue Bonds In November 2003, Rhode Island entered into a payment agreement with the Rhode Island Economic Development Corporation relating to the issuance of $53,030,000 of Motor Fuel Tax Revenue Bonds to provide funds for the State match for certain major Transportation projects funded by GARVEE bonds also issued by the Corporation. The Motor Fuel Tax Revenue Bonds are secured by two cents of the motor fuel tax dedicated to the Department of Transportation, subject to annual appropriation. In March 2006, a second series of bonds totaling $42,815,000 was sold. In April 2009, a third series was issued totaling $12,410,000. As of June 30, 2016, $53,965,000 was outstanding. (See Appendix C for debt service payments.) The GARVEE bonds, which are secured by federal funds made available to the Department of Transportation, are not considered part of the State’s net tax supported debt. As of June 30, 2016 there was $476,205,000 outstanding which are supported by federal revenues. (See Appendix H for debt service payments.)
Performance Based Obligations of the Rhode
Island Commerce Corporation (formerly Economic Development Corporation)
Fidelity
In May 1996, the Economic Development Corporation issued $25,000,000 of bonds to finance infrastructure for Fidelity Investments.
9

Classification of State Debt
These bonds carry a moral obligation of the state. If at any time, certain reserve funds of the Economic Development Corporation pledged for this bond issue fall below their funding requirements, a request will be made to the General Assembly to appropriate the amount of the deficiency. In addition, pursuant to the lease the Economic Development Corporation entered into with FMR Rhode Island, Inc. to secure the bonds, credits are provided for lease payments if certain targeted new job goals are met for the financed project. Currently, it is projected that these job goals will be met. If the job goals are met, the Economic Development Corporation will credit FMR Rhode Island, Inc.'s lease payments and make annual requests to the General Assembly for appropriations, which will be used to pay the debt service on this bond issue. In May 2002, an additional $10.0 million of bonds with similar provisions were issued. As of June 30, 2016, $17.2 million of Fidelity bonds were outstanding. As shown on the EDC-Fidelity debt service schedule, job rent credits are expected to result in a state obligation of $3.4 million in FY 2017 including $2.5 million for Phase I, plus $954,053 due on Phase II. (See Appendix C for obligations.)
Bank of America (Fleet)
In November 1997, the Economic Development Corporation entered into a similar agreement with Fleet Bank (subsequently acquired by Bank of America); bonds issued for that transaction totaled $11.0 million. As of June 30, 2016, $6,950,000 of Fleet bonds were outstanding. Under the lease agreement with Fleet, job rent credits are applied against lease payments if certain targeted new job goals are met for the financed project. The company has never reported jobs levels in excess of the base number of jobs (approx. 3,900). Job rent credits, if maximized, are estimated to result in a State obligation of approximately $945,000 per year.
Providence Place Mall In May 2000 the Rhode Island Economic Development Corporation issued revenue note obligations in the amount of $40,820,000 to finance a portion of the costs of the Providence Place Mall. Such financing will be supported by two-thirds of the sales taxes generated at the mall (up to a cap of $3.68 million in years 1-5, and $3.56 million in years 6-20) as provided in the Mall Act (R.I.G.L. § 42-63.5-1 et. seq.) enacted by the General Assembly in 1996 and by Public Investment and HOV Agreement. It is expected that sales tax revenues generated at the Mall will be sufficient to fully support the revenue note obligations. Sales tax generated at the Mall are recorded as general revenues. The State is not obligated to fund the note payments if the sales tax generated is not sufficient. As of June 30, 2016, $20,340,000 was outstanding. (See Appendix C for obligations.) Rhode Island Commerce Corporation (formerly
Economic Development Corporation) – Job Creation Guaranty
In November 2010, the Corporation issued $75.0 million of taxable revenue bonds under the Job Creation Guaranty Program. The bond proceeds were loaned to 38 Studios, and provided funding for relocation of the company’s corporate headquarters to Rhode Island and establishment and operation of a video gaming studio in the City of Providence. Proceeds also were used to fund a Capital Reserve Fund and Capitalized Interest Fund. Amounts in the Capital Reserve Fund are to be used in the event that 38 Studios fails to make any required loan payments. In June 2012, 38 Studios filed for Chapter 7 bankruptcy protection and thus is not expected to make debt service payments when due. As a result, the Capital Reserve Fund is expected to be drawn down and the State asked to restore the fund. In accordance with the enabling legislation and the agreement between the Economic Development Corporation, the trustee and 38
10

Classification of State Debt
Studios, should amounts in the Capital Reserve Fund fall below minimum requirements, the Economic Development Corporation has agreed to present the Governor with a certificate stating the amounts required to restore any shortfall and the Governor is required to include such amounts in his or her budget request for appropriation to the General Assembly. The General Assembly may but is not required to appropriate such amounts. The Governor has included $2.5 million in the FY 2017 budget and zero dollars, due to available to legal settlement proceeds, in the FY 2018 recommended budget, which will be sufficient, when combined with resources in the debt service reserve fund, to pay the required debt service in both fiscal years. An additional $6,500,000 in guarantees has been issued under the Job Creation Guaranty program for other companies through June 30, 2013, of which $2,066,667 million is outstanding as of June 30, 2016. The General Assembly repealed the authority of the Job Guaranty Program in the 2013 Session and thus the Corporation can make no further loans. Rhode Island Commerce Corporation (formerly
Economic Development Corporation) – Historical Structure Tax Credit
In June 2009, the State entered into a payment agreement with the Rhode Island Economic Development Corporation relating to the issuance of Economic Development Corporation Revenue Bonds in the amount of $150,000,000 to provide funds to reimburse the State for Historic Structures Tax Credits presented by taxpayers. In March 2015, the State entered into a new payment agreement with the Rhode Island Commerce Corporation relating to the bank loan entered into by the Corporation in the amount of $75,000,000. As of June 30, 2016, there was $106,995,000 of such debt is outstanding.
Rhode Island Commerce Corporation (formerly Economic Development Corporation)
I-195 Redevelopment District In April 2013, the Economic Development Corporation entered into two loans with Sovereign Bank in the amounts of $37,440,000 (tax-exempt) and $960,000 (taxable) to provide funds for the purchase of land from the Department of Transportation made available from the relocation of I-195 in Providence. Interest only will be due on this loan for the first five years. Principal is amortized over a twenty year schedule beginning in year six (6), with a balloon payment in year ten (10). The initial loan is for ten (10) years, with an option to extend for an additional ten (10) years. As of June 30, 2016, there was $38,400,000 of this loan outstanding.
11

Tax Supported Debt Burden
In the determination of the debt burden of the State of Rhode Island, the rating agencies take into account all tax supported debts which are or could be a future liability of the state. Therefore, the definition of "tax supported debt" is more expansive than the strict "voter approved" general obligation category. In Rhode Island's case, the State has indirectly extended its credit to quasi-public agencies and authorities, such as the Rhode Island Convention Center Authority, through lease arrangements. The amount of debt reflected is that which is defined by Moody's Investors' Service in their credit report as the debt outstanding that could potentially be a liability of the State. It, therefore, does not reflect offsets that will reduce the State's payments on these debts, such as debt service reserve funds, interest earnings, and other revenue that could reduce the State's liability. Rhode Island's net tax supported debt totaled $1.680 billion as of June 30, 2016. In evaluation of the Rhode Island's credit, the rating agencies review the State's ability to repay the debt and all factors that could affect the issuer's ability to make debt service payments (i.e., economy, budgetary issues, management team, debt structure etc.). The projection of capital project disbursements and debt service costs reflect updated debt service projections as included in the FY 2018 – FY 2022 Capital Improvement Plan. General revenue funded debt service on all tax supported obligations is projected to rise from $141.9 million in FY 2017 to $175.4 million in FY 2018, and to $188.0 million in FY 2022. The five year forecast is based upon outstanding debt and projected new debt contained in the Governor’s recommended FY 2018 - 2022 Capital Improvement Plan. Executive Order 95-4, relating to state debt requires all issuances of state debt requiring the approval of the Governor to be reviewed by the State Budget Office. The role of the Budget
Office is to advise the Governor of the direct and potential impact of such debt issuance on the state's tax supported debt and its credit rating. An examination of Rhode Island’s projection of net tax supported debt shows evidence that this businesslike approach to capital planning and management has reaped results. The Governor’s Capital Budget is within the recommended debt guidelines set by the Public Finance Management Board with regards to debt ratios. The projected ratio of debt service to general revenues is well within the recommended guideline of 7.5 percent. The FY 2017 ratio is 5.19 percent, which is projected to increase to 5.81 percent in FY 2019 and is projected to decrease to 5.56 percent by FY 2022. The low percentages in the early years of the plan are the result of the debt restructuring/refinancing completed in July 2015. This lowered the amount of debt service due in FY 2016 and FY 2017, but will result in an increase in debt service in later years. In addition, the state’s general revenue receipts have strengthened in recent years and the out-year forecast reflects a continuing economic recovery. For FY 2018 the Governor recommends debt service funding from all sources of $222.3 million for debt and other long term obligations, including: $129.4 million for general obligation debt service, $21.6 million for the Convention Center obligation, $9.1 million for motor fuel debt service, $23.6 for federally funded GARVEE debt service, $32.5 million for certificates of participation and long-term obligations, and $7.0 million for performance-based obligations. A detailed listing of these obligations can be found in Appendix C, and the long-term projections are shown in the following chart.
12

Tax Supported Debt Burden
13

Tax Supported Debt Burden
Debt as Percentage of Personal Income The ratio of debt to personal income is well within the recommended 5.0 to 6.0 percent guideline. Furthermore, the Governor's recommended capital budget will result in improvement to the State's ratio of debt as a percentage of personal income, which is expected to decline from 7.02 percent in FY 1996 to 3.13 percent in FY 2017, and projected to further decrease to 2.28 percent by FY 2022.
14

Tax Supported Debt Burden
15

General Obligation Debt Authorization
The State of Rhode Island has $486.6 million of authorized but unissued general obligation debt as of January 1, 2017. These authorizations have been approved by the voters at various referenda. Under the Constitution of Rhode Island, the General Assembly has no power to incur debts in excess of $50,000 without consent of the people, except in the case of war, insurrection or invasion or to pledge the faith of the state to the payment of obligations of others without such consent. By judicial interpretation, the limitation stated above has been judged to include all debts of the state for which its full faith and credit are pledged, including general obligation bonds and notes, bonds and notes guaranteed by the state and debts or loans insured by agencies of the state such as the Industrial-Recreational Building Authority. Since 1979, the voters have authorized $3.383 billion of general obligation bonds. Of this authorization, 31.28 percent or $1.058 billion has been for Transportation purposes; 24.53 percent or $829.6 million was for Natural Resource purposes. Education reflected 22.27 percent of the total amount authorized or $753.2 million. Of the total $486.6 million of unissued debt, 7.09 percent or $34.5 million remains unissued for Transportation purposes, 17.59 percent or $85.6 million is for Natural Resources and 45.11 percent or $219.5 million remains unissued for Education purposes. Due to concern about the increasing level of authorized but unissued debt, the General Assembly enacted a sunset provision relating to general obligation bond authorizations. Chapter 438 of the Public Laws of 1988, which took effect on December 31, 1991, provides that any special act of the State that authorizes the issuance of general obligation bonds or notes of the State, which has a balance that remains unissued, and is seven (7) years or older is invalid as to that portion which remains unissued. Notwithstanding, the General Assembly may, by special act, extend any authorization for a period of one (1) to five (5) years upon a petition of the Department of Administration. Such extension may be granted more than one (1) time. Upon a
certification of the General Treasurer to the Governor as to debt authorizations described above and no longer extended, the authorization shall not be deemed or counted toward the authorized but unissued debt of the state. As of January 1, 2017, $142.6 million of authorized debt has been extinguished or reallocated by law. The following graphs exhibit a historical perspective of Rhode Island’s debt by functional category including the amount of bond authorizations and amount of general obligation bonds issued (cash proceeds received) since 1979 by functional category for the various functions of state government. Transportation, Natural Resource, and Education projects benefited by the highest percentage of issued bond proceeds, reflecting 37.16 percent of the total amount issued for Transportation, 26.48 percent for Natural Resources, and 19.12 percent for Education. Issued proceeds received for Transportation projects totaled $1.022 billion while Natural Resource projects received $728.7 and Education projects received $526.0 million. The final graph displays the amounts that remain authorized but unissued as of January 2017.
16

General Obligation Debt Authorization
17

General Obligation Debt Authorization
18

Public Finance Management Board
The FY 2017 budget as enacted expanded the responsibilities of the Public Finance Management Board (PFMB), and created an Office of Debt Management within Treasury that aims to improve the issuance, oversight, and management of publicly-supported debt in Rhode Island. The PFMB’s new requirements are intended to improve the fiscal stability of Rhode Island and its many public debt issuers. Beginning January 1, 2017, the PFMB is now required to annually report the total amount of public state, regional, municipal, public and quasi-public corporation, and fire district and other special district debt authorized, sold and unsold. The PFMB is also required to undertake a debt affordability study, which must include recommended limits for debt capacity at least every two (2) years for each public issuer. Also, the law requires issuers of public debt, by the end of each fiscal year, to provide to the PFMB the following information for each outstanding debt incurred:
the principal amount of the outstanding issue;
the amount of proceeds of the issue that remains unspent;
the amount of debt authorized by the bond act or other appropriate authorization relevant to the issue that remains authorized but unissued; and
a list of purposes for which the debt has been issued and the amounts expended for each purpose in the prior fiscal year.
Lastly, to support these new PFMB functions, the PFMB has amended its Rules and Regulations to assess the statutory fee of 1/40th of 1% to the lead underwriter or purchaser of any taxable or tax exempt debt issue of the state, all state departments, any city or town, any state, municipal and regional authorities, agencies, boards, commissions, public or quasi-public corporations, and fire districts and other special districts.1 This fee will now also be assessed on refunding issuances as well. Taken together, these recent legislative changes empower the Public Finance Management Board, staffed by the office of the General Treasurer, to create systemic reform of public debt management and oversight in Rhode Island. Historically, the Public Finance Management Board released an annual report on Rhode Island debt. First issued in December 1998, this study provided a historical perspective of the State of Rhode Island’s tax supported and other debt, and recommended certain credit guidelines to monitor state debt. The board adopted several guidelines, which were later amended in March 2000. As part of the newly enacted PFMB requirement to produce a debt affordability study, the following guidelines are being reviewed for potential revision.
1 However, if a governmental entity is the purchaser of another governmental debt obligation which serves as underlying security for a related debt issuance, the governmental entity shall be exempt from the assessment.
19

Public Finance Management Board
Credit Guideline 1: Tax Supported Debt should not exceed 5.0 to 6.0 percent of personal income, and annual debt service for Tax Supported Debt should not exceed 7.5 percent of state general revenues. Explanation: Tax Supported Debt is a state’s core debt. General revenues and taxes secure this debt. The credit rating of the largest component of Tax Supported Debt, general obligation bonds, is the benchmark for the credit rating for several other state debt issuers. The recommended limits on the total amount of debt and the burden on the state’s budget are based on a combination of factors including historical trends in Rhode Island and ratios of peer states. Credit Guideline 2: The Board should monitor the total amount of Tax Supported Debt, State Supported Revenue Debt, and Agency Revenue Debt in relation to Rhode Island’s personal income levels. Explanation: These three types of debt are directly payable from or represent a contingent obligation/relationship on the state’s financial resources. Overall levels should be monitored so that trends in the total amount and the relative levels of each are understood. Credit Guideline 3: If a Guideline is exceeded due to economic or financial circumstances or if the Governor and the Legislature determine that extraordinary infrastructure needs exist, the Board should request that the Governor and
the Legislature recommend a plan to return debt levels to the Guideline within 5 years. Explanation: The Credit Guidelines may be exceeded temporarily under certain extraordinary conditions. If exceeded, the state should take steps to return debt levels to recommended levels within a manageable period of time. The Capital Budget presents these guidelines and the projected debt ratios resulting from the Governor’s recommended Capital Budget. As can be seen in the section entitled “Tax Supported Debt Burden”, the recommended Capital Budget projects a ratio of debt to personal income which is well within the recommended 5.0 to 6.0 percent guideline, decreasing from 3.4 percent in FY 2018 to 2.28 percent in FY 2022. The projected ratio of debt service to general revenues is less than the recommended guideline capped at 7.5 percent in all years projected. It is projected to range between 5.76 percent and 6.45 percent over the five-year planning horizon. The low percentages in the early years of the plan are the result of the debt restructuring/refinancing completed in July 2015. This lowered the amount of debt service due in FY 2016 and FY 2017, but will result in an increase in debt service in later years. In addition, the state’s general revenue receipts have strengthened in recent years and the out-year forecast reflects a continuing economic recovery. The Administration and Treasury will continue to take such actions that will reduce debt service obligations and will closely monitor the growth of debt service expenditures.
20

General Government
Department of Administration Executive Office of Commerce
Department of Labor and Training Department of Revenue
Secretary of State Public Utilities Commission


Department of Administration
Agency Responsibilities The Department of Administration manages capital projects coordinated by the new Division of Capital Asset Management and Maintenance, the Division of Information Technology, the Water Resources Board, and through agreement with the Rhode Island Convention Center Authority. Division of Information Technology The Division of Information Technology (DoIT) manages and supports all day-to-day operations of the State’s technology infrastructure, telecommunications, and associated applications as well as the implementation of all new and mission critical technology infrastructure projects and upgrades for state agencies. DoIT oversees the Information Technology Investment Fund to determine the eligibility of expenditures from the fund. This includes hardware and software purchases and/or development, information technology consulting services, and ongoing maintenance contracts. Division of Capital Asset Management and Maintenance – The FY 2017 budget merged the Divisions of Facilities Management and Capital Projects and Property Management into a new Division of Capital Asset Management and Maintenance (DCAMM). This new division is responsible for coordinated facilities management for state departments and agencies, including, but not limited to: operation, maintenance and repair of buildings, grounds, central HVAC, power plants and other facilities. In addition, the Division is responsible for planning, designing and constructing new state facilities and major renovations to existing buildings. Some of the facilities that DCAMM oversees include the State House, the William Powers Building (Department of Administration), the Cannon Building (Department of Health), the State Office Building (Department of Transportation), and various other structures. This program also has responsibility for most of the facilities at the Pastore Government Center in Cranston and Zambarano Campus in Burrillville.
In FY 2018 Budget, the DCAMM section of capital projects merges projects under categories in order to give the Division more flexibility in spending between projects in the event of emergencies and/or ability to move certain projects further along at a quicker rate than previously anticipated. These categories are Capitol Hill Campus Projects, Environmental Projects, State Facility Projects, Pastore Center Campus Projects, State House Asset Protection Projects, and Zambarano Campus Projects. Water Resources Board – The Rhode Island Water Resources Board was established by RIGL 46-15 and is now organized under the Division of Planning in the Department of Administration. The Water Resources Board supports the proper development, protection, conservation, and use of the State’s water resources while providing for economic development and protection for the environment. Rhode Island Convention Center Authority – The Rhode Island Convention Center Authority manages three Rhode Island Capital Fund projects in agreement with the Department of Administration. These projects are budgeted for under the Department of Administration. The projects include upgrades to the Convention Center, Dunkin’ Donuts Center, and Veterans’ Memorial Auditorium, all of which are located in Providence. Governor's Recommendations Division of Information Technology Information Technology Investment Fund - The Governor recommends expenditures of $37.9 million in restricted receipts from the Information Technology Investment Fund. This fund serves as the long-term term strategic funding source for information technology improvement purchases and infrastructure investment by state agencies. The fund was established by the 2011 General Assembly and is supported by cash inflows from the sale of state real properties and equipment, federal awards, private donations, and state appropriations pursuant to RIGL 42-11-2.5. The Division of Information Technology (DoIT) and
21

Department of Administration
Office of Digital Excellence (ODE) administers the review, selection, and monitoring of potential projects through adoption of rules and regulations in order to provide for orderly and equitable disbursements from the fund. The Governor recommends expenditures of $22.7 million in FY 2017, $7.7 million in FY 2018, $3.3 million in FY 2019, and $2.1 million annually in FY 2020 and FY 2021 assuming resources are available in the fund. IT Strategic Plan – The Governor recommends $16.2 million from Certificates of Participation from FY 2018 through FY 2021 to fund Information Technology projects that had been reviewed by Enterprise Technology Strategy and Services (ETSS). These requests were prioritized based on the potential positive impact for consolidation, efficiency, improvement of customer services, and the need for ongoing technical support. Projects in line for funding include the replacement and development of hospital information systems, electronic medical records platform, and patient case management tracking systems; the development of a vital records system; the expansion of the new tax integrated system; and a new state payroll system. Division of Capital Asset Management and Maintenance Capitol Hill Campus Projects Chapin Health Laboratory – The Governor recommends expenditures of $6.8 million from the Rhode Island Capital Plan Fund for infrastructure upgrades at the Chapin Health Laboratory. Project repairs address inadequate mechanical ventilation and upgrades to the existing electrical and HVAC systems and components that deliver insufficient service. The Governor recommends Rhode Island Capital Plan Fund expenditures of $750,000 in FY 2017 and $6.1 million in FY 2018. Expenditures prior to FY 2017 total $333,399. Cannon Building – The Governor recommends expenditures of $9.1 million from the Rhode Island Capital Plan Fund (RICAP) for repairs and renovations to the Cannon Building, which
houses all of the Department of Health functions except for the Health Laboratory and State Medical Examiner. The upgrades include restroom renovations, installation of LED fixtures, a new standby generator, installation of new windows, and electrical panel rebalance and floor outlet repositioning. The Governor recommends RICAP expenditures of $400,000 in FY 2017; $700,000 in FY 2018; $600,000 in FY 2019; $350,000 in FY 2020, and $3.5 million each in FY 2021 and FY 2022. Expenditures prior to FY 2017 total $2.6 million in RICAP resources. State Office Building – The Governor recommends expenditures of $6.7 million from the Rhode Island Capital Plan Fund for renovations to the State Office Building. The building is currently occupied by the Department of Transportation (RIDOT). Several of the building systems are either in non-compliance or have outlived their useful life, which includes electrical, elevators, HVAC, and fire suppression. Completed projects include the re-pointing and sealing of the exterior walls, primary electrical system upgrades, window and skylight replacements, and roof replacement. The Governor recommends expenditures of $1.7 million in FY 2017; $700,000 in FY 2018; $350,000 in FY 2019; $1.0 million in FY 2020; and $2.9 million in FY 2022. Expenditures prior to FY 2017 total $3.5 million. William Powers Building – The Governor recommends expenditures of $12.0 million from the Rhode Island Capital Plan Fund for the William Powers building, which houses the Departments of Administration and Revenue. Planned projects include HVAC upgrades, the creation of a centralized command center; envelope repairs and granite caulking, and elevator renovations. The Governor recommends expenditures of $1.0 million in FY 2017 and $1.0 million in FY 2018; $2.0 million in FY 2019; $3.0 million in FY 2020; $4.0 million in FY 2021; and $1.0 million in FY 2022. Expenditures prior to FY 2017 total $6.8 million. Environmental Projects
22

Department of Administration
Environmental Compliance – The Governor recommends expenditures of $1.0 million from the Rhode Island Capital Plan Fund for on-going monitoring and remediation of contaminated soil and groundwater at State properties as mandated by the Department of Environmental Management. The Governor recommends expenditures of $200,000 annually for the fiscal years 2017 through 2021. Expenditures prior to FY 2017 total $1.4 million. Replacement of Fueling Tanks – The Governor recommends expenditures of $1.9 million from the Rhode Island Capital Plan Fund for the replacement of fuel tanks at numerous State properties. The State owns and operates 15 fueling stations for State owned vehicles. Underground tanks that have reached fifteen years of age should be replaced. The Governor recommends expenditures of $295,610 in FY 2017; $450,000 in FY 2018; and $300,000 annually for the fiscal years 2019 through 2022. Expenditures prior to FY 2017 total $2.4 million. State Facility Projects DoIT Enterprise Operations Center – The Governor recommends expenditures of $2.4 million from the Rhode Island Capital Plan Fund to continue to upgrade the data center facility at 50 Service Ave. in Warwick. The building has been renovated and is occupied by the Division of Information Technology (DoIT) and Treasury. The planned projects at the facility include HVAC upgrades, roof replacement, and replacement of the generator and transfer switch. The Governor recommends expenditures of $530,000 in FY 2017, $700,000 in FY 2018, and $1.1 million in FY 2019. Expenditures prior to FY 2017 total $10.0 million. Old Colony House (Newport) – The Governor recommends expenditures of $430,000 from the Rhode Island Capital Plan Fund for repairs to the Old Colony House in Newport. This building was built in Newport between 1739 and 1743 and is the fourth oldest State House still standing in the United States. The State owns the building, but the Newport Historical Society runs the day-to-day operation of the building, which includes
daily public viewing. The building requires significant repairs and renovations to preserve the historic nature of the building. The Governor recommends expenditures of $280,000 in FY 2017; $100,000 in FY 2018; and $50,000 in FY 2019. Expenditures prior to FY 2017 total $1.6 million. Old State House (Providence) – The Governor recommends expenditures of $1.9 million from the Rhode Island Capital Plan Fund for renovations and improvements to the Old State House located on Benefit Street in Providence. The building is currently occupied by the Rhode Island Historical Preservation and Heritage Commission and is open to the public for touring. Planned projects include a roof replacement, brownstone and mason repairs, window restoration, and general exterior improvements. The Governor recommends expenditures of $250,000 in FY 2017; $1.0 million in FY 2018; $500,000 in FY 2019; and $150,000 in FY 2020. Expenditures prior to FY 2017 total $1.6 million. Washington County Government Center – The Governor recommends expenditures of $5.3 million from the Rhode Island Capital Plan Fund for renovations to the Washington County Government Center in Wakefield. The building tenants include the Department of Labor and Training, Department of Human Services, Department of Children, Youth and Families, Coastal Resources Management Council, the Division of Motor Vehicles, the Judiciary, and the South County Tourism Council. All of the ceilings in the building were renovated to accept a new HVAC system when the project begins. Other projects include masonry repairs, window replacement, and other interior renovations. The Governor recommends expenditures of $100,000 in FY 2017; $1.4 million in FY 2018; $1.3 million annually in FY 2019 and FY 2020; $750,000 in FY 2021; and $500,000 in FY 2022. Expenditures prior to FY 2017 total $2.7 million. Shepard Building – The Governor recommends expenditures of $5.0 million from the Rhode Island Capital Fund for repairs and renovations to the to the Shepard building, including roof replacement, main entrance repairs, and
23
Department of Administration
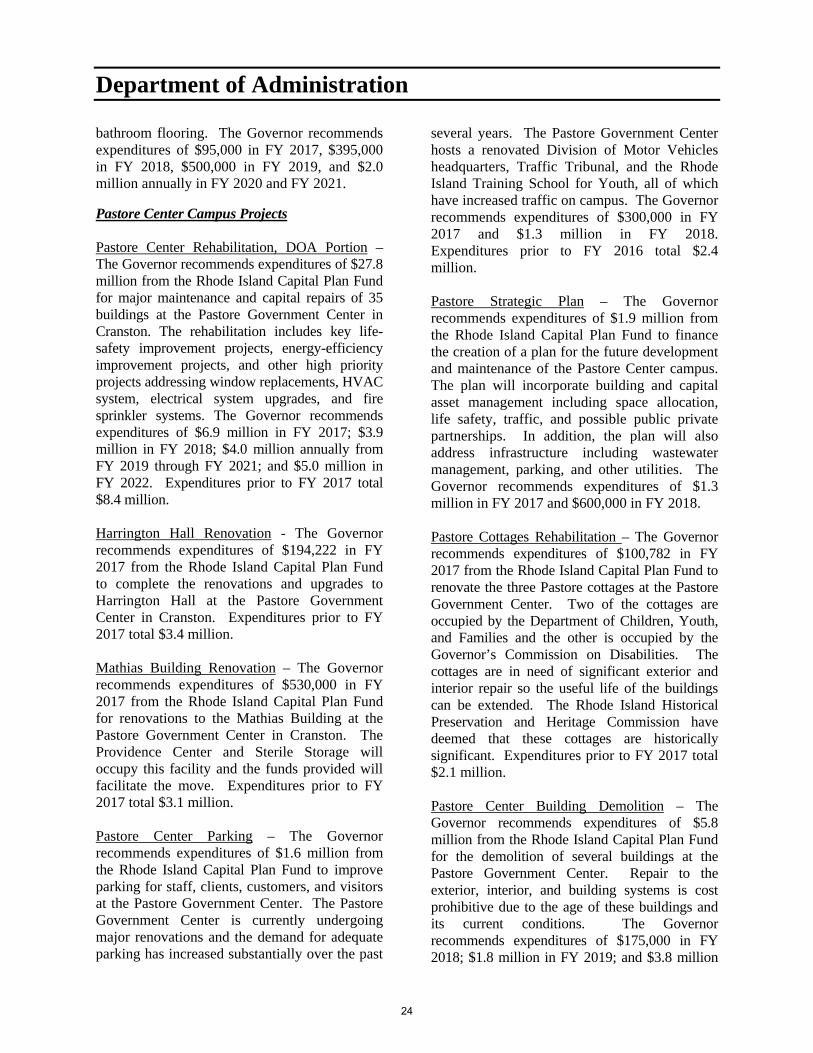
bathroom flooring. The Governor recommends expenditures of $95,000 in FY 2017, $395,000 in FY 2018, $500,000 in FY 2019, and $2.0 million annually in FY 2020 and FY 2021.
Pastore Center Campus Projects Pastore Center Rehabilitation, DOA Portion – The Governor recommends expenditures of $27.8 million from the Rhode Island Capital Plan Fund for major maintenance and capital repairs of 35 buildings at the Pastore Government Center in Cranston. The rehabilitation includes key life-safety improvement projects, energy-efficiency improvement projects, and other high priority projects addressing window replacements, HVAC system, electrical system upgrades, and fire sprinkler systems. The Governor recommends expenditures of $6.9 million in FY 2017; $3.9 million in FY 2018; $4.0 million annually from FY 2019 through FY 2021; and $5.0 million in FY 2022. Expenditures prior to FY 2017 total $8.4 million. Harrington Hall Renovation - The Governor recommends expenditures of $194,222 in FY 2017 from the Rhode Island Capital Plan Fund to complete the renovations and upgrades to Harrington Hall at the Pastore Government Center in Cranston. Expenditures prior to FY 2017 total $3.4 million. Mathias Building Renovation – The Governor recommends expenditures of $530,000 in FY 2017 from the Rhode Island Capital Plan Fund for renovations to the Mathias Building at the Pastore Government Center in Cranston. The Providence Center and Sterile Storage will occupy this facility and the funds provided will facilitate the move. Expenditures prior to FY 2017 total $3.1 million. Pastore Center Parking – The Governor recommends expenditures of $1.6 million from the Rhode Island Capital Plan Fund to improve parking for staff, clients, customers, and visitors at the Pastore Government Center. The Pastore Government Center is currently undergoing major renovations and the demand for adequate parking has increased substantially over the past
several years. The Pastore Government Center hosts a renovated Division of Motor Vehicles headquarters, Traffic Tribunal, and the Rhode Island Training School for Youth, all of which have increased traffic on campus. The Governor recommends expenditures of $300,000 in FY 2017 and $1.3 million in FY 2018. Expenditures prior to FY 2016 total $2.4 million. Pastore Strategic Plan – The Governor recommends expenditures of $1.9 million from the Rhode Island Capital Plan Fund to finance the creation of a plan for the future development and maintenance of the Pastore Center campus. The plan will incorporate building and capital asset management including space allocation, life safety, traffic, and possible public private partnerships. In addition, the plan will also address infrastructure including wastewater management, parking, and other utilities. The Governor recommends expenditures of $1.3 million in FY 2017 and $600,000 in FY 2018. Pastore Cottages Rehabilitation – The Governor recommends expenditures of $100,782 in FY 2017 from the Rhode Island Capital Plan Fund to renovate the three Pastore cottages at the Pastore Government Center. Two of the cottages are occupied by the Department of Children, Youth, and Families and the other is occupied by the Governor’s Commission on Disabilities. The cottages are in need of significant exterior and interior repair so the useful life of the buildings can be extended. The Rhode Island Historical Preservation and Heritage Commission have deemed that these cottages are historically significant. Expenditures prior to FY 2017 total $2.1 million. Pastore Center Building Demolition – The Governor recommends expenditures of $5.8 million from the Rhode Island Capital Plan Fund for the demolition of several buildings at the Pastore Government Center. Repair to the exterior, interior, and building systems is cost prohibitive due to the age of these buildings and its current conditions. The Governor recommends expenditures of $175,000 in FY 2018; $1.8 million in FY 2019; and $3.8 million
24
Department of Administration
in FY 2020. Expenditures prior to FY 2017 total $4.0 million. Pastore Power Plant Rehabilitation – The Governor recommends expenditures of $1.5 million from the Rhode Island Capital Plan Fund for the Pastore Center Power Plant Rehabilitation project. The Pastore Government Center has a Central Power Plant with the capability to co-generate electricity. This project includes the installation of a redundant DA Tank, replacement of aged steam piping, pump renewal, and repairs to steam turbines. The Governor recommends Rhode Island Capital Plan Fund expenditures of $800,000 in FY 2017 and $650,000 in FY 2018. Rhode Island Capital Plan Fund expenditures prior to FY 2017 total $2.4 million. Pastore Government Center Utilities Upgrade – The Governor recommends expenditures of $4.6 million from the Rhode Island Capital Plan Fund for upgrades to the utility infrastructure at the Pastore Government Center and Zambarano Campus. Replacement and upgrades to the Pastore Government Center underground distribution system includes switch upgrades and generator upgrades at Regan and Forand. Upgrades to Zambarano include switch gear, generator, and main distribution lines. These systems are beyond its useful life and needs to be replaced and upgraded. The Governor recommends Rhode Island Capital Fund expenditures of $2.6 million in FY 2017 and $2.0 million in FY 2018. Expenditures prior to FY 2017 total $3.1 million. Pastore Center Water Utility System – The Governor recommends expenditures of $1.4 million from the Rhode Island Capital Plan Fund to enhance the water supply and distribution system of the underground water supply pipe network at the Pastore Government Center. Cleaning and replacing selected underground lines will continue. The Governor recommends expenditures of $540,000 in FY 2017 and $280,000 annually from FY 2018 to FY 2020. Expenditures prior to FY 2017 total $354,434. State House Asset Protection Projects
State House Energy Management Improvement Project – The Governor recommends expenditures of $5.1 million from the Rhode Island Capital Plan Fund for to provide infrastructure upgrades to the building and boiler house, with the intention of distributing conditioned air throughout the facility. Also, included in this project is repairs and/or the replacement of the mechanical, electrical, life safety, fire protection, and telecommunications infrastructure of the building. The Governor recommends $108,333 in FY 2017, $2.0 million in FY 2018, and $3.0 million in FY 2019. Expenditures prior to FY 2017 total $564,667. State House Renovations – The Governor recommends expenditures of $5.5 million from the Rhode Island Capital Plan Fund for the continuing renovation and rehabilitation of the Rhode Island State House. The project includes repairs to exterior walls and parapet cap, reconditioned walkways and exterior staircases, interior dome repair, refurbished exterior windows, installations of LED lighting, elevator repairs, and the upper legislative parking lots rehabilitated. The Governor recommends expenditures of $1.0 in FY 2017; $1.3 million annually in FY 2018 and FY 2019; $1.0 million in FY 2020; and $500,000 annually in FY 2021 and FY 2022. Expenditures prior to FY 201 total $6.1 million. Zambarano Campus Projects Zambarano Utilities and Infrastructure – The Governor recommends expenditures of $15.1 million from the Rhode Island Capital Plan Fund to facilitate asset protection for buildings, equipment, road, parking, open space, and utilities at the Zambarano Campus in Burrillville. This multi-year project will make the repairs necessary to ensure the reliability of the campus infrastructure, to include the domestic water supply, the wastewater disposal system, the steam heat, and the electricity provided to the buildings that house institutional patients on the campus. Other projects include slate roof repairs, window replacement, and HVAC upgrades. The Governor recommends expenditures of $3.2
25

Department of Administration
million in FY 2017; $6.1 million in FY 2018; $2.2 million in FY 2019; $1.1 million in FY 2020; $1.5 million in FY 2021; and $1.0 million in FY 2022. Expenditures prior to FY 2017 total $5.1 million. Other Projects Security - The Governor recommends expenditures of $500,000 in FY 2018 for security measures at the Cannon Building. The Cannon Building houses the Department of Health’s major programs and functions, including trainings, hearings, licensing, and public access to vital records. This project will address security issues throughout the building. Cranston Street Armory – The Governor recommends expenditures of $2.4 million from the Rhode Island Capital Plan Fund for ongoing rehabilitation of the Cranston Street Armory. The Armory is listed as one of “America’s 11 Most Endangered Historic Places” by the National Trust for Historic Preservation. Military Staff vacated this early 1900s era building during the fall of 1996 and transferred ownership to the Department of Administration. The Governor recommends expenditures of $1.5 million in FY 2017 and $850,000 in FY 2018. Expenditures prior to FY 2017 total $3.1 million. Energy Efficiency- The Governor recommends expenditures of $4.0 million annually from FY 2018 through FY 2021 and $1.0 million in FY 2022 from the Rhode Island Capital Plan Fund to support the implementation of comprehensive, cost-effective energy efficiency measures and renewable energy installations at state-owned properties. This initiative will reduce state facility operating and on-going maintenance costs and reduce energy costs across state government and shrink state government’s footprint by reducing overall energy demand and adopting renewable energy resources. McCoy Stadium – The Governor recommends expenditures of $101,761 million in FY 2018 from the Rhode Island Capital Plan Fund for the completion of upgrades to McCoy Stadium. In 1998 and 1999, the State shared in the costs to
finance a construction project to upgrade McCoy Stadium in Pawtucket, which is currently the home of the Pawtucket Red Sox, a Triple-A baseball franchise. The impetus for the State’s involvement in this project was to keep the Pawtucket Red Sox in Rhode Island. Expenditures prior to FY 2017 total $1.8 million. Virks Building Renovation – The Governor recommends expenditures of $20.3 million in Rhode Island Capital Plan Fund for the renovation and upgrades to the Virks Building at the Pastore Government Center in Cranston. The Executive Office of Health and Human Services (EOHHS) will occupy the newly renovated building. The Governor recommends expenditures of $15.1 million in FY 2017 and $5.2 million in FY 2018. Expenditures prior to FY 2017 total $2.4 million. Accessibility – Facility Renovations - The Governor recommends expenditures of $6.0 from the Rhode Island Capital Plan Fund for ADA and accessibility renovations at state buildings. This funding was previously included under the Governor’s Commission of Disabilities budget, but shifted to the Department of Administration in FY 2016. The Governor recommends $1.0 million annually for the fiscal years 2017 through 2022. Expenditures prior to FY 2017 total $2.6 million. Water Resources Board Big River Management Area - The Governor recommends total project expenditures of $806,720 from the Rhode Island Capital Plan Fund for on-going administration of real estate in the perimeter of the Big River Management Area pursuant to state statute (RIGL 46-15.1-19.1). Covering 8,400 acres, it contains 27 single-family occupied, rented dwellings, three commercial buildings, a 79-pad mobile home court, a nine-hole golf course, seven miles of public roads, and three bridges. The Governor recommends expenditures of $131,720 in FY 2017; $100,000 in FY 2018; $125,000 in FY 2019; and $150,000 annually from FY 2020
26

Department of Administration
through FY 2022. Expenditures prior to FY 2017 total $803,035. South County Groundwater Site Acquisition Program - The Governor recommends expenditures of $3.4 million from Public Law 2004, Chapter 595 general obligation bonds issued and unissued to preserve and protect valuable groundwater resources in the State through the purchase of wellhead lands and development rights to such sites in order to assure the future availability of water and water independence for the State of Rhode Island. The Water Resources Board (WRB) has purchased two sites and continues to investigate multiple sites throughout South County from the use of well drillers and professional engineers. The Governor recommends expenditures of $1.4 million in FY 2017; $1.0 million in FY 2018; and $1.0 million in FY 2019. Expenditures prior to FY 2017 total $4.1 million. Statewide Emergency Water Interconnections - The Governor recommends expenditures of $2.1 million in FY 2017 from Public Law 2004, Chapter 595 issued general obligation bond proceeds to establish emergency interconnections between the State’s thirty large water systems and other systems. Interconnections are determined dependent on the ease of redundancy, quality, and quantity of water as well as the benefits to the health and safety of one or more systems. Expenditures prior to FY 2017 total $1.6 million. Bristol County Water Treatment Facility – The Governor recommends $79,762 in FY 2017 from Public Law 2004, Chapter 575 to make the final payment associated with the Shad Factor pipeline that connects Massachusetts supplies to the Child Street Treatment Facility. In 2004, the voter approved a $5.0 million general obligation bond to complete this pipeline to preserve Rhode Island water rights to two Massachusetts reservoirs. Expenditures prior to FY 2017 include $4.9 million from general obligation bonds. Rhode Island Convention Center Authority
Veterans’ Memorial Auditorium and Office Building – The Governor recommends expenditures of $1.1 million from the Rhode Island Capital Plan Fund for renovations to the Veterans’ Memorial Auditorium. The renovations include upgrades to furniture and fixtures, box office improvements, restroom updates, a lobby and video audio system, the installation of WiFI, and base board heat in the gallery. The renovations are currently in the final phase. The Governor recommends Rhode Island Capital Plan Fund expenditures of $455,147 in FY 2017; $205,000 in FY 2018; $200,000 in FY 2019; $90,000 in FY 2020; and $185,000 in FY 2021. Rhode Island Capital Plan Fund Expenditures prior to FY 2017 total $16.6 million. Federal fund expenditures prior to FY 2017 total $300,000. Dunkin’ Donuts Center – The Dunkin’ Donuts Center was purchased by the Rhode Island Convention Center Authority by the issuance of revenue bonds (2006 Series A Bonds) and leased back to the State. Rental payments from the Dunkin’ Donuts Center lease are applied to the debt service payments on the revenue bonds. The Governor recommends expenditures of $13.2 million from the Rhode Island Capital Plan Fund to be deposited into the Renewal and Replacement Fund in accordance with yearly requirements specified by the bond covenants of the 2006 Series A Bonds. The Governor recommends expenditures of $3.9 million in FY 2017; and $1.9 million annually for the fiscal years 2018 through 2022. Expenditures prior to FY 2017 total $1.2 million. Rhode Island Convention Center – The Governor recommends expenditures of $6.8 million from the Rhode Island Capital Plan Fund for repairs and maintenance to the Convention Center. These asset protection expenditures include electrical, food and beverage, operational, and HVAC upgrades to the facility. Projects include the purchase of energy efficient equipment, parking garage restoration, meeting room conversion and upgrades, common area improvements, roof replacement, LED installation, HVAC, and the replacement of main sprinkler piping and control valves. As the
27

Department of Administration
facility continues to age, proactive maintenance is required to maintain the asset and ensure the safety of staff and attendees. The Governor recommends expenditures of $1.8 million in FY 2017 and $1.0 million annually from FY 2018 through FY 2022. Expenditures prior to FY 2017 total $2.5 million.
28

Executive Office of Commerce
Agency Responsibilities The Executive Office of Commerce was established February 1, 2015 to oversee and serve as the lead agency of the Executive Branch for managing the promotion of commerce and the state’s economy. This Office implements economic development initiatives and programs that seek to create opportunity for all Rhode Islanders. The Housing and Community Development program, which is comprised of the Housing Resources Commission (HRC) and the Office of Community Development, administers the federal Community Development Block (CDBG) Grant and related programs. The Housing Resources Commission (HRC) is responsible for the rental assistance program, which provides housing to homeless individuals and families by non-profit homeless service providers. The Office also has power to oversee functions of the Department of Business Regulation, the Office of Health Insurance Commissioner, the Rhode Island Commerce Corporation, and the I-195 Redevelopment Commission. Governor's Recommendations I-195 Redevelopment District Commission - The Governor recommends a total of $2.4 million, which includes $351,683 in FY 2017 and $300,000 in FY 2018 in Rhode Island Capital Plan (RICAP) financing for development of the I-195 Surplus Land pursuant to the I-195 Redevelopment Act of 2011. The financing will continue to be utilized for the permitting, environmental modeling and other architectural/engineering services to prepare the property for acquisition and development. Prior to FY 2017 a total of $1.8 million was spent including $400,000 in Environmental Protection agency funding for remediation work on the land and $1.4 million in Rhode Island Capital Plan funds. Quonset Point/Davisville Pier - The Port of Davisville has two piers (Pier 1 and Pier 2), each with one primary Roll-on Roll-off berth. Both
piers are significantly older than their expected useful lives. The aging of the port infrastructure has created conditions that are impacting operating parameters and could influence future business decisions of its users. Pier 2 is comprised of land fill placed in Narragansett Bay supported along its edges by a retaining wall and requires repairs more urgently than Pier 1. Quonset has put forth a plan to extend and rehabilitate Pier 2 by building an east extension and installing a sheet pile bulkhead. Although other, more robust options were considered, this option is most sensible as it is cost effective and will allow for continuity at the Port. In order to build the improvements and continue operations, the east berth of Pier 2 will need to be extended to accommodate docking and unloading of a car carrier. By adding a pier extension to Pier 2, Quonset can sequence the repairs without impacting the Port’s ability to service customers while repairs are under way. Ultimately, the added berth at Pier 2 could also replace the berth at Pier 1 if needed. The Governor recommends $90.0 million for the project beginning in FY 2017. The Governor recommends a total of $15.0 million in RICAP funds as follows: $400,000 in FY 2017, $2.6 million in FY 2018, $2.0 million in FY 2019 and $5.0 million in each year for FY 2020 and FY 2021. Other funding includes newly approved 2016 general obligation bonds as follows: $1.5 million in FY 2018, $11.0 million in FY 2019, $24.5 million in FY 2020 and $13.0 million in FY 2021. Financing for the project also includes $25.0 million in Quonset Development Corporation issued revenue bonds. Innovation Campuses – The Governor recommends $20.0 million in newly authorized general obligation bond financing to build one or more innovation campuses involving business collaborations with the University of Rhode Island and may include other higher education institutions where cutting-edge research can be turned into new products, services, and businesses. The Executive Office of Commerce will run a competitive selection process to
29

Executive Office of Commerce
determine the location and type of center or centers to build. The winning proposals must match the public’s investment with private or federal funds and create substantial numbers of new jobs at a wide variety of skill levels. A total of $5.0 million is recommended annually from FY 2018 to FY 2021. Affordable Housing – The Governor recommends $40.0 million from newly authorized general obligation bond funds in conjunction with $25.0 million in 2012 general obligation bond financing to be allocated for affordable housing projects through the existing Building Homes Rhode Island (BHRI) program. The Governor recommends $16.2 million in FY 2017, which includes $6.2 million from the 2012 bond authorization and $10.0 million from the 2016 bond authorization. The recommendation also includes $10.0 million in FY 2018 and $20.0 million in FY 2019. A total of $18.7 million has already been spent from the 2012 bond authorization. New bond proceeds will develop affordable housing opportunity programs through the redevelopment of existing structures and/or new construction. Urban Revitalization and Blight Remediation – The Governor recommends $10.0 million from the newly approved 2016 bond authorization to provide funding for the improvement of properties that are blighted or in need of revitalization, including residential and commercial properties and public and community spaces. The financing makes up a portion of the $50.0 million of the Housing Opportunity Bonds approved by the voters in November 2016. Port of Providence – The Governor recommends $20.0 million from the newly approved 2016 bond authorization in order to increase terminal capacity at the Port specifically by financing the acquisition of up to 25 acres of land located between Allens Avenue in the City of Providence and the Providence River, and associated infrastructure improvements. Once acquired and improved, the State anticipates
leasing the land to ProvPort, the City of Providence’s current port operator. ProvPort, in turn, will enter into subleases with one or more private terminal operators. Those entities will make private investments in their terminal operations as well as pay fees to ProvPort for the land they lease. The State will share in the gross revenues, including sublease payments, generated from the expanded port area. The State will also realize additional income taxes from expanded employment.
30
Department of Labor and Training
Agency Responsibilities The Department of Labor and Training is responsible for administering income support programs (Unemployment Insurance, and Temporary Disability Insurance) and employment and training programs; enforcing laws relating to prevailing wages, labor standards, weights and measures, professional regulations, and occupational health and safety; operating a rehabilitation facility (Donley Center) for individuals with work-related injuries; administering Workers’ Compensation programs, including claims monitoring and education programs; and providing administrative support for the Labor Relations Board and the Board of Review. The Department has a network of six full service field offices (Pawtucket, Woonsocket, Providence, West Warwick, Warren, and Wakefield) to provide a full range of employment and training services; a headquarters in the Center General Complex at the Pastore Government Center, Cranston; an auxiliary office for the Board of Review in Providence (Westminster Street), and the Donley Rehabilitation Center in Providence (249 Blackstone Blvd). Governor's Recommendations Center General Asset Protection - The Governor recommends $7.4 million from the Rhode Island Capital Plan Fund to maintain and repair the six buildings comprising the Center General Complex. Occupants include the Department of Labor and Training, Department of Business Regulation, as well as support staff of the Division of Capital Asset Management and Maintenance and the Division of Information Technology, both part of the Department of Administration. Capital repair deficiencies compiled by the Division of Capital Asset Management and Maintenance include: carpet replacement; parking lot and walkway repairs; exterior envelope repairs; window replacements, repairs and caulking; cornice repairs; HVAC improvements; air duct cleaning; interior
painting; foundation perimeter sealing; and repairs of the building 72 roof. Project expenditures will include: $1.4 million in FY 2017, $1.1 million in FY 2018, $900,000 in FY 2019, $1.7 million in FY 2020 and $816,869 in FY 2021. Expenditures prior to FY 2017 total $1.6 million. Center General Complex Slate Roof Replacement - The Governor recommends expenditures of $1.3 million from the Rhode Island Capital Plan Fund and $884,249 from other sources to complete the replacement of the slate roofs on three of the six Center General Complex buildings, including the roofs on buildings 68, 69, and 71. When the facility was rehabilitated during the late 1990s, the only slate roof that was completely replaced was on building 72. For buildings 68, 69, and 71, the slate roofs were redone using existing material. Due to water leaking into the buildings and deteriorating slate falling off buildings, the Governor recommends replacing the roofs on these buildings with new slate material. Financing in FY 2017 consists of $156,620 from the Rhode Island Capital Plan Fund, $281,812 from Temporary Disability Insurance funds; $236,548 from restricted receipts; and $307,365 from federal funds. Expenditures prior to FY 2017 total $1.2 million.
31

Department of Revenue
Agency Responsibilities The Department of Revenue has seven programmatic functions, including Central Management (Director of Revenue), Taxation; State Lottery, Registry of Motor Vehicles, Revenue Analysis, Municipal Finance, and State Aid. The Department is responsible for three capital projects, which include the Integrated Tax System for the Division of Taxation, Modernization of the Department of Motor Vehicles IT system (RIMS), and Lottery Building renovations. Governor's Recommendations Integrated Tax System – The Governor recommends a total of $5.4 million to complete the new Integrated Tax System named “STAARS” (State Tax Administration and Revenue System) in FY 2017. This includes $5.2 million from issued Certificates of Participation (COPS) and $212,000 from federal funds. The final group of mainframe/off line taxes will be incorporated into STAARS, various portals will go live, and revenue accounting will be implemented in FY 2017. The system will expand taxpayer, tax preparer, and taxpayer representative online functionality for registration, filing, payment, account inquiry, access to taxpayer documents, and other self-service activities. Expenditures prior to FY 2017 total $19.8 million all from COPS. An additional $2.0 million in new COPS funding is being recommended under the Information Technology Project within the Department of administration for Phase 2 of the STAARS Tax System project. Phase 2 will include improved cash transaction management by replacing manual cash, check and credit card payments and allow for reconciliation and to provide management with dashboard and real time statistical reporting tools, as well as meet audit requirements. Division of Motor Vehicles IT Modernization – The Governor recommends total project expenditures of $28.4 million for the DMV Modernization System known as RIMS (Rhode Island Motor Vehicle System) to implement a
new, real-time, and customer-centric motor vehicle system that will replace the current DMV system. Funding includes $8.6 million in restricted receipts in FY 2017 and a total of $1.4 million from general revenues from FY 2017 to FY 2019. The replacement of the current system is required due to outdated technology which cannot respond to legislative changes, federal mandates, and incorporate the hundreds of interfaces with outside entities that are necessary. Expenditures prior to FY 2017 were as follows: $11.0 million from Certificates of Participation, $377,854 from federal funds, $1.6 million from general revenue, and $5.4 million from restricted receipt funds. Lottery Building Renovations – The Governor recommends $119,112 from the Rhode Island Capital Plan Fund in FY 2017 for the completion of renovations at the Lottery Division’s headquarters building on Pontiac Avenue in Cranston. The renovations have included improvements to the parking lot, and new carpeting and office upgrades. Expenditures prior to FY 2017 total $785,303.
32

Secretary of State
Agency Responsibilities One of the five general offices subject to voter election, the Secretary of State administers all activities of the Office as prescribed by the Rhode Island Constitution and state law. As the custodian of state records, the Office has a vital role in providing the public with basic information about the workings of state government and consists of six divisions and one internal service fund. Divisions of the Secretary of State include Administration, Corporations, Elections and Civics, Public Information, State Archives, and the Record Center. Governor's Recommendations State Archives - The Governor recommends $150,000 in FY 2017 to conduct a feasibility study to recommend the best available options for a permanent facility to house the State Archives. Archival documents are currently held in leased space. The enacted FY 2017 Budget included $100,000 for the study; the additional $50,000 in the revised FY 2017 Budget will support increased expenditures due to the complexity of the feasibility study.
33
Public Utilities Commission
Agency Responsibilities Comprised of two distinct regulatory bodies, the Division of Public Utilities and Carriers and the Public Utilities Commission, the Public Utilities Commission serves as a quasi-judicial tribunal with jurisdiction, powers, and duties to implement and enforce the standards of conduct for all public utilities and common carriers of property and persons. Both divisions also hold hearings and investigations involving rates, tariffs, tolls, and charges. Additionally, while the Commission exercises jurisdiction over the sites of potential energy facilities, the Division of Public Utilities and Carriers supervises and regulates Community Antenna Television Systems (CATV), including transactions between public utilities and affiliates, as well as public utility debt and equity issuances. Governor's Recommendations Facility Asset Protection/Renovations. This project seeks to bring the facility housing the Public Utilities Commission into compliance with state fire code regulations and federal Americans with Disabilities Act requirements. The Commission has undertaken various improvements and renovations to its state- owned office building at 89 Jefferson Boulevard since its relocation in FY 2001. The Governor recommends project funding of $123,258 in federal funds (in FY 2016) and $536,820 in restricted receipts, consisting of $36,705 in FY 2016, $50,115 in FY 2017, $50,000 in FY 2018, $200,000 in FY 2019, $100,000 in FY 2020, and $100,000 in FY 2021. These funds will be used for various asset protection and renovation projects and capital asset acquisition including, but not limited to: 1) elevator upgrades, 2) replacement of the membrane roof, 3) replacement of exterior windows, 4) pavement resurfacing, and 5) replacement of handicapped railings and ramps.
34

Health and Human Services
Department of Children, Youth and Families Department of Human Services
Behavioral Healthcare, Developmental Disabilities and Hospitals


Department of Children, Youth and Families
Agency Responsibilities The Department of Children, Youth and Families provides services to children and youth, both directly and in partnership with private sector agencies. A number of state and privately owned facilities are used to provide these services. The Department is responsible for facilities at the Rhode Island Training School for Youth at the Pastore Center, the Groden School on Cowesett and Mt. Hope Avenues, and the building occupied by the North American Family Institute. In the past, the Department’s Capital Improvement Plan has primarily focused on the construction and repair needs of the Rhode Island Training School for Youth. Projects at the Training School, many of which were mandated by court order, have included the renovation of the Youth Correctional Center, the construction of a new school building, and the installation of an air conditioning system and additional fencing. In FY 2009, the Thomas C. Slater Training School opened and the old facility was vacated by the Department. Governor's Recommendations Thomas C. Slater Training School Training School Repairs and Improvements - The Governor recommends financing of $483,816 in FY 2017 from the Rhode Island Capital Plan Fund for various repairs and improvements to the Rhode Island Training School for Youth. Some of the repairs and improvements include flashing protection and the installation of a sprinkler system retrofit, roof repairs, conduits, cement pads, and backflow preventers. Prior to FY 2017, expenditures totaled $1.0 million. RITS Maintenance Building – The Governor recommends financing of $385,000 in FY 2017 and $150,000 in FY 2018 from the Rhode Island Capital Plan Fund for the construction of a maintenance building that will be utilized as part of the Thomas C. Slater Training School. This
facility will consist of a shop area and warehouse. Generators - The Governor recommends $50,000 in FY 2017 and $950,000 in FY 2018 from the Rhode Island Capital Plan Fund for the purchase and installation of generators at the Thomas C. Slater Training School. The generators will facilitate the use of the HVAC system during power failures. Prior to FY 2017, expenditures totaled $30,802. Private Providers NAFI Center – The Governor recommends $40,857 in FY 2017 from the Rhode Island Capital Plan Fund for repairs and renovations to the North American Family Institute (NAFI) facility. Included in this recommendation is an upgrade to the facility’s fire alarm system, sprinkler system, generator, repair of the driveway and drainage pipes, and replacement of the HVAC system. Prior to FY 2017, expenditures totaled $710,138.
35

Department of Human Services
Agency Responsibilities The Department of Human Services has utilized the Rhode Island Capital Plan Fund and agency funds to continually rehabilitate fixed assets essential to providing basic and specialized services to needy individuals and families. The current Capital Improvement Plan focuses primarily on infrastructural improvements at the facilities operated by the Division of Veterans’ Affairs. These include the Veterans' Home in Bristol and the Veterans’ Memorial Cemetery in Exeter. Most of these projects are financed via the Veterans’ Home restricted receipt account, established pursuant to RIGL 35-24-10. Governor's Recommendations Veterans’ Home - New Construction Article 5 of Chapter 241 of the Public Laws of 2012 provided for a November 2012 ballot proposition authorizing the issuance of general obligation bonds not to exceed $94.0 million for the design and construction of a new Rhode Island Veterans’ Home complex. Voters approved the ballot item on November 6, 2012. Of this funding a total of $33.5 million was issued and spent. Federal approval for the project was granted in May 2013 by the Veterans Administration. The agency issued its first notice of grant award totaling $10.0 million in December 2015 and the balance of $50.5 million was authorized during 2016. Due to the agency’s ability to utilize federal funding for the project, only $33.5 million of the total $94.0 million from the 2012 general obligation bond authorization can be utilized for the project based on the ballot authorizing language. A November 2016 ballot proposition was needed to provide the necessary matching funds for the new federal grant award. The bond authorization was approved by the voters and now a total of $27.0 million in additional general obligation funds are available for the project. A feasibility study was completed in August 2013. The schematic designs on the new facility were completed in May 2014. Construction for
the New Veterans’ Home began in 2016 and is expected to be complete by August 2017. The Governor recommends total financing of $121.0 million for the project including $37.0 million in federal funds in FY 2017, $23.5 million in federal funds in FY 2018, and $27.0 million in general obligation bonds from the 2016 bond authorization in FY 2018. Establishment and Refurbishment of Blind Vending Facilities – To date, the Blind Vending Facilities have undergone $1.0 million in renovations prior to FY 2017. The Governor recommends financing of $165,000 from the Rhode Island Capital Plan Fund each year from FY 2017 through FY 2022 totaling $990,000 to support ongoing improvements at vending facilities operated under the Business Enterprises Program (BEP) of the Office of Rehabilitation Services (ORS). These facilities are managed exclusively by legally blind individuals. Currently, ORS operates fifteen BEP outlets throughout the State, all of which are located within state, local, or federally-owned or occupied properties. These facilities offer significant convenience to both governmental employees and the public at large, while also providing a source of meaningful employment to the client-entrepreneurs.
36
Department of Behavioral Healthcare, Developmental Disabilities, and Hospitals
Agency Responsibilities The Department of Behavioral Healthcare, Developmental Disabilities, and Hospitals (BHDDH) has an extensive capital improvement program. This program primarily reflects the increased fixed asset demands resulting from the deinstitutionalization of patients into residential facilities. The Department is responsible for both administrative and patient care facilities at the Pastore Center, the Zambarano Hospital Campus, and community and residential facilities statewide. The Department provides grants, through its capital program, to regional centers that serve mentally ill and developmentally disabled clients in addition to having responsibility for all substance abuse related facilities. The Department provides and/or manages substance abuse prevention and treatment programs through a community based network of residential and outpatient treatment facilities, owned by both the State and private providers. These facilities are located in various communities throughout Rhode Island and on the grounds of the Pastore Center in Cranston. The Department's Capital Improvement Plan is composed of the following major categories, which include both infrastructure improvement to state facilities and support to non-state agencies. Institutional Facilities – The institutional facilities plan provides for the physical plant requirements of the BHDDH facilities on the Pastore Center campus and the Zambarano Hospital campus. These requirements include major interior and exterior repairs to protect buildings and the replacement of worn out heating, ventilation and air conditioning (HVAC) systems. Renovations and repairs to buildings and HVAC systems, as well as the implementation of energy conservation initiatives, have been ongoing requirements for the Department. Community Services - The Department is
responsible for making certain capital improvements to residential facilities statewide through its residential programs, including group homes and mental health community facilities. This includes the acquisition, renovation or repair of community residences, and the purchase of home modifications and specialized equipment to allow disabled family members to stay at home. Community Mental Health Centers - The Department is responsible for making certain capital improvements to regional community centers that are owned by the Department and operated by licensed non-profit organizations that lease the facilities. Regional Centers for the Developmentally Disabled – The Department is responsible for the acquisition, construction, renovation, equipment, and furnishing costs associated with regional centers for the developmentally disabled. Day Programs – The Department is responsible for capital improvements to Day Treatment Facilities for the chronically mentally ill. Governor's Recommendations Hospital Building(s) Asset Protection – The Governor recommends $6.1 million from the Rhode Island Capital Plan Fund for the rehabilitation of the BHDDH institutional facilities at the Pastore Center. The scope of this plan includes the ongoing repair, renovation, upgrade and rejuvenation of the Hospital buildings. Recommended financing by fiscal year is as follows: $252,204 in FY 2017; $250,000 in FY 2018; $300,000 in FY 2019; $350,000 in FY 2020; $400,000 in FY 2021; and $450,000 in FY 2022. Expenditures prior to FY 2017 total $4.0 million. Hospital Consolidation – The Governor recommends $5.7 million from the Rhode Island Capital Plan Fund for the consolidation of the
37

Department of Behavioral Healthcare, Developmental Disabilities, and Hospitals
Hospital units to improve the quality of care and gain operation efficiencies. Recommended financing totals $2.5 million in FY 2017, $2.3 million in FY 2018, and $920,000 in FY 2019. Administration Buildings Asset Protection – The Governor recommends expenditures of $12.9 million from the Rhode Island Capital Plan Fund for the correction of environmental deficiencies to Barry and Simpson Halls on the Pastore Campus. This project consists of upgrades or the replacement of roofs, exterior masonry, windows, HVAC systems, replacement of asbestos pipes, interior paint jobs, and carpeting. Recommended financing by fiscal year is as follows: $5.5 million in FY 2017 and $250,000 in each year from FY 2018 through 2022. Expenditures prior to FY 2017 total $6.1 million. Community Facilities Fire Code Upgrade - The Governor recommends $3.5 million from the Rhode Island Capital Plan Fund to install or upgrade fire alarm and sprinkler systems in residential, workshop, day program, and out-patient facilities for the Divisions of Developmental Disabilities, Rhode Island Community Living and Supports, and Behavioral Health Services. Recommended financing by fiscal year is as follows: $442,200 in FY 2017; $400,000 annually for fiscal years 2018 and 2019; and $200,000 in FY 2020. Expenditures prior to FY 2016 total $2.0 million. Zambarano Campus Asset Protection - The Governor recommends $2.8 million from the Rhode Island Capital Plan Fund for renovations at the Eleanor Slater Hospital on the Zambarano campus. The funding will be used for maintenance projects related to infection control and improving the environment of care. Recommended financing by fiscal year is as follows: $580,000 in FY 2017; $280,000 in FY 2018; $250,000 for fiscal years 2019 and 2020 and $300,000 for fiscal years 2021 and 2022. Expenditures prior to FY 2017 total $887,227. Hospital Equipment Asset Protection – The
Governor recommends $2.1 million from the Rhode Island Capital Plan Fund to replace hospital beds and medical equipment and to continue the systematic replacement of critical basic needs on an ongoing basis at the Eleanor Slater Hospital. Recommended financing totals $370,771 in FY 2017 and $300,000 annually for fiscal years 2018 through 2022. Expenditures prior to FY 2017 total $229,229. Mental Health Services Mental Health Residences - The Governor recommends $9.9 million from the Rhode Island Capital Plan Fund that would be principally provided to the Rhode Island Housing & Mortgage Finance Corporation to provide low-cost housing for people with mental illness. Recommended financing by fiscal year totals $800,000 annually for fiscal years 2017 through 2022. Expenditures prior to FY 2017 total $5.1 million. Mental Health Community Facilities Asset Protection – The Governor recommends $3.3 million from the Rhode Island Capital Plan Fund for maintenance and repairs to 30 group homes, 12 outpatient facilities, and one regional work center. The funds are used to maintain the physical structure and make emergency repairs, including roofs, siding, windows, HVAC systems, emergency generators, individual sewage disposal systems (ISDS), water wells, flooring, and kitchen and bathroom renovations. Recommended financing by fiscal year totals $200,000 annually for fiscal years 2017 through 2022. Expenditures prior to FY 2017 total $2.1 million. Developmental Disabilities DD Group Homes – Asset Protection - The Governor recommends $10.3 million from the Rhode Island Capital Plan Fund to maintain and repair 270 group homes, of which 149 are state-owned and 121 are privately-owned. The funds are used to maintain the physical structure and
38
Department of Behavioral Healthcare, Developmental Disabilities, and Hospitals
related systems, including: roofs, HVAC systems, individual sewage disposal systems (ISDS), water wells, flooring, windows, siding, and kitchen and bathroom renovations. Recommended financing by fiscal year is as follows: $1.2 million in FY 2017, $1.0 million in FY 2018, and $750,000 million annually for fiscal years 2019 through 2012. Expenditures prior to FY 2017 total $5.1 million. DD Residential Support - The Governor recommends $7.5 million in Rhode Island Capital Plan Fund resources for the Access to Independence program and continuation of the development of housing for individuals with developmental disabilities. The Access to Independence program provides funding to families for adaptations to their homes, including the installation of ramps, modifications of bathrooms, installation of lifts or other equipment purchases. The residential program also provides grants to individuals and agencies for down payments and contributions toward ownership, enabling individuals to reside in the community rather than in group-homes. Recommended financing includes $500,000 annually for fiscal years 2017 through 2022. Expenditures prior to FY 2017 total $4.5 million. DD Regional Centers Asset Protection - The Governor recommends $5.7 million from the Rhode Island Capital Plan Fund for repairs to the Developmental Disability Regional Centers. Repair projects may include HVAC systems, roofs, septic systems and interior and exterior modifications. Recommended financing includes $974,363 in FY 2017 and $500,000 annually for fiscal years 2018 through 2022. Expenditures prior to FY 2017 total $2.3 million. DD Private Waiver Community Facilities Fire Code Upgrade - The Governor recommends a total of $5.2 million including $2.0 million from the Rhode Island Capital Plan Fund and $3.2 million from federal funds to install or upgrade fire alarm and sprinkler systems in state-owned and privately-owned residential, workshop, day
program, and out-patient facilities licensed and operated for the Division of Developmental Disabilities under the Home and Community Based Waiver system. The cost of upgrading these facilities is eligible for federal participation with a state - federal match rate of approximately 50% state and 50% federal. Recommended Rhode Island Capital Plan Fund resources are as follows: $209,544 in FY 2017 and $100,000 annually for fiscal years 2018 and 2019. Rhode Island Capital Plan Fund expenditures prior to FY 2017 total $1.6 million. Recommended federal fund expenditures are as follows: $200,000 in FY 2017 and $100,000 annually for fiscal years 2018 and 2019. Federal fund expenditures prior to FY 2017 total $2.8 million. Substance Abuse Services Substance Abuse Asset Protection - The Governor recommends $1.7 million from the Rhode Island Capital Plan Fund for substance abuse asset protection projects. The project includes general renovations to state-owned substance abuse facilities to include remodeling for A.D.A. compliance, replacement of roofs, HVAC systems and for emergency repairs. Recommended financing by fiscal year is as follows: $100,000 in FY 2017, $150,000 in FY 2018, $200,000 in FY 2019 and $250,000 annually for fiscal years 2020 through 2022. Expenditures prior to FY 2017 total $488,806.
39


Education
Department of Elementary and Secondary Education Public Higher Education
Council on the Arts Atomic Energy Commission
Historical Preservation and Heritage Commission


Department of Elementary and Secondary Education
Agency Responsibilities The Department of Elementary and Secondary Education (RIDE) is responsible for the repair, renovation, and improvement of fixed assets utilized by departmental administration, the career and technical education system, and the School for the Deaf. This system includes seven regional career and technical schools operated by the local school districts, and three state-operated facilities: the School for the Deaf, the Davies Career and Technical School, and the Metropolitan Career and Technical School. The Department’s administrative section, the Administration of Comprehensive Education Strategy (ACES), is housed in the Shepard Building in downtown Providence. The Department’s FY 2018 – FY 2022 Capital Improvement Plan, as recommended by the Governor, is detailed below. Governor's Recommendations Transfer of Warwick and Woonsocket Career and Technical Schools – As part of a transfer agreement, the Governor recommends $2.3 million in Rhode Island Capital Plan Fund financing in FY 2017 for infrastructure projects at the Warwick and Woonsocket Career and Technical Schools. On completion of payment, ownership of each school will be transferred to each respective municipality. LEA Technology Infrastructure – The Governor recommends expenditures of $19.8 million from previously approved Certificates of Participation (COPS) financing for a technology infrastructure initiative. The Department of Elementary and Secondary Education is embarking on several educational reform initiatives as outlined in the Department’s Strategic Plan. Funding of the Local Education Authority - LEA Technology Infrastructure project plans to address the inequitable states of readiness of LEAs to meet the new requirements, focusing on student/teacher information systems, virtual learning, and technology in the classroom. Rhode Island school buildings have a varying degree of
technical capacity – the proceeds from the COPS issuance will primarily be used to extend wireless access in classrooms across the state. Prior to FY 2017, the Department expended $13.3 million in authorized COPS proceeds. The Governor recommends $6.5 million in FY 2017. ITI – Comprehensive Education Information System (CEIS) – The Governor recommends a total of $7.6 million for this project, comprised of $3.0 million in previously approved Certificates of Participation (COPS) financing and $4.6 million in federal financing to support the completion of the Comprehensive Education Information System (CEIS). This system has been in development for several years, and is designed to fulfill the student data reporting mandates of the federal No Child Left Behind Act (NCLB). The project, which involves a complex integration of both state and district-level data systems within a web-based Enterprise Portal Gateway Website infrastructure, is an ongoing priority of the Department. A major component of CEIS has been implemented in most school districts. The remaining components of CEIS will be addressed by this project, including further development, implementation, and maintenance of the eRIDE Portal system, which is the backbone of the CEIS structure; warehouse licenses and support; programming for the Uniform Chart of Accounts; and a dry “FM-200” fire suppression system for the technology room at the Shepard’s Building. Once complete, it is expected that CEIS will provide the Department with the capability of meeting all data collection requirements under state and federal law. Moreover, school districts will have access to a multitude of information on student achievement over a variety of dimensions, enabling them to focus resources in crucial areas. Prior to FY 2017, the Department expended $2.7 million in authorized COPS financing and $4.6 million in federal funds on CEIS development. The Governor recommends the final disbursement of the remaining COPS financing in FY 2017, totaling $305,884.
40

Department of Elementary and Secondary Education
Davies Career and Technical School – HVAC – Heating, ventilation, and air conditioning (HVAC) upgrades at the Davies School are necessary due to the age, inefficiency, and defectiveness of the current units. Several areas within the school cannot be properly climate controlled, with some classrooms requiring space heaters during the winter months. The Governor recommends using $5.1 million from the Rhode Island Capital Plan Fund to address this issue, a total that includes: $2.1 million in pre-FY 2017 spending, $498,808 in FY 2017, and a final disbursement of $2.5 million in FY 2018. Davies Career and Technical School – Asset Protection – The Governor recommends $2.6 million in Rhode Island Capital Plan Fund financing for various asset protection projects at the Davies School, including $1.4 million in pre-FY 2017 spending. Projects include various electrical upgrades, flooring renovations, and upgrades to both railings and guardrails necessary to meet code. The School expended $1.4 million Prior FY 2017. The Governor recommends expenditures of $477,911 in FY 2017 and $150,000 annually from FY 2018 through FY 2022. Davies Career and Technical School – Davies Advanced Manufacturing – Davies is a central node of manufacturing workforce development in the state of Rhode Island. To support Rhode Island manufacturers’ personnel needs across industry sectors and increase opportunities for students, Davies will invest strategically in updated technology and infrastructure to prepare the next generation of manufacturing workers. Investments will be guided by the strategic needs of the school and of the industry. The Governor recommends $3.7 million in financing from the RI Capital Plan Fund in FY 2018. Metropolitan Regional Career and Technical – HVAC - The Governor recommends $6.2 million in Rhode Island Capital Plan Fund financing to replace and repair the HVAC system for some buildings at the Met School’s Peace Street and
Public Street campuses. The scope of the project will be to replace outdated, inefficient, and dysfunctional HVAC equipment, controls, and related energy components and systems. This project will also prolong the useful life of the existing HVAC system and implement and install state of the art “green” energy equipment and related systems to create a more comfortable, healthy, and safe environment for students, staff, and visitors. The total recommendation includes pre-FY 2017 expenditures totaling $3.1 million, with a FY 2017 recommendation of $3.1 million to complete the project. Metropolitan Regional Career and Technical School – Asset Protection – The Governor recommends $1.5 million in Rhode Island Capital Plan Fund financing to fund various asset protection projects in FY 2017 through FY 2022. Asset protection financing is necessary to make “Health/Life Safety/Code” repairs at the campuses of the Met School. The total recommendation includes pre – FY 2017 expenditures totaling $349,089, in addition to expenditures of $200,000 in FY 2017, and $250,000 annually in FY 2018 through FY 2022.
41
Public Higher Education
Agency Responsibilities Rhode Island’s Public Higher Education institutions are responsible for the repair, renovation, and improvement of their physical plant infrastructure and extensive inventory of fixed assets. These institutions are the University of Rhode Island (URI), Rhode Island College (RIC), and the Community College of Rhode Island (CCRI), collectively overseen by the Office of the Postsecondary Commissioner (OPC). Combined, these institutions are responsible for approximately 350 structures, comprising over one-third of all state-owned facilities. Buildings are located on eleven campuses and total approximately 5.2 million square feet of space. Given the large number of structures and the need to maintain and modernize facilities, major emphasis is placed on asset protection of the educational infrastructure in the Public Higher Education capital improvement program. Governor's Recommendations University of Rhode Island URI Asset Protection – The Governor recommends expenditures of $55.4 million from the Rhode Island Capital Plan Fund over the CIP period for asset protection projects on the Kingston Campus. The University uses Rhode Island Capital Plan Fund monies as the principal means of financing building and utility infrastructure repair and general renovations. URI is responsible for maintaining over 300 buildings constructed over a period of 120 years, encompassing 4.5 million square feet of space. Additionally, high-voltage electrical, water, steam, sewer, stormwater drainage, hydrant, fire alarm, and various security systems must be continually maintained and upgraded. By fiscal year, the Governor recommends expenditures of $13.6 million in FY 2017; $8.0 million in FY 2018; $8.2 million in FY 2019; $8.4 million in FY 2020; $8.5 million in FY 2021; and $8.7 million in FY 2022. In FY 2017 and FY 2018, a portion of these funds are specifically designated
for the construction of a new Biological Resources Laboratory (also referred to as a “vivarium”).
URI Athletic and Recreation Facilities Advanced Planning – The Governor recommends $250,000 in university funds to plan for the removal or rehabilitation of aged and decayed facilities, including the Slade Outdoor Track and Field, the Natatorium, and the grandstands at Meade Stadium. An architectural and engineering firm will be engaged in FY 2017 to complete feasibility and design work.
URI College of Pharmacy Building – The Governor recommends expenditures of $595,892 in FY 2017 to complete the College of Pharmacy building project. Of this amount, $518,892 is from remaining general obligation bond proceeds and $77,000 is derived from private sources. The total cost of the project will is $70.5 million, of which $65.0 million was financed from a general obligation bond referendum approved by the voters in November 2006.
URI Combined Health and Counseling Center – The Governor recommends expenditure of $21.0 million to combine and co-locate Health Services, currently located in the URI Potter building, and the Counseling Center, currently located in Roosevelt Hall, into a single facility. Of the $21.0 million, $17.5 million is from RIHEBC bonds, $3.0 million is from university funds, and $500,000 is from private funding. If a $17.5 million Debt Management Act Joint Resolution is ultimately approved, $10.2 million of RIHEBC bonds would be disbursed in FY 2020 and $7.3 million in FY 2021. The total amount recommended for all fund sources by year include: FY 2019: $1.6 million; FY 2020: $11.6 million; and FY 2021: $7.8 million.
URI Electric Utility Substation Replacement – The Governor recommends expenditure of $7.0 million from the Rhode Island Capital Plan Fund to replace two electrical substations on the main URI campus, which will receive and distribute
42

Public Higher Education
power underground to campus facilities. Expenditures prior to FY 2017 totaled $5.6 million, with the remaining $1.4 million to be spent in FY 2017 to complete the project.
URI Energy Conservation Phase II – This $12.6 million project, financed with Certificates of Participation, is to purchase energy cost-saving improvements for campus buildings and infrastructure, which have a 15-year cost recovery period. The Governor recommends expenditure of remaining COPS proceeds totaling $5.2 million in FY 2017 and $1.8 million in FY 2018. Previous years’ expenditures total $5.6 million.
URI Energy Conservation Phase III – The Governor recommends Certificates of Participation totaling $11.6 million for an energy performance contract involving the multi-campus installation of LED lighting, HVAC upgrades, building weatherization, and electric sub-metering on the Kingston Campus. If authorized under the proposed Debt Management Act Joint Resolution, COPS proceeds would be disbursed in increments of $7.0 million in FY 2018 and $4.6 million in FY 2019.
URI College of Engineering Building Renovations, Phase I – The Governor recommends expenditures of $125.0 million from the 2014 general obligation bond authorization to complete Phase I of a comprehensive program to renovate and build additions to the existing College of Engineering complex of buildings clustered around the Engineering Quad. The buildings to be razed include Crawford Hall, Gilbreth Hall, Kelly Hall and Annex, and Wales Hall. Also included in Phase I are renovations to Kirk and the construction of a new Engineering building adjacent to Bliss and Kirk Halls. The Governor recommends expenditures of $25.9 million in FY 2017, $35.0 million in FY 2018, $35.0 million in FY 2019, and $27.5 million in FY 2020. Bond proceeds of $1.6 million were spent in the previous fiscal years to begin the project.
URI College of Engineering Building Renovations, Phase II - The Governor recommends $25.5 million in general obligation bond proceeds for Phase II of the College of Engineering’s new construction and renovation project. In Phase II, a 20,000 square foot addition to Bliss Hall will be constructed, combined with full renovation of the existing Bliss Hall structure. The Governor recommends bond expenditures of $1.2 million in both FY 2018 and FY 2019, $12.0 million in FY 2020, and $11.1 million in FY 2021.
URI Facilities Services Sector Upgrade – The Governor recommends expenditures of $11.8 million from RIHEBC bonds to build new facilities for the URI Service Sector, comprised of Facilities Services, Capital Projects, Central Receiving, Postal Services, Lands and Grounds, and a vehicle servicing station. If authorized, projected disbursements of bond proceeds total $931,496 in FY 2021, $2.9 million in FY 2022, and $8.0 million in the post-FY 2022 period.
URI Fine Arts Center Renovation and Addition -The Governor recommends expenditures of university funds totaling $56,930 in both FY 2017 and FY 2018 to complete advance planning efforts for a full-scale renovation of the URI Fine Arts Center, currently a functional but antiquated facility with several structural deficiencies. The Governor further recommends an appropriation of $1.0 million from the Rhode Island Capital Plan Fund to address initial project requirements in FY 2018. In previous fiscal years, $400,000 was expended from the Rhode Island Capital Plan Fund and $211,415 from university funds to address advanced planning and design.
URI Fire Safety/Protection, Academic and Administrative Buildings – The Governor recommends expenditures totaling $13.4 million from the Rhode Island Capital Plan Fund to install sprinkler systems and upgrade or replace fire alarm systems in URI’s academic, administrative, and general business buildings. The FY 2017 recommendation is $2.6 million, with the balance of $10.8 million spent in the
43

Public Higher Education
previous fiscal years. Federal stimulus financing of $12.5 million was expended during the pre-FY 2016 period. Total project funding is $25.8 million.
URI Fire Safety/Protection – Auxiliary Enterprises – The Governor recommends expenditure of $18.2 million from previously approved RIHEBC bonds to install sprinkler systems and upgrade fire alarms in several auxiliary buildings. This project includes Potter Health Services Center, existing residential, dining, commercial, and other buildings. The bonds are backed with auxiliary account revenues. Recommended disbursements total $5.9 million in FY 2017 and $2.0 million in FY 2018, with pre-FY 2017 expenses of $10.3 million.
URI Fraternity Circle Infrastructure, Phase I - The Governor recommends expenditures of $5.1 million from RIHEBC bonds for underground infrastructure improvements to the Fraternity Circle section of the Kingston campus. This project includes improving/replacing underground utility systems in the vicinity of Fraternity Circle. The 2015 General Assembly approved a Debt Management Act Joint Resolution allowing for a RIHEBC (conduit) bond issuance, with planned expenditures of $491,689 in FY 2017, $3.9 million in FY 2018, and $742,220 in FY 2019.
URI Fraternity Circle Infrastructure, Phase II - The Governor recommends expenditures of $3.0 million in private funding for landscaping improvements to the URI Fraternity Circle precinct to create a pleasant, safe, and more aesthetically cohesive neighborhood which enhances the communal aspect of Greek life. The Governor recommends expenditures of $228,025 in FY 2019 and $2.8 million in FY 2020. “Gateway to URI” Welcome Center – The Governor recommends expenditures of $7.6 million from university funds beginning in FY 2016 to build a new 12,500 square foot Welcome Center building on Upper College Road at the site of the current visitors center.
Expenditures by year are $1.5 million in FY 2017 and $6.0 million in FY 2018 to complete the project.
URI Hope Commons Expansion – The Governor recommends $2.3 million from university funds to expand and update the dining hall in Hope Commons, to offer late night, off-hours dining opportunities for a growing student population. The Governor recommends expenditures of $256,814 in FY 2020 and $2.0 million in FY 2021 to complete this project.
URI New Chemistry Building – The Governor recommends total expenditures of $76.8 million for the (recently constructed) new Chemistry Building, including $61.0 million in authorized general obligation bond proceeds, $3.9 million in private financing, $8.8 million from the Rhode Island Capital Plan Fund, $230,836 from third party financing, and $2.8 million from university funds. The modern facility houses the Chemistry Department, and includes teaching laboratories and classrooms, research laboratories, and faculty and administrative offices. To date, $72.5 million has been spent, and the Governor recommends $4.2 million in combined financing for FY 2017 to fully complete the project.
Rhode Island Nursing Education Center - The Governor recommends expenditures of $10.5 million in Certificates of Participation and $301,859 from the Rhode Island Capital Plan Fund for furnishings for the new Rhode Island Nursing Education Center, located on the South Street Landing property in Providence, for FY 2017. The new facility is a shared education institute between the University’s nursing school and the nursing program at Rhode Island College. Furnishings include laboratory and lecture spaces, and simulation labs for training of students. It is anticipated that occupancy will occur in February, 2017, allowing URI and RIC time to fully outfit the building with equipment and furnishings for the academic term beginning in the fall of 2017. Article 4 of the FY 2015 Appropriations Act authorized the Board of
44

Public Higher Education
Education and the Department of Administration to enter into a multi-year lease with the developer of the property for use as a Nursing Education Center. The state’s obligations for the base lease and tenant improvement costs, along with the debt service on the COPS, is budgeted in the Office of the Postsecondary Commissioner.
URI Ranger Hall Renovation – The Governor recommends expenditures of $1.2 million in FY 2017 to complete the Ranger Hall renovation project. This amount includes $81,972 from third party funding and $1.1 million of private funding. The 36,000 square foot building is on the Quadrangle and was built in 1913. When the renovations are completed, the building will house the new Harrington School of Communication and Media. The full cost of the project totals $5.5 million.
URI Repaving and Road Construction – The Governor recommends total expenditures of $14.4 million, with $8.5 million already expended in prior fiscal years, to repave and reconstruct major parking facilities, internal roadways, and walkways across three of its four campuses. Of the $14.4 million, $13.7 million is from RIHEBC bonds and $675,680 is from university funds. To complete the project, the Governor recommends $3.0 million in FY 2017 and $3.0 million in FY 2018 from issued RIHEBC bond proceeds.
URI Repaving, Hardscape and Landscape – The Governor recommends expenditures of $10.0 million from RIHEBC bond proceeds for repaving, hardscape, and landscape programs. This is the fifth phase of the University’s progressive work to repave and reconstruct major parking facilities, internal roadways, and walkways across three of its four campuses. The disbursements recommended by year are as follows: FY 2019: $3.5 million; FY 2020: $2.9 million, and FY 2021: $3.6 million. URI Upper College Road Multi-use Development – The Governor recommends
expenditures of $1.4 million from university funds to create a multi-use facility on Upper College Road. This public-private partnership will include a hotel, apartment style housing units, a restaurant, retail bookstore, and conference space. The Governor recommends expenditures of $482,703 in FY 2017, $583,715 in FY 2018, and $279,607 in FY 2019.
URI Biotechnology Center – The Governor recommends expenditures of $156,439 in FY 2017 for minor follow-up expenses for the Biotechnology Center, financed via a previous appropriation from the Rhode Island Capital Plan Fund.
URI Utility Infrastructure Upgrade, Phase I – The Governor recommends expenditures of $6.5 million spanning FY 2019 and FY 2020 for Phase I of the utility infrastructure upgrade project. This project will upgrade steam/condensate distribution systems, water distribution systems, electrical distribution conduits, sanitary sewer systems, and storm water management systems. The project will be financed from a future issuance of RIHEBC bonds, assuming passage of a Debt Management Act Joint Resolution.
URI Utility Infrastructure Upgrade, Phase II – The Governor recommends expenditures totaling $18.4 million for Phase II of the utility infrastructure upgrade project, commencing in FY 2021. This project will continue and expand upon the upgrades initiated in Phase I. The project will be financed from a future issuance of RIHEBC bonds, assuming passage of a Debt Management Act Joint Resolution.
White Hall Renovations – The Governor recommends expenditures of $3.6 million for renovations to the White Hall building, which currently houses the URI College of Nursing. Of this amount, $1.3 million is financed from the Rhode Island Capital Plan Fund and $2.3 million is from university funds. Project expenses of $1.1 million were incurred in fiscal years proceeding FY 2017, consisting of $0.9
45

Public Higher Education
million in RICAP funds. All-funds expenditures are currently planned at $1.9 million in FY 2017 and $675,000 in FY 2018.
URI White Horn Brook Apartments – The Governor recommends expenditures of $94.3 million for the construction of a new, apartment-style residence hall. Of the $94.3 million, $5.6 million is from institutional funds, with $88.8 million derived from the issuance of RIHEBC bonds. The newly constructed hall would accommodate approximately 500 new beds, and is a critical enhancement to the stock of convenient and affordable student housing on the Kingston Campus. Combined all-funds disbursements of $4.1 million in FY 2017, $49.8 million in FY 2018, and $39.7 million in FY 2019 are currently projected. Pre-FY 2017 advance planning and preliminary design activities were financed with $0.7 million of university funds. Authorization for the $88.8 million RIHEBC bond issuance is contained in the Governor’s FY 2018 Appropriations Act.
Rhode Island College
RIC Asset Protection – The Governor recommends expenditures of $24.9 million from the Rhode Island Capital Plan Fund for asset protection projects on the Rhode Island College campus during the FY 2017 through FY 2022 time period. The funding will be used to renovate buildings, and maintain and repair buildings, roads, and the campus infrastructure. The amounts recommended by year from the Rhode Island Capital Plan Fund are as follows: FY 2017: $5.8 million; FY 2018: $3.5 million; FY 2019: $3.6 million; FY 2020: $3.7 million; FY 2021: $4.2 million; and FY 2022: $4.2 million. Prior to FY 2017, $22.6 million has been spent on asset protection projects at RIC, including electrical upgrades to the Adams Library and HVAC replacements at Roberts and Fogarty Halls.
RIC Modernization/Renovation of Academic Buildings, Phase I – The Governor recommends total expenditures of $56.8 million to renovate and modernize Adams Library, Craig Lee Hall
and Gaige Hall. Of this total, $44.7 million is financed from general obligation bond proceeds authorized in 2012 and $12.1 million is financed from the Rhode Island Capital Plan Fund. The project will include: re-purposing areas of Adams Library to accommodate student service organizations and academic departments that will be moving out of Craig Lee Hall and Gaige Hall prior to renovating these buildings; renovating restrooms and classrooms, replacing mechanical and electrical systems, new windows, and brick and slate work. The all-funds disbursements recommended by year are as follows: FY 2017: $20.0 million; FY 2018: $24.1 million; and FY 2019: $6.0 million. Bond proceeds of $6.7 million were expended prior to FY 2017.
RIC Modernization/Renovation of Academic Buildings, Phase IV – The Governor recommends $150,000 from the Rhode Island Capital Plan Fund in FY 2019 to finance a feasibility study of proposed renovations of the Clarke Science Building and the Henry Barnard School.
RIC Auxiliary Enterprise Asset Protection – The Governor recommends auxiliary revenue funds totaling $5.2 million to complete roof replacements of Donovan Dining and the Student Union. In future years, Rhode Island College will include auxiliary-funded capital repairs under this project to identify and address the deferred maintenance of the residence halls, dining, and student union operations. Projected disbursements total $2.2 million in FY 2017 and $500,000 from FY 2018 through the post-FY 2022 period.
RIC East Campus Improvements – The Governor recommends $150,000 from the Rhode Island Capital Plan Fund in FY 2020 to finance a feasibility study of proposed renovations to several buildings on the eastern side of the RIC campus.
RIC Energy Performance Contract (ESCO) - The Governor recommends expenditures totaling $7.5 million in FY 2017 and FY 2018
46

Public Higher Education
for an Energy Performance Contract to purchase energy savings improvements for buildings and infrastructure. Authorized Certificates of Participation (COPS) will provide the financing for the energy efficiency improvements, and the resultant energy savings will be applied toward debt service on the certificates. Disbursements of COPS proceeds by year are projected at $3.0 million in FY 2017 and $4.5 million in FY 2018.
RIC Faculty Center Renovation – The Governor recommends expenditures of $50,000 from college funds in FY 2017 to pursue a feasibility study regarding the renovation of the faculty center, located in the Donovan Dining Center. This study will determine project scope and phasing, and will provide estimated costs of improvements to HVAC systems, lighting, and audio/video systems.
RIC Renovate/Addition to Fogarty Life Sciences Building – The Governor recommends expenditure of $5.3 million in general obligation bond proceeds to renovate and build an addition on the Fogarty Life Sciences building. The renovation work includes improvements to the building envelope, interior spaces, handicapped accessibility, and upgrades to the HVAC and electrical systems. It is expected that the $1.2 million unspent balance of issued proceeds will be expended FY 2017, bringing the project to substantial completion.
RIC New Residence Hall – The Governor recommends the use of third-party financing totaling $40.0 million to construct a new residence hall on the RIC campus, potentially through a public-private partnership. To supplement third-party financing and provide for project initiation, the Governor recommends an FY 2018 appropriation of $3.0 million from the Rhode Island Capital Plan Fund. A feasibility study financed with $98,000 in college funds was completed in May 2016.
RIC Modernize/Renovate Existing Residence Halls – The Governor recommends renovating five of the existing six residence halls at RIC, including Thorp, Browne, Willard, Weber, and
Sweet Halls, which range in age from 20 to 50 years old. The Governor recommends third-party financing totaling $85.0 million over a two-year period beginning in FY 2022. Rhode Island Capital Plan Fund financing will total $10.0 million, with $5.0 million recommended in both FY 2021 and FY 2022. College funds totaling $86,000 financed a feasibility study, completed in April 2016.
RIC Infrastructure Modernization – The Governor recommends expenditures of $22.4 million from the Rhode Island Capital Plan Fund between FY 2017 and FY 2022 to modernize the infrastructure on the campus of Rhode Island College, including improving traffic circulation on campus, road paving and parking, replacement of steam and water lines, electrical transformers and distribution systems, and network voice and data telecommunication systems. Recommended appropriations of Rhode Island Capital Plan Funds by year is as follows: FY 2017: $2.8 million; FY 2018: $4.5 million; FY 2019: $4.5 million; FY 2020: $3.6 million; FY 2021: $3.5 million; and FY 2022: $3.5 million. Pre-FY 2017 expenditures for this project totaled $10.2 million, yielding a total project cost of $32.6 million.
Community College of Rhode Island
CCRI Asset Protection – The Governor recommends expenditures totaling $15.7 million from the Rhode Island Capital Plan Fund, spanning FY 2017 through FY 2022, for asset protection projects on the Knight, Flanagan, Liston, and Newport County campuses. Typical projects include replacing asphalt surfaces and concrete walkways; painting; replacing lockers, flooring, lighting; and building system refurbishment and replacement. Disbursements by year are recommended as follows: FY 2017: $3.0 million; FY 2018: $2.8 million; FY 2019: $2.4 million; FY 2020: $2.4 million; FY 2021: $2.5 million; and FY 2022: $2.5 million. Pre-FY 2017 expenditures total $15.1 million.
CCRI Accessibility Improvements – The Governor recommends $1.9 million, comprised
47

Public Higher Education
of $472,758 from other funds and $1.4 million from college funds for facility and classroom accessibility features, communication systems, elevators and accessible parking at each of its four campuses.
CCRI Flanagan Campus Lecture Halls – The Governor recommends expenditures of $908,000, including $490,000 from college funds and $418,000 from private funding for the renovation of five lecture halls on the Flanagan Campus of CCRI. Work includes updating the lighting, replacing auditorium chairs, replacing carpeting, AV upgrades, installation of non-skid floor paint, and removal of aged and unused equipment. This project will reach substantial completion in FY 2018.
CCRI Flanagan Campus Renewal – The Governor recommends $10.1 million, including $100,000 from college funds in FY 2019 and $10.0 million from the Rhode Island Capital Plan Fund (RICAP) to complete a comprehensive review and prepare a master plan for the campus. Classroom utilization, especially for health care students, is a significant concern, requiring a plan for new learning environments and laboratory spaces. Faculty office space and the field house locker rooms will also be renovated under this project. Projected disbursements of RICAP financing are currently estimated at $2.0 million in FY 2020, FY 2021, and FY 2022. Project completion will occur in the post-FY 2022 period, with $4.0 million of RICAP funds programmed within that timeframe.
CCRI Knight Campus Renewal - The Governor recommends $17.2 million from the Rhode Island Capital Plan Fund, spanning FY 2017 through FY 2020, for renovation projects and facility upgrades to the Knight Campus megastructure. Projects include roadway and landscape improvements to the main entrance; upgrading the bookstore; replacing sewer pipes, water pipes, electrical transformers, wood doors, lighting, hardware, and various other upgrades and improvements. Projected financing by fiscal year is as follows: FY 2017: $7.0 million; FY
2018: $5.3 million; FY 2019: $4.3 million; and FY 2020: $3.9 million. Pre-FY 2017 RICAP expenditures totaled $2.9 million. Rhode Island Capital Plan Funds are supplemented by other funds totaling $3.3 million and college funds of $0.1 million, yielding an all-in project cost of $23.5 million.
CCRI Knight Campus Biology and Chemistry Lab Renovation – The Governor recommends expenditures of $750,000 from the Rhode Island Capital Plan Fund, with $375,000 budgeted in both FY 2018 and FY 2019, to complete the renovation of the CCRI chemistry and biology labs. This project will modernize all lab equipment and provide the necessary structural upgrades to attain current code standards.
Office of the Postsecondary Commissioner
Westerly Campus – A satellite campus of CCRI, the Westerly Higher Education and Industry Center is a vocational training facility that commenced initial operations in late 2016 with classes being offered by CCRI for Electric Boat employees. This project represents a direct vehicle for general economic development, regional economic stimulus, and high-wage/high-skill job creation, particularly for students opting not to attend a traditional 4-year undergraduate program. To complete the construction and furnishing of this 34,500 square foot facility (consisting of 17 classrooms), the Governor recommends expenditures of $5.7 million in FY 2017, including $2.0 million from the Rhode Island Capital Plan Fund, $3.0 million from private funding, and $750,000 from general revenue. The Governor further recommends $1.3 million in FY 2018 general revenue funds for final construction expenses at the Center.
48

RI Council on the Arts
Agency Responsibilities The Rhode Island State Council on the Arts (RISCA) was established in 1967. It provides grants, technical assistance and support to artists, arts organizations, schools, community centers, social service organizations, and local governments to bring the arts into the lives of Rhode Islanders. RISCA employs a variety of methods to carry out its work, including grant-making, strategic partnerships, outreach and facilitation. Governor's Recommendations Creative and Cultural Economy – In November 2014, voters approved the issuance of $35.0 million in general obligation bonds to fund capital improvement, preservation, and renovation projects for public and nonprofit artistic, performance centers, historic sites, museums, and cultural art centers located throughout the State of Rhode Island. Of the $35.0 million, $30.0 million will be used to capitalize a new Cultural Arts and the Economy Grant program which will provide 1:1 matching grants and will be administered by the State Council on the Arts. Of the $30.0 million, $6.9 million is to be allocated by the RI Council on the Arts through a competitive application process, with the remaining funds designated for the following organizations: $4.6 million for Trinity Repertory Company; $2.4 million for Rhode Island Philharmonic; $4.2 million for Newport Performing Arts Center; $2.4 million for United Theatre/Westerly Land Trust; $1.1 million for The Chorus of Westerly; $2.1 million for The Stadium Theatre Conservatory in Woonsocket; $1.1 million for 2nd Story Theater; $2.1 million to AS220; and $3.2 million for WaterFire Providence. The Governor recommends financing of $10.2 million in FY 2017, $7.0 million in FY 2018, and $2.5 million in FY 2019.
49
Rhode Island Atomic Energy Commission
Agency Responsibilities The Rhode Island Atomic Energy Commission operates the Rhode Island Nuclear Science Center (RINSC) for the purposes of research, education and training, and for matters relating to the health, welfare, and economy of the people of Rhode Island. The RINSC is located on the Narragansett Bay Campus of the University of Rhode Island. Governor's Recommendations Atomic Energy Commission Asset Protection – The Governor recommends expenditures of $309,895 from the Rhode Island Capital Plan Fund over the period FY 2017 through FY 2022 for several Atomic Energy Commission asset protection projects, including replacing HVAC systems, landscaping the facility, updating the fire protection system, painting the building and the confinement stack, replacing emergency generators, and various other items. Expenditures prior to FY 2017 total $456,889. By fiscal year, the Governor recommends expenditures as follows: $59,895 in FY 2017; and $50,000 per year from FY 2018 through FY 2022.
50
Historical Preservation and Heritage Commission
Agency Responsibilities The Rhode Island Historical Preservation and Heritage Commission (HPHC) is responsible for the protection and preservation of historic buildings, districts, and archaeological sites in Rhode Island. Currently, HPHC administers a grant program that funds restoration at museums, cultural centers, and public historic sites located in historic structures. Governor's Recommendations Historic Preservation Grants – As part of the initiative to develop the creative cultural economy in Rhode Island, a general obligation bond of $35.0 million was presented to and passed by voters on November 4, 2014. Of the $35.0 million, $30.0 million will be for the State Cultural Arts and the Economy Grants Program under the Rhode Island Council on the Arts, while the remaining $5.0 million will be used to capitalize the State Preservation Grants Program under HPHC, to be disbursed at $1.0 million per year for five years starting in FY 2016. Due to delays, $2.0 million will be awarded in FY 2017 with the remaining funds being disbursed as scheduled. The schedule of bond issuance may be further altered should grant applications and subsequent awards diverge from the current plan of $1.0 million per year. Specifically, it will assist cities and towns and non-profit organizations to renovate and improve public and nonprofit historic sites, museums and cultural art centers located in historic structures in the State of Rhode Island. To date, this program has invested $6.0 million in prior general obligation bond issuances, distributing these funds through a competitive grant program for restoration of historic buildings used as museums, cultural art centers, and public historic sites. This matching grant program offers grants in two categories: Small Project grants which range from $5,000 to $30,000; assistance to projects that cost less than $45,000; and Large Project grants which climb up to $150,000.
51

Public Safety
Attorney General Department of Corrections
Judicial Military Staff Public Safety
Rhode Island Emergency Management Agency


Attorney General
Agency Responsibilities The Attorney General is established under the Rhode Island Constitution as one of the five general officers subject to election by the voters. As the State’s central legal agency, the Attorney General is responsible for the prosecution of all felony criminal cases, misdemeanor appeals, and misdemeanor cases brought by state law enforcement action in the various district courts. Governor's Recommendations Building Renovations and Repairs – In December of 1995, the State of Rhode Island acquired the office building located at 150 South Main Street in Providence to serve as the main office for the Department of the Attorney General. The Department has identified the following areas that are in need of repairs: HVAC upgrades, repointing/limestone repair, piping infrastructure, fire protection upgrades, roof replacement, electrical upgrades, elevator repairs and renovation of the cupola. The Governor recommends $3.1 million from the Rhode Island Capital Plan Fund. Prior to FY 2017, $2.0 million has been expended for this project. The Governor recommends $417,530 in FY 2017, and $150,000 annually in FY 2018 through FY 2022. Automated Fingerprint Identification Systems – The Automated Fingerprint System (AFIS) is used to transmit fingerprint data from local and state police departments to the Bureau of Criminal Identification’s Rhode Island Criminal History database. Since 1995, the State of Rhode Island has partnered with the State of Connecticut on a system. In order to comply with differences between Connecticut and Rhode Island laws as well as speed up the process of conducting background checks, a new AFIS system is recommended. Project completion is scheduled for FY 2017. Total financing of $3.7 million is recommended. Prior to FY 2017, $1.4 million in federal funds and $375,816 in issued general obligation bond funds have been expended for this project. For FY 2017, the Governor recommends $374,184
in expenditures from issued general obligation bond funds and $1.6 million from federal funds. Google Forfeiture Funds – The Department secured a one-time forfeiture of $60.0 million from Google as a result of an investigation into the advertisement of prescription drugs by Canadian pharmacies through Google’s AdWords advertising program. With adherence of standards identified by the United States Department of Justice, the Department has utilized these resources to: 1) address its real estate needs by purchasing a second building at 180 South Main Street in Providence, financing renovations and upgrades, purchasing furniture and equipment, and updating its information technology infrastructure; 2) begin construction of a new Customer Service Center to be located on the Pastore Complex in Cranston; 3) allocate resources for generator upgrades, security upgrades, and roof replacement in the 150 South Main Street building; and 4) redesign and renovate the 150 South Main Street headquarters. Expenditures prior to FY 2017 totaled $12.1 million. The Governor recommends FY 2017 expenditures of $14.0 million and FY 2018 expenditures of $12.7 million.
52

Department of Corrections
Agency Responsibilities The Department of Corrections is responsible for the provision of safe, secure, and humane control of offenders. The Department’s facilities are located at the Pastore Center in Cranston and include administrative buildings (including Administration and Dix) and seven inmate institutions (High Security, Maximum Security, Moran Medium Security, Minimum Security, the New Gloria McDonald and Bernadette Guay Women’s facilities, and the Intake Services Center), collectively known as the Adult Correctional Institutions (ACI). All of the facilities are maintained through the Department of Corrections’ capital improvement program. Major capital projects include the construction and expansion of new and replacement of secure and program support facilities; the acquisition of new or replacement support systems, such as fencing, alarm systems, and security cameras; electrical and HVAC upgrades; roof and window replacements; interior and exterior renovations; and parking lot and road repairs. Governor’s Recommendations All of the projects recommended by the Governor in FY 2017 through FY 2022 will be financed from the Rhode Island Capital Plan Fund. The Gloria McDonald facility (the former Reintegration Center) was previously ninety percent federally funded from the Violent Offender Incarceration-Truth in Sentencing (VOI-TIS) program. Nineteen subprojects will be financed in a single asset protection line item, while the remaining projects remain separate. Repair, Renovation, and Equipment Replacement Projects Corrections Asset Protection - The Governor recommends a total of $36.7 million from the Rhode Island Capital Plan Fund for a variety of general repair and maintenance, safety and security, and facility enhancement projects that will preserve the correctional system’s existing physical assets. Pre-FY 2017 expenditures
totaled $14.6 million; $3.2 million is scheduled for FY 2017; $3.9 million is scheduled for FY 2018; and $3.8 million is annually from FY 2019 to FY 2022. The project’s single appropriation is designed to provide the Department with maximum flexibility in the selection and timing of its various projects. The following projects are under way or are under consideration by the Department for funding under asset protection: Complex-Wide Facilities Capital Projects –
The Department estimates expenditure for miscellaneous smaller scale work of an immediate nature where repairs are required within the year or are important in maintaining the current operation of various facilities. Typical past repair projects have included air handling unit repairs, drain installations, roof replacement. Projects completed include new public address systems in all facilities, and laundry system replacements and improvements. New projects include window upgrades in the Administration building.
Security Camera Installation - The Department estimates expenditures of $5.0 million in FY 2017 - FY 2022 for the installation of surveillance cameras in and around the Intake Service Center, High Security, and Minimum Security.
Fire Code Renovations – The Department
estimates total expenditures of $675,000 in FY 2017 - FY 2021, for fire alarms, fire doors and partitions, electrical circuitry work, and other improvements at all facilities, as mandated by the State Fire Marshall, as well as anticipated further changes.
Security System Upgrades/Replacement –
The Department estimates total expenditures of $4.9 million in FY 2017 - FY 2022, to replace cameras at all secure facilities, including exterior systems.
53

Department of Corrections
Minimum Infrastructure/Windows – The Department estimates expenditures of $970,000 in FY 2017 - FY 2019 to replace windows, sashes and casements to maintain the required temperature level in winter and to provide extra security due to the transfer of some inmates from the now closed Medium Price facility.
Emergency Generators – The Department estimates $1.5 million in expenditures for FY 2017 through FY 2022 to replace emergency generators in facilities whose generators are reaching or exceeding their useful life of 25 years. This would include relocating an existing generator from Dix to Maximum Security and replacing the generator at Bernadette.
Hot Water Converters – The Department estimates $375,000 in financing for FY 2017 through FY 2021 to replace aging and leaking water tanks and ancilliary pumps and valves at various housing units.
Hot Water Distribution Equipment – The Department estimates expenditures totaling $425,000 in FY 2017 through FY 2021 to replace aging equipment throughout the complex.
Maximum Security Railing Extensions – The Department estimates total expenditures of $90,000 in FY 2019 - FY 2021 to increase the length of railings and to close the distance between bars to comply with state building code requirements.
High Security Interior Renovations – the Department estimates $1.7 million in financing will be needed in FY 2017 through FY 2019 to replace flooring, remove deteriorated carpets, carpentry and window upgrades for control centers, fix cell door food traps, and renovate showers and bathrooms. This project is on hold pending completion of the facility study (see below).
Complex-Wide A/E Mechanical and Architectural Work – The Department estimates total expenditures of $600,000 in FY 2017 through FY 2022 to develop designs for all such projects as required for building code approval and bid process eligibility.
Complex-Wide HVAC – The Department estimates $1.4 million for FY 2017 through FY 2022 to repair, replace or upgrade several heating and air conditioning systems to a higher standard of efficiency.
Prison Rape Elimination Act (PREA)
Compliance – The Department estimates $150,000 in FY 2017 - FY 2019 to install new shower doors and other measures to bring facilities into compliance with federal standards.
Gloria McDonald Programming, Gym, and
Recreation Area – The Department estimates $1.4 million in FY 2021 - FY 2022 to construct a new building for indoor recreation and classroom space at the women’s facility.
Maximum Security Cupola – The
Department estimates $580,000 in FY 2017 - FY 2018 to replace the 100-year old structure to its original R.I. Historical Society specifications in order to avoid water damage.
Central Distribution Center – The
Department estimates $1.1 million in FY 2017 and FY 2018 to renovate basement offices, loading dock, and a new generator tank.
General Renovations - Maximum - The Governor recommends expenditures of $7.8 million to complete the current project scope. Pre-FY 2017 expenditures total $4.3 million. The project scope includes the replacement of the buildings electrical and distribution systems, renovation of the outside segregation yard,
54

Department of Corrections
installation of a new emergency generator, renovations of the plumbing system, repointing, steam pipe insulation, laundry upgrades, shower exhausts, kitchen floor replacement, and roof replacement. The Governor recommends financing of $1.3 million in FY 2017 and FY 2018, $500,000 in FY 2019, and $350,000 in FY 2020. Medium Infrastructure – The Governor recommends $23.2 million to expand the showers, laundry, kitchen and dining areas; replace heat exchangers, heat pumps, HVAC coils, chiller units and support equipment; and replace the roof. The expanded project will accommodate the increase in the inmate population now housed at the Medium-Moran facility. Pre-FY 2017 expenditures total $876,023. The Governor recommends financing of $2.0 million in FY 2017; $7.3 million in FY 2018; $6.0 million in FY 2019; and $7.0 million in FY 2020. Intake Service Center – Exterior Envelope/HVAC Restoration – The Governor recommends total expenditure of $8.2 million, with $707,590 in prior year expenditures; $425,000 in FY 2017; $2.0 million in FY 2018; $1.7 million in FY 2019; $2.2 million in FY 2020, and $1.2 million in FY 2021 for this project to restore the exterior façade of the center, including patching, joint sealing, and resealing brick veneers, as well as to replace all windows and casements damaged by water. Combined with this project is the renovation of the HVAC system, including new chillers, cooling tower, and tubing, and the replacement of heat exchangers, hot water equipment, and circulating pumps. The project also includes replacement of the door and locking system. Several of the subprojects could result in energy savings, and will be bid separately with one approved contractor. Construction, Relocation and Expansion Projects New Gloria McDonald Women’s Facility Renovations – A vacant building facility has
been converted to a new women’s facility in order to address deficiencies in program space, segregation concerns, and security issues in the former Dix and McDonald facilities. To complete this project, the Governor recommends expenditures of $4.1 million in Rhode Island Capital Plan funds. $3.4 million has been spent to date, with $539,133 to be expended in FY 2017 and $150,000 in FY 2018 to complete bathroom, bathing area, and cell modifications, alleviation of privacy concerns, as well as acquisition of furniture and other equipment. The building capacity is sufficient to house the 168 female inmates previously housed at the Dix and McDonald facilities. Because additional program space will be required, the Governor also recommends the use of the neighboring Bernadette Guay building to house Women’s Facilities programs and activities, as well as renovation of the existing Dix facility for office space. These projects are discussed separately below. Dix Renovations – The Governor recommends financing of $4.7 million in Rhode Island Capital Plan Fund resources, which includes roof replacement; installation of a new gutter system; and replacement of water-damaged ceilings, interior walls and aged electrical systems. This project also includes repointing of all exterior masonry and waterproofing basement grade level, as well a replacement of the HVAC system. In addition, as part of the relocation of female inmates from the Dix and Gloria McDonald facilities, the Governor recommends expenditures to fund renovations of the Dix facility for re-use as office space. Staff from Probation and Parole, Education Unit, and Tactical Team personnel from the Bernadette Guay building, as well as the Correctional Officer Training Academy, the Planning and Research Unit, and Home Confinement from the Pinel Building, have moved to this newly renovated space. Pre FY 2017 expenditures total $2.4 million. The Governor recommends financing of $311,066 in FY 2017; $1.1 million in FY 2018; $250,000 in FY 2019, and $650,000 in FY 2020.
55

Department of Corrections
Correctional Facilities Study – The Governor recommends $250,000 in Rhode Island Capital Plan Fund in FY 2017 to finance a feasibility study to determine both the costs and the benefits of replacing the Department’s Maximum and High Security facilities with a new facility. The focus of the study will be the construction of a new facility that houses both populations within the current facility footprints or elsewhere on the Pastore Center campus. The study will examine problems with the relatively high cost per inmate of both facilities and the need for expensive repairs for the Maximum Security facility that was built in 1878. The study will be performed under the supervision of the Division of Capital Asset Management and Maintenance (DCAMM) of the Department of Administration.
56

Judicial
Agency Responsibilities Rhode Island has a unified court system composed of six statewide courts. The Supreme Court is the court of review, the Superior Court is the general trial court, and the Family, District, Traffic Tribunal and Worker’s Compensation Courts are trial courts of special jurisdiction. The Traffic Tribunal was created in 1999 to replace the Administrative Adjudication Court. The Rhode Island court system is state-operated, except for the probate courts, which are the responsibility of cities and towns, and the municipal courts, which are local courts of limited jurisdiction. The Chief Justice of the Supreme Court is the executive head of the Rhode Island court system. Each court has responsibility over its own operations and has a chief judge, who appoints an administrator to handle internal court management. The Chief Judge of the District Court serves as the Chief Judge of the Traffic Tribunal. The Judicial Department has maintenance and repair responsibility for six court buildings located in various parts of Rhode Island. Prior to FY 2005, the Department of Administration had responsibility for the supervision and maintenance of all courthouse buildings. In FY 2005, the General Assembly transferred this responsibility to the Judiciary. Governor's Recommendations Judicial Complexes HVAC Repairs - The Governor recommends expenditures of $10.3 million to restore or replace heating, ventilation and air conditioning systems, as necessary, at the Licht, Garrahy, Murray, McGrath, Kent, Traffic Tribunal and Fogarty courthouses. Future year’s projects include more air handling unit replacement at Garrahy, replacement of make-up air units at the Fogarty Complex, and new chillers at Garrahy. Prior year expenditure was $5.3 million. Amounts recommended by year are as follows: FY 2017 - $1.1 million; FY 2018 - $900,000 and; $1,000,000 in each of FY 2019 FY
2020, and FY 2021. These projects are financed from the Rhode Island Capital Plan Fund. Asset Protection - The Governor recommends expenditures of $12.7 million from the Rhode Island Capital Plan Fund for asset protection projects at various courthouses. The 2006 General Assembly reclassified numerous projects in the Judiciary as Asset Protection with the intent of more accurately reflecting the nature of the projects and allowing for greater flexibility in prioritizing projects. The Judiciary’s asset protection list includes security upgrades, courtroom restorations, restroom renovations, interior refurbishments to public areas and office space, elevator upgrades, and exterior courthouse refurbishments. In FY 2017, Rhode Island Capital Plan Fund financing will continue elevator upgrades at four court complexes, fire suppression and alarm installations, real-time security enhancements for hearing rooms and entrance ways, including camera installation and conversion to internet protocol cameras, replacement of Halon fire suppression systems with new sprinkler systems, and interior restorations to areas subject to high traffic. The amounts recommended by year are as follows: FY 2017 - $868,614; FY 2018 - $950,000; FY 2019 - $950,000; FY 2020 - $1.0 million; FY 2021 $1.0 million, and FY 2022 $1.0 million. Total expenditures prior to FY 2017 total $7.0 million. Licht Judicial Complex Restoration – The Governor recommends expenditures of $5.8 million from the Rhode Island Capital Plan Fund for restoration and renovation of the Licht Judicial complex. These funds will be used to repair decaying plaster; replace or renovate courtroom benches; replace carpeting; and repaint the courthouse interior. The interior woodwork and plaster restoration is especially labor intensive due to the ornate quality of the building’s original accoutrements. Architectural and engineering work has been completed for one courtroom and construction is underway. Four courtrooms are completed. The Governor
57

Judicial
recommends $750,000 in each year from FY 2017 through FY 2022. Expenditures prior to FY 2017 total $1.3 million. Licht Window/Exterior Restoration-The Governor recommends $1.3 million in Rhode Island Capital Plan Fund financing for a new project for window replacement, roof repair, painting, and brick masonry repair at the Licht Judicial Complex. The Governor recommends $500,000 in FY 2018 and $800,000 in FY 2019. Licht Chillers Replacement-The Governor recommends $1.2 million in Rhode Island Capital Plan Fund financing to replace two 30-year chillers in the Licht Complex. The Governor recommends expenditure of $600,000 in FY 2019 and $600,000 in FY 2020. Noel Complex Shelled Courtroom Build-out- The Governor recommends expenditures of $10.0 million in Rhode Island Capital Plan Fund financing for the build-out of unfinished courtroom space at the Noel Judicial Complex in Warwick. The interior completion of a space large enough for three courtrooms was not completed during the initial construction in FY 2007. The Governor recommends build-out of the space, in part to serve the growing South County population currently served by the McGrath Complex in Wakefield, and to relieve the overcrowded Garrahy Complex in Providence. The build-out will also include an addition to the existing parking structure, which is at near full capacity for the courtrooms currently in use. Prior year expenditure was $2.6 million. The Governor recommends $3.4 million in FY 2017 and $4.0 million in FY 2018. Garrahy Courtroom Restoration-The Governor recommends $500,000, $250,000 in each of FY 2021 and FY 2022 to restore or replace courtroom seating and benches, repaint surfaces, restore or replace carpeting, and refinish woodwork at the courthouse. Murray Courtroom Renovation-The Governor recommends $700,000, $350,000 in each of FY
2021 and FY 2022 to restore or replace courtroom seating and benches, repaint surfaces, restore or replace carpeting, restore ornamental plaster, and refinish woodwork at the courthouse. All future expenditures are from the Rhode Island Capital Plan Fund.
58

Military Staff
Agency Responsibilities The Adjutant General is responsible for fourteen armories, four air support facilities, two training sites, and six logistical sites, including four organizational maintenance shops (OMS) and one combined support maintenance shop (CSMS). The armories include the Armory of Mounted Commands and the Benefit Street Arsenal, both located in Providence, and eleven other armories located in Bristol, Warren, Middletown, North Smithfield, East Greenwich (4), Warwick, and Cranston (2). In general, the armories are operated and fully maintained with state funds. The exceptions are the Warwick and East Greenwich armories, which are maintained with 75 percent federal funds and 25 percent general revenue funds. The four aviation support facilities are located at Quonset Point (2), Coventry, and North Smithfield. Quonset Point houses two facilities, one operated by the Army National Guard (Quonset Armory) and one by the Air National Guard. These facilities serve as maintenance facilities, unit headquarters, meeting places, and equipment/personal effects storage areas for Army Guard and Air Guard units. These facilities are maintained with 75 percent federal funds and 25 percent general revenue funds. The Military Staff operates two training camps, Camp Varnum and Camp Fogarty. These facilities include physical fitness equipment, an obstacle course, and firearms training. Camp Varnum also houses the Rhode Island Military Academy. The training camps are maintained with federal funds. The National Guard operates six logistical sites including three OMS shops; the U.S. Property and Fiscal Office located adjacent to the Armory of Mounted Commands; an Army Aviation Support Facility (AASF) at Quonset Point; and a Combined Support Maintenance Shop (CSMS) in East Greenwich. These facilities are maintained with 75 percent federal funds and 25 percent general revenue funds.
Of the Guard facilities, four were built before World War I, with the oldest, the Benefit Street Arsenal, built in 1843. Two, including the Armory of Mounted Commands, date from 1925 and five more are of World War II vintage, including the hangars at the Quonset Point Air Station. Ten date from the fifties and early sixties, including the substantially rehabilitated Coventry Air Guard Station. The Command Readiness Center, located in Cranston, houses the National Guard and currently, the RI Emergency Management Agency (RIEMA) headquarters. The Command Readiness Center is maintained with general revenue funds and serves as the state’s centralized location for response to crisis events. Governor's Recommendations Military Staff Asset Protection – The Governor recommends a total of $5.0 million from the Rhode Island Capital Plan Fund to match $8.0 million in National Guard Bureau funds for a variety of general repair and maintenance projects that will preserve the National Guard’s existing physical assets. The financing schedule for the R.I. Capital Plan Fund is as follows: FY 2017 - $808,202; FY 2018 – 700,000; FY 2019 - $700,000; FY 2020 - $750,000; FY 2021 - $1.0 million and FY 2022 - $1.0 million. Federal financing in corresponding amounts is provided in each year, dependent on the project under construction as federal matching rates vary from 10.0 percent to 75.0 percent. The project’s single appropriation is designed to provide the agency with maximum flexibility in the selection and timing of its various projects. Currently planned projects include: Warwick Armory boiler; Warren Armory windows and doors; Sun Valley Armory roof replacement; North Smithfield Armory rehabilitation; Middletown Armory renovations; Camp Fogarty HVAC repairs/improvements and armory latrine upgrades.
59

Military Staff
Armory of Mounted Commands - The Governor recommends expenditures of $2.2 million between FY 2017 and FY 2018 to continue repairs to the Armory of Mounted Commands (AMC), which was built in 1925. Both the first phase of AMC rehabilitation (roof replacement/masonry re-pointing), and the second phase (replacement of the original windows with commercial grade energy efficient windows, as well as further re-pointing and exterior power washing), have been completed. A total of $6.9 million from both the Rhode Island Capital Plan Fund and National Guard Bureau funds have been spent to date in an approximate 50:50 ratio. The Governor recommends expenditures of an additional $2.2 million, including $1.1 million from the RICAP Fund and $1.1 million from Nation National Guard Bureau funds. The R.I. Capital Plan Fund amount recommended by year are as follows: FY 2017 - $132,725, and FY 2018 - $949,775. Some of the projects currently planned include: roof replacement, plumbing renovations, parking lot improvements, elevator installation, and building repointing. Benefit Street Arsenal - The Governor recommends expenditures from the Rhode Island Capital Plan Fund of $37,564 in FY 2017 to complete renovations to the Benefit Street Arsenal, which will preserve and maintain this historic building. A total of $660,093 has been spent to date on the project. When complete, the project will have replaced the current 80 year-old electrical system, as well as exterior work, (repair the turret, maintain the roof, repair masonry, paint the exterior, and replace windows), and interior work (asbestos abatement, door replacement, a new boiler, and installation of fire alarms and a fire escape). Burrillville Regional Training Institute – The Governor recommends expenditures of $22,150 in Rhode Island Capital Plan Fund financing in FY 2018 to complete environmental remediation and feasibility studies for a new state of the art training facility near the grounds of the current Zambarano Hospital. The proposed facility
would provide sufficient space to train National Guardsmen in land navigation, map/compass reading and other essential military skills. The new facility would replace the current Camp Varnum facility. A total of $150,000 in National Guard Bureau federal funds has been expended to date to fund an environmental assessment of the property. The Rhode Island Capital Plan Fund financing would finance a study that would update information on feasibility, design, and construction costs. Construction costs (yet to be determined) would be funded with 100 percent federal funds. Prior to FY 2015, $22,350 in Rhode Island Capital Plan Fund financing was expended on the project. Bristol Readiness Center Study – The Governor recommends $125,000 in Rhode Island Capital Plan Fund financing to conduct a project feasibility study for a new readiness center capable of supporting two modern Army National Guard units and a new field maintenance shop in Bristol. The feasibility study portion of the project would be conducted in FY 2018. The architectural, engineering and construction portions of the project would be determined once the feasibility study is completed. New Joint Force Headquarters Building – The Governor recommends expenditures of $32.4 million to construct a new Joint Force Headquarters Building on federally-owned land at Camp Fogarty, East Greenwich. Of the $32.4 million project, $21.7 million is financed from National Guard Bureau federal funding and $10.7 million is financed from the RICAP Fund. The new Joint Force Headquarters will house both the Air National Guard and the Army National Guard. The current headquarters, which also houses the Emergency Management Agency, is determined to be inadequately sized, especially during times of National Guard or Emergency Management Agency activation. The new building will also provide spaces for training, logistics, equipment maintenance and storage areas, classrooms and supply facilities. The estimated size of the new headquarters, based on
60

Military Staff
federal funding formulas for square footage per soldier, will be 80,776 square feet. The three phases of the project are: Phase I - Site Survey and Utility Extension; Phase II - Design and Bid Specifications, with 100 percent completion of bid documents by May, 2017; and Phase III - Building Construction, with construction contract awarded by the Fall of 2017 and construction completed in 2019. Phase I of the project is currently near completion. The Governor recommends all funds expenditures of $2.3 million in FY 2017; $15.9 million in FY 2018; and $14.2 million in FY 2019. The RICAP Fund amounts recommended by year are: FY 2017 - $600,000; FY 2018 - $5.9 million; and FY 2019 - $4.2 million. Quonset Air National Guard Facilities – The Governor recommends expenditures of $99.0 million between FY 2017 and FY 2020 for various projects at the Quonset Air National Guard Base. Funded 100.0 percent by the National Guard Bureau federal funds, some of the larger projects include: renovation and repairs to Operations and Training Facility Building #1 ($27.0 million); renovation and repairs to Base Supply Buildings #4 and #5 ($6.4 million); repair and construction of an addition to the Base Fire and Crash Rescue Station ($4.0 million); renovations to the Vehicle Maintenance Building #3 ($3.4 million); and upgrades to the Quonset airfield Instrument Landing System (ILS) ($1.2 million). Several of these projects, such as the upgrades to the ILS system, will provide benefits to commercial aviation utilizing Quonset State Airport. The amounts recommended by year are as follows: FY 2017 – $53.8 million; FY 2018 - $21.6 million; FY 2019 - $2.6 million; and FY 2020 - $21.0 million.
61

Department of Public Safety
Agency Responsibilities The Department of Public Safety is responsible for providing the citizens of Rhode Island with an increased level of safety and security. In FY 2009, the State Police, E-911 Emergency Telephone System, State Fire Marshal, the Capitol Police, and the Municipal Police Training Academy were merged to create the Department of Public Safety. In FY 2012, the Sheriffs were integrated into the Department in an effort to consolidate all public safety personnel. The Governor recommends the creation of a Division of Homeland Security beginning in FY 2017, and that the Rhode Island Emergency Management Agency be merged into the Department of Public Safety in FY 2018. Governor's Recommendations Fire Academy Building – The Governor recommends expenditures of $2.9 million in the current year to complete construction of the new State Municipal Fire Academy. Most of the expenditures for the $10.7 million project were incurred prior to FY 2017. The project is being funded with $4.3 million of Rhode Island Capital Plan Fund financing and $6.4 million of general obligation bonds from the 2002 authorization. The State Municipal Fire Academy facility will be available for use by all municipal (professional and volunteer) fire departments in Rhode Island. The new facility will include a training building, a maintenance building, and a “burn” building, affording Rhode Island firefighters the opportunity to train using the latest innovations in the field. Phase I of the project addressed many of the practical aspects of the building necessary for firefighting training. FY 2017 expenditures will finance phase II of the project which includes construction of classroom and administrative space. Currently classroom instruction training is conducted at off-site locations. Phase II of the project includes construction of a new classroom/administration building with a
dining area; a turn out gear room; bathrooms; locker rooms; and shower facilities. Lincoln Woods Barracks Renovation - The Governor recommends FY 2017 expenditures of $2.8 million for continued renovations of the Lincoln State Police Barracks. Of this amount, $511,345 million is from the Rhode Island Capital Plan Fund and $2.3 million is from Google Forfeiture funds (restricted receipts). The renovations include the installation of a new HVAC system and back-up power generator, upgrades to the electrical system and information technology wiring, trans-formation of an attached garage/storage area into three cell blocks and sally port, along with renovations to a holding and processing room. Additionally, the project will include a new ADA-compliant public restroom and dispatch room, a Trooper report work area, and expansion of a larger public waiting area. A detached garage will be converted into a men’s locker room for uniform and equipment storage and a fifteen hundred square foot addition will be comprised of a kitchen/eating area, men’s shower room, and a women’s locker and shower room. The project is expected to be completed in FY 2017. DPS Asset Protection – The Governor recommends expenditures of $2.0 million from Rhode Island Capital Plan Fund financing for the upkeep of the various buildings located across the state that are owned by the state and managed under the Department of Public Safety and State Police. The asset protection financing is to be used for projects that maintain and extend the useful life of buildings under the Department of Public Safety’s control. In FY 2017, the agency plans roof repairs and an upgrade of the management information systems server room climate control systems at the State Police headquarters. The Governor recommends expenditures of $660,479 in FY 2017 and $250,000 per year from FY 2018 to FY 2022. Secure Vehicle Garage – The Governor recommends expenditures of $1.0 million in FY 2017 from Federal Forfeiture funds (restricted
62

Department of Public Safety
receipts, non-Google) to construct a pre-engineered steel building to store specialty vehicles and equipment, which will extend the useful life of the vehicles and equipment. The project is expected to be completed in FY 2017. State Police Barracks Feasibility Study – The Governor recommends expenditures of $191,244 in FY 2017 from the Rhode Island Capital Plan Fund to finance a feasibility study of the merits of constructing a new State Police barracks or renovating the existing barracks. The project scope includes two barracks: the Wickford Barracks and the Hope Valley Barracks. The Wickford and Hope Valley Barracks (located in North Kingstown and Hopkinton, respectively) were constructed in the 1930s to meet the needs of the State Police during that era. Since then, the barracks have undergone some changes to accommodate the current technology and staffing needs. State Police Training Academy Renovation – The Governor recommends expenditures of $155,080 in FY 2017 from Google Forfeiture funds (restricted receipts) for renovations to the existing State Police Training Academy. The project will replace or encapsulate all flooring; update the electrical and telephone and data wiring systems; and renovate the classroom and sleeping areas. The renovations are expected to be completed in FY 2017. State Police Training Academy Upgrades – The Governor recommends expenditures of $600,000 from the Rhode Island Capital Plan Fund beginning in FY 2018 for upgrades at State Police Training Academy. In FY 2018, $100,000 is included to renovate the obstacle course and replace existing equipment. In FY 2019, $300,000 is recommended for firing range upgrades and $200,000 is recommended to repurpose an existing barn structure for use as a gym. Computer Crimes Unit – The Governor recommends expenditures of $378,739 in FY 2017 from Google Forfeiture funds (restricted
receipts) to relocate the Computer Crimes Unit to 50 Service Avenue in Warwick, away from the State Police Headquarters in North Scituate. The relocation will require additional data outlets, a server room and new work station cubicles in the new office space. According to the State Police, with the increasing growth of the Computer Crimes Unit, the current space which the unit now occupies is inadequate for their needs. The relocation is expected to be completed in FY 2017. Administrative Support Building Renovation – The Governor recommends $250,000 in each fiscal year from FY 2021 to FY 2022, to finance a feasibility study and architectural and engineering costs to begin the renovation of the administrative support building at the State Police headquarters. The building was originally constructed in 1794. Due to the building’s age, the agency plans renovations which include a new HVAC system, electrical upgrade, IT upgrade, and exterior siding and trim replacement. Rhode Island State Communications System Network (RISCON) – This project was included in the Rhode Island Emergency Management Agency (RIEMA) budget in FY 2017, but will shift to the Department of Public Safety per the Governor’s recommendation that RIEMA be merged into the Department of Public Safety in FY 2018. The Governor recommends expenditures of $10.0 million to renovate, repair and replace components of the RISCON system. Of this amount, $2.5 million is from federal funds and $7.5 million is from the Rhode Island Capital Plan Fund. RISCON is an 800MHz interoperable radio system providing public and life safety communications to all 39 communities in the state, 20 state agencies, and all hospitals, universities, and federal organizations with over 10,000 end users. The system first became operable in 2004, and many of the major system components are no longer supported by the manufacturer. In early 2016, the State entered
63

Department of Public Safety
into a $10.0 million lease financing arrangement with Motorola which will allow RIEMA to fund system improvements, replace antiquated components, and tower maintenance. The renovation and repairs will increase system reliability and reduce potential down time; increase capacity; and improve radio coverage. The technology upgrades to the system will ensure the reliability of the system will ensure the reliability of the system for the next 10 to 15 years.
64
Rhode Island Emergency Management Agency
Agency Responsibilities The Rhode Island Emergency Management Agency (RIEMA) is responsible for the planning and implementation of all hazard preparedness programs at the state level and for providing appropriate support to community hazard response activity. RIEMA maintains the State Emergency Operations Center (SEOC) at the Command Readiness Center in Cranston which provides a central location for interagency coordination and executive decision-making in support of any regional incident or local event. RIEMA is also responsible for the operation and maintenance of the State’s 800 MHz interoperable radio system and network. Heading the Interoperable Communications Committee, RIEMA facilitates the coordination of policy, practices and procedures applicable to radio communication networks. Governor's Recommendations Emergency Management Agency Building Feasibility Study – The Governor recommends expenditures of $189,750 of RICAP Fund money for an EMA building feasibility study. The EMA Headquarters and Emergency Operations Center, which is currently housed in the Command Readiness Center in Cranston, is considered to be insufficient to meet the daily working needs of the agency. When the State Emergency Operations Plan is activated during an emergency, numerous state agencies convene at the facility, which exacerbates the overcrowding in the building. The EMA building feasibility study project will evaluate the space needs of the agency, and explore building options to house the agency. The amount recommended in FY 2017 is $189,750. Hurricane Sandy Cleanup – The Governor recommends a total of $928,000 in FY 2017 for Hurricane Sandy repairs. Of this amount, $696,225 is Federal Emergency Management Agency funds (FEMA) and $232,075 is Rhode Island Capital Plan Fund (RICAP) financing. The RICAP Fund money serves as the 25.0
percent state match for FEMA grants to communities and other public entities to repair damaged structures and infrastructure as a result of Hurricane Sandy on October 29, 2012. All counties in the central and southern parts of the state were declared federal disaster areas and, as such, were eligible to receive public assistance for damage repair and reimbursement of protective measures. Fiscal year 2017 is scheduled to be the last year of expenditure for this project as all reimbursements are nearly complete for approved local projects. Rhode Island Statewide Communications System Network (RISCON) – The Governor recommends expenditures of $10.0 million between FY 2017 and FY 2021 to renovate, repair, and replace components of the RISCON system. The Governor proposes to fund the RISCON upgrades with $7.5 million of RICAP Fund financing and $2.5 million from federal funds. RISCON is an 800MHz interoperable radio system providing public and life safety communications to all 39 communities in the state, 20 state agencies and all hospitals, universities and federal organizations with over 10,000 end users. The system first became operable in 2004, and many of the major system components are no longer supported by the manufacturer. In early FY 2016, the State entered into a $10.0 million lease financing arrangement with Motorola, which will allow RIEMA to fund system improvements, replace antiquated components, and tower maintenance. The renovation and repairs will increase system reliability and reduce potential down time; increase capacity; and improve radio coverage. The technology upgrades to the system will ensure the reliability of the system for the next 10 to 15 years. The amounts recommended from all funds between FY 2017 and FY 2021 are $2.0 million per year. Because in FY 2018 the Governor recommends merging the Emergency Management Agency into the Department of Public Safety, all funding for the project from FY
65

Rhode Island Emergency Management Agency
2018 through FY 2021 are reflected in the Department of Public Safety operating budget.
66


Natural Resources
Department of Environmental Management Coastal Resources Management Council
Rhode Island Infrastructure Bank Narragansett Bay Commission


Department of Environmental Management
Agency Responsibilities The Department of Environmental Management administers an extensive capital program to meet environmental and public safety requirements for state-owned facilities and management areas and for various municipal and non-profit beneficiaries. Major project categories are described below. Narragansett Bay and Watershed Restoration Projects – Bond authorizations approved in November 2004 and 2012 provide matching grants for water quality protection efforts in Narragansett Bay, its tributaries and surrounding watershed. The program provides matching grants to governmental and non-governmental agencies for projects that restore water quality, including non-point source pollution abatement and riparian restoration projects. The fund generally provides assistance for projects that may not otherwise qualify for Rhode Island’s other clean water financial assistance program. The Department has worked with municipalities and non-profits to complete over 30 projects across the State to improve water quality in Narragansett Bay and other watersheds. Environmental Protection Programs – The department operates various programs for environmental protection and remediation. Activities including flood prevention, brownfields remediation and stormwater pollution prevention. Open Space and Natural Land Protection – The department manages state acquisitions and grants to municipalities and non-profit agencies for the acquisition of title and development rights to critical natural resources. Open space is acquired to safeguard land from private development. Development rights purchases allow private ownership of land while protecting the existing level of use, generally as farmland or open space. Municipal Recreation Projects – The department administers grant programs for municipal
acquisition and development of recreational lands and facilities. Bond financing is provided on a 50 percent matching basis; distressed communities are eligible for 75 percent financing. State Recreation and Infrastructure Facilities – The department operates natural management areas, commercial fishing piers, and recreational facilities, for which bond authorizations and the Rhode Island Capital Plan Fund provides financing for acquisition, development, and renovation. Additional funds from federal, restricted and private sources are also utilized. The department also undertakes restoration and repair of state-owned dams in need of structural improvements with Rhode Island Capital Plan Fund resources. Governor’s Recommendations Narragansett Bay and Watershed Restoration - The voters approved $8.5 million in November 2004 and $4.0 million in November 2012 to be used for several water pollution abatement projects, including matching grants and incentive grants to state and local entities, non-profit organizations and for-profit businesses for water quality restoration and protection projects. The bond funds may be used in conjunction with federal and local contributions. Examples of projects to be funded include point and non-point source pollution abatement, nutrient loading abatement, best management grants for farmers and businesses, and riparian buffer enhancements. The watershed approach to pollution identification and assessment, with the remediation responsibility assigned to the polluter wherever possible, is also part of the Department’s community-based approach to improving the health of Narragansett Bay and its tributaries. Prior to FY 2017, $6.1 million in bond proceeds were expended on the project. The Governor recommends the expenditure of general obligation bond proceeds totaling $4.4 million in FY 2017, consisting of $2.8 million from the 2004 bond authorization and $1.6 million from the 2012 bond authorization.
67

Department of Environmental Management
Recommended general obligation bond expenditures for FY 2018 through FY 2019 include $1.0 million annually from the 2012 referenda. Environmental Protection Programs Stormwater Pollution Prevention - The Governor recommends a total of $3.0 million from the newly approved 2016 general obligation bond authorization to provide up to seventy-five percent (75%) matching grants for public, private and/or non-profit entities for projects that reduce stormwater pollution. Funds will be administered through the existing Narragansett Bay and Watershed Restoration Fund. Using FY 2012 funds, DEM awarded $2.6 million in matching grants for projects, including green infrastructure projects and capital equipment and vehicle purchases that built municipal capacity to perform this work. This funding leveraged local and federal investment in stormwater management. Examples of successful stormwater improvement projects include projects in Bristol and Newport which reduced beach closures following installation of enhanced stormwater controls. Contaminants carried by stormwater result in waters unsafe for recreation, including beach closures, closed shell fish growing areas and other degraded conditions that impair the beneficial uses of our rivers, lakes and coastal waters. Much of RI’s existing developed landscape lacks proper stormwater controls. Techniques utilizing green infrastructure are now available to capture and reduce the stormwater pollution. Investment to integrate stormwater management techniques including installation of green infrastructure through retrofitting is necessary to restore most known degraded waters. State water quality restoration plans (TMDLs), provide the technical basis for prioritizing needed stormwater controls and incentives are included for efforts to address priority problem sites. Further investment is needed to advance restoration efforts and improve protection of water supply sources (Newport Water System, Scituate Reservoir), important recreational
waters (numerous lakes and rivers) and shell fishing waters (e.g. coastal ponds, Narrow River, Greenwich Bay). The projects will yield long-term benefits in terms of supporting Rhode Island’s water-based economy, including tourism, and strengthening the resiliency of stormwater infrastructure with respect to changing precipitation patterns, and building public awareness and support for expanding local stormwater programs to continue needed restoration efforts. Brownfield Remediation – The Governor recommends $12.2 million from FY 2017 through FY 2022 from the 2014 general obligation bond authorization of $8.0 million, as well as $5.0 million from the newly approved 2016 bond authorization for Brownfield remediation projects. Between 10,000 and 12,000 abandoned industrial sites lie idle in towns and cities across the state. These funds would provide matching grants to public, private, and/or non-profit entities for the cleanup, reinvestment, and re-use of these sites to create and attract jobs, protect the urban environment, remove hazards, and reduce the cost of storm water flooding. As part of a continued focus on economic growth and putting people back to work in Rhode Island, the newly authorized 2016 general obligation bond funds will provide $5.0 million in 80 percent matching grants to public, private, and/or non-profit entities to clean up contaminated property and promote redevelopment, particularly along the state’s urban corridor. Between 10,000 and 12,000 abandoned industrial sites, referred to as “brownfields,” lie idle in towns and cities across the state. Brownfields comprise between 100,000 and 120,000 acres of land, much of it in prime commercial or industrial locations within the state’s urban services boundaries established by Land Use 2020. The program funds will clean up blighted properties, create jobs, open up valuable real estate, and promote public health. This grant program, which helps accelerate redevelopment and supports smart growth, provides critical resources to facilitate the return of these sites to productive use. Grants will
68

Department of Environmental Management
provide for both site preparation and redevelopment projects and can be used to fill gaps that exist in supporting data and/or to develop and analyze potential remedial strategies necessary to clean up and develop the site. Flood Prevention – The Governor recommends $3.0 million from a 2014 general obligation bond authorization, which consists of $1.0 million annually from FY 2017 through FY 2019. These funds will be used to provide project design and construction grants for the restoration and/or improved resiliency of vulnerable coastal habitats and the restoration of rivers and stream floodplains. Bond funds will assist in leveraging significant matching funds to support local projects to improve community resiliency and public safety in the face of increased flooding, major storm events, and environmental degradation. Open Space and Natural Land Protection Farmland Preservation and Acquisition – The Governor recommends a total of $7.5 million for farmland development rights to relieve farm owners from the economic pressure to sell their land for residential or commercial development, thus making the properties available for farming in perpetuity. Farming in Rhode Island is a $414.0 million business and its future is dependent upon the availability of affordable farmland with high quality agriculture soil. Using bond funds, combined with other partnership funds, the RI Agricultural Land Preservation Commission acquires development rights on farms. In the current year, the Department will also begin the Access to Affordable Farmland program which will allow the Department to purchase farmland and then resell to qualified farmers with restrictions to require that the land be farmed. The importance to access to local food has also significantly increased in Rhode Island. The Department’s Division of Agriculture is working with farmers to improve direct marking of agricultural products. For FY 2017, the Governor
recommends $2.4 million in issued proceeds from the 2012 bond authorization. The recommendation also includes $1.0 million each year from FY 2018 through FY 2020 from the 2014 bond authorization. Prior to FY 2017, $2.1 million was spent on this project from the 2012 general obligation bond authorization. State Land Acquisition - Open Space – The Governor recommends a total of $16.5 million for open space and land acquisition purchases by the department. Land acquisition includes land and development rights to preserve coastal access and shoreline open space, including land acquisition and development rights related to the implementation of the Greenspace Plan. Under the Plan, the department uses state bond funds combined with federal and non-profit funds (i.e. Nature Conservancy, Champlin Foundation, Audubon Society, and various land trusts) to coordinate preservation projects and acquire real estate. Goals of the department’s land acquisition program include watershed protection, expansion of open space and recreation areas, protection of greenways, easements to recreation lands, and preservation of wildlife habitat and natural heritage areas. Prior to FY 2017, $10.3 million was spent, consisting of $9.4 million from the 2004 bond authorization and $900,949 from the 2012 bond authorization. In FY 2017, the Governor recommends $571,402 from the 2004 general obligation bond authorization and a total of $1.6 million from the 2012 bond authorization. Additionally, the recommendation includes $1.0 million in each year beginning in FY 2018 through FY 2021 from the newly approved 2016 bond authorization. Under this program, $4.0 million will be available to continue the efforts of the State’s land acquisition program. Bond funds are often matched by federal, local and non-profit sources with every state dollar being matched at three other dollars. Using recent past history, the $4.0 million investment would leverage funds for total program funding of $16.0 million. Rhode Island’s beaches, bays, forests, farms and rivers help to sustain the State’s economy and provide residents with a
69

Department of Environmental Management
high quality of life. Investing in the preservation of iconic, scenic and sensitive natural resources including gems such as Rocky Point in Warwick, Jerimoth Hill in Foster, and the Blue Pond Management Area in Hopkinton provide opportunities for Rhode Islander’s and visitors to recreate, enjoy nature, hike, fish and hunt. This program continues support of the tourism economy in Rhode Island, which is the state’s second largest economic engine that supports over 70,000 jobs and annually generates $2.26 billion for the state’s economy, and $5.0 billion in spending and nine percent of all Rhode Island Government Revenue. Outdoor sports tourism (hunting and fishing), birdwatchers, and other wildlife observers generate $332.0 million dollars each year to the Rhode Island economy. Municipal Recreation Projects Local Recreation Development – The Governor recommends a total of $17.5 million in general obligation bond proceeds for grants to municipalities to acquire, develop and rehabilitate local recreational facilities. The program provides funding assistance of up to 50 percent of total project costs. In some years, federal funds are available to augment state resources. Prior to FY 2017, a total of $2.6 million from prior general obligation bond authorizations had been expended on this program. The Governor recommends a total of $4.4 million in FY 2017 from the 2006 and 2012 general obligation bond authorizations. This recommendation also includes $1.5 million FY 2018 from the 2012 authorization and $1.0 million in each year from FY 2019 to FY 2022 from the 2014 bond authorization to provide grants to the municipalities for recreation acquisition and development. The Governor also recommends an additional $1.0 million in FY 2020 and $2.0 million in each year for FY 2021 and FY 2022 from the newly authorized 2016 general bond obligation. This program provides up to eighty percent (80%) matching grants to municipalities to develop public recreational facilities in Rhode
Island to meet the ever-growing need for active recreational facilities; projects include development of fields for baseball, soccer, and football, tennis courts, and playgrounds. State assistance is necessary for municipalities to be able to fund these community enhancement projects that promote active, healthy, recreational activities. Examples of recent projects include: completion of a track facility in East Greenwich, development of a multi-use recreational facility at Camp Meehan/Notte Park in North Providence. In times of competing municipal needs and interests, this program is heavily relied upon to serve needs of communities across the state, particularly in urban communities. Often the number of applications to this program exceed available funding by two or three fold. That is why in FY 2018 the Governor is also including general revenue financing stemming from recommendation of the Outdoor Recreation Council. The Council was created by Executive Order 16-01 in January 2016 and charged with developing a strategic plan to grow and promote recreation in Rhode Island. A portion of the funding reflected in the Department of Environmental Management’s operating budget will be directed to local recreation matching grants and local recreation programming. Funding is derived from the Governor’s recommended increase in the cigarette tax by $0.50 in FY 2018. Roger Williams Park – The state has provided bond proceeds to the City of Providence for various renovations and upgrades at Roger Williams Park in Providence since 1989. Current work will include the construction of a new education center, demolition of existing facilities and construction of a new tropical rain forest. Design is underway for the first project of the Master Plan for the Zoo, or Phase 1 for the new Rainforest exhibit. The entire first phase will be completed in FY 2022 and mark the 150th anniversary of Roger Williams Park Zoo, which is one of the oldest in the nation. Once completed, the new exhibit will allow visitors to experience rare and exciting creatures from the
70

Department of Environmental Management
rain forests of South America including birds, primates and reptiles in a spacious and sunlit structure. The Governor recommends a total of $18.0 million from the 2014 bond authorization to continue park and zoo improvements. This recommendation includes $3.6 million annually from FY 2018 through FY 2020 and $2.6 million in FY 2021. Prior to FY 2017, $436,863 was spent from the 2004 bond authorization and $10.9 million was spent from the 2006 authorization. In FY 2017, the Governor recommends the remaining balance of $50,579 from the 2006 general obligation bond as well as $4.2 million from the 2014 unissued bond authorization.
Local Land Acquisition - The Governor recommends a total of $17.0 million for grants to municipalities, local land trusts, and non-profit organizations for the acquisition and development rights of coastal and shoreline access points, open space land, and land suitable for public recreational facilities. The program provides funds of up to 50 percent of the purchase price of the land and allows for the preservation of open space which possesses natural, ecological, agricultural, or scenic values. The Governor recommends $3.1 million in FY 2017 comprised of $2.1 million in 2004 bond authorization funds and $1.0 million from the 2012 bond authorization. In FY 2018, the remaining balance of $1.5 million from the 2004 bond authorization as well as the remaining balance of $500,000 from the 2012 bond authorization and $1.0 million from the newly approved 2016 bond authorization is recommended. The remaining $3.0 million from the 2016 bond authorization is recommended annually from FY 2019 through FY 2021. Prior to FY 2017, $7.9 million had been expended on this project from general obligation bonds. The availability of a local match may alter the issuance and expenditure budgets for this project. For the first time in thirty years, DEM had depleted all available funds for this program, thus requiring the $4.0 million from the 2016 bond authorization. The interest in
local land conservation continues to be strong across Rhode Island with conservation efforts underway in many communities that will be unfulfilled without additional funding. Over 160 conservation projects preserving over 10,000 acres of land have been completed to date including Sunset Farms in Narragansett, Weetamoe Woods in Tiverton, Glacier Park in Westerly, and Mount Hope Farm in Bristol. Total bargain sales of all projects preserved in this program are $40 million and leveraging is at two other dollars for every State dollar spent in this program.
Historic/Passive Local Recreation Grants – The Governor recommends a total of $5.0 million for Historic/Passive Local Recreation Grants. The recommendation includes the 2004 local recreation bond authorization and the 2012 bond authorization for the renovation and development of historic and passive recreation areas. The grants provide funding to municipalities of up to 90 percent of the cost for renovations and developments, including improvements to walking trails, gazebos, bandstands, lighting, picnic tables etc. The primary goal of the program is to assist in providing outdoor recreation opportunities to the residents and visitors of the State of Rhode Island in accordance with the State Comprehensive Outdoor Recreation Plan. Prior to FY 2017, $3.9 million was utilized from the 2004 and 2012 general obligation bond authorizations. The Governor recommends $206,926 from the 2004 bond authorization and $896,000 from the 2012 bond authorization in FY 2017. World War II State Park – The Governor recommends $2.6 million in Rhode Island Capital Plan Fund financing for the construction of a new World War II State Park in Woonsocket, RI. Plans will revitalize the currently closed park with design ideas pending. The project will also include: water, sewer, storm water, and electrical upgrades; new curbing, walkways, plantings and shrubs, replacement of a pedestrian bridge, benches, a
71

Department of Environmental Management
new playground and fencing. The project is being completed and the Governor recommends the remaining balance of $128,715 in FY 2017 in Rhode Island Capital Plan Fund financing for this project. A total of $2.5 million was spent on this project prior to FY 2017. State Recreational Facilities Recreational Facilities Improvements - The Department is responsible for maintenance and operation of over fifty state-owned buildings, twenty-five miles of roads, and several bridges in state parks and management areas. The Governor recommends total expenditures of $52.2 million, including Rhode Island Capital Plan Fund resources, federal financing, and issued general obligation bond proceeds for the asset protection of these projects. Currently, the department is making renovations and improvements of facilities at Lincoln Woods State Park, Fisherman’s Memorial Campground, and Colt State Park. In FY 2017, the Governor recommends the remaining balance from the 2000 bond authorization of $13,134, $1.3 million from the 2004 issued general obligation bond, $835,000 in federal funds along with $5.7 million from the Rhode Island Capital Plan Fund for a total of $7.9 million. The recommendation also includes $2.5 million in FY 2018 from RICAP financing along with $950,000 in federal funds. RICAP financing is recommended in the outyears for projects including $1.6 million in FY 2019, $1.9 million in FY 2020, $2.1 million in FY 2021 and $2.0 million in FY 2022. In order to ensure that the Department has continued financing to maintain all of the facilities under its oversight, FY 2018 marks the first year of a conscious effort to include a total of $200,000 each year in asset protection funding for this program. Prior to FY 2017, a total of $33.4 million had been spent on various recreational facility improvements. Rocky Point Acquisition/Renovations – The Governor recommends $14.0 million for the
Rocky Point Acquisition project. Rocky Point Park in Warwick consists of 81 acres of land purchased by the State in 2013. The City of Warwick purchased an additional 41 acres in 2007. The 2010 bond authorization funding totaling $10.0 million was mostly used to acquire the park. The project is almost complete. In June 2014, the State demolished and removed derelict buildings, debris piles, cottages, and in FY 2016 the grading and seeding of the property was completed. A total of $306,417 is recommended in FY 2017 including $189,425 in 2010 bond authorization funding and $116,992 in Rhode Island Capital Plan funds. Total funding in FY 2018, the final year for the project, includes $150,000 in Rhode Island Capital Plan funding. Remaining funds will be utilized to develop a master plan for the property. The Department hopes to provide the public with access to the land for many recreational activities, such as: picnicking, hiking, and sightseeing, as well as providing the public access to the shoreline for saltwater based recreation, such as boating, kayaking, and fishing. Fort Adams Trust/Rehabilitation – The Governor recommends a total of $4.1 million from the Rhode Island Capital Plan Fund for the Fort Adams State Park project in Newport, which consists of $301,625 in FY 2017 and $300,000 for each year from FY 2018 through FY 2022. The Fort contains significant American military history artifacts and is a National Landmark Structure. These funds will be used for continuing improvements to the uniquely designed and engineered structures at the park. Fort Adams Sailing Improvements/Mid-Park – The Governor recommends a total of $13.2 million for improvements to the Fort Adams State Park to create an event center to host sailing events. The Department has been working with the Rhode Island Commerce Corporation to design improvements to Fort
72

Department of Environmental Management
Adams that will allow it to host large sailing events, such as the America’s Cup, the Extreme Sailing Championship, and the Volvo Regatta. In the summer of 2012, Rhode Island hosted America’s Cup races. The Governor recommends $1.5 million in RICAP funding in FY 2017 and $1.8 million in FY 2018 in addition to $3.6 million in private funding from Sail Newport recommended in FY 2017 for the project. Prior to FY 2017, $6.4 million was expended. The Governor recommends moving the project schedule up and shifts $350,000 in FY 2019 and provides an additional $1.0 in FY 2018 in order to accelerate the project schedule in time for the State to host the next 2018 Volvo Ocean Race including work on Mid-Park. The department has also been working closely with Sail Newport to construct a new mid-park multi-use building to support sailing activities and house restrooms, storage, and meeting rooms. India Point Acquisition – The Governor recommends $160,028 in FY 2017 for the India Point Acquisition project. This represents the remaining bond funds from the 2010 general obligation authorization of $3.2 million. The Department plans to use the remaining proceeds for various site improvements to the property, which may include grading of vacant area, landscaping improvements, improving on-site safety concerns, and removal of perimeter fencing. State Bikeway Development – The Governor recommends a total of $10.0 million including $2.0 in each year from FY 2018 to FY 2022 from the newly authorized 2016 bond authorization for the design and construction of bikeways, including the completion of the Blackstone River Bikeway and the South County Bikeway. Since the opening of the East Bay Bicycle Path in 1995, to the recent efforts in extending the Trestle Trail bikeway westward to Connecticut, Rhode Island has created a diverse system of bikeways that are used by cyclists for
recreation and commuting purposes. Competition for funding under the “Transportation Alternative Programs”, the elimination of Earmark funds and the competing needs of Rhode Island’s highway road and bridge infrastructure have had a significant impact on the availability of state funds for bikeway development. These funds are critical to keep the momentum going and to complete high priority projects. Greenway Blackstone Valley Park Improvements – A total of $1.4 million in RICAP financing is recommended for the Blackstone Valley Bike Path/State Park, to be utilized for the construction of the bike path and other construction and restoration work within the Blackstone Valley. The Bike Path is scheduled to be a 17.1 mile by 12-foot wide scenic bike path that will connect to the East Bay Bike Path, eventually making a continuous 31.9 mile route for alternative transportation. The Blackstone Valley is utilized by many organizations including the National Park Service. The Department is working with the “Friends of the Blackstone River” for improvements to river access, safety and complement the State’s efforts in the improvements of this river corridor. The Governor recommends $393,348 in FY 2017, and $359,170 FY 2018 in Rhode Island Capital Plan Fund resources. FY 2018 funding will be utilized primarily to provide for an addition to the Sycamore Landing building on the banks of the Blackstone River in Lincoln. The building serves as a main meeting and gathering place for volunteers and education program leaders. The building addition will provide meeting space and restroom facilities for visiting public. Historic State Park Development Program – A total of $4.0 million in newly approved 2016 bond authorization funding is recommended beginning in FY 2018 comprised of $1.0 million in FY 2018, and $1.5 million each in FY 2019 and FY 2020. Funding is directed towards capital improvement projects to the Park system, matching bond funds with other available
73

Department of Environmental Management
sources including the National Park Service’s Land and Water Conservation Fund (which recently doubled its stateside allocation to program to just under $1.0 million annually). The improvements to be made under this project would be in conjunction with the projects encompassed under the Recreational Facility Improvements Project. A small portion of these funds will be used for critical infrastructure improvements to working farms under DEM ownership and managed and operated under agreements to agriculturally focused entities. Priority improvements include the following projects: Goddard Park – complete renovation of the bathing pavilion, new golf course facility building, historic roof replacement, landscape planning and installation; Fort Adams – new restroom facility and maintenance building; Colt Park – historic restoration of Stone barn; Coggeshall Farm improvements – to include barn replacement and visitor center; and Brenton Point – historic restoration of existing restroom and visitor facility. Since the establishment of the Metropolitan Parks Commission in 1883, through Governor Raimondo’s creation of the Outdoor Recreation Council, Rhode Islanders and its leaders have recognized the important place that the park system has in Rhode Island identity, heritage and improving health and wellness. Historic state parks, including Fort Adams, Lincoln Woods, Colt State Park, Goddard Park and Brenton Point have suffered along with RI’s economy. An infusion of general revenue funding is recommended as part of the Council’s efforts to support outdoor recreation and will provide additional capital funding for recreation acquisition and maintenance. Capital improvements to the State’s recreational and agricultural facilities will bolster the tourism economy and create jobs in the service, construction and the food and agriculture sectors. State Infrastructure Facilities State Recreation Building Demolition -
The Governor recommends $300,000 in Rhode Island Capital Plan Funds comprised of $100,000 each year from 2017 to FY 2019 for demolition of thirty-four buildings statewide that need to be demolished to either remove liability for the State, or to enhance visitor experiences at the Department’s properties. Specific buildings to be demolished include the condemned Forestry headquarters at Chopmist and buildings at Black Farm on Switch Road-Grantville Road among others. In the current fiscal year the Department is seeking to move on demolishing those buildings not requiring asbestos abatement. The demolition of these buildings would eliminate potential public safety issues. Galilee and Newport Piers - The Governor recommends a total of $18.0 million in total funding including $10.8 million from the Rhode Island Capital Plan Fund and $2.5 million in federal funds for improvements at Galilee Piers ($16.3 million) and Newport Piers ($1.7 million). These port facilities and piers support the State’s commercial marine fishing industry and provide access points for the Department’s enforcement and marine wildlife divisions. Prior to FY 2017, $4.7 million from the Rhode Island Capital Plan Fund was spent on the Galilee Piers and $1.4 million on the Newport Piers. The Port of Galilee berths over 170 commercial fishing vessels annually. The Department has consistently made major infrastructure improvements to the port including pier replacements and recent southern bulkhead replacement bring these facilities up to today’s standards in support of the State’s commercial fishing industry. The Governor recommends continued financing for pier improvements. Financing from the Rhode Island Capital Plan Fund for the Galilee Piers is recommended in the amount of $311,611 in FY 2017, and $1,250,000 each in FY 2018 and FY 2019 to match federal funding. The recommendation also includes $400,000 in each year from in FY 2020 to FY 2022. The Department will also receive $1.3 million in each year for FY 2018 and FY 2019 in federal
74

Department of Environmental Management
financing from an Economic Development Administration grant. FY 2017 funding will allow for a feasibility study for the replacement of the northern bulkhead. FY 2018 funding will be utilized for the capital improvements needed for the northern bulkhead. These funds would be used to repair and/or replace all structural elements, dolphin clusters, and electrical services. The State Pier in Newport currently houses over 40 fishing vessels and provides the only affordable berthing space for the local commercial fleet. Rhode Island Capital Plan Fund financing for the Newport Piers includes $137,500 each in FY 2017 and FY 2018. Most of the major reconstruction at Newport was completed in previous years; continued financing will be used for securing the heavy duty pier and its electrical service, upgrades to the office building, and fender pile replacements. State-Owned Dams Rehabilitation - The Governor recommends $10.6 million from the Rhode Island Capital Plan Fund for design and construction and repairs to state-owned dams in various recreation and management areas operated by the department. The rehabilitation projects are for dams classified as high-hazard dams which is a measure of downstream hazard potential, not only a measure of the potential for failure. The repairs are also necessary to manage water levels at recreational fishing and swimming areas. Over the past eleven years the Department has completed the repair of the Olney Pond Dam at Lincoln Woods State Park, the Bowdish Lake Dam in Burrillville, the Stillwater Reservoir Dam in Smithfield, and the JL Curran Dam in Cranston. Currently, design is underway for the Lower Curran Dam and Wyoming Dam in Richmond/Hopkinton as well as Trestle Trail culvert. Prior to FY 2017, $3.3 million had been utilized for these projects. The Governor recommends $254,195 in FY 2017; $2.2 million in FY 2018; $1.5 million in FY 2019; $1.3 million in FY
2020; $1.0 million in FY 2021, and $1.0 million in FY 2022. Marine Infrastructure and Pier Development – The Governor recommends a total of $4.8 million from the Rhode Island Capital Plan Fund to provide funds for marine infrastructure and pier development at sites critical to Rhode Island’s tourism and fishing economy. These funds will be used to develop piers at India Point in Providence, Rocky Point in Warwick and the former Navy pier in Middletown. Additionally, funding will allow the Department to contract for a Marine Facilities Master Plan at the Jerusalem facility in South Kingstown to redevelop this site for partnership opportunities related to aquaculture and research. Aquaculture is a rapidly growing industry in Rhode Island. The workforce also continues to grow with the number of aquaculture farm workers increasing from 20 percent from 142 to 171 from 2014 to 2015. The Department’s Division of Fish and Wildlife has prepared a position paper with recommendations for the future development at Jerusalem. This would be used as the basis for a Master Planning process. This recommendation includes RICAP funding of $100,000 in FY 2017; $500,000 in FY 2018 and $1.0 million annually from FY 2019 to FY 2022. RICAP funding in FY 2018 is being matched with $200,000 in federal funding in FY 2018. Natural Resources Offices/Visitor’s Center - The Governor recommends a total of $6.9 million from the Rhode Island Capital Plan Fund for the construction of a new office facility in the Arcadia Management Area at Browning Mill Pond in the Town of Richmond. This facility will serve as the gateway center for public access to Arcadia Management Area and consolidate administrative offices of the Department’s Fish and Wildlife and Forestry Divisions. Currently, these office spaces are scattered across the State. This recommendation includes $1.1 million in FY 2017 and $5.5 million in FY 2018. This facility will consolidate and provide office space, laboratories, storage, and workshop areas for mosquito abatement testing, the state
75

Department of Environmental Management
veterinarian, and the Administrative Offices and Freshwater Fisheries and Wildlife sections of the Division of Fish & Wildlife. The facility would also be utilized as a visitor’s center for people using the Arcadia Management Area for fishing, hunting, hiking, mountain biking, swimming, and horseback riding. Expenditures prior to FY 2017 total $384,440. Fish and Wildlife Maintenance Facility - The Governor recommends a total of $426,000 in federal funds, $142,253 in insurance proceeds from a fire at a former maintenance facility, and $150,000 from the Rhode Island Capital Plan Fund for the construction of a new maintenance facility for the Division of Fish & Wildlife in FY 2018. The existing facilities at the Great Swamp Management area are over thirty years old and are incapable of housing the heavy equipment and research equipment used in managing fish and game areas supervised by the State. The project is a continuation of improvements to the Great Swamp Facility, which is a focal point of activities for the division including research activities, wildlife management, and public involvement for all fish and wildlife efforts of the department.
76

Coastal Resources Management Council
Agency Responsibilities The Rhode Island Coastal Resources Management Council is responsible for managing, preserving and restoring the coastal resources of Rhode Island through long-range planning that is embodied in the R.I. Coastal Resources Management Program, adopted in 1976, federally approved in 1978, and revised substantially in 1983 and 1996. The program defines the various types of shorelines and the activities and restrictions appropriate for each. For example, 70.0 percent of Rhode Island’s shoreline is designated as either conservation or low intensity use and is protected from commercial development through restrictions on the type of allowable water structures. In addition to the permitting process and other regulatory activities, the Council acts as the lead agency for Rhode Island’s dealings with the U.S. Army Corps of Engineers. The latter has administered funds for various capital project activities, such as the dredging of the Providence shipping channel, habitat restoration and beach replenishment and restoration. The Agency also is the lead agency for certain projects funded by the Department of the Interior. Governor's Recommendations Coastal and Estuary Habitat Restoration Trust Fund – The Governor recommends the expenditure of $250,000 in restricted receipts from the Oil Spill Prevention, Administration and Response Fund, (OSPAR) in FY 2017, and $250,000 in each year thereafter through FY 2022, to preserve and restore coastal wetlands, fish runs, and eelgrass beds that protect the shore from storms and erosion, serve as breeding grounds for recreational and commercial fishing, filter out pollution, and hinder the spread of mosquitoes. Restoration projects are reviewed and selected by the R.I. Habitat Protection Team. Past project work totaling $3.5 million has included 1) Salt Marsh Restorations (statewide assessments, Lonsdale Drive-in Marsh Buckeye Brook, salt marsh restorations at Fields Point,
Stillhouse Cove, Palmer River, Mussachuck Creek, Walker Farm, Little Mussachuck Creek, Gooseneck Cove, Jacob’s Point, Stillhouse Cove, Brenton Cove, Round Marsh in Jamestown, Manton Pond, Winnapaug, and Silver Creek in Bristol, Boyd’s Marsh Town Pond habitat restoration, Hog Island, Goosewing Beach, Potowomut, Coggeshall, Barrington Beach); 2) Dam Improvements (Shannock Falls Dams accessways improvements, Dyerville Dam, Ten Mile River Reservation, Shady Lea Mill dam removal); 3) Fish Passage Restoration (Wakefield, Gilbert Stuart, Factory Brook, Kickemuit Reservoir, Atlantic Mills, Blackstone, Manton Pond, Ten Mile River, Woonasquatucket River, Rising Sun Mill, Pawcatuck River, Paragon, Lower Shannock, Blackstone River, Main Street Dam in South Kingston, Palisades, Kenyon Mill Dam, Manton Pond fishway); and 4) Other Projects (habitat planning & enhancements at Narrow River and Long Pond, wetlands restoration at Cocumscussoc Brook and Meadow Brook, restoration of Napatree and Third Beach dunes, hard clams in Rhode Island’s salt ponds, sediment management in the Lower Pawtuxet River ecosystem, Allin’s Cove Invasive control and upland restoration and Narragansett Bay Seagrass, enhanced eastern oyster restoration, caged scallop spawning sanctuary, Avondale farm/Colonel Willie Cove phragmite control as well as financing for environmental studies and mosquito abatement equipment). The total cost of the project during the capital planning period is $1.3 million. Rhode Island Coastal Storm Risk Study – The Governor recommends the expenditure of a total $1.5 million in Rhode Island Capital Fund financing to begin in FY 2017 to match a total of $8.9 million in Army Corps of Engineers federal funds for a new project for studies to investigate responses to major storms such as Hurricane/Tropical Storm Sandy that would reduce future flood risks in ways that would support long term resiliency of coastal ecosystems and reduce the economic costs of such storm events. The study will include plan formulation and engineering analyses with
77

Coastal Resources Management Council
decision criteria to identify the most effective risk management strategies to support community resilience. Confined Aquatic Dredged Material Disposal Cells – The Governor recommends the expenditure of $10.5 million in Certificate of Participation funds and $500,000 from the Coastal Resources Management Council Dredge Fund in FY 2018 to provide the state match for a new confined aquatic disposal cell (CAD cell), to store dredged contaminated sediments in depressions at the bottom of an aquatic system. The CAD cell is required to contain material displaced during the Army Corps of Engineers’ upcoming dredging of the Providence Harbor. The extra space in the CAD cell will generate revenue from the fees charged to other marinas and harbors to dispose their own material. Shoreline Change Special Area Management Plan (SAMP) – The Governor recommends $40,810 in federal funds in FY 2017 to finish the development of a management plan to assist Rhode Island beach communities to protect and develop shoreline assets that are vulnerable to storm-based erosion and flooding caused by storm surge and sea level rise. The total project costs are $488,383 in federal funds and $298,374 in Rhode Island Capital Plan Fund financing. Narragansett Bay Special Area Management Plan (SAMP) – The Governor recommends $250,000 in Rhode Island Capital Plan Fund financing in FY 2018 to create a new management plan to protect and manage Narragansett Bay resources, as the State has done with past Ocean and Shoreline SAMPs. South Coast Restoration Project – The Governor recommends continuation of the project to dredge breachways and tidal deltas in order to replenish beach areas and repair damage from Hurricane Sandy along the state’s south coast. The Governor recommends $3.3 million in federal funds, matched with $321,775 in Rhode Island Capital Plan funds, for sediment removal and habitat restoration at both Ninigret and
Winnapaug ponds. The former is funded by the Department of the Interior, U.S. Fish and Wildlife Service. The latter is funded by the Department of Agriculture, National Resources Conservation Service. Narrow River Salt Marsh Restoration – The Governor recommends the expenditure of a total $45,000 in federal funds from the U.S. Fish and Wildlife Service in FY 2017 and FY 2018 to mitigate the impact on the salt marsh system of the Narrow River that will occur due to sea level rise. The project will disperse dredged material from sediment-laden areas into the marsh surface to increase elevation, thus strengthening the resiliency of the marsh in the face of future coastal storms and increased rates of sea level rise. This project was previously funded by a larger grant before the scope of the project was transferred to The Nature Conservancy.
78
Rhode Island Infrastructure Bank
Agency Responsibilities The Rhode Island Infrastructure Bank (RIIB), formerly the Clean Water Finance Agency, functions as a body politic, a corporate and public instrumentality having a distinct legal existence from the State of Rhode Island. The mission of the agency is to provide low-cost financing to municipalities, suppliers of drinking water, sewer commissions and wastewater management districts by means of the State Revolving Fund (SRF) programs. The SRF programs are designed to leverage state bond funds, increasing the availability of money to borrowers by a ratio of 10 to 1. The SRF loan programs consist of a Clean Water SRF, a Safe Drinking Water SRF and a Rhode Island Water Pollution Control Revolving Fund. The Clean Water SRF is capitalized by federal Environmental Protection Agency (EPA) capitalization grants, proceeds from the 1990, 2000, 2004, 2012 and 2014 general obligation bond referenda and other borrowing as authorized. An estimated $1.4 billion will be required to address Rhode Island's wastewater priorities through 2020. Eligible projects include water pollution control facility capital improvements, non-point pollution reduction programs (including landfill closures and septic systems repairs), and estuary protection programs. To be eligible for Clean Water SRF financing, projects must meet EPA criteria, be approved by the Department of Environmental Management, and meet CWFA criteria as to financial soundness. Once approved by all parties, projects are funded by federal, state and/or investors' dollars acquired by the sale of tax-exempt revenue bonds. States are required to provide a match of 20 percent of available federal funds. The CWFA can also make direct loans using federal and state match dollars. The Safe Drinking Water SRF is designed to function in the same manner as the Clean Water
SRF. With the Department of Health as its regulatory partner, the CWFA uses the Safe Drinking Water SRF to finance the acquisition, design, planning, construction, enlargement, repair, protection or improvement to public drinking water supplies. Currently, there are 484 active public water systems in the State of Rhode Island. The drinking water systems that are eligible for Safe Drinking Water SRF loans are community water systems, both private and publicly owned; and non-profit, non-community water systems. The Department of Health has estimated the total funding need of Rhode Island's public systems over the next 20 years to be approximately $577.0 million of which $312 million are identified as high priority. In August 1996, the 104th Congress approved the Safe Drinking Water Act Amendments that, for the first time, authorized the award of EPA capitalization grants to safe drinking water SRFs. Rhode Island's share of the capitalization grant monies is estimated to be $9.2 million per year through FY 2019. To be eligible for these funds, the State is required to provide a 20 percent state match. The Rhode Island Water Pollution Control revolving Fund (RIWPCRF) receives the state capital contribution, including proceeds from the Water Quality management bond authorization, before the funds are transferred to the Clean Water and Drinking Water SRFs. The CWFA uses interest and loan repayments to finance projects not meeting federal requirements. The Fund also administers the Rhode Island Zero Interest Loan Fund that has issued forty-six zero and subsidized interest loans worth $222.0 million. The 2014 Appropriations Act established the Municipal Road and Bridge Revolving Fund, requiring the Agency to establish and administer a revolving fund to receive funds from various sources, specifically $10.0 million from bond fund premium proceeds, to be used to provide financial assistance to municipalities (such as subsidized direct loans) for projects approved by
79
Rhode Island Infrastructure Bank
the Agency and the Department of Transportation. Beginning with the FY 2016 budget, the scope of the Clean Water Finance Agency has been expanded. The new organization, the Rhode Island Infrastructure Bank (RIIB), provides energy efficiency and renewable energy financing for local businesses by allowing commercial properties to be eligible for the Property Assessed Clean Energy Program (PACE), for stormwater management loans, and for federal funded Brownfields projects. The RIIB will also provide new funding for energy efficiency retrofits and renewable energy projects to Rhode Island’s municipalities and school districts, by accessing federal energy conservation funding. Governor's Recommendation Clean Water State Revolving Fund – The Governor recommends an all funds total of $74.7 million in FY 2017. Expenditures in Clean Water SRF loans are financed from revenue bonds ($40.1 million in FY 2017, $157.2 million in FY 2018 through FY 2022), Environmental Protection Agency federal funds ($9.8 million in FY 2017, $39.1 million in FY 2018 through FY 2022), and Revolved Capitalization Grants ($13.0 million in FY 2017, $53.1 million in FY 2018 through FY 2022). Zero interest subsidies for loans from the Clean Water State Revolving Fund have been financed from leveraged funds supported by the $60.0 million Water Quality Management bond authorization (the referendum which was approved in November 2000), and the $10.5 million Clean Water Finance Agency share of the Narragansett Bay and Watershed Restoration bond authorization (the referendum which was approved in November 2004). The latter authorization can be used by municipalities and governmental entities (including the Narragansett Bay Commission) to construct wastewater treatment facilities to implement nutrient reduction and other water quality projects
impacting Narragansett Bay and state watersheds. In addition, $12.0 million of the approved bond authorization (P.L. 2012 Ch.241) will be used with federal capitalization grants to provide low-interest subsidized loans for local governments to finance approved water pollution abatement projects. The Capital Plan also includes an additional 2014 bond authorization (P.L. 2014 Ch. 145) of $20.0 million. Prior to FY 2017, the Agency has spent a total of $1.4 billion from all fund sources, including $46.4 million from general obligation bonds, $236.5 million from Environmental Protection Agency and federal stimulus funds, $959.7 million in revenue bonds, and $155.4 million in revolved capitalization grants. These funds have supported $1.0 billion in low-interest loans to 29 municipalities, Providence Water, the Rhode Island Airport Corporation, and the Narragansett Bay Commission. Safe Drinking Water State Revolving Fund – The Governor recommends SRF loans of $30.5 million in FY 2017. Over the period FY 2017 through FY 2022, the Governor recommends a total of SRF loans of $147.2 million, including $2.8 million from the 2012 bond authorization, $68.1 million in revenue bonds, and $29.0 million in revolved capitalization grants, to be used to match $47.3 million in Environmental Protection Agency federal funds. To date, the Agency has spent a total of $391.5 million from all fund sources. These funds have supported municipalities and water systems for water main cleaning, pipe rehabilitation, water meters and storage tank replacement. Water Pollution Control Revolving Fund – The Governor recommends the utilization of interest earnings and revolved capitalization grants on Clean Water bonds issued by the State to finance the Water Pollution Control Revolving Fund. The Agency has spent $2.5 million in interest earnings and $1.7 million in revolved capitalization grants prior to FY 2017. The Agency will spend an additional $50,000 from interest earnings in FY
80

Rhode Island Infrastructure Bank
2017 and $50,000 annually from FY 2018 through FY 2021, as well as Revolved Capitalization Loan repayments of $100,000 each in FY 2017 and FY 2018, $150,000 FY 2019, $1.1 million in FY 2020, and $100,000 in FY 2021. In addition, the $60.0 million in bond proceeds authorized in the Water Quality Management bond referendum (P.L. 2000 Ch. 44) have been issued and has been deposited into an investment account commensurate with current arbitrage rules and regulations. These bonds have been issued to enable the agency, in combination with other agency resources (loan repayments, investment proceeds, previously authorized federal and state capitalization grants), to leverage up to $210.0 million in funds ($70.0 million per year for three years) for the following purposes:
Not more than $3.0 million in bond proceeds can be used to provide state matching funds for the Drinking Water State Revolving Fund to finance drinking water projects by private and public community water systems.
The remaining $57.0 million was loaned
to the Narragansett Bay Commission. Since the 2000 bond referendum provides that a minimum of $70.0 million be provided to the Narragansett Bay Commission in zero interest loans for the Combined Sewer Overflow project, the agency provided an additional $13.0 million out of available resources.
The $57.0 million created a flow of funds that was invested above bond yield. This flow, along with interest income generated by the loan, has been provided to other municipalities and agencies to establish a zero interest loan fund. Proceeds from the fund pay the difference between the subsidized interest of 66 and 2/3rd
percent and the zero subsidized interest of 50 percent of the latter, or 33 and 1/3rd percent. The
program reduces the interest rate paid by eligible borrowers from the subsidized rate reduction of 33 and 1/3rd percent from the market rate currently provided by the agency to zero percent. Projects eligible for zero percent financing include water pollution abatement projects, such as wastewater treatment facilities, sludge improvement projects, sewer construction to relieve septic systems, planning/feasibility studies to support water quality restoration projects (including stormwater treatment and nutrient reduction), and implementation of stormwater treatment and other nonpoint source water pollution abatement projects. Other loans made by this program include Facility Plan Loans, which makes low interest loans to municipalities to prepare plan documents, amendments, or updates.
Water Quality Protection Charge Program -- The Governor recommends the expenditure of $5.4 million in FY 2017-FY 2021 for land acquisitions to protect watersheds and other water supplier projects. Funding would be derived from the 36.1 percent share of the Water Quality Protection Charge formerly deposited with the Water Resources Board (Corporate), whose functions have been transferred to the Rhode Island Infrastructure Bank. Municipal Road & Bridge Revolving Fund – The Governor recommends expenditures in FY 2016 of $2.6 million in other funds for road and bridge infrastructure projects approved by the Agency and the Department of Transportation. $25.1 million has been spent prior to FY 2017. Efficient Building Fund-The EBF is a public building energy efficiency and renewable energy investment program that will provide municipalities, school districts, and quasi-state entities with access to capital to make renewable energy and energy efficient improvements to their facilities. The Governor recommends expenditures of $84.5 million in revenue bonds between FY 2018-FY 2021.
81

Rhode Island Infrastructure Bank
Brownfields Revolving Loan Fund-The Brownfields Revolving Loan finances brownfield remediation projects for municipal and private entities. The BRLF is a new program developed in partnership with the Rhode Island Department of Environment management (DEM) and Commerce Rhode Island (Commerce RI). DEM will be responsible for creating and approving a project priority list for which the RIIB will use to determine the project priority funding. The BRLF was created in 2015 by the General Assembly. The Governor recommends expenditures of $820,000 in other funds in FY 2018.
82

Narragansett Bay Commission
Agency Responsibilities Narragansett Bay Commission (NBC) - In 1991, legislation was enacted merging the Blackstone Valley District Commission (BVDC) into the NBC. The merger took effect in January 1992. As a result of the merger, NBC’s service area was expanded to include the areas formerly served by the BVDC, including the cities of Pawtucket and Central Falls, and portions of the towns of Cumberland, Lincoln, Smithfield and the City of East Providence. The merger resulted in the consolidation of the two largest wastewater treatment facilities in Rhode Island. The Field's Point plant, which services NBC's original district, handles average dry weather flows of 50 million gallons per day (mgd) and the Bucklin Point facility, which services the area formally served by the BVDC, handles average dry weather flows of 23 mgd. Together, these two facilities serve 10 communities and 300,000 people or about one-third of Rhode Island's population. NBC owns, operates and maintains seven pump stations. Four of the seven are within the original NBC district, while three are within the former BVDC district. NBC is responsible for 86 of the 89 combined sewer overflows (CSOs) in Rhode Island (59 in the original NBC district and 27 in the old BVDC district), and over 89 miles of underground interceptors and 32 tide gates. While BVDC ceased to exist as a legal entity in January 1992, the following discussion on each agency’s bond authorization is provided to place the state's general obligation commitment to NBC and BVDC in a historical perspective. In November of 1980, the voters approved a bond issue of $87.7 million to finance capital improvements to be undertaken by the Narragansett Bay Water Quality Management District Commission. In 1990, $15.0 million of this authorization was reallocated by a referendum to the Blackstone Valley District ($6.0 million) and the Pawtuxet River District Commission ($9.0 million). In November 1992, the voters approved a $15.0 million bond
referendum that restored to NBC the funds that had been reallocated to the Blackstone Valley District and the Pawtuxet River District Commission. Although the $93.7 million of bonds are general obligations of the State, user fees are required under the authorizing statute of the commission to support debt service costs for no more than $14.1 million of such bonds and general operating expenses and other debt service requirements of the Commission. While the size and timing of the 1980 bond authorization was based upon the anticipated termination of the federal Clean Water Act grant program, the federal program continued for several years to provide the Commission with additional resources. Since the Commission assumed full responsibility for the metropolitan Providence system on May 2, 1982, it has received grants from the United States Environmental Protection Agency under provisions of the Clean Water Act, and matching grants from the Rhode Island Department of Environmental Management. In addition, the Clean Water Finance Agency has provided the Commission with below-market rate State Revolving Fund loans. The Commission is also authorized to issue its own revenue bonds to finance system-wide improvements. The Commission has indicated that a substantial share of its new and existing projects will be funded from other fund sources that would include state revolving funds, revenue bonds, or other fund sources. All spending in FY 2017 through post FY 2022 is described below. Governor's Recommendation Wastewater Treatment Facility Improvements – The Governor recommends expenditures of $31.8 million from FY 2017 through FY 2022 to address wastewater treatment facility improvements. Projects include blower improvements ($5.4 million); construction of a water quality science building ($1.5 million) that will be a 36,790 square foot facility that will house laboratory staff and equipment; final clarifiers improvements ($2.7 million); refurbish
83

Narragansett Bay Commission
an operations and lab building for reuse, which consists of the installation of a combined heat and power system that will burn the biogas generated from the anaerobic biosolids digestion process ($6.8 million); and address floor protection issues ($1.2 million). These projects include inspection and clearing and repair and construction of NBC energy efficiency upgrades. Infrastructure Management – The governor recommends expenditures of $12.4 million from FY 2017 through FY 2022 to address NBC interceptor easement restorations ($2.9 million); construct facility electrical improvements ($237,783); and the purchase of three 1.5 MW wind turbines that convert wind energy to electricity. These turbines will be located on a remote site and the electricity will be net metered ($6.9 million), and a Greenhouse Gas Study ($332,055). Phase III CSO Facilities – The governor recommends expenditures of $277.3 million from FY 2017 through FY 2022 for NBC’s design and construction of the third and final phase of the federally mandated CSO Abatement Program required as part of a consent agreement between NBC and the Rhode Island Department of Environmental Management. The Phase III CSO Program is subdivided into four phases to be completed over a period of 22 years. This is the first Phase of the Phase III facilities and includes the design and construction of a deep rock tunnel in Pawtucket approximately 13,000 feet in length along the Seekonk and Blackstone Rivers, and a Pump Station to convey flow to the Bucklin Point WWTF in East Providence. Expenditures in post FY 2022 will total $553.4 million. Interceptor Inspection & Cleaning – The governor recommends expenditures of $3.0 million from FY 2017 through FY 2022 to address remote television inspection and grit/debris removal and disposal.
Interceptor Restoration & Construction – The governor recommends expenditures of $29.6 million from FY 2017 through FY 2022. Some of the projects involved include the Moshassuck Valley Interceptor ($6.5 million); the Louisquisset Pike Interceptor construction in the northern section of the Town of Lincoln to accommodate the additional flow resulting from expected development ($4.0 million); and the Johnston Sewer Improvements ($4.4 million).
84

Transportation
Department of Transportation
Rhode Island Public Transit Authority


Department of Transportation
Agency Responsibilities The Department of Transportation is responsible for providing and maintaining the surface transportation (highway, mass transit, and rail) infrastructure that serves the needs of Rhode Island residents and visitors. Infrastructure-related capital projects are outlined in the Department's five year Capital Improvement Plan for inclusion in the Transportation Improvement Program (TIP), which is a ten-year plan updated once a year by the Department of Administration's Office of Statewide Planning and approved by the State Planning Council. The TIP addresses the goals of Rhode Island’s transportation program and lists priority projects and activities. In recent years, the Department's capital improvement projects have focused on continued highway construction and reconstruction, bridge repair, and statewide road projects. The State of Rhode Island has relied in the past on the issuance of general obligation debt to both finance state projects and provide the majority of required state match for federal funds. Over the last few years and moving forward, Department of Motor Vehicle fees, along with Rhode Island Capital Plan Fund financing will be the primary funding streams for the local match as the State moves away from borrowing. Federal funds have come from three sources: the Federal Highway Administration (FHWA), the Federal Transit Administration (FTA), and the Federal Railroad Administration (FRA). Federal highway funding is provided through the Highway Trust Fund and other sources, as appropriated and allocated by Congress through transportation authorization legislation. Typically, these authorization provisions extend five to six years, allowing for mid-range capital planning at the state level. In June 2012, Congress approved a two-year transportation authorization, called Moving Ahead for Progress in the 21st Century (MAP-21). MAP-21 shifted the Federal Planning and project model toward performance measurements. The limited time of the authorization was an improvement over short-term extensions, but the
two-year authorization still required the State to make assumptions when projecting the availability of future Federal resources. MAP-21 intended to create a streamlined and performance-based surface transportation program and build on and refine many existing highway, transit, bike, and pedestrian programs and policies. In December 2015, Congress enacted the FAST Act (Fixing America’s Surface Transportation Act). This is a five-year, $305 billion reauthorization of federal surface transportation programs. The Highway Trust Fund (HTF) is the source of funding for most MAP-21 programs. The HTF includes the Highway account, which funds highway and intermodal programs, and the Mass Transit Account. Federal motor fuel taxes are the primary source of income for the HTF. The passage of the FAST Act extended highway-user fees (federal gas tax and other related taxes), generally at the rates that were in place when the legislation was enacted. In the FAST Act, the metropolitan and statewide transportation planning processes are continued and enhanced to incorporate performance goals, measures, and targets into the process of identifying needed transportation improvements and project selection. Requirements for a long-range plan and a short-term Transportation Improvement Program (TIP) continue, with the development of the Long-Range Transportation Plan (LRTP) incorporating the performance plans required by the Act for certain programs. The TIP must also be developed to make progress toward established performance targets and must include a description of the anticipated achievements. All projects within the Rhode Island TIP fall into the following categories:
▪ Bridge Maintenance ▪ Pavement Maintenance ▪ Traffic Safety Maintenance ▪ Drainage Maintenance ▪ Maintenance Operations ▪ Transit Operations
85

Department of Transportation
▪ Toll Facilities Operations ▪ Headquarters Operations ▪ Debt Service ▪ Bridge Capital Program ▪ Pavement Capital Program ▪ Traffic Safety Capital Program ▪ Drainage Capital Program ▪ Railway Highway Crossing Program ▪ Transit Capital Program ▪ Transportation Alternatives ▪ Planning & Development
Bridge Maintenance involves an asset management based system of planning, with an emphasis on preservation and maintenance to keep assets in good condition. Activities include inspections, permits, joint sealing, and spot painting.
Pavement Maintenance covers the preservation of approximately 1,100 miles of roadway under the Department of Transportation’s jurisdiction. Activities include crack sealing and surface treatments.
Traffic Safety Maintenance handles damaged safety equipment that must be repaired or replaced. Activities include signage and lighting repair, permits, and pavement striping.
Drainage Maintenance activities include cleaning and flushing, removing sediment and debris, inspections, and routine maintenance.
Maintenance Operations include programs covering winter operations, mowing, sweeping, roadside maintenance, and traffic operations.
Transit Operations covers both the Department of Transportation (including commuter rail service and seasonal bus and ferry services) and RIPTA (all bus transit and paratransit operations) funding.
Toll Facilities Operations is authorized through RhodeWorks legislation. The infrastructure consists of cashless, All Electronic Tolling with equipment mounted on overhead gantries. Headquarters Operations encompasses all administrative functions at the Department of
Transportation, including Legal, Human Resources, Communications, Information Technology, and Finance. These functions maintain a system of centralized program services.
Debt Service is mainly for General Obligation bonds that require annual payments through FY 2034. In addition, debt service is required for Grant Anticipation Revenue Vehicle (GARVEE) and Motor Fuel bonds.
The Bridge Capital Program is similar to Bridge Maintenance in that it is an asset management approach used to identify and develop the sequence of preservation, repair, rehabilitation, and repair actions for bridges.
The Pavement Capital Program also uses an asset management approach to maintain the Pavement Structural Health Index (PSHI) per mile traveled at an average of 80% over the life of the TIP. A proactive approach is taken to pavement management in order to extend the life of the road surfaces.
The Traffic Safety Capital Program covers activities including roadway departure mitigation, intersection and interchange improvements, pedestrian improvements, traffic signal optimization, bottleneck reduction, and sign and structure replacement.
The Railway Highway Crossing Program provides for the elimination of hazards at crossings between rail and highways.
The Drainage Capital Program includes a comprehensive plan to invest in the State’s 25,000 stormwater catch basins, 2,000 outfalls, and 100 treatment systems.
The Transportation Alternatives Program provides funding for projects defined as transportation alternatives, including pedestrian and bicycle facilities, community improvement activities, environmental mitigation, recreational trail program projects, and safe routes to school projects.
Planning – Program Development refers to
86

Department of Transportation
tasks performed by planning personnel including data collection, civil rights, transit and capital planning, the Local Technical Assistance Program (LTAP), permitting, and research.
The Transit Capital Program covers both the Department of Transportation (including in-state rail shuttles, new transit stations and hubs, Northeast Corridor capacity improvements, ferry terminals, and rapid bus transit) and the Rhode Island Public Transit Authority (RIPTA) (including regular replacement of buses and paratransit vans, passenger facility upgrades, and intelligent transportation system equipment). GARVEE/Motor Fuel Bond Program FY 2004 marked the beginning of a major effort on the part of Rhode Island government to address the rebuilding and modernization of the State’s transportation systems. In 2003 and 2006, the State completed the first and second parts of a three-part bond transaction which authorized $709.6 million and programmed $660.5 million for five major infrastructure projects to be completed over an 8½ year period. The majority of the costs were financed through Grant Anticipation Revenue Vehicle bonds (GARVEE). GARVEE is a program approved by Congress that allows states to borrow funds, which are then backed and repaid by the annual allocation of FHWA construction funds. The remaining costs were provided through Motor Vehicle Tax Revenue Bonds. These bonds are financed through a two-cent dedication of the Department’s gasoline tax allocation. The State issued a third series of both the GARVEE and Motor Fuel Bonds in 2009. With the established funding sources in place to meet the financing requirements of this borrowing, this program will have no fiscal impact to the State and offer no financial exposure to taxpayers other than the pledging of the FHWA and gas tax funds to repay the bonds. The projects financed under this program were the I-195 Relocation, Washington Bridge Reconstruction, a new Sakonnet River Bridge,
and the Quonset Rt. 403 construction. Also financed was the completion of the Freight Rail Improvement Program. Most of the projects participating in the GARVEE program have additional financing programmed as other highway funds. Total costs have already been included in the Highway Improvement Program (HIP) project. During the 2015 General Assembly session, the passage of RhodeWorks legislation included the refinancing of existing GARVEE debt to shift payments into the future, which frees up $120 million in federal funding for use by the Department in the first four years of the program. In 2016, an additional $300 million in new GARVEE funding was made available, with the debt structured over 15 years with interest-only payments in the first nine years. The current debt service on all GARVEE bonds to be paid through the FHWA allocation is $19.1 million in FY 2017 and $23.6 million in FY 2018. The gas tax funded debt service on the Motor Fuel Tax revenue bonds totals $6.9 million in both FY 2017 and FY 2018, which is paid using 2.0-cents of the state gas tax yield. Governor's Recommendations Highway Improvement Program (HIP) – The HIP project is directed towards implementing the Department of Transportation’s federally-funded capital program as identified in the TIP. The Governor recommends the use of $8.0 million of previously authorized issued general obligation bonds in FY 2017 and FY 2018. For FY 2017 through FY 2022, a total of $1.297 billion of federal highway funds will be matched with $42.3 million in land sale revenue, $194.7 million in Rhode Island Capital Plan Fund financing, and $494.9 million in vehicle registration fee revenues. A major part of the HIP project consists of the RhodeWorks plan, which provides more funding for bridges, pavement, transit and transportation alternatives when compared to previous funding
87

Department of Transportation
options. The main focus of the program is to reduce the number of structurally deficient bridges in Rhode Island, from 22% in 2015 to 10% in 2025. The RhodeWorks program, which was included in legislation during the 2015 General Assembly, allows the Rhode Island Department of Transportation to establish and collect tolls on large commercial trucks Class 8 or larger while the collection of tolls on other vehicles, including passenger cars, motorcycles, and all other vehicle classes one (1) through seven (7) pursuant to the FHWA vehicle classification schedule, is expressly prohibited. The Department estimates that the first location will start tolling in FY 2018, depending on the construction schedule, and expected toll revenue will be $44.8 million per year. As such, the Governor recommends $217.2 million in toll revenues between FY 2018 and FY 2022. The RhodeWorks legislation also made available additional GARVEE funding, as referenced earlier. The Governor recommends a total of $313.6 in GARVEE funded expenditures as well as a total of $314.0 million in GARVEE and Motor Fuel Tax Revenue Bond debt service. A major part of the RhodeWorks plan is funding to reconstruct the aging infrastructure around the Route 6 and Route 10 interchange in Providence. Eight of 11 bridges in the Route 6/10 corridor are more than 60 years old. Based on recent structural evaluations of one of the interchange’s bridges, that portion of the project was accelerated in FY 2017 to a replacement-in-kind. For FY 2017 through FY 2022, projected total financing for the Highway Improvement Program is as follows: $446.0 million in FY 2017, $543.3 million in FY 2018, $546.6 million in FY 2019, $496.0 million in FY 2020, $440.3 million in FY 2021, and $410.4 million in FY 2022. These totals include some funding that is allotted to other capital projects within the Department of Transportation and the Rhode Island Public Transit Authority. Fixed Guideway (Commuter Rail) – The total cost of this project is projected at $161.1 million, including $61.6 million in pre-FY 2017
expenditures. Funding for the project includes $112.4 million in FTA funds, $30.0 million in Federal Stimulus funds, $3.6 million from a 2008 general obligation bond, $10.0 million in private funding, and $5.2 million from the Massachusetts Bay Transportation Authority (MBTA). The project involves the planning, design, and construction of new fixed guideway facilities, commuter rail, light rail, and/or intercity rail that will also enhance the commuter rail. The program includes the construction of stations, tracks and signals, right-of-way acquisition, purchase of locomotives and rail coaches, and other rail appurtenances to accommodate rail passenger service in Rhode Island. Commuter Rail Service is provided by the MBTA as an extension of its service to South Attleboro. Service to Providence began in 1988 when the State of Rhode Island entered into the Pilgrim Partnership Agreement with the MBTA, through which the MBTA provides commuter service to Providence Station in exchange for Rhode Island federal capital funding for projects benefiting commuter rail service. In most cases, the MBTA has provided the local match for capital investments, approximately 20 percent of a project’s costs. Such capital projects have included the Pawtucket Layover Facility Yard, a six-track overnight storage yard that opened in July 2006 and accommodates the transfer of the Attleboro Layover yard, as well as new trains, the purchase of five bi-level coaches and a commuter rail locomotive; and planning for improvements to South Attleboro Station. Rhode Island entered into an additional agreement with the MBTA to provide a South County Commuter Rail (SCCR) under the South County Operating Agreement. The extended service consists of 10 round trips along 20 miles between Providence and North Kingstown, with stops at T.F. Green Airport in Warwick and Wickford Junction. Service to Warwick/T.F. Green Airport became fully operational on December 6, 2010 and new service to Wickford Junction Station became fully operational on
88

Department of Transportation
April 24, 2012. The Interlink project at T.F. Green Airport, which is an important part of the commuter rail system, is included in Rhode Island Airport Corporation (RIAC) capital budget. The Interlink is a multimodal consolidated rental car facility stemming from a public/private partnership with the Department of Transportation, RIAC, and the rental car agencies. The facility, which opened on October 27, 2010, centralizes all Airport transportation services, including commuter rail, RIPTA, intercity bus, and rental cars into a 2,670 space parking facility connected to the Airport terminal by a moving Skybridge system. RIAC is responsible for its operation. In order for the MBTA to provide commuter rail service south of Providence to the Interlink and Wickford Junction, the Department of Transportation entered into a Rail Operating Agreement with the MBTA and the quasi-public agency, the Rhode Island Public Rail Corporation (RIPRC). That agreement requires the Department of Transportation to support MBTA service with capital projects (with the MBTA providing the match) and to pay for any MBTA costs not covered by fares. Federal Transit Administration funds allocated to Rhode Island will be used to fund the capital projects. Federal Congestion Mitigation and Air Quality (CMAQ) funds have been used to pay all operating costs during the start-up of the train service to Warwick/T.F. Green and Wickford Junction. These costs include monthly payments to AMTRAK for use of the main line and for preventive maintenance of the third track. Additionally, both AMTRAK and the MBTA require indemnification and liability insurance coverage for the Department of Transportation to extend rail service beyond Providence. This insurance and indemnification is being provided by the Rhode Island Public Rail Corporation, since the Department of Transportation, as a State agency, is not able to provide the insurance and indemnification. The Department of Transportation has entered agreements with the RIPRC covering these requirements. This capital budget project includes the Department of Transportation’s obligation to the RIPRC to pay
for the insurance and the line of credit required to indemnify AMTRAK. In July 2016, the Department of Transportation contracted with a private operator to launch a new pilot program that provides ferry service between Providence and Newport. The Department of Transportation is continuing to evaluate the benefits and costs of the ferry service. Continuation of service or the addition of routes could lead to the need for more permanent capital improvements in future years. During 2017, the following activities will be undertaken under the Fixed Guideway project: continuation of construction of the Kingston Station bypass; engineering of short term improvements to Providence Station; completion of the reconstruction of Providence Station’s south plaza; additional Pawtucket Layover Facility improvements; improvements to South Attleboro station; and renovation of MBTA equipment to allow for increased frequency of SCCR service, along with weekend service. For FY 2017, the Governor recommends total funding of $33.0 million, consisting of $10.8 million in Federal Transit Administration funds, $445,110 in MBTA funds, $920,763 of general obligation bonds from the issued 2008 authorization, $10.0 million in private funding, and $10.9 million in federal stimulus funds. For FY 2018, the Governor recommends total funding of $18.9 million, consisting of $17.2 million in Federal Transit Administration funds, and $1.7 million in MBTA funds. Financing for outer years includes $14.2 million in FY 2019, $11.0 million in FY 2020, $11.2 million in FY 2021, and $11.3 million in FY 2022. Pawtucket-Central Falls Train Station – The total cost of this project is projected to be $35.6 million, including $31.1 million in federal funds, $1.4 million in land sale revenue, and $3.0 million in local funds. In addition, $4.5 million of matching state funds is included in the Department of Transportation’s Highway
89

Department of Transportation
Improvement Program (HIP). The project encompasses construction of a new commuter rail station in Pawtucket near the Central Falls border, including two siding tracks, two platforms, a pedestrian overpass, drop-off access, parking, and enhanced bicycle/pedestrian access. The station will be served along the Providence MBTA line that connects to Boston and will relieve some of the capacity issues currently faced by Providence and South Attleboro Stations. The area of the new station is mostly underutilized or vacant mill space and is well-suited for redevelopment. Preliminary engineering and environmental reviews have already been completed, and in the spring of 2016 the Department of Transportation, in conjunction with the cities of Pawtucket and Centrals Falls, received a $13.1 million TIGER grant from the federal government. For FY 2017 through FY 2022, funding is projected as follows: $14.2 million in FY 2017, $10.9 million in FY 2018, $4.4 million in FY 2019, $3.5 million in FY 2020, and $2.5 million in FY 2021. These figures include the state funds that are part of the Department of Transportation’s HIP project. Mass Transit Hub Infrastructure – The Rhode Island Public Transit Authority, the Department of Transportation and the Division of Statewide Planning are working cooperatively on a comprehensive operational analysis of the State’s mass transit hub system to determine if the current system is the most effective and efficient structure that best serves the citizens of the State. A $35.0 million general obligation bond referendum was placed on the November 2014 ballot and ultimately approved by voters. The referenda allows the State “to issue not more than $35.0 million to fund enhancements and renovations to mass transit hub infrastructure throughout the State of Rhode Island to improve access to multiple intermodal sites, key transportation, healthcare, and other locations.” The intent of this project is to provide citizens with quick and easy access to good jobs that
offer opportunities for upward mobility in Rhode Island or beyond and a resilient downtown Providence that attracts and cultivates economic activity with an equitable, convenient, affordable and sustainable transportation network. The Department of Transportation, RIPTA, and the Statewide Planning Program identified the Providence Station Transit Center (PSTC) concept as part of its recently completed Redesigning Downtown Transit Plan. The plan conceptualizes the PSTC as a catalyst that would help unlock significant passenger and operational benefits. In addition to the $35.0 million general obligation bond, the Governor recommends $650,000 in Federal Transit Administration funds that the Department of Transportation received for the planning stages of this project, as well as $450,000 that is counted in the Department of Transportation’s Highway Improvement Program project, both to be spent in FY 2017. For FY 2017 through FY 2022, funding is projected as follows: $3.6 million in FY 2017, $15.0 million in FY 2018, and $17.0 million in FY 2019. These figures include the $450,000 that is already included in the Highway Improvement Program project. Rhode Island Travel Plaza and Transit Hub – The Governor recommends a total of $9.0 million in federal funds for this project, in addition to $3.0 million in other highway funds that are included in the Department of Transportation’s Highway Improvement Program project. The state was awarded a discretionary TIGER grant in FY 2015 to design and build a multimodal travel plaza in Hopkinton that will serve RIPTA bus riders, address a 100-mile gap in service plazas along I-95, support tourist traffic, and function as an intercity bus hub. Funds are divided evenly between FY 2017 and FY 2018. Train Station Maintenance and Repairs – The Governor recommends a total of $2.2 million for expenditures on this project, including $165,088
90
Department of Transportation
in pre-FY 2017 expenditures. The Governor recommends expenditures of $673,555 in Rhode Island Capital Plan Fund financing in FY 2017, and $350,000 per year from FY 2018 through FY 2021. The Department is responsible for the oversight and maintenance of three train stations located in Woonsocket, South Kingstown, and Westerly. The train stations serve as intermodal facilities for each of their communities. There is a need for major capital repairs at each location, such as HVAC and roofing repairs. Maintenance – Capital Equipment Replacement – This project involves the purchase of heavy trucks, sweepers, loaders, tractors, and other equipment that will replace existing fleet equipment. An analysis of the Department of Transportation’s Maintenance Division’s rolling stock and heavy vehicle inventory has been made and a replacement plan has been developed. In addition, new dump trucks have a graduated salt dispensing system which can better regulate the amount of salt placed on roads. The older trucks, which lack this system, would dispense too much salt, causing environmental issues, as well as financial issues from the wasted salt. The Department of Administration also maintains a “revolving loan fund” from which funding for limited procurements of heavy equipment has been made available. The Department reimburses this funding through the gas tax funded budget. As a means to replace the Department of Transportation’s aging heavy equipment fleet, the Governor recommends $3.5 million in FY 2017 comprised of $1.5 million in Rhode Island Capital Plan Funding, and $2.0 million in gas tax revenues. In the years following, the Governor recommends $2.5 million in Rhode Island Capital Plan Funding, along with $2.5 million in gas tax revenues annually between FY 2018 and FY 2022. This recommendation will continue to provide the Department of Transportation with a consistent source of funding each year, allowing them to continue their replacement plan by cycling in new vehicles while replacing older ones.
Maintenance Facilities Salt Storage Facilities – The Governor recommends a total of $11.3 million in Rhode Island Capital Plan Fund financing for expenditures on Salt Storage Facilities, including $4.4 million in pre-FY 2017 expenditures. This project is a planning effort on the part of the Department to examine the consolidation of salt stockpiles to improve operational efficiencies, remedy environmental deficiencies, and reduce costs. This project will combat potential groundwater contamination and reduce environmental concerns over the storage of this chemical. The Department has reviewed the existing salt storage facilities and developed a plan to replace/improve salt storage facilities to meet operational and environmental concerns. Salt is purchased in bulk with tens of thousands of tons stored at locations statewide. Currently, salt is stored uncovered at three of the division’s storage sites out of the twenty-three salt distribution centers located throughout the State. The Department has identified facilities which it plans to remediate and proposes to reduce the number of salt distribution centers to twenty. To date, five facilities have been closed; however, due to a continued need for strategically located material piles, uncovered locations continue to operate in Newport, Portsmouth, and Narragansett. The Department of Transportation has reviewed the existing salt storage facilities and developed a plan to replace/improve salt storage facilities to meet operational and environmental concerns over a five-year period. With the completion of a Portsmouth facility in FY 2020, the Department’s construction plan for new salt storage facilities will be complete. Beginning in FY 2019, the Department will begin replacement and renovations to the dome and “barn” type salt storage structures around the State. Project financing includes $2.0 million in FY 2017, and $1.0 million in each year after through FY 2022. Portsmouth Facility Construction and Repairs –The Governor recommends total financing of $6.6 million for this project, including $1.5 million in
91

Department of Transportation
pre-2017 expenditures. This project encompasses the relocation of the Portsmouth facility to state-owned land located between Boyd's Lane and the ramp to Route 24. The current facility is in poor condition with no space for the indoor storage of maintenance vehicles and equipment, nor for the covered storage of winter chemicals (salt). For FY 2017, project financing includes $923,150 of remaining general obligation bond proceeds and $2.3 million in Rhode Island Capital Plan Fund financing. In FY 2018, project financing includes $741,056 in gas tax funds and $575,256 in Rhode Island Capital Plan Fund financing. The project will be complete in FY 2019 with $500,000 of Rhode Island Capital Plan Fund financing. Maintenance Facility Improvements – The Department of Transportation has identified several maintenance facilities that are in need of capital improvements. The Governor recommends a total of $4.4 million in Rhode Island Capital Plan Fund financing, including $2.0 million in pre-FY 2017 expenditures, for continued general repair and renovation work across all seven maintenance facilities and at Division Headquarters in Warwick. Work to be performed includes repairs and renovations to roofs, walls, flooring, windows and garage doors, drainage, plumbing systems, HVACs, and electrical systems. Emphasis will be placed on renovations that make facilities more energy efficient. Upcoming projects include improvements to the Belleville Maintenance Facility, bathroom renovations at the Glocester Maintenance Facility, and roof repairs at the Little Compton Maintenance Facility. Additionally, an existing fuel pump will be moved from the Lincoln to the Smithfield Maintenance Facility. The Governor’s recommendation includes $400,000 in Rhode Island Capital Plan Fund financing per year from FY 2017 through FY 2022.
92

Rhode Island Public Transit Authority
Agency Responsibilities The Rhode Island Public Transit Authority (RIPTA) has primary responsibility for directing statewide fixed-route bus service and Americans with Disabilities Act paratransit service operations. RIPTA is managed under the direction of an eight-member Board of Directors. A Separation of Powers amendment to the constitution had eliminated two memberships formerly appointed by the House Speaker and Senate President. As a result, a 2006 amendment to R.I.G.L. 39-18-2 changed the composition of the Board from seven members to eight members with seven members being appointed by the Governor and one member as the director of the Department of Transportation. In addition to its core transit services, RIPTA operations also include program development and implementation of the statewide carpool and vanpool program. RIPTA is committed to protecting the environment and providing safe, reliable, quality transit service that is responsive to customer needs with particular emphasis on Rhode Island’s families, children, transit dependent populations, elderly and disabled residents. RIPTA has a fleet of 232 buses and trolleys, which are operated and maintained by over 800 employees. The authority’s main facility is located in the City of Providence with a satellite operation on Aquidneck Island. In addition to the fixed route service, RIPTA administers the paratransit service and as the largest of the three existing carriers, provides direct service in four of six designated regions. RIPTA is responsible for management oversight of coordinated paratransit services, including coordination of the purchase of vehicles and state equipment for contractors in the state paratransit system; and ensuring that project vehicles and equipment are maintained in good operating condition. As the statewide public transit organization, RIPTA has a primary role to expand access and mobility opportunities for
Rhode Islanders by undertaking actions and supportive strategies, directly and in collaboration with others, to provide a full range of options to the single-occupant automobile. These key mobility strategies include: transit design and service strategies which help improve the livability of communities and act as a stimulus for neighborhood renewal; technological advancements which increase travel options and convenience; and, collaborative land use strategies and economic development initiatives that foster transit ridership and pedestrian movement through transit-friendly land use and development. Governor's Recommendations RIPTA Bus Purchases – The Governor recommends expenditures of $42.7 million from FY 2017 through FY 2022 for the Rhode Island Public Transit Authority (RIPTA) for the continued purchase of buses and other revenue vehicles that have exceeded, or will exceed, their estimated useful life over the five-year plan. Most of the funding for these purchases ($36.7 million) is provided by Federal Transit Administration (FTA) grants, as well as the State Fleet Replacement Fund ($2.4 million), funds transferred from the Rhode Island Department of Transportation revenues from vehicle registration fees ($3.0 million), and Rhode Island Capital Plan Funds in FY 2022 ($3.5 million). The Governor recommends expenditures as follows: $11.6 million in FY 2017; $12.8 million in FY 2018; $694,575 in FY 2019; and $17.6 million in FY 2022. Of note, the vehicle registration fees used for this project are already counted in the Department of Transportation’s capital plan (within the Highway Improvement Program) and are shown as offset to avoid double-counting. Paratransit Vehicles – For FY 2017 through FY 2022, the Governor recommends expenditures of $9.8 million, including $7.9 million in FTA grants and $2.0 million from the RIPTA Paratransit Revolving Loan Fund, for the continued replacement and renovation of
93

Rhode Island Public Transit Authority
paratransit vehicles for transportation service provided to elderly and disabled people throughout Rhode Island. RIPTA is now utilizing an Intelligent Transportation System program to replace the existing software scheduling and billing system. This project includes a software system upgrade that equips RIde vehicles with on-board technology that combines vehicle location with up-to-the-minute schedule changes. The Intelligent Transportation Systems Implementation is now a separate project included below. The FTA funds will be matched with RIPTA paratransit revolving loan funds generated by lease payments made to RIPTA by contracted paratransit carriers (80 percent/20 percent match rate). The Governor recommends expenditures of $1.4 million for each year from FY 2017 to FY 2022 for this project. Downtown Providence Transit Connector – The Governor recommends expenditures of $15.0 million in FY 2017 through FY 2019, including $13.0 million in FTA funding and $4.0 million in other funding. The FTA funding is a discretionary TIGER grant that was awarded to implement the Downtown Transit Connector, an enhanced transit corridor that will provide peak bus service through the of downtown Providence and connect passengers to the state’s largest employment hubs and major redevelopment area. The project investments include additional hybrid electric vehicles, custom designed shelters, signage, roadway improvements and bike infrastructure. The matching state funding will be from three sources. $1.1 million of the state match will come from the Rhode Island Department of Transportation revenues from vehicle registration fees, specifically for the match required to purchase the new hybrid electric vehicles (the total costs for vehicles is $4.4 million). Another $838,721 of the match will be from the Department of Transportation’s Highway Improvement Program capital project funds. The remaining $2.0 million in match will be from Rhode Island Capital Plan Funds. The Governor recommends $305,882 in FY 2017, $2.0 million in FY 2018, and $12.7 million in FY 2019 for this
project. Of note, the vehicle registration fees and other Department of Transportation funding used for this project are already counted in the Department’s capital plan (within the Highway Improvement Program) and are shown as offsets to avoid double-counting. Pawtucket Bus Hub and Transit Corridor – The Governor recommends total project costs of $7.0 million dollars to build a bus hub adjacent to the new Pawtucket-Central Falls Commuter Rail Station (a Rhode Island Department of Transportation project) that is anticipated to open in 2020. The current Pawtucket bus hub, which is the second busiest in the state, is outdated and in need of replacement. The new hub will be moved a half-mile to the west to realign with an improved transit corridor within the city and will include six to eight bus berths, shelters, real-time bus information, ticket vending machines (TVMs), and a small building for waiting space and restrooms. In addition, the project will include shelters and TVMs at a number of stops along the transit corridor within the city of Pawtucket, as well as improvements to curbs, sidewalks, and crosswalks at the station and along the corridor. Funding for the project will be primarily from Federal Transit Administration funds ($5.6 million), Rhode Island Capital Plan Funds ($1.3 million), and local funds from the City of Pawtucket ($150,000). The Governor recommends expenditures as follows: $301,969 in FY 2017, $2.0 million in FY 2018, and $4.7 million in FY 2018 for this project. College Hill Bus Tunnel – The Governor recommends $9.3 million in expenditures for FY 2019 through FY 2021, in addition to $69,929 in pre-FY 2017 expenditures for improvements, structural and drainage repairs, and safety enhancements to the College Hill Bus Tunnel. The tunnel is a critical element of the transit network and is designated as a “fixed guideway”, in which the federal government requires the tunnel be maintained as a condition of transit funding. Funding sources include FTA funds ($7.5 million), Rhode Island Capital Plan Fund
94

Rhode Island Public Transit Authority
financing ($1.6 million) and RIPTA operating funds ($266,727). Projected expenditures by year are as follows: $943,705 in FY 2019; $4.2 million in FY 2020; and $4.2 million in FY 2021. Land and Buildings Enhancements – The Governor recommends expenditures of $14.2 million between FY 2017 and FY 2022 for upgrades to transit hubs and Park and Ride lots, financed from $12.5 million of FTA funds, $994,000 of local funds, $712,696 of Rhode Island Capital Plan Fund financing, $55,000 of RIPTA capital funds, and $108,232 of RIPTA operating funds. The budget includes a multi-year Bus Stop and Sidewalk program in partnership with the City of Providence, with the goal to create improved bus shelters at high-volume stops. Partnerships with community organizations to build bus shelters will continue, and will be used to provide the 20 percent match required for project financing. The Governor recommends expenditures as follows: $8.0 million in FY 2017; $2.0 million in FY 2018; and $1.1 million per year from FY 2019 through FY 2022. Farebox Upgrade – The Governor recommends expenditures of $5.5 million in FY 2018 to upgrade RIPTA’s vehicle fareboxes from a mechanical process to a digital process. As part of the project, RIPTA will be conducting a fare study which will create a simplified, more equitable fare structure. The project will be financed using $4.4 million in Federal Transit Administration funds and $1.1 million of RIPTA operating funds Redundancy – The Governor recommends expenditures of $1.9 million in FY 2017 and FY 2018 for a computer system redundancy to ensure the duplication of critical components and functions of RIPTA’s data and computer systems with the intention of increasing reliability of the system. Of this total, the Governor recommends $1.5 million from FTA funds with a match of $372,000 from RIPTA’s revolving loan fund. The Governor recommends expenditures as follows: $1.0 million in FY 2017; and $860,000 in FY
2018. Enterprise Software Solution – The Governor recommends expenditures of $890,410 in FY 2017 as part of five-year plan to migrate RIPTA’s current iSeries IBM platform to a Windows-based enterprise software solution. The upgrade will allow RIPTA to improve its financial and other data systems; improve data quality; reduce processing time; and provide management with new tools to monitor agency performance. The Federal Transit Administration awarded RIPTA a competitive grant for 80.0-percent of the cost of the project to improve RIPTA’s data systems and asset management through its “State of Good Repair” program. RIPTA will benefit from the efficiencies of an upgraded enterprise software solution by providing increased performance measures, which may lead to greater cost containment. FY 2017 expenditures consist of $712,328 in FTA funds matched by $178,082 in RIPTA Revolving Loan Fund resources. Intelligent Transportation Systems Implementation – The Governor recommends expenditures of $217,691 to complete the purchase and installation of an Automated Transit Management System (ATMS) in RIPTA vehicles. The total cost of the project is $8.4 million, of which $8.1 million was spent prior to FY 2017. The new technology allows RIPTA to furnish real-time bus information to riders; use real-time data communications to adjust bus scheduling; and provides for automatically announced predetermined stops to comply with American with Disabilities mandates. This project is expected to be completed in FY 2017. Funding consists of $174,153 in FTA funding and $43,538 in RIPTA Revolving Loan Fund resources. Fixed Route and Paratransit Cameras – The Governor recommends expenditures of $180,340 in FY 2017 to complete a $2.3 million project to install a digital security camera system (SCS) on RIPTA’s 227 fixed route and 125 paratransit vehicles, which will improve employee and public safety and reduce insurance claims due to
95

Rhode Island Public Transit Authority
injury and accidents. Some features of the SCS include: a minimum of six cameras on each fixed route vehicle; five cameras on paratransit vehicles; a wireless LAN network in the garage; and a database server large enough to store 2,000 hours of video data. FTA funds will support 80.0-percent of the project in the amount of $1.8 million, matched by $453,960 from RIPTA’s Revolving Loan Fund.
96
Quasi-Public Agencies
Rhode Island Airport Corporation Rhode Island Resource Recovery Corporation Rhode Island Turnpike and Bridge Authority

Airport Corporation
Agency Responsibilities The Rhode Island Economic Development Corporation (EDC), now known as the Rhode Island Commerce Corporation (Commerce RI), created the Rhode Island Airport Corporation (RIAC or Airport Corporation) on December 9, 1992 as a subsidiary public corporation, governmental agency, and public instrumentality having a distinct legal existence from the State of Rhode Island and the EDC and having many of the same powers and purposes of the EDC. RIAC is empowered to undertake the planning, development, management, acquisition, ownership, operation, repair, construction, renovation, sale, lease or other disposition of any airport facility, including the T.F. Green State Airport in Warwick, as well as the North Central, Quonset, Westerly, Newport, and Block Island airports. The powers of the Airport Corporation are vested in its Board of Directors consisting of seven members. RIAC does not have the power to issue bonds or notes or borrow money without the approval of the Rhode Island Commerce Corporation (formerly known as EDC). The Airport Corporation leases the airports from the State of Rhode Island, heretofore, through the Department of Transportation. The State and the department have assigned all rights to airport revenues, the proceeds of general obligation bonds issued for airport projects, federal grant agreements, insurance proceeds, all contracts including concession agreements with vendors and airlines, and all licenses and permits to the Airport Corporation. RIAC has agreed to reimburse the State for general obligation debt service after July 1, 1993, to the extent that money is available from its funds. In the event of insufficient funds, the unpaid debt shall accrue and be payable in the following fiscal year. The Airport Corporation was established for the purpose of assuming operating responsibility for the airports and undertaking capital
improvements. RIAC is intended to provide more flexibility in the provision of state match funds for all airport related projects by utilizing revenue bonds backed by revenue from parking, car rental, and other concessionaires, including landing fees paid by airlines, as well as a passenger facility charge that the federal government has empowered local airports to collect in order to finance capital improvements. The Airport Corporation is entitled to receive funds from the Federal Aviation Administration (FAA), which provides funds on a (federal/sponsor) matching basis, generally ranging from 75-95%, to improve the State's airport system and finance equipment purchases, runway reconstruction, and terminal building improvements. The grants are used to support a program of specific runway, hangar, taxiway, signing, and other improvements under the general title of the Airport Improvement Program. The recommendation for the FY 2017 – FY 2021 Capital Budget includes T.F. Green Improvements and General Aviation (GA) Improvements. Total costs of $203.7 million for T.F. Green Improvements are recommended while $47.5 million for General Aviation Improvements are also recommended. The following is a breakdown of the specific projects recommended of the two overall projects contained in the FY 2017 – FY 2021 Capital Budget. Governor's Recommendations T.F. Green Capital Improvements Extend Runway 5-23 – The Governor recommends $92.5 million including $44.8 million in pre-FY 2017 expenditures to extend Runway 5 to the south by approximately 1,530 feet to a total length of 8,700 feet. Major components of this work will contain mandatory acquisition of property to support roadway re-alignment; re-alignment of a portion of Main Avenue; relocation of Winslow Park;
97

Airport Corporation
installation of an EMAS bed to provide a FAA approved RSA for Runway 5; new navigational aids, airfield approach lighting, drainage improvements, and utility relocations; and voluntary acquisition of residences located in a newly defined Runway Protection Zone (RPZ) for Runway 5’s extension. Remaining financing for the project will include $25.8 million of FAA funds and $21.8 million in passenger facility charges and bonds backed by passenger facility charges. Noise Mitigation – The Airport Corporation has undertaken an extensive Noise Mitigation Program for more than a decade. This project consists of two components: home and land acquisition and sound insulation treatments. In accordance with Federal Aviation Regulations, this project provides for sound insulation of eligible homes and apartments within the 2020 65 DNL contour of the Airport and contiguous neighborhoods. Soundproofing measures include replacement of windows, new prime and storm doors, installation of air conditioning, and other related measures. This project is for a total of 578 units (homes and apartments) that fall within the 2020 65 DNL. The second component, in accordance with Federal Aviation Regulations, provides for the voluntary land acquisition of homes and vacant parcels within the 2025 70 DNL contour and the 2020 70 DNL contour. This project is for the purchase and demolition of approximately 83 homes and associated parcels. Any home acquired will be based on their fair market value as determined by a certified appraisal. Residents will be offered a replacement housing payment, moving expenses, closing costs and incidental expenses. The Governor recommends $58.0 million, which includes $27.9 million in pre-FY 2017 expenditures. For the period FY 2017 through FY 2018, $18.6 million in FAA funds and $2.1 million in passenger facility charges are recommended. Airfield Geometry Improvements – The Governor recommends $6.0 million for the
design, construction, and construction administration related to airfield geometry improvements (“hotspots”) identified at three separate areas on the airfield. The Governor recommends financing of $4.5 million from FAA funds and $1.5 million from passenger facility charges over FY 2019 and FY 2020. Runway Obstructions – The Governor recommends $1.8 million, including $0.6 million in pre-FY 2017 expenditures, for the removal or lighting of identified obstructions based on the FAA determination. Financing for FY 2017 and FY 2018 includes $1.1 million in FAA funds and $118,679 in RIAC general revenues. Terminal Improvements – The Governor recommends $5.8 million for improvements to the interior of the airport terminal. Improvements include upgrades or replacement to the public announcement system, bathroom facilities, carpeting, ceiling and wall coverings and public seating. Expenditures will occur through FY 2021 and will be financed entirely from RIAC general revenue. Triturator Upgrade – The Governor recommends total passenger facility charges funds of $725,000 for the design, permitting, bidding and construction costs to ensure compliance with the Rhode Island Department of Environmental Management and Warwick Sewer Authority standards. Financing includes $92,143 in pre-FY 2017 expenditures, $532,857 in FY 2017 and $100,000 in FY 2018. Airport Improvement Mitigation Measures – The Governor recommends $500,000, including $334,452 in pre-FY 2017 expenditures for airport improvement mitigation measures required by the Record of Decision associated with Airport Improvement projects identified in the Final Environmental Impact Statement. Two key tasks include final permitting and cultural assessments associated with Main Avenue relocation, Winslow Park recreation facilities,
98

Airport Corporation
Runway 5 extension, and post-construction tracking and monitoring for wetlands mitigation measures. Financing includes $62,081 in FAA funds and $20,694 in passenger facility charge revenues in both FY 2017 and in FY 2018. Master Plan Update – The Governor recommends total financing of $1.0 million, including $36,000 in pre-FY 2017 expenditures, to update the Airport Master Plan for T.F. Green Airport. The Federal Aviation Administration recommends that Airport Master Plans be updated every five to ten years. Financing of the project includes $626,600 in FY 2017 and $337,400 in FY 2018 from General Airport Revenue Bonds. Runway 34 Taxiway C Improvements – The Governor recommends $20.0 million for safety improvements to Runway 34 Taxiway C. This safety improvement will relocate the Taxiway C centerline from the current 300-foot offset to the FAA standard 400-foot offset to the Runway 16-34 centerline. Impact to the wetlands is expected and the extent of mitigation measures will be determined during the design phase. Financing includes $1.5 million of FAA funds and $500,000 in passenger facility charge revenues in FY 2021, $8.8 million of FAA funds and $2.9 million in passenger facility charge revenues in FY 2022 and $4.7 million of FAA funds and $1.6 million in passenger facility charge revenues in FY 2022 and beyond for this safety improvement project. Runway 16/34 Reconstruction – The Governor recommends total financing of $16.5 million, beginning in FY 2020, for the design and reconstruction of the runway pavement. The scope of the project includes milling existing bituminous surfaces, grading, paving, pavement markings, lighting, and signage improvements to ensure long-term use of the runway. Financing of the project includes $1.9 million of FAA funds and $618,750 in passenger facility charge revenues in FY 2020, $9.3 million in FAA funds and $3.1 million in passenger facility charge
revenues in FY 2021 and $1.2 million in FAA funds and $412,500 in passenger facility charge revenues in post-FY 2022. Demolition of Properties – The Governor recommends $400,000 beginning in FY 2017 from General Airport Revenue Bonds for the demolition of various buildings/structures on the airport property. Taxiway Signage Change and Redesign – The Governor recommends $200,000 in FY 2019 for signage improvements at various taxiways. Financing includes $150,000 of FAA funds and $50,000 of RIAC general revenue. Lot E Infrastructure Improvements – The Governor recommends $300,000 in RIAC general revenue beginning in FY 2017 for repairs and improvements to Lot E (long-term parking). Improvements include paving, additional curb cuts and shelter upgrades. General Aviation Capital Improvements Block Island – The Airport Master Plan Update identified the need for additional aircraft parking during the peak season. This project will rehabilitate the existing apron and develop an additional paved aircraft parking apron at the west end of the existing apron. This Block Island project includes $4.3 million in FAA financing and General Airport Revenue Bonds, beginning in FY 2020. Newport – Newport is scheduled to begin rehabilitation and expansion of the current aircraft apron, rehabilitation of Runway 4-22, and the acquisition of easements to remove multiple obstructions and install obstruction lights at the airport. The Governor recommends total financing, supported from RIAC general revenues, FAA funds and General Airport Revenue Bonds, in the amount of $7.8 million. Financing includes $255,638 in FY 2017, $3.5 million in FY 2018, $367,207 in FY 2020, and $3.7 million in FY 2021. Quonset – The Governor recommends total
99

Airport Corporation
financing of $35.2 million for various projects at the Quonset Airport. Projects include the demolition of the old terminal, rehabilitation of Runways 5-23 and 16-34, relocating the fuel farm consisting of two 12,000 tanks, reconstruction of the seawall which is in poor condition, and for the design and construction of additional hanger space. Construction of the hanger is contingent upon appropriate level of demand within the marketplace. Financing will come from FAA funds, General Airport Revenue Bonds, passenger facility charges, and RIAC general revenue. Miscellaneous Demolition – The Governor recommends $100,000 beginning in FY 2017 for environmental assessments, hazardous materials abatement, and demolition of various buildings located on General Aviation Airport property.
100

Rhode Island Resource Recovery Corporation
Agency Operations The Resource Recovery Corporation operates an integrated statewide system of solid waste management facilities and programs to provide environmentally sound and economically reasonable source reduction, recycling and disposal services. The goal of the Corporation's solid waste management system is to minimize the amount of waste generated and landfill and maximize the amount of waste recycled and reused. Source reduction and public education programs include the following:
household hazardous waste reduction; used consumer electronics collection; distribution of home composting bins; technical assistance; materials exchange listings; a teacher’s curriculum; school presentations and workshops;
and other source reduction programs.
The Materials Recycling Facility (MRF), in concert with grants to municipalities, supports a broad municipal recycling program. Metal, newspapers, and plastic and glass containers are delivered to the MRF, processed, and sold on the open market to be remanufactured. The Corporation developed and implemented an integrated solid waste management system in the most environmentally sensitive and economical manner possible. The Landfill is currently the foundation of the integrated system. All operations are conducted utilizing state of the art technology, including double lining the landfill. Corporation’s Capital Plans
Phase VI Design and Construction:
The eastward Phase VI expansion of the Central Landfill is expected to provide solid waste disposal capacity for Rhode Island through
2038. Included in the capital plan for Phase VI is the cost to design, excavate, and incrementally construct the baseliner for the several planned cells. Projected costs are as follows: $8.5 million in FY 2017; $12.6 million in FY 2018; $8.9 million in FY 2019; $2.9 million in FY 2020; $4.5 million in FY 2021; $9.0 million in FY 2022 and $51.2 million in post-FY 2022. Prior to FY 2017, $22.4 million has been spent.
Underdrain Treatment System:
The project will provide Phosphorus Treatment associated with the underdrain treatment system. The governor recommends $1.1 million in FY 2018.
Pump Station #3 Retrofit:
This project would begin modification of the existing pump station to better manage leachate flows, reduce operational expenses, better record flows and update configuration to extend useful life. The governor recommends $175,000 in FY 2018 and $175,000 in FY 2019.
Pump Station Modifications:
This project consists of making the modifications necessary to utilize new storage tanks. It includes design, earthwork piping and PS configurations. The governor recommends $375,000 in FY 2017. Prior to FY 2017, $375,000 has been spent.
Leachate Storage Tanks:
This project would add a 1 million gallon equalization tank for LPTF Operations with secondary storage. It has been determined that an additional tank may be required to handle excess leachate during wet conditions. The governor recommends $1.0 million in FY 2017 and $1.0 million in FY 2018.
101
Rhode Island Resource Recovery Corporation
Relocation of trailer loading docks
This project would relocate new loading docks on the East Side of their building. The governor recommends $325,000 in FY 2020.
Fiber Bailer and Conveyor Replacement
This project would replace an aging fiber bailer and incline conveyor. The bailer is close to 13 years old and has logged approximately 30,000 hours of use. The governor recommends $1.5 million in FY 2021.
102

Rhode Island Turnpike and Bridge Authority
Agency Responsibilities The Rhode Island Turnpike and Bridge Authority (RITBA) has primary responsibility for operating and maintaining the Pell Bridge, built in 1969, between Newport and Jamestown, and the Mount Hope Bridge, built in 1929, between Portsmouth and Bristol, structures that are integral to travel in the coastal area of Rhode Island and neighboring states. RITBA was created in 1954 by the Rhode Island General Assembly as a body corporate and politic responsible for construction of the Claiborne Pell Bridge (formerly the Newport Bridge) which was opened for traffic on June 28, 1969. The authority consists of five (5) members, including the director of transportation and four (4) members appointed by the governor. The authority is authorized to fix, revise, charge and collect tolls for the use of the Pell Bridge and the Mount Hope Bridge. The toll for the Mount Hope Bridge has been eliminated and the upkeep remains the responsibility of RITBA from proceeds of toll revenues collected on the Claiborne Pell Bridge, as well as interest earning on investments. In the 2012 Legislative Session, legislation was passed which transferred ownership of the Jamestown Bridge and the Sakonnet River Bridge from the State to the Rhode Island Turnpike and Bridge Authority contingent on the tolling of the Sakonnet River Bridge. Toll revenue from the Sakonnet and Newport Bridge were designed to provide the funds needed to maintain the four bridges under RITBA’s control. During the following legislative session, the 2013 General Assembly enacted legislation contained in Article 5 of the FY 2014 budget as enacted and House Bill 6329 Substitute A, which amended R.I.G.L. 24-12-40.F entitled “Sakonnet River Bridge Vested in Rhode Island Turnpike and Bridge Authority – Institution of Tolls”. The Amendment delayed the collection of tolls on the Sakonnet River Bridge until August 19, 2013, at which time; the Authority may then charge and collect tolls for the use of the bridge. The toll imposed was not to exceed ten cents ($0.10) until April 1, 2014.
The amendment also established a Special Legislative Commission to make a comprehensive study of all types of funding mechanisms and strategies to support Rhode Island’s infrastructure. In 2014, Senate Bill 2697 Substitute A extended the final date the Rhode Island Turnpike and Bridge Authority could impose a toll on the Sakonnet River Bridge not to exceed ten cents from April 1, 2014 to May 15, 2014 (the Governor halted the tolls on June 20, 2014 after signing into law the state budget). The Commission to study all types of funding mechanisms in support of Rhode Island’s transportation infrastructure held four meetings between the months of September through December of 2013 and ultimately reported its findings on January 15, 2014. With the advent of a joint House and Senate Commission to study transportation with participants from the Department of Administration, Department of Transportation and Rhode Island Turnpike and Bridge Authority, along with Senate Bill 2335 Relating to Public Finance and the creation of a Rhode Island Transportation Infrastructure Fund (2014); Article 21 passed by the 2014 General Assembly was included as part of the final FY 2015 Appropriations Act and became Rhode Island’s plan towards transportation financing. The article makes a number of technical changes to existing law and implements various funding streams as a means towards financing the plan. Article 21 removed any power the Rhode Island Turnpike and Bridge Authority (RITBA) would have to charge tolls on the Sakonnet River Bridge. Section 1 also ended the ten cent ($0.10) toll as of June 30, 2014. The Turnpike and Bridge Authority will continue to control the four bridges in the East Bay (Newport Pell, Jamestown, Mount Hope, and Sakonnet). Tolling of the Newport Pell Bridge will continue. To make up for the loss of revenue by not tolling the Sakonnet River Bridge, Section 4 of Article 21, related to the Motor Fuel Tax, transfers three and one-half cents (3.50 cents) of
103

Rhode Island Turnpike and Bridge Authority
the gas tax to the Rhode Island Turnpike and Bridge Authority beginning in FY 2015 to be used for maintenance operations, capital expenditures and debt service on any of its projects in lieu of a toll on the Sakonnet River Bridge Governor's Recommendations Bridge and Connector Repairs – A Kushner Authorization was approved in FY 2011 for the issuance of $68.1 million in Rhode Island Turnpike and Bridge Authority revenue bonds to be secured by tolls and other revenues. The proceeds will be used for steel superstructure repair and steel superstructure sandblasting, as well as the application of protective coatings to the various bridges under the Authority’s control, as needed. The total cost of repairs to the Bridges for the period from FY 2017 to 2022 is estimated at $152.6 million. The repairs for the Newport Pell Bridge total $88.0 million for the period. The total cost for the Mt. Hope Bridget is $24.4 million for the period. The total cost for the Sakonnet River Bridge is $10.5 million for the period. The total cost for the Jamestown Bridge is $21.4 million for the period. Projected costs for work on the Rt. 138 Connector and Authority facilities total $8.4 million for the period.
104

Section 3 – Schedules


Schedule 1 - Summary of Proposed G.O. Bond Issuance by Agency
FY 2017 FY 2018 FY 2019 FY 2020 FY 2021 FY 2022 TotalsAgency
Administration - - - - - - - Commerce Corporation 5,000,000 31,500,000 51,000,000 34,500,000 18,000,000 - 140,000,000 Labor and Training - - - - - - - Revenue - - - - - - - Public Utilities Commission - - - - - - -
Subtotal: General Government 5,000,000 31,500,000 51,000,000 34,500,000 18,000,000 - 140,000,000
Behavioral Healthcare, Devel Dis. & Hosp. - - - - - - - Children, Youth and Families - - - - - - - Human Services 27,000,000 - - - - - 27,000,000 Governor's Commission on Disabilities - - - - - - -
Subtotal: Human Services 27,000,000 - - - - - 27,000,000
Elementary & Secondary Education - - - - - - - Higher Education 40,000,000 54,200,000 36,200,000 39,500,000 11,100,000 - 181,000,000 Council on the Arts 5,000,000 7,000,000 2,500,000 - - - 14,500,000 Atomic Energy Commission - - - - - - - Historical Preservation & Heritage Comm. 1,000,000 1,000,000 1,000,000 1,000,000 - - 4,000,000
Subtotal: Education 46,000,000 62,200,000 39,700,000 40,500,000 11,100,000 - 199,500,000
Attorney General - - - - - - - Corrections - - - - - - - Judicial - - - - - - - Military Staff - - - - - - - RI Emergency Management Agency - - - - - - - Public Safety - - - - - - -
Subtotal: Public Safety - - - - - - -
Environmental Management 2,025,000 16,600,000 16,100,000 14,100,000 9,575,000 - 58,400,000 Coastal Resources Management Council - - - - - - - Clean Water Finance Agency 9,475,000 6,900,000 5,800,000 - - - 22,175,000 Narragansett Bay Commission - - - - - - -
Subotal: Natural Resources 11,500,000 23,500,000 21,900,000 14,100,000 9,575,000 - 80,575,000
Transportation 2,500,000 15,000,000 17,000,000 - - - 34,500,000 RI Public Transit Authority - - - - - - -
Subtotal: Transportation 2,500,000 15,000,000 17,000,000 - - - 34,500,000
Totals 92,000,000 132,200,000 129,600,000 89,100,000 38,675,000 - 481,575,000
105

Schedule 2 - Statewide Summary by Source of Funds
Pre-FY 2017 FY 2017 FY 2018 FY 2019
By Source of Funds Agency Funds 4,742,896 900,000 900,000 900,000 Certificates of Participation 52,366,205 30,719,080 31,790,000 14,040,000 Federal Emergency Management Agency 2,598,923 1,196,225 500,000 500,000 Federal Environmental Protection Agency 374,554,541 19,300,000 19,250,000 19,200,000 Federal Funds 25,494,776 43,664,947 27,502,727 2,350,000 Federal Highway Administration 981,661,072 241,513,719 251,639,250 211,489,250 Federal Highway Funds - Debt Service 199,824,903 19,117,070 23,560,250 57,535,250 Federal National Guard Bureau 30,237,215 57,495,016 34,057,500 13,390,000 Federal Stimulus Funding 76,278,070 10,865,591 - - Federal Transit Administration 149,724,042 36,509,848 44,107,397 35,212,299 GARVEE Bonds 501,973,232 62,578,184 100,000,000 100,000,000 GARVEE Residual Earnings 20,105,872 500,000 494,418 - Gas Tax 2,743,879 3,227,320 3,241,056 2,500,000 Gas Tax Proceeds - Debt Service 42,151,526 6,860,740 6,859,490 6,862,940 General Obligation - Issued Proceeds 395,652,265 65,144,224 7,504,303 2,000,000 General Obligation - Unissued Proceeds - 97,000,000 131,200,000 128,600,000 General Revenue 1,601,265 900,000 1,868,000 636,540 Information Technology Investment Fund 16,356,087 22,745,966 7,665,000 3,310,000 Insurance Proceeds - - 142,253 - Interest Earnings 2,485,258 50,000 50,000 50,000 Land Sale Revenue 13,761,476 13,200,000 14,217,970 10,760,000 Local Funds 620,630 1,853,394 1,210,606 1,020,000 Massachusetts Bay Transit Authority 14,890 445,110 1,674,412 902,003 Other Funds 60,597,419 46,632,539 32,421,013 19,591,500 Paratransit Revolving Fund 5,054,541 280,525 280,525 280,525 Private Funding 6,633,619 19,817,127 418,000 228,025 Restricted Receipt Funds 22,868,884 26,962,719 13,500,000 450,000 Revenue Bonds 1,164,593,678 52,830,000 75,819,680 70,800,000 Revolved Capitalization Grants 191,090,673 18,600,000 18,800,000 19,592,000 RI Capital Plan Fund 481,563,761 180,652,324 182,436,462 132,364,578 RIHEBC Bonds 18,131,279 9,377,029 57,874,472 45,616,954 RIPTA Capital Funds - 55,000 - - RIPTA Operating Funds 619,681 - 1,100,000 188,741 RIPTA Revolving Loan Fund 3,028,454 457,687 172,000 - State Fleet Replacement Fund 5,252,800 2,173,704 273,496 - Third Party Financing 448,795 91,622 - 20,000,000 Toll Revenue - - 38,000,000 44,800,000 University/College Funds 5,995,364 10,640,277 9,014,571 3,002,824 Vehicle Registration Fees 61,377,364 77,124,400 84,089,714 82,684,956
Totals 4,922,205,335 1,181,481,387 1,223,634,565 1,050,858,385
106

Schedule 2 - Statewide Summary by Source of Funds
FY 2020 FY 2021 FY 2022 Post-FY 2022 Totals
By Source of Funds Agency Funds 900,000 900,000 900,000 - 10,142,896 Certificates of Participation 6,250,000 4,500,000 - - 139,665,285 Federal Emergency Management Agency 500,000 500,000 - - 5,795,148 Federal Environmental Protection Agency 19,200,000 19,200,000 - - 470,704,541 Federal Funds 6,500,000 - - - 105,512,450 Federal Highway Administration 217,362,250 213,889,250 183,989,250 - 2,301,544,041 Federal Highway Funds - Debt Service 57,563,500 57,540,250 57,540,000 470,113,000 942,794,223 Federal National Guard Bureau 22,812,750 1,025,000 1,025,000 - 160,042,481 Federal Stimulus Funding - - - - 87,143,661 Federal Transit Administration 19,235,426 18,349,426 26,720,768 1,122,100 330,981,306 GARVEE Bonds 50,000,000 - - - 814,551,416 GARVEE Residual Earnings - - - - 21,100,290 Gas Tax 2,500,000 2,500,000 2,500,000 - 19,212,255 Gas Tax Proceeds - Debt Service 6,859,440 6,860,516 6,860,704 29,597,803 112,913,159 General Obligation - Issued Proceeds - - - - 470,300,792 General Obligation - Unissued Proceeds 84,100,000 39,675,000 6,000,000 - 486,575,000 General Revenue - - - - 5,005,805 Information Technology Investment Fund 2,090,000 2,050,000 - - 54,217,053 Insurance Proceeds - - - - 142,253 Interest Earnings 50,000 50,000 - - 2,735,258 Land Sale Revenue 3,535,144 1,000,000 1,000,000 - 57,474,590 Local Funds 20,000 20,000 20,000 - 4,764,630 Massachusetts Bay Transit Authority 714,081 714,081 714,081 - 5,178,658 Other Funds 20,041,558 87,064,000 159,994,000 555,405,000 981,747,029 Paratransit Revolving Fund 280,525 280,525 280,525 280,525 7,018,216 Private Funding 2,771,975 500,000 - - 30,368,746 Restricted Receipt Funds 350,000 350,000 250,000 - 64,731,603 Revenue Bonds 71,200,000 102,300,000 2,000,000 - 1,539,543,358 Revolved Capitalization Grants 20,050,000 19,599,999 - - 287,732,672 RI Capital Plan Fund 120,967,886 115,026,766 100,120,797 4,000,000 1,317,132,574 RIHEBC Bonds 17,940,918 18,942,914 9,546,475 12,569,459 189,999,500 RIPTA Capital Funds - - - - 55,000 RIPTA Operating Funds 32,000 32,000 - - 1,972,422 RIPTA Revolving Loan Fund - - - - 3,658,141 State Fleet Replacement Fund - - - - 7,700,000 Third Party Financing 20,000,000 - 20,000,000 65,000,000 125,540,417 Toll Revenue 44,800,000 44,800,000 44,800,000 - 217,200,000 University/College Funds 2,433,597 2,843,186 500,000 500,000 34,929,819 Vehicle Registration Fees 83,473,311 83,726,883 83,767,448 - 556,244,076
Totals 904,534,361 844,239,796 708,529,048 1,138,587,887 11,974,070,764
107

Schedule 3 - Statewide Summary by Agency
Pre-FY 2017 FY 2017 FY 2018 FY 2019
By AgencyAdministration 131,953,429 73,401,051 59,512,761 38,310,000 Executive Office of Commerce 20,508,745 16,977,568 34,400,000 53,000,000 Labor and Training 2,765,234 2,356,783 1,130,000 900,000 Revenue 38,969,815 14,282,653 618,000 636,540 Secretary of State - 150,000 - - Public Utilities Commission 159,963 50,115 50,000 200,000
Subtotal: General Government 194,357,186 107,218,170 95,710,761 93,046,540
Behavioral Health, DevelopmentalDisabilities and Hospitals 37,233,809 13,810,541 7,165,000 5,570,000
Children, Youth & Families 1,745,183 959,673 1,100,000 - Human Services 34,529,959 64,165,000 23,665,000 165,000
Subtotal: Human Services 73,508,951 78,935,214 31,930,000 5,735,000
Elementary & Secondary Education 31,555,087 13,426,254 6,549,000 400,000 Higher Education 330,168,108 128,898,053 169,559,637 139,143,022 Office of the Post Secondary Commissioner - 5,707,000 1,250,000 - Council on the Arts 10,286,202 10,213,798 7,000,000 2,500,000 Atomic Energy Commission 456,889 59,895 50,000 50,000 Historical Preservation & Heritage Commission - 2,000,000 1,000,000 1,000,000
Subtotal: Education 372,466,286 160,305,000 185,408,637 143,093,022
Attorney General 15,751,664 16,426,486 12,850,000 150,000 Corrections 26,280,995 8,035,421 15,758,185 12,200,000 Judicial 16,107,313 6,103,756 7,100,000 4,100,000 Military Staff 37,046,485 59,073,507 41,754,425 18,271,152 RI Emergency Management Agency 3,191,385 1,118,050 - - Public Safety 12,740,960 10,070,209 2,344,414 2,744,414
Subtotal: Public Safety 111,118,802 100,827,429 79,807,024 37,465,566
Environmental Management 121,791,560 43,162,702 36,965,031 23,100,000 Coastal Resources Management Council 4,423,529 4,202,585 13,101,727 1,750,000 RI Infrastructure Bank 1,795,479,910 109,826,451 123,439,680 117,242,000 Narragansett Bay Commission 37,647,152 40,781,813 30,200,913 18,391,500
Subtotal: Natural Resources 1,959,342,151 197,973,551 203,707,351 160,483,500
Transportation 2,066,785,909 512,331,758 600,544,673 589,467,027 RI Public Transit Authority 144,626,050 23,890,265 26,526,119 21,567,730
Subtotal: Transportation 2,211,411,959 536,222,023 627,070,792 611,034,757
Totals 4,922,205,335 1,181,481,387 1,223,634,565 1,050,858,385
108

Schedule 3 - Statewide Summary by Agency
FY 2020 FY 2021 FY 2022 Post-FY 2022 Totals
By AgencyAdministration 31,810,000 31,415,000 16,800,000 - 383,202,241 Executive Office of Commerce 36,700,000 43,800,000 2,000,000 - 207,386,313 Labor and Training 1,650,000 816,869 - - 9,618,886 Revenue - - - - 54,507,008 Secretary of State - - - - 150,000 Public Utilities Commission 100,000 100,000 - - 660,078
Subtotal: General Government 70,260,000 76,131,869 18,800,000 - 655,524,526
Behavioral Health, DevelopmentalDisabilities and Hospitals 4,350,000 4,250,000 4,300,000 - 76,679,350
Children, Youth & Families - - - - 3,804,856 Human Services 165,000 165,000 165,000 - 123,019,959
Subtotal: Human Services 4,515,000 4,415,000 4,465,000 - 203,504,165
Elementary & Secondary Education 400,000 400,000 400,000 - 53,130,341 Higher Education 106,718,616 59,055,237 56,017,090 82,069,459 1,071,629,222 Office of the Post Secondary Commissioner - - - - 6,957,000 Council on the Arts - - - - 30,000,000 Atomic Energy Commission 50,000 50,000 50,000 - 766,784 Historical Preservation & Heritage Commission 1,000,000 - - - 5,000,000
Subtotal: Education 108,168,616 59,505,237 56,467,090 82,069,459 1,167,483,347
Attorney General 150,000 150,000 150,000 - 45,628,150 Corrections 13,950,000 4,900,000 3,750,000 - 84,874,601 Judicial 3,350,000 3,350,000 2,350,000 - 42,461,069 Military Staff 23,562,750 2,050,000 2,050,000 - 183,808,319 RI Emergency Management Agency - - - - 4,309,435 Public Safety 2,244,414 2,494,414 500,000 - 33,138,825
Subtotal: Public Safety 43,257,164 12,944,414 8,800,000 - 394,220,399
Environmental Management 18,900,000 15,375,000 10,700,000 - 269,994,293 Coastal Resources Management Council 7,075,000 250,000 250,000 - 31,052,841 RI Infrastructure Bank 110,100,000 122,149,999 900,000 - 2,379,138,040 Narragansett Bay Commission 18,291,558 86,164,000 159,994,000 555,405,000 946,875,936
Subtotal: Natural Resources 154,366,558 223,938,999 171,844,000 555,405,000 3,627,061,110
Transportation 517,334,398 460,671,652 428,086,155 499,710,803 5,674,932,375 RI Public Transit Authority 6,632,625 6,632,625 20,066,803 1,402,625 251,344,843
Subtotal: Transportation 523,967,023 467,304,277 448,152,958 501,113,428 5,926,277,218
Totals 904,534,361 844,239,796 708,529,048 1,138,587,887 11,974,070,764
109

Schedule 4 - Projects By Funding Source
Pre-FY 2017 FY 2017 FY 2018 FY 2019
Department of Administration
Capital Hill Campus ProjectsChapin Health Laboratory 333,399 750,000 6,050,000 - RI Capital Plan Fund 283,399 750,000 6,050,000 - Other Funds 50,000 - - -
Cannon Building 2,605,882 400,000 700,000 600,000 RI Capital Plan Fund 2,605,882 400,000 700,000 600,000
State Office Building 3,532,235 1,705,000 700,000 350,000 RI Capital Plan Fund 3,532,235 1,705,000 700,000 350,000
William Powers Building (Administration) 6,802,623 1,000,000 1,000,000 2,000,000 RI Capital Plan Fund 6,802,623 1,000,000 1,000,000 2,000,000
Environmental ProjectsEnvironmental Compliance 1,385,795 200,000 200,000 200,000 RI Capital Plan Fund 1,385,795 200,000 200,000 200,000
Replacement of Fueling Tanks 2,387,596 295,610 450,000 300,000 RI Capital Plan Fund 2,387,596 295,610 450,000 300,000
State Facility ProjectsDoIT Enterprise Operations Center 9,968,337 530,000 770,000 1,080,000 RI Capital Plan Fund 9,968,337 530,000 770,000 1,080,000
Old Colony House 1,603,026 280,000 100,000 50,000 RI Capital Plan Fund 1,603,026 280,000 100,000 50,000
Old State House 1,597,457 250,000 1,000,000 500,000 RI Capital Plan Fund 1,597,457 250,000 1,000,000 500,000
Shepard Building - 95,000 395,000 500,000 RI Capital Plan Fund - 95,000 395,000 500,000
Washington County Government Center 2,733,034 100,000 1,400,000 1,250,000 RI Capital Plan Fund 2,733,034 100,000 1,400,000 1,250,000
Pastore Center Campus ProjectsHarrington Hall Renovations 3,424,981 194,222 - - RI Capital Plan Fund 3,424,981 194,222 - -
Mathias Building Renovation 3,130,684 530,000 - - RI Capital Plan Fund 3,130,684 530,000 - -
Pastore Center Building Demolition 4,040,046 - 175,000 1,825,000 RI Capital Plan Fund 4,040,046 - 175,000 1,825,000
Pastore Center Parking 2,399,765 300,000 1,300,000 - RI Capital Plan Fund 2,399,765 300,000 1,300,000 -
Pastore Center Rehab - DOA Portion 8,429,551 6,900,000 3,900,000 4,000,000 RI Capital Plan Fund 8,429,551 6,900,000 3,900,000 4,000,000
Pastore Cottages Rehabilitation 2,089,593 100,782 - - RI Capital Plan Fund 2,089,593 100,782 - -
Pastore Strategic Plan - 1,325,500 600,000 - RI Capital Plan Fund - 1,325,500 600,000 -
Projected Disbursements
110

Schedule 4 - Projects By Funding Source
Projected DisbursementsFY 2020 FY 2021 FY 2022 Post-FY 2022 Totals
Department of Administration
Capital Hill Campus ProjectsChapin Health Laboratory - - - - 7,133,399 RI Capital Plan Fund - - - - 7,083,399 Other Funds - - - - 50,000
Cannon Building 350,000 3,500,000 3,500,000 - 11,655,882 RI Capital Plan Fund 350,000 3,500,000 3,500,000 - 11,655,882
State Office Building 1,000,000 2,930,000 - - 10,217,235 RI Capital Plan Fund 1,000,000 2,930,000 - - 10,217,235
William Powers Building (Administration) 3,000,000 4,000,000 1,000,000 - 18,802,623 RI Capital Plan Fund 3,000,000 4,000,000 1,000,000 - 18,802,623
Environmental ProjectsEnvironmental Compliance 200,000 200,000 - - 2,385,795 RI Capital Plan Fund 200,000 200,000 - - 2,385,795
Replacement of Fueling Tanks 300,000 300,000 300,000 - 4,333,206 RI Capital Plan Fund 300,000 300,000 300,000 - 4,333,206
State Facility ProjectsDoIT Enterprise Operations Center - - - - 12,348,337 RI Capital Plan Fund - - - - 12,348,337
Old Colony House - - - - 2,033,026 RI Capital Plan Fund - - - - 2,033,026
Old State House 150,000 - - - 3,497,457 RI Capital Plan Fund 150,000 - - - 3,497,457
Shepard Building 2,000,000 2,000,000 - - 4,990,000 RI Capital Plan Fund 2,000,000 2,000,000 - - 4,990,000
Washington County Government Center 1,250,000 750,000 500,000 - 7,983,034 RI Capital Plan Fund 1,250,000 750,000 500,000 - 7,983,034
Pastore Center Campus ProjectsHarrington Hall Renovations - - - - 3,619,203 RI Capital Plan Fund - - - - 3,619,203
Mathias Building Renovation - - - - 3,660,684 RI Capital Plan Fund - - - - 3,660,684
Pastore Center Building Demolition 3,750,000 - - - 9,790,046 RI Capital Plan Fund 3,750,000 - - - 9,790,046
Pastore Center Parking - - - - 3,999,765 RI Capital Plan Fund - - - - 3,999,765
Pastore Center Rehab - DOA Portion 4,000,000 4,000,000 5,000,000 - 36,229,551 RI Capital Plan Fund 4,000,000 4,000,000 5,000,000 - 36,229,551
Pastore Cottages Rehabilitation - - - - 2,190,375 RI Capital Plan Fund - - - - 2,190,375
Pastore Strategic Plan - - - - 1,925,500 RI Capital Plan Fund - - - - 1,925,500
111

Schedule 4 - Projects By Funding Source
Pre-FY 2017 FY 2017 FY 2018 FY 2019Projected Disbursements
Pastore Power Plant Rehabilitation 2,362,246 800,000 650,000 - RI Capital Plan Fund 2,362,246 800,000 650,000 -
Pastore Utilities Upgrade 3,103,813 2,635,622 2,000,000 - RI Capital Plan Fund 3,103,813 2,635,622 2,000,000 -
Pastore Utility Systems Water Tanks and Pipes 354,434 540,000 280,000 280,000 RI Capital Plan Fund 354,434 540,000 280,000 280,000
State House Asset Protection ProjectsState House Energy Management Improvement Project 564,667 108,333 2,000,000 3,000,000 RI Capital Plan Fund 564,667 108,333 2,000,000 3,000,000
State House Renovations 6,053,349 1,000,000 1,250,000 1,250,000 RI Capital Plan Fund 6,053,349 1,000,000 1,250,000 1,250,000
Zambarano Campus ProjectsZambarano Utilities and Infrastructure 5,112,521 3,175,000 6,085,000 2,240,000 RI Capital Plan Fund 5,112,521 3,175,000 6,085,000 2,240,000
Other Department of Administration ProjectsAccessibility 2,630,693 1,000,000 1,000,000 1,000,000 RI Capital Plan Fund 2,630,693 1,000,000 1,000,000 1,000,000
DOA Virks Building Renovation 2,364,946 15,132,512 5,236,000 - RI Capital Plan Fund 2,364,946 15,132,512 5,236,000 -
Cranston Street Armory 3,143,241 1,500,000 850,000 - RI Capital Plan Fund 3,143,241 1,500,000 850,000 -
Dunkin' Donuts Center Asset Protection 1,164,241 3,923,259 1,850,000 1,850,000 RI Capital Plan Fund 1,164,241 3,923,259 1,850,000 1,850,000
Energy Efficiency - - 4,000,000 4,000,000 Certificates of Participation - - 3,000,000 3,000,000 RI Capital Plan Fund - - 1,000,000 1,000,000
Information Technology Investment Fund 16,279,173 22,745,966 7,665,000 3,310,000 Information Technology Investment Fund 16,279,173 22,745,966 7,665,000 3,310,000
IT Strategic Plan - - 5,000,000 6,400,000 Certificates of Participation - - 5,000,000 6,400,000
McCoy Stadium Repairs 1,820,847 - 101,761 - RI Capital Plan Fund 1,820,847 - 101,761 -
Rhode Island Convention Center Asset Protection 2,492,248 1,800,245 1,000,000 1,000,000 RI Capital Plan Fund 2,492,248 1,800,245 1,000,000 1,000,000
Security Measures/State Buildings - - 500,000 - RI Capital Plan Fund - - 500,000 -
The VETS 16,564,275 455,147 205,000 200,000 RI Capital Plan Fund 16,264,275 455,147 205,000 200,000 Federal Funds 300,000 - - -
Water Resources BoardBig River Management Area 803,035 131,720 100,000 125,000 RI Capital Plan Fund 803,035 131,720 100,000 125,000
112

Schedule 4 - Projects By Funding Source
Projected DisbursementsFY 2020 FY 2021 FY 2022 Post-FY 2022 Totals
Pastore Power Plant Rehabilitation - - - - 3,812,246 RI Capital Plan Fund - - - - 3,812,246
Pastore Utilities Upgrade - - - - 7,739,435 RI Capital Plan Fund - - - - 7,739,435
Pastore Utility Systems Water Tanks and Pipes 280,000 - - - 1,734,434 RI Capital Plan Fund 280,000 - - - 1,734,434
State House Asset Protection ProjectsState House Energy Management Improvement Project - - - - 5,673,000 RI Capital Plan Fund - - - - 5,673,000
State House Renovations 1,000,000 500,000 500,000 - 11,553,349 RI Capital Plan Fund 1,000,000 500,000 500,000 - 11,553,349
Zambarano Campus ProjectsZambarano Utilities and Infrastructure 1,100,000 1,500,000 1,000,000 - 20,212,521 RI Capital Plan Fund 1,100,000 1,500,000 1,000,000 - 20,212,521
Other Department of Administration ProjectsAccessibility 1,000,000 1,000,000 1,000,000 - 8,630,693 RI Capital Plan Fund 1,000,000 1,000,000 1,000,000 - 8,630,693
DOA Virks Building Renovation - - - - 22,733,458 RI Capital Plan Fund - - - - 22,733,458
Cranston Street Armory - - - - 5,493,241 RI Capital Plan Fund - - - - 5,493,241
Dunkin' Donuts Center Asset Protection 1,850,000 1,850,000 1,850,000 - 14,337,500 RI Capital Plan Fund 1,850,000 1,850,000 1,850,000 - 14,337,500
Energy Efficiency 4,000,000 4,000,000 1,000,000 - 17,000,000 Certificates of Participation 3,000,000 3,000,000 - - 12,000,000 RI Capital Plan Fund 1,000,000 1,000,000 1,000,000 - 5,000,000
Information Technology Investment Fund 2,090,000 2,050,000 - - 54,140,139 Information Technology Investment Fund 2,090,000 2,050,000 - - 54,140,139
IT Strategic Plan 3,250,000 1,500,000 - - 16,150,000 Certificates of Participation 3,250,000 1,500,000 - - 16,150,000
McCoy Stadium Repairs - - - - 1,922,608 RI Capital Plan Fund - - - - 1,922,608
Rhode Island Convention Center Asset Protection 1,000,000 1,000,000 1,000,000 - 9,292,493 RI Capital Plan Fund 1,000,000 1,000,000 1,000,000 - 9,292,493
Security Measures/State Buildings - - - - 500,000 RI Capital Plan Fund - - - - 500,000
The VETS 90,000 185,000 - - 17,699,422 RI Capital Plan Fund 90,000 185,000 - - 17,399,422 Federal Funds - - - - 300,000
Water Resources BoardBig River Management Area 150,000 150,000 150,000 - 1,609,755 RI Capital Plan Fund 150,000 150,000 150,000 - 1,609,755
113

Schedule 4 - Projects By Funding Source
Pre-FY 2017 FY 2017 FY 2018 FY 2019Projected Disbursements
Bristol County Water Treatment Facility 4,893,067 79,762 - - P.L. 2004 Ch. 595 Issued 4,893,067 79,762 - -
South County Groundwater Site Acquisition Program 4,144,815 1,355,185 1,000,000 1,000,000 P.L. 2004 Ch. 595 Issued 4,144,815 1,355,185 1,000,000 1,000,000
Statewide Emergency Water Interconnections 1,637,814 2,062,186 - - P.L. 2004 Ch. 595 Issued 1,637,814 2,062,186 - -
Department of Administration Totals 131,953,429 73,401,051 59,512,761 38,310,000
Executive Office of Commerce
Affordable Housing 18,744,115 16,225,885 10,000,000 20,000,000 P.L. 2012 Ch. 241 Issued 18,744,115 6,225,885 - - P.L. 2016 Ch. 142 Unissued - 10,000,000 10,000,000 20,000,000
I-195 Redevelopment District Commission 1,764,630 351,683 300,000 - Environmental Protection Agency - Federal 400,000 - - - RI Capital Plan Fund 1,364,630 351,683 300,000 -
Innovation Centers - - 5,000,000 5,000,000 P.L. 2016 Ch. 142 Unissued - - 5,000,000 5,000,000
Port of Providence - - 10,000,000 10,000,000 P.L. 2016 Ch. 142 Unissued - - 10,000,000 10,000,000
Quonset Point/Davisville Pier - 400,000 4,100,000 13,000,000 P.L. 2016 Ch. 142 Unissued - - 1,500,000 11,000,000 RI Capital Plan Fund - 400,000 2,600,000 2,000,000 Revenue Bonds - - - -
Urban Revitalization and Blight Remediation - - 5,000,000 5,000,000 P.L. 2016 Ch. 142 Unissued - - 5,000,000 5,000,000
Executive Office of Commerce Total 20,508,745 16,977,568 34,400,000 53,000,000
Department of Labor and Training
Center General Asset Protection 1,573,867 1,374,438 1,130,000 900,000 RI Capital Plan Fund 1,573,867 1,374,438 1,130,000 900,000
Center General Building Roof 1,191,367 982,345 - - Federal Funds 19,508 307,365 - - Other Funds 19,508 281,812 - - Restricted Receipt Funds 19,508 236,548 - - RI Capital Plan Fund 1,132,843 156,620 - -
Department of Labor and Training Totals 2,765,234 2,356,783 1,130,000 900,000
Revenue
DMV Modernization Project 18,406,053 8,730,000 618,000 636,540 Certificates of Participation 11,000,000 - - - Restricted Receipt Funds 5,426,934 8,580,000 - - Federal Funds 377,854 - - - General Revenue 1,601,265 150,000 618,000 636,540
Integrated Tax System 19,778,459 5,433,541 - - Certificates of Participation 19,778,459 5,221,541 - - Federal Funds - 212,000 - -
114

Schedule 4 - Projects By Funding Source
Projected DisbursementsFY 2020 FY 2021 FY 2022 Post-FY 2022 Totals
Bristol County Water Treatment Facility - - - - 4,972,829 P.L. 2004 Ch. 595 Issued - - - - 4,972,829
South County Groundwater Site Acquisition Program - - - - 7,500,000 P.L. 2004 Ch. 595 Issued - - - - 7,500,000
Statewide Emergency Water Interconnections - - - - 3,700,000 P.L. 2004 Ch. 595 Issued - - - - 3,700,000
Department of Administration Totals 31,810,000 31,415,000 16,800,000 - 383,202,241
Executive Office of Commerce
Affordable Housing - - - - 64,970,000 P.L. 2012 Ch. 241 Issued - - - - 24,970,000 P.L. 2016 Ch. 142 Unissued - - - - 40,000,000
I-195 Redevelopment District Commission - - - - 2,416,313 Environmental Protection Agency - Federal - - - - 400,000 RI Capital Plan Fund - - - - 2,016,313
Innovation Centers 5,000,000 5,000,000 - - 20,000,000 P.L. 2016 Ch. 142 Unissued 5,000,000 5,000,000 - - 20,000,000
Port of Providence - - - - 20,000,000 P.L. 2016 Ch. 142 Unissued - - - - 20,000,000
Quonset Point/Davisville Pier 31,700,000 38,800,000 2,000,000 - 90,000,000 P.L. 2016 Ch. 142 Unissued 24,500,000 13,000,000 - - 50,000,000 RI Capital Plan Fund 5,000,000 5,000,000 - - 15,000,000 Revenue Bonds 2,200,000 20,800,000 2,000,000 - 25,000,000
Urban Revitalization and Blight Remediation - - - - 10,000,000 P.L. 2016 Ch. 142 Unissued - - - - 10,000,000
Executive Office of Commerce Total 36,700,000 43,800,000 2,000,000 - 207,386,313
Department of Labor and Training
Center General Asset Protection 1,650,000 816,869 - - 7,445,174 RI Capital Plan Fund 1,650,000 816,869 - - 7,445,174
Center General Building Roof - - - - 2,173,712 Federal Funds - - - - 326,873 Other Funds - - - - 301,320 Restricted Receipt Funds - - - - 256,056 RI Capital Plan Fund - - - - 1,289,463
Department of Labor and Training Totals 1,650,000 816,869 - - 9,618,886
Revenue
DMV Modernization Project - - - - 28,390,593 Certificates of Participation - - - - 11,000,000 Restricted Receipt Funds - - - - 14,006,934 Federal Funds - - - - 377,854 General Revenue - - - - 3,005,805
Integrated Tax System - - - - 25,212,000 Certificates of Participation - - - - 25,000,000 Federal Funds - - - - 212,000
115

Schedule 4 - Projects By Funding Source
Pre-FY 2017 FY 2017 FY 2018 FY 2019Projected Disbursements
Lottery Building Renovations 785,303 119,112 - - RI Capital Plan Fund 785,303 119,112 - -
Department of Revenue Totals 38,969,815 14,282,653 618,000 636,540
Secretary of State
State Archives - 150,000 - - RI Capital Plan Fund - 150,000 - -
Secretary of State Total - 150,000 - -
Public Utilities Commission
Public Utilities Commission Asset Protection 159,963 50,115 50,000 200,000 Restricted Receipt Funds 36,705 50,115 50,000 200,000 Federal Funds 123,258 - - -
Public Utilities Commission Totals 159,963 50,115 50,000 200,000
General Government Totals 194,357,186 107,218,170 95,710,761 93,046,540
Children, Youth and Families
R.I. Training SchoolGenerators - Rhode Island Training School 30,802 50,000 950,000 - RI Capital Plan Fund 30,802 50,000 950,000 -
RITS Maintenance Building - 385,000 150,000 - RI Capital Plan Fund - 385,000 150,000 -
Various Repairs and Improvements to YDC and YAC 1,004,243 483,816 - - RI Capital Plan Fund 1,004,243 483,816 - -
Private ProvidersNAFI Center 710,138 40,857 - - RI Capital Plan Fund 710,138 40,857 - -
Children, Youth and Families Totals 1,745,183 959,673 1,100,000 -
Human Services
Blind Vending Facilities 1,029,959 165,000 165,000 165,000 RI Capital Plan Fund 1,029,959 165,000 165,000 165,000
Veterans Home: New Construction 33,500,000 64,000,000 23,500,000 - P.L. 2012 Ch. 241 Issued 33,500,000 - - - P.L. 2016 Ch. 142 Unissued - 27,000,000 - - Federal Funds - 37,000,000 23,500,000 -
Department of Human Services Total 34,529,959 64,165,000 23,665,000 165,000
Behavioral Health, Developmental Disabilities and Hospitals
Hospital ServicesAdmin Buildings - Asset Protection 6,102,379 5,522,030 250,000 250,000 RI Capital Plan Fund 6,102,379 5,522,030 250,000 250,000
116

Schedule 4 - Projects By Funding Source
Projected DisbursementsFY 2020 FY 2021 FY 2022 Post-FY 2022 Totals
Lottery Building Renovations - - - - 904,415 RI Capital Plan Fund - - - - 904,415
Department of Revenue Totals - - - - 54,507,008
Secretary of State
State Archives - - - - 150,000 RI Capital Plan Fund - - - - 150,000
Secretary of State Total - - - - 150,000
Public Utilities Commission
Public Utilities Commission Asset Protection 100,000 100,000 - - 660,078 Restricted Receipt Funds 100,000 100,000 - - 536,820 Federal Funds - - - - 123,258
Public Utilities Commission Totals 100,000 100,000 - - 660,078
General Government Totals 70,260,000 76,131,869 18,800,000 - 655,524,526
Children, Youth and Families
R.I. Training SchoolGenerators - Rhode Island Training School - - - - 1,030,802 RI Capital Plan Fund - - - - 1,030,802
RITS Maintenance Building - - - - 535,000 RI Capital Plan Fund - - - - 535,000
Various Repairs and Improvements to YDC and YAC - - - - 1,488,059 RI Capital Plan Fund - - - - 1,488,059
Private ProvidersNAFI Center - - - - 750,995 RI Capital Plan Fund - - - - 750,995
Children, Youth and Families Totals - - - - 3,804,856
Human Services
Blind Vending Facilities 165,000 165,000 165,000 - 2,019,959 RI Capital Plan Fund 165,000 165,000 165,000 - 2,019,959
Veterans Home: New Construction - - - - 121,000,000 P.L. 2012 Ch. 241 Issued - - - - 33,500,000 P.L. 2016 Ch. 142 Unissued - - - - 27,000,000 Federal Funds - - - - 60,500,000
Department of Human Services Total 165,000 165,000 165,000 - 123,019,959
Behavioral Health, Developmental Disabilities and Hospitals
Hospital ServicesAdmin Buildings - Asset Protection 250,000 250,000 250,000 - 12,874,409 RI Capital Plan Fund 250,000 250,000 250,000 - 12,874,409
117
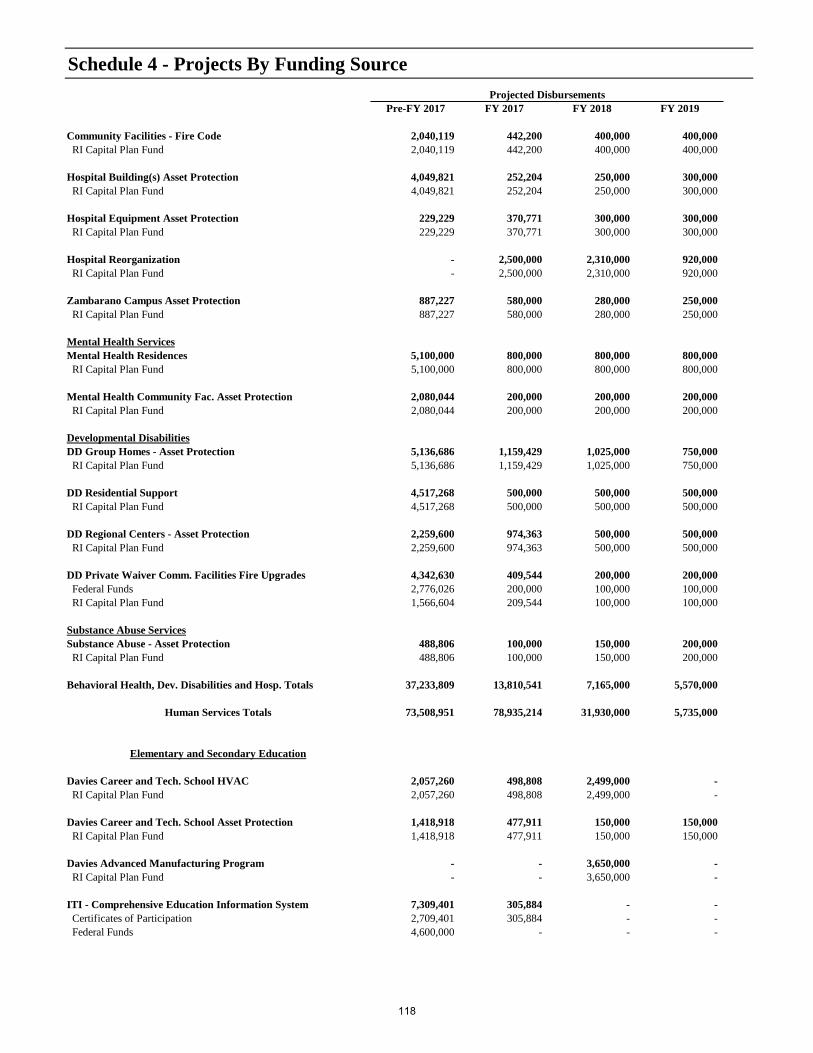
Schedule 4 - Projects By Funding Source
Pre-FY 2017 FY 2017 FY 2018 FY 2019Projected Disbursements
Community Facilities - Fire Code 2,040,119 442,200 400,000 400,000 RI Capital Plan Fund 2,040,119 442,200 400,000 400,000
Hospital Building(s) Asset Protection 4,049,821 252,204 250,000 300,000 RI Capital Plan Fund 4,049,821 252,204 250,000 300,000
Hospital Equipment Asset Protection 229,229 370,771 300,000 300,000 RI Capital Plan Fund 229,229 370,771 300,000 300,000
Hospital Reorganization - 2,500,000 2,310,000 920,000 RI Capital Plan Fund - 2,500,000 2,310,000 920,000
Zambarano Campus Asset Protection 887,227 580,000 280,000 250,000 RI Capital Plan Fund 887,227 580,000 280,000 250,000
Mental Health ServicesMental Health Residences 5,100,000 800,000 800,000 800,000 RI Capital Plan Fund 5,100,000 800,000 800,000 800,000
Mental Health Community Fac. Asset Protection 2,080,044 200,000 200,000 200,000 RI Capital Plan Fund 2,080,044 200,000 200,000 200,000
Developmental DisabilitiesDD Group Homes - Asset Protection 5,136,686 1,159,429 1,025,000 750,000 RI Capital Plan Fund 5,136,686 1,159,429 1,025,000 750,000
DD Residential Support 4,517,268 500,000 500,000 500,000 RI Capital Plan Fund 4,517,268 500,000 500,000 500,000
DD Regional Centers - Asset Protection 2,259,600 974,363 500,000 500,000 RI Capital Plan Fund 2,259,600 974,363 500,000 500,000
DD Private Waiver Comm. Facilities Fire Upgrades 4,342,630 409,544 200,000 200,000 Federal Funds 2,776,026 200,000 100,000 100,000 RI Capital Plan Fund 1,566,604 209,544 100,000 100,000
Substance Abuse ServicesSubstance Abuse - Asset Protection 488,806 100,000 150,000 200,000 RI Capital Plan Fund 488,806 100,000 150,000 200,000
Behavioral Health, Dev. Disabilities and Hosp. Totals 37,233,809 13,810,541 7,165,000 5,570,000
Human Services Totals 73,508,951 78,935,214 31,930,000 5,735,000
Elementary and Secondary Education
Davies Career and Tech. School HVAC 2,057,260 498,808 2,499,000 - RI Capital Plan Fund 2,057,260 498,808 2,499,000 -
Davies Career and Tech. School Asset Protection 1,418,918 477,911 150,000 150,000 RI Capital Plan Fund 1,418,918 477,911 150,000 150,000
Davies Advanced Manufacturing Program - - 3,650,000 - RI Capital Plan Fund - - 3,650,000 -
ITI - Comprehensive Education Information System 7,309,401 305,884 - - Certificates of Participation 2,709,401 305,884 - - Federal Funds 4,600,000 - - -
118

Schedule 4 - Projects By Funding Source
Projected DisbursementsFY 2020 FY 2021 FY 2022 Post-FY 2022 Totals
Community Facilities - Fire Code 200,000 - - - 3,482,319 RI Capital Plan Fund 200,000 - - - 3,482,319
Hospital Building(s) Asset Protection 350,000 400,000 450,000 - 6,052,025 RI Capital Plan Fund 350,000 400,000 450,000 - 6,052,025
Hospital Equipment Asset Protection 300,000 300,000 300,000 - 2,100,000 RI Capital Plan Fund 300,000 300,000 300,000 - 2,100,000
Hospital Reorganization - - - - 5,730,000 RI Capital Plan Fund - - - - 5,730,000
Zambarano Campus Asset Protection 250,000 300,000 300,000 - 2,847,227 RI Capital Plan Fund 250,000 300,000 300,000 - 2,847,227
Mental Health ServicesMental Health Residences 800,000 800,000 800,000 - 9,900,000 RI Capital Plan Fund 800,000 800,000 800,000 - 9,900,000
Mental Health Community Fac. Asset Protection 200,000 200,000 200,000 - 3,280,044 RI Capital Plan Fund 200,000 200,000 200,000 - 3,280,044
Developmental DisabilitiesDD Group Homes - Asset Protection 750,000 750,000 750,000 - 10,321,115 RI Capital Plan Fund 750,000 750,000 750,000 - 10,321,115
DD Residential Support 500,000 500,000 500,000 - 7,517,268 RI Capital Plan Fund 500,000 500,000 500,000 - 7,517,268
DD Regional Centers - Asset Protection 500,000 500,000 500,000 - 5,733,963 RI Capital Plan Fund 500,000 500,000 500,000 - 5,733,963
DD Private Waiver Comm. Facilities Fire Upgrades - - - - 5,152,174 Federal Funds - - - - 3,176,026 RI Capital Plan Fund - - - - 1,976,148
Substance Abuse ServicesSubstance Abuse - Asset Protection 250,000 250,000 250,000 - 1,688,806 RI Capital Plan Fund 250,000 250,000 250,000 - 1,688,806
Behavioral Health, Dev. Disabilities and Hosp. Totals 4,350,000 4,250,000 4,300,000 - 76,679,350
Human Services Totals 4,515,000 4,415,000 4,465,000 - 203,504,165
Elementary and Secondary Education
Davies Career and Tech. School HVAC - - - - 5,055,068 RI Capital Plan Fund - - - - 5,055,068
Davies Career and Tech. School Asset Protection 150,000 150,000 150,000 - 2,646,829 RI Capital Plan Fund 150,000 150,000 150,000 - 2,646,829
Davies Advanced Manufacturing Program - - - - 3,650,000 RI Capital Plan Fund - - - - 3,650,000
ITI - Comprehensive Education Information System - - - - 7,615,285 Certificates of Participation - - - - 3,015,285 Federal Funds - - - - 4,600,000
119

Schedule 4 - Projects By Funding Source
Pre-FY 2017 FY 2017 FY 2018 FY 2019Projected Disbursements
LEA Technology Infrastructure 13,288,345 6,511,655 - - Certificates of Participation 13,288,345 6,511,655 - -
Metropolitan Career and Tech HVAC 3,104,373 3,131,996 - - RI Capital Plan Fund 3,104,373 3,131,996 - -
Met School Asset Protection 349,089 200,000 250,000 250,000 RI Capital Plan Fund 349,089 200,000 250,000 250,000
Woonsocket Career & Tech. Projects 1,242,661 1,950,000 - - RI Capital Plan Fund 1,242,661 1,950,000 - -
Warwick Career & Tech. Projects 2,785,040 350,000 - - RI Capital Plan Fund 2,785,040 350,000 - -
Elementary & Secondary Education Totals 31,555,087 13,426,254 6,549,000 400,000
Higher Education
University of Rhode IslandAsset Protection - URI 57,896,018 13,556,000 8,030,000 8,200,000 RI Capital Plan Fund 57,896,018 13,556,000 8,030,000 8,200,000
Athletic & Recreation Facilities Advanced Planning - 250,000 - - University/College Funds - 250,000 - -
College of Pharmacy Building 69,933,252 595,892 - - P.L. 2006 Ch. 246 Issued 64,481,108 518,892 - - Private Funding 4,181,722 77,000 - - Third Party Financing 227,609 - - - University/College Funds 1,042,813 - - -
Combined Health & Counseling Center - - - 1,623,217 RIHEBC Bonds - - - - Private Funding - - - - University/College Funds - - - 1,623,217
Electric Utility Substation Replacement 5,617,350 1,382,650 - - RI Capital Plan Fund 5,617,350 1,382,650 - -
Energy Conservation/Performance Contract Phase II 5,590,000 5,180,000 1,830,000 - Certificates of Participation 5,590,000 5,180,000 1,830,000 -
Energy Conservation/Performance Contract Phase III - - 6,960,000 4,640,000 Certificates of Participation - - 6,960,000 4,640,000
Engineering - Building Renovations, Phase I 1,566,104 25,933,896 35,000,000 35,000,000 P.L. 2014 Ch. 145 Issued 1,566,104 5,933,896 - - P.L. 2014 Ch. 145 Unissued - 20,000,000 35,000,000 35,000,000
Engineering - Building Renovations, Phase II - - 1,200,000 1,200,000 P.L. 2016 Ch. 142 Unissued - - 1,200,000 1,200,000
Facilities Services Sector Upgrade - - - - RIHEBC Bonds - - - -
Fine Arts Center Renovation and Addition 611,415 56,930 1,056,930 - University/College Funds 211,415 56,930 56,930 - RI Capital Plan Fund 400,000 - 1,000,000 -
Fire Safety & Protection Academic & Administrative 23,295,388 2,552,968 - - RI Capital Plan Fund 10,797,032 2,552,968 - - Federal Stimulus Funding 12,498,356 - - -
120

Schedule 4 - Projects By Funding Source
Projected DisbursementsFY 2020 FY 2021 FY 2022 Post-FY 2022 Totals
LEA Technology Infrastructure - - - - 19,800,000 Certificates of Participation - - - - 19,800,000
Metropolitan Career and Tech HVAC - - - - 6,236,369 RI Capital Plan Fund - - - - 6,236,369
Met School Asset Protection 250,000 250,000 250,000 - 1,799,089 RI Capital Plan Fund 250,000 250,000 250,000 - 1,799,089
Woonsocket Career & Tech. Projects - - - - 3,192,661 RI Capital Plan Fund - - - - 3,192,661
Warwick Career & Tech. Projects - - - - 3,135,040 RI Capital Plan Fund - - - - 3,135,040
Elementary & Secondary Education Totals 400,000 400,000 400,000 - 53,130,341
Higher Education
University of Rhode IslandAsset Protection - URI 8,364,000 8,531,280 8,700,000 - 113,277,298 RI Capital Plan Fund 8,364,000 8,531,280 8,700,000 - 113,277,298
Athletic & Recreation Facilities Advanced Planning - - - - 250,000 University/College Funds - - - - 250,000
College of Pharmacy Building - - - - 70,529,144 P.L. 2006 Ch. 246 Issued - - - - 65,000,000 Private Funding - - - - 4,258,722 Third Party Financing - - - - 227,609 University/College Funds - - - - 1,042,813
Combined Health & Counseling Center 11,596,134 7,780,649 - - 21,000,000 RIHEBC Bonds 10,219,351 7,280,649 - - 17,500,000 Private Funding - 500,000 - - 500,000 University/College Funds 1,376,783 - - - 3,000,000
Electric Utility Substation Replacement - - - - 7,000,000 RI Capital Plan Fund - - - - 7,000,000
Energy Conservation/Performance Contract Phase II - - - - 12,600,000 Certificates of Participation - - - - 12,600,000
Energy Conservation/Performance Contract Phase III - - - - 11,600,000 Certificates of Participation - - - - 11,600,000
Engineering - Building Renovations, Phase I 27,500,000 - - - 125,000,000 P.L. 2014 Ch. 145 Issued - - - - 7,500,000 P.L. 2014 Ch. 145 Unissued 27,500,000 - - - 117,500,000
Engineering - Building Renovations, Phase II 12,000,000 11,100,000 - - 25,500,000 P.L. 2016 Ch. 142 Unissued 12,000,000 11,100,000 - - 25,500,000
Facilities Services Sector Upgrade - 931,496 2,912,360 7,956,144 11,800,000 RIHEBC Bonds - 931,496 2,912,360 7,956,144 11,800,000
Fine Arts Center Renovation and Addition - - - - 1,725,275 University/College Funds - - - - 325,275 RI Capital Plan Fund - - - - 1,400,000
Fire Safety & Protection Academic & Administrative - - - - 25,848,356 RI Capital Plan Fund - - - - 13,350,000 Federal Stimulus Funding - - - - 12,498,356
121

Schedule 4 - Projects By Funding Source
Pre-FY 2017 FY 2017 FY 2018 FY 2019Projected Disbursements
Fire Safety & Protection Auxiliary Enterprises 10,314,174 5,931,392 1,959,434 - RIHEBC Bonds 10,314,174 5,931,392 1,959,434 -
Fraternity Circle Infrastructure, Phase I - 491,689 3,866,091 742,220 RIHEBC Bonds - 491,689 3,866,091 742,220
Fraternity Circle Infrastructure, Phase II - - - 228,025 Private Funding - - - 228,025
Gateway to URI (Welcome Center) 75,290 1,475,459 6,049,251 - University/College Funds 75,290 1,475,459 6,049,251 -
Hope Commons Expansion - - - - University/College Funds - - - -
New Chemistry Building 72,549,377 4,234,463 - - P.L. 2010 Ch. 23 Issued 59,024,614 1,975,386 - - RI Capital Plan Fund 8,800,000 - - - University/College Funds 2,658,008 182,441 - - Private Funding 1,845,569 2,066,986 - - Third Party Financing 221,186 9,650 - -
Nursing Education Center 989,855 10,801,859 - - RI Capital Plan Fund 989,855 301,859 - - Certificates of Participation - 10,500,000 - -
Ranger Hall Renovation 4,343,053 1,198,113 - - P.L. 1996 Ch. 100 Issued 3,640,063 - - - Private Funding 606,328 1,116,141 - - Third Party Financing - 81,972 - - University/College Funds 96,662 - - -
Repaving & Road Construction 8,492,785 2,953,948 2,953,947 - RIHEBC Bonds 7,817,105 2,953,948 2,953,947 - University/College Funds 675,680 - - -
Repaving, Hardscape & Landscape - - - 3,464,689 RIHEBC Bonds - - - 3,464,689
Upper College Road Multiuse Development 83,975 482,703 583,715 279,607 University/College Funds 83,975 482,703 583,715 279,607
URI Biotechnology Center 5,100,000 156,439 - - RI Capital Plan Fund 5,100,000 156,439 - -
Utility Infrastructure Upgrade, Phase I - - - 1,718,045 RIHEBC Bonds - - - 1,718,045
Utility Infrastructure Upgrade, Phase II - - - - RIHEBC Bonds - - - -
White Hall Renovations 1,030,870 1,919,130 675,000 - University/College Funds 125,000 1,500,000 675,000 - RI Capital Plan Fund 905,870 419,130 - -
White Horn Brook Apartments 689,045 4,111,281 49,844,675 39,692,000 RIHEBC Bonds - - 49,095,000 39,692,000 University/College Funds 689,045 4,111,281 749,675 -
Rhode Island CollegeAsset Protection - RIC 22,552,949 5,840,117 3,458,431 3,562,184 RI Capital Plan Fund 22,552,949 5,840,117 3,458,431 3,562,184
122
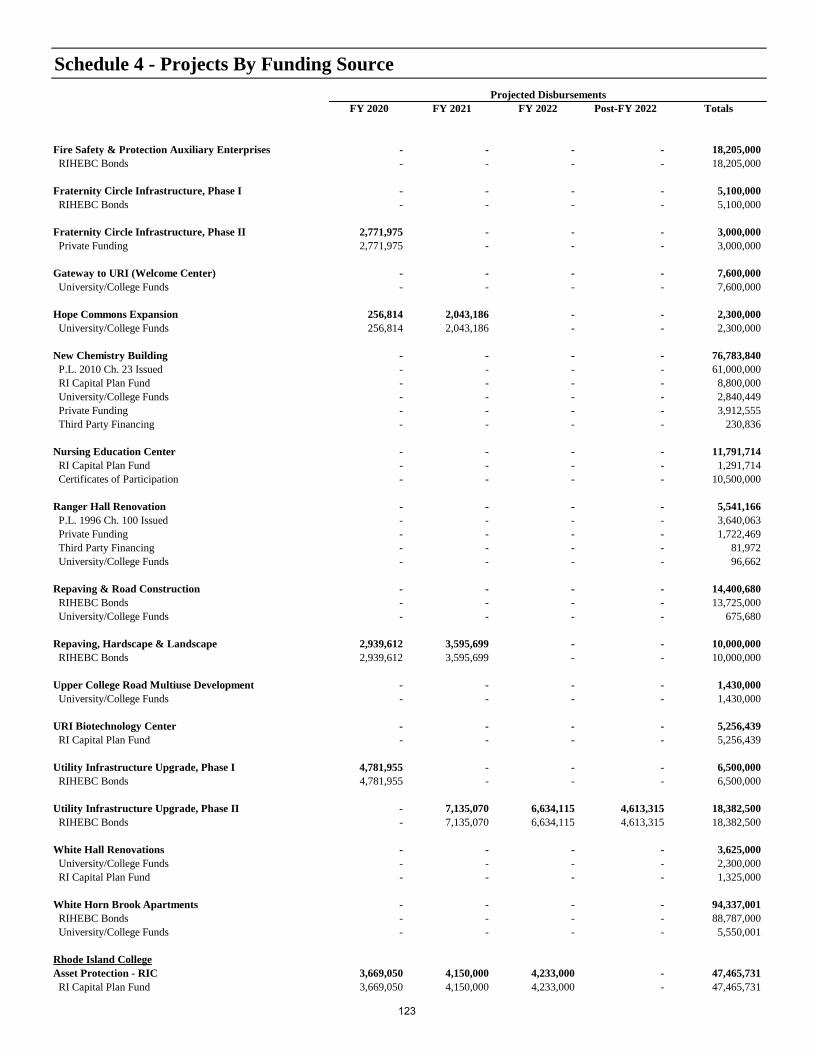
Schedule 4 - Projects By Funding Source
Projected DisbursementsFY 2020 FY 2021 FY 2022 Post-FY 2022 Totals
Fire Safety & Protection Auxiliary Enterprises - - - - 18,205,000 RIHEBC Bonds - - - - 18,205,000
Fraternity Circle Infrastructure, Phase I - - - - 5,100,000 RIHEBC Bonds - - - - 5,100,000
Fraternity Circle Infrastructure, Phase II 2,771,975 - - - 3,000,000 Private Funding 2,771,975 - - - 3,000,000
Gateway to URI (Welcome Center) - - - - 7,600,000 University/College Funds - - - - 7,600,000
Hope Commons Expansion 256,814 2,043,186 - - 2,300,000 University/College Funds 256,814 2,043,186 - - 2,300,000
New Chemistry Building - - - - 76,783,840 P.L. 2010 Ch. 23 Issued - - - - 61,000,000 RI Capital Plan Fund - - - - 8,800,000 University/College Funds - - - - 2,840,449 Private Funding - - - - 3,912,555 Third Party Financing - - - - 230,836
Nursing Education Center - - - - 11,791,714 RI Capital Plan Fund - - - - 1,291,714 Certificates of Participation - - - - 10,500,000
Ranger Hall Renovation - - - - 5,541,166 P.L. 1996 Ch. 100 Issued - - - - 3,640,063 Private Funding - - - - 1,722,469 Third Party Financing - - - - 81,972 University/College Funds - - - - 96,662
Repaving & Road Construction - - - - 14,400,680 RIHEBC Bonds - - - - 13,725,000 University/College Funds - - - - 675,680
Repaving, Hardscape & Landscape 2,939,612 3,595,699 - - 10,000,000 RIHEBC Bonds 2,939,612 3,595,699 - - 10,000,000
Upper College Road Multiuse Development - - - - 1,430,000 University/College Funds - - - - 1,430,000
URI Biotechnology Center - - - - 5,256,439 RI Capital Plan Fund - - - - 5,256,439
Utility Infrastructure Upgrade, Phase I 4,781,955 - - - 6,500,000 RIHEBC Bonds 4,781,955 - - - 6,500,000
Utility Infrastructure Upgrade, Phase II - 7,135,070 6,634,115 4,613,315 18,382,500 RIHEBC Bonds - 7,135,070 6,634,115 4,613,315 18,382,500
White Hall Renovations - - - - 3,625,000 University/College Funds - - - - 2,300,000 RI Capital Plan Fund - - - - 1,325,000
White Horn Brook Apartments - - - - 94,337,001 RIHEBC Bonds - - - - 88,787,000 University/College Funds - - - - 5,550,001
Rhode Island CollegeAsset Protection - RIC 3,669,050 4,150,000 4,233,000 - 47,465,731 RI Capital Plan Fund 3,669,050 4,150,000 4,233,000 - 47,465,731
123

Schedule 4 - Projects By Funding Source
Pre-FY 2017 FY 2017 FY 2018 FY 2019Projected Disbursements
Academic Bldg Phase I-Craig Lee, Gaige, Adams Lib. 6,700,000 20,000,000 24,100,000 6,000,000 P.L. 2012 Ch. 241 Issued 6,700,000 - - - P.L. 2012 Ch. 241 Unissued - 20,000,000 18,000,000 - RI Capital Plan Fund - - 6,100,000 6,000,000
Academic Bldg Phase IV-Clarke Science, Henry Barn. - - - 150,000 RI Capital Plan Fund - - - 150,000
Auxiliary Enterprise Asset Protection - 2,200,000 500,000 500,000 University/College Funds - 2,200,000 500,000 500,000
East Campus Improvements - - - - RI Capital Plan Fund - - - -
Energy Performance Contract (ESCO) - 3,000,000 4,500,000 - Certificates of Participation - 3,000,000 4,500,000 -
Faculty Center Renovations - 50,000 - - University/College Funds - 50,000 - -
Fogarty Life Sciences Building Renovation/Addition 4,118,943 1,181,057 - - P.L. 2012 Ch. 241 Issued 4,118,943 1,181,057 - -
New Residence Hall II 98,000 - 3,000,000 20,000,000 Third Party Financing - - - 20,000,000 University/College Funds 98,000 - - - RI Capital Plan Fund - - 3,000,000 -
Residence Halls Modernization/Renovation 86,000 - - - University/College Funds 86,000 - - - Third Party Financing - - - - RI Capital Plan Fund - - - -
RICAP Infrastructure Modernization 10,245,298 2,754,701 4,500,000 4,500,000 RI Capital Plan Fund 10,245,298 2,754,701 4,500,000 4,500,000
Community College of Rhode IslandAsset Protection - CCRI 15,056,636 3,032,100 2,799,063 2,368,035 RI Capital Plan Fund 15,056,636 3,032,100 2,799,063 2,368,035
CCRI Accessibility Improvements 92,921 466,808 225,100 500,000 Other Funds 22,313 225,345 225,100 - University/College Funds 70,608 241,463 - 500,000
CCRI Flanagan Campus Lecture Halls - 90,000 818,000 - Private Funding - - 418,000 - University/College Funds - 90,000 400,000 -
Flanagan Campus Renewal - - - 100,000 University/College Funds - - - 100,000 RI Capital Plan Fund - - - -
Knight Campus Renewal 3,039,410 7,018,458 5,275,000 4,300,000 RI Capital Plan Fund 2,901,098 5,223,902 5,000,000 4,000,000 Other Funds 55,444 1,794,556 275,000 300,000 University/College Funds 82,868 - - -
Knight Campus Bio and Chemistry Lab Renovation - - 375,000 375,000 RI Capital Plan Fund - - 375,000 375,000
Higher Education Totals 330,168,108 128,898,053 169,559,637 139,143,022
124

Schedule 4 - Projects By Funding Source
Projected DisbursementsFY 2020 FY 2021 FY 2022 Post-FY 2022 Totals
Academic Bldg Phase I-Craig Lee, Gaige, Adams Lib. - - - - 56,800,000 P.L. 2012 Ch. 241 Issued - - - - 6,700,000 P.L. 2012 Ch. 241 Unissued - - - - 38,000,000 RI Capital Plan Fund - - - - 12,100,000
Academic Bldg Phase IV-Clarke Science, Henry Barn. - - - - 150,000 RI Capital Plan Fund - - - - 150,000
Auxiliary Enterprise Asset Protection 500,000 500,000 500,000 500,000 5,200,000 University/College Funds 500,000 500,000 500,000 500,000 5,200,000
East Campus Improvements 150,000 - - - 150,000 RI Capital Plan Fund 150,000 - - - 150,000
Energy Performance Contract (ESCO) - - - - 7,500,000 Certificates of Participation - - - - 7,500,000
Faculty Center Renovations - - - - 50,000 University/College Funds - - - - 50,000
Fogarty Life Sciences Building Renovation/Addition - - - - 5,300,000 P.L. 2012 Ch. 241 Issued - - - - 5,300,000
New Residence Hall II 20,000,000 - - - 43,098,000 Third Party Financing 20,000,000 - - - 40,000,000 University/College Funds - - - - 98,000 RI Capital Plan Fund - - - - 3,000,000
Residence Halls Modernization/Renovation - 5,000,000 25,000,000 65,000,000 95,086,000 University/College Funds - - - - 86,000 Third Party Financing - - 20,000,000 65,000,000 85,000,000 RI Capital Plan Fund - 5,000,000 5,000,000 - 10,000,000
RICAP Infrastructure Modernization 3,600,000 3,500,000 3,500,000 - 32,599,999 RI Capital Plan Fund 3,600,000 3,500,000 3,500,000 - 32,599,999
Community College of Rhode IslandAsset Protection - CCRI 2,439,076 2,487,857 2,537,615 - 30,720,382 RI Capital Plan Fund 2,439,076 2,487,857 2,537,615 - 30,720,382
CCRI Accessibility Improvements 300,000 300,000 - - 1,884,829 Other Funds - - - - 472,758 University/College Funds 300,000 300,000 - - 1,412,071
CCRI Flanagan Campus Lecture Halls - - - - 908,000 Private Funding - - - - 418,000 University/College Funds - - - - 490,000
Flanagan Campus Renewal 2,000,000 2,000,000 2,000,000 4,000,000 10,100,000 University/College Funds - - - - 100,000 RI Capital Plan Fund 2,000,000 2,000,000 2,000,000 4,000,000 10,000,000
Knight Campus Renewal 3,850,000 - - - 23,482,868 RI Capital Plan Fund 3,000,000 - - - 20,125,000 Other Funds 850,000 - - - 3,275,000 University/College Funds - - - - 82,868
Knight Campus Bio and Chemistry Lab Renovation - - - - 750,000 RI Capital Plan Fund - - - - 750,000
Higher Education Totals 106,718,616 59,055,237 56,017,090 82,069,459 1,071,629,222
125
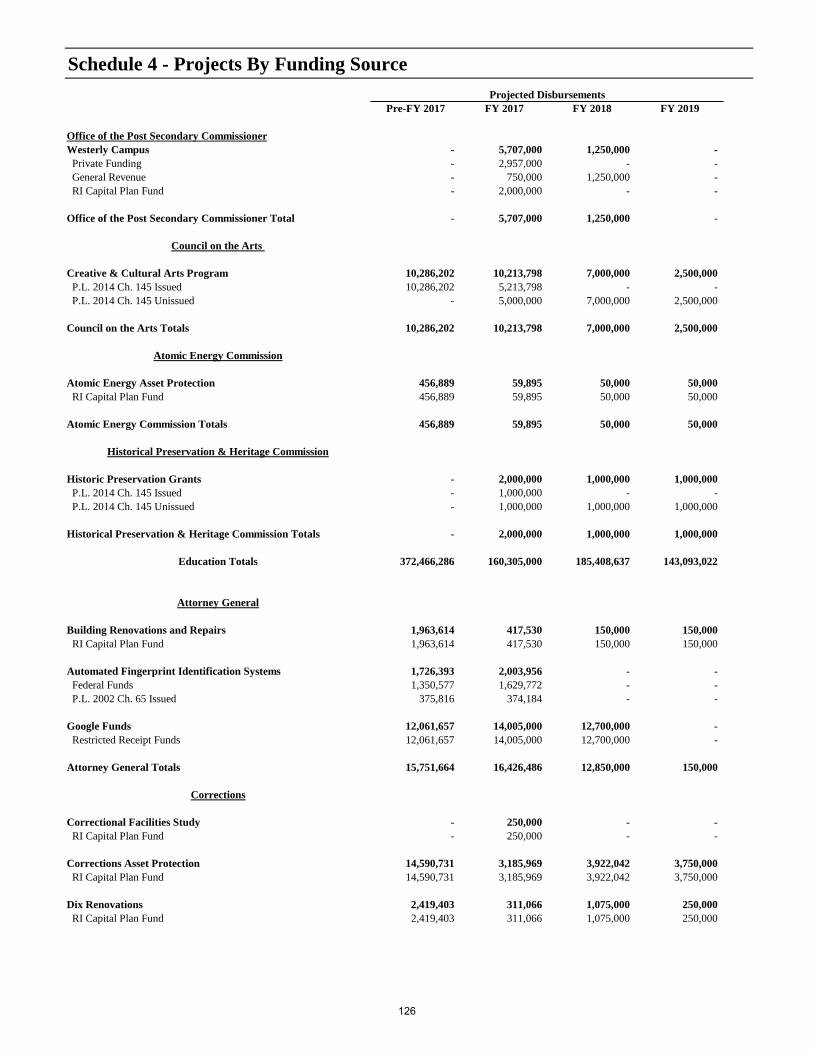
Schedule 4 - Projects By Funding Source
Pre-FY 2017 FY 2017 FY 2018 FY 2019Projected Disbursements
Office of the Post Secondary CommissionerWesterly Campus - 5,707,000 1,250,000 - Private Funding - 2,957,000 - - General Revenue - 750,000 1,250,000 - RI Capital Plan Fund - 2,000,000 - -
Office of the Post Secondary Commissioner Total - 5,707,000 1,250,000 -
Council on the Arts
Creative & Cultural Arts Program 10,286,202 10,213,798 7,000,000 2,500,000 P.L. 2014 Ch. 145 Issued 10,286,202 5,213,798 - - P.L. 2014 Ch. 145 Unissued - 5,000,000 7,000,000 2,500,000
Council on the Arts Totals 10,286,202 10,213,798 7,000,000 2,500,000
Atomic Energy Commission
Atomic Energy Asset Protection 456,889 59,895 50,000 50,000 RI Capital Plan Fund 456,889 59,895 50,000 50,000
Atomic Energy Commission Totals 456,889 59,895 50,000 50,000
Historical Preservation & Heritage Commission
Historic Preservation Grants - 2,000,000 1,000,000 1,000,000 P.L. 2014 Ch. 145 Issued - 1,000,000 - - P.L. 2014 Ch. 145 Unissued - 1,000,000 1,000,000 1,000,000
Historical Preservation & Heritage Commission Totals - 2,000,000 1,000,000 1,000,000
Education Totals 372,466,286 160,305,000 185,408,637 143,093,022
Attorney General
Building Renovations and Repairs 1,963,614 417,530 150,000 150,000 RI Capital Plan Fund 1,963,614 417,530 150,000 150,000
Automated Fingerprint Identification Systems 1,726,393 2,003,956 - - Federal Funds 1,350,577 1,629,772 - - P.L. 2002 Ch. 65 Issued 375,816 374,184 - -
Google Funds 12,061,657 14,005,000 12,700,000 - Restricted Receipt Funds 12,061,657 14,005,000 12,700,000 -
Attorney General Totals 15,751,664 16,426,486 12,850,000 150,000
Corrections
Correctional Facilities Study - 250,000 - - RI Capital Plan Fund - 250,000 - -
Corrections Asset Protection 14,590,731 3,185,969 3,922,042 3,750,000 RI Capital Plan Fund 14,590,731 3,185,969 3,922,042 3,750,000
Dix Renovations 2,419,403 311,066 1,075,000 250,000 RI Capital Plan Fund 2,419,403 311,066 1,075,000 250,000
126

Schedule 4 - Projects By Funding Source
Projected DisbursementsFY 2020 FY 2021 FY 2022 Post-FY 2022 Totals
Office of the Post Secondary CommissionerWesterly Campus - - - - 6,957,000 Private Funding - - - - 2,957,000 General Revenue - - - - 2,000,000 RI Capital Plan Fund - - - - 2,000,000
Office of the Post Secondary Commissioner Total - - - - 6,957,000
Council on the Arts
Creative & Cultural Arts Program - - - - 30,000,000 P.L. 2014 Ch. 145 Issued - - - - 15,500,000 P.L. 2014 Ch. 145 Unissued - - - - 14,500,000
Council on the Arts Totals - - - - 30,000,000
Atomic Energy Commission
Atomic Energy Asset Protection 50,000 50,000 50,000 - 766,784 RI Capital Plan Fund 50,000 50,000 50,000 - 766,784
Atomic Energy Commission Totals 50,000 50,000 50,000 - 766,784
Historical Preservation & Heritage Commission
Historic Preservation Grants 1,000,000 - - - 5,000,000 P.L. 2014 Ch. 145 Issued - - - - 1,000,000 P.L. 2014 Ch. 145 Unissued 1,000,000 - - - 4,000,000
Historical Preservation & Heritage Commission Totals 1,000,000 - - - 5,000,000
Education Totals 108,168,616 59,505,237 56,467,090 82,069,459 1,167,483,347
Attorney General
Building Renovations and Repairs 150,000 150,000 150,000 - 3,131,144 RI Capital Plan Fund 150,000 150,000 150,000 - 3,131,144
Automated Fingerprint Identification Systems - - - - 3,730,349 Federal Funds - - - - 2,980,349 P.L. 2002 Ch. 65 Issued - - - - 750,000
Google Funds - - - - 38,766,657 Restricted Receipt Funds - - - - 38,766,657
Attorney General Totals 150,000 150,000 150,000 - 45,628,150
Corrections
Correctional Facilities Study - - - - 250,000 RI Capital Plan Fund - - - - 250,000
Corrections Asset Protection 3,750,000 3,750,000 3,750,000 - 36,698,742 RI Capital Plan Fund 3,750,000 3,750,000 3,750,000 - 36,698,742
Dix Renovations 650,000 - - - 4,705,469 RI Capital Plan Fund 650,000 - - - 4,705,469
127

Schedule 4 - Projects By Funding Source
Pre-FY 2017 FY 2017 FY 2018 FY 2019Projected Disbursements
General Renovations - Maximum 4,308,376 1,324,253 1,300,000 500,000 RI Capital Plan Fund 4,308,376 1,324,253 1,300,000 500,000
Gloria McDonald Renovations 3,378,872 539,133 150,000 - RI Capital Plan Fund 3,378,872 539,133 150,000 -
ISC Exterior Envelope and HVAC Renovation 707,590 425,000 2,027,455 1,700,000 RI Capital Plan Fund 707,590 425,000 2,027,455 1,700,000
Medium Infrastucture 876,023 2,000,000 7,283,688 6,000,000 RI Capital Plan Fund 876,023 2,000,000 7,283,688 6,000,000
Department of Corrections Totals 26,280,995 8,035,421 15,758,185 12,200,000
Judicial
Garrahy Courtroom Restoration - - - - RI Capital Plan Fund - - - -
Judicial Complexes - HVAC 5,281,928 1,080,072 900,000 1,000,000 RI Capital Plan Fund 5,281,928 1,080,072 900,000 1,000,000
Judicial Asset Protection 6,980,455 868,614 950,000 950,000 RI Capital Plan Fund 6,980,455 868,614 950,000 950,000
Licht Judicial Complex Restoration 1,250,000 750,000 750,000 750,000 RI Capital Plan Fund 1,250,000 750,000 750,000 750,000
Licht Window/Exterior Restoration - - 500,000 800,000 RI Capital Plan Fund - - 500,000 800,000
Licht Chillers Replacement - - - 600,000 RI Capital Plan Fund - - - 600,000
Murray Courtroom Restoration - - - - RI Capital Plan Fund - - - -
Noel Shelled Courtroom Build Out 2,594,930 3,405,070 4,000,000 - RI Capital Plan Fund 2,594,930 3,405,070 4,000,000 -
Judicial Department Totals 16,107,313 6,103,756 7,100,000 4,100,000
Military Staff
AMC Rehab 6,856,728 665,225 1,499,775 - National Guard Bureau - Federal 3,197,654 532,500 550,000 - RI Capital Plan Fund 3,659,074 132,725 949,775 -
Benefit Street Arsenal Rehabilitation 660,093 37,564 - - RI Capital Plan Fund 660,093 37,564 - -
Burrillville Regional Training Institute 22,350 - 22,150 - RI Capital Plan Fund 22,350 - 22,150 -
Bristol Readiness Center - - 125,000 - RI Capital Plan Fund - - 125,000 -
Joint Force Headquarters Building 18,848 2,340,860 15,900,000 14,181,152 National Guard Bureau - Federal - 1,740,860 10,000,000 10,000,000 RI Capital Plan Fund 18,848 600,000 5,900,000 4,181,152
128

Schedule 4 - Projects By Funding Source
Projected DisbursementsFY 2020 FY 2021 FY 2022 Post-FY 2022 Totals
General Renovations - Maximum 350,000 - - - 7,782,629 RI Capital Plan Fund 350,000 - - - 7,782,629
Gloria McDonald Renovations - - - - 4,068,005 RI Capital Plan Fund - - - - 4,068,005
ISC Exterior Envelope and HVAC Renovation 2,200,000 1,150,000 - - 8,210,045 RI Capital Plan Fund 2,200,000 1,150,000 - - 8,210,045
Medium Infrastucture 7,000,000 - - - 23,159,711 RI Capital Plan Fund 7,000,000 - - - 23,159,711
Department of Corrections Totals 13,950,000 4,900,000 3,750,000 - 84,874,601
Judicial
Garrahy Courtroom Restoration - 250,000 250,000 - 500,000 RI Capital Plan Fund - 250,000 250,000 - 500,000
Judicial Complexes - HVAC 1,000,000 1,000,000 - - 10,262,000 RI Capital Plan Fund 1,000,000 1,000,000 - - 10,262,000
Judicial Asset Protection 1,000,000 1,000,000 1,000,000 - 12,749,069 RI Capital Plan Fund 1,000,000 1,000,000 1,000,000 - 12,749,069
Licht Judicial Complex Restoration 750,000 750,000 750,000 - 5,750,000 RI Capital Plan Fund 750,000 750,000 750,000 - 5,750,000
Licht Window/Exterior Restoration - - - - 1,300,000 RI Capital Plan Fund - - - - 1,300,000
Licht Chillers Replacement 600,000 - - - 1,200,000 RI Capital Plan Fund 600,000 - - - 1,200,000
Murray Courtroom Restoration - 350,000 350,000 - 700,000 RI Capital Plan Fund - 350,000 350,000 - 700,000
Noel Shelled Courtroom Build Out - - - - 10,000,000 RI Capital Plan Fund - - - - 10,000,000
Judicial Department Totals 3,350,000 3,350,000 2,350,000 - 42,461,069
Military Staff
AMC Rehab - - - - 9,021,728 National Guard Bureau - Federal - - - - 4,280,154 RI Capital Plan Fund - - - - 4,741,574
Benefit Street Arsenal Rehabilitation - - - - 697,657 RI Capital Plan Fund - - - - 697,657
Burrillville Regional Training Institute - - - - 44,500 RI Capital Plan Fund - - - - 44,500
Bristol Readiness Center - - - - 125,000 RI Capital Plan Fund - - - - 125,000
Joint Force Headquarters Building - - - - 32,440,860 National Guard Bureau - Federal - - - - 21,740,860 RI Capital Plan Fund - - - - 10,700,000
129

Schedule 4 - Projects By Funding Source
Pre-FY 2017 FY 2017 FY 2018 FY 2019Projected Disbursements
Military Staff Asset Protection 9,158,466 2,249,858 2,607,500 1,490,000 National Guard Bureau - Federal 6,709,561 1,441,656 1,907,500 790,000 RI Capital Plan Fund 2,448,905 808,202 700,000 700,000
Quonset Air National Guard Facilities 20,330,000 53,780,000 21,600,000 2,600,000 National Guard Bureau - Federal 20,330,000 53,780,000 21,600,000 2,600,000
Military Staff Totals 37,046,485 59,073,507 41,754,425 18,271,152
RI Emergency Management Agency
Emergency Management Building - 189,750 - - RI Capital Plan Fund - 189,750 - -
Hurricane Sandy Cleanup 3,191,385 928,300 - - Federal Emergency Management Agency 2,567,595 696,225 - - RI Capital Plan Fund 623,790 232,075 - -
RI Emergency Management Agency Totals 3,191,385 1,118,050 - -
Public Safety
Administrative Support Building Renovation - - - - RI Capital Plan Fund - - - -
Computer Crimes Unit 21,261 378,739 - - Restricted Receipt Funds 21,261 378,739 - -
DPS Asset Protection 39,521 660,479 250,000 250,000 RI Capital Plan Fund 39,521 660,479 250,000 250,000
Fire Academy Building 7,853,329 2,871,671 - - RI Capital Plan Fund 1,480,811 2,844,189 - - P.L. 2002 Ch. 65 Issued 6,372,518 27,482 - -
Lincoln Woods Barracks Renovation 4,580,122 2,795,806 - - RI Capital Plan Fund 2,937,083 511,345 - - Restricted Receipt Funds 1,515,539 2,284,461 - - Federal Funds 127,500 - - -
RI Statewide Communications System Network - 1,994,414 1,994,414 1,994,414 Federal Emergency Management Agency - 500,000 500,000 500,000 RI Capital Plan Fund - 1,494,414 1,494,414 1,494,414
Secure Vehicle Garage 131,177 1,022,776 - - Restricted Receipt Funds 131,177 1,022,776 - -
State Police Barracks Feasibility Study 8,756 191,244 - - RI Capital Plan Fund 8,756 191,244 - -
State Police Training Academy Renovation 106,794 155,080 - - Restricted Receipt Funds 106,794 155,080 - -
State Police Training Academy Upgrades - - 100,000 500,000 RI Capital Plan Fund - - 100,000 500,000
Public Safety Totals 12,740,960 10,070,209 2,344,414 2,744,414
Public Safety Totals 111,118,802 100,827,429 79,807,024 37,465,566
130

Schedule 4 - Projects By Funding Source
Projected DisbursementsFY 2020 FY 2021 FY 2022 Post-FY 2022 Totals
Military Staff Asset Protection 2,562,750 2,050,000 2,050,000 - 22,168,574 National Guard Bureau - Federal 1,812,750 1,025,000 1,025,000 - 14,711,467 RI Capital Plan Fund 750,000 1,025,000 1,025,000 - 7,457,107
Quonset Air National Guard Facilities 21,000,000 - - - 119,310,000 National Guard Bureau - Federal 21,000,000 - - - 119,310,000
Military Staff Totals 23,562,750 2,050,000 2,050,000 - 183,808,319
RI Emergency Management Agency
Emergency Management Building - - - - 189,750 RI Capital Plan Fund - - - - 189,750
Hurricane Sandy Cleanup - - - - 4,119,685 Federal Emergency Management Agency - - - - 3,263,820 RI Capital Plan Fund - - - - 855,865
RI Emergency Management Agency Totals - - - - 4,309,435
Public Safety
Administrative Support Building Renovation - 250,000 250,000 - 500,000 RI Capital Plan Fund - 250,000 250,000 - 500,000
Computer Crimes Unit - - - - 400,000 Restricted Receipt Funds - - - - 400,000
DPS Asset Protection 250,000 250,000 250,000 - 1,950,000 RI Capital Plan Fund 250,000 250,000 250,000 - 1,950,000
Fire Academy Building - - - - 10,725,000 RI Capital Plan Fund - - - - 4,325,000 P.L. 2002 Ch. 65 Issued - - - - 6,400,000
Lincoln Woods Barracks Renovation - - - - 7,375,928 RI Capital Plan Fund - - - - 3,448,428 Restricted Receipt Funds - - - - 3,800,000 Federal Funds - - - - 127,500
RI Statewide Communications System Network 1,994,414 1,994,414 - - 9,972,070 Federal Emergency Management Agency 500,000 500,000 - - 2,500,000 RI Capital Plan Fund 1,494,414 1,494,414 - - 7,472,070
Secure Vehicle Garage - - - - 1,153,953 Restricted Receipt Funds - - - - 1,153,953
State Police Barracks Feasibility Study - - - - 200,000 RI Capital Plan Fund - - - - 200,000
State Police Training Academy Renovation - - - - 261,874 Restricted Receipt Funds - - - - 261,874
State Police Training Academy Upgrades - - - - 600,000 RI Capital Plan Fund - - - - 600,000
Public Safety Totals 2,244,414 2,494,414 500,000 - 33,138,825
Public Safety Totals 43,257,164 12,944,414 8,800,000 - 394,220,399
131
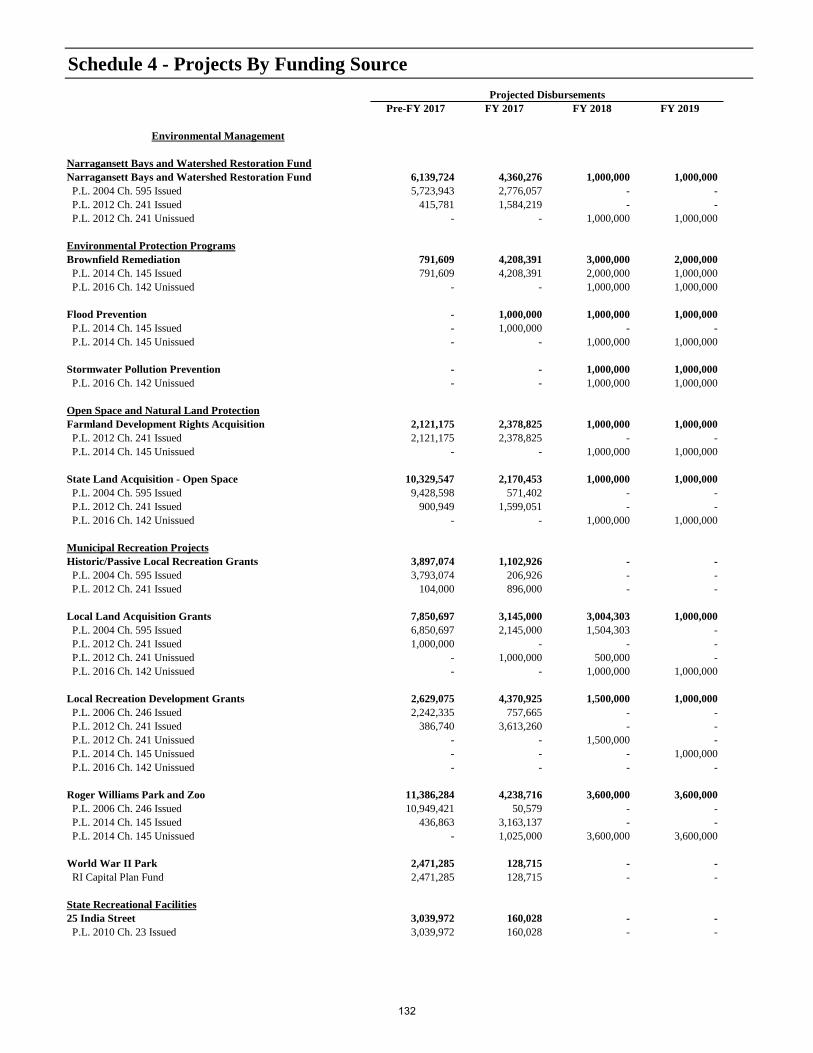
Schedule 4 - Projects By Funding Source
Pre-FY 2017 FY 2017 FY 2018 FY 2019Projected Disbursements
Environmental Management
Narragansett Bays and Watershed Restoration FundNarragansett Bays and Watershed Restoration Fund 6,139,724 4,360,276 1,000,000 1,000,000 P.L. 2004 Ch. 595 Issued 5,723,943 2,776,057 - - P.L. 2012 Ch. 241 Issued 415,781 1,584,219 - - P.L. 2012 Ch. 241 Unissued - - 1,000,000 1,000,000
Environmental Protection ProgramsBrownfield Remediation 791,609 4,208,391 3,000,000 2,000,000 P.L. 2014 Ch. 145 Issued 791,609 4,208,391 2,000,000 1,000,000 P.L. 2016 Ch. 142 Unissued - - 1,000,000 1,000,000
Flood Prevention - 1,000,000 1,000,000 1,000,000 P.L. 2014 Ch. 145 Issued - 1,000,000 - - P.L. 2014 Ch. 145 Unissued - - 1,000,000 1,000,000
Stormwater Pollution Prevention - - 1,000,000 1,000,000 P.L. 2016 Ch. 142 Unissued - - 1,000,000 1,000,000
Open Space and Natural Land ProtectionFarmland Development Rights Acquisition 2,121,175 2,378,825 1,000,000 1,000,000 P.L. 2012 Ch. 241 Issued 2,121,175 2,378,825 - - P.L. 2014 Ch. 145 Unissued - - 1,000,000 1,000,000
State Land Acquisition - Open Space 10,329,547 2,170,453 1,000,000 1,000,000 P.L. 2004 Ch. 595 Issued 9,428,598 571,402 - - P.L. 2012 Ch. 241 Issued 900,949 1,599,051 - - P.L. 2016 Ch. 142 Unissued - - 1,000,000 1,000,000
Municipal Recreation ProjectsHistoric/Passive Local Recreation Grants 3,897,074 1,102,926 - - P.L. 2004 Ch. 595 Issued 3,793,074 206,926 - - P.L. 2012 Ch. 241 Issued 104,000 896,000 - -
Local Land Acquisition Grants 7,850,697 3,145,000 3,004,303 1,000,000 P.L. 2004 Ch. 595 Issued 6,850,697 2,145,000 1,504,303 - P.L. 2012 Ch. 241 Issued 1,000,000 - - - P.L. 2012 Ch. 241 Unissued - 1,000,000 500,000 - P.L. 2016 Ch. 142 Unissued - - 1,000,000 1,000,000
Local Recreation Development Grants 2,629,075 4,370,925 1,500,000 1,000,000 P.L. 2006 Ch. 246 Issued 2,242,335 757,665 - - P.L. 2012 Ch. 241 Issued 386,740 3,613,260 - - P.L. 2012 Ch. 241 Unissued - - 1,500,000 - P.L. 2014 Ch. 145 Unissued - - - 1,000,000 P.L. 2016 Ch. 142 Unissued - - - -
Roger Williams Park and Zoo 11,386,284 4,238,716 3,600,000 3,600,000 P.L. 2006 Ch. 246 Issued 10,949,421 50,579 - - P.L. 2014 Ch. 145 Issued 436,863 3,163,137 - - P.L. 2014 Ch. 145 Unissued - 1,025,000 3,600,000 3,600,000
World War II Park 2,471,285 128,715 - - RI Capital Plan Fund 2,471,285 128,715 - -
State Recreational Facilities25 India Street 3,039,972 160,028 - - P.L. 2010 Ch. 23 Issued 3,039,972 160,028 - -
132

Schedule 4 - Projects By Funding Source
Projected DisbursementsFY 2020 FY 2021 FY 2022 Post-FY 2022 Totals
Environmental Management
Narragansett Bays and Watershed Restoration FundNarragansett Bays and Watershed Restoration Fund - - - - 12,500,000 P.L. 2004 Ch. 595 Issued - - - - 8,500,000 P.L. 2012 Ch. 241 Issued - - - - 2,000,000 P.L. 2012 Ch. 241 Unissued - - - - 2,000,000
Environmental Protection ProgramsBrownfield Remediation 1,000,000 1,000,000 1,000,000 - 13,000,000 P.L. 2014 Ch. 145 Issued - - - - 8,000,000 P.L. 2016 Ch. 142 Unissued 1,000,000 1,000,000 1,000,000 - 5,000,000
Flood Prevention - - - - 3,000,000 P.L. 2014 Ch. 145 Issued - - - - 1,000,000 P.L. 2014 Ch. 145 Unissued - - - - 2,000,000
Stormwater Pollution Prevention 1,000,000 - - - 3,000,000 P.L. 2016 Ch. 142 Unissued 1,000,000 - - - 3,000,000
Open Space and Natural Land ProtectionFarmland Development Rights Acquisition 1,000,000 - - - 7,500,000 P.L. 2012 Ch. 241 Issued - - - - 4,500,000 P.L. 2014 Ch. 145 Unissued 1,000,000 - - - 3,000,000
State Land Acquisition - Open Space 1,000,000 1,000,000 - - 16,500,000 P.L. 2004 Ch. 595 Issued - - - - 10,000,000 P.L. 2012 Ch. 241 Issued - - - - 2,500,000 P.L. 2016 Ch. 142 Unissued 1,000,000 1,000,000 - - 4,000,000
Municipal Recreation ProjectsHistoric/Passive Local Recreation Grants - - - - 5,000,000 P.L. 2004 Ch. 595 Issued - - - - 4,000,000 P.L. 2012 Ch. 241 Issued - - - - 1,000,000
Local Land Acquisition Grants 1,000,000 1,000,000 - - 17,000,000 P.L. 2004 Ch. 595 Issued - - - - 10,500,000 P.L. 2012 Ch. 241 Issued - - - - 1,000,000 P.L. 2012 Ch. 241 Unissued - - - - 1,500,000 P.L. 2016 Ch. 142 Unissued 1,000,000 1,000,000 - - 4,000,000
Local Recreation Development Grants 2,000,000 3,000,000 3,000,000 - 17,500,000 P.L. 2006 Ch. 246 Issued - - - - 3,000,000 P.L. 2012 Ch. 241 Issued - - - - 4,000,000 P.L. 2012 Ch. 241 Unissued - - - - 1,500,000 P.L. 2014 Ch. 145 Unissued 1,000,000 1,000,000 1,000,000 - 4,000,000 P.L. 2016 Ch. 142 Unissued 1,000,000 2,000,000 2,000,000 - 5,000,000
Roger Williams Park and Zoo 3,600,000 2,575,000 - - 29,000,000 P.L. 2006 Ch. 246 Issued - - - - 11,000,000 P.L. 2014 Ch. 145 Issued - - - - 3,600,000 P.L. 2014 Ch. 145 Unissued 3,600,000 2,575,000 - - 14,400,000
World War II Park - - - - 2,600,000 RI Capital Plan Fund - - - - 2,600,000
State Recreational Facilities25 India Street - - - - 3,200,000 P.L. 2010 Ch. 23 Issued - - - - 3,200,000
133
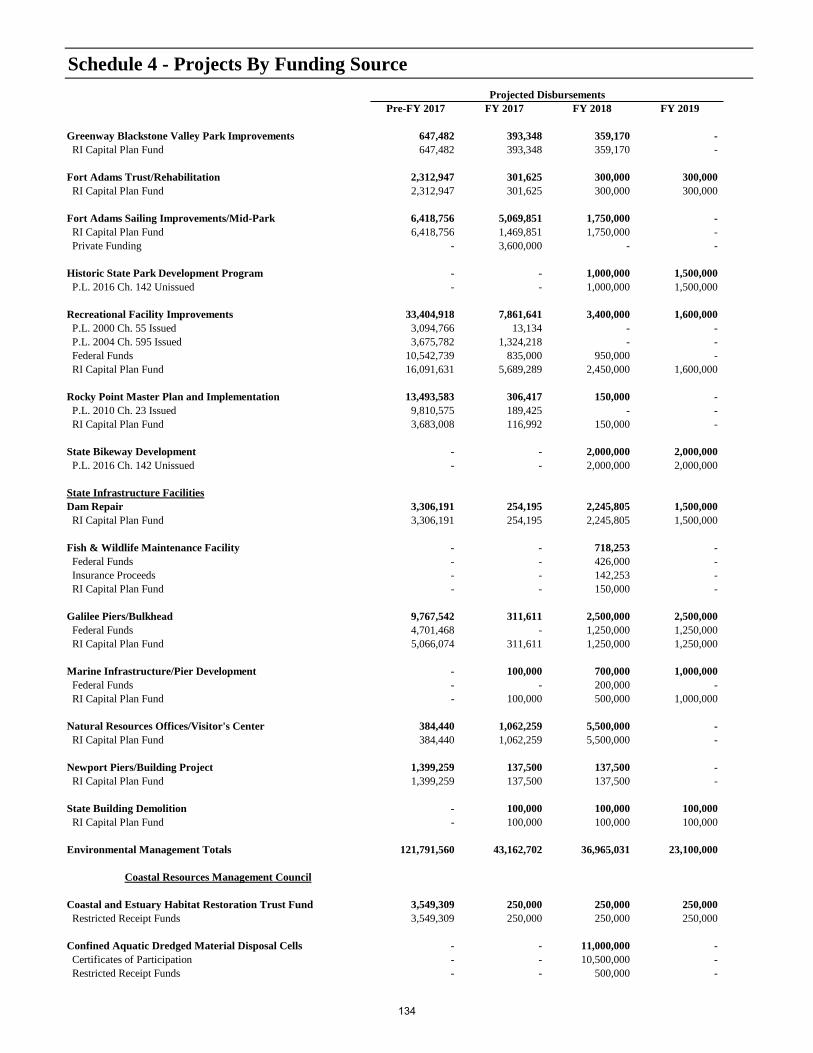
Schedule 4 - Projects By Funding Source
Pre-FY 2017 FY 2017 FY 2018 FY 2019Projected Disbursements
Greenway Blackstone Valley Park Improvements 647,482 393,348 359,170 - RI Capital Plan Fund 647,482 393,348 359,170 -
Fort Adams Trust/Rehabilitation 2,312,947 301,625 300,000 300,000 RI Capital Plan Fund 2,312,947 301,625 300,000 300,000
Fort Adams Sailing Improvements/Mid-Park 6,418,756 5,069,851 1,750,000 - RI Capital Plan Fund 6,418,756 1,469,851 1,750,000 - Private Funding - 3,600,000 - -
Historic State Park Development Program - - 1,000,000 1,500,000 P.L. 2016 Ch. 142 Unissued - - 1,000,000 1,500,000
Recreational Facility Improvements 33,404,918 7,861,641 3,400,000 1,600,000 P.L. 2000 Ch. 55 Issued 3,094,766 13,134 - - P.L. 2004 Ch. 595 Issued 3,675,782 1,324,218 - - Federal Funds 10,542,739 835,000 950,000 - RI Capital Plan Fund 16,091,631 5,689,289 2,450,000 1,600,000
Rocky Point Master Plan and Implementation 13,493,583 306,417 150,000 - P.L. 2010 Ch. 23 Issued 9,810,575 189,425 - - RI Capital Plan Fund 3,683,008 116,992 150,000 -
State Bikeway Development - - 2,000,000 2,000,000 P.L. 2016 Ch. 142 Unissued - - 2,000,000 2,000,000
State Infrastructure FacilitiesDam Repair 3,306,191 254,195 2,245,805 1,500,000 RI Capital Plan Fund 3,306,191 254,195 2,245,805 1,500,000
Fish & Wildlife Maintenance Facility - - 718,253 - Federal Funds - - 426,000 - Insurance Proceeds - - 142,253 - RI Capital Plan Fund - - 150,000 -
Galilee Piers/Bulkhead 9,767,542 311,611 2,500,000 2,500,000 Federal Funds 4,701,468 - 1,250,000 1,250,000 RI Capital Plan Fund 5,066,074 311,611 1,250,000 1,250,000
Marine Infrastructure/Pier Development - 100,000 700,000 1,000,000 Federal Funds - - 200,000 - RI Capital Plan Fund - 100,000 500,000 1,000,000
Natural Resources Offices/Visitor's Center 384,440 1,062,259 5,500,000 - RI Capital Plan Fund 384,440 1,062,259 5,500,000 -
Newport Piers/Building Project 1,399,259 137,500 137,500 - RI Capital Plan Fund 1,399,259 137,500 137,500 -
State Building Demolition - 100,000 100,000 100,000 RI Capital Plan Fund - 100,000 100,000 100,000
Environmental Management Totals 121,791,560 43,162,702 36,965,031 23,100,000
Coastal Resources Management Council
Coastal and Estuary Habitat Restoration Trust Fund 3,549,309 250,000 250,000 250,000 Restricted Receipt Funds 3,549,309 250,000 250,000 250,000
Confined Aquatic Dredged Material Disposal Cells - - 11,000,000 - Certificates of Participation - - 10,500,000 - Restricted Receipt Funds - - 500,000 -
134

Schedule 4 - Projects By Funding Source
Projected DisbursementsFY 2020 FY 2021 FY 2022 Post-FY 2022 Totals
Greenway Blackstone Valley Park Improvements - - - - 1,400,000 RI Capital Plan Fund - - - - 1,400,000
Fort Adams Trust/Rehabilitation 300,000 300,000 300,000 - 4,114,572 RI Capital Plan Fund 300,000 300,000 300,000 - 4,114,572
Fort Adams Sailing Improvements/Mid-Park - - - - 13,238,607 RI Capital Plan Fund - - - - 9,638,607 Private Funding - - - - 3,600,000
Historic State Park Development Program 1,500,000 - - - 4,000,000 P.L. 2016 Ch. 142 Unissued 1,500,000 - - - 4,000,000
Recreational Facility Improvements 1,850,000 2,100,000 2,000,000 - 52,216,559 P.L. 2000 Ch. 55 Issued - - - - 3,107,900 P.L. 2004 Ch. 595 Issued - - - - 5,000,000 Federal Funds - - - - 12,327,739 RI Capital Plan Fund 1,850,000 2,100,000 2,000,000 - 31,780,920
Rocky Point Master Plan and Implementation - - - - 13,950,000 P.L. 2010 Ch. 23 Issued - - - - 10,000,000 RI Capital Plan Fund - - - - 3,950,000
State Bikeway Development 2,000,000 2,000,000 2,000,000 - 10,000,000 P.L. 2016 Ch. 142 Unissued 2,000,000 2,000,000 2,000,000 - 10,000,000
State Infrastructure FacilitiesDam Repair 1,250,000 1,000,000 1,000,000 - 10,556,191 RI Capital Plan Fund 1,250,000 1,000,000 1,000,000 - 10,556,191
Fish & Wildlife Maintenance Facility - - - - 718,253 Federal Funds - - - - 426,000 Insurance Proceeds - - - - 142,253 RI Capital Plan Fund - - - - 150,000
Galilee Piers/Bulkhead 400,000 400,000 400,000 - 16,279,153 Federal Funds - - - - 7,201,468 RI Capital Plan Fund 400,000 400,000 400,000 - 9,077,685
Marine Infrastructure/Pier Development 1,000,000 1,000,000 1,000,000 - 4,800,000 Federal Funds - - - - 200,000 RI Capital Plan Fund 1,000,000 1,000,000 1,000,000 - 4,600,000
Natural Resources Offices/Visitor's Center - - - - 6,946,699 RI Capital Plan Fund - - - - 6,946,699
Newport Piers/Building Project - - - - 1,674,259 RI Capital Plan Fund - - - - 1,674,259
State Building Demolition - - - - 300,000 RI Capital Plan Fund - - - - 300,000
Environmental Management Totals 18,900,000 15,375,000 10,700,000 - 269,994,293
Coastal Resources Management Council
Coastal and Estuary Habitat Restoration Trust Fund 250,000 250,000 250,000 - 5,049,309 Restricted Receipt Funds 250,000 250,000 250,000 - 5,049,309
Confined Aquatic Dredged Material Disposal Cells - - - - 11,000,000 Certificates of Participation - - - - 10,500,000 Restricted Receipt Funds - - - - 500,000
135
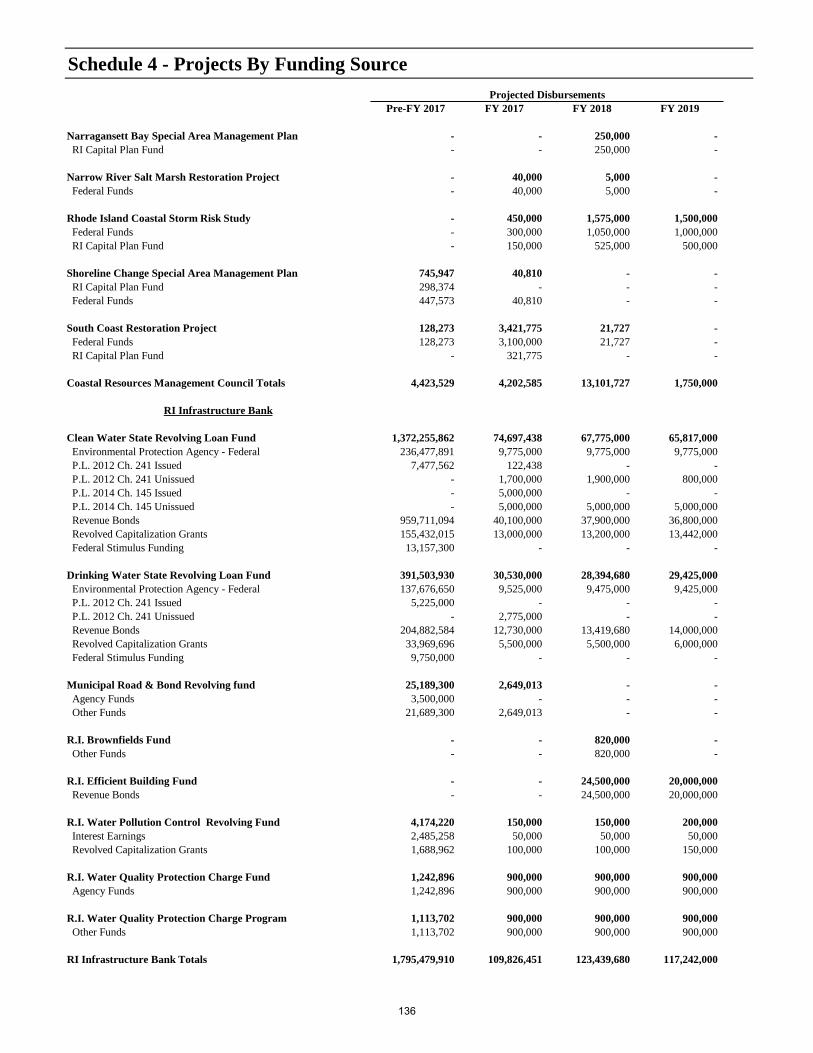
Schedule 4 - Projects By Funding Source
Pre-FY 2017 FY 2017 FY 2018 FY 2019Projected Disbursements
Narragansett Bay Special Area Management Plan - - 250,000 - RI Capital Plan Fund - - 250,000 -
Narrow River Salt Marsh Restoration Project - 40,000 5,000 - Federal Funds - 40,000 5,000 -
Rhode Island Coastal Storm Risk Study - 450,000 1,575,000 1,500,000 Federal Funds - 300,000 1,050,000 1,000,000 RI Capital Plan Fund - 150,000 525,000 500,000
Shoreline Change Special Area Management Plan 745,947 40,810 - - RI Capital Plan Fund 298,374 - - - Federal Funds 447,573 40,810 - -
South Coast Restoration Project 128,273 3,421,775 21,727 - Federal Funds 128,273 3,100,000 21,727 - RI Capital Plan Fund - 321,775 - -
Coastal Resources Management Council Totals 4,423,529 4,202,585 13,101,727 1,750,000
RI Infrastructure Bank
Clean Water State Revolving Loan Fund 1,372,255,862 74,697,438 67,775,000 65,817,000 Environmental Protection Agency - Federal 236,477,891 9,775,000 9,775,000 9,775,000 P.L. 2012 Ch. 241 Issued 7,477,562 122,438 - - P.L. 2012 Ch. 241 Unissued - 1,700,000 1,900,000 800,000 P.L. 2014 Ch. 145 Issued - 5,000,000 - - P.L. 2014 Ch. 145 Unissued - 5,000,000 5,000,000 5,000,000 Revenue Bonds 959,711,094 40,100,000 37,900,000 36,800,000 Revolved Capitalization Grants 155,432,015 13,000,000 13,200,000 13,442,000 Federal Stimulus Funding 13,157,300 - - -
Drinking Water State Revolving Loan Fund 391,503,930 30,530,000 28,394,680 29,425,000 Environmental Protection Agency - Federal 137,676,650 9,525,000 9,475,000 9,425,000 P.L. 2012 Ch. 241 Issued 5,225,000 - - - P.L. 2012 Ch. 241 Unissued - 2,775,000 - - Revenue Bonds 204,882,584 12,730,000 13,419,680 14,000,000 Revolved Capitalization Grants 33,969,696 5,500,000 5,500,000 6,000,000 Federal Stimulus Funding 9,750,000 - - -
Municipal Road & Bond Revolving fund 25,189,300 2,649,013 - - Agency Funds 3,500,000 - - - Other Funds 21,689,300 2,649,013 - -
R.I. Brownfields Fund - - 820,000 - Other Funds - - 820,000 -
R.I. Efficient Building Fund - - 24,500,000 20,000,000 Revenue Bonds - - 24,500,000 20,000,000
R.I. Water Pollution Control Revolving Fund 4,174,220 150,000 150,000 200,000 Interest Earnings 2,485,258 50,000 50,000 50,000 Revolved Capitalization Grants 1,688,962 100,000 100,000 150,000
R.I. Water Quality Protection Charge Fund 1,242,896 900,000 900,000 900,000 Agency Funds 1,242,896 900,000 900,000 900,000
R.I. Water Quality Protection Charge Program 1,113,702 900,000 900,000 900,000 Other Funds 1,113,702 900,000 900,000 900,000
RI Infrastructure Bank Totals 1,795,479,910 109,826,451 123,439,680 117,242,000
136

Schedule 4 - Projects By Funding Source
Projected DisbursementsFY 2020 FY 2021 FY 2022 Post-FY 2022 Totals
Narragansett Bay Special Area Management Plan - - - - 250,000 RI Capital Plan Fund - - - - 250,000
Narrow River Salt Marsh Restoration Project - - - - 45,000 Federal Funds - - - - 45,000
Rhode Island Coastal Storm Risk Study 6,825,000 - - - 10,350,000 Federal Funds 6,500,000 - - - 8,850,000 RI Capital Plan Fund 325,000 - - - 1,500,000
Shoreline Change Special Area Management Plan - - - - 786,757 RI Capital Plan Fund - - - - 298,374 Federal Funds - - - - 488,383
South Coast Restoration Project - - - - 3,571,775 Federal Funds - - - - 3,250,000 RI Capital Plan Fund - - - - 321,775
Coastal Resources Management Council Totals 7,075,000 250,000 250,000 - 31,052,841
RI Infrastructure Bank
Clean Water State Revolving Loan Fund 57,775,000 70,774,999 - - 1,709,095,299 Environmental Protection Agency - Federal 9,775,000 9,775,000 - - 285,352,891 P.L. 2012 Ch. 241 Issued - - - - 7,600,000 P.L. 2012 Ch. 241 Unissued - - - - 4,400,000 P.L. 2014 Ch. 145 Issued - - - - 5,000,000 P.L. 2014 Ch. 145 Unissued - - - - 15,000,000 Revenue Bonds 35,000,000 47,500,000 - - 1,157,011,094 Revolved Capitalization Grants 13,000,000 13,499,999 - - 221,574,014 Federal Stimulus Funding - - - - 13,157,300
Drinking Water State Revolving Loan Fund 29,425,000 29,425,000 - - 538,703,610 Environmental Protection Agency - Federal 9,425,000 9,425,000 - - 184,951,650 P.L. 2012 Ch. 241 Issued - - - - 5,225,000 P.L. 2012 Ch. 241 Unissued - - - - 2,775,000 Revenue Bonds 14,000,000 14,000,000 - - 273,032,264 Revolved Capitalization Grants 6,000,000 6,000,000 - - 62,969,696 Federal Stimulus Funding - - - - 9,750,000
Municipal Road & Bond Revolving fund - - - - 27,838,313 Agency Funds - - - - 3,500,000 Other Funds - - - - 24,338,313
R.I. Brownfields Fund - - - - 820,000 Other Funds - - - - 820,000
R.I. Efficient Building Fund 20,000,000 20,000,000 - - 84,500,000 Revenue Bonds 20,000,000 20,000,000 - - 84,500,000
R.I. Water Pollution Control Revolving Fund 1,100,000 150,000 - - 5,924,220 Interest Earnings 50,000 50,000 - - 2,735,258 Revolved Capitalization Grants 1,050,000 100,000 - - 3,188,962
R.I. Water Quality Protection Charge Fund 900,000 900,000 900,000 - 6,642,896 Agency Funds 900,000 900,000 900,000 - 6,642,896
R.I. Water Quality Protection Charge Program 900,000 900,000 - - 5,613,702 Other Funds 900,000 900,000 - - 5,613,702
RI Infrastructure Bank Totals 110,100,000 122,149,999 900,000 - 2,379,138,040
137

Schedule 4 - Projects By Funding Source
Pre-FY 2017 FY 2017 FY 2018 FY 2019Projected Disbursements
Narragansett Bay Commission
Infrastructure Management 13,040,946 9,240,907 1,282,440 673,500 Other Funds 13,040,946 9,240,907 1,282,440 673,500
Interceptor Inspection & Cleaning 344,000 500,000 500,000 500,000 Other Funds 344,000 500,000 500,000 500,000
Interceptor Restoration & Construction 313,260 10,878,029 12,312,000 1,896,000 Other Funds 313,260 10,878,029 12,312,000 1,896,000
Phase III CSO Facilities 2,382,145 7,544,716 10,865,027 13,148,000 Other Funds 2,382,145 7,544,716 10,865,027 13,148,000
Wasterwater Treatment Facility Improvements 21,566,801 12,618,161 5,241,446 2,174,000 Other Funds 21,566,801 12,618,161 5,241,446 2,174,000
Narragansett Bay Commission Totals 37,647,152 40,781,813 30,200,913 18,391,500
Natural Resources Totals 1,959,342,151 197,973,551 203,707,351 160,483,500
Transportation
Fixed Guideway (Commuter Rail) 61,565,289 33,000,053 18,865,923 14,233,285 P.L. 2008 Ch. 100 Issued 2,649,237 920,763 - - Federal Transit Administration 39,816,753 10,768,589 17,191,511 13,331,282 Massachusetts Bay Transit Authority 14,890 445,110 1,674,412 902,003 Private Funding - 10,000,000 - - Federal Stimulus Funding 19,084,409 10,865,591 - -
Highway Improvement Program 1,986,188,178 445,989,652 543,262,438 546,583,742 P.L. 2010 Ch. 23 Issued 79,905,807 94,193 - - Federal Highway Administration 980,161,072 230,463,719 240,589,250 211,489,250 Gas Tax Proceeds - Debt Service 42,151,526 6,860,740 6,859,490 6,862,940 Federal Highway Funds - Debt Service 199,824,903 19,117,070 23,560,250 57,535,250 Land Sale Revenue 13,761,476 11,800,000 14,217,970 10,760,000 RI Capital Plan Fund 71,926,926 32,451,346 32,451,346 32,451,346 GARVEE Bonds 501,973,232 62,578,184 100,000,000 100,000,000 GARVEE Residual Earnings 20,105,872 500,000 494,418 - Toll Revenue - - 38,000,000 44,800,000 G.O. Issued Proceeds 15,000,000 5,000,000 3,000,000 - Vehicle Registration Fees 61,377,364 77,124,400 84,089,714 82,684,956
Information Technology Investment Strategy 76,914 1,227,320 - - Gas Tax - 1,227,320 - - Information Technology Investment Fund 76,914 - - -
Maintenance - Capital Equipment Replacement 10,743,879 3,500,000 5,000,000 5,000,000 RI Capital Plan Fund 4,500,000 1,500,000 2,500,000 2,500,000 Gas Tax 2,743,879 2,000,000 2,500,000 2,500,000 State Fleet Replacement Fund 3,500,000 - - -
Maintenance Facility Improvements 2,044,419 400,000 400,000 400,000 RI Capital Plan Fund 2,044,419 400,000 400,000 400,000
Mass Transit Hub Infrastructure 1,350 3,648,650 15,000,000 17,000,000 Federal Transit Administration - 650,000 - - P.L. 2014 Ch. 145 Issued 1,350 498,650 - - P.L. 2014 Ch. 145 Unissued - 2,500,000 15,000,000 17,000,000 Offset to Avoid Double Counting - (450,000) - - Other Highway Funds - 450,000 - -
138

Schedule 4 - Projects By Funding Source
Projected DisbursementsFY 2020 FY 2021 FY 2022 Post-FY 2022 Totals
Narragansett Bay Commission
Infrastructure Management 663,000 294,000 - - 25,194,793 Other Funds 663,000 294,000 - - 25,194,793
Interceptor Inspection & Cleaning 500,000 500,000 500,000 500,000 3,844,000 Other Funds 500,000 500,000 500,000 500,000 3,844,000
Interceptor Restoration & Construction 1,500,000 1,500,000 1,500,000 1,500,000 31,399,288 Other Funds 1,500,000 1,500,000 1,500,000 1,500,000 31,399,288
Phase III CSO Facilities 9,604,558 79,410,000 156,720,000 553,405,000 833,079,446 Other Funds 9,604,558 79,410,000 156,720,000 553,405,000 833,079,446
Wasterwater Treatment Facility Improvements 6,024,000 4,460,000 1,274,000 - 53,358,409 Other Funds 6,024,000 4,460,000 1,274,000 - 53,358,409
Narragansett Bay Commission Totals 18,291,558 86,164,000 159,994,000 555,405,000 946,875,936
Natural Resources Totals 154,366,558 223,938,999 171,844,000 555,405,000 3,627,061,110
Transportation
Fixed Guideway (Commuter Rail) 11,039,407 11,153,407 11,277,407 - 161,134,771 P.L. 2008 Ch. 100 Issued - - - - 3,570,000 Federal Transit Administration 10,325,326 10,439,326 10,563,326 - 112,436,113 Massachusetts Bay Transit Authority 714,081 714,081 714,081 - 5,178,658 Private Funding - - - - 10,000,000 Federal Stimulus Funding - - - - 29,950,000
Highway Improvement Program 496,044,991 440,268,245 410,408,748 499,710,803 5,368,456,797 P.L. 2010 Ch. 23 Issued - - - - 80,000,000 Federal Highway Administration 217,362,250 213,889,250 183,989,250 - 2,277,944,041 Gas Tax Proceeds - Debt Service 6,859,440 6,860,516 6,860,704 29,597,803 112,913,159 Federal Highway Funds - Debt Service 57,563,500 57,540,250 57,540,000 470,113,000 942,794,223 Land Sale Revenue 3,535,144 1,000,000 1,000,000 - 56,074,590 RI Capital Plan Fund 32,451,346 32,451,346 32,451,346 - 266,635,002 GARVEE Bonds 50,000,000 - - - 814,551,416 GARVEE Residual Earnings - - - - 21,100,290 Toll Revenue 44,800,000 44,800,000 44,800,000 - 217,200,000 G.O. Issued Proceeds - - - - 23,000,000 Vehicle Registration Fees 83,473,311 83,726,883 83,767,448 - 556,244,076
Information Technology Investment Strategy - - - - 1,304,234 Gas Tax - - - - 1,227,320 Information Technology Investment Fund - - - - 76,914
Maintenance - Capital Equipment Replacement 5,000,000 5,000,000 5,000,000 - 39,243,879 RI Capital Plan Fund 2,500,000 2,500,000 2,500,000 - 18,500,000 Gas Tax 2,500,000 2,500,000 2,500,000 - 17,243,879 State Fleet Replacement Fund - - - - 3,500,000
Maintenance Facility Improvements 400,000 400,000 400,000 - 4,444,419 RI Capital Plan Fund 400,000 400,000 400,000 - 4,444,419
Mass Transit Hub Infrastructure - - - - 35,650,000 Federal Transit Administration - - - - 650,000 P.L. 2014 Ch. 145 Issued - - - - 500,000 P.L. 2014 Ch. 145 Unissued - - - - 34,500,000 Offset to Avoid Double Counting - - - - (450,000) Other Highway Funds - - - - 450,000
139

Schedule 4 - Projects By Funding Source
Pre-FY 2017 FY 2017 FY 2018 FY 2019Projected Disbursements
Pawtucket-Central Falls Train Station 80,247 14,234,000 10,850,000 4,400,000 Federal Highway Administration - 6,550,000 6,550,000 - Federal Transit Administration - 5,284,000 3,300,000 3,400,000 Local Funds - 1,000,000 1,000,000 1,000,000 Land Sale Revenue - 1,400,000 - - Offset to Avoid Double Counting - (1,326,000) (830,000) (850,000) Other Highway Funds - 1,326,000 830,000 850,000 RI Capital Plan Fund 80,247 - - -
Portsmouth Facility 1,548,321 3,196,594 1,316,312 500,000 P.L. 2004 Ch. 595 Issued 1,141,850 923,150 - - RI Capital Plan Fund 406,471 2,273,444 575,256 500,000 Gas Tax - - 741,056 -
Rhode Island Travel Plaza and Transit Hub - 4,500,000 4,500,000 - Federal Highway Administration - 4,500,000 4,500,000 - Offset to Avoid Double Counting - (1,500,000) (1,500,000) - Other Highway Funds - 1,500,000 1,500,000 -
Salt Storage Facilities 4,372,224 1,961,934 1,000,000 1,000,000 RI Capital Plan Fund 4,372,224 1,961,934 1,000,000 1,000,000
Train Station Maintenance and Repairs 165,088 673,555 350,000 350,000 RI Capital Plan Fund 165,088 673,555 350,000 350,000
Transportation Totals 2,066,785,909 512,331,758 600,544,673 589,467,027
Rhode Island Public Transit Authority
Bus Purchases (RIPTA) 100,946,953 11,598,312 12,800,371 694,575 Federal Transit Administration 75,774,583 9,424,608 12,526,875 694,575 RIPTA Operating Funds 480,170 - - - RIPTA Revolving Loan Fund 1,151,395 - - - State Fleet Replacement Fund 1,752,800 2,173,704 273,496 - Federal Stimulus Funding 21,788,005 - - - Vehicle Registration Fees - - 2,858,223 173,644 Offset to Avoid Double Counting - - (2,858,223) (173,644) RI Capital Plan Fund - - - -
College Hill Bus Tunnel 69,929 - - 943,705 Federal Transit Administration 55,943 - - 754,964 RI Capital Plan Fund - - - - RIPTA Operating Funds 13,986 - - 188,741
Enterprise Software Solution 696,024 890,410 - - Federal Transit Administration 556,819 712,328 - - RIPTA Revolving Loan Fund 139,205 178,082 - -
Farebox Upgrade - - 5,500,000 - Federal Transit Administration - - 4,400,000 - RIPTA Operating Funds - - 1,100,000 -
Fixed Route and Paratransit Cameras 2,089,464 180,340 - - Federal Transit Administration 1,671,571 144,273 - - RIPTA Revolving Loan Fund 417,893 36,067 - -
Intelligent Transportation Systems Implementation 8,186,273 217,691 - - Federal Transit Administration 5,349,019 174,153 - - Federal Highway Administration 1,500,000 - - - RIPTA Operating Funds 17,293 - - - RIPTA Revolving Loan Fund 1,319,961 43,538 - -
140

Schedule 4 - Projects By Funding Source
Projected DisbursementsFY 2020 FY 2021 FY 2022 Post-FY 2022 Totals
Pawtucket-Central Falls Train Station 3,500,000 2,500,000 - - 35,564,247 Federal Highway Administration - - - - 13,100,000 Federal Transit Administration 3,500,000 2,500,000 - - 17,984,000 Local Funds - - - - 3,000,000 Land Sale Revenue - - - - 1,400,000 Offset to Avoid Double Counting (880,000) (630,000) - - (4,516,000) Other Highway Funds 880,000 630,000 - - 4,516,000 RI Capital Plan Fund - - - - 80,247
Portsmouth Facility - - - - 6,561,227 P.L. 2004 Ch. 595 Issued - - - - 2,065,000 RI Capital Plan Fund - - - - 3,755,171 Gas Tax - - - - 741,056
Rhode Island Travel Plaza and Transit Hub - - - - 9,000,000 Federal Highway Administration - - - - 9,000,000 Offset to Avoid Double Counting - - - - (3,000,000) Other Highway Funds - - - - 3,000,000
Salt Storage Facilities 1,000,000 1,000,000 1,000,000 - 11,334,158 RI Capital Plan Fund 1,000,000 1,000,000 1,000,000 - 11,334,158
Train Station Maintenance and Repairs 350,000 350,000 - - 2,238,643 RI Capital Plan Fund 350,000 350,000 - - 2,238,643
Transportation Totals 517,334,398 460,671,652 428,086,155 499,710,803 5,674,932,375
Rhode Island Public Transit Authority
Bus Purchases (RIPTA) - - 17,594,178 - 143,634,390 Federal Transit Administration - - 14,075,342 - 112,495,984 RIPTA Operating Funds - - - - 480,170 RIPTA Revolving Loan Fund - - - - 1,151,395 State Fleet Replacement Fund - - - - 4,200,000 Federal Stimulus Funding - - - - 21,788,005 Vehicle Registration Fees - - - - 3,031,867 Offset to Avoid Double Counting - - - - (3,031,867) RI Capital Plan Fund - - 3,518,836 - 3,518,836
College Hill Bus Tunnel 4,160,000 4,160,000 - - 9,333,634 Federal Transit Administration 3,328,000 3,328,000 - - 7,466,907 RI Capital Plan Fund 800,000 800,000 - - 1,600,000 RIPTA Operating Funds 32,000 32,000 - - 266,727
Enterprise Software Solution - - - - 1,586,434 Federal Transit Administration - - - - 1,269,147 RIPTA Revolving Loan Fund - - - - 317,287
Farebox Upgrade - - - - 5,500,000 Federal Transit Administration - - - - 4,400,000 RIPTA Operating Funds - - - - 1,100,000
Fixed Route and Paratransit Cameras - - - - 2,269,804 Federal Transit Administration - - - - 1,815,844 RIPTA Revolving Loan Fund - - - - 453,960
Intelligent Transportation Systems Implementation - - - - 8,403,964 Federal Transit Administration - - - - 5,523,172 Federal Highway Administration - - - - 1,500,000 RIPTA Operating Funds - - - - 17,293 RIPTA Revolving Loan Fund - - - - 1,363,499
141

Schedule 4 - Projects By Funding Source
Pre-FY 2017 FY 2017 FY 2018 FY 2019Projected Disbursements
Land and Buildings Enhancements 7,333,370 7,993,036 1,950,000 1,070,000 Federal Transit Administration 6,281,186 6,882,340 1,739,000 960,000 Local Funds 620,630 793,000 121,000 20,000 RI Capital Plan Fund 323,322 262,696 90,000 90,000 RIPTA Capital Funds - 55,000 - - RIPTA Operating Funds 108,232 - - -
Paratransit Vehicles (RIPTA) 25,272,709 1,402,625 1,402,625 1,402,625 Federal Transit Administration 20,218,168 1,122,100 1,122,100 1,122,100 Paratransit Revolving Fund 5,054,541 280,525 280,525 280,525
Pawtucket Bus Hub and Transit Corridor - 301,969 2,013,123 4,730,840 Federal Transit Administration - 241,575 1,610,499 3,784,672 RI Capital Plan Fund - - 313,018 946,168 Local Funds - 60,394 89,606 -
Providence Transit Connector - 305,882 2,000,000 12,725,985 Federal Transit Administration - 305,882 1,529,412 11,164,706 Vehicle Registration Fees - 94,118 - 1,035,294 RI Capital Plan Fund - - 470,588 1,561,279 Other Funds - - - 838,721 Offset to Avoid Double Counting - (94,118) - (1,874,015)
Redundancy 31,328 1,000,000 860,000 - Federal Transit Administration - 800,000 688,000 - RIPTA Revolving Loan Fund - 200,000 172,000 - Federal Emergency Management Agency 31,328 - - -
RI Public Transit Authority Totals 144,626,050 23,890,265 26,526,119 21,567,730
Transportation Totals 2,211,411,959 536,222,023 627,070,792 611,034,757
Statewide Totals 4,922,205,335 1,181,481,387 1,223,634,565 1,050,858,385
142

Schedule 4 - Projects By Funding Source
Projected DisbursementsFY 2020 FY 2021 FY 2022 Post-FY 2022 Totals
Land and Buildings Enhancements 1,070,000 1,070,000 1,070,000 - 21,556,406 Federal Transit Administration 960,000 960,000 960,000 - 18,742,526 Local Funds 20,000 20,000 20,000 - 1,614,630 RI Capital Plan Fund 90,000 90,000 90,000 - 1,036,018 RIPTA Capital Funds - - - - 55,000 RIPTA Operating Funds - - - - 108,232
Paratransit Vehicles (RIPTA) 1,402,625 1,402,625 1,402,625 1,402,625 35,091,084 Federal Transit Administration 1,122,100 1,122,100 1,122,100 1,122,100 28,072,868 Paratransit Revolving Fund 280,525 280,525 280,525 280,525 7,018,216
Pawtucket Bus Hub and Transit Corridor - - - - 7,045,932 Federal Transit Administration - - - - 5,636,746 RI Capital Plan Fund - - - - 1,259,186 Local Funds - - - - 150,000
Providence Transit Connector - - - - 15,031,867 Federal Transit Administration - - - - 13,000,000 Vehicle Registration Fees - - - - 1,129,412 RI Capital Plan Fund - - - - 2,031,867 Other Funds - - - - 838,721 Offset to Avoid Double Counting - - - - (1,968,133)
Redundancy - - - - 1,891,328 Federal Transit Administration - - - - 1,488,000 RIPTA Revolving Loan Fund - - - - 372,000 Federal Emergency Management Agency - - - - 31,328
RI Public Transit Authority Totals 6,632,625 6,632,625 20,066,803 1,402,625 251,344,843
Transportation Totals 523,967,023 467,304,277 448,152,958 501,113,428 5,926,277,218
Statewide Totals 904,534,361 844,239,796 708,529,048 1,138,587,887 11,974,070,764
143

Schedule 5 - Rhode Island Capital Plan Fund Projects
Disbursements
Pre-FY 2017 FY 2017 FY 2018 FY 2019
Department of Administration
Capital Hill Campus Projects
Chapin Health Laboratory 283,399 750,000 6,050,000 -
Cannon Building 2,605,882 400,000 700,000 600,000
State Office Building 3,532,235 1,705,000 700,000 350,000
William Powers Building (Administration) 6,802,623 1,000,000 1,000,000 2,000,000
Environmental Projects
Environmental Compliance 1,385,795 200,000 200,000 200,000
Replacement of Fueling Tanks 2,387,596 295,610 450,000 300,000
State Facility Projects
DoIT Enterprise Operations Center 9,968,337 530,000 770,000 1,080,000
Old Colony House 1,603,026 280,000 100,000 50,000
Old State House 1,597,457 250,000 1,000,000 500,000
Shepard Building - 95,000 395,000 500,000
Washington County Government Center 2,733,034 100,000 1,400,000 1,250,000
Pastore Center Campus Projects
Harrington Hall Renovations 3,424,981 194,222 - -
Mathias Building Renovation 3,130,684 530,000 - -
Pastore Center Building Demolition 4,040,046 - 175,000 1,825,000
Pastore Center Parking 2,399,765 300,000 1,300,000 -
Pastore Center Rehab - DOA Portion 8,429,551 6,900,000 3,900,000 4,000,000
Pastore Cottages Rehabilitation 2,089,593 100,782 - -
Pastore Power Plant Rehabilitation 2,362,246 800,000 650,000 -
Pastore Strategic Plan - 1,325,500 600,000 -
Pastore Utilities Upgrade 3,103,813 2,635,622 2,000,000 -
Pastore Utility Systems Water Tanks and Pipes 354,434 540,000 280,000 280,000
State House Asset Protection Projects
State House Energy Management Improvement Project 564,667 108,333 2,000,000 3,000,000
State House Renovations 6,053,349 1,000,000 1,250,000 1,250,000
Zambarano Campus Projects
Zambarano Utilities and Infrastructure 5,112,521 3,175,000 6,085,000 2,240,000
Other Department of Administration Projects
Accessibility 2,630,693 1,000,000 1,000,000 1,000,000
Big River Management Area 803,035 131,720 100,000 125,000
Cranston Street Armory 3,143,241 1,500,000 850,000 -
Dunkin' Donuts Center Asset Protection 1,164,241 3,923,259 1,850,000 1,850,000
Energy Efficiency - - 1,000,000 1,000,000
McCoy Stadium Repairs 1,820,847 - 101,761 -
Rhode Island Convention Center Asset Protection 2,492,248 1,800,245 1,000,000 1,000,000
Security Measures/State Buildings - - 500,000 -
The VETS 16,264,275 455,147 205,000 200,000
DOA Virks Building Renovation 2,364,946 15,132,512 5,236,000 -
Subtotal 104,648,560 47,157,952 42,847,761 24,600,000
Executive Office of Commerce
I-195 Redevelopment District Commission 1,364,630 351,683 300,000 -
Quonset Point/Davisville Pier - 400,000 2,600,000 2,000,000
Subtotal 1,364,630 751,683 2,900,000 2,000,000
144

Schedule 5 - Rhode Island Capital Plan Fund Projects
Disbursements
FY 2020 FY 2021 FY 2022 Post-FY 2022 Total
Department of Administration
Capital Hill Campus Projects
Chapin Health Laboratory - - - - 7,083,399
Cannon Building 350,000 3,500,000 3,500,000 - 11,655,882
State Office Building 1,000,000 2,930,000 - - 10,217,235
William Powers Building (Administration) 3,000,000 4,000,000 1,000,000 - 18,802,623
Environmental Projects
Environmental Compliance 200,000 200,000 - - 2,385,795
Replacement of Fueling Tanks 300,000 300,000 300,000 - 4,333,206
State Facility Projects
DoIT Enterprise Operations Center - - - - 12,348,337
Old Colony House - - - - 2,033,026
Old State House 150,000 - - - 3,497,457
Shepard Building 2,000,000 2,000,000 - - 4,990,000
Washington County Government Center 1,250,000 750,000 500,000 - 7,983,034
Pastore Center Campus Projects
Harrington Hall Renovations - - - - 3,619,203
Mathias Building Renovation - - - - 3,660,684
Pastore Center Building Demolition 3,750,000 - - - 9,790,046
Pastore Center Parking - - - - 3,999,765
Pastore Center Rehab - DOA Portion 4,000,000 4,000,000 5,000,000 - 36,229,551
Pastore Cottages Rehabilitation - - - - 2,190,375
Pastore Power Plant Rehabilitation - - - - 3,812,246
Pastore Strategic Plan - - - - 1,925,500
Pastore Utilities Upgrade - - - - 7,739,435
Pastore Utility Systems Water Tanks and Pipes 280,000 - - - 1,734,434
State House Asset Protection Projects
State House Energy Management Improvement Project - - - - 5,673,000
State House Renovations 1,000,000 500,000 500,000 - 11,553,349
Zambarano Campus Projects
Zambarano Utilities and Infrastructure 1,100,000 1,500,000 1,000,000 - 20,212,521
Other Department of Administration Projects
Accessibility 1,000,000 1,000,000 1,000,000 - 8,630,693
Big River Management Area 150,000 150,000 150,000 - 1,609,755
Cranston Street Armory - - - - 5,493,241
Dunkin' Donuts Center Asset Protection 1,850,000 1,850,000 1,850,000 - 14,337,500
Energy Efficiency 1,000,000 1,000,000 1,000,000 - 5,000,000
McCoy Stadium Repairs - - - - 1,922,608
Rhode Island Convention Center Asset Protection 1,000,000 1,000,000 1,000,000 - 9,292,493
Security Measures/State Buildings - - - - 500,000
The VETS 90,000 185,000 - - 17,399,422
DOA Virks Building Renovation - - - - 22,733,458
Subtotal 23,470,000 24,865,000 16,800,000 - 284,389,273
Executive Office of Commerce
I-195 Redevelopment District Commission - - - - 2,016,313
Quonset Point/Davisville Pier 5,000,000 5,000,000 - - 15,000,000
Subtotal 5,000,000 5,000,000 - - 17,016,313
145

Schedule 5 - Rhode Island Capital Plan Fund Projects
Disbursements
Pre-FY 2017 FY 2017 FY 2018 FY 2019
Department of Labor and Training
Center General Asset Protection 1,573,867 1,374,438 1,130,000 900,000
Center General Building Roof 1,132,843 156,620 - -
Subtotal 2,706,710 1,531,058 1,130,000 900,000
Department of Revenue
Lottery Building Renovations 785,303 119,112 - -
Subtotal 785,303 119,112 - -
Secretary of State
State Archives - 150,000 - -
Subtotal - 150,000 - -
Department of Children, Youth and Families
Generators - Rhode Island Training School 30,802 50,000 950,000 -
Mt. Hope - Fire Towers - - - -
NAFI Center 710,138 40,857 - -
RITS Maintenance Building - 385,000 150,000 -
Various Repairs and Improvements to YDC and YAC 1,004,243 483,816 - -
Subtotal 1,745,183 959,673 1,100,000 -
Human Services
Blind Vending Facilities 1,029,959 165,000 165,000 165,000
Subtotal 1,029,959 165,000 165,000 165,000
Behavioral Health, Developmental Disabilities & Hospitals
Admin Buildings - Asset Protection 6,102,379 5,522,030 250,000 250,000
Community Facilities - Fire Code 2,040,119 442,200 400,000 400,000
DD Private Waiver Comm. Facilities Fire Upgrades 1,566,604 209,544 100,000 100,000
Hospital Reorganization - 2,500,000 2,310,000 920,000
Hospital Equipment Asset Protection 229,229 370,771 300,000 300,000
Mental Health Community Fac. Asset Protection 2,080,044 200,000 200,000 200,000
Mental Health Residences 5,100,000 800,000 800,000 800,000
DD Group Homes - Asset Protection 5,136,686 1,159,429 1,025,000 750,000
DD Residential Support 4,517,268 500,000 500,000 500,000
Hospital Building(s) Asset Protection 4,049,821 252,204 250,000 300,000
DD Regional Centers - Asset Protection 2,259,600 974,363 500,000 500,000
Substance Abuse - Asset Protection 488,806 100,000 150,000 200,000
Zambarano Campus Asset Protection 887,227 580,000 280,000 250,000
Subtotal 34,457,783 13,610,541 7,065,000 5,470,000
Elementary and Secondary Education
Davies Career and Tech. School HVAC 2,057,260 498,808 2,499,000 -
Davies Career and Tech. School Asset Protection 1,418,918 477,911 150,000 150,000
Davies Advanced Manufacturing Program - - 3,650,000 -
Met School Asset Protection 349,089 200,000 250,000 250,000
Metropolitan Career and Tech HVAC 3,104,373 3,131,996 - -
Warwick Career & Tech. Projects 2,785,040 350,000 - -
Woonsocket Career & Tech. Projects 1,242,661 1,950,000 - -
Subtotal 10,957,341 6,608,715 6,549,000 400,000
146

Schedule 5 - Rhode Island Capital Plan Fund Projects
Disbursements
FY 2020 FY 2021 FY 2022 Post-FY 2022 Total
Department of Labor and Training
Center General Asset Protection 1,650,000 816,869 - - 7,445,174
Center General Building Roof - - - - 1,289,463
Subtotal 1,650,000 816,869 - - 8,734,637
Department of Revenue
Lottery Building Renovations - - - - 904,415
Subtotal - - - - 904,415
Secretary of State
State Archives - - - - 150,000
Subtotal - - - - 150,000
Department of Children, Youth and Families
Generators - Rhode Island Training School - - - - 1,030,802
Mt. Hope - Fire Towers - - - - -
NAFI Center - - - - 750,995
RITS Maintenance Building - - - - 535,000
Various Repairs and Improvements to YDC and YAC - - - - 1,488,059
Subtotal - - - - 3,804,856
Human Services
Blind Vending Facilities 165,000 165,000 165,000 - 2,019,959
Subtotal 165,000 165,000 165,000 - 2,019,959
Behavioral Health, Developmental Disabilities & Hospitals
Admin Buildings - Asset Protection 250,000 250,000 250,000 - 12,874,409
Community Facilities - Fire Code 200,000 - - - 3,482,319
DD Private Waiver Comm. Facilities Fire Upgrades - - - - 1,976,148
Hospital Reorganization - - - - 5,730,000
Hospital Equipment Asset Protection 300,000 300,000 300,000 - 2,100,000
Mental Health Community Fac. Asset Protection 200,000 200,000 200,000 - 3,280,044
Mental Health Residences 800,000 800,000 800,000 - 9,900,000
DD Group Homes - Asset Protection 750,000 750,000 750,000 - 10,321,115
DD Residential Support 500,000 500,000 500,000 - 7,517,268
Hospital Building(s) Asset Protection 350,000 400,000 450,000 - 6,052,025
DD Regional Centers - Asset Protection 500,000 500,000 500,000 - 5,733,963
Substance Abuse - Asset Protection 250,000 250,000 250,000 - 1,688,806
Zambarano Campus Asset Protection 250,000 300,000 300,000 - 2,847,227
Subtotal 4,350,000 4,250,000 4,300,000 - 73,503,324
Elementary and Secondary Education
Davies Career and Tech. School HVAC - - - - 5,055,068
Davies Career and Tech. School Asset Protection 150,000 150,000 150,000 - 2,646,829
Davies Advanced Manufacturing Program - - - - 3,650,000
Met School Asset Protection 250,000 250,000 250,000 - 1,799,089
Metropolitan Career and Tech HVAC - - - - 6,236,369
Warwick Career & Tech. Projects - - - - 3,135,040
Woonsocket Career & Tech. Projects - - - - 3,192,661
Subtotal 400,000 400,000 400,000 - 25,715,056
147

Schedule 5 - Rhode Island Capital Plan Fund Projects
Disbursements
Pre-FY 2017 FY 2017 FY 2018 FY 2019
Office of Higher Education
Asset Protection - URI 57,896,018 13,556,000 8,030,000 8,200,000
Electric Utility Substation Replacement 5,617,350 1,382,650 - -
Fine Arts Center Renovation and Addition 400,000 - 1,000,000 -
Fire Safety & Protection Academic & Administrative 10,797,032 2,552,968 - -
New Chemistry Building 8,800,000 - - -
Nursing Education Center 989,855 301,859 - -
Shepard Building Upgrades - - - -
URI Biotechnology Center 5,100,000 156,439 - -
White Hall Renovations 905,870 419,130 - -
Asset Protection - RIC 22,552,949 5,840,117 3,458,431 3,562,184
Academic Bldg Phase I-Craig Lee, Gaige, Adams Lib. - - 6,100,000 6,000,000
Academic Bldg Phase IV-Clarke Science, Henry Barn. - - - 150,000
East Campus Improvements - - - -
New Residence Hall II - - 3,000,000 -
Residence Halls Modernization/Renovation - - - -
RICAP Infrastructure Modernization 10,245,298 2,754,701 4,500,000 4,500,000
Asset Protection - CCRI 15,056,636 3,032,100 2,799,063 2,368,035
Flanagan Campus Renewal - - - -
Knight Campus Bio and Chemistry Lab Renovation - - 375,000 375,000
Knight Campus Renewal 2,901,098 5,223,902 5,000,000 4,000,000
Westerly Campus - 2,000,000 - -
Subtotal 141,262,106 37,219,866 34,262,494 29,155,219
Atomic Energy Commission
Atomic Energy Asset Protection 456,889 59,895 50,000 50,000
Subtotal 456,889 59,895 50,000 50,000
Attorney General
Building Renovations and Repairs 1,963,614 417,530 150,000 150,000
Subtotal 1,963,614 417,530 150,000 150,000
Department of Corrections
Bernadette Guay Renovations - - - -
Corrections Asset Protection 14,590,731 3,185,969 3,922,042 3,750,000
Correctional Facilities Study - 250,000 - -
Dix Renovations 2,419,403 311,066 1,075,000 250,000
General Renovations - Maximum 4,308,376 1,324,253 1,300,000 500,000
Gloria McDonald Renovations 3,378,872 539,133 150,000 -
ISC Exterior Envelope and HVAC Renovation 707,590 425,000 2,027,455 1,700,000
Medium Infrastucture 876,023 2,000,000 7,283,688 6,000,000
Subtotal 26,280,995 8,035,421 15,758,185 12,200,000
Judicial
Garrahy Courtroom Restoration - - - -
Judicial Asset Protection 6,980,455 868,614 950,000 950,000
Judicial Complexes - HVAC 5,281,928 1,080,072 900,000 1,000,000
Licht Judicial Complex Restoration 1,250,000 750,000 750,000 750,000
Licht Window/Exterior Restoration - - 500,000 800,000
Licht Chillers Replacement - - - 600,000
Murray Courtroom Restoration - - - -
148

Schedule 5 - Rhode Island Capital Plan Fund Projects
Disbursements
FY 2020 FY 2021 FY 2022 Post-FY 2022 Total
Office of Higher Education
Asset Protection - URI 8,364,000 8,531,280 8,700,000 - 113,277,298
Electric Utility Substation Replacement - - - - 7,000,000
Fine Arts Center Renovation and Addition - - - - 1,400,000
Fire Safety & Protection Academic & Administrative - - - - 13,350,000
New Chemistry Building - - - - 8,800,000
Nursing Education Center - - - - 1,291,714
Shepard Building Upgrades - - - - -
URI Biotechnology Center - - - - 5,256,439
White Hall Renovations - - - - 1,325,000
Asset Protection - RIC 3,669,050 4,150,000 4,233,000 - 47,465,731
Academic Bldg Phase I-Craig Lee, Gaige, Adams Lib. - - - - 12,100,000
Academic Bldg Phase IV-Clarke Science, Henry Barn. - - - - 150,000
East Campus Improvements 150,000 - - - 150,000
New Residence Hall II - - - - 3,000,000
Residence Halls Modernization/Renovation - 5,000,000 5,000,000 - 10,000,000
RICAP Infrastructure Modernization 3,600,000 3,500,000 3,500,000 - 32,599,999
Asset Protection - CCRI 2,439,076 2,487,857 2,537,615 - 30,720,382
Flanagan Campus Renewal 2,000,000 2,000,000 2,000,000 4,000,000 10,000,000
Knight Campus Bio and Chemistry Lab Renovation - - - - 750,000
Knight Campus Renewal 3,000,000 - - - 20,125,000
Westerly Campus - - - - 2,000,000
Subtotal 23,222,126 25,669,137 25,970,615 4,000,000 320,761,563
Atomic Energy Commission
Atomic Energy Asset Protection 50,000 50,000 50,000 - 766,784
Subtotal 50,000 50,000 50,000 - 766,784
Attorney General
Building Renovations and Repairs 150,000 150,000 150,000 - 3,131,144
Subtotal 150,000 150,000 150,000 - 3,131,144
Department of Corrections
Bernadette Guay Renovations - - - - -
Corrections Asset Protection 3,750,000 3,750,000 3,750,000 - 36,698,742
Correctional Facilities Study - - - - 250,000
Dix Renovations 650,000 - - - 4,705,469
General Renovations - Maximum 350,000 - - - 7,782,629
Gloria McDonald Renovations - - - - 4,068,005
ISC Exterior Envelope and HVAC Renovation 2,200,000 1,150,000 - - 8,210,045
Medium Infrastucture 7,000,000 - - - 23,159,711
Subtotal 13,950,000 4,900,000 3,750,000 - 84,874,601
Judicial
Garrahy Courtroom Restoration - 250,000 250,000 - 500,000
Judicial Asset Protection 1,000,000 1,000,000 1,000,000 - 12,749,069
Judicial Complexes - HVAC 1,000,000 1,000,000 - - 10,262,000
Licht Judicial Complex Restoration 750,000 750,000 750,000 - 5,750,000
Licht Window/Exterior Restoration - - - - 1,300,000
Licht Chillers Replacement 600,000 - - - 1,200,000
Murray Courtroom Restoration - 350,000 350,000 - 700,000
149

Schedule 5 - Rhode Island Capital Plan Fund Projects
Disbursements
Pre-FY 2017 FY 2017 FY 2018 FY 2019
Noel Shelled Courtroom Build Out 2,594,930 3,405,070 4,000,000 -
Subtotal 16,107,313 6,103,756 7,100,000 4,100,000
Military Staff
AMC Rehab 3,659,074 132,725 949,775 -
Benefit Street Arsenal Rehabilitation 660,093 37,564 - -
Bristol Readiness Center - - 125,000 -
Burrillville Regional Training Institute 22,350 - 22,150 -
Military Staff Asset Protection 2,448,905 808,202 700,000 700,000
Joint Force Headquarters Building 18,848 600,000 5,900,000 4,181,152
Subtotal 6,809,270 1,578,491 7,696,925 4,881,152
Rhode Island Emergency Management Agency
Critical State-Wide Emergency Projects - - - -
Emergency Management Building - 189,750 - -
Hurricane Sandy Cleanup 623,790 232,075 - -
Subtotal 623,790 421,825 - -
Public Safety
Administrative Support Building Renovation - - - -
DPS Asset Protection 39,521 660,479 250,000 250,000
Fire Academy Building 1,480,811 2,844,189 - -
Lincoln Woods Barracks Renovation 2,937,083 511,345 - -
RI Statewide Communications System Network - 1,494,414 1,494,414 1,494,414
State Police Barracks Feasibility Study 8,756 191,244 - -
State Police Training Academy Upgrades - - 100,000 500,000
Subtotal 4,466,171 5,701,671 1,844,414 2,244,414
Environmental Management
Blackstone Valley Park Improvements/Friends 647,482 393,348 359,170 -
Dam Repair 3,306,191 254,195 2,245,805 1,500,000
Fish & Wildlife Maintenance Facility - - 150,000 -
Fort Adams Trust/Rehabilitation 2,312,947 301,625 300,000 300,000
Fort Adams Sailing Improvements/Mid-Park 6,418,756 1,469,851 1,750,000 -
Galilee Piers/Bulkhead 5,066,074 311,611 1,250,000 1,250,000
Marine Infrastructure/Pier Development - 100,000 500,000 1,000,000
Natural Resources Offices/Visitor's Center 384,440 1,062,259 5,500,000 -
Newport Piers/Building Project 1,399,259 137,500 137,500 -
Recreational Facility Improvements 16,091,631 5,689,289 2,450,000 1,600,000
Rocky Point Master Plan and Implementation 3,683,008 116,992 150,000 -
State Building Demolition - 100,000 100,000 100,000
World War II Park 2,471,285 128,715 - -
Subtotal 41,781,073 10,065,385 14,892,475 5,750,000
Coastal Resources Management Council
Narragansett Bay Special Area Management Plan - - 250,000 -
Rhode Island Coastal Storm Risk Study - 150,000 525,000 500,000
Shoreline Change Special Area Management Plan 298,374 - - -
South Coast Restoration Project - 321,775 - -
Subtotal 298,374 471,775 775,000 500,000
150
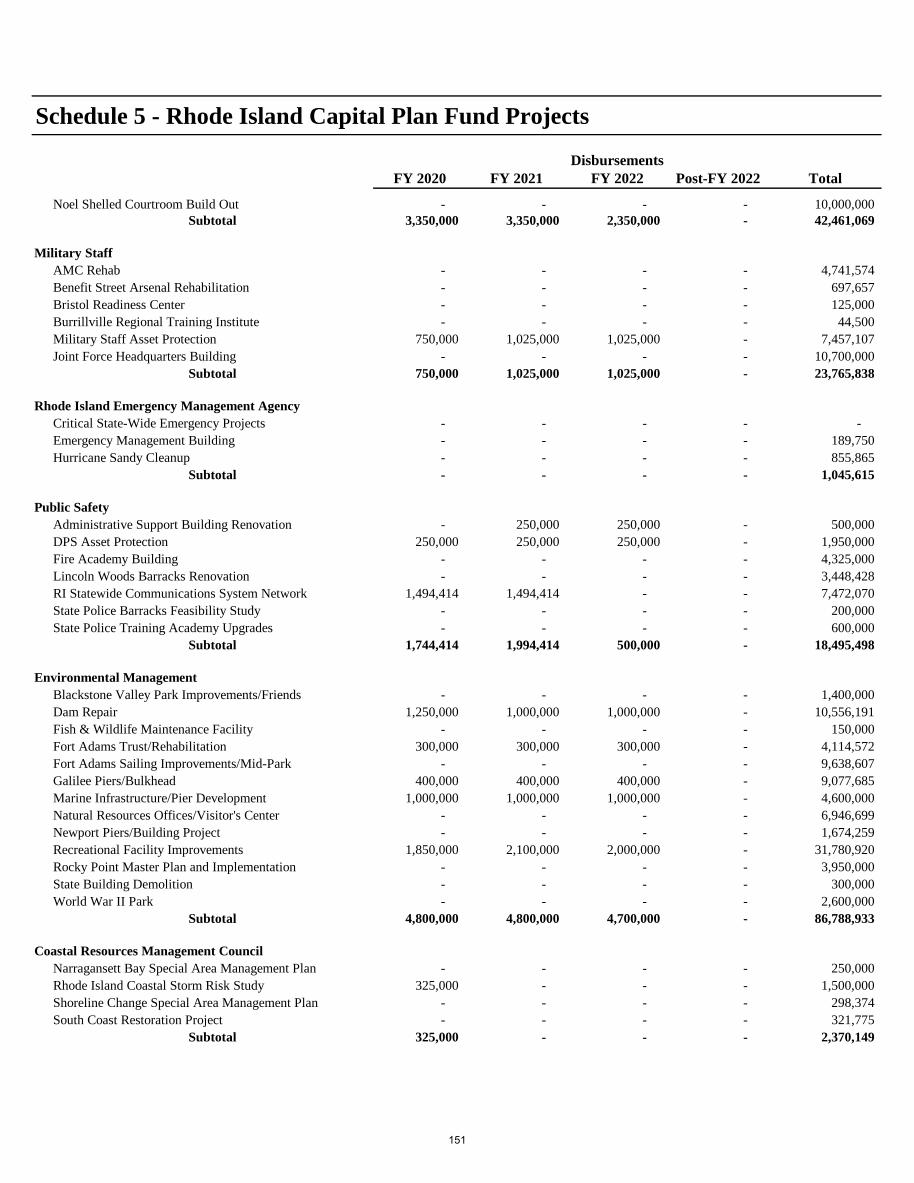
Schedule 5 - Rhode Island Capital Plan Fund Projects
Disbursements
FY 2020 FY 2021 FY 2022 Post-FY 2022 Total
Noel Shelled Courtroom Build Out - - - - 10,000,000
Subtotal 3,350,000 3,350,000 2,350,000 - 42,461,069
Military Staff
AMC Rehab - - - - 4,741,574
Benefit Street Arsenal Rehabilitation - - - - 697,657
Bristol Readiness Center - - - - 125,000
Burrillville Regional Training Institute - - - - 44,500
Military Staff Asset Protection 750,000 1,025,000 1,025,000 - 7,457,107
Joint Force Headquarters Building - - - - 10,700,000
Subtotal 750,000 1,025,000 1,025,000 - 23,765,838
Rhode Island Emergency Management Agency
Critical State-Wide Emergency Projects - - - - -
Emergency Management Building - - - - 189,750
Hurricane Sandy Cleanup - - - - 855,865
Subtotal - - - - 1,045,615
Public Safety
Administrative Support Building Renovation - 250,000 250,000 - 500,000
DPS Asset Protection 250,000 250,000 250,000 - 1,950,000
Fire Academy Building - - - - 4,325,000
Lincoln Woods Barracks Renovation - - - - 3,448,428
RI Statewide Communications System Network 1,494,414 1,494,414 - - 7,472,070
State Police Barracks Feasibility Study - - - - 200,000
State Police Training Academy Upgrades - - - - 600,000
Subtotal 1,744,414 1,994,414 500,000 - 18,495,498
Environmental Management
Blackstone Valley Park Improvements/Friends - - - - 1,400,000
Dam Repair 1,250,000 1,000,000 1,000,000 - 10,556,191
Fish & Wildlife Maintenance Facility - - - - 150,000
Fort Adams Trust/Rehabilitation 300,000 300,000 300,000 - 4,114,572
Fort Adams Sailing Improvements/Mid-Park - - - - 9,638,607
Galilee Piers/Bulkhead 400,000 400,000 400,000 - 9,077,685
Marine Infrastructure/Pier Development 1,000,000 1,000,000 1,000,000 - 4,600,000
Natural Resources Offices/Visitor's Center - - - - 6,946,699
Newport Piers/Building Project - - - - 1,674,259
Recreational Facility Improvements 1,850,000 2,100,000 2,000,000 - 31,780,920
Rocky Point Master Plan and Implementation - - - - 3,950,000
State Building Demolition - - - - 300,000
World War II Park - - - - 2,600,000
Subtotal 4,800,000 4,800,000 4,700,000 - 86,788,933
Coastal Resources Management Council
Narragansett Bay Special Area Management Plan - - - - 250,000
Rhode Island Coastal Storm Risk Study 325,000 - - - 1,500,000
Shoreline Change Special Area Management Plan - - - - 298,374
South Coast Restoration Project - - - - 321,775
Subtotal 325,000 - - - 2,370,149
151

Schedule 5 - Rhode Island Capital Plan Fund Projects
Disbursements
Pre-FY 2017 FY 2017 FY 2018 FY 2019
Department of Transporation
Highway Improvement Program 71,926,926 32,451,346 32,451,346 32,451,346
Maintenance - Capital Equipment Replacement 4,500,000 1,500,000 2,500,000 2,500,000
Maintenance Facility Improvements 2,044,419 400,000 400,000 400,000
Pawtucket-Central Falls Train Station 80,247 - - -
Portsmouth Facility 406,471 2,273,444 575,256 500,000
Salt Storage Facilities 4,372,224 1,961,934 1,000,000 1,000,000
Train Station Maintenance and Repairs 165,088 673,555 350,000 350,000
Subtotal 83,495,375 39,260,279 37,276,602 37,201,346
Rhode Island Public Transit Authority
Bus Purchases (RIPTA) - - - -
College Hill Bus Tunnel - - - -
Land and Buildings Enhancements 323,322 262,696 90,000 90,000
Pawtucket Bus Hub and Transit Corridor - - 313,018 946,168
Providence Transit Connector - - 470,588 1,561,279
Subtotal 323,322 262,696 873,606 2,597,447
Total Rhode Island Capital Plan Fund Projects 481,563,761 180,652,324 182,436,462 132,364,578
152

Schedule 5 - Rhode Island Capital Plan Fund Projects
Disbursements
FY 2020 FY 2021 FY 2022 Post-FY 2022 Total
Department of Transporation
Highway Improvement Program 32,451,346 32,451,346 32,451,346 - 266,635,002
Maintenance - Capital Equipment Replacement 2,500,000 2,500,000 2,500,000 - 18,500,000
Maintenance Facility Improvements 400,000 400,000 400,000 - 4,444,419
Pawtucket-Central Falls Train Station - - - - 80,247
Portsmouth Facility - - - - 3,755,171
Salt Storage Facilities 1,000,000 1,000,000 1,000,000 - 11,334,158
Train Station Maintenance and Repairs 350,000 350,000 - - 2,238,643
Subtotal 36,701,346 36,701,346 36,351,346 - 306,987,640
Rhode Island Public Transit Authority
Bus Purchases (RIPTA) - - 3,518,836 - 3,518,836
College Hill Bus Tunnel 800,000 800,000 - - 1,600,000
Land and Buildings Enhancements 90,000 90,000 90,000 - 1,036,018
Pawtucket Bus Hub and Transit Corridor - - - - 1,259,186
Providence Transit Connector - - - - 2,031,867
Subtotal 890,000 890,000 3,608,836 - 9,445,907
Total Rhode Island Capital Plan Fund Projects 120,967,886 115,026,766 100,120,797 4,000,000 1,317,132,574
153
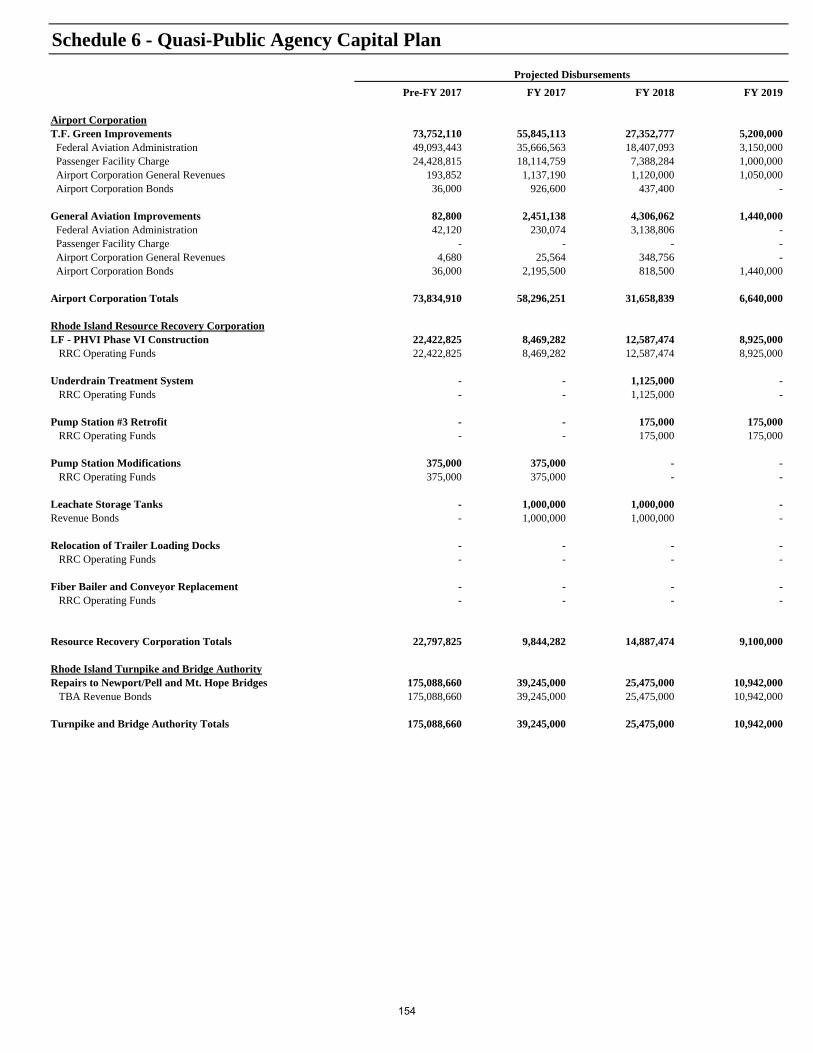
Schedule 6 - Quasi-Public Agency Capital Plan
Projected Disbursements
Pre-FY 2017 FY 2017 FY 2018 FY 2019
Airport CorporationT.F. Green Improvements 73,752,110 55,845,113 27,352,777 5,200,000 Federal Aviation Administration 49,093,443 35,666,563 18,407,093 3,150,000 Passenger Facility Charge 24,428,815 18,114,759 7,388,284 1,000,000 Airport Corporation General Revenues 193,852 1,137,190 1,120,000 1,050,000 Airport Corporation Bonds 36,000 926,600 437,400 -
General Aviation Improvements 82,800 2,451,138 4,306,062 1,440,000 Federal Aviation Administration 42,120 230,074 3,138,806 - Passenger Facility Charge - - - - Airport Corporation General Revenues 4,680 25,564 348,756 - Airport Corporation Bonds 36,000 2,195,500 818,500 1,440,000
Airport Corporation Totals 73,834,910 58,296,251 31,658,839 6,640,000
Rhode Island Resource Recovery CorporationLF - PHVI Phase VI Construction 22,422,825 8,469,282 12,587,474 8,925,000 RRC Operating Funds 22,422,825 8,469,282 12,587,474 8,925,000
Underdrain Treatment System - - 1,125,000 - RRC Operating Funds - - 1,125,000 -
Pump Station #3 Retrofit - - 175,000 175,000 RRC Operating Funds - - 175,000 175,000
Pump Station Modifications 375,000 375,000 - - RRC Operating Funds 375,000 375,000 - -
Leachate Storage Tanks - 1,000,000 1,000,000 - Revenue Bonds - 1,000,000 1,000,000 -
Relocation of Trailer Loading Docks - - - - RRC Operating Funds - - - -
Fiber Bailer and Conveyor Replacement - - - - RRC Operating Funds - - - -
Resource Recovery Corporation Totals 22,797,825 9,844,282 14,887,474 9,100,000
Rhode Island Turnpike and Bridge AuthorityRepairs to Newport/Pell and Mt. Hope Bridges 175,088,660 39,245,000 25,475,000 10,942,000 TBA Revenue Bonds 175,088,660 39,245,000 25,475,000 10,942,000
Turnpike and Bridge Authority Totals 175,088,660 39,245,000 25,475,000 10,942,000
154

Schedule 6 - Quasi-Public Agency Capital Plan
Projected Disbursements
FY 2020 FY 2021 FY 2022 Post-FY 2022 Totals
Airport CorporationT.F. Green Improvements 5,475,000 15,375,000 14,350,000 6,300,000 203,650,000 Federal Aviation Administration 3,356,250 10,781,250 10,012,500 4,725,000 135,192,100 Passenger Facility Charge 1,118,750 3,593,750 3,337,500 1,575,000 60,556,858 Airport Corporation General Revenues 1,000,000 1,000,000 1,000,000 - 6,501,042 Airport Corporation Bonds - - - - 1,400,000
General Aviation Improvements 9,829,639 21,830,406 6,572,220 961,050 47,473,316 Federal Aviation Administration 2,942,676 19,647,365 5,914,998 864,945 32,780,984 Passenger Facility Charge 119,613 746,381 - - 865,995 Airport Corporation General Revenues 102,541 - - - 481,541 Airport Corporation Bonds 6,664,810 1,436,659 657,222 96,105 13,344,796
Airport Corporation Totals 15,304,639 37,205,406 20,922,220 7,261,050 251,123,316
Rhode Island Resource Recovery CorporationLF - PHVI Phase VI Construction 2,871,667 4,540,000 9,043,333 51,237,061 120,096,642 RRC Operating Funds 2,871,667 4,540,000 9,043,333 51,237,061 120,096,642
Underdrain Treatment System - - - - 1,125,000 RRC Operating Funds - - - - 1,125,000
Pump Station #3 Retrofit - - - - 350,000 RRC Operating Funds - - - - 350,000
Pump Station Modifications - - - - 750,000 RRC Operating Funds - - - - 750,000
Leachate Storage Tanks - - - - 2,000,000 Revenue Bonds - - - - 2,000,000
Relocation of Trailer Loading Docks 325,000 - - - 325,000 RRC Operating Funds 325,000 - - - 325,000
Fiber Bailer and Conveyor Replacement - 1,500,000 - - 1,500,000 RRC Operating Funds - 1,500,000 - - 1,500,000
Resource Recovery Corporation Totals 3,196,667 6,040,000 9,043,333 51,237,061 126,146,642
Rhode Island Turnpike and Bridge AuthorityRepairs to Newport/Pell and Mt. Hope Bridges 24,001,000 29,476,000 23,508,000 70,770,000 398,505,660 TBA Revenue Bonds 24,001,000 29,476,000 23,508,000 70,770,000 398,505,660
Turnpike and Bridge Authority Totals 24,001,000 29,476,000 23,508,000 70,770,000 398,505,660
155


Section 4 – Technical Appendices


Appendices Overview
The Appendices contain information relating to the Rhode Island's outstanding debt and projected debt service. Appendix A – Projected Net Tax Supported
Debt This analysis is performed to identify all debt that is considered "tax supported" debt, and provide insight on the future course of the Rhode Island's tax supported debt. This summary is supported in later appendices, which provide debt service schedules by issues for all outstanding and projected debt issues. Debt outstanding by issuer is also provided in separate schedules. In both the debt service schedules and the summary of net tax supported debt outstanding, an attempt has been made to project those revenues which would offset the state’s obligation. The following assumptions were made in pro-jecting the State of Rhode Island's net tax supported debt outstanding: Items Included in Calculation - All debts included in Moody's Investors' Service tax supported debt calculation have been included. Certain revenue bonds of the Economic Development Corporation and certificates of participation lease obligations are or will be long term in nature and may result in financial commitments that would be funded in part by general revenues. Appendix B – Outstanding and Projected Debt
by Issuer and Debt Ratios This appendix includes the outstanding balances of the state’s obligations as well as the proposed issuance of new debt and the anticipated reduction in debt due to prepayment or defeasance. Proposed Issues - Interest rates for fixed rate general obligation bonds to be issued to fund FY
2017 projects are projected at 4.5 percent. Historic Tax Credit debt is projected to be issued at 4.5 percent in 2018. Projected amortization schedules are found in the exhibits contained in Appendix C of the Capital Budget document. 2) Debt Ratios - Personal income data are derived from the November 2016 Revenue Estimating Conference consensus economic forecast. General revenue receipts projections are consistent with the Governor’s FY 2018 recommended budget, as well as the out year projections contained in the Five-Year Forecast. Appendix C – Debt Service Payable by Issuer The gross debt service payable on all outstanding and proposed debts of the state is adjusted to reflect the estimated disbursement for debt service. A table of contents is provided at the beginning of this appendix to assist the reader in locating specific schedules.
1. Debt Service on obligations that have debt service reserve funds available will be offset in the year in which cash reserve funds are available. It is assumed that reserve funds will be invested and interest earnings will offset the state’s lease payment.
2. Assumes the state appropriates debt service and operating requirements under lease for the Convention Center Authority and the Dunkin Donuts Center.
3. The receipt of federal funds in the schedule does not offset the lease for the Department of Labor and Training’s Howard Center Complex, although the operating budget anticipates the continued receipt of significant federal funds to cover the lease.
4. The obligations arising from the performance based contracts between the Rhode Island Commerce Corporation and private entities are projected to result in state appropriations due to the projected achievement of performance targets. In FY 2017 and FY 2018, it assumes the Fidelity Phase I is $2.5
156

Appendices Overview
million in phase I and $0.8 million in Phase II and Providence Place Mall obligations are $3.6 million. The forecast assumes no requirement for the Bank of America (Fleet) obligation transaction, which if earned would total approximately $0.3 million.
Appendix D – Transportation GARVEE
Bonds The state utilized the Economic Development Corporation as a financing vehicle to issue bonds for transportation projects that are secured by federal grants. The debt service on the bonds issued, which will be funded by future federal grants, is reflected in this appendix for information purposes.
Appendix E – State of Rhode Island Bond Referenda
Appendix E provides information relating to general obligation bond referenda. It provides a historical perspective on all bond referenda presented to the voters at each election since 1972, identifying the amounts presented, the amounts approved by the voters, and the actual vote count for each question.
Appendix F – Analysis of Bond Authorizations Appendix F contains information relating to the state's debt by providing a historical perspective by functional purpose of the debt. This appendix shows the amount of debt approved by functional category since 1979, the amount of bonds actually issued from that authorization, the amount of authorization extinguished or unissued debt as of January 2017. The table also reflects the specific authorizations that are budgeted.
Appendix G – Debt Issuance Appendix G contains information relating to the amount of debt issued each year since 1982, including state general obligation bonds, Rhode Island Public Buildings Authority bonds, Lease
Participation Certificates, Convention Center Authority bonds, Depositors Economic Protection Corporation bonds and other debt.
Appendix H - Glossary
Appendix I is a glossary of terms relevant to capital budgeting and debt issuance.
157

Appendix A Projected Net Tax Supported Debt


Appendix A - Tax Supported Debt and Other Obligations
Obligations Obligations Obligations
June 30,2017 June 30,2018 June 30,2019
Direct Debt:
Proposed General Obligation Bond Issuance 92,000 350,940 432,981
Variable Rate Bonds - -
Various purpose bonds 1,003,880 923,885 842,730
Subtotal 1,095,880 1,274,825 1,275,711
Other Debt Subject to Annual Appropriation:
RI Refunding Bond Authority - Public Buildings Lease Rental Bonds - - -
Convention Center Authority 192,440 181,330 169,670
Economic Development Corporation - Transportation (Motor Fuel) 49,765 45,375 40,800
Economic Development Corporation - Masonic Temple - - -
Economic Development Corporation - URI Power Plant 3,520 2,405 1,230
Economic Development Corporation - McCoy Stadium - - -
Economic Development Corporation - Job Creation Guaranty 43,722 33,467 22,810
Projected Economic Development Corporation - I-195 Land Sale 38,400 38,400 36,980
Certificates of Participation - Equipment/Vehicle Leases - - -
Certificates of Participation - Intake Center - - -
Certificates of Participation - Attorney General - - -
Certificates of Participation - DLT Howard Complex - - -
Certificates of Participation - Shepard's Building (originally EDC) - - -
Certificates of Participation - Pastore Center Power Plant 8,295 6,355 4,325
Certificates of Participation - Kent County Courthouse 27,310 23,940 20,420
Certificates of Participation - Traffic Tribunal Court Complex 11,320 10,085 8,805
Certificates of Participation - Training School 27,835 24,895 21,835
Certificates of Participation - Information Technology 31,255 27,725 24,030
Certificates of Participation - School for the Deaf 21,495 20,165 18,775
Certificates of Participation - CCRI Energy Conservation 2,955 2,250 1,525
Certificates of Participation - DOA Energy Conservation 32,555 27,090 21,395
Certificates of Participation - URI Energy Conservation 11,780 9,660 7,370
Certificates of Participation - RIC Energy Conservation 7,465 7,125 6,755
Projected Certficates of Participation - Information Technology - 16,200 14,912
Projected Certificates of Participation - Nursing Education Center - 10,500 9,665
Projected Certificates of Participation - Energy Efficiency - OER - 12,000 10,912
Projected Certificates of Participation - CAD Cells - 10,500 9,665
Projected Certficates of Participation - URI Energy Conservation - 11,600 11,062
Loan Agreement - Historic Structures Tax Credit Fund 80,225 51,995 43,905
Projected Loan Agreement - Historic Structures Tax Credit Fund - 75,000 68,057
Loan Agreement - Divison of Motor Vehicle System - - -
RIHMFC Neighborhood Opportunities Housing Program - - - Subtotal 590,337 648,062 574,903
Performance Based Agreements
Economic Development Corporation- Fidelity Building 8,353 6,519 4,530
Economic Development Corporation- Fidelity Building II 6,707 6,230 5,718
Economic Development Corporation- Fleet Bank 6,525 6,070 5,580Subtotal 21,585 18,819 15,828
Gross Debt 1,707,802 1,941,706 1,866,442
Less: Adjustments for Agency Payments (1) (8,029) (6,599) (5,086)
Net Tax Supported Debt 1,699,773 1,935,107 1,861,356
Debt Ratios
Personal Income 55,225,466 57,450,055 59,921,947 Debt as a percent of Personal Income 3.08% 3.37% 3.11%
(1) As of FY 2017, the State anticipates it will be responsible for 100% of the Fidelity II debt service payments and thus is no longer
adjusting these costs from the calculation of Net Tax Supported Debt.
A-1

Appendix A - Tax Supported Debt and Other Obligations
Obligations Obligations Obligations
June 30,2020 June 30,2021 June 30,2022
Direct Debt:
Proposed General Obligation Bond Issuance 460,339 544,453 566,686
Variable Rate Bonds
Various purpose bonds 756,865 674,395 592,875
Subtotal 1,217,204 1,218,848 1,159,561
Other Debt Subject to Annual Appropriation:
RI Refunding Bond Authority - Public Buildings Lease Rental Bonds - - -
Convention Center Authority 157,430 143,080 127,995
Economic Development Corporation - Transportation (Motor Fuel) 36,015 31,000 25,745
Economic Development Corporation - Masonic Temple - - -
Economic Development Corporation - URI Power Plant - - -
Economic Development Corporation - McCoy Stadium - - -
Economic Development Corporation - Job Creation Guaranty 11,830 - -
Projected Economic Development Corporation - I-195 Land Sale 35,440 33,780 31,990
Certificates of Participation - Equipment/Vehicle Leases - - -
Certificates of Participation - Intake Center - - -
Certificates of Participation - Attorney General - - -
Certificates of Participation - DLT Howard Complex - - -
Certificates of Participation - Shepard's Building (originally EDC) - - -
Certificates of Participation - Pastore Center Power Plant 2,205 - -
Certificates of Participation - Kent County Courthouse 16,735 12,860 8,785
Certificates of Participation - Traffic Tribunal Court Complex 7,480 6,110 4,690
Certificates of Participation - Training School 18,635 15,270 11,730
Certificates of Participation - Information Technology 20,150 16,085 11,820
Certificates of Participation - School for the Deaf 17,320 15,775 14,135
Certificates of Participation - CCRI Energy Conservation 775 - -
Certificates of Participation - DOA Energy Conservation 15,430 10,830 6,915
Certificates of Participation - URI Energy Conservation 4,905 2,980 2,515
Certificates of Participation - RIC Energy Conservation 6,350 5,910 5,435
Projected Certficates of Participation - Information Technology 13,560 12,140 10,649
Projected Certificates of Participation - Nursing Education Center 8,789 7,868 6,902
Projected Certificates of Participation - Energy Efficiency - OER 9,769 8,569 7,309
Projected Certificates of Participation - CAD Cells 8,789 7,868 6,902
Projected Certficates of Participation - URI Energy Conservation 10,498 9,905 9,283
Loan Agreement - Historic Structures Tax Credit Fund 35,595 27,055 18,280
Projected Loan Agreement - Historic Structures Tax Credit Fund 60,801 53,219 45,296
Loan Agreement - Divison of Motor Vehicle System - - -
RIHMFC Neighborhood Opportunities Housing Program - - - Subtotal 498,501 420,304 356,376
Performance Based Agreements
Economic Development Corporation- Fidelity Building 2,374 - -
Economic Development Corporation- Fidelity Building II 5,167 4,577 3,943
Economic Development Corporation- Fleet Bank 5,050 4,480 3,865Subtotal 12,591 9,057 7,808
Gross Debt 1,728,296 1,648,209 1,523,745
Less: Adjustments for Agency Payments (3,490) (3,096) (2,671)
Net Tax Supported Debt 1,724,806 1,645,113 1,521,074
Debt Ratios
Personal Income 62,482,183 65,034,003 67,705,185 Debt as a percent of Personal Income 2.76% 2.53% 2.25%
A-2
Appendix B Outstanding Debt and
Debt Ratios


Appendix B - Projected Unamortized Principal
Unamortized Principal Outstanding
General RI Refunding Fiscal Obligation 1998 1999 Projected 2000 BondYear Bonds G.O.Variable Rate G.O.Variable Rate G.O.Variable Rate Authority Loan
1996 740,343,295 - - - 6,635,000 1997 774,622,173 - - - 5,275,000 1998 731,132,699 36,500,000 - - 3,940,000 1999 753,543,576 36,500,000 - - 2,615,000 2000 816,268,021 32,400,000 32,390,000 - 1,955,000 2001 822,484,778 - - 31,365,000 1,300,000 2002 654,878,581 - - 28,165,000 650,000 2003 694,933,495 - - 27,965,000 - 2004 737,771,665 - - 24,865,000 - 2005 778,250,422 - - 22,665,000 - 2006 822,881,179 - - 19,665,000 - 2007 897,118,526 - - 16,365,000 - 2008 982,922,740 - - 14,165,000 - 2009 1,036,189,000 - - - - 2010 1,118,030,000 - - - - 2011 1,049,400,000 - - - - 2012 1,110,585,000 - - - - 2013 1,119,450,000 - - - - 2014 1,103,945,000 - - - - 2015 1,022,895,000 - - - - 2016 1,051,810,000 - - - - 2017 1,003,880,000 - - - - 2018 923,885,000 - - - - 2019 842,730,000 - - - - 2020 756,865,000 - - - - 2021 674,395,000 - - - - 2022 592,875,000 - - - - 2023 514,995,000 - - - - 2024 436,810,000 - - - - 2025 363,025,000 - - - - 2026 286,285,000 - - - -
2027 221,495,000 - - - - 2028 170,605,000 - - - - 2029 134,545,000 - - - - 2030 96,860,000 - - - - 2031 70,020,000 - - - - 2032 41,915,000 - - - - 2033 24,685,000 - - - - 2034 12,915,000 - - - - 2035 4,805,000 - - - - 2036 - - - - - 2037 - - - - - 2038 - - - - - 2039 - - - - - 2040 - - - - -
B-1

Appendix B - Projected Unamortized Principal
Unamortized Principal Outstanding
RI Refunding Intake Center Attorney General Shepard's Building MasterFiscal Bond Certificates Certificates Certificates Equipment Year (Public Bldgs) of Participation of Participation of Participation Lease
1996 215,870,000 27,040,000 4,500,000 33,680,000 1,005,000 1997 202,750,000 28,185,000 4,360,000 33,265,000 190,000 1998 184,405,000 26,895,000 4,215,000 33,620,000 - 1999 171,640,000 25,160,000 4,065,000 32,535,000 - 2000 159,210,000 23,355,000 3,905,000 31,400,000 - 2001 146,055,000 21,470,000 3,740,000 30,215,000 - 2002 132,440,000 19,500,000 2,795,000 28,820,000 - 2003 100,705,000 17,440,000 2,795,000 27,655,000 - 2004 84,730,000 15,285,000 2,795,000 26,410,000 - 2005 74,615,000 13,025,000 2,795,000 25,080,000 - 2006 60,320,000 10,655,000 2,795,000 23,655,000 - 2007 42,710,000 8,160,000 2,575,000 22,135,000 - 2008 24,235,000 5,535,000 2,230,000 20,980,000 - 2009 6,040,000 2,775,000 2,030,000 19,155,000 - 2010 - - 1,745,000 17,245,000 - 2011 - - 1,450,000 15,220,000 - 2012 - - 1,145,000 13,060,000 - 2013 - - 830,000 10,765,000 - 2014 - - 505,000 8,320,000 - 2015 - - 170,000 5,710,000 - 2016 - - - 2,940,000 - 2017 - - - - - 2018 - - - - - 2019 - - - - - 2020 - - - - - 2021 - - - - - 2022 - - - - - 2023 - - - - - 2024 - - - - - 2025 - - - - - 2026 - - - - -
2027 - - - - - 2028 - - - - - 2029 - - - - - 2030 - - - - - 2031 - - - - - 2032 - - - - - 2033 - - - - - 2034 - - - - - 2035 - - - - - 2036 - - - - - 2037 - - - - - 2038 - - - - - 2039 - - - - - 2040 - - - - -
B-2

Appendix B - Projected Unamortized Principal
Unamortized Principal Outstanding
Depositors' Narragansett Ref Bond Convention DLTFiscal Protection Bay Auth-Narr. Center Howard CenterYear Corporation Commission Bay Comm. Authority Building
1996 320,725,000 24,908,063 110,000 347,080,000 - 1997 312,725,000 23,906,949 90,000 341,880,000 24,000,0001998 196,420,000 22,634,668 75,000 335,970,000 24,000,0001999 107,990,000 21,387,552 60,000 329,665,000 24,000,0002000 41,725,000 19,869,173 45,000 322,930,000 23,150,0002001 - 18,459,191 30,000 315,805,000 22,265,0002002 - 15,018,911 15,000 319,435,000 21,335,0002003 - 13,118,982 - 310,005,000 20,365,0002004 - 11,265,823 - 302,320,000 19,345,0002005 - - - 202,855,000 18,275,0002006 - - - 287,185,000 17,150,0002007 - - - 279,935,000 15,970,0002008 - - - 270,960,000 13,375,0002009 - - - 275,810,000 12,630,0002010 - - - 268,280,000 11,200,0002011 - - - 259,620,000 9,695,0002012 - - - 250,510,000 8,115,0002013 - - - 236,960,000 6,455,0002014 - - - 226,900,000 4,705,0002015 - - - 215,210,000 2,865,0002016 - - - 203,880,000 930,0002017 - - - 192,440,000 - 2018 - - - 181,330,000 - 2019 - - - 169,670,000 - 2020 - - - 157,430,000 - 2021 - - - 143,080,000 - 2022 - - - 127,995,000 - 2023 - - - 114,255,000 - 2024 - - - 97,770,000 - 2025 - - - 80,400,000 - 2026 - - - 62,100,000 -
2027 - - - 42,785,000 - 2028 - - - 38,470,000 - 2029 - - - 33,895,000 - 2030 - - - 29,045,000 - 2031 - - - 23,900,000 - 2032 - - - 18,440,000 - 2033 - - - 12,650,000 - 2034 - - - 6,510,000 - 2035 - - - - - 2036 - - - - - 2037 - - - - - 2038 - - - - - 2039 - - - - - 2040 - - - - -
B-3

Appendix B - Projected Unamortized Principal
Unamortized Principal Outstanding
Fiscal URI Power Pastore Center Pastore Center E-911 Center GeneralYear Plant Power Plant Telecom. Phase 1 (DLT)Furniture
1996 - - - - - 1997 - - - - - 1998 - - - - - 1999 16,395,000 - - - - 2000 16,395,000 - 3,500,000 1,398,000 1,550,000 2001 15,859,000 28,180,000 2,800,000 1,110,000 1,240,000 2002 15,304,000 23,440,000 2,100,000 830,000 930,000 2003 14,729,000 23,440,000 1,400,000 550,000 620,000 2004 14,134,000 23,440,000 700,000 275,000 310,000 2005 13,514,000 23,440,000 - - - 2006 12,869,000 23,440,000 - - - 2007 12,194,000 22,360,000 - - - 2008 11,494,000 22,160,000 - - - 2009 10,759,000 21,035,000 - - - 2010 9,995,000 19,650,000 - - - 2011 9,195,000 18,220,000 - - - 2012 8,360,000 16,735,000 - - - 2013 7,485,000 15,185,000 - - - 2014 6,565,000 13,580,000 - - - 2015 5,600,000 11,905,000 - - - 2016 4,585,000 10,145,000 - - - 2017 3,520,000 8,295,000 - - - 2018 2,405,000 6,355,000 - - - 2019 1,230,000 4,325,000 - - - 2020 - 2,205,000 - - - 2021 - - - - - 2022 - - - - - 2023 - - - - - 2024 - - - - - 2025 - - - - - 2026 - - - - -
2027 - - - - - 2028 - - - - - 2029 - - - - - 2030 - - - - - 2031 - - - - - 2032 - - - - - 2033 - - - - - 2034 - - - - - 2035 - - - - - 2036 - - - - - 2037 - - - - - 2038 - - - - - 2039 - - - - - 2040 - - - - -
B-4

Appendix B - Projected Unamortized Principal
Unamortized Principal Outstanding
Fiscal NOP/ Information Kent County Training Traffic Year Travelers Aid Technology Courthouse School Tribunal
1996 - - - - - 1997 - - - - - 1998 - - - - - 1999 - - - - - 2000 - - - - - 2001 - - - - - 2002 12,550,000 - - - - 2003 12,550,000 - - - - 2004 12,550,000 - - - 2005 13,060,000 - 58,910,000 51,985,000 21,565,000 2006 18,754,000 - 56,685,000 51,985,000 21,565,000 2007 15,502,000 23,490,000 54,405,000 50,205,000 20,765,000 2008 18,152,000 21,000,000 52,075,000 48,370,000 19,940,000 2009 13,179,000 30,500,000 49,690,000 46,470,000 19,090,000 2010 8,450,000 25,935,000 47,240,000 44,500,000 18,215,000 2011 3,485,000 21,390,000 44,715,000 42,450,000 17,310,000 2012 - 16,795,000 42,110,000 40,290,000 16,380,000 2013 - 21,480,000 36,310,000 36,575,000 15,290,000 2014 - 16,890,000 33,180,000 33,825,000 14,115,000 2015 - 42,865,000 31,875,000 32,270,000 13,320,000 2016 - 36,195,000 30,515,000 30,655,000 12,510,000 2017 - 31,255,000 27,310,000 27,835,000 11,320,000 2018 - 27,725,000 23,940,000 24,895,000 10,085,000 2019 - 24,030,000 20,420,000 21,835,000 8,805,000 2020 - 20,150,000 16,735,000 18,635,000 7,480,000 2021 - 16,085,000 12,860,000 15,270,000 6,110,000 2022 - 11,820,000 8,785,000 11,730,000 4,690,000 2023 - 7,335,000 4,500,000 8,010,000 3,200,000 2024 - 3,760,000 - 4,105,000 1,635,000 2025 - - - - - 2026 - - - - -
2027 - - - - - 2028 - - - - - 2029 - - - - - 2030 - - - - - 2031 - - - - - 2032 - - - - - 2033 - - - - - 2034 - - - - - 2035 - - - - - 2036 - - - - - 2037 - - - - - 2038 - - - - - 2039 - - - - - 2040 - - - - -
B-5

Appendix B - Projected Unamortized Principal
Unamortized Principal Outstanding
Fiscal Masonic URI Energy DOA Energy CCRI Energy Vehicles/Year Temple HSTC Conservation Conservation Conservation Rolling Stock
1996 - - - - - 1997 - - - - - 1998 - - - - - 1999 - - - - - 2000 - - - - 3,395,000 2001 - - - - 5,865,000 2002 - - - - 4,135,000 2003 - - - - 6,295,000 2004 - - - - 3,895,000 2005 - - - - 9,505,000 2006 - - - - 13,580,000 2007 14,280,000 6,735,000 6,000,000 - 19,790,000 2008 9,775,000 6,735,000 6,000,000 - 14,395,000 2009 5,030,000 18,090,000 5,830,000 - 9,400,000 2010 - 17,385,000 5,635,000 - 5,425,000 2011 - 16,205,000 5,415,000 - 3,505,000 2012 - 20,400,000 23,645,000 6,145,000 1,570,000 2013 - 18,905,000 38,915,000 5,540,000 405,000 2014 - 17,305,000 35,060,000 4,925,000 - 2015 - 15,590,000 42,800,000 4,290,000 - 2016 - 13,750,000 37,785,000 3,635,000 - 2017 - 11,780,000 32,555,000 2,955,000 - 2018 - 9,660,000 27,090,000 2,250,000 - 2019 - 7,370,000 21,395,000 1,525,000 - 2020 - 4,905,000 15,430,000 775,000 - 2021 - 2,980,000 10,830,000 - - 2022 - 2,515,000 6,915,000 - - 2023 - 1,990,000 2,775,000 - - 2024 - 1,400,000 1,415,000 - - 2025 - 740,000 - - - 2026 - - - - -
2027 - - - - - 2028 - - - - - 2029 - - - - - 2030 - - - - - 2031 - - - - - 2032 - - - - - 2033 - - - - - 2034 - - - - - 2035 - - - - - 2036 - - - - - 2037 - - - - - 2038 - - - - - 2039 - - - - - 2040 - - - - -
B-6

Appendix B - Projected Unamortized Principal
Unamortized Principal Outstanding
Fiscal Division of Motor Motor Fuel School for the Historic Structures I-195Year Vehicles IT System Transportation Deaf Tax Credit Fund Land Purchase
1996 - - - - - 1997 - - - - - 1998 - - - - - 1999 - - - - - 2000 - - - - - 2001 - - - - - 2002 - - - - - 2003 - - - - - 2004 - 47,405,000 - - - 2005 - 42,255,000 - - - 2006 - 79,920,000 - - - 2007 - 76,290,000 - - - 2008 - 72,560,000 - - - 2009 - 81,125,000 30,425,000 150,000,000 - 2010 11,000,000 77,645,000 29,500,000 135,195,000 - 2011 9,615,000 74,060,000 28,470,000 120,820,000 - 2012 8,175,000 70,350,000 27,410,000 105,990,000 - 2013 6,675,000 66,510,000 26,320,000 90,575,000 38,400,000 2014 5,110,000 62,525,000 25,185,000 74,400,000 38,400,000 2015 3,075,000 58,340,000 24,005,000 132,390,000 38,400,000 2016 - 53,965,000 22,775,000 106,995,000 38,400,000 2017 - 49,765,000 21,495,000 80,225,000 38,400,000 2018 - 45,375,000 20,165,000 51,995,000 38,400,000 2019 - 40,800,000 18,775,000 43,905,000 36,980,000 2020 - 36,015,000 17,320,000 35,595,000 35,440,000 2021 - 31,000,000 15,775,000 27,055,000 33,780,000 2022 - 25,745,000 14,135,000 18,280,000 31,990,000 2023 - 20,230,000 12,415,000 9,265,000 - 2024 - 14,450,000 10,605,000 - - 2025 - 8,840,000 8,700,000 - - 2026 - 2,935,000 6,695,000 - -
2027 - - 4,580,000 - - 2028 - - 2,350,000 - - 2029 - - - - - 2030 - - - - - 2031 - - - - - 2032 - - - - - 2033 - - - - - 2034 - - - - - 2035 - - - - - 2036 - - - - - 2037 - - - - - 2038 - - - - - 2039 - - - - - 2040 - - - - -
B-7

Appendix B - Projected Unamortized Principal
Unamortized Principal Outstanding
Rhode Island Economic Development CorporationFiscal Central Falls Alpha Beta Collaborative McCoy EDC Job CreationYear Detention Center Stadium Guaranty Program
1996 29,574,000 29,700,000 - - - 1997 29,274,000 29,380,000 - - - 1998 28,949,000 29,040,000 - 11,825,000 - 1999 - 28,675,000 - 11,105,000 - 2000 - - 25,000,000 10,360,000 - 2001 - - 25,000,000 9,585,000 - 2002 - - 25,000,000 8,780,000 - 2003 - - 25,000,000 7,945,000 - 2004 - - 25,000,000 7,080,000 - 2005 - - 24,541,822 6,180,000 - 2006 - - - 5,245,000 - 2007 - - - 4,275,000 - 2008 - - - 3,265,000 - 2009 - - - 2,220,000 - 2010 - - - 1,130,000 - 2011 - - - - 75,000,000 2012 - - - - 75,000,000 2013 - - - - 81,500,000 2014 - - - - 73,576,667 2015 - - - - 64,514,845 2016 - - - - 53,381,667 2017 - - - - 43,721,667 2018 - - - - 33,466,667 2019 - - - - 22,810,000 2020 - - - - 11,830,000 2021 - - - - - 2022 - - - - - 2023 - - - - - 2024 - - - - - 2025 - - - - - 2026 - - - - -
2027 - - - - - 2028 - - - - - 2029 - - - - - 2030 - - - - - 2031 - - - - - 2032 - - - - - 2033 - - - - - 2034 - - - - - 2035 - - - - - 2036 - - - - - 2037 - - - - - 2038 - - - - - 2039 - - - - - 2040 - - - - -
B-8

Appendix B - Projected Unamortized Principal
Projected Unamortized Principal Outstanding
Outstanding Projected Projected Projected Fiscal RIC Energy Projected Office of Nursing Education CAD CellsYear Conservation G.O.Issuance Energy Resources Center Equipment CRMC
1996 - - - 1997 - - - - - 1998 - - - - - 1999 - - - - - 2000 - - - - - 2001 - - - - - 2002 - - - - - 2003 - - - - - 2004 - - - - - 2005 - - - - - 2006 - - - - - 2007 - - - - - 2008 - - - - - 2009 - - - - - 2010 - - - - - 2011 - - - - - 2012 - - - - - 2013 - - - - - 2014 - - - - - 2015 7,465,000 - - - - 2016 7,465,000 - - - - 2017 7,465,000 92,000,000 - - - 2018 7,125,000 350,940,000 12,000,000 10,500,000 10,500,000 2019 6,755,000 432,980,624 10,911,719 9,665,202 9,665,202 2020 6,350,000 460,339,148 9,769,024 8,788,664 8,788,664 2021 5,910,000 544,453,228 8,569,194 7,868,299 7,868,299 2022 5,435,000 566,686,345 7,309,373 6,901,916 6,901,916 2023 4,915,000 585,130,648 5,986,561 5,887,214 5,887,214 2024 4,355,000 601,412,037 4,597,608 4,821,777 4,821,777 2025 3,750,000 615,423,189 - 3,703,067 3,703,067 2026 3,100,000 627,051,449 - 2,528,423 2,528,423
2027 2,400,000 636,178,570 - 1,295,046 1,295,046 2028 1,650,000 642,680,433 - - - 2029 850,000 646,426,753 - - - 2030 - 647,280,778 - - - 2031 - 645,098,963 - - - 2032 - 639,730,633 - - - 2033 - 631,017,630 - - - 2034 - 618,793,942 - - - 2035 - 602,885,310 - - - 2036 - 583,108,820 - - - 2037 - 559,272,472 - - - 2038 - 538,072,231 - - - 2039 - 523,492,607 - - - 2040 - 515,480,058 - - -
-
B-9

Appendix B - Projected Unamortized Principal
Projected Projected Fiscal URI Energy Projected Historic StructuresYear Conservation Information Technology Projects Tax Credit Fund
1996 - 1997 - - - 1998 - - - 1999 - - - 2000 - - - 2001 - - - 2002 - - - 2003 - - - 2004 - - - 2005 - - - 2006 - - - 2007 - - - 2008 - - - 2009 - - - 2010 - - - 2011 - - - 2012 - - - 2013 - - - 2014 - - - 2015 - - - 2016 - - - 2017 - - - 2018 11,600,000 16,200,000 75,000,000 2019 11,062,429 14,912,026 68,056,915 2020 10,497,980 13,559,653 60,801,391 2021 9,905,309 12,139,662 53,219,368 2022 9,283,004 10,648,671 45,296,154 2023 8,629,583 9,083,130 37,016,396 2024 7,943,492 7,439,312 28,364,049 2025 7,223,096 5,713,304 19,322,345 2026 6,466,680 3,900,995 9,873,766
2027 5,672,444 1,998,071 - 2028 4,838,496 - - 2029 3,962,850 - - 2030 3,043,422 - - 2031 2,078,022 - - 2032 1,064,353 - - 2033 - - - 2034 - - - 2035 - - - 2036 - - - 2037 - - - 2038 - - - 2039 - - - 2040 - - -
Projected Unamortized Principal Outstanding
B-10

Appendix B - Projected Unamortized Principal
Projected Net Tax Supported Debt and Other Obligations - (Excluding Performance Based Agreements)
Total All Outstanding Adjustment Total All Unamortized Fiscal and Projected for Agency Principal OutstandingYear Unamortized Principal Payments* and Projected
1996 1,781,168,360 (115,292,063) 1,665,876,297 1997 1,809,901,123 (113,650,949) 1,696,250,174 1998 1,669,619,367 (80,698,668) 1,588,920,699 1999 1,565,334,127 (37,842,552) 1,527,491,575 2000 1,570,198,192 (61,309,173) 1,508,889,019 2001 1,502,825,966 (59,348,191) 1,443,477,775 2002 1,316,119,488 (55,337,911) 1,260,781,577 2003 1,307,509,472 (52,847,982) 1,254,661,490 2004 1,359,574,482 (50,399,823) 1,309,174,659 2005 1,402,514,237 (38,055,822) 1,364,458,415 2006 1,528,347,171 (12,869,000) 1,515,478,171 2007 1,611,257,517 (12,194,000) 1,599,063,517 2008 1,640,321,730 (11,494,000) 1,628,827,730 2009 1,847,469,989 (10,759,000) 1,836,710,989 2010 1,873,397,988 (9,995,000) 1,863,402,988 2011 1,825,237,987 (9,195,000) 1,816,042,987 2012 1,862,767,986 (8,360,000) 1,854,407,986 2013 1,880,527,985 (7,485,000) 1,873,042,985 2014 1,799,014,651 (6,565,000) 1,792,449,651 2015 1,775,552,828 (5,600,000) 1,769,952,828 2016 1,722,314,649 (4,585,000) 1,717,729,649 2017 1,686,214,648 (3,520,000) 1,682,694,648 2018 1,922,884,646 (2,405,000) 1,920,479,646 2019 1,850,612,096 (1,230,000) 1,849,382,096 2020 1,715,702,502 - 1,715,702,502 2021 1,639,151,336 - 1,639,151,336 2022 1,515,935,355 - 1,515,935,355 2023 1,361,503,721 - 1,361,503,721 2024 1,235,703,025 - 1,235,703,025 2025 1,120,541,042 - 1,120,541,042 2026 1,013,462,707 - 1,013,462,707
2027 917,697,147 - 917,697,147 2028 860,591,898 - 860,591,898 2029 819,677,572 - 819,677,572 2030 776,227,168 - 776,227,168 2031 741,094,952 - 741,094,952 2032 701,147,952 - 701,147,952 2033 668,350,595 - 668,350,595 2034 638,216,906 - 638,216,906 2035 607,688,273 - 607,688,273 2036 583,106,782 - 583,106,782 2037 559,270,433 - 559,270,433 2038 538,070,191 - 538,070,191 2039 523,490,566 - 523,490,566 2040 515,482,098 - 515,482,098
B-11

Appendix B - Projected Unamortized Principal
Performance Based Agreements *
Rhode Island Economic Development CorporationFiscal Fidelity I Fidelity II Fleet Total Year Performance Based
1996 25,000,000 - - 25,000,000 1997 25,000,000 - - 25,000,000 1998 25,000,000 - 11,000,000 36,000,000 1999 25,000,000 - 10,890,000 35,890,000 2000 24,579,000 - 10,770,000 35,349,000 2001 24,116,000 - 10,640,000 34,756,000 2002 23,615,000 10,000,000 10,500,000 44,115,000 2003 23,071,240 10,000,000 10,350,000 43,421,240 2004 22,486,634 10,000,000 10,190,000 42,676,634 2005 21,847,451 10,000,000 10,015,000 41,862,451 2006 21,154,249 10,000,000 9,830,000 40,984,249 2007 20,402,462 10,000,000 9,630,000 40,032,462 2008 19,591,677 9,765,782 9,415,000 38,772,459 2009 18,707,829 9,514,298 9,180,000 37,402,127 2010 17,749,284 9,244,279 8,925,000 35,918,563 2011 16,709,729 8,954,357 8,655,000 34,319,086 2012 15,585,984 8,643,065 8,360,000 32,589,049 2013 14,363,600 8,308,827 8,045,000 30,717,427 2014 13,037,909 7,949,953 7,710,000 28,697,862 2015 11,600,179 7,564,626 7,345,000 26,509,805 2016 10,043,400 7,150,896 6,950,000 24,144,296 2017 8,352,592 6,706,670 6,525,000 21,584,262 2018 6,518,887 6,229,700 6,070,000 18,818,587 2019 4,530,209 5,717,572 5,580,000 15,827,781 2020 2,374,248 5,167,695 5,050,000 12,591,943 2021 - 4,577,285 4,480,000 9,057,285 2022 - 3,943,357 3,865,000 7,808,357 2023 - 3,262,702 3,205,000 6,467,702 2024 - 2,531,875 2,490,000 5,021,875 2025 - 1,747,178 1,720,000 3,467,178 2026 - 904,641 895,000 1,799,641
2027 - - - - 2028 - - - - 2029 - - - - 2030 - - - - 2031 - - - - 2032 - - - - 2033 - - - - 2034 - - - - 2035 - - - - 2036 - - - - 2037 - - - - 2038 - - - - 2039 - - - - 2040 - - - -
B-12

Appendix B - Projected Unamortized Principal
Projected Net Tax Supported Debt and Other Obligations - (Including Performance Based Agreements)
Total All Outstanding Adjustment Total All Unamortized Fiscal and Projected for Agency Principal OutstandingYear Unamortized Principal Payments* and Projected
1996 1,806,168,360 (115,292,063) 1,690,876,297 1997 1,834,901,123 (113,650,949) 1,721,250,174 1998 1,705,619,367 (88,299,668) 1,617,319,699 1999 1,601,224,127 (45,367,542) 1,555,856,585 2000 1,605,547,192 (68,751,243) 1,536,795,949 2001 1,537,581,966 (66,700,431) 1,470,881,535 2002 1,360,234,488 (72,593,411) 1,287,641,077 2003 1,350,930,712 (69,999,832) 1,280,930,880 2004 1,402,251,116 (67,441,113) 1,334,810,003 2005 1,444,376,688 (54,976,187) 1,389,400,501 2006 1,569,331,420 (29,661,530) 1,539,669,890 2007 1,651,289,979 (28,848,330) 1,622,441,649 2008 1,679,094,189 (27,765,547) 1,651,328,642 2009 1,884,872,116 (26,616,678) 1,858,255,438 2010 1,909,316,551 (25,406,454) 1,883,910,097 2011 1,859,557,073 (24,129,962) 1,835,427,111 2012 1,895,357,035 (22,779,825) 1,872,577,210 2013 1,911,245,412 (21,352,922) 1,889,892,490 2014 1,827,712,513 (12,012,610) 1,815,699,903 2015 1,802,062,633 (10,795,395) 1,791,267,238 2016 1,746,458,945 (9,507,450) 1,736,951,495 2017 1,707,798,910 (8,028,775) 1,699,770,135 2018 1,941,703,233 (6,599,370) 1,935,103,863 2019 1,866,439,877 (5,085,780) 1,861,354,097 2020 1,728,294,445 (3,489,550) 1,724,804,895 2021 1,648,208,621 (3,095,680) 1,645,112,941 2022 1,523,743,712 (2,670,715) 1,521,072,997 2023 1,367,971,423 (2,214,655) 1,365,756,768 2024 1,240,724,900 (1,720,590) 1,239,004,310 2025 1,124,008,220 (1,188,520) 1,122,819,700 2026 1,015,262,348 (618,445) 1,014,643,903
2027 917,697,147 - 917,697,147 2028 860,591,898 - 860,591,898 2029 819,677,572 - 819,677,572 2030 776,227,168 - 776,227,168 2031 741,094,952 - 741,094,952 2032 701,147,952 - 701,147,952 2033 668,350,595 - 668,350,595 2034 638,216,906 - 638,216,906 2035 607,688,273 - 607,688,273 2036 583,106,782 - 583,106,782 2037 559,270,433 - 559,270,433 2038 538,070,191 - 538,070,191 2039 523,490,566 - 523,490,566 2040 515,482,098 - 515,482,098
B-13

Appendix B
Debt Service as a Percent of General Revenues
Fiscal General Dedicated Adjusted General Net Tax Supported
Year Revenues(1) Gas Tax(2) Revenues Debt Service Debt Ratio
2017 3,719,386,118 152,380,620 3,871,766,738 201,098,738 5.19%2018 3,832,136,714 152,234,732 3,984,371,446 231,262,786 5.80%2019 3,902,276,691 151,255,910 4,053,532,601 234,018,655 5.77%2020 3,984,615,267 153,989,715 4,138,604,982 255,462,785 6.17%2021 4,065,849,469 151,739,837 4,217,589,306 254,750,073 6.04%2022 4,151,188,865 153,656,130 4,304,844,995 237,934,292 5.53%
(1) Reflects general revenues as recommended for FY 2017, and estimates contained in the Five Year Forecast.. (2) Reflects estimated yield on gas tax dedicated to transportation purposes, as proposed in the Governor's FY2017 budget.
B-14
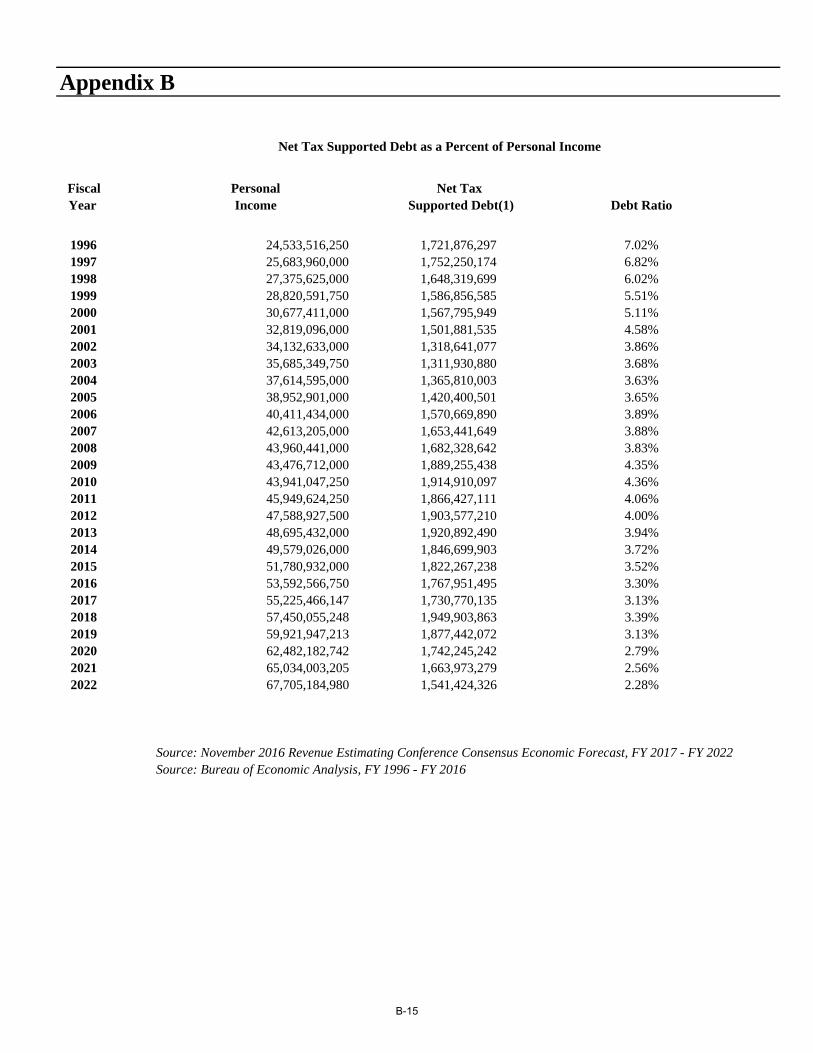
Appendix B
Net Tax Supported Debt as a Percent of Personal Income
Fiscal Personal Net Tax Year Income Supported Debt(1) Debt Ratio
1996 24,533,516,250 1,721,876,297 7.02%1997 25,683,960,000 1,752,250,174 6.82%1998 27,375,625,000 1,648,319,699 6.02%1999 28,820,591,750 1,586,856,585 5.51%2000 30,677,411,000 1,567,795,949 5.11%2001 32,819,096,000 1,501,881,535 4.58%2002 34,132,633,000 1,318,641,077 3.86%2003 35,685,349,750 1,311,930,880 3.68%2004 37,614,595,000 1,365,810,003 3.63%2005 38,952,901,000 1,420,400,501 3.65%2006 40,411,434,000 1,570,669,890 3.89%2007 42,613,205,000 1,653,441,649 3.88%2008 43,960,441,000 1,682,328,642 3.83%2009 43,476,712,000 1,889,255,438 4.35%2010 43,941,047,250 1,914,910,097 4.36%2011 45,949,624,250 1,866,427,111 4.06%2012 47,588,927,500 1,903,577,210 4.00%2013 48,695,432,000 1,920,892,490 3.94%2014 49,579,026,000 1,846,699,903 3.72%2015 51,780,932,000 1,822,267,238 3.52%2016 53,592,566,750 1,767,951,495 3.30%2017 55,225,466,147 1,730,770,135 3.13%2018 57,450,055,248 1,949,903,863 3.39%2019 59,921,947,213 1,877,442,072 3.13%2020 62,482,182,742 1,742,245,242 2.79%2021 65,034,003,205 1,663,973,279 2.56%2022 67,705,184,980 1,541,424,326 2.28%
Source: November 2016 Revenue Estimating Conference Consensus Economic Forecast, FY 2017 - FY 2022Source: Bureau of Economic Analysis, FY 1996 - FY 2016
B-15

Appendix C Debt Service Payable
By Issuer

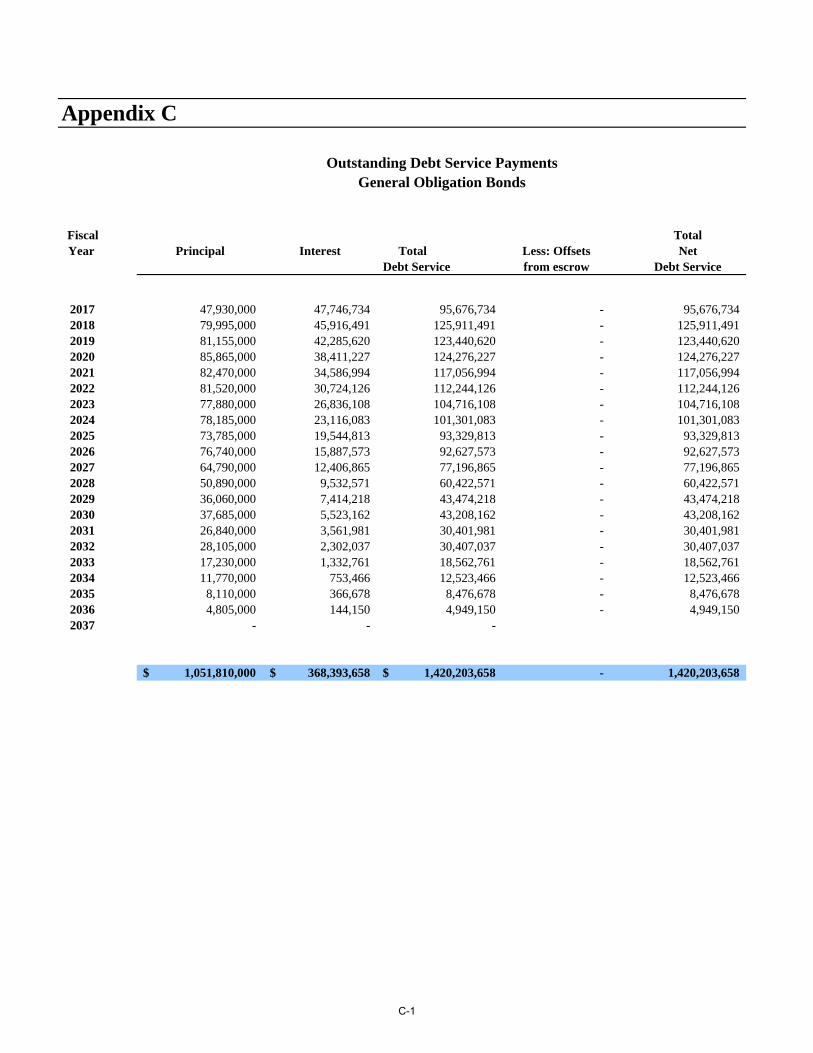
Appendix C
Fiscal TotalYear Principal Interest Total Less: Offsets Net
Debt Service from escrow Debt Service
2017 47,930,000 47,746,734 95,676,734 - 95,676,7342018 79,995,000 45,916,491 125,911,491 - 125,911,4912019 81,155,000 42,285,620 123,440,620 - 123,440,6202020 85,865,000 38,411,227 124,276,227 - 124,276,2272021 82,470,000 34,586,994 117,056,994 - 117,056,9942022 81,520,000 30,724,126 112,244,126 - 112,244,1262023 77,880,000 26,836,108 104,716,108 - 104,716,1082024 78,185,000 23,116,083 101,301,083 - 101,301,0832025 73,785,000 19,544,813 93,329,813 - 93,329,8132026 76,740,000 15,887,573 92,627,573 - 92,627,5732027 64,790,000 12,406,865 77,196,865 - 77,196,8652028 50,890,000 9,532,571 60,422,571 - 60,422,571 2029 36,060,000 7,414,218 43,474,218 - 43,474,218 2030 37,685,000 5,523,162 43,208,162 - 43,208,162 2031 26,840,000 3,561,981 30,401,981 - 30,401,981 2032 28,105,000 2,302,037 30,407,037 - 30,407,037 2033 17,230,000 1,332,761 18,562,761 - 18,562,761 2034 11,770,000 753,466 12,523,466 - 12,523,466 2035 8,110,000 366,678 8,476,678 - 8,476,678 2036 4,805,000 144,150 4,949,150 - 4,949,150 2037 - - -
1,051,810,000$ 368,393,658$ 1,420,203,658$ - 1,420,203,658
Outstanding Debt Service PaymentsGeneral Obligation Bonds
C-1

Appendix C
Outstanding Debt Service PaymentsShepard's Building - Certificates of Participation
Fiscal Principal Interest Total Net Year Debt Service
2017 2,940,000 73,500 3,013,5002018 - - - 2019 - - - 2020 - - - 2021 - - - 2022 - - - 2023 - - - 2024 - - - 2025 - - - 2026 - - - 2027 - - - 2028 - - - 2029 - - - 2030 - - - 2031 - - - 2032 - - -
2,940,000 73,500 3,013,500
C-2

Appendix C
Outstanding Debt Service Payments
Convention Center Authority
Total Net Less: (Offsets) Total NetFiscal Principal Interest Debt Service or Other Lease LeaseYear Payment Payments Payment
2017 11,440,000 11,024,563 22,464,563 - 22,464,5632018 11,110,000 10,463,465 21,573,465 - 21,573,4652019 11,660,000 9,905,776 21,565,776 - 21,565,7762020 12,240,000 9,312,244 21,552,244 - 21,552,2442021 14,350,000 8,693,083 23,043,083 - 23,043,0832022 15,085,000 7,949,512 23,034,512 - 23,034,5122023 13,740,000 7,164,001 20,904,001 - 20,904,0012024 16,485,000 6,534,485 23,019,485 - 23,019,4852025 17,370,000 5,642,386 23,012,386 - 23,012,3862026 18,300,000 4,702,225 23,002,225 - 23,002,2252027 19,315,000 3,675,373 22,990,373 - 22,990,3732028 4,315,000 2,591,477 6,906,477 - 6,906,4772029 4,575,000 2,331,282 6,906,282 - 6,906,282 2030 4,850,000 2,054,037 6,904,037 - 6,904,037 2031 5,145,000 1,760,127 6,905,127 - 6,905,127 2032 5,460,000 1,448,340 6,908,340 - 6,908,340 2033 5,790,000 1,117,464 6,907,464 - 6,907,464 2034 6,140,000 766,590 6,906,590 - 6,906,590 2035 6,510,000 394,506 6,904,506 - 6,904,506 2036 - - - - - 2037 - - - - -
203,880,000 97,530,934 301,410,934 - 301,410,934
C-3

Appendix C
Outstanding Debt Service Payments Center General Project - Certificates of Participation
Total Less: CapitalizedFiscal Principal Interest Projected Interest & Debt Net LeaseYear Lease Payment Service Reserve Payment
2017 930,000 17,437 947,437 - 947,437 2018 - - - - - 2019 - - - - - 2020 - - - - - 2021 - - - - - 2022 - - - - - 2023 - - - - - 2024 - - - - - 2025 - - - - - 2026 - - - - - 2027 - - - - - 2028 - - - - - 2029 - - - - - 2030 - - - - - 2031 - - - - - 2032 - - - - - 2033 - - - - -
930,000 17,437 947,437 - 947,437
A significant portion of these lease payments are funded by federal grants and other non-generalrevenue sources.
C-4

Appendix C
Outstanding Debt Service Payments Pastore Center - Power Plant Certificates of Participation
Fiscal Total Net
Year Principal (1) Interest Total Less: Debt Service
Debt Service Offsets Payment
2017 1,850,000 403,063 2,253,063 - 2,253,0632018 1,940,000 315,656 2,255,656 - 2,255,6562019 2,030,000 223,750 2,253,750 - 2,253,7502020 2,120,000 130,600 2,250,600 - 2,250,6002021 2,205,000 44,100 2,249,100 - 2,249,1002022 - - - - 02023 - - - - - 2024 - - - - - 2025 - - - - - 2026 - - - - - 2027 - - - - - 2028 - - - - - 2029 - - - - - 2030 - - - - - 2031 - - - - - 2032 - - - - -
10,145,000 1,117,169 11,262,169 - 11,262,169
(1) Reflects defeasance of $3,875,000 of COPS in June 2002.
C-5

Appendix C
Outstanding Debt Service Payments Kent Count Courthouse
Total
Fiscal Principal (1) Interest Projected Less: Offset Total NetYear Debt Service Debt Service
2017 3,205,000 1,410,425 4,615,425 - 4,615,4252018 3,370,000 1,246,050 4,616,050 - 4,616,0502019 3,520,000 1,091,400 4,611,400 - 4,611,4002020 3,685,000 928,875 4,613,875 - 4,613,8752021 3,875,000 739,875 4,614,875 - 4,614,8752022 4,075,000 541,125 4,616,125 - 4,616,1252023 4,285,000 332,125 4,617,125 - 4,617,1252024 4,500,000 112,500 4,612,500 - 4,612,5002025 - - - - 02026 - - - - - 2027 - - - - - 2028 - - - - - 2029 - - - - - 2030 - - - - - 2031 - - - - - 2032 - - - - - 2033 - - - - -
30,515,000 6,402,375 36,917,375 - 36,917,375
(1) Reflects refunding of COPS in April 2013.
C-6

Appendix C
Outstanding Debt Service PaymentsJuvenile Training School
Fiscal Principal (1) Interest Total Year Debt Service
2017 2,820,000 1,388,150 4,208,150 2018 2,940,000 1,272,950 4,212,950 2019 3,060,000 1,152,950 4,212,950 2020 3,200,000 1,011,750 4,211,750 2021 3,365,000 847,625 4,212,625 2022 3,540,000 675,000 4,215,000 2023 3,720,000 493,500 4,213,500 2024 3,905,000 302,875 4,207,875 2025 4,105,000 102,625 4,207,625 2026 - - - 2027 - - - 2028 - - - 2029 - - - 2030 - - - 2031 - - - 2032 - - - 2033 - - -
30,655,000 7,247,425 37,902,425
(1) Reflects refunding of COPS in April 2013.
C-7

Appendix C
Outstanding Debt Service PaymentsTraffic Tribunal Court Complex
Fiscal Principal (1) Interest Total Year Debt Service
2017 1,190,000 483,650 1,673,650 2018 1,235,000 441,100 1,676,100 2019 1,280,000 390,800 1,670,800 2020 1,325,000 345,325 1,670,325 2021 1,370,000 304,900 1,674,900 2022 1,420,000 250,475 1,670,475 2023 1,490,000 180,475 1,670,475 2024 1,565,000 113,050 1,678,050 2025 1,635,000 40,875 1,675,875 2026 - - - 2027 - - - 2028 - - - 2029 - - - 2030 - - - 2031 - - - 2032 - - - 2033 - - -
12,510,000 2,550,650 15,060,650
(1) Reflects refunding of COPS in April 2013.
C-8

Appendix C
Outstanding Debt ServiceSchool for the Deaf
Total
Fiscal Principal Interest Total Estimated Net
Year Debt Service Offsets Debt Service
2017 1,280,000 1,203,850 2,483,850 - 2,483,850 2018 1,330,000 1,149,450 2,479,450 - 2,479,450 2019 1,390,000 1,089,600 2,479,600 - 2,479,600 2020 1,455,000 1,025,313 2,480,313 - 2,480,313 2021 1,545,000 936,194 2,481,194 - 2,481,194 2022 1,640,000 841,563 2,481,563 - 2,481,563 2023 1,720,000 759,563 2,479,563 - 2,479,563 2024 1,810,000 673,563 2,483,563 - 2,483,563 2025 1,905,000 578,538 2,483,538 - 2,483,538 2026 2,005,000 476,144 2,481,144 - 2,481,144 2027 2,115,000 368,375 2,483,375 - 2,483,375 2028 2,230,000 252,050 2,482,050 - 2,482,050 2029 2,350,000 132,188 2,482,188 - 2,482,188 2030 - - - - - 2031 - - - - - 2032 - - - - - 2033 - - - - -
22,775,000 9,486,388 32,261,388 - 32,261,388
C-9
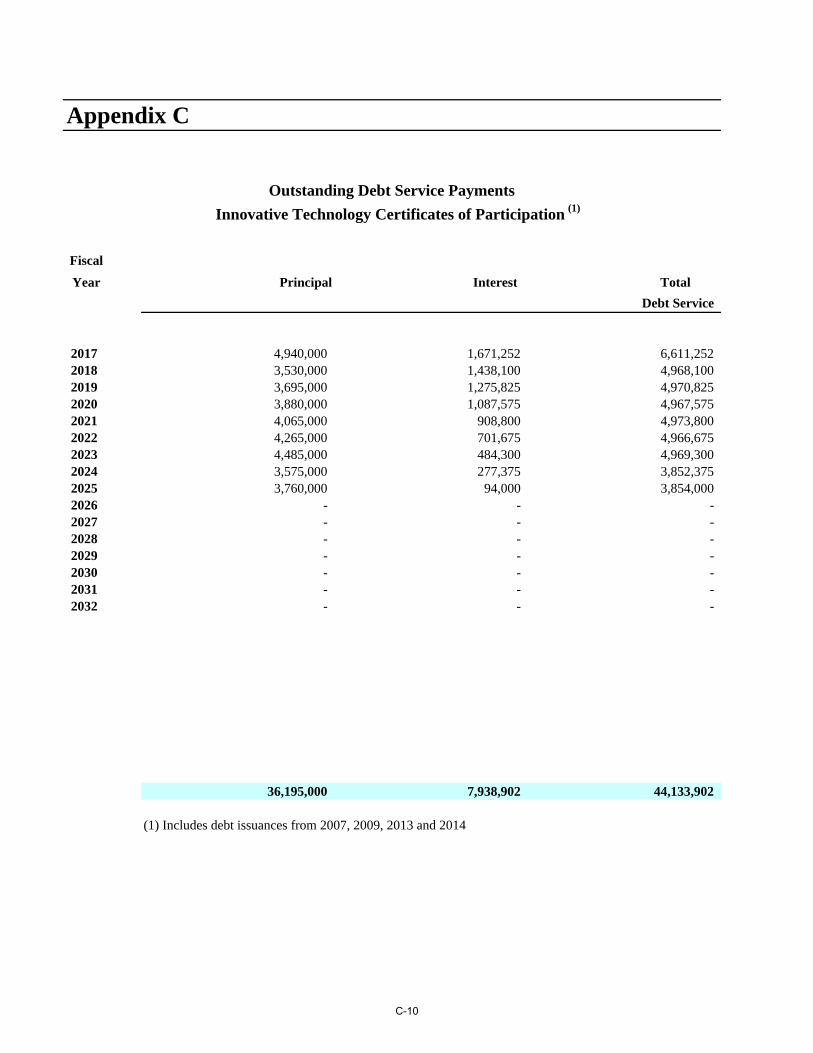
Appendix C
Outstanding Debt Service Payments
Innovative Technology Certificates of Participation (1)
Fiscal
Year Principal Interest Total
Debt Service
2017 4,940,000 1,671,252 6,611,252 2018 3,530,000 1,438,100 4,968,100 2019 3,695,000 1,275,825 4,970,825 2020 3,880,000 1,087,575 4,967,575 2021 4,065,000 908,800 4,973,800 2022 4,265,000 701,675 4,966,675 2023 4,485,000 484,300 4,969,300 2024 3,575,000 277,375 3,852,375 2025 3,760,000 94,000 3,854,000 2026 - - - 2027 - - - 2028 - - - 2029 - - - 2030 - - - 2031 - - - 2032 - - -
36,195,000 7,938,902 44,133,902
(1) Includes debt issuances from 2007, 2009, 2013 and 2014
C-10

Appendix C
Outstanding Debt Service Department of Administration Energy Conservation Equipment Leases
Total
Fiscal Principal Interest Total Estimated Net
Year Debt Service Offsets (1) Debt Service
2017 5,230,000 1,623,150 6,853,150 - 6,853,150 2018 5,465,000 1,406,913 6,871,913 - 6,871,913 2019 5,695,000 1,198,256 6,893,256 - 6,893,256 2020 5,965,000 956,281 6,921,281 - 6,921,281 2021 4,600,000 696,156 5,296,156 - 5,296,156 2022 3,915,000 478,075 4,393,075 - 4,393,075 2023 4,140,000 283,263 4,423,263 - 4,423,263 2024 1,360,000 91,150 1,451,150 - 1,451,150 2025 1,415,000 35,375 1,450,375 - 1,450,375 2026 - - - - - 2027 - - - - - 2028 - - - - - 2029 - - - - - 2030 - - - - - 2031 - - - - - 2032 - - - - - 2033 - - - - - 2034 - - - - -
-
37,785,000 6,768,619 44,553,619 - 44,553,619
(1) Energy savings from installation of energy conservation equipment are redirected to cover debt service. Includes issuances in 2007, 2011, 2013 and 2014.
C-11

Appendix C
Outstanding Debt Service Payments onEDC- Transportation Motor Fuel Bonds
Fiscal Excess Two Total Net
Year Principal Interest Total Less: Cents of Gas Tax Debt Service
Debt Service Offsets (1) held by Trustee (2) Payment (3)
2017 4,200,000 2,660,740 6,860,740 (86,603) 2,325,535 9,099,6722018 4,390,000 2,469,490 6,859,490 (86,603) 2,318,073 9,090,9602019 4,575,000 2,287,940 6,862,940 (86,603) 2,256,171 9,032,5082020 4,785,000 2,074,440 6,859,440 (86,603) 2,156,315 8,929,1522021 5,015,000 1,845,515 6,860,515 (86,603) 2,024,780 8,798,6922022 5,255,000 1,605,704 6,860,704 (86,603) 1,884,667 8,658,7682023 5,515,000 1,347,660 6,862,660 (86,603) 1,796,123 8,572,1802024 5,780,000 1,080,385 6,860,385 (86,603) 1,712,676 8,486,4592025 5,610,000 774,785 6,384,785 (86,603) 2,103,411 8,401,5942026 5,905,000 480,935 6,385,935 (86,603) 2,018,246 8,317,5782027 2,935,000 169,038 3,104,038 (3,104,038) 8,234,402 8,234,4022028 - - - - - - 2029 - - - - - - 2030 - - - - - - 2031 - - - - - -
53,965,000 16,796,631 70,761,631 (3,970,063) 28,830,396 95,621,965
(1) Reflects debt service reserve fund and interest thereon.(2) Budget reflects dedication of two cent of gas tax to trustee for motor fuel bonds.Amount shown is amount payable on bonds, but bond documents covenant two full cents flows to Trustee for coverage purposes. Gas tax transfers based on Office of Revenue Analysis estimates.(3) Debt service reserve fund will be available upon full repayment of all motor fuel bonds.
C-12

Appendix C
Outstanding Debt Service Payments- Rhode Island Economic Development Corporation - URI Power Plant
Fiscal
Year Principal Interest Total Amounts Budgeted Total Net
Debt Service within University Debt Service
2017 1,065,000 229,250 1,294,250 (1,294,250) - 2018 1,115,000 176,000 1,291,000 (1,291,000) - 2019 1,175,000 120,250 1,295,250 (1,295,250) - 2020 1,230,000 61,500 1,291,500 (1,291,500) - 2021 - - - 0 - 2022 - - - - - 2023 - - - - - 2024 - - - - - 2025 - - - - - 2026 - - - - - 2027 - - - - - 2028 - - - - - 2029 - - - - - 2030 - - - - - 2031 - - - - - 2032 - - - - -
4,585,000 587,000 5,172,000 (5,172,000) -
C-13
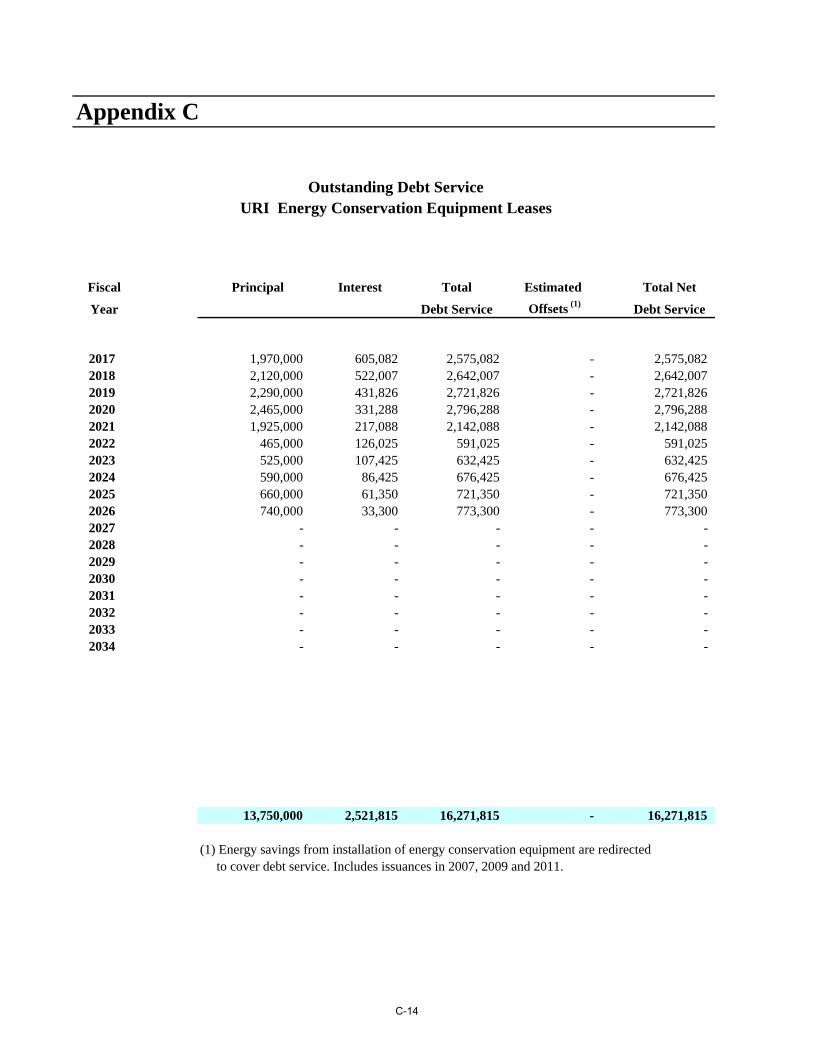
Appendix C
Outstanding Debt Service URI Energy Conservation Equipment Leases
Fiscal Principal Interest Total Estimated Total Net
Year Debt Service Offsets (1) Debt Service
2017 1,970,000 605,082 2,575,082 - 2,575,082 2018 2,120,000 522,007 2,642,007 - 2,642,007 2019 2,290,000 431,826 2,721,826 - 2,721,826 2020 2,465,000 331,288 2,796,288 - 2,796,288 2021 1,925,000 217,088 2,142,088 - 2,142,088 2022 465,000 126,025 591,025 - 591,025 2023 525,000 107,425 632,425 - 632,425 2024 590,000 86,425 676,425 - 676,425 2025 660,000 61,350 721,350 - 721,350 2026 740,000 33,300 773,300 - 773,300 2027 - - - - - 2028 - - - - - 2029 - - - - - 2030 - - - - - 2031 - - - - - 2032 - - - - - 2033 - - - - - 2034 - - - - -
13,750,000 2,521,815 16,271,815 - 16,271,815
(1) Energy savings from installation of energy conservation equipment are redirected to cover debt service. Includes issuances in 2007, 2009 and 2011.
C-14

Appendix C
Outstanding Debt Service RIC Energy Conservation Equipment Leases
Total
Fiscal Principal Interest Total Estimated Net
Year Debt Service Offsets Debt Service
2017 - 256,275 256,275 - 256,275 2018 340,000 252,875 592,875 - 592,875 2019 370,000 243,925 613,925 - 613,925 2020 405,000 230,275 635,275 - 635,275 2021 440,000 215,575 655,575 - 655,575 2022 475,000 199,475 674,475 - 674,475 2023 520,000 179,575 699,575 - 699,575 2024 560,000 157,975 717,975 - 717,975 2025 605,000 137,700 742,700 - 742,700 2026 650,000 112,375 762,375 - 762,375 2027 700,000 85,625 785,625 - 785,625 2028 750,000 63,875 813,875 - 813,875 2029 800,000 40,125 840,125 - 840,125 2030 850,000 13,813 863,813 - 863,813 2031 - - - - - 2032 - - - - - 2033 - - - - - 2034 - - - - -
7,465,000 2,189,463 9,654,463 - 9,654,463
C-15
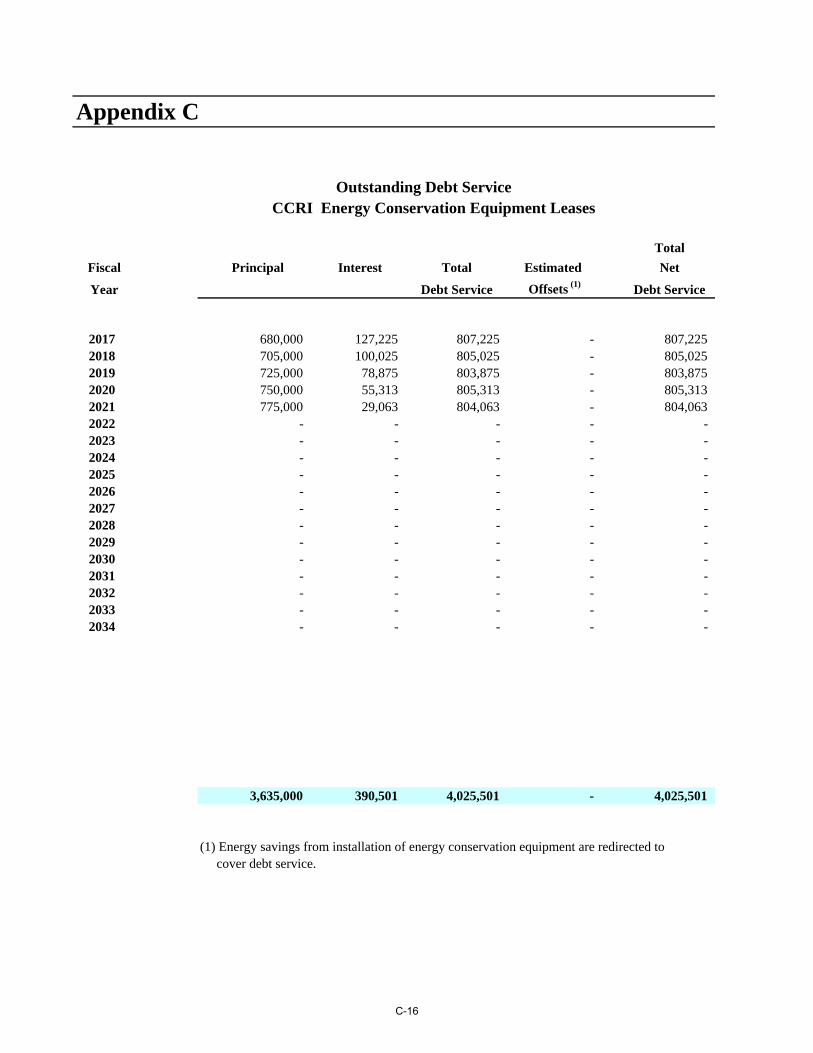
Appendix C
Outstanding Debt Service CCRI Energy Conservation Equipment Leases
Total
Fiscal Principal Interest Total Estimated Net
Year Debt Service Offsets (1) Debt Service
2017 680,000 127,225 807,225 - 807,225 2018 705,000 100,025 805,025 - 805,025 2019 725,000 78,875 803,875 - 803,875 2020 750,000 55,313 805,313 - 805,313 2021 775,000 29,063 804,063 - 804,063 2022 - - - - - 2023 - - - - - 2024 - - - - - 2025 - - - - - 2026 - - - - - 2027 - - - - - 2028 - - - - - 2029 - - - - - 2030 - - - - - 2031 - - - - - 2032 - - - - - 2033 - - - - - 2034 - - - - -
3,635,000 390,501 4,025,501 - 4,025,501
(1) Energy savings from installation of energy conservation equipment are redirected to cover debt service.
C-16

Appendix C
Outstanding Debt Service
Historic Structures Tax Credits Fund(1)
Total
Fiscal Principal Interest Total Estimated NetYear Debt Service Offsets Debt Service
2017 26,770,000 4,223,872 30,993,872 - 30,993,872 2018 28,230,000 2,884,368 31,114,368 - 31,114,368 2019 8,090,000 1,414,264 9,504,264 - 9,504,264 2020 8,310,000 1,194,216 9,504,216 - 9,504,216 2021 8,540,000 968,184 9,508,184 - 9,508,184 2022 8,775,000 735,896 9,510,896 - 9,510,896 2023 9,015,000 497,216 9,512,216 - 9,512,216 2024 9,265,000 252,008 9,517,008 - 9,517,008 2025 - - - - - 2026 - - - - - 2027 - - - - - 2028 - - - - - 2029 - - - - - 2030 - - - - - 2031 - - - - - 2032 - - - - - 2033 - - - - - 2034 - - - - -
106,995,000 12,170,023 119,165,023 - 119,165,023
(1) Inlcudes debt issuances in 2009 and 2015.
C-17

Appendix C
Fiscal Principal Interest Total Capitalized Total Net
Year Debt Service Interest (2) Offsets (2) Debt Service
Outstanding Debt Service
EDC Job Creation Guaranty Program(1)
2017 8,860,000 3,589,288 12,449,288 - (9,926,027) 2,523,2612018 9,455,000 2,923,881 12,378,881 - (12,378,881) 02019 10,190,000 2,162,638 12,352,638 - (11,248,468) 1,104,1702020 10,980,000 1,342,300 12,322,300 - - 12,322,3002021 11,830,000 458,413 12,288,413 - - 12,288,4132022 - - - - - 02023 - - - - - - 2024 - - - - - - 2025 - - - - - - 2026 - - - - - - 2027 - - - - - - 2028 - - - - - - 2029 - - - - - - 2030 - - - - - - 2031 - - - - - - 2032 - - - - - -
51,315,000 10,476,519 61,791,519 - (33,553,376) 28,238,143
(2) Offsets are from cash on hand in the debt service reserve fund and settlement proceeds.
(1) Under the loan and trust agreement of the 2010 EDC Job Creation Guaranty Program, the EDC is required to request that the Governor include funding in his annual budget submission to bring the balance in the capital reserve fund to a level equal to the minimum capital reserve fund requirement, whenever the fund balance falls below this level. This funding is subject to appropriation by the General Assembly.
C-18

Appendix C
Fiscal Principal Interest Total Less Total NetYear Debt Service Offsets (2) Debt Service
Outstanding Debt ServiceEDC Job Creation Guaranty Program II
2017 800,000 76,500 876,500 (876,500) - 2018 800,000 40,500 840,500 (840,500) - 2019 466,667 6,750 473,417 (473,417) - 2020 - 250 250 (250) - 2021 - - - - - 2022 - - - - - 2023 - - - - - 2024 - - - - - 2025 - - - - - 2026 - - - - - 2027 - - - - - 2028 - - - - - 2029 - - - - - 2030 - - - - - 2031 - - - - - 2032 - - - -
2,066,667 124,000 2,190,667 (2,190,667) -
(1) Companies to which loans have been made are expected to pay the required annual debt service.
C-19

Appendix C
Total Total
Fiscal Principal Interest Projected Estimated Projected Net
Year Debt Service Offsets (2) Debt Service
Debt Service on Debt Issuance for
Redevelopment of I-195 Land (1)
2017 - 2,978,400 2,978,400 (2,378,400) 600,000 2018 - 2,978,400 2,978,400 (2,328,400) 650,000 2019 1,420,000 2,950,600 4,370,600 (4,370,600) - 2020 1,540,000 2,836,694 4,376,694 (4,376,694) - 2021 1,660,000 2,715,019 4,375,019 (4,375,019) - 2022 1,790,000 2,583,850 4,373,850 (4,373,850) - 2023 31,990,000 2,442,413 34,432,413 (34,432,413) - 2024 - - - - - 2025 - - - - - 2026 - - - - - 2027 - - - - - 2028 - - - - - 2029 - - - - - 2030 - - - - - 2031 - - - - - 2032 - - - - - 2033 - - - - - 2034 - - - - - 2035 - - - - - 2036 - - - - - 2037 - - - - - 2038 - - - - - 2039 - - - - -
38,400,000 19,485,376 57,885,376 (56,635,376) 1,250,000
(1) Tax-exempt bank loan totaling $37.44 million with interest rate at LIBOR plus 1.0% and taxable bank loan
totaling $960,000 with interest rate at LIBOR plus 1.15%; semi-annual interest payments, with no principal
payments for the first five years. Principal will be amortized over a twenty year schedule beginning in year 6,
with a balloon payment in year 10. Initial agreement is for ten (10) years with an option to extend for an
additional ten (10) years.
(2) Interest displayed is based on interest rate cap of 7.75% for tax-exempt issue and 8.0% for taxable issue;
offsets are based on anticipated actual interest payments due to current LIBOR rates plus adjustments.
Assumes proceeds from land sales will offset principal and interest payments beginning in FY 2019
and conservatively does not reflect reimbursement of interest to be paid by the State in the first five years of
this loan. If such reimbursement is recevied from land sales, the revenue will be deposited in the general fund.
C-20

Appendix C
Less:CapitalizedInterest, Reserve Excess Two Total Net
Fiscal Principal Interest* Total Gross Fund Deposit Cents of Gas Tax Debt Service
Year Debt Service Self Supporting held by Trustee(2) Payment
Summary - All Outstanding Debt Service Payments(1)
(Exluding Performance Based Agreements)
2017 128,100,000 81,792,405 209,892,405 (14,561,780) 2,325,535 197,656,1602018 158,070,000 75,997,720 234,067,720 (16,925,384) 2,318,073 219,460,4092019 142,786,667 68,311,044 211,097,711 (17,474,337) 2,256,171 195,879,5442020 150,200,000 61,335,466 211,535,466 (5,755,047) 2,156,315 207,936,7342021 148,030,000 54,206,584 202,236,584 (4,461,622) 2,024,780 199,799,7422022 132,220,000 47,412,500 179,632,500 (4,460,453) 1,884,667 177,056,7152023 159,025,000 41,107,623 200,132,623 (34,519,016) 1,796,123 167,409,7302024 127,580,000 32,797,874 160,377,874 (86,603) 1,712,676 162,003,9472025 110,850,000 27,012,446 137,862,446 (86,603) 2,103,411 139,879,2552026 104,340,000 21,692,551 126,032,551 (86,603) 2,018,246 127,964,1942027 89,855,000 16,705,275 106,560,275 (3,104,038) 8,234,402 111,690,6402028 58,185,000 12,439,973 70,624,973 0 0 70,624,9732029 43,785,000 9,917,812 53,702,812 0 - 53,702,8122030 43,385,000 7,591,012 50,976,012 - - 50,976,0122031 31,985,000 5,322,108 37,307,108 - - 37,307,1082032 33,565,000 3,750,377 37,315,377 - - 37,315,3772033 23,020,000 2,450,225 25,470,225 - - 25,470,2252034 17,910,000 1,520,056 19,430,056 - - 19,430,0562035 14,620,000 761,184 15,381,184 - - 15,381,1842036 4,805,000 144,150 4,949,150 - - 4,949,1502037 - - - - - - 2038 - - - - - - 2039 - - - - - - 2040 - - - - - -
1,722,316,667 572,268,384 2,294,585,051 (101,521,482) 28,830,396 2,221,893,966
(1) Reflects amounts payable on outstanding net tax supported debt. Excludes performance based obligationsthat are shown on subsequent schedules.
(2) Budget reflects dedication of two cent of gas tax to trustee for motor fuel bonds. Amount shown is the amount payable on the bonds but bond documents covenant that a full two cents of gas tax proceeds flow to the Trustee for coverage purposes. Transfer amounts based on Office of Revenue Analysis estimates.
C-21

Appendix C
Projected Debt Service on Proposed Debt IssuanceGeneral Obligation Bonds
Fiscal Principal Interest (1)Projected
Year Debt Service
2017 - - - 2018 2,860,000 4,140,000 7,000,000 2019 7,059,375 13,861,300 20,920,675 2020 11,316,477 18,991,138 30,307,615 2021 14,560,920 23,135,684 37,696,604 2022 18,256,438 27,891,228 46,147,666 2023 22,780,903 31,495,874 54,276,777 2024 25,716,250 33,375,082 59,091,332 2025 28,797,543 35,108,344 63,905,887 2026 32,032,043 36,688,400 68,720,443 2027 35,427,370 38,107,628 73,534,998 2028 38,991,526 39,358,027 78,349,553 2029 42,732,911 40,431,198 83,164,108 2030 46,660,341 41,318,323 87,978,663 2031 50,783,073 42,010,146 92,793,219 2032 55,110,824 42,496,950 97,607,774 2033 59,653,794 42,768,535 102,422,329 2034 64,422,692 42,814,192 107,236,884 2035 69,428,760 42,622,680 112,051,440 2036 74,683,797 42,182,198 116,865,995 2037 80,200,194 41,480,356 121,680,550 2038 78,925,890 40,496,610 119,422,500 2039 74,078,669 39,550,316 113,628,985 2040 69,197,719 38,846,382 108,044,101 2041 67,322,545 38,386,496 105,709,042 2042 64,585,291 38,020,369 102,605,660
1,135,585,345 875,577,456 2,011,162,802
(1) Assumes 4.5% interest in FY 2018 with an issuance of 92.0 million; 5.0% in FY 2019 with an issuance of $132.2 million; 5.0% in FY 2020 with an issuance of $129.6 million; 5.0% in FY 2021 with an issuance of $89.1 million and 5.0% in FY 2022 with an issuance of $38.7 million.
C-22

Appendix C
Projected Debt Service on Planned Debt Issuance
Information Technology Investments
Total Total
Fiscal Principal Interest (1)Projected Offsets Projected Net
Year Debt Service Debt Service
2017 - - - - - 2018 - - - - - 2019 1,287,974 810,000 2,097,974 - 2,097,974 2020 1,352,373 745,601 2,097,974 - 2,097,974 2021 1,419,991 677,983 2,097,974 - 2,097,974 2022 1,490,991 606,983 2,097,974 - 2,097,974 2023 1,565,541 532,434 2,097,974 - 2,097,974 2024 1,643,818 454,156 2,097,974 - 2,097,974 2025 1,726,008 371,966 2,097,974 - 2,097,974 2026 1,812,309 285,665 2,097,974 - 2,097,974 2027 1,902,924 195,050 2,097,974 - 2,097,974 2028 1,998,071 99,904 2,097,974 - 2,097,974 2029 - - - - - 2030 - - - - - 2031 - - - - - 2032 - - - - - 2033 - - - - - 2034 - - - - - 2035 - - - - - 2036 - - - - - 2037 - - - - - 2038 - - - - - 2039
16,200,000 4,779,741 20,979,741 - 20,979,741
(1) Assumes issuance of $16.2 million in FY 2018 at an interest rate of 5.0%.
C-23

Appendix C
Projected Debt Service on Nursing Education Center EquipmentCertifcates of Participation
Total Total
Fiscal Principal Interest (1)Projected Less: Projected
Year Debt Service Offsets Debt Service
2017 - - - - 2018 834,798 525,000 1,359,798 1,359,798 2019 876,538 483,260 1,359,798 1,359,798 2020 920,365 439,433 1,359,798 1,359,798 2021 966,383 393,415 1,359,798 1,359,798 2022 1,014,702 345,096 1,359,798 1,359,798 2023 1,065,437 294,361 1,359,798 1,359,798 2024 1,118,709 241,089 1,359,798 1,359,798 2025 1,174,645 185,153 1,359,798 1,359,798 2026 1,233,377 126,421 1,359,798 1,359,798 2027 1,295,046 64,752 1,359,798 1,359,798 2028 - - - - 2029 - - - - 2030 - - - - 2031 - - - - 2032 - - - - 2033 - - - - 2034 - - - - 2035 - - - - 2036 - - - - 2037 - - - - 2038 - - - - 2039204020412042
10,500,000 3,097,980 13,597,980 - 13,597,980
(1) Assumes issuance of $10.5 million in FY 2017 at an interest rate of 5.0%.
C-26C-24

Appendix C
Projected Debt Service on Proposed Debt Issuance
Total Total
Fiscal Principal Interest (1)Projected Estimated Projected Net
Year Debt Service Offsets Debt Service
Statewide Energy Efficiency Projects - Office of Energy Resources
2017 - - - - - 2018 - - - - - 2019 1,088,281 600,000 1,688,281 (1,688,281) - 2020 1,142,695 545,586 1,688,281 (1,688,281) - 2021 1,199,830 488,451 1,688,281 (1,688,281) - 2022 1,259,821 428,460 1,688,281 (1,688,281) - 2023 1,322,812 365,469 1,688,281 (1,688,281) - 2024 1,388,953 299,328 1,688,281 (1,688,281) - 2025 1,458,401 229,880 1,688,281 (1,688,281) - 2026 1,531,321 156,960 1,688,281 (1,688,281) - 2027 1,607,887 80,394 1,688,281 (1,688,281) - 2028 - - - - - 2029 - - - - - 2030 - - - - - 2031 - - - - - 2032 - - - - - 2033 - - - - - 2034 - - - - - 2035 - - - - - 2036 - - - - - 2037 - - - - - 2038203920402041
12,000,000 3,194,529 15,194,529 - -
(1) Assumes issuance of $12.0 million in FY 2018 at an interest rate of 5.0%.Offsets assumed from energy savings.
C-25

Appendix C
Projected Debt Service on Proposed Debt Issuance
Energy Conservation Equipment Leases for URI
Total Total
Fiscal Principal Interest (1)Projected Estimated Projected Net
Year Debt Service Offsets Debt Service
2017 - - - - 2018 - - - - - 2019 537,571 580,000 1,117,571 (1,117,571) - 2020 564,449 553,121 1,117,571 (1,117,571) - 2021 592,672 524,899 1,117,571 (1,117,571) - 2022 622,305 495,265 1,117,571 (1,117,571) - 2023 653,420 464,150 1,117,571 (1,117,571) - 2024 686,091 431,479 1,117,571 (1,117,571) - 2025 720,396 397,175 1,117,571 (1,117,571) - 2026 756,416 361,155 1,117,571 (1,117,571) - 2027 794,237 323,334 1,117,571 (1,117,571) - 2028 833,948 283,622 1,117,571 (1,117,571) - 2029 875,646 241,925 1,117,571 (1,117,571) - 2030 919,428 198,142 1,117,571 (1,117,571) - 2031 965,399 152,171 1,117,571 (1,117,571) - 2032 1,013,669 103,901 1,117,571 (1,117,571) - 2033 1,064,353 53,218 1,117,571 (1,117,571) - 2034 - - - - - 2035 - - - - - 2036 - - - - -
11,600,000 5,163,558 16,763,558 (16,763,558) -
(1) Assumes issuance of $11.6 million in FY 2018 at an interest rate of 5.0%. Debt service paid by URI and assumed to be offset by energy savings.
C-26

Appendix C
Projected Debt Service on Proposed Debt Issuance
Confined Aquatic Disposal Cells - CRMC
Total Total
Fiscal Principal Interest (1)Projected Estimated Projected Net
Year Debt Service Offsets Debt Service
2017 - - - - 2018 - - - - - 2019 834,798 525,000 1,359,798 - 1,359,798 2020 876,538 483,260 1,359,798 - 1,359,798 2021 920,365 439,433 1,359,798 - 1,359,798 2022 966,383 393,415 1,359,798 - 1,359,798 2023 1,014,702 345,096 1,359,798 - 1,359,798 2024 1,065,437 294,361 1,359,798 - 1,359,798 2025 1,118,709 241,089 1,359,798 - 1,359,798 2026 1,174,645 185,153 1,359,798 - 1,359,798 2027 1,233,377 126,421 1,359,798 - 1,359,798 2028 1,295,046 64,752 1,359,798 - 1,359,798 2029 - - - - - 2030 - - - - - 2031 - - - - - 2032 - - - - - 2033 - - - - - 2034 - - - - - 2035 - - - - - 2036 - - - - -
10,500,000 3,097,980 13,597,980 0 13,597,980
(1) Assumes issuance of $10.5 million in FY 2018 at an interest rate of 5.0%.
C-27

Appendix C
Projected Debt Service on Proposed Debt Issuance
Historic Structures Tax Credits Fund (1)
Total Total
Fiscal Principal Interest Projected Estimated ProjectedYear Debt Service Offsets Debt Service
2017 - - - - - 2018 - - - - - 2019 6,943,085 3,375,000 10,318,085 - 10,318,085 2020 7,255,524 3,062,561 10,318,085 - 10,318,085 2021 7,582,023 2,736,063 10,318,085 - 10,318,085 2022 7,923,214 2,394,872 10,318,085 - 10,318,085 2023 8,279,758 2,038,327 10,318,085 - 10,318,085 2024 8,652,347 1,665,738 10,318,085 - 10,318,085 2025 9,041,703 1,276,382 10,318,085 - 10,318,085 2026 9,448,580 869,506 10,318,085 - 10,318,085 2027 9,873,766 444,319 10,318,085 - 10,318,085 2028 - - - - - 2029 - - - - - 2030 - - - - - 2031 - - - - - 2032 - - - - - 2033 - - - - - 2034 - - - - - 2035 - - - - - 2036 - - - - - 2037 - - - - -
75,000,000 17,862,767 92,862,767 - 92,862,767
(1) Assumes $75.0 million remaining to be issued in late FY 2018 and amortized over nine years. Assumed interest rate on future issuance is 4.5%.
C-28

Appendix C
Summary - All Outstanding and Projected Debt Service Payments (Exluding Performance Based Agreements)
Less: Offsets Excess Two Net DebtFiscal Principal Interest Total Gross & Self Cents of Gas Tax Service
Year Debt Service Supporting held by Trustee(2) Payable(1)
2017 128,100,000 81,792,405 209,892,405 (14,561,780) 2,325,535 197,656,160 2018 161,764,798 80,662,720 242,427,519 (16,925,384) 2,318,073 227,820,208 2019 161,414,289 88,545,604 249,959,893 (20,280,189) 2,256,171 231,935,875 2020 173,628,421 86,156,167 259,784,588 (8,560,898) 2,156,315 253,380,004 2021 175,272,183 82,602,512 257,874,695 (7,267,473) 2,024,780 252,632,001 2022 163,753,854 79,967,819 243,721,674 (7,266,304) 1,884,667 238,340,036 2023 195,707,574 76,643,332 272,350,907 (37,324,867) 1,796,123 236,822,162 2024 167,851,606 69,559,107 237,410,713 (2,892,454) 1,712,676 236,230,935 2025 154,887,405 64,822,435 219,709,840 (2,892,454) 2,103,411 218,920,798 2026 152,328,689 60,365,811 212,694,500 (2,892,454) 2,018,246 211,820,292 2027 141,989,606 56,047,174 198,036,780 (5,909,889) 8,234,402 200,361,293 2028 101,303,591 52,246,277 153,549,868 (1,117,571) - 152,432,298 2029 87,393,557 50,590,935 137,984,491 (1,117,571) - 136,866,921 2030 90,964,769 49,107,477 140,072,246 (1,117,571) - 138,954,675 2031 83,733,472 47,484,425 131,217,898 (1,117,571) - 130,100,327 2032 89,689,493 46,351,228 136,040,721 (1,117,571) - 134,923,151 2033 83,738,147 45,271,978 129,010,125 (1,117,571) - 127,892,555 2034 82,332,692 44,334,248 126,666,940 - - 126,666,940 2035 84,048,760 43,383,864 127,432,623 - - 127,432,623 2036 79,488,797 42,326,348 121,815,145 - - 121,815,145 2037 80,200,194 41,480,356 121,680,550 - - 121,680,550 2038 78,925,890 40,496,610 119,422,500 - - 119,422,500 2039 74,078,669 39,550,316 113,628,985 - - 113,628,985 2040 69,197,719 38,846,382 108,044,101 - - 108,044,101 2041 67,322,545 38,386,496 105,709,042 - - 105,709,042 2042 64,585,291 38,020,369 102,605,660 - - 102,605,660
2,993,702,012 1,485,042,396 4,478,744,408 (133,479,568) 28,830,396 4,374,095,237
(1) Reflects amounts payable on net tax supported debt, including projected issuance. Excludes performancebased obligations that are shown on subsequent schedules.
(2) Budget reflects dedication of two cent of gas tax to trustee for motor fuel bonds. Amount shown is the amount payable on the bonds but bond documents covenant that a full two cents of gas tax proceeds flow to the Trustee for coverage purposes. Transfer amounts based on Office of Revenue Analysis estimates.
C-29

Appendix C
Outstanding Debt Service Payments Performance Based State Obligation RI Economic Development Corporation - Fidelity I
Total Total Fiscal Principal Interest Lease Less: Revenues Net LeaseYear Payment Pledged Payment
2017 1,690,808 797,717 2,488,525 - 2,488,5252018 1,833,705 654,820 2,488,525 - 2,488,5252019 1,988,678 499,847 2,488,525 - 2,488,5252020 2,155,961 332,565 2,488,526 - 2,488,5262021 2,374,248 149,568 2,523,816 - 2,523,8162022 - - - - - 2023 - - - - - 2024 - - - - - 2025 - - - - - 2026 - - - - - 2027 - - - - - 2028 - - - - - 2029 - - - - - 2030 - - - - - 2031 - - - - - 2032 - - - - -
10,043,400 2,434,517 12,477,917 - 12,477,917
Assumes carry-over credits are available in any year that the job rent credits are not fully achieved.
C-30

Appendix C
Outstanding Debt Service Payments Performance Based State Obligation RI Economic Development Corporation - Fidelity II
Total Total Fiscal Principal Interest Lease Less: Revenues Net LeaseYear Payment Pledged Payment
2017 444,226 509,827 954,053 - 954,053 2018 476,970 477,083 954,053 - 954,053 2019 512,128 441,925 954,053 - 954,053 2020 549,877 404,176 954,053 - 954,053 2021 590,410 363,644 954,054 - 954,054 2022 633,928 320,126 954,054 - 954,054 2023 680,655 273,398 954,053 - 954,053 2024 730,827 223,227 954,054 - 954,054 2025 784,697 169,357 954,054 - 954,054 2026 842,537 111,517 954,054 - 954,054 2027 904,641 49,413 954,054 - 954,054 2028 - - - - - 2029 - - - - - 2030 - - - - - 2031 - - - - -
7,150,896 3,343,693 10,494,589 - 10,494,589
C-31

Appendix C
Outstanding Debt Service Payments Performance Based State Obligation
RI Economic Development Corporation - Fleet
Total TotalFiscal Principal Interest Debt Service Less: Revenues Net State
Year Payment Pledged (1) Payment
2017 425,000 520,905 945,905 (945,905) - 2018 455,000 487,991 942,991 (942,991) - 2019 490,000 452,796 942,796 (942,796) - 2020 530,000 414,745 944,745 (944,745) - 2021 570,000 373,651 943,651 (943,651) - 2022 615,000 329,513 944,513 (944,513) - 2023 660,000 281,760 941,760 (941,760) - 2024 715,000 228,583 943,583 (943,583) - 2025 770,000 175,808 945,808 (945,808) - 2026 825,000 116,482 941,482 (941,482) - 2027 895,000 51,368 946,368 (946,368) - 2028 - - - - - 2029 - - - - - 2030 - - - - - 2031 - - - - -
6,950,000 3,433,602 10,383,602 (10,383,602) -
(1) Assumes no state obligation, which is $1,000 per FTE in excess of the first 1,000 new FTE's employed, up to a maximum credit equal to approximately 31% of the total debt service on the bonds. Of the $11 million of bonds issued, the State's obligation to pay job rent credits, if all conditions are met, relates only to $3.4 million, or 31%.
C-32
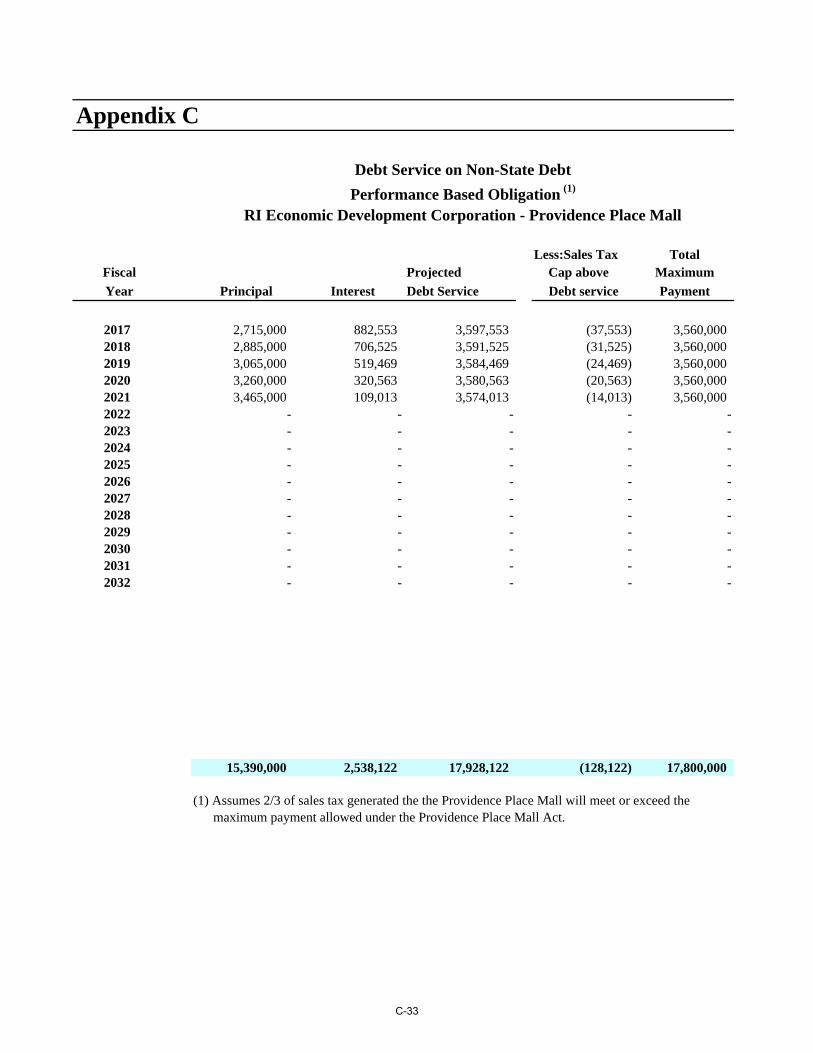
Appendix C
Less:Sales Tax TotalFiscal Projected Cap above Maximum
Year Principal Interest Debt Service Debt service Payment
Debt Service on Non-State Debt
Performance Based Obligation (1)
RI Economic Development Corporation - Providence Place Mall
2017 2,715,000 882,553 3,597,553 (37,553) 3,560,0002018 2,885,000 706,525 3,591,525 (31,525) 3,560,0002019 3,065,000 519,469 3,584,469 (24,469) 3,560,0002020 3,260,000 320,563 3,580,563 (20,563) 3,560,0002021 3,465,000 109,013 3,574,013 (14,013) 3,560,0002022 - - - - -2023 - - - - -2024 - - - - -2025 - - - - -2026 - - - - -2027 - - - - -2028 - - - - -2029 - - - - -2030 - - - - -2031 - - - - -2032 - - - - -
15,390,000 2,538,122 17,928,122 (128,122) 17,800,000
(1) Assumes 2/3 of sales tax generated the the Providence Place Mall will meet or exceed the maximum payment allowed under the Providence Place Mall Act.
C-33

Appendix C
Summary - All Outstanding and Projected Debt Service Payments (Including Performance Based Agreements)
Less: Net DebtFiscal Principal Interest Total Gross Less:Other Motor Fuel & Service
Year Debt Service Offsets Self Supporting(2) Payable(1)
2017 133,375,034 84,503,407 217,878,441 (15,507,685) 2,287,981 204,658,7382018 167,415,473 82,989,139 250,404,613 (17,868,375) 2,286,548 234,822,7862019 167,470,095 90,459,641 257,929,736 (21,222,985) 2,231,702 238,938,4532020 180,124,259 87,628,215 267,752,474 (9,505,643) 2,135,752 260,382,5832021 182,271,841 83,598,387 265,870,228 (8,211,124) 2,010,767 259,669,8712022 165,002,782 80,617,458 245,620,241 (8,210,817) 1,884,667 239,294,0902023 197,048,229 77,198,490 274,246,720 (38,266,627) 1,796,123 237,776,2152024 169,297,433 70,010,917 239,308,350 (3,836,037) 1,712,676 237,184,9892025 156,442,102 65,167,600 221,609,702 (3,838,262) 2,103,411 219,874,8522026 153,996,226 60,593,810 214,590,036 (3,833,936) 2,018,246 212,774,3462027 143,789,247 56,147,955 199,937,202 (6,856,257) 8,234,402 201,315,3472028 101,303,591 52,246,277 153,549,868 (1,117,571) 0 152,432,2982029 87,393,557 50,590,935 137,984,491 (1,117,571) - 136,866,9212030 90,964,769 49,107,477 140,072,246 (1,117,571) - 138,954,6752031 83,733,472 47,484,425 131,217,898 (1,117,571) - 130,100,3272032 89,689,493 46,351,228 136,040,721 (1,117,571) - 134,923,1512033 83,738,147 45,271,978 129,010,125 (1,117,571) - 127,892,5552034 82,332,692 44,334,248 126,666,940 - - 126,666,9402035 84,048,760 43,383,864 127,432,623 - - 127,432,6232036 79,488,797 42,326,348 121,815,145 - - 121,815,1452037 80,200,194 41,480,356 121,680,550 - - 121,680,5502038 78,925,890 40,496,610 119,422,500 - - 119,422,5002039 74,078,669 39,550,316 113,628,985 - - 113,628,9852040 69,197,719 38,846,382 108,044,101 - - 108,044,1012041 67,322,545 38,386,496 105,709,042 - - 105,709,0422042 64,585,291 38,020,369 102,605,660 - - 102,605,660
3,033,236,308 1,496,792,330 4,530,028,638 (143,863,170) 28,702,275 4,414,867,743
(1) Reflects amounts payable on net tax supported debt, including projected issuance and performance based obligations.
(2) Budget reflects dedication of two cent of gas tax to trustee for motor fuel bonds. Amount shown is the amount payable on the bonds but bond documents covenant that a full two cents of gas tax proceeds flow to the Trustee for coverage purposes. Transfer amounts based on Office of Revenue Analysis estimates.
C-34

Appendix D Transportation GARVEE
Bonds


Appendix D
Outstanding Debt Service on Non-State Debt RI Economic Development Corporation - GARVEE
Less: TotalFiscal Projected Federal General RevenueYear Principal Interest Debt Service Funds Commitment
2017 - 19,117,070 19,117,070 (19,117,070) -2018 - 23,560,250 23,560,250 (23,560,250) -2019 33,975,000 23,560,250 57,535,250 (57,535,250) -2020 35,525,000 22,011,500 57,536,500 (57,536,500) -2021 37,305,000 20,235,250 57,540,250 (57,540,250) -2022 39,170,000 18,370,000 57,540,000 (57,540,000) -2023 41,125,000 16,411,500 57,536,500 (57,536,500) -2024 43,180,000 14,355,250 57,535,250 (57,535,250) -2025 30,205,000 12,296,250 42,501,250 (42,501,250) -2026 31,715,000 10,786,000 42,501,000 (42,501,000) -2027 33,300,000 9,200,250 42,500,250 (42,500,250) --2028 34,965,000 7,535,250 42,500,250 (42,500,250) --2029 36,715,000 5,787,000 42,502,000 (42,502,000) --2030 38,550,000 3,951,250 42,501,250 (42,501,250) --2031 40,475,000 2,023,750 42,498,750 (42,498,750) --2032 - - - - -2033 - - - - -2034 - - - - -2035 - - - - -2036 - - - - -2037 - - - - -2038 - - - - -
476,205,000 209,200,820 685,405,820 (685,405,820) -
D-1


Appendix E State of Rhode Island
Bond Referenda


Appendix E - Bond Referenda
State of Rhode Island Bond Referenda, 1972-2016
Votes VotesElection and Question Presented Approved Percent Rejected Percent
November 7. 1972
School Bonds $10,000,000 168,582 56.31% 130,822 43.69%Health Facilities Bonds 11,000,000 223,882 71.75% 88,158 28.25%Social Services Bonds 8,200,000 162,543 55.54% 130,117 44.46%Park Bond Facilities 1,100,000 160,268 55.42% 128,894 44.58%Sewage Facilities Bonds 2,000,000 179,503 61.29% 113,351 38.71%Redevelopment Bonds 6,000,000 119,149 42.73% 159,697 57.27%State Buildings Bonds 8,400,000 103,311 37.20% 174,419 62.80%Transportation 9,300,000 112,860 40.26% 167,502 59.74%
Total Presented $56,000,000Total Approved $32,300,000
November 5, 1974
Correction Facilities $9,500,000 110,709 45.53% 132,450 54.47%State Properties 1,400,000 71,956 30.98% 160,314 69.02%Rehabilitative Services 1,455,000 127,732 52.25% 116,736 47.75%MHRH 15,000,000 159,264 61.59% 99,310 38.41%Transportation 16,100,000 95,630 38.98% 149,707 61.02%Parks, Recreation, Conservation 650,000 130,267 54.51% 108,717 45.49%Health Facilities 6,750,000 116,998 48.96% 121,978 51.04%State Water Supply 3,000,000 110,196 47.19% 123,302 52.81%Educational Facilities 11,400,000 106,535 44.93% 130,587 55.07%Solid Waste Management 1,700,000 112,373 48.56% 119,049 51.44%Board of Regents 10,000,000 98,597 43.35% 128,840 56.65%
Total Presented $76,955,000Total Approved $17,105,000
June 24, 1975
Transportation $14,000,000 49,732 64.70% 27,139 35.30%Health Facilities 14,000,000 52,336 68.08% 24,537 31.92%Education Facilities 9,500,000 43,815 58.13% 31,558 41.87%Health Lab Building 2,750,000 49,084 64.83% 26,633 35.17%
Total Presented $40,250,000Total Approved $40,250,000
E-1

Appendix E - Bond Referenda
State of Rhode Island Bond Referenda, 1972-2016
Votes VotesElection and Question Presented Approved Percent Rejected Percent
November 2, 1976
Vietnam Veterans' Bond $10,000,000 192,856 57.87% 140,373 42.13%Transportation 1,700,000 115,696 39.18% 179,632 60.82%Corrections 13,900,000 128,392 42.32% 174,957 57.68%State Properties 2,000,000 75,248 26.55% 208,159 73.45%MHRH 14,700,000 222,476 69.03% 99,814 30.97%Roads and Bridges 6,886,000 136,841 45.42% 164,453 54.58%Public Transportation 2,114,000 122,051 41.78% 170,049 58.22%Parks, Recreation, Conservation 1,250,000 142,299 48.21% 152,888 51.79%Health Facilities 9,000,000 160,569 54.05% 136,488 45.95%State Water Supply 3,800,000 132,503 45.26% 160,243 54.74%Educational Facilities 12,700,000 143,286 49.46% 146,422 50.54%Solid Waste Management 700,000 102,460 37.11% 173,651 62.89%Firefighting Training 1,000,000 102,268 36.50% 177,886 63.50%
Total Presented $79,750,000Total Approved $33,700,000
June 28, 1977
Correctional Facilities - Intake $6,000,000 33,072 51.40% 31,270 48.60%Transportation 41,500,000 42,203 64.51% 23,215 35.49%
Total Presented $47,500,000Total Approved $47,500,000
November 7, 1978Blackstone Valley Project $2,000,000 77,353 34.08% 149,604 65.92%Veterans Cemetery 3,250,000 97,416 39.62% 148,450 60.38%Correctional Facilities 750,000 88,388 38.37% 141,994 61.63%MHRH 11,700,000 145,660 58.81% 102,036 41.19%State Properties 3,000,000 54,014 24.12% 169,919 75.88%Health Facilities 10,000,000 109,757 47.02% 123,668 52.98%Water Supply 4,300,000 96,314 41.91% 133,493 58.09%Educational Facilities 16,180,000 101,483 42.57% 136,934 57.43%Environmental Management 2,400,000 100,696 45.66% 119,836 54.34%Transportation 650,000 94,763 43.21% 124,564 56.79%
Total Presented $54,230,000Total Approved $11,700,000
E-2

Appendix E - Bond Referenda
State of Rhode Island Bond Referenda, 1972-2016
Votes VotesElection and Question Presented Approved Percent Rejected Percent
June 26, 1979
Economic Development $25,000,000 30,568 62.34% 18,466 37.66%Environmental Quality 15,000,000 36,398 73.32% 13,247 26.68%
Total Presented $40,000,000Total Approved $40,000,000
July 22, 1980
Transportation $8,600,000 22,558 56.38% 17,450 43.62%Vocational Education 1,175,000 21,256 53.39% 18,560 46.61%Energy Conservation 7,400,000 16,752 42.72% 22,458 57.28%Correctional Facilities 5,830,000 10,530 27.05% 28,403 72.95%Handicapped Accessiblity 5,250,000 21,259 53.40% 18,552 46.60%Hazardous Substances 3,000,000 21,938 55.37% 17,680 44.63%
Total Presented $31,255,000Total Approved $18,025,000
November 4, 1980
Narragansett Bay Water Quality $87,700,000 215,614 67.66% 103,069 32.34%State Water Supplies 5,230,000 184,829 62.10% 112,782 37.90%MHRH 8,579,600 185,267 58.72% 130,251 41.28%Children & Their Families 1,060,000 187,754 61.05% 119,788 38.95%Educational Facilities 5,965,000 139,582 47.15% 156,460 52.85%
Total Presented $108,534,600Total Approved $102,569,600
November 2, 1982
Transportation $25,000,000 177,429 62.36% 107,088 37.64%Farmland Preservation 2,000,000 181,465 64.96% 97,863 35.04%Children & Their Families 3,100,000 169,125 61.77% 104,660 38.23%Correctional Facilities 8,500,000 123,798 45.34% 149,239 54.66%MHRH 4,600,000 181,643 64.55% 99,736 35.45%Educational Facilities-El./Sec. Ed. 2,600,000 142,168 52.56% 128,330 47.44%Educational Facilities-Higher Ed. 4,600,000 151,741 56.14% 118,537 43.86%Environmental Management 600,000 182,602 62.12% 111,334 37.88%
Total Presented $51,000,000Total Approved $42,500,000
E-3

Appendix E - Bond Referenda
State of Rhode Island Bond Referenda, 1972-2016
Votes VotesElection and Question Presented Approved Percent Rejected Percent
November 8, 1983
Correctional Facilities $5,000,000 59,206 58.71% 41,639 41.29%Transportation 45,000,000 68,488 67.82% 32,492 32.18%MHRH 8,500,000 69,616 68.02% 32,727 31.98%Water Resources Board 10,100,000 54,997 55.63% 43,873 44.37%
Total Presented $68,600,000Total Approved $68,600,000
June 12, 1984
Strategic Development Program $90,000,000 30,604 20.17% 121,090 79.83%Total Presented $90,000,000Total Approved $0
November 6, 1984
Educational Facilities-Higher Ed. $2,200,000 172,783 54.48% 144,345 45.52%Educational Facilities-El./Sec. Ed. 2,600,000 200,229 64.68% 109,321 35.32%Environmental Management 3,000,000 180,954 60.27% 119,299 39.73%Emergency Telephone System 5,000,000 235,120 71.36% 94,370 28.64%Environmental Response Fund 5,000,000 164,686 55.48% 132,166 44.52%Sewerage/Water Supply Failure 5,000,000 170,158 56.58% 130,570 43.42%MHRH 8,000,000 213,196 67.07% 104,693 32.93%Transportation 9,975,000 178,054 58.59% 125,847 41.41%Correctional Facilities 10,600,000 136,640 45.69% 162,443 54.31%Heritage Capital Development 14,000,000 133,734 46.59% 153,301 53.41%
Total Presented $65,375,000Total Approved $40,775,000
November 5, 1985
State House Renovations $5,500,000 67,239 58.86% 46,997 41.14%Handicapped Accessibility 5,000,000 70,871 61.48% 44,397 38.52%Transportation 16,000,000 73,569 64.30% 40,842 35.70%Heritage Capital Development 9,000,000 60,236 53.78% 51,763 46.22%Refund of General Obligation [40,700,000] 73,419 65.24% 39,113 34.76%Underground Storage Tank 1,500,000 59,772 54.91% 49,079 45.09%Agricultural Land Preservation 2,000,000 72,003 64.85% 39,030 35.15%MHRH 12,680,000 80,818 69.19% 35,988 30.81%Asbestos/Dangerous Products 20,000,000 68,977 61.23% 43,679 38.77%
Total Presented $71,680,000Total Approved $71,680,000
E-4

Appendix E - Bond Referenda
State of Rhode Island Bond Referenda, 1972-2016
Votes VotesElection and Question Presented Approved Percent Rejected Percent
November 4, 1986
Clean Water Act Environ. Trust $35,000,000 204,272 76.59% 62,435 23.41%Blackstone Valley District 17,200,000 156,857 61.98% 96,226 38.02%Water Resources 13,600,000 158,223 63.31% 91,707 36.69%Environmental Management 16,000,000 160,287 63.02% 94,054 36.98%MHRH 11,690,000 166,926 69.57% 73,026 30.43%Human Services 2,600,000 162,367 67.31% 78,867 32.69%Children & Their Families 6,500,000 163,502 68.15% 76,430 31.85%Hazardous Substances 2,000,000 167,772 69.60% 73,286 30.40%Educational Facilities-Higher Ed. 8,700,000 156,967 65.12% 84,076 34.88%Transportation 57,490,000 155,421 64.76% 84,592 35.24%
Total Presented $170,780,000Total Approved $170,780,000
November 3, 1987
Open Space and Recreactional Areas $65,200,000 74,516 77.40% 21,756 22.60%
Total Presented $65,200,000Total Approved $65,200,000
November 8, 1988
Water Resources $10,000,000 262,956 84.31% 48,941 15.69%Environmental Management 2,000,000 224,640 74.84% 75,524 25.16%MHRH 29,142,500 247,810 76.91% 74,398 23.09%MHRH- Substance Abuse Treatment Fac 3,200,000 222,866 73.23% 81,480 26.77%Historic Preservation Commission 2,500,000 186,276 61.32% 117,502 38.68%Rhode Island Aqua Fund 15,000,000 225,944 74.65% 76,742 25.35%Educational Facilities-Higher Ed. 17,700,000 235,523 73.72% 83,964 26.28%Transportation 98,580,000 211,832 67.84% 100,415 32.16%
Total Presented $178,122,500Total Approved $178,122,500
November 7, 1989
Historic Preservation Commission 4,500,000 60,296 54.75% 49,837 45.25%Environmental Management 74,500,000 70,920 64.17% 39,598 35.83%Transportation 3,000,000 71,819 65.61% 37,652 34.39%MHRH 17,500,000 75,618 67.34% 36,670 32.66%Cross-Bay Pipeline 15,000,000 29,737 27.03% 80,283 72.97%
Total Presented $114,500,000Total Approved $99,500,000
E-5

Appendix E - Bond Referenda
State of Rhode Island Bond Referenda, 1972-2016
Votes VotesElection and Question Presented Approved Percent Rejected Percent
November 6, 1990
MHRH $41,850,000 203,100 66.02% 104,533 33.98%Transportation 92,100,000 172,451 57.55% 127,184 42.45%Educational Facilities-Higher Ed. 7,000,000 190,601 65.54% 100,218 34.46%Environmental Management-Agric.Pres. 2,000,000 185,956 62.64% 110,902 37.36%Clean Water Act Environ. Trust 35,000,000 204,978 70.71% 84,923 29.29%Reallocate NBC to BSV and Pawtuxet [15,000,000] 171,645 59.27% 117,974 40.73%State Facilities-Asset Protection 19,445,540 152,677 53.99% 130,119 46.01%Economic Development 3,500,000 131,987 46.58% 151,372 53.42%
Total Presented $200,895,540Total Approved $197,395,540
November 3, 1992
Transportation $12,000,000 173,812 52.21% 159,067 47.79%Rhode Island Historical Society 2,500,000 112,236 34.82% 210,052 65.18%State Facilities 9,500,000 108,679 36.02% 193,012 63.98%Historic Preservation 4,500,000 130,048 39.88% 196,087 60.12%R.I. Housing and Conservation Trust 10,000,000 133,789 41.38% 189,514 58.62%Narragansett Bay Water Quality 15,000,000 181,193 55.42% 145,726 44.58%
Total Presented $53,500,000Total Approved $27,000,000
November 8, 1994Transportation $56,500,000 169,839 58.26% 121,675 41.74%Rhode Island Historical Preservation 4,500,000 133,488 44.67% 165,363 55.33%Correctional Facilities 3,800,000 105,062 35.38% 191,894 64.62%Elementary & Secondary Education 29,000,000 151,692 50.51% 148,600 49.49%State House 5,000,000 128,562 44.40% 161,007 55.60%
Total Presented $98,800,000Total Approved $85,500,000
November 5, 1996Transportation 80,180,000 179,989 56.19% 140,360 43.81%Higher Education-Telecommunication 40,600,000 172,546 53.63% 149,163 46.37%Higher Education Facilities 33,803,485 173,163 54.14% 146,698 45.86%Quonset Point/Davisville 72,000,000 196,530 60.29% 129,420 39.71%Environmental Management 4,000,000 179,203 57.02% 135,053 42.98%Brownsfield Loan Program 5,000,000 112,494 37.16% 190,231 62.84%Asset Protection 18,500,000 125,091 41.15% 178,929 58.85%
Total Presented 254,083,485Total Approved 230,583,485
November 3, 1998Transportation 65,700,000 178,389 68.21% 83,148 31.79%Higher Education Facilities 20,990,000 177,916 67.75% 84,710 32.25%Environmental Management 15,000,000 173,332 67.78% 82,409 32.22%
Total Presented 101,690,000Total Approved 101,690,000
November 7, 2000Environmental Management 34,000,000 252,364 73.38% 91,566 26.62%Clean Water Finance Agency 60,000,000 260,362 75.35% 85,157 24.65%Transportation 62,510,000 231,745 68.10% 108,536 31.90%Higher Education Facilities 36,950,000 232,066 67.46% 111,930 32.54%Heritage Harbor Museum 25,000,000 168,808 49.29% 173,657 50.71%
Total Presented 218,460,000Total Approved 193,460,000
E-6

Appendix E - Bond Referenda
State of Rhode Island Bond Referenda, 1972-2016
Votes VotesElection and Question Presented Approved Percent Rejected Percent
November 5, 2002State Police Headquarters Facility and State Municipal Fire Academy 55,000,000 183,839 60.42% 120,452 39.58%Preservation, Recreation and 14,000,000 167,398 55.51% 134,149 44.49% HeritageTransportation 63,500,000 219,067 72.81% 81,811 27.19%Quonset Point/Davisville 11,000,000 137,453 46.22% 159,923 53.78%
Total Presented 143,500,000Total Approved 132,500,000
November 2, 2004Transportation 66,520,000 245,153 66.48% 123,583 33.52%Regional Career and Technical Schools 15,000,000 207,005 56.50% 159,387 43.50%Higher Education Residence Halls 50,000,000 188,805 51.22% 179,814 48.78%Cranston Street Armory 12,300,000 122,125 33.67% 240,536 66.33%Emergency Water Interconnect 10,000,000 247,845 67.69% 118,283 32.31%Open Space, Recreation, Bay and Watershed Protection 70,000,000 262,486 70.78% 108,347 29.22%Pell Library-Undersea Exploration Ctr 14,000,000 185,045 50.59% 180,721 49.41%Athletic Center/Meade Stadium 6,700,000 117,971 32.50% 244,988 67.50%Historic Preservation 3,000,000 205,267 56.00% 161,259 44.00%Rehab of State owned Facilities 46,500,000 169,311 46.74% 192,923 53.26%URI Biotechnology Center 50,000,000 214,811 57.94% 155,914 42.06%Quonset Point/Davisville 48,000,000 206,243 56.33% 159,882 43.67%
Total Presented 392,020,000Total Approved 326,520,000
November 7, 2006Higher Education Bonds 72,790,000 230,174 62.02% 140,939 37.98%Transportation Bonds 80,000,000 276,350 75.42% 90,079 24.58%Roger Williams Park Zoo Bonds 11,000,000 248,874 67.82% 118,081 32.18%Fort Adams Rec and Restoration Bonds 4,000,000 179,635 49.44% 183,709 50.56%DEM Bonds 3,000,000 219,272 60.77% 141,531 39.23%Affordable Housing Bonds 50,000,000 241,517 66.03% 124,268 33.97%
Total Presented 220,790,000Total Approved 216,790,000
November 4, 2008Open Space and Recreational Development 2,500,000 275,541 68.01% 129,578 31.99%Transportation Bonds 87,215,000 313,394 76.71% 95,134 23.29%
Total Presented 89,715,000
Total Approved 89,715,000
E-7

Appendix E - Bond Referenda
State of Rhode Island Bond Referenda, 1972-2016
Votes VotesElection and Question Presented Approved Percent Rejected Percent
November 2, 2010Higher Education Facilities Bonds 78,000,000 175,978 55.23% 142,632 44.77%Transportation Bonds 84,700,000 233,182 73.13% 85,660 26.87%Open Space and Recreation Bonds 14,700,000 205,218 64.63% 112,310 35.37%
Total Presented 177,400,000
Total Approved 177,400,000
November 6, 2012
Higher Education Facilities Bonds 50,000,000 262,307 66.19% 133,981 33.81%
Veterans' Home Bonds 94,000,000 304,287 77.34% 89,130 22.66%
Clean Water Bonds 20,000,000 298,330 74.50% 102,097 25.50%
Environmental Management Bonds 20,000,000 276,924 69.83% 119,659 30.17%
Affordable Housing Bonds 25,000,000 246,132 61.60% 153,413 38.40%
Total Presented 209,000,000
Total Approved 209,000,000
November 4, 2014
Higher Education Facilities Bonds 125,000,000 186,616 63.60% 107,016 36.40%
Creative and Cultural Economy Bonds 30,000,000 185,917 60.60% 121,026 39.40%
Mass Transit Hub Infrastructure Bonds 35,000,000 175,160 60.20% 116,028 39.80%
Clean Water, Open Space , Healthy Comm 53,000,000 214,865 71.20% 86,885 28.80%
Total Presented 243,000,000
Total Approved 243,000,000
November 8, 2016
Higher Education Facilities and Innovation Centers Bonds 45,500,000 248,708 59.50% 169,408 40.50%
Port Infrastructure Bonds 70,000,000 264,056 63.30% 153,132 36.70%
Green Economy Bonds 35,000,000 284,408 67.60% 136,205 32.40%
Veterans Home Bonds 27,000,000 356,337 83.90% 68,406 16.10%
Housing Opportunity Bonds 50,000,000 245,135 58.00% 177,218 42.00%
Total Presented 227,500,000
Total Approved 227,500,000
E-8

Appendix F
Analysis of Bond Authorizations


Appendix F - Analysis of Bond Authorizations
Analysis of Debt Authorizations, Debt Issuances, and Authorized But Unissued DebtBy Agency and Categorical Function - Fiscal Years 1979 - 2017
Total During Period 1979 - 2017 (12/31/16) Unissued Statutory Amount of Voter Amounts Premium Amounts as of Direct Debt and Guaranteed Debt Authority Authorizations Extinguished Allocation from Issued January 2017
or Reallocated 2007 transaction
General GovernmentLand acquisition - Industrial Development Ch. 157-P.L. of 1979 25,000,000 (4,925) - 24,995,075 - Handicapped Accessibility Improvements Ch. 166-P.L. of 1980 5,250,000 - - 5,250,000 - Asbestos Abatement Ch. 366-P.L. of 1985 20,000,000 (15,495,000) - 4,505,000 - Handicapped Accessibility Improvements Ch. 367-P.L. of 1985 5,000,000 (985) - 4,999,015 - State House Renovations Ch. 367-P.L. of 1985 5,500,000 (4,418) - 5,495,582 - State Facilities Ch. 434-P.L. of 1990 19,445,540 (540) - 19,445,000 - Quonset Point/Davisville Ch. 100-P.L. of 1996 72,000,000 - - 72,000,000 - Quonset Point/Davisville Ch. 595-P.L. of 2004 48,000,000 - (190,000) 47,810,000 - Affordable Housing Ch. 246-P.L. of 2006 50,000,000 - - 50,000,000 - Affordable Housing Ch. 241-P.L. of 2012 25,000,000 - - 25,000,000 - Quonset Point/Davisville/Port Infrastructure Ch 142-P.L. of 2016 70,000,000 - - - 70,000,000 Affordable Housing/Blight Remediation Ch 142-P.L. of 2016 50,000,000 - - - 50,000,000
Subtotal 395,195,540 (15,505,868) (190,000) 259,499,672 120,000,000
Human ServicesMental Health, Retardation and Hospitals Ch. 163-P.L. of 1980 8,579,600 (4,600) - 8,575,000 - Children and Their Families Ch. 163-P.L. of 1980 1,060,000 - - 1,060,000 - Mental Health, Retardation and Hospitals Ch. 344-P.L. of 1982 4,600,000 - - 4,600,000 - Children and Their Families Ch. 344-P.L. of 1982 3,100,000 (38,790) - 3,061,210 - Mental Health, Retardation and Hospitals Ch. 332-P.L. of 1983 8,500,000 - - 8,500,000 - Mental Health, Retardation and Hospitals Ch. 156-P.L. of 1984 8,000,000 (5,736) - 7,994,264 - Mental Health, Retardation and Hospitals Ch. 367-P.L. of 1985 12,680,000 (9,008) - 12,670,992 - Mental Health, Retardation and Hospitals Ch. 419-P.L. of 1986 11,690,000 - - 11,690,000 - Children and Their Families Ch. 419-P.L. of 1986 6,500,000 (15,000) - 6,485,000 - Human Services Ch. 419-P.L. of 1986 2,600,000 - - 2,600,000 - Mental Health, Retardation and Hospitals Ch. 449-P.L. of 1988 29,142,500 (2,500) - 29,140,000 - Residential Substance Treatment Facilities Ch. 628-P.L. of 1988 3,200,000 - - 3,200,000 - Mental Health, Retardation and Hospitals Ch. 552-P.L. of 1989 17,500,000 - - 17,500,000 - Mental Health, Retardation and Hospitals Ch. 434-P.L. of 1990 41,850,000 (30,000) - 41,820,000 - Veterans' Home Ch. 241-P.L. of 2012 94,000,000 (60,500,000) - 33,500,000 - Veterans' Home Ch 142-P.L. of 2016 27,000,000 - - - 27,000,000
Subtotal 280,002,100 (60,605,634) - 192,396,466 27,000,000
F-1

Appendix F - Analysis of Bond Authorizations
Analysis of Debt Authorizations, Debt Issuances, and Authorized But Unissued DebtBy Agency and Categorical Function - Fiscal Years 1979 - 2017
Total During Period 1979 - 2017 (12/31/16) Unissued Statutory Amount of Voter Amounts Premium Amounts as of Direct Debt and Guaranteed Debt Authority Authorizations Extinguished Allocation from Issued January 2017
or Reallocated 2007 transaction
EducationVocational Education Ch. 254-P.L. of 1980 1,175,000 - - 1,175,000 - Elementary and Secondary Education Ch. 344-P.L. of 1982 2,600,000 - - 2,600,000 - Higher Education Ch. 344-P.L. of 1982 4,600,000 - - 4,600,000 - Elementary and Secondary Education Ch. 156-P.L. of 1984 2,600,000 (4,664) - 2,595,336 - Higher Education Ch. 156-P.L. of 1984 2,200,000 (46) - 2,199,954 - Higher Education Facilities Ch. 419-P.L. of 1986 8,700,000 (4,894) - 8,695,106 - Historic Preservation Commission Ch. 449-P.L. of 1988 2,500,000 - - 2,500,000 - Higher Education Facilities Ch. 449-P.L. of 1988 17,700,000 (25,000) - 17,675,000 - Historical Preservation Commission Ch. 377-P.L. of 1989 4,500,000 (4,500,000) - - - Higher Education Facilities Ch. 434-P.L. of 1990 7,000,000 - - 7,000,000 - Elementary and Secondary Education Ch. 70-P.L. of 1994 29,000,000 - (5,000) 28,995,000 - Higher Education-Telecommunication Ch. 100-P.L. of 1996 40,600,000 - - 40,600,000 - Higher Education Facilities Ch. 100-P.L. of 1996 33,803,485 (3,485) - 33,800,000 - Higher Education Facilities Ch. 31-P.L. of 1998 20,990,000 (2,685,000) - 18,305,000 - Higher Education Facilities Ch. 55-P.L. of 2000 36,950,000 - - 36,950,000 - Regional Career and Tech Schools Ch. 595-P.L. of 2004 15,000,000 - - 15,000,000 - Higher Education Residence Halls Ch. 595-P.L. of 2004 50,000,000 - (30,000) 49,970,000 - Pell Library-Udersea Exploration Ctr Ch. 595-P.L. of 2004 14,000,000 - (87,000) 13,913,000 - Historic Preservation Ch. 595-P.L. of 2004 3,000,000 - (16,000) 2,984,000 - URI Biotechnology Center Ch. 595-P.L. of 2004 50,000,000 - (153,000) 49,847,000 - Higher Education Ch. 246-P.L. of 2006 72,790,000 - (174,000) 72,616,000 - Higher Education Ch. 23-P.L. of 2010 78,000,000 - - 78,000,000 - Higher Education Ch. 241-P.L. of 2012 50,000,000 - - 12,000,000 38,000,000 Higher Education Facilities Bonds Ch 145-P.L. of 2014 $125,000,000 - - 7,500,000 117,500,000 Creative and Cultural Economy Bonds Ch 145-P.L. of 2014 $35,000,000 - - 16,500,000 18,500,000 Higher Education Ch 142-P.L. of 2016 $45,500,000 - - - 45,500,000
Subtotal 753,208,485 (7,223,089) (465,000) 526,020,396 219,500,000
Public SafetyCorrectional Facilities Ch. 150-P.L. of 1977 1,500,000 - - 1,500,000 - Corrections Ch. 332-P.L. of 1983 5,000,000 - - 5,000,000 - Emergency Telephone System Ch. 155-P.L. of 1984 5,000,000 (4,149,833) - 850,167 - State Police Headquarter Facility and - - State Municipal Fire Academy Ch. 65-P.L. of 2002 55,000,000 (40,070,000) - 14,930,000 -
F-2

Appendix F - Analysis of Bond Authorizations
Analysis of Debt Authorizations, Debt Issuances, and Authorized But Unissued DebtBy Agency and Categorical Function - Fiscal Years 1979 - 2017
Total During Period 1979 - 2017 (12/31/16) Unissued Statutory Amount of Voter Amounts Premium Amounts as of Direct Debt and Guaranteed Debt Authority Authorizations Extinguished Allocation from Issued January 2017
or Reallocated 2007 transactionSubtotal 66,500,000 (44,219,833) - 22,280,167 -
Natural ResourcesBlackstone Valley Sewer District Loan Ch. 267-P.L. of 1966 8,500,000 (700,000) - 7,800,000 - Blackstone Valley Sewer District Loan Ch. 92-P.L. of 1971 3,300,000 (2,100,000) - 1,200,000 - Sewerage Facility Grants Ch. 255-P.L. of 1976 - - - - - Environmental Quality Projects Ch. 156-P.L. of 1979 15,000,000 - - 15,000,000 - Hazardous Substances Ch. 166-P.L. of 1980 3,000,000 - - 3,000,000 - State Water Supplies Ch. 163-P.L. of 1980 5,230,000 (95,000) - 5,135,000 - Narragansett Bay Water Quality Mgmt. Ch. 342-P.L. of 1980 73,641,000 (15,001,000) - 58,640,000 - Narragansett Bay Water Quality Mgmt. Ch. 342-P.L. of 1980 14,059,000 (574,000) - 13,485,000 - Farmland Preservation Ch. 299-P.L. of 1981 2,000,000 - - 2,000,000 - Environmental Management Ch. 344-P.L. of 1982 600,000 - - 600,000 - Water Facilities Assistance Program Ch. 332-P.L. of 1983 10,100,000 (1,307) - 10,098,693 - Environmental Response Fund Ch. 403-P.L. of 1984 5,000,000 (1,418) - 4,998,582 - Environmental Management-Ports Ch. 156-P.L. of 1984 3,000,000 - - 3,000,000 - Sewerage and Water Supply Failure Fund Ch. 420-P.L. of 1984 5,000,000 (4,251) - 4,995,749 - Heritage Preservation Ch. 369-P.L. of 1985 9,000,000 (778,538) - 8,221,462 - Underground Storage Tank Replacement Ch. 486-P.L. of 1985 1,500,000 (706,818) - 793,182 - Agricultural Land Preservation Ch. 367-P.L. of 1985 2,000,000 (64) - 1,999,936 - Water Resources Ch. 419-P.L. of 1986 13,600,000 - - 13,600,000 - Hazardous Waste Ch. 399-P.L. of 1986 2,000,000 (250,000) - 1,750,000 - Clean Water Act Environmental Trust Fund Ch. 289-P.L. of 1986 35,000,000 (4,627) (6,000) 34,989,373 - Environmental Management Ch. 419-P.L. of 1986 16,000,000 (4,842) - 15,995,158 - Blackstone Valley District Commission Ch. 289-P.L. of 1986 17,200,000 (940,000) - 16,260,000 - Open Space Ch. 425-P.L. of 1987 65,200,000 (3,254) - 65,196,746 - Water Resources Ch. 417-P.L. of 1987 10,000,000 - - 10,000,000 - Environmental Management Ch. 449-P.L. of 1988 2,000,000 - - 2,000,000 - Rhode Island Aqua Fund Ch. 443-P.L. of 1988 15,000,000 (5,315,000) - 9,685,000 - Environmental Management Ch. 552-P.L. of 1989 74,500,000 (1,623,990) - 72,876,010 - Clean Water Protection Finance Agency Ch. 238-P.L. of 1988 - - - - -
Ch. 303-P.L. of 1989 - - - - - Ch. 434-P.L. of 1990 35,000,000 - - 35,000,000 -
Agricultural Land Preservation Ch. 434-P.L. of 1990 2,000,000 - - 2,000,000 - Blackstone Valley District Commission Ch. 434-P.L. of 1990 - 6,000,000 - 6,000,000 -
F-3

Appendix F - Analysis of Bond Authorizations
Analysis of Debt Authorizations, Debt Issuances, and Authorized But Unissued DebtBy Agency and Categorical Function - Fiscal Years 1979 - 2017
Total During Period 1979 - 2017 (12/31/16) Unissued Statutory Amount of Voter Amounts Premium Amounts as of Direct Debt and Guaranteed Debt Authority Authorizations Extinguished Allocation from Issued January 2017
or Reallocated 2007 transactionPawtuxet River District Commission Ch. 434-P.L. of 1990 - 9,000,000 - 9,000,000 - Narragansett Bay Water Quality Mgmt. Ch. 434-P.L. of 1990 15,000,000 - - 15,000,000 - Environmental Management Ch. 100-P.L. of 1996 4,000,000 - - 4,000,000 - Environmental Management Ch. 31-P.L. of 1998 15,000,000 - - 15,000,000 - Clean Water Protection Finance Agency Ch. 55-P.L. of 2000 60,000,000 - - 60,000,000 - Environmental Management Ch. 55-P.L. of 2000 34,000,000 (255,000) - 33,745,000 - Preservation, Recreation & Heritage Ch. 65-P.L. of 2002 14,000,000 (1,200,000) (21,000) 12,779,000 - Emergency Water Interconnect Ch. 595-P.L. of 2004 10,000,000 - (27,000) 9,973,000 - Open Space, Recreation, Bay and Watershed Protection Ch. 595-P.L. of 2004 70,000,000 (500,000) (210,000) 69,290,000 - Roger Williams Park Zoo Ch. 246-P.L. of 2006 11,000,000 - (55,000) 10,945,000 - Environmental Management Ch. 246-P.L. of 2006 3,000,000 - - 3,000,000 - Open Space and Recreation Development Ch. 378/469-P.L. of 2008 2,500,000 - - 2,500,000 - Open Space and Recreation Development Ch. 23-P.L. of 2010 14,700,000 - - 14,700,000 - Environmental Management Ch. 241-P.L. of 2012 20,000,000 - - 15,000,000 5,000,000 Clean Water Protection Finance Agency Ch. 241-P.L. of 2012 20,000,000 - - 12,825,000 7,175,000 Clean Water, Open Space, and Healthy Communities Bonds Ch. 145-P.L. of 2014 $53,000,000 - - 14,600,000 38,400,000
Green Economy Bonds Ch 142-P.L. of 2016 $35,000,000 - - - 35,000,000 Subtotal 829,630,000 (15,059,109) (319,000) 728,676,891 85,575,000
TransportationTransportation Ch. 150-P.L. of 1977 - - - - - Transportation Ch. 254-P.L. of 1978 8,600,000 - - 8,600,000 - Transportation Ch. 344/Ch. 455 -
P.L. of 1982 25,000,000 (10,509) - 24,989,491 - Transportation Ch. 332-P.L. of 1983 45,000,000 (1,030) - 44,998,970 - Transportation Ch. 156-P.L. of 1984 9,975,000 - - 9,975,000 - Transportation Ch. 367-P.L. of 1985 16,000,000 (4,801) - 15,995,199 - Transportation Ch. 419-P.L. of 1986 57,490,000 (153) - 57,489,847 - Transportation Ch. 449-P.L. of 1988 98,580,000 (821) - 98,579,179 - Transportation Ch. 552-P.L. of 1989 3,000,000 - - 3,000,000 - Transportation Ch. 434-P.L. of 1990 92,100,000 - - 92,100,000 - Transportation Ch. 133-P.L. of 1992 12,000,000 - - 12,000,000 -
F-4

Appendix F - Analysis of Bond Authorizations
Analysis of Debt Authorizations, Debt Issuances, and Authorized But Unissued DebtBy Agency and Categorical Function - Fiscal Years 1979 - 2017
Total During Period 1979 - 2017 (12/31/16) Unissued Statutory Amount of Voter Amounts Premium Amounts as of Direct Debt and Guaranteed Debt Authority Authorizations Extinguished Allocation from Issued January 2017
or Reallocated 2007 transactionTransportation Ch. 70-P.L. of 1994 56,500,000 - - 56,500,000 - Transportation Ch. 100-P.L. of 1996 80,180,000 - - 80,180,000 - Transportation Ch. 31-P.L. of 1998 65,700,000 - - 65,700,000 - Transportation Ch. 55-P.L. of 2000 62,510,000 - - 62,510,000 - Transportation Ch. 65-P.L. of 2002 63,500,000 - - 63,500,000 - Transportation Ch. 595-P.L. of 2004 66,520,000 - (34,000) 66,486,000 - Transportation Ch. 246-P.L. of 2006 88,500,000 (2,195) (544,805) 87,953,000 - Transportation Ch. 100-P.L. of 2008 87,215,000 - - 87,215,000 - Transportation Ch. 23-P.L. of 2010 84,700,000 - - 84,700,000 - Mass Transit Hub Infrastructure Bonds Ch. 145-P.L. of 2014 $35,000,000 - - 500,000 34,500,000
Subtotal 1,058,070,000 (19,509) (578,805) 1,022,471,686 34,500,000
Total 3,382,606,125 (142,633,042) (1,552,805) 2,751,345,278 486,575,000
F-5


Appendix G
Summary of Tax Supported Debt Issuance
by Fiscal Year


Appendix GSummary of Tax Supported Debt Issuances by Fiscal Year
Fiscal Year G.O. Bonds PBA COPS Master Lease Sub-totalFY 1997 (1) 57,835,000 - 24,000,000 - 81,835,000 FY 1998 (2) 75,775,000 - - - 75,775,000 FY 1999 (3) 102,220,000 - - - 102,220,000 FY 2000 (4) 152,740,000 - - 9,525,000 162,265,000 FY 2001 (5) 172,731,289 - 28,180,000 3,150,000 204,061,289 FY 2002 (6) 135,400,000 - - - 135,400,000 FY 2003 (7) 77,140,000 - - 3,890,000 81,030,000 FY 2004 79,770,000 - - - 79,770,000 FY 2005 (8) 87,095,000 - 132,460,000 6,950,000 226,505,000 FY 2006 (9) 93,385,000 - - 6,000,000 99,385,000 FY 2007 (10\) 118,785,000 - 35,865,000 9,100,000 163,750,000 FY 2008 (11) 131,755,000 - - - 131,755,000 FY 2009 (12) 95,375,000 - 54,610,000 - 149,985,000 FY 2010 (13) 144,665,000 - 11,000,000 - 155,665,000 FY 2011 - - - - - FY 2012 (14) 145,035,000 - 31,980,000 - 177,015,000 FY 2013 (15) 81,400,000 - 26,690,000 - 108,090,000 FY 2014 (16) 53,150,000 - - - 53,150,000 FY 2015 (17) 46,125,000 - 49,495,000 - 95,620,000 FY 2016 (18) 72,000,000 - - - 72,000,000 FY 2017 (19) 92,000,000 - 10,500,000 - 102,500,000 FY 2018 (20) 132,200,000 - 50,300,000 - 182,500,000 FY 2019 129,600,000 - - - 129,600,000 FY 2020 89,100,000 - - - 89,100,000 FY 2021 38,675,000 - - - 38,675,000
Total 3,266,775,557 161,375,000 492,580,000 86,345,000 3,749,700,557 (1) FY 1997 G.O. issuance dated April 1996. FY1997 includes COPS for DLT($24 million).(2) FY 1998 G.O. issuance dated June 1997; excludes refunding of EDC Shepard's debt as COPS.(3) FY 1999 G.O. issuance includes $15 million of debt for the FY1998 capital program issued as variable rate debt.(4) FY 2000 G.O.issuance includes $95.51 million for FY2000 projects and $57.23 million for FY2001 projects, COPS includes $9.525 million for vehicles, telecommunications, and rolling stock.(5) FY 2001 G.O.issuance includes $31.365 million for FY2001 projects, $141.4 for FY2002 projects.
COPS issuance reflects $28.2 million for the Pastore Center Power Plant, $3.15 million for master lease.(6) FY 2002 G.O.issuance includes $135.4 million for FY2002 projects.(7) FY 2003 includes GO issuance of $77.140 million for FY2004 projects, $3.89 m for master lease for
DOT trucks for FY2002.(8) FY 2005 includes GO issuance of $87.095 million for FY2005 projects. COPS includes $51.985 million for the
Training School, $58.91 million for the Kent County Courthouse, $21.565 million for Traffic Tribunaland $6.95 million for master lease.
(9) FY 2006 includes GO issuance of $93.385 million for FY2006 projects , and $6.0 million for master lease(10) FY 2007 includes GO issuance of $118.8 million for FY2007 projects , $23.490 milllion for the IT
initiative, $9.1 million for vehicle masterlease, and $12.735 million for Energy Conservation projects.(11) FY 2008 includes GO issuance of $131.755 million for FY 2008 projects.(12) FY 2009 includes GO Issuance of $95.375 million for FY 2009 projects, COPS include $11.805 million for
URI Energy, $12.38 for Innovative Technology, $30.425 million for School for the Deaf.(13) FY 2010 includes GO Issuance of $144.7 million for FY 2010 and FY 2011 projects, and COPS
includes $11.5 for the DMV System.(14) FY 2012 includes GO Issuance of $145.035 million for FY 2012 projects, and COPS includes $20.0 million
for Pastore/Zambarano Energy Conservation, $12.19 miilion for URI/CCRI Energy Conservation(15) FY 2013 includes GO Issuance of $81.4 million for FY 2013 projects and $26.7 million for energy conservation and IT COPS.(16) FY 2014 includes GO Issuance of $53.2 million for FY 2014 projects.(17) FY 2015 includes GO Issuance of $46.1 million for FY 2015 projects and $49.5 million for energy conservation and IT COPS.(18) FY 2016 includes GO Issuance of $72.0 million for FY 2016 projects.
(19) FY 2017 includes GO Issuance of $92.0 million for FY 2017 projects and $10.5 million for Nursing Education Center COPS.
(20) FY 2018 includes GO Issuance of $132.2 million for FY 2018 projects and COPS includes $12.0 million for energy efficiency
projects, $10.5 million for the CRMC CAD cells projects, $11.6 million for URI Energy Conservation and $16.2 million for IT projects.
G-1

Appendix G Summary of Tax Supported Debt Issuances by Fiscal Year
Fiscal Year Sub-total Convention Center DEPCO Other TotalFY 1997 81,835,000 - - - 81,835,000 FY 1998 (3) 75,775,000 - - 22,825,000 98,600,000 FY 1999 (4) 102,220,000 - - 16,375,000 118,595,000 FY 2000 162,265,000 - - - 162,265,000 FY 2001 204,061,289 - - - 204,061,289 FY 2002 (5) 135,400,000 - - 77,530,000 212,930,000 FY 2003 81,030,000 - - - 81,030,000 FY 2004 (6) 79,770,000 - - 55,270,000 135,040,000 FY 2005 226,505,000 - - - 226,505,000 FY 2006 (7) 99,385,000 - - 50,315,000 149,700,000 FY 2007 (8) 163,750,000 - - 14,280,000 178,030,000
FY 2008 (9) 131,755,000 - - 7,500,000 139,255,000 FY 2009 (10) 149,985,000 - - 162,410,000 312,395,000 FY 2010 155,665,000 - - - 155,665,000 FY 2011 (11) - - - 75,000,000 75,000,000 FY 2012 (12) 177,015,000 - - 5,500,000 182,515,000 FY 2013 (13) 108,090,000 - - 39,600,000 147,690,000 FY 2014 53,150,000 - - - 53,150,000 FY 2015 (14) 95,620,000 - - 75,000,000 170,620,000 FY 2016 72,000,000 - - - 72,000,000 FY 2017 (15) 102,500,000 - - - 102,500,000 FY 2018 182,500,000 - - 75,000,000 257,500,000 FY 2019 129,600,000 - - - 129,600,000 FY 2020 89,100,000 - - - 89,100,000 FY 2021 38,675,000 - - - 38,675,000
Total 3,749,700,557 323,000,000 456,466,923 - 735,675,000 5,394,442,480 (1) FY1995 includes Economic Development Corporation's lease for the Shepard's Building.(2) FY1996 includes Economic Development Corporation's lease with Fidelity.(3) FY1998 includes EDC obligation for McCoy Stadium($11.825 million), and EDC lease with Fleet($11.0 million)(4) FY1999 includes EDC obligation for URI Power Plant($16.9 million).(5) FY2002 includes $14.5 million of RI Housing and Mortgage Finance obligations for the Neighborhood Opportunities Program($11.62 million) and Travelers Aid Project($2.88 million), $10.0 million for the EDC's obligation resulting from the amended Fidelity lease, and $53.03 m for EDC Motor Fuel Bonds.(6) FY2004 includes $2.25 million of RI Housing and Mortgage Finance obligations for the Travelers Aid project,
and $53,030,000 of motor fuel bonds for transportation projects.(7) FY2006 includes $7.5 million for RIHMFC NOP and $42.815 million of motor fuel bonds for transportation projects.(8) FY2007 includes $14.3 million for EDC Masonic Temple(tax credits)(9) FY2008 includes $7.5 million for RIHMFC NOP for FY2007 projects(10) FY2009 includes $12.41 million of EDC motor fuel bonds for transportation projects, and $150 million for Historic
Tax Credit bonds. (11) FY 2011 includes $75.0 million for tha EDC Job Creation Guaranty program.(12) FY 2012 includes $5.5 million for the EDC Job Creation Guaranty program.(13) FY 2013 includes $38.6 million for the purchase of I-195 land and $1.0 million for the EDC Job Creation Guaranty program.(14) FY2015 includes $75.0 million for Historic Tax Credit bonds. (15) FY2017 includes $75.0 million for Historic Tax Credit bonds.
G-2

Appendix H Capital Budget
Glossary


Capital Budget Glossary
GLOSSARY 1 Amortization of Debt - The process of paying the principal amount of an issue of securities by periodic
payments either directly to security holders or to a sinking fund for the benefit of security holders. See: Debt Service; Debt Service Schedule.
Amortization Schedule - A table showing the gradual repayment of an amount of indebtedness, such as a
mortgage or bond, over a period of time. This table is often set up to show interest payments in addition to principal repayments. See: Debt Service Schedule.
Arbitrage - With respect to the issuance of municipal securities, arbitrage usually refers to the difference
between the interest paid on the tax-exempt securities and the interest earned by investing the security proceeds in higher-yielding taxable securities. Internal Revenue Service regulations govern arbitrage on the proceeds from issuance of governmental securities.
Authority - A unit or agency of government established to perform specialized functions, usually financed
by service charges, fees or tolls, although it may also have taxing powers. In many cases authorities have the power to issue debt which is secured by the lease rental payments made by a governmental unit using the facilities constructed with bond proceeds. An authority may function independently of other governmental units, or it may depend upon other units for its creation, funding or administrative oversight. Examples of authorities include health facilities authorities, industrial development authorities and housing authorities.
Authorization - The legal or statutory basis to issue debt, usually with a specific dollar limit.
Average Life or Average Maturity - The number of years to the point at which half of an issue will have
been redeemed. The average life is a reflection of the rapidity with which the principal of an issue is expected to be paid. Under one commonly used calculation method, it is equal to the total bond years divided by the total number of bonds (1 bond equals $1.000 par amount, regardless of actual certificate denomination); note that this computation method does not take into account the time value of the principal amounts. The formula for this computation is:
Total Bond Years Average Life = ───────── Number of Bonds Example: Issue size: $10,000,000 Interest rate: 7 percent Maturity of issue: 5 years 1 bond = $1,000 1 Primarily derived from the "Glossary of Municipal Securities Terms" Municipal Securities Rule Making
Board, 1985.
H-1

Capital Budget Glossary
(1) (2) (3) (4) Years Principal Number Bond Years of Bonds (1 x 3)
1 1,740 $1,740,000 1,740 2 3,720 1,860,000 1,860 3 5,970 1,990,000 1,990 4 8,520 2,130,000 2,130 5 11,400 2,280,000 2,280 Total 31,350 $10,000,000 10,000
31,350 ─────── = 3.135 years average life 10,000 Bond - Evidence of the issuer's obligation to repay a specified principal amount on a date certain (maturity
date), together with interest at a stated rated, or according to a formula for determining that rate. Bonds are distinguishable from notes, which usually mature in a much shorter period of time. Bonds may be classified according to maturity structure (serial vs. term), source of payment (general obligation vs. revenue), method of transfer (bearer vs. registered), issuer (state vs. municipality vs. special district) or price (discount vs. premium). Compare: Note.
Bond Anticipation Note - See: Note. Bond Counsel - An attorney (or firm of attorneys) retained by the issuer to give a legal opinion that the
issuer is authorized to issue proposed securities, the issuer has met all legal requirements necessary for issuance, and interest on the proposed securities will be exempt from federal income taxation and, or review and advise the issuer regard applicable, from state and local taxation. Typically, bond counsel may prepare, or review and advise the issuer regarding authorizing resolutions or ordinances, trust indentures, official statements, validation proceedings and litigation. The bond counsel may also be referred to as the "bond attorney," the "bond approving attorney" or the "bond approving counsel."
Bonded Debt - The portion of an issuer's total indebtedness represented by outstanding bonds: Direct Debt or Gross Bonded Debt - The sum of the total bonded debt and any short-term debt of the
issuer. Direct debt may be incurred in the issuer's own name or assumed through the annexation of territory or consolidation with another governmental unit.
Net Direct Debt or Net Bonded Debt - Direct debt less sinking fund accumulations and all self-
supporting debt. See: Debt Ratios.
H-2
Capital Budget Glossary
Bond Election or Bond Referendum - A process whereby the voters of a governmental unit are given the opportunity to approve or disapprove a proposed issue of municipal securities. An election is most commonly required in connection with general obligation bonds. Requirements for voter approval may be imposed by constitution, statute or local ordinance.
Bond Proceeds - The money paid to the issuer by the purchaser or underwriter of a new issue of municipal
securities. These moneys are used to finance the project or purpose for which the securities were issued and to pay certain costs of issuance as may be provided in the bond contract.
Capital Appreciation Bond or CAB - A long-term municipal security on which the investment return on an
initial principal amount is assumed to be reinvested at a stated compounded rate until maturity, at which time the investor receives a single payment (the "maturity value") representing both the initial principal amount and the total investment return. Several different types of capital appreciation bonds are issued, including compound interest bonds and multiplier bonds. Capital appreciation bonds are distinct from traditional zero coupon bonds because the investment return is considered to be in the form of compounded interest, rather than accreted original issue discount; for this reason only the initial principal amount of a capital appreciation bond would be counted against a municipal issuer's statutory debt limit, rather than the total par value, as in the case of a traditional zero coupon bond.
Costs of Issuance - The expenses associated with the sale of a new issue of municipal securities, including
such items as printing, legal and rating agency fees, and others. In certain cases, the underwriter's spread may be considered one of the costs of issuance.
Coupon - (1) A detachable part of a bond which evidences interest due. The coupon specifies the date,
place and dollar amount of interest payable, among other matters. Coupons may be redeemed (usually semi-annually) by detaching them from bonds and presenting them to the issuer's paying agent for payment or to a bank for collection.
(2) The term is also used colloquially to refer to a security's interest rate. Coupon Rate - The annual rate of interest payable on a coupon security expressed as a percentage of the
principal amount. Debt Limit - The maximum amount of debt which an issuer of municipal securities is permitted to incur
under constitutional, statutory or charter provisions. The debt limit is usually expressed as a percentage of assessed valuation.
Debt Ratios - Comparative statistics showing the relationship between the issuer's outstanding debt and such
factors as its tax base, income or population. Such ratios are often used in the process of determining credit quality of an issue, primarily on general obligation bonds. Some of the more commonly used ratios are (a) net overall debt to assessed valuation, (b) net overall debt to estimated full valuation, and (c) net overall debt per capita. See: Bonded Debt.
Debt Service - The amount of money necessary to pay interest on an outstanding debt, the principal of
maturing serial bonds and the required contributions to a sinking fund for term bonds. Debt service on bonds may be calculated on a calendar year, fiscal year, or bond fiscal year basis.
H-3
Capital Budget Glossary
Debt Service Reserve Fund - The fund in which moneys are placed which may be used to pay debt service if pledged revenues are insufficient to satisfy the debt service requirements. The debt service reserve fund may be entirely funded with bond proceeds, or it may only be partly funded at the time of issuance and allowed to reach its full funding requirement over time, due to the accumulation of pledged revenues. If the debt service reserve fund is used in whole or part to pay debt service, the issuer usually is required to replenish the funds from the first available funds or revenues. A typical reserve requirement might be the maximum aggregate annual debt service requirement for any year remaining until the bonds reach maturity. The size and investment of the reserve may be subject to arbitrage regulations. Under a typical revenue pledge this fund is the third to be funded out of the revenue fund.
Debt Service Schedule - A table listing the periodic payments necessary to meet debt service requirements
over the period of time the securities are to be outstanding. See: Amortization Schedule. Direct Debt - See: Bonded Debt. Fitch's Investor Services – An independent service which provides ratings for municipal securities and other financial information to investors. General Obligation Bond or G.O. Bond - A bond which is secured by the full faith and credit of an issuer
with taxing power. General obligation bonds issued by local units of government are typically secured by a pledge of the issuer's ad valorem taxing power; general obligation bonds issued by states are generally based upon appropriations made by the state legislature for the purposes specified. Ad valorem taxes necessary to pay debt service on general obligation bonds are often not subject to the constitutional property tax millage limits. Such bonds constitute debts of the issuer and normally require approval by election prior to issuance. In the event of default, the holders of general obligation bonds have the right to compel a tax levy or legislative appropriation, by mandamus or injunction, in order to satisfy the issuer's obligation on the defaulted bonds.
Interest - The amount paid by a borrower as compensation for the use of borrowed money. This amount is
generally an annual percentage of the principal amount. Issuing Bonds - To "issue" bonds means to sell, deliver, and receive payment for bonds. The State
generally issues bonds once a year upon determining the amount of cash necessary to implement projects during that year.
Issue of Bonds or Issue of Securities - Bonds or securities sold in one or more series which are authorized
under the same resolution or indenture and have the same dated date. Issuer - A state, political subdivision, agency or authority that borrows money through the sale of bonds or
notes.
H-4

Capital Budget Glossary
Lease Rental Bond - A bond from an issue which is secured by lease payments made by the party leasing the facilities financed by the issue. Typically, lease rental bonds are used to finance construction of facilities (e.g., schools or office buildings) used by a state or municipality, which leases the facilities from a financing authority. Often the leasing state or municipality is legally obligated to appropriate moneys from its general tax revenues to make lease payments: in some cases, however, lease payments will be made only from revenues associated with the facility financed (e.g., school tuition payments).
Legal Opinion or Legal or Approving Opinion - The written conclusions of bond counsel that the
issuance of municipal securities and the proceedings taken in connection therewith comply with applicable laws, and that interest on the securities will be exempt from federal income taxation and, where applicable, from state and local taxation. The legal opinion is generally printed on the securities. See: Bond Counsel.
Level Debt Service - A maturity schedule in which the combined annual amount of principal and interest
payments remains relatively constant over the life of the issue. Example: Level Debt Service Assumptions: Size of issue: $10,000,000 Interest rate: 7 percent Maturity of issue: 5 years Debt Schedule ═══════════════════════════════════════════════════ Years Principal Interest Total* ═══════════════════════════════════════════════════ 1 $1,740,000 $700,000 $ 2,440,000 2 1,860,000 578,200 2,438,200 3 1,990,000 448,000 2,438,000 4 2,130,000 308,700 2,438,700 5 2,280,000 159,600 2,439,600 Total $10,000,000 $2,194,500 $12,194,500 ═══════════════════════════════════════════════════
* Total of principal and interest remains substantially level throughout life of issue. Maturity or Maturity Date - The date upon which the principal of a municipal security becomes due and
payable to the security holder. Moral Obligation Bond - A bond, typically issued by a state agency or authority, which is secured by the
revenues from the financed project and, additionally, by a non-binding undertaking that any deficiency in pledged revenues will be reported to the state legislature which may apportion state moneys to make up the shortfall. Legislation authorizing the issuance of moral obligation securities typically grants the state legislature the authority to apportion money to support the debt service payments on any such securities, but does not legally oblige the legislature to do so.
H-5

Capital Budget Glossary
Note - A written, short-term promise of an issuer to repay a specified principal amount on a date certain, together with interest at a stated rate, payable from a defined source of anticipated revenue. Notes usually mature in one year or less, although notes of longer maturities are also issued. The following types of notes are common in the municipal market:
Bond Anticipation Notes (BANs) - Notes issued by a governmental unit, usually for capital
projects, which are paid from the proceeds of the issuance of long term bonds. Tax Anticipation Notes (TANs) - Notes issued in anticipation of future tax receipts, such as receipts of ad valorem taxes which are due and payable at a set time of the year. Notes may be issued to finance capital projects or to alleviate cash flow problems of the issuer. Compare: Bond. Per Capita Debt - The amount of an issuing municipality's debt outstanding divided by the population
residing in the municipality. This is often used as an indication of the issuer's credit position since it can be used to compare the proportion of debt borne per resident with that borne by the residents of other municipalities. See: Debt Ratios.
Premium - A bond that is trading above its par value. A bond will trade at a premium when it offers a
coupon rate that is higher than prevailing interest rates. This is because investors want a higher yield, and will pay more for it.
Principal - The face amount or par value of a security payable on the maturity date. Compare: Interest. Rating Agencies - The organizations which provide publicly available ratings of the credit quality of
securities issuers. The term is most often used to refer to the nationally recognized agencies, Moody's Investors Service, Inc., Standard & Poor's Corporation, and Fitch Investors.
Ratings - Evaluation of the credit quality of notes and bonds usually made by independent rating services.
Ratings are intended to measure the probability of the timely repayment of principal of and interest on municipal securities. Ratings are initially made before issuance and are periodically reviewed and may be amended to reflect changes in the issuer's credit position. The information required by the rating agencies varies with each issue, but generally includes information regarding the issuer's demographics, debt burden, economic base, finances and management structure. Many financial institutions also assign their own individual ratings to securities.
Referendum - A referendum is a means by which a legislative body requests the electorate to approve or
reject proposals such as constitutional amendments, long-term borrowing, and special laws affecting some cities and towns.
The Rhode Island Constitution prohibits the legislature from making an amendment to the Constitution
or from entering into a debt for over a one-year period without the consent of the electorate. When the General Assembly wishes to incur debt beyond a one-year period, it authorizes an election at which voters can approve or reject incurring long-term debt.
H-6

Capital Budget Glossary
Such a legislative request is always phrased as a question. The question is substantially in the following form: "Shall an act, passed at the January, 1990 Session of the General Assembly, entitled...be approved?"
Therefore, a referendum is called a question. Referenda is the plural form of the word. Refunding - A procedure whereby an issuer refinances an outstanding bond issue by issuing new bonds.
There are generally two major reasons for refunding: to reduce the issuer's interest costs or to remove a burdensome or restrictive covenant imposed by the terms of the bonds being refinanced. The proceeds of the new bonds are either deposited in escrow to pay the debt service on the outstanding obligations, when due (in which case the financing is known as an "advance refunding"), or used to immediately retire the outstanding obligations. The new obligations are referred to as the "refunding bonds," and the outstanding obligations being refinanced are referred to as the "refunded bonds" or the "prior issue." For accounting purposes, refunded obligations are not considered a part of the issuer's debt because the lien of the holders of the refunded bonds, in the first instance, is on the escrowed funds, not on the originally pledged source of revenues. The refunded bonds, however, will continue to hold a lien on the originally pledged source of revenues unless provisions have been made in the bond contract on the refunded bonds for defeasance of the bonds prior to redemption.
Revenue Bond - A bond which is payable from a specific source of revenue and to which the full faith and
credit of an issuer with taxing power is not pledged. Revenue bonds are payable from identified sources of revenue, and do not permit the bondholders to compel taxation or legislative appropriation of funds not pledged for payment of debt service. Pledged revenues may be derived from operation of the financed project, grants and excise or other specified not-ad-valorem taxes. Generally, no voter approval is required prior to issuance of such obligations. Compare: General Obligation Bond.
Serial Bonds - Bonds of an issue in which some bonds mature in successive years without interruption.
Compare: Term Bonds. Tax Anticipation Note - See: Note. Term Bonds - Bonds comprising a large part or all of a particular issue which come due in a single maturity.
The issuer usually agrees to make periodic payments into a sinking fund for mandatory redemption of term bonds before maturity or for payment at maturity. Compare: Serial Bonds.
Unissued Bond Authorization (Unissued Bonds) - The balance remaining from a legal or statutory
authorization, after taking into account the amount of bonds already issued.
H-7