20181025 analystenpresentatie london roadshow pp · london roadshow october 25, 2018 the connection...
TRANSCRIPT

London RoadshowLondon RoadshowLondon RoadshowLondon RoadshowOctober 25, 2018
The Connection to the world of Sustainable Tropical Agriculture 1
SIPEF financial statements SIPEF financial statements SIPEF financial statements SIPEF financial statements June 2018June 2018June 2018June 2018

SummarySummarySummarySummary
1. SIPEF Group Company profile
2. SIPEF group - Expansion
3. SIPEF Group – Productions & prices
4. SIPEF group – Financial performance
5. Peer review
The Connection to the world of Sustainable Tropical Agriculture
2

SummarySummarySummarySummary
1. SIPEF Group Company profile
2. SIPEF group - Expansion
3. SIPEF Group – Productions & prices
4. SIPEF group – Financial performance
5. Peer review
The Connection to the world of Sustainable Tropical Agriculture
3

1. SIPEF group - Company profile
The Connection to the world of Sustainable Tropical Agriculture 4
Agriculture • 1st segment of the supply chain - commodities
Tropical • Recent industrialised countries
Sustainable • Audited certifications
Connection • Publicly quotedPublicly quotedPublicly quotedPublicly quoted

1. SIPEF group - Company profile
The Connection to the world of Sustainable Tropical Agriculture 5
Continuous production
• Continuous crops
Diversified in product
• Palm oil : basic commodity for food (and recently energy)
• Rubber : cyclic business - tire industry
Diversified in origin
• Indonesia : leading producing country within Asian market
• PNG : export oriented with strong agronomical basics
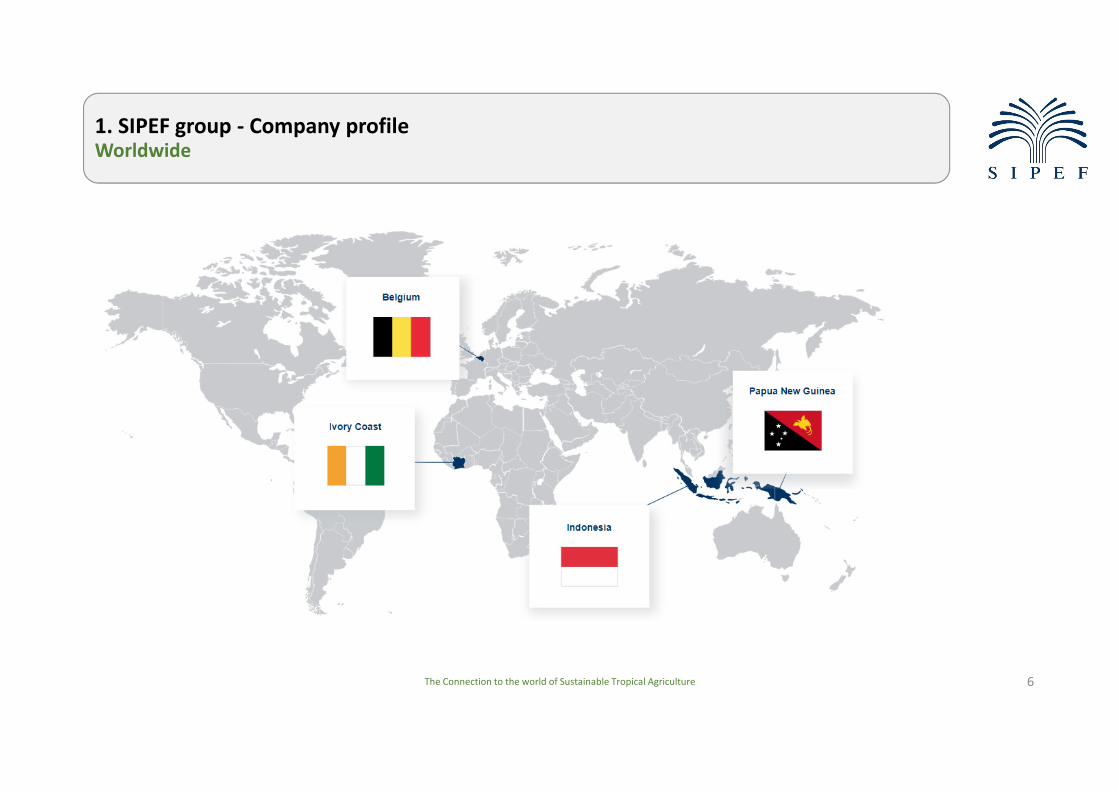
1. SIPEF group - Company profileWorldwide
The Connection to the world of Sustainable Tropical Agriculture 6

1. SIPEF group - Company profileIndonesia
7
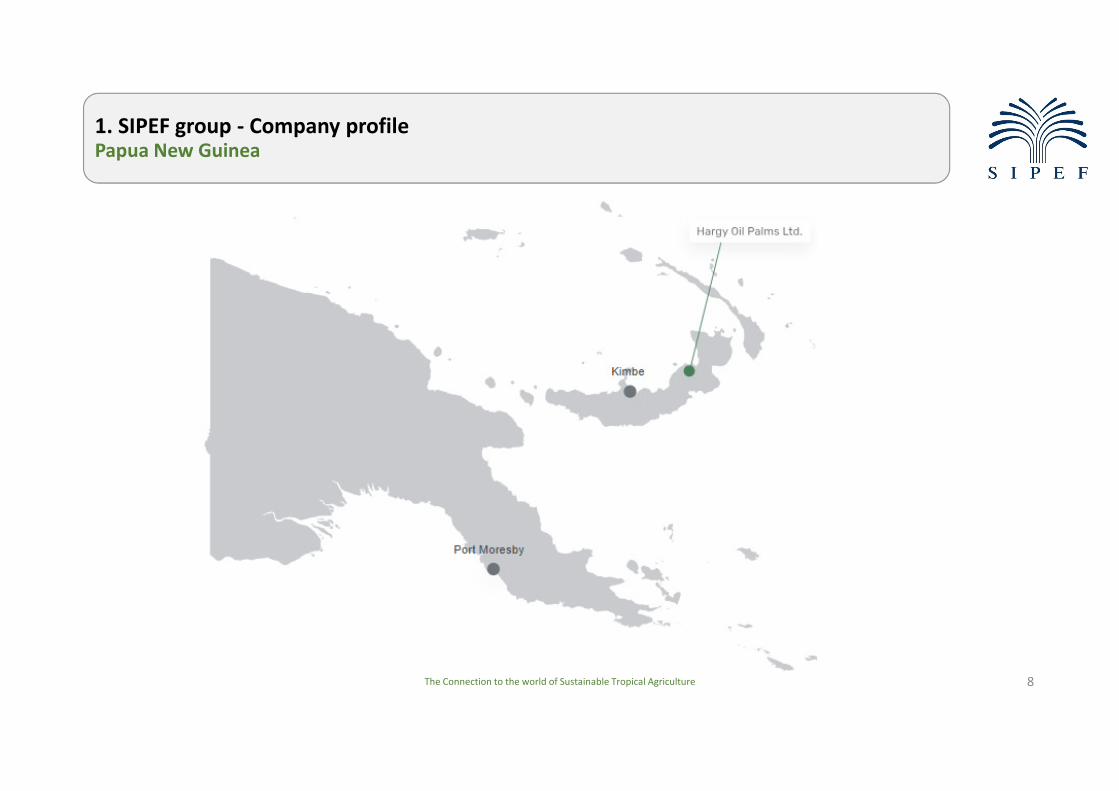
1. SIPEF group - Company profilePapua New Guinea
The Connection to the world of Sustainable Tropical Agriculture 8

1. SIPEF group - Company profilePlanted hectares summary – 30 June 2018
The Connection to the world of Sustainable Tropical Agriculture 9
Palm Rubber Tea Bananas Other Total % Group share
Indonesia 56 425 6 121 1 752 64 298 82% 57 936
PNG 13 622 13 622 17% 13 622
Ivory coast 690 42 732 1% 732
Total 70 047 6 121 1 752 690 42 78 652 100% 72 290
% 89% 8% 2% 1% 0% 100%
Group share 64 739 5 237 1 581 690 42 72 290

• In the coming 40 years, mankind will have to produce more food than in the previous 10 000 years put together
1. SIPEF group - Company profilePalm oil in the world - Population growth
The Connection to the world of Sustainable Tropical Agriculture 10
• Population growth will have a
huge impact on future food
demands
• Rising middle class is causing diet
changes in developing countries
• Agricultural land is increasingly
becoming scarcer
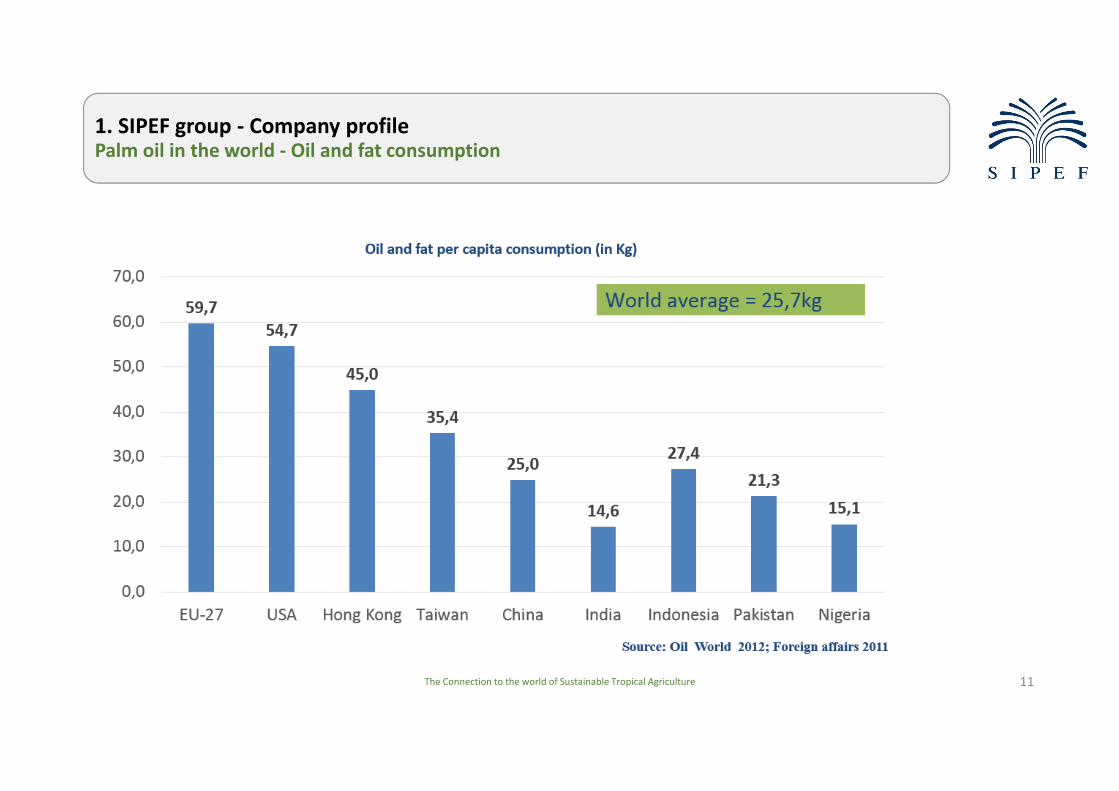
1. SIPEF group - Company profilePalm oil in the world - Oil and fat consumption
The Connection to the world of Sustainable Tropical Agriculture 11
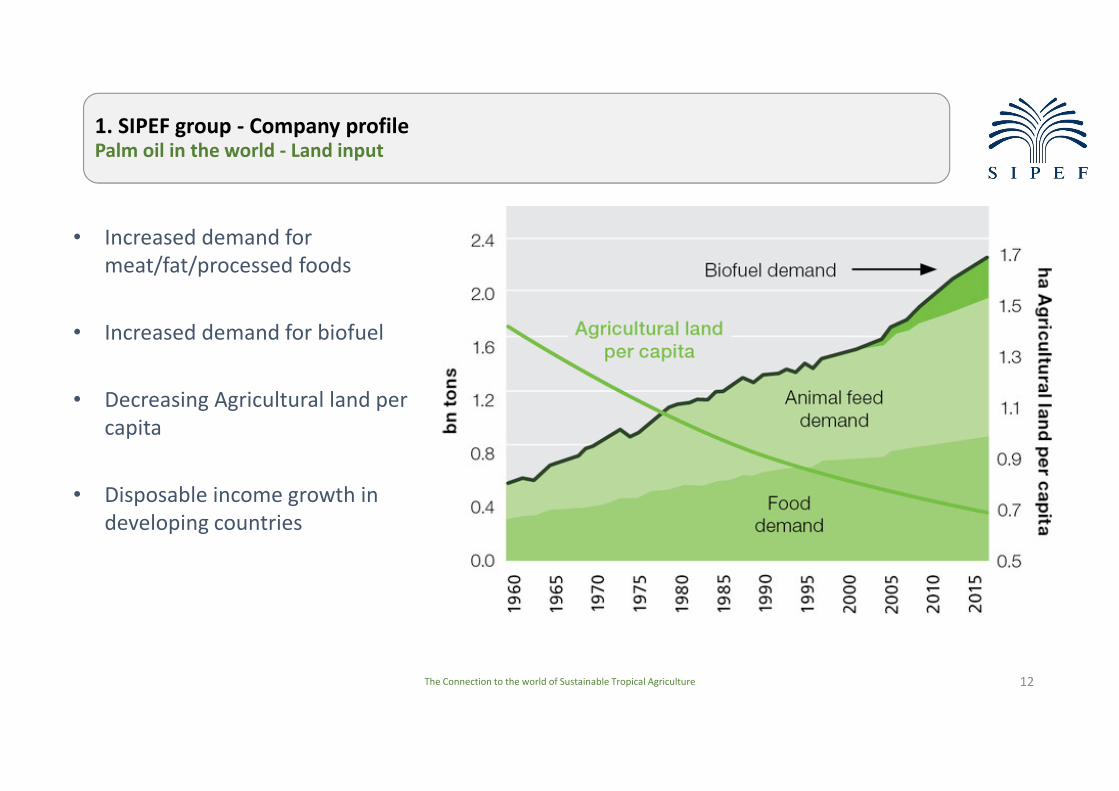
1. SIPEF group - Company profilePalm oil in the world - Land input
The Connection to the world of Sustainable Tropical Agriculture 12
• Increased demand for
meat/fat/processed foods
• Increased demand for biofuel
• Decreasing Agricultural land per
capita
• Disposable income growth in
developing countries

1. SIPEF group - Company profilePalm oil in the world - Sources for deforestation
The Connection to the world of Sustainable Tropical Agriculture 13

1. SIPEF group - Company profilePalm oil in the world - Vegetable oils
The Connection to the world of Sustainable Tropical Agriculture 14
31%
24%
12%
9%
4%
20%
2017: 220,0 million tonnes
Palm oil Soya oil
Rape oil Sunflower oil
Palm kernel and coconut oil Other oils/animals fats
16%
21%
11%9%
6%
37%
Palm oil Soya oil
Rape oil Sunflower oil
Palm kernel and coconut oil Other oils/animal fats
1994/95: 93,1 million tonnes

1. SIPEF group - Company profilePalm oil in the world - Comparison to other oils
The Connection to the world of Sustainable Tropical Agriculture 15
Resources used per vegetable oil:

1. SIPEF group - Company profilePalm oil in the world - Palm oil production
The Connection to the world of Sustainable Tropical Agriculture 16
54%
29%
4%
3%1%
6%
3%
2017 Palm oil production
(Total of 67,1 Mn Tonnes)
Indonesia Malaysia Thailand Africa Oceania Middle & South America Oth. Countries

1. SIPEF group - Company profilePalm oil in the world - Palm oil consumption
The Connection to the world of Sustainable Tropical Agriculture 17
11%
2%
2%
6%
65%
14%0%
2014/15 World consumption
Europe Russia North America South America Asia and the middle east Africa Oceania

1. SIPEF group - Company profilePalm oil in the world - Biodiesel
The Connection to the world of Sustainable Tropical Agriculture 18
12%
10%
20%
27%
10%
21%
31%
Biodiesel 2017
(Total of 35,2 Mn tonnes)
Other oils & fats Used cooking oil Rapeseed oil Soya oil Palm oil EU Palm oil non-EU
3,5 Mn ton
7,5 Mn ton

1. SIPEF group - Company profilePalm oil in the world - Sustainable palm oil
The Connection to the world of Sustainable Tropical Agriculture 19
In 2017 approximately 3,55 million tons entered the market as ‘segregated’ (100% traceable)
SIPEF = 100% certified oil and > 350.000 tons ‘segregated’
2,86 Million Ha RSPO certified production area

SummarySummarySummarySummary
1. SIPEF Group Company profile
2. SIPEF group - Expansion
3. SIPEF Group – Productions & prices
4. SIPEF group – Financial performance
5. Peer review
The Connection to the world of Sustainable Tropical Agriculture
20

2. SIPEF group - ExpansionStrategy & expansion
The Connection to the world of Sustainable Tropical Agriculture 21
SIPEF group= 100.000 Ha planted (group’ share)
• Palmoil – Rubber – Bananas – Tea
• Indonesia – Papua New Guinea
Focus on core-business
Focus on ‘Sustainable Agriculture’ (RSPO)
Expansion of existing activities
Acquisition of new investments
Balanced leverage
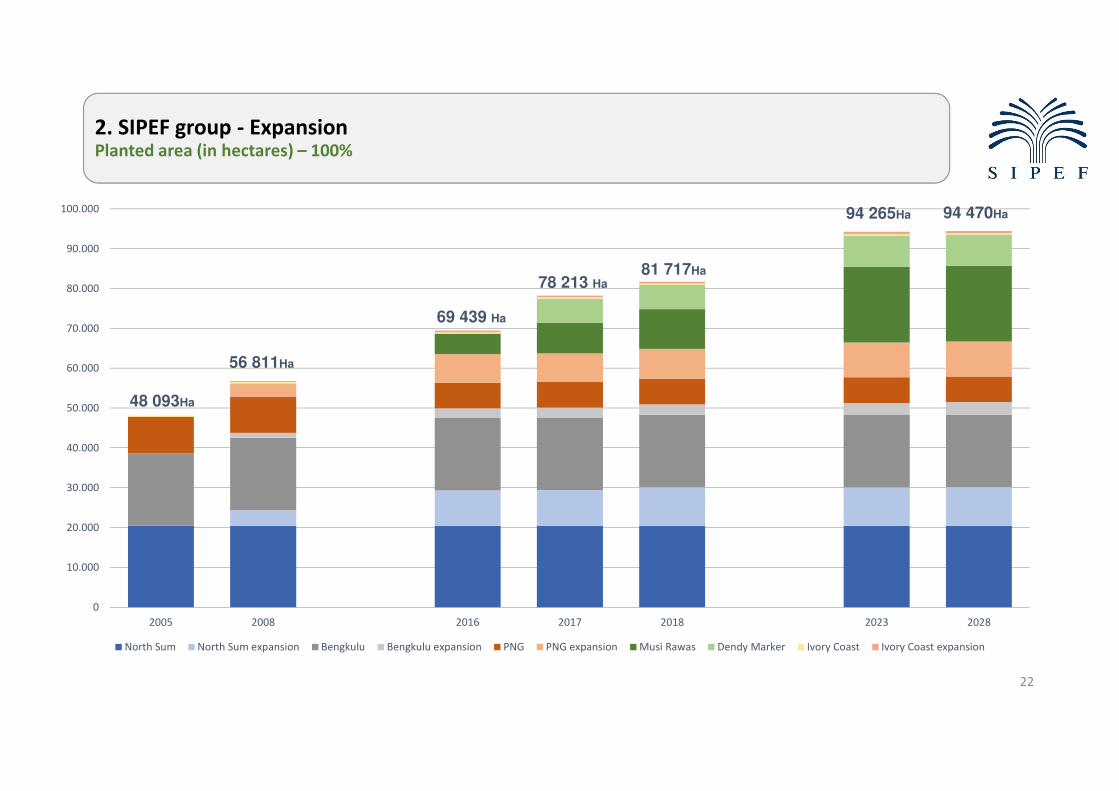
2. SIPEF group - ExpansionPlanted area (in hectares) – 100%
22
0
10.000
20.000
30.000
40.000
50.000
60.000
70.000
80.000
90.000
100.000
2005 2008 2016 2017 2018 2023 2028
North Sum North Sum expansion Bengkulu Bengkulu expansion PNG PNG expansion Musi Rawas Dendy Marker Ivory Coast Ivory Coast expansion
48 093Ha
56 811Ha
69 439 Ha
78 213 Ha
81 717Ha
94 265Ha 94 470Ha

2. SIPEF group - ExpansionSupply base (in hectares): own ha and outgrowers ha – 100%
The Connection to the world of Sustainable Tropical Agriculture 23
81
.71
7
87
.40
8
91
.20
3
93
.29
6
94
.09
9
94
.26
5
94
.33
1
94
.32
9
94
.44
1
94
.46
2
94
.47
0
19
.65
6
20
.53
8
21
.28
6
21
.65
2
21
.78
6
21
.78
6
21
.78
6
21
.78
6
21
.78
6
21
.78
6
21
.78
6
0
20.000
40.000
60.000
80.000
100.000
120.000
140.000
2018 2019 2020 2021 2022 2023 2024 2025 2026 2027 2028
Own ha Outgrowers ha

2. SIPEF group - Expansion100% CPO production (including plasma and outgrowers – NO FFB)
The Connection to the world of Sustainable Tropical Agriculture 24
0
100.000
200.000
300.000
400.000
500.000
600.000
700.000
2017 2018 2019 2020 2021 2022 2023 2024 2025 2026 2027 2028
Outgrowers
Own
2028
Own: 480 Kton
Outg: 119 Kton
Total: 599 Kton

2. SIPEF group - ExpansionEvolution mature-immature ha oil palm – 100%
The Connection to the world of Sustainable Tropical Agriculture 25
0
10.000
20.000
30.000
40.000
50.000
60.000
70.000
80.000
90.000
2017 2018 2019 2020 2021 2022 2023 2024 2025 2026 2027 2028
Mature Immature

2. SIPEF group - ExpansionYield per hectare CPO
The Connection to the world of Sustainable Tropical Agriculture 26
0
1
2
3
4
5
6
7
2008 2009 2010 2011 2012 2013 2014 2015 2016 2017 2018 2019 2020 2021 2022 2023 2024 2025 2026 2027 2028
Yie
ld/h
ect
are
CP
O
CPO/ha mature
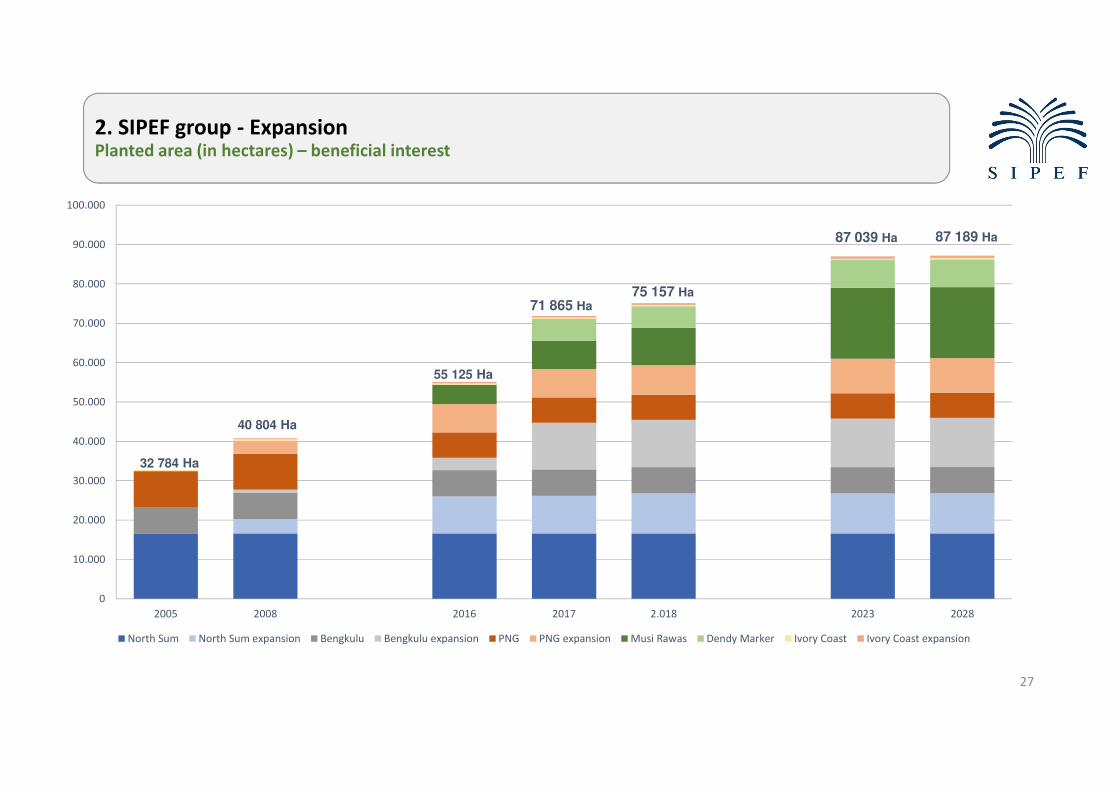
2. SIPEF group - ExpansionPlanted area (in hectares) – beneficial interest
27
0
10.000
20.000
30.000
40.000
50.000
60.000
70.000
80.000
90.000
100.000
2005 2008 2016 2017 2.018 2023 2028
North Sum North Sum expansion Bengkulu Bengkulu expansion PNG PNG expansion Musi Rawas Dendy Marker Ivory Coast Ivory Coast expansion
55 125 Ha
71 865 Ha
75 157 Ha
87 189 Ha87 039 Ha
32 784 Ha
40 804 Ha

2. SIPEF group - ExpansionPlanted hectares and production of CPO (sale of FFB not included) (BI)
The Connection to the world of Sustainable Tropical Agriculture 28
100%
110%
120%
130%
140%
150%
160%
170%
180%
BI hectares
BI production
+ 74%
+ 23%

2. SIPEF group - ExpansionMusi Rawas expansion
The Connection to the world of Sustainable Tropical Agriculture 29
Sumatra
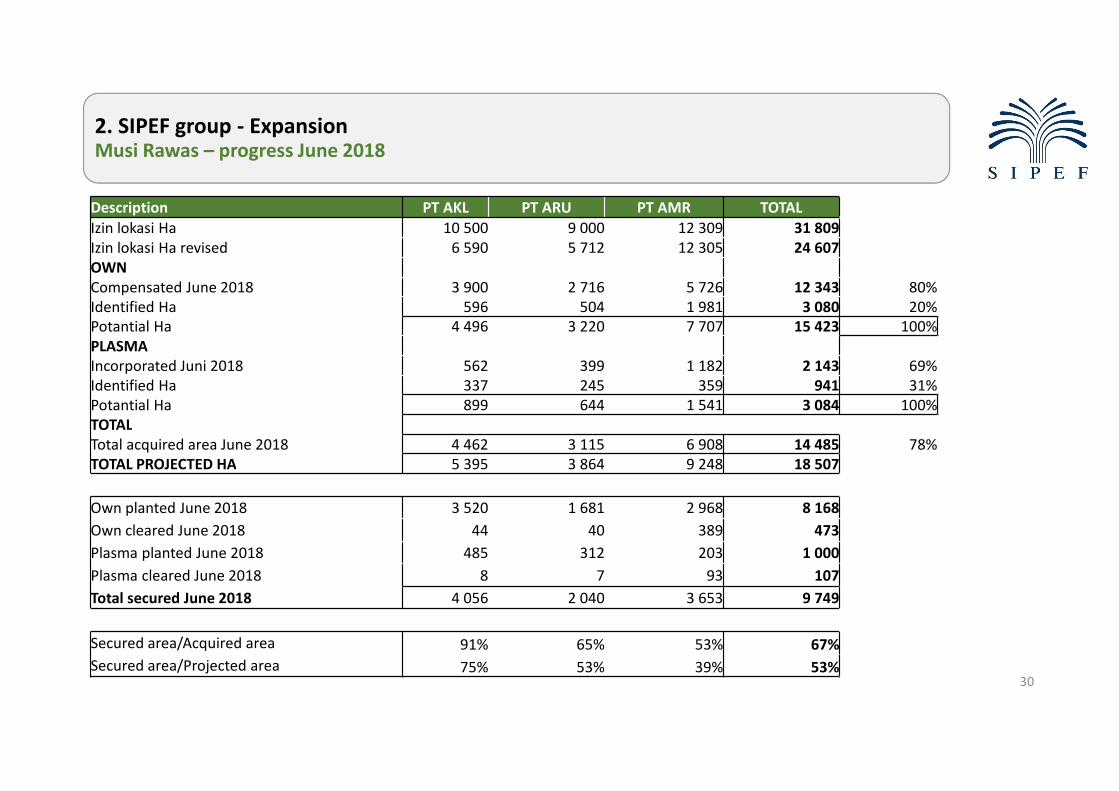
2. SIPEF group - ExpansionMusi Rawas – progress June 2018
30
Description PT AKL PT ARU PT AMR TOTAL
Izin lokasi Ha 10 500 9 000 12 309 31 809
Izin lokasi Ha revised 6 590 5 712 12 305 24 607
OWN
Compensated June 2018 3 900 2 716 5 726 12 343 80%
Identified Ha 596 504 1 981 3 080 20%
Potantial Ha 4 496 3 220 7 707 15 423 100%
PLASMA
Incorporated Juni 2018 562 399 1 182 2 143 69%
Identified Ha 337 245 359 941 31%
Potantial Ha 899 644 1 541 3 084 100%
TOTAL
Total acquired area June 2018 4 462 3 115 6 908 14 485 78%
TOTAL PROJECTED HA 5 395 3 864 9 248 18 507
Own planted June 2018 3 520 1 681 2 968 8 168
Own cleared June 2018 44 40 389 473
Plasma planted June 2018 485 312 203 1 000
Plasma cleared June 2018 8 7 93 107
Total secured June 2018 4 056 2 040 3 653 9 749
Secured area/Acquired area 91% 65% 53% 67%
Secured area/Projected area 75% 53% 39% 53%

2. SIPEF group - ExpansionMusi Rawas – progress June 2018
31
June 2018Compensation Ha Cleared/Planted Ha
Correct Planted Clearedplanted/
Area YTD 2017 jun/18 TOTAL YTD 2017 planted jun/18 jun/18 TOTALcompensated
AKL 3 759 141 3 900 3 776 -407 151 44 3 564 91,4%
ARU 2 626 90 2 716 1 558 -13 135 40 1 721 63,4%
AMR 4 789 937 5 726 2 410 -33 590 389 3 357 58,6%
Plasma 2 109 34 2 143 929 -39 110 107 1 107 51,7%
TOTAL 13 283 1 202 14 485 8 673 -491 986 580 9 749 67,3%

2. SIPEF group - ExpansionMusi Rawas – South Sumatra summary of project status
32
Latest update Izin Lokasi Expansion TOTAL Planted Identified Potential INTI PLASMA
HGU Izin Lokasi HGU/IZIN Cleared development
PT AKL 6 590 6 590 4 056 1 339 5 395 4 496 899
PT AKL II 3 137 3 137 0 1 569 1 569 1 307 261
PT ARU 5 712 5 712 2 040 1 824 3 864 3 220 644
PT AMR I+II 12 305 12 305 3 653 5 595 9 248 7 707 1 541
PT AMR III 1 303 1 303 0 652 652 543 109
Metafocus 4 201 4 201 0 2 101 2 101 1 750 350
Dendymarker 17 793 17 793 8 986 8 986 6 205 2 781
DIL Newplant 0 0 1 604 1 604 1 604 0
TOTAL 42 400 8 641 51 041 18 735 14 683 33 418 26 832 6 586

2. SIPEF group - ExpansionMusi Rawas compensated area June 2018
33
0
2 000
4 000
6 000
8 000
10 000
12 000
14 000
okt
/11
de
c/1
1
feb
/12
ap
r/1
2
jun
/12
au
g/1
2
okt
/12
de
c/1
2
feb
/13
ap
r/1
3
jun
/13
au
g/1
3
okt
/13
de
c/1
3
feb
/14
ap
r/1
4
jun
/14
au
g/1
4
okt
/14
de
c/1
4
feb
/15
ap
r/1
5
jun
/15
au
g/1
5
okt
/15
de
c/1
5
feb
/16
ap
r/1
6
jun
/16
au
g/1
6
okt
/16
de
c/1
6
feb
/17
ap
r/1
7
jun
/17
au
g/1
7
okt
/17
de
c/1
7
feb
/18
ap
r/1
8
jun
/18
au
g/1
8
okt
/18
de
c/1
8
Cumulative Compensated Area (Ha) ARU AMR AKL

2. SIPEF group - ExpansionMusi Rawas planted area up to june 2018
34
0
1000
2000
3000
4000
5000
6000
7000
8000
9000
10000
He
cta
res
Cumulative Planted Area (Ha) AKL ARU AMR

SummarySummarySummarySummary
1. SIPEF Group Company profile
2. SIPEF group - Expansion
3. SIPEF Group – Productions & prices
4. SIPEF group – Financial performance
5. Peer review
The Connection to the world of Sustainable Tropical Agriculture
35

3. SIPEF group – Productions & pricesSeptember production 2018
36
In Tonnes September 2018 September 2017 YoY%
Palm oil own
- Tolan Tiga Group 53 313 50 639 5,3%
- UMW/TUM Group 32 423 29 928 8,3%
- Agro Muko Group 65 336 58 384 11,9%
- South Sumatra Group 3 990 360 1008%
- Hargy Oil Palms 62 450 61 341 1,8%
Total palm oil own 217 512 200 652 8,4%
Total palm oil outgrowers 44 168 45 393 -2,7%
Total palm oil 261 680 246 045 6,4%
In Tonnes September 2018 September 2017 YoY%
Total rubber 5 917 6 121 -3,3%
Total tea 1 658 1 747 -5,1%
Total bananas 20 563 22 115 -7,0%

3. SIPEF group – Productions & pricesMarkets
The Connection to the world of Sustainable Tropical Agriculture 3730/10/2018
Rating Bullish inputs Bearish inputs
Palm Oil
SO 530
ND 545
JFM 580
AMJ 595
Neutral - Malaysian production underperforming.
- Indonesia has increased the blending targets,
and 20% for the last quarter is realistic. 30%
for 2019 looks more feasible with Jokowi’s
support.
- Also more biodiesel exports, leading to
capacity constraints in Indo biodiesel industry.
- Petro market close to the $80 per barrel level.
- El Nino story becoming more vocal, 70%
chance. But looks to be a mild one.
- Latest MPOB report very disappointing, with slow exports
and stocks increasing more than expected
- Palm oil stocks remain high and will increase in the coming
months both in Indo and Mal.
- China/US trade war still having a negative impact on
agricultural products.
- USDA soybean production at a new record high, with
massive yields, leading to a very bearish US bean story.
- Bigger hectares in Brazil and Argy expected for soybeans
- Very good sun seed production in Ukraine and Russia, will
fight for Indian demand.
Rubber
RSS3 1460
SIR10 1344
Neutral - Rubber is cheap, touching cost of production! - Market long term outlook is that is still a small over-
production until 2025.
- High stocks in China.
- Customers very lackluster.
Tea Friendly - Winter demand kicking in - Pakistan instable politics / economy

3. SIPEF group – Productions & pricesMonthly palm oil (CIF Rotterdam USD/ton)
The Connection to the world of Sustainable Tropical Agriculture 38
500
550
600
650
700
750
800
Jan Feb Mar Apr May Jun Jul Aug Sep Oct Nov Dec
2016
2017
2018

3. SIPEF group – Productions & pricesPalm oil (FOB Malaysia) and its main competitor (monthly prices)
The Connection to the world of Sustainable Tropical Agriculture 39
FOB Malaysia
0
200
400
600
800
1.000
1.200
1.400
1.600
1.800
20
06
M0
1
20
06
M0
4
20
06
M0
7
20
06
M1
0
20
07
M0
1
20
07
M0
4
20
07
M0
7
20
07
M1
0
20
08
M0
1
20
08
M0
4
20
08
M0
7
20
08
M1
0
20
09
M0
1
20
09
M0
4
20
09
M0
7
20
09
M1
0
20
10
M0
1
20
10
M0
4
20
10
M0
7
20
10
M1
0
20
11
M0
1
20
11
M0
4
20
11
M0
7
20
11
M1
0
20
12
M0
1
20
12
M0
4
20
12
M0
7
20
12
M1
0
20
13
M0
1
20
13
M0
4
20
13
M0
7
20
13
M1
0
20
14
M0
1
20
14
M0
4
20
14
M0
7
20
14
M1
0
20
15
M0
1
20
15
M0
4
20
15
M0
7
20
15
M1
0
20
16
M0
1
20
16
M0
4
20
16
M0
7
20
16
M1
0
20
17
M0
1
20
17
M0
4
20
17
M0
7
20
17
M1
0
20
18
M0
1
20
18
M0
4
20
18
M0
7
Palm oil Soybean oil

3. SIPEF group – Productions & pricesMonthly rubber (RSS3 Singapore USD/ton)
The Connection to the world of Sustainable Tropical Agriculture 40
1 000
1 200
1 400
1 600
1 800
2 000
2 200
2 400
2 600
2 800
Jan Feb Mar Apr May Jun Jul Aug Sep Oct Nov Dec
2016
2017
2018

3. SIPEF group – Productions & pricesMonthly tea prices (Mombasa/Nairobi auctions USD/ton)
The Connection to the world of Sustainable Tropical Agriculture 41
1 500
1 700
1 900
2 100
2 300
2 500
2 700
2 900
3 100
3 300
Jan Feb Mar Apr May Jun Jul Aug Sep Oct Nov Dec
2016
2017
2018
SummarySummarySummarySummary
1. SIPEF Group Company profile
2. SIPEF group - Expansion
3. SIPEF Group – Productions & prices
4. SIPEF group – Financial performance
5. Peer review
The Connection to the world of Sustainable Tropical Agriculture
42

4. SIPEF group – Financial performanceSales – Consolidated gross margin
43
Total consolidated turnover (including corporateTotal consolidated turnover (including corporateTotal consolidated turnover (including corporateTotal consolidated turnover (including corporate)– June 2018: 139 973 KUSD
– June 2017: 157 017 KUSD
134 541
8 8454 123
8 790
123 208
4 979 2 9298 342
-5 000
15 000
35 000
55 000
75 000
95 000
115 000
135 000
155 000
Palm Rubber Tea Bananas
2017 Sales 2017 Gross Margin 2018 Sales 2018 Gross Margin
38,4%
36,4%
30,7%-8,8% 8,4%
13,1%22,4%
15,8%

4. SIPEF group – Financial performanceGross profit –per product
44
In KUSD 2018 in % 2017 in %
Palm 44 819 96,2% 51 731 90,1%
Rubber -440 -0,9% 2 713 4,7%
Tea 383 0,8% 345 0,6%
Bananas 1 319 2,8% 1 966 3,4%
Corporate and others 515 1,1% 717 1,2%
Total 46 596 100,0% 57 472 100,0%
Gross profit (June YTD)

4. SIPEF group – Financial performanceProfit and loss statement (management presentation)
45
Profit and loss (June YTD)
In KUSD 2018 2017
Gross Profit 46 597 57 472
Services and administration -16 306 - 14 930
Other operating income/(charges) -361 1 007
Operating result 29 930 43 549
Financial income 1 089 784
Financial charges -1 497 -1 683
Exchange result -909 937
Profit before tax 28 613 43 587
Tax -9 479 -12 391
Profit after tax 19 134 31 196
Share of associates and JV’s -511 3 100
Result from continuing operations 18 623 34 296

4. SIPEF group – Financial performanceProfit and loss statement (management presentation)
46
Profit and loss (June YTD)
In KUSD 2018 2017
Result from continuing operations 18 623 34 296
Gain on sale BDM-ASCO 7 380 0
Revaluation gain acquisition PT Agro Muko 0 79 324
Profit for the period 26 003 113 620
Result from continuing operations share of the group 17 391 32 250
Gain on sale BDM-ASCO Share of the group 7 380 0
Revaluation gain acquisition PT Agro Muko Share of the group 0 75 182
Profit for the period Share of the group 24 771 107 432

4. SIPEF group – Financial performanceProfit and loss statement
47
Sale BDM-ASCO insurance
• As announced on 18 December 2017, the sale of BDM-ASCO was finalised and handed over on 7 June 2018
• Total net cash amount received: 20 467 KUSD (20 804 KUSD – 0.337 KUSD)
• Total one-off gain: 7 380 KUSD
• Deconsolidated as of 1 January 2018. The result up to 7 June 2018 was immaterial.
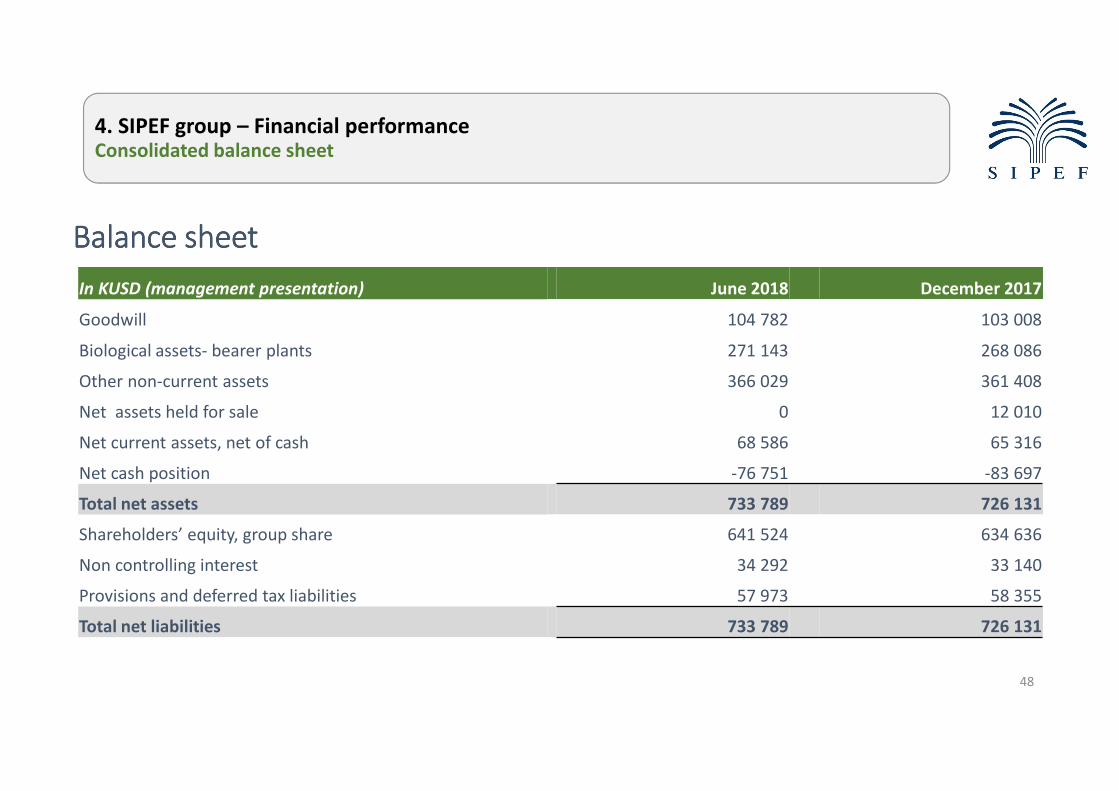
4. SIPEF group – Financial performanceConsolidated balance sheet
48
In KUSD (management presentation) June 2018 December 2017
Goodwill 104 782 103 008
Biological assets- bearer plants 271 143 268 086
Other non-current assets 366 029 361 408
Net assets held for sale 0 12 010
Net current assets, net of cash 68 586 65 316
Net cash position -76 751 -83 697
Total net assets 733 789 726 131
Shareholders’ equity, group share 641 524 634 636
Non controlling interest 34 292 33 140
Provisions and deferred tax liabilities 57 973 58 355
Total net liabilities 733 789 726 131
Balance sheetBalance sheetBalance sheetBalance sheet

4. SIPEF group – Financial performanceConsolidated cash flow
49
In KUSD (management presentation) June 2018 June 2017
Cash flow from operating activities 48 471 58 097
Change in net working capital -21 304 6 854
Income taxes paid -11 154 -2 021
Cash flow from operating activities after tax 16 013 62 930
Acquisitions intangible and tangible assets -29 194 -24 175
Sales of PP&E and financial assets (excl BDM-ASCO) 1 309 1 633
Acquisition financial assets -99 -350
Recurring free cash flow -11 971 40 037
Selling price BDM-ASCO 20 467 0
Purchase price PT Agro Muko 0 -124 977
Capital Increase 0 95 037
Other financing activities -16 537 5 486
Net increase in investments, cash and cash equivalents -8 041 15 583
Cash FlowCash FlowCash FlowCash Flow

4. SIPEF group – Financial performanceValue per hectare
50
Sensitivity 30/06/2018
Market price (closing 30/06/2018) 63,00EUR Share price EUR @ USD per hectare
50,00 8.908
Number of shares 10.579.328 55,00 9.733
Own shares -123.300 60,00 10.559
10.456.028 63,00 11.054
65,00 11.384
EUR/USD 1,1684 70,00 12.210
75,00 13.036
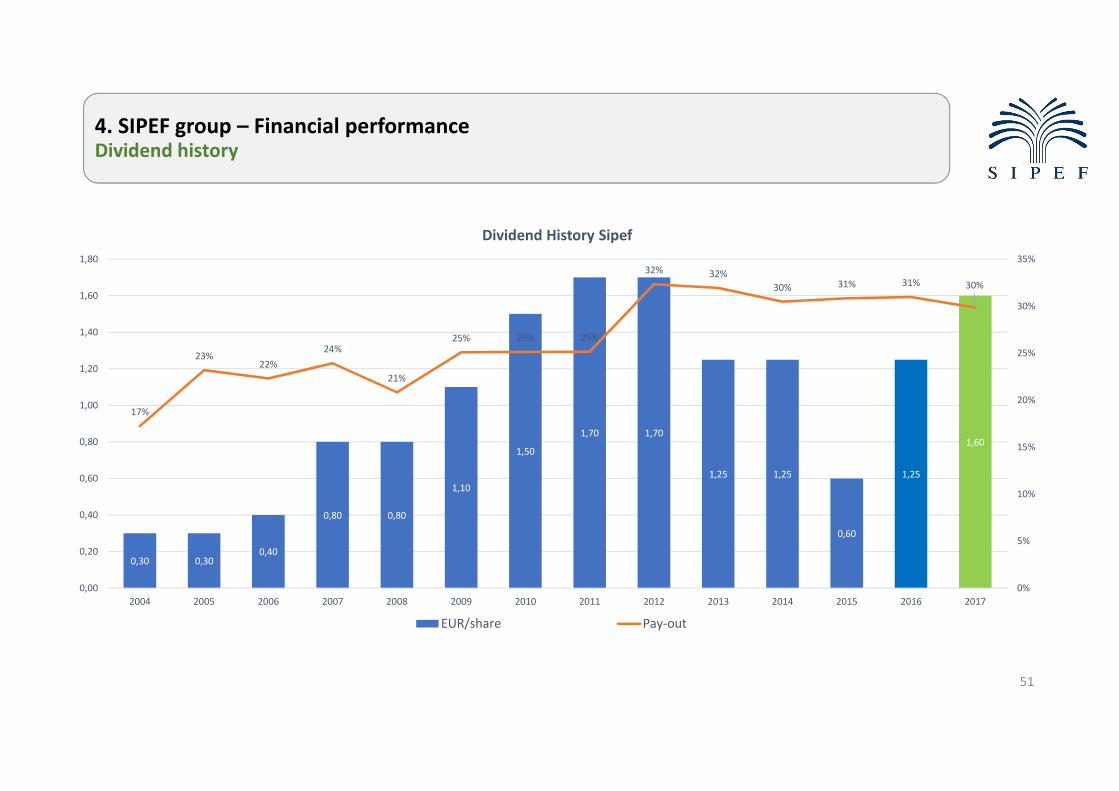
4. SIPEF group – Financial performanceDividend history
51
0,30 0,300,40
0,80 0,80
1,10
1,50
1,70 1,70
1,25 1,25
0,60
1,25
1,60
17%
23%22%
24%
21%
25% 25% 25%
32% 32%
30% 31% 31% 30%
0%
5%
10%
15%
20%
25%
30%
35%
0,00
0,20
0,40
0,60
0,80
1,00
1,20
1,40
1,60
1,80
2004 2005 2006 2007 2008 2009 2010 2011 2012 2013 2014 2015 2016 2017
Dividend History Sipef
EUR/share Pay-out

4. SIPEF group – Financial performanceProspects – comments press release October 18, 2018
52
Production
As in previous quarters, we observed an enduring increase in palm oil fruit and palm oil production
volumes across all SIPEF group plantations at the beginning of the fourth quarter. We maintain our
expectation of at least 9% growth in our palm oil production.
We do not expect a further fall in rubber volumes toward the end of the year. We expect the annual
volumes to recover.
Expectations remain rather negative for the disappointing tea production in Cibuni, Java.
For the banana production in Ivory Coast, the full impact of the steps taken to increase the volumes for
export to Europe will probably only be felt at the beginning of 2019.
Markets
The palm oil market is currently in its peak production period and will probably face high stocks until
the end of the year.
With the rather limited production growth ahead of us in 2019, this additional biodiesel demand will
certainly provide enough incentive for significantly higher markets.
The rubber market remains lacklustre and unless there is new input, it is likely to stay in this narrow
trading range.
Demand for tea in the Mombasa tea auction normally peaks during the fourth quarter, but sufficient
supplies in Kenya will limit the upside. We expect tea prices to remain range-bound with slight upticks.

4. SIPEF group – Financial performanceProspects – comments press release October 18, 2018
53
Cash flow and expansion
• Investment policy remains fully focused on expanding South Sumatra palm oil activities (PT Dendymarker and Musi Rawas)
• DIL will be increased to more than 10 000 hectares in the future, which will bring the total development in South Sumatra to +/- 33 000 hectares, of which 20% will belong to the local communities but will be exploited by us.
• To conclude, the additional acquisition of concessions earlier this year has opened the way to the growth of the SIPEF group into a company that, over a 5-year period, will approach 100 000 hectares under own management, of which 80 000 hectares are already planted and the supply base will reach 120 000 hectares.
Result
• To date we have sold 78% of our expected palm oil production at an average price of USD 694 CIF Rotterdam, premiums included, compared with 95% at USD 755 CIF Rotterdam at the same time last year.
• Given the considerable fall in palm oil and rubber sale prices, we expect the recurring result for the second half of 2018 to be approximately the same as for the first half of the year, which means the recurring annual results will be significantly lower than in 2017.
SummarySummarySummarySummary
1. SIPEF Group Company profile
2. SIPEF group - Expansion
3. SIPEF Group – Productions & prices
4. SIPEF group – Financial performance
5. Peer review
The Connection to the world of Sustainable Tropical Agriculture
54

5. Peer reviewDisclaimer
The information contained in this section is provided for your general information only and is not designed nor intended to offer anything more than information only.
The information with respect to the companies included in the Peer Review was retrieved from publicly available information being annual reports and company websites on the one hand and from analyst reports we received on the other hand. In some cases we had to give our own interpretation to the available information in order to get comparable indicators.
As a consequence of using different sources combined with giving our own interpretation to the available information, the information may not always be correct and SIPEF does not accept any liability for loss and damage that may arise from relying upon this information.
The Connection to the world of Sustainable Tropical Agriculture 55

5. Peer reviewPrinciple assumptions
• Benchmark of main industrial competitors
• Age profile based on own ageing interpretation
• Market capitalization is calculated based on the average exchange rate & average share price of the year
• Benchmark based on own CPO productions of competitors:
• Representative sample of comparable industry competitors (2017): 32,3%
• Industrial comparable companies (50%)
The Connection to the world of Sustainable Tropical Agriculture 56
Tons
CPO own production benchmark (2017) 10.972.924
Worldwide production (Oilworld 2017) 66.860.000

5. Peer reviewOwn planted Oil Palm Hectares in KHa (2017)
The Connection to the world of Sustainable Tropical Agriculture 57
37
39
44
65
83
89
96
126
131
144
180
225
174
211
240
248
342
400
603
69
MP Evans
Socfinasia
R.E.A. Holdings
Anglo Eastern Plantations
SIPEF
Sampoerna Agro
Socfinaf
London Sumatra Indon
Eagle High Plantations
Bumitama
Genting Plantations
IOI Corporation
First Resources
Kuala Lumpur Kepong
Astra Agro Lestari
Wilmar International
Salim Ivomas Pratama
Felda Global Ventures
Golden Agri-Resources
Sime Darby
Plantation
Integrated
Sipef

5. Peer reviewAge Profile: Average age planted hectares (2017)
The Connection to the world of Sustainable Tropical Agriculture 58
7,0
8,4
8,9
10,0
10,0
10,0
10,0
10,8
11,1
14,1
15,0
15,2
11,0
12,4
13,2
14,5
14,5
15,0
16,0
10,3
MP Evans
Eagle High Plantations
Bumitama
Anglo Eastern Plantations
First Resources
Genting Plantations
Sampoerna Agro
SIPEF
Socfinaf
Wilmar International
R.E.A. Holdings
Kuala Lumpur Kepong
Sime Darby
Socfinasia
IOI Corporation
Felda Global Ventures
London Sumatra Indon
Salim Ivomas Pratama
Astra Agro Lestari
Golden Agri-Resources
Plantation
Integrated
Sipef
2016 2017 Var %
Average 11,74 11,97 1,9%
Sipef 9,91 10,26 3,5%

5. Peer reviewFFB Yield – MT/ha (2017)
59
9,3
13,1
14,1
14,9
15,6
16,1
17,5
18,2
18,4
19,1
19,9
22,2
14,8
15,4
19,0
19,4
20,5
21,4
21,7
23,9
Eagle High Plantations
Sampoerna Agro
Socfinaf
Salim Ivomas Pratama
London Sumatra Indon
Felda Global Ventures
R.E.A. Holdings
Bumitama
Anglo Eastern Plantations
First Resources
Genting Plantations
Wilmar International
Astra Agro Lestari
Sime Darby
MP Evans
Golden Agri-Resources
Kuala Lumpur Kepong
IOI Corporation
Socfinasia
SIPEF*
Plantation
Integrated
Sipef
* Sipef excluding PT Dendymarker acquired per 1 August 2017
The Connection to the world of Sustainable Tropical Agriculture
2016 2017 Var %
Average 16,9 17,8 5,2%
Sipef 22,4 23,9 6,6%
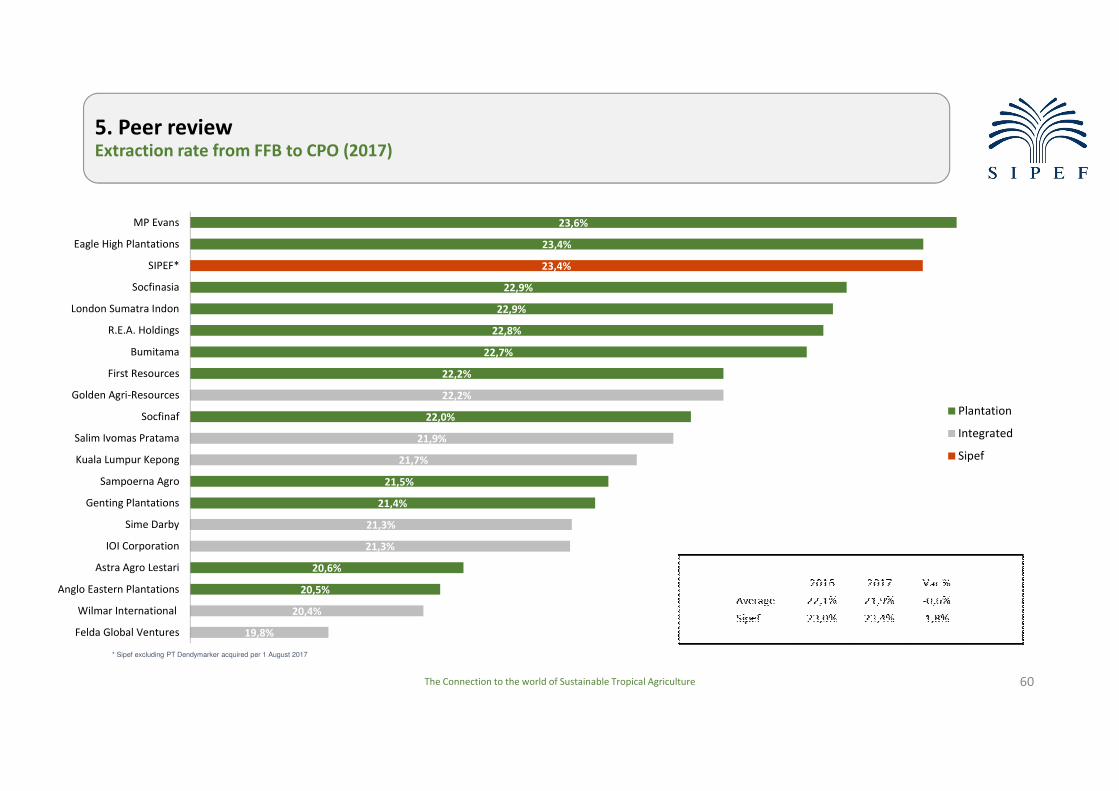
5. Peer reviewExtraction rate from FFB to CPO (2017)
The Connection to the world of Sustainable Tropical Agriculture 60
20,5%
20,6%
21,4%
21,5%
22,0%
22,2%
22,7%
22,8%
22,9%
22,9%
23,4%
23,6%
19,8%
20,4%
21,3%
21,3%
21,7%
21,9%
22,2%
23,4%
Felda Global Ventures
Wilmar International
Anglo Eastern Plantations
Astra Agro Lestari
IOI Corporation
Sime Darby
Genting Plantations
Sampoerna Agro
Kuala Lumpur Kepong
Salim Ivomas Pratama
Socfinaf
Golden Agri-Resources
First Resources
Bumitama
R.E.A. Holdings
London Sumatra Indon
Socfinasia
SIPEF*
Eagle High Plantations
MP Evans
Plantation
Integrated
Sipef
* Sipef excluding PT Dendymarker acquired per 1 August 2017

5. Peer reviewCPO Yield – MT/ha (2017)
The Connection to the world of Sustainable Tropical Agriculture 61
2,17
2,82
3,11
3,41
3,56
3,59
3,66
3,94
3,94
4,04
4,70
5,53
3,06
3,25
3,88
4,14
4,55
4,61
4,64
5,58
Eagle High Plantations
Sampoerna Agro
Felda Global Ventures
Socfinaf
Salim Ivomas Pratama
London Sumatra Indon
R.E.A. Holdings
Anglo Eastern Plantations
Bumitama
Wilmar International
Astra Agro Lestari
Genting Plantations
First Resources
Sime Darby
Golden Agri-Resources
IOI Corporation
Kuala Lumpur Kepong
MP Evans
Socfinasia
SIPEF*
Plantation
Integrated
Sipef
* Sipef excluding PT Dendymarker acquired per 1 August 2017
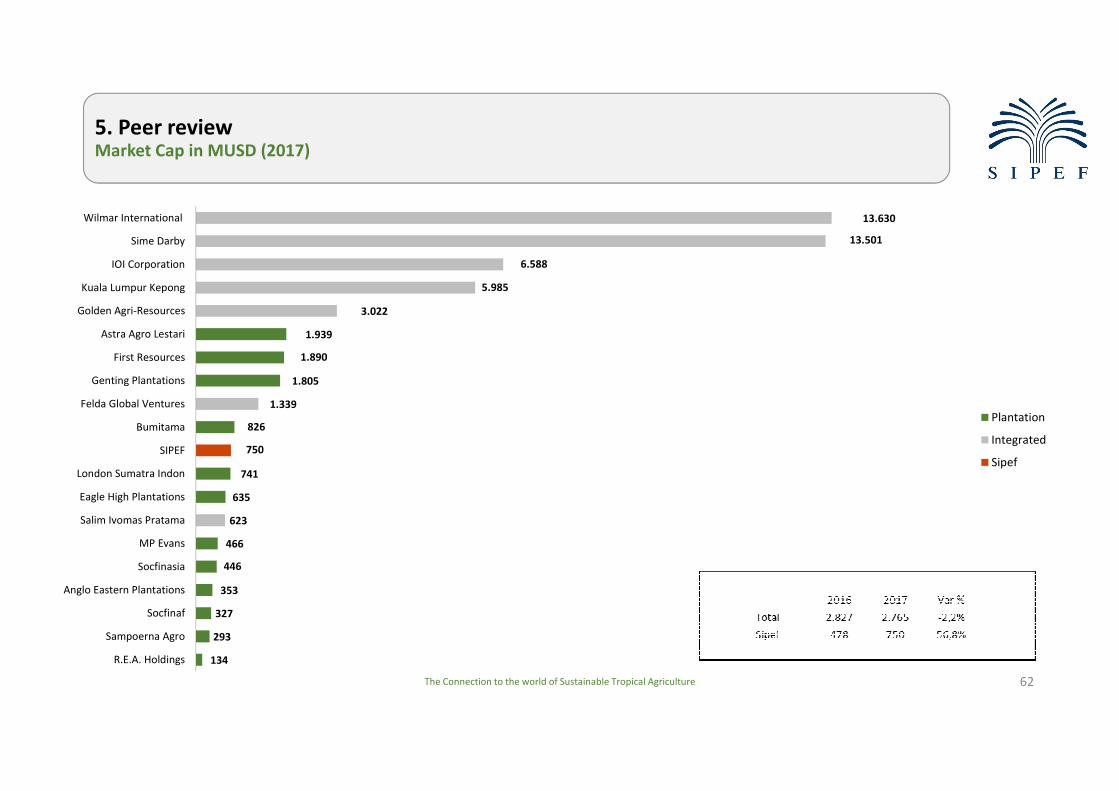
5. Peer reviewMarket Cap in MUSD (2017)
The Connection to the world of Sustainable Tropical Agriculture 62
134
293
327
353
446
466
635
741
826
1.805
1.890
1.939
623
1.339
3.022
5.985
6.588
13.501
13.630
750
R.E.A. Holdings
Sampoerna Agro
Socfinaf
Anglo Eastern Plantations
Socfinasia
MP Evans
Salim Ivomas Pratama
Eagle High Plantations
London Sumatra Indon
SIPEF
Bumitama
Felda Global Ventures
Genting Plantations
First Resources
Astra Agro Lestari
Golden Agri-Resources
Kuala Lumpur Kepong
IOI Corporation
Sime Darby
Wilmar International
Plantation
Integrated
Sipef

5. Peer reviewDividend Yields (based on average market cap 2017)
The Connection to the world of Sustainable Tropical Agriculture 63
0,0%
0,0%
0,5%
0,6%
1,2%
2,4%
2,6%
3,1%
3,5%
3,7%
3,7%
5,0%
1,9%
2,0%
2,1%
2,1%
2,7%
2,8%
2,9%
2,5%
Eagle High Plantations
R.E.A. Holdings
Anglo Eastern Plantations
Socfinaf
Sampoerna Agro
Salim Ivomas Pratama
Kuala Lumpur Kepong
IOI Corporation
Golden Agri-Resources
Genting Plantations
SIPEF
Bumitama
Sime Darby
Felda Global Ventures
Wilmar International
London Sumatra Indon
Astra Agro Lestari
First Resources
MP Evans
Socfinasia
Plantation
Integrated
Sipef

5. Peer reviewPrice Earning Ratio (based on average market cap 2017)
The Connection to the world of Sustainable Tropical Agriculture 64
0,0
0,0
9,4
9,8
12,9
13,0
13,1
13,6
13,7
15,8
19,3
26,0
45,4
11,2
16,3
23,8
25,9
38,1
40,8
12,4
Eagle High Plantations *
R.E.A. Holdings *
Bumitama
Anglo Eastern Plantations
Wilmar International
SIPEF
Astra Agro Lestari
London Sumatra Indon
Socfinaf
Sampoerna Agro
First Resources
Socfinasia
Salim Ivomas Pratama
MP Evans
Sime Darby
Kuala Lumpur Kepong
Genting Plantations
IOI Corporation
Golden Agri-Resources
Felda Global Ventures
Plantation
Integrated
Sipef
* Not included as irrelevant (profit close to break-even or loss for the year)

The Connection to the world of Sustainable Tropical Agriculture 65