20180801 consolidated financial results for the first ... · ated financ ial informatio artial...
TRANSCRIPT

Consolid
All financThis is a pconsolidastatement
CompaStock eStock cURL: Represe
Contact
Phone: ScheduSubmisComme SupplemQuarter
1. Conso(Apri
(1) Conso
First QuFirst Qu
Note: Comp
First QuFirst Qu
(2) Conso
End of FEnd of F
For referen*Total equ
2. Cash D Record
or per
FY2018FY2019FY2019(forecas
Note: Rev
dated Financ
cial informatiopartial Englishated results unts does not app
any name: exchange listincode:
entative:
t:
uled dates ssion of quarteencement of d
mentary materly results pre
olidated Resuil 1, 2018 – Jolidated Finan
uarter., FY201uarter., FY201prehensive incom
uarter., FY201uarter., FY201
olidated Finan
First Quarter, FY2018 nce: Total equituity = Sharehold
Dividends for
date iod End-Q
y
8 9 9 st)
visions from the
cial Results fo (
on has been ph translation o
nless otherwisepear in this tra
TIS Inngs: The F
3626 http://Toru KTsunePlann+81 3
erly report: dividend paym
rials to the qusentation held
ults for the Fune 30, 2018
ncial Results
N
millio
19 918 9
me: First Quarter., F
Np
19 18
ncial Position
FY2019
ty: End of first ders’ equity plu
r ShareholderCash d
Q1 End-Q2 yen yen
- 14.00 -
20.00
e latest release o
or the First Q(April 1, 201Prepared pur
prepared in accof the originale noted. Informanslation.
nc. First Section of
/www.tis.com/Kuwano, Chaieyoshi Ito, Deping SBU. -5337-4569
ments:
uarterly resultsd:
FigFirst Quarter8)
Net sales
ons of yen %
96,467 5.191,778 3.0FY 2019 8,161m
Net income per share –
basic Yen
50.9242.96
Total assetsmillions of ye
374,100366,954
quarter, FY201us total accumul
rs of Commodividends per
End-Q3 Yyen
-
-
of dividends for
Quarter of th18 through Jursuant to Jap
cord with accol Japanese-lanrmation on the
f the Tokyo S
m/ irman and Prepartment Man
August -
s: AvailabYes (tar
gures in millior of the Fisca
Operating
% millions of yen
5,8220 5,053million yen (61.4%
Net incper sha
dilute
26
Net assen million
0 2294 22
19: 224,423millated other com
on Stock share
Year-end Tyen
26.00 4
40.00 6
recasts: None
he Fiscal Yearune 30, 2018
panese GAAP
ounting princinguage docume basis of pres
tock Exchang
esident nager of Finan
9, 2018
le geted at institu
ons of yen areal Year Endin
Percenta
income Re
n % mill
2 15.23 25.8%), First Quarter.,
ome are – ed
yen
--
ets Equs of yen
9,0216,298lion yen End o
mprehensive inc
Total yen
40.00
60.00
r Ending Ma8) P)
iples generallyment. All inform
entation of co
ge
nce & Account
utional invest
e rounded downg March 31
ages indicate y
ecurring profit
lions of yen
6,466 16.5,574 27.
FY 2018: 5,056m
uity ratio %
60.060.4
of FY2018: 22ome
arch 31, 2019
y accepted in mation pertainonsolidated fin
Augu
ting Dept., Co
tors and analy
wn to the neare1, 2019
year-over-yea
t
Net inattributowners
parent co% millions of y
.0 4,33
.5 3,696million yen (52.6
21,634million y
9
Japan. ns to nancial
ust 1, 2018
orporate
sts)
est million
ar changes ncome table to s of the ompany yen %
31 17.394 34.0%)
en.
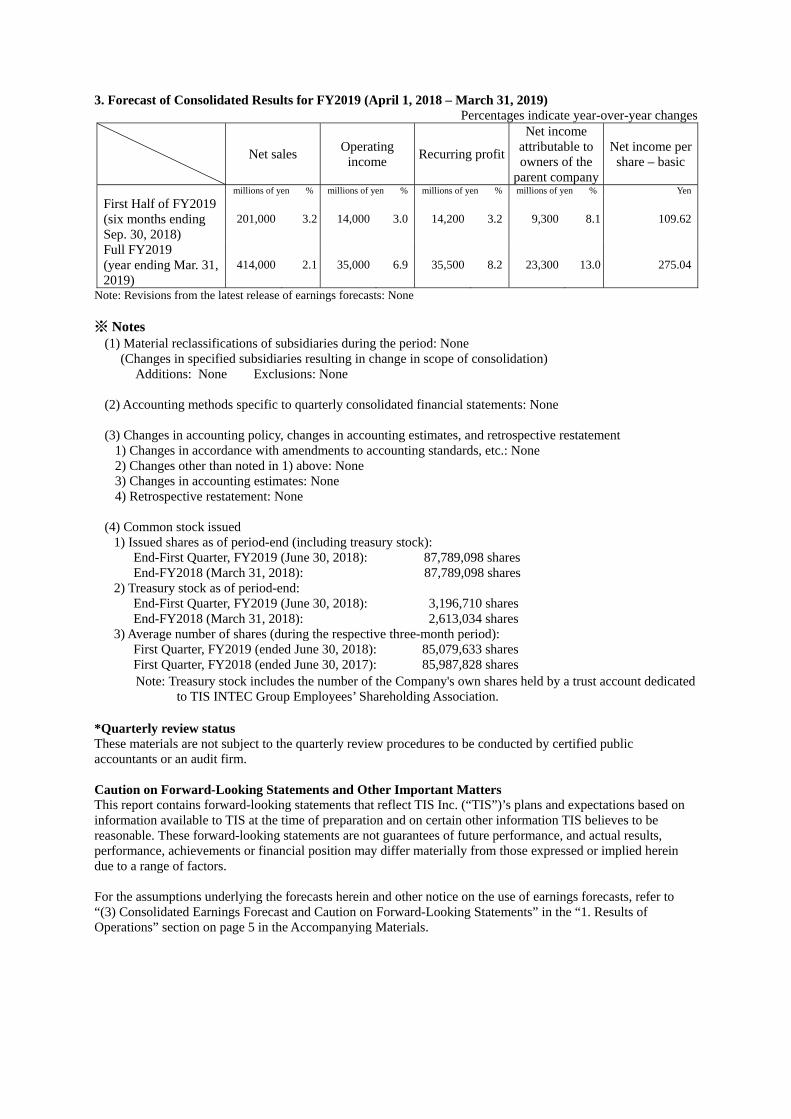
3. Forecast of Consolidated Results for FY2019 (April 1, 2018 – March 31, 2019)
Percentages indicate year-over-year changes
Net sales Operating
income Recurring profit
Net income attributable to owners of the
parent company
Net income per share – basic
millions of yen % millions of yen % millions of yen % millions of yen % Yen
First Half of FY2019 (six months ending Sep. 30, 2018)
201,000 3.2 14,000 3.0 14,200 3.2 9,300 8.1 109.62
Full FY2019 (year ending Mar. 31, 2019)
414,000 2.1 35,000 6.9 35,500 8.2 23,300 13.0 275.04
Note: Revisions from the latest release of earnings forecasts: None ※ Notes
(1) Material reclassifications of subsidiaries during the period: None (Changes in specified subsidiaries resulting in change in scope of consolidation)
Additions: None Exclusions: None
(2) Accounting methods specific to quarterly consolidated financial statements: None (3) Changes in accounting policy, changes in accounting estimates, and retrospective restatement
1) Changes in accordance with amendments to accounting standards, etc.: None 2) Changes other than noted in 1) above: None 3) Changes in accounting estimates: None 4) Retrospective restatement: None
(4) Common stock issued
1) Issued shares as of period-end (including treasury stock): End-First Quarter, FY2019 (June 30, 2018): 87,789,098 shares End-FY2018 (March 31, 2018): 87,789,098 shares
2) Treasury stock as of period-end: End-First Quarter, FY2019 (June 30, 2018): 3,196,710 shares End-FY2018 (March 31, 2018): 2,613,034 shares
3) Average number of shares (during the respective three-month period): First Quarter, FY2019 (ended June 30, 2018): 85,079,633 shares First Quarter, FY2018 (ended June 30, 2017): 85,987,828 shares Note: Treasury stock includes the number of the Company's own shares held by a trust account dedicated
to TIS INTEC Group Employees’ Shareholding Association. *Quarterly review status These materials are not subject to the quarterly review procedures to be conducted by certified public accountants or an audit firm. Caution on Forward-Looking Statements and Other Important Matters This report contains forward-looking statements that reflect TIS Inc. (“TIS”)’s plans and expectations based on information available to TIS at the time of preparation and on certain other information TIS believes to be reasonable. These forward-looking statements are not guarantees of future performance, and actual results, performance, achievements or financial position may differ materially from those expressed or implied herein due to a range of factors. For the assumptions underlying the forecasts herein and other notice on the use of earnings forecasts, refer to “(3) Consolidated Earnings Forecast and Caution on Forward-Looking Statements” in the “1. Results of Operations” section on page 5 in the Accompanying Materials.
Accompanying Materials – Contents
1. Results of Operations 2
(1) Analysis of Consolidated Operating Results 2
(2) Analysis of Financial Condition 5
(3) Consolidated Earnings Forecast and Caution on Forward-Looking Statements 5
2. Consolidated Financial Statements 6
(1) Consolidated Balance Sheets 6
(2) Consolidated Statements of Income and Comprehensive Income 8
Consolidated Statements of Income
For the First Quarter
8
Consolidated Statements of Comprehensive Income
For the First Quarter
9
(3) Notes on the Consolidated Financial Statements
(Notes on the Going-concern Assumption)
10
10
(Notes on Significant Changes in the Amount of Shareholders’ Equity) 10
(Additional Information) 10
- 1 -

1. Results of Operations (1) Analysis of Consolidated Operating Results In the first three months of fiscal 2019 (April 1, 2018 ~ June 30, 2018), the Japanese economy continued a moderate recovery owing to high corporate earnings and an improvement in employment conditions. Regarding the outlook, although it is necessary to monitor the impact of uncertainties surrounding the global economy and financial market fluctuations, the Japanese economy is expected to continue its moderate recovery trend.
The business environment surrounding the IT services industry, to which the TIS INTEC Group belongs, was robust during the period. The Bank of Japan’s Short-term Economic Survey of Enterprises in Japan (June 2018) showed a 6.4% year-on-year increase in company software investment plans (all manufacturing & financial institutions), reflecting a strong trend for increased IT investment by companies embracing digital management and aiming to realize their business strategies through the aggressive application of IT.
In this environment, the TIS INTEC Group promoted various measures to achieve a speedy
structural transformation and raise corporate value under a new three-year medium-term management plan launched at the start of the new fiscal year. The new three-year plan will build the foundation from which the Group will work to realize its Group Vision 2026.
Consolidated net sales for the Group in the first quarter of fiscal 2019 increased 5.1% year on year to ¥96,467 million. Operating income rose 15.2% to ¥5,822 million, recurring profit expanded 16.0% to ¥6,466 million, and net income attributable to owners of the parent company increased 17.3% to ¥4,331 million.
The increase in consolidated net sales was driven by the Group’s ability to accurately grasp the IT investment needs of its customers in areas where IT investment is growing. The increase in operating income reflects sales growth and higher gross profit realized through continued efforts to improve profitability. These positives offset an increase in selling, general and administrative expenses related to expenditures targeted at strengthening the Group’s efforts to achieve structural reforms. The increases in recurring profit and net income attributable to owners of the parent company reflect mainly the growth in operating income.
Segment results for the period are as follows. Following changes to the Group’s management
structure for the purpose of accelerating the ongoing structural transformation, reporting business segments have been realigned and changed, effective from the start of the first quarter of current fiscal year. The sales figures for each segment include inter-segment sales. Year-on-year percent changes are based on calculations of previous-year results that reflect the new segmentation. 1) Service IT Business This segment comprises Group businesses providing knowledge-intensive IT services that leverage TIS’ service and industry know-how to create universalized, template-oriented solutions for its customers (includes default configuration and ERP).
Segment sales in the first quarter totaled ¥26,668 million, up 19.0% year on year, and operating income expanded 22.4% to ¥1,477 million. Expansion of settlement-related business and strong demand for ERP updates contributed to strong sales growth, which offset spending on forward-looking investment to strengthen the business, thus enabling the segment to post growth in sales and profits.
2) BPO This segment comprises businesses that leverage the Group’s extensive service and IT know-how to deliver business process outsourcing (BPO) services, including marketing and sales services and office and contract operations.
Segment sales in the first quarter totaled ¥9,153 million, up 1.9% year on year. Operating income expanded by 42.7% to ¥403 million. Taking advantage of the favorable business
- 2 -

environment, we strengthened efforts to improve transaction margins. As a result, the segment achieved growth in sales and profits.
3) Financial IT Business This segment comprises businesses that leverage business and operating know-how specific to the financial sector to raise the value-added of clients’ operations, expand their use of IT, and provide support to operations using IT.
Segment sales in the first quarter totaled ¥26,211 million, up 9.4% year on year, and operating income increased 11.7% to ¥2,294 million. Sales and profits increased on strong contributions from large-scale projects for credit card companies and expanding IT investment by core clients.
4) Industrial IT Business This segment’s businesses leverage business and operating know-how specific to non-finance industries to raise the value-added of clients’ operations, expand their use of IT, and provide support to operations using IT.
Segment sales in the first quarter totaled ¥40,959 million, up 2.1% year on year, and operating income expanded 18.2% to ¥1,604 million. The increases in sales and profits were driven by expanding IT investment by clients in a wide range of industrial sectors, including energy-related sectors.
5) Other The Other segment includes a number of ancillary businesses that provide leasing and other information systems to clients.
Segment sales in the first quarter totaled ¥2,285 million, down 13.1% year on year, and operating income fell 9.5% to ¥233 million.
As noted above, the TIS INTEC Group embarked on a new three-year medium-term
management plan from the start of this fiscal year. The new plan will build the foundation from which the Group will work to realize its Group Vision 2026. By striving to fulfill the new plan’s five basic policies—“Sustainable profit growth”, “Emphasis on employee self-fulfillment”, "Concentrate on core businesses”; “Shift to prior investment style of business development”, and “Expand Global Business”—we aim to achieve a speedy structural transformation and raise corporate value.
Fiscal 2019 is the first year of the new medium-term management plan. The Group has
formulated the following management strategy for the plan’s initial year and will energetically implement measures to accomplish the strategy. Group Management Policies for Fiscal 2019
1) Charge forward on switch to service-style business
2) Robust prior investment to create new services
3) Added-value and productivity improvements in domains of expertise
4) Promote growth strategy aimed at becoming a top-class IT group in ASEAN region
5) Boost motivation and reinforce human resource management
The major initiatives taken in the first quarter of fiscal 2019 are presented below. 1) Charge forward on switch to service-style business
During the period, we strengthened our cloud and security business when we launched the new Platform Square brand, which is based on the concept of providing one-stop added-value services by combining our Cloud & Security solutions with our Consulting & Managed
- 3 -

Services. The new Platform Square brand brings together our specialists in cloud and security-related solutions and various other fields. In addition to strengthened staff numbers, the new brand brings together a wide range of solutions, from service consulting to managed services, which it is now using to accelerate business expansion, including the creation of new services.
2) Robust prior investment to create new services
As part of our efforts to acquire state-of-the-art technology and enter the global market, we established a capital and business tie-up with R3 HoldCo LLC, a US-based technology startup that has established one of the world’s leading brands in distributed ledger technology (DLT), a blockchain-related technology for corporate users. In addition, to promote business development of robot integration (the linking of robotics and ICT technologies) in the enterprise domain, we made an additional investment in SEQSENSE Inc., a venture enterprise engaged in the development of autonomous mobile robots that we have previously been involved with through seed investments from our corporate venture capital system and through the dispatch of directors and employees.
In line with our efforts to promote open innovation through corporate venture capital, during the period we established an AI-specialized corporate venture capital framework to speed up decision-making and facilitate closer collaboration with venture companies in the AI field, where the remarkable pace of technological advance is attracting keen attention from companies in all fields.
3) Added-value and productivity improvements in domains of expertise
During the period, we moved forward with preparations to launch CreditCube+, a next-generation card processing service that fully leverages the technologies and expertise cultivated through our CreditCube credit-card core operations system. The new system will enable customers to improve competitiveness and reduce costs by using a system that optimally balances the merits of shared data with customers’ proprietary data. Also, we joined five other companies participating in a test run of the use of electronic payment service Alipay directly on ticket gates of the Yui Rail monorail line operated by Okinawa Urban Monorail, Inc. The test was part of TIS’s effort to contribute to solutions that make travel in Japan easier for foreign visitors and create new opportunities for business expansion through the construction and operation of settlement centers that handle payment processing for merchants and acquirers.
We also continued efforts to eliminate unprofitable projects and promote enhancement reforms aimed at further improving profitability. These efforts contributed firmly to the improvement in the Group’s gross profit margin in the first quarter of the year.
4) Promote growth strategy aimed at becoming a top-class IT group in ASEAN region During the period, we strengthened partnerships that increase our ability to promote the development and provision of IT services to local companies and Japanese companies operating in the ASEAN region. First, we formed a capital and business tie-up with TinhVan Technologies JSC., a major IT firm in Vietnam. The two partners will jointly promote QR settlement services and other settlement-related business. Meanwhile, we strengthened an existing partnership with the Group’s Indonesian equity-method affiliate PT Anabatic Technologies Tbk by purchasing convertible bonds with stock acquisition rights issued by the company.
5) Boost motivation and reinforce human resource management
In April 2018, our newly established Human Resources SBU issued a personnel manifest that set forth our plans to make TIS a company where employees are highly motivated by implementing various of "workstyle reforms" and "health management" measures that will promote the growth of each member of our diverse group of employees as well as the sustainable growth of the Company.
- 4 -
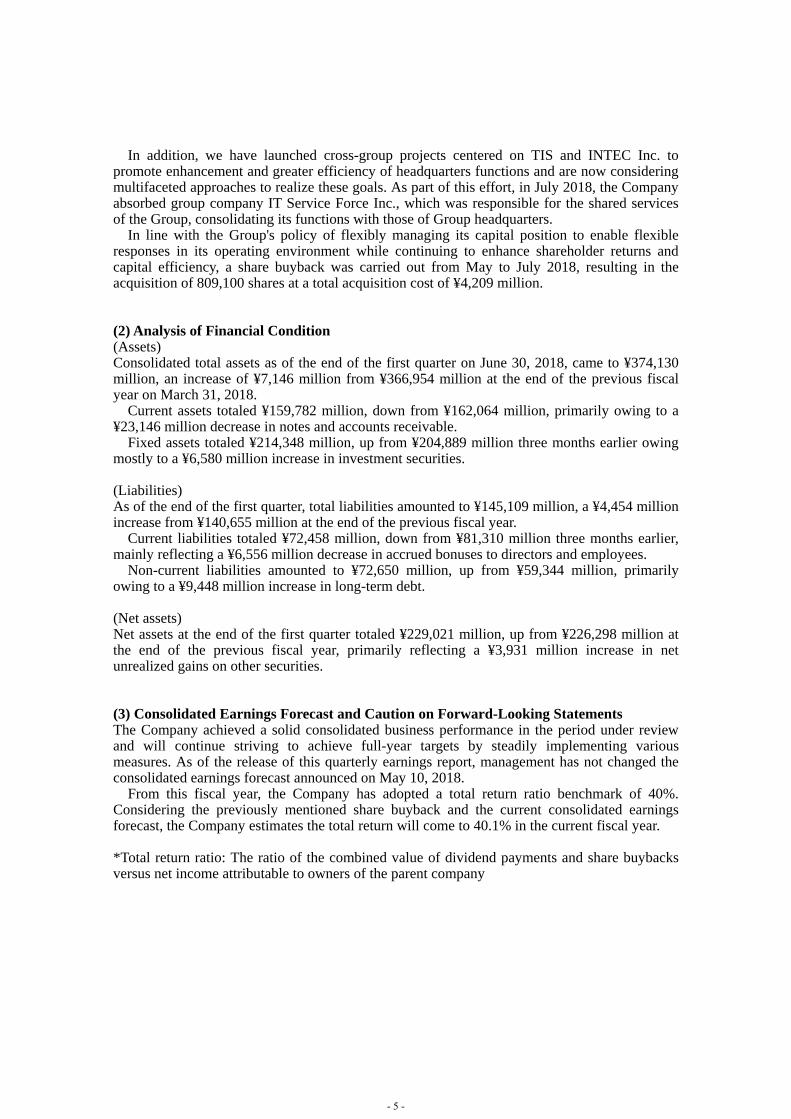
In addition, we have launched cross-group projects centered on TIS and INTEC Inc. to
promote enhancement and greater efficiency of headquarters functions and are now considering multifaceted approaches to realize these goals. As part of this effort, in July 2018, the Company absorbed group company IT Service Force Inc., which was responsible for the shared services of the Group, consolidating its functions with those of Group headquarters.
In line with the Group's policy of flexibly managing its capital position to enable flexible responses in its operating environment while continuing to enhance shareholder returns and capital efficiency, a share buyback was carried out from May to July 2018, resulting in the acquisition of 809,100 shares at a total acquisition cost of ¥4,209 million. (2) Analysis of Financial Condition (Assets) Consolidated total assets as of the end of the first quarter on June 30, 2018, came to ¥374,130 million, an increase of ¥7,146 million from ¥366,954 million at the end of the previous fiscal year on March 31, 2018.
Current assets totaled ¥159,782 million, down from ¥162,064 million, primarily owing to a ¥23,146 million decrease in notes and accounts receivable.
Fixed assets totaled ¥214,348 million, up from ¥204,889 million three months earlier owing mostly to a ¥6,580 million increase in investment securities. (Liabilities) As of the end of the first quarter, total liabilities amounted to ¥145,109 million, a ¥4,454 million increase from ¥140,655 million at the end of the previous fiscal year.
Current liabilities totaled ¥72,458 million, down from ¥81,310 million three months earlier, mainly reflecting a ¥6,556 million decrease in accrued bonuses to directors and employees.
Non-current liabilities amounted to ¥72,650 million, up from ¥59,344 million, primarily owing to a ¥9,448 million increase in long-term debt. (Net assets) Net assets at the end of the first quarter totaled ¥229,021 million, up from ¥226,298 million at the end of the previous fiscal year, primarily reflecting a ¥3,931 million increase in net unrealized gains on other securities. (3) Consolidated Earnings Forecast and Caution on Forward-Looking Statements The Company achieved a solid consolidated business performance in the period under review and will continue striving to achieve full-year targets by steadily implementing various measures. As of the release of this quarterly earnings report, management has not changed the consolidated earnings forecast announced on May 10, 2018.
From this fiscal year, the Company has adopted a total return ratio benchmark of 40%. Considering the previously mentioned share buyback and the current consolidated earnings forecast, the Company estimates the total return will come to 40.1% in the current fiscal year.
*Total return ratio: The ratio of the combined value of dividend payments and share buybacks versus net income attributable to owners of the parent company
- 5 -
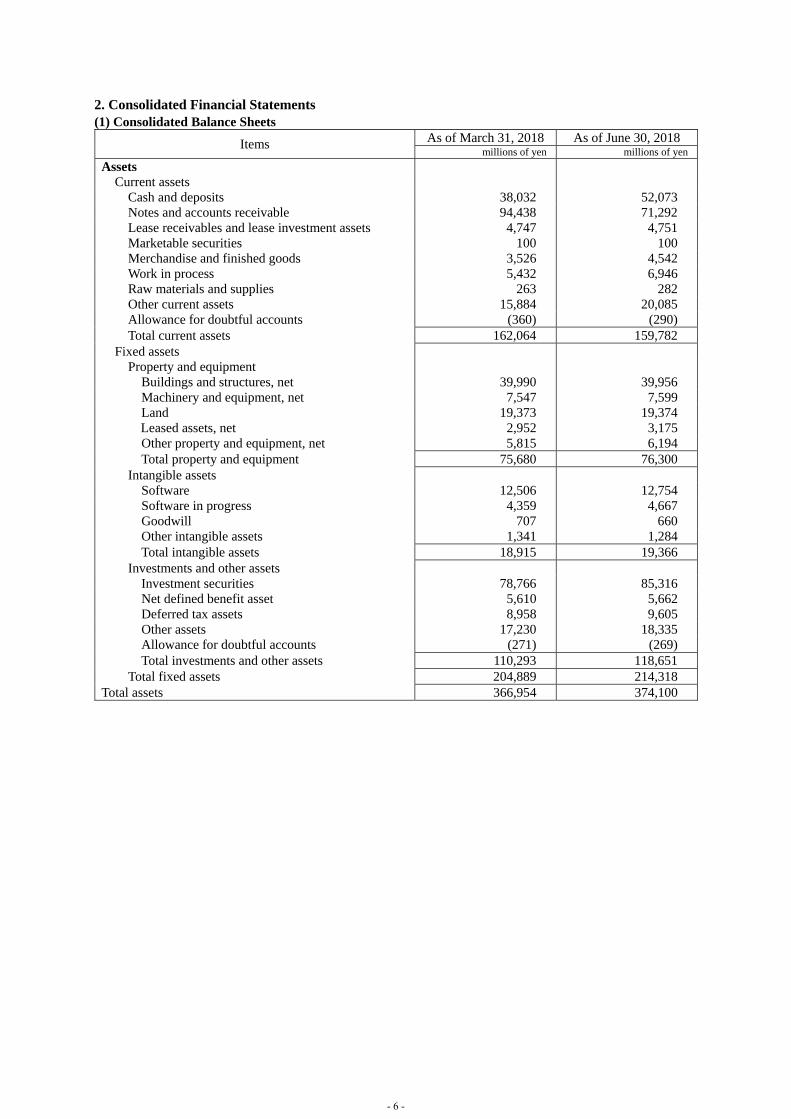
2. Consolidated Financial Statements (1) Consolidated Balance Sheets
Items As of March 31, 2018 As of June 30, 2018 millions of yen millions of yen
Assets Current assets
Cash and deposits 38,032 52,073 Notes and accounts receivable 94,438 71,292 Lease receivables and lease investment assets 4,747 4,751 Marketable securities 100 100 Merchandise and finished goods 3,526 4,542 Work in process 5,432 6,946 Raw materials and supplies 263 282 Other current assets 15,884 20,085 Allowance for doubtful accounts (360) (290) Total current assets 162,064 159,782
Fixed assets Property and equipment
Buildings and structures, net 39,990 39,956 Machinery and equipment, net 7,547 7,599 Land 19,373 19,374 Leased assets, net 2,952 3,175 Other property and equipment, net 5,815 6,194 Total property and equipment 75,680 76,300
Intangible assets Software 12,506 12,754 Software in progress 4,359 4,667 Goodwill 707 660 Other intangible assets 1,341 1,284 Total intangible assets 18,915 19,366
Investments and other assets Investment securities 78,766 85,316 Net defined benefit asset 5,610 5,662 Deferred tax assets 8,958 9,605 Other assets 17,230 18,335 Allowance for doubtful accounts (271) (269) Total investments and other assets 110,293 118,651
Total fixed assets 204,889 214,318 Total assets 366,954 374,100
- 6 -

Items As of March 31, 2018 As of June 30, 2018 millions of yen millions of yen
Liabilities Current liabilities
Notes and accounts payable 23,246 18,412 Short-term borrowings 4,460 4,029 Income taxes payable 6,139 1,128 Accrued bonuses to directors and employees 13,184 6,628 Provision for loss on order received 1,075 797 Other allowances 72 58 Other current liabilities 33,131 41,375 Total current liabilities 81,310 72,428
Non-current liabilities Long-term debt 25,482 34,931 Lease obligations 3,997 4,132 Deferred tax liabilities 3,925 7,459 Deferred tax liabilities from revaluation of land 403 403 Accrued retirement benefits to directors 65 56 Other allowances 650 647 Net defined benefit liability 17,296 17,217 Asset retirement obligations 3,471 3,917 Other non-current liabilities 4,051 3,884 Total non-current liabilities 59,344 72,650
Total liabilities 140,655 145,079 Net assets
Shareholders’ equity Common stock 10,001 10,001 Additional paid-in capital 83,384 83,384 Retained earnings 108,298 110,402 Less treasury stock, at cost (7,742) (10,773) Total shareholders’ equity 193,941 193,014
Accumulated other comprehensive income Net unrealized gains on other securities 31,922 35,854 Revaluation reserve for land (2,375) (2,375) Foreign currency translation adjustments 128 (201) Remeasurements of defined benefit plans (1,983) (1,868) Total accumulated other comprehensive income 27,692 31,408
Non-controlling interests 4,664 4,597 Total net assets 226,298 229,021
Total liabilities and net assets 366,954 374,100
- 7 -

(2) Consolidated Statements of Income and Consolidated Statements of Comprehensive Income
Consolidated Statements of Income
Items First Quarter, FY2018
(Apr. 1 – Jun. 30, 2017)First Quarter, FY2019
(Apr. 1 – Jun. 30, 2018)millions of yen millions of yen
Net sales 91,778 96,467 Cost of sales 74,241 77,136 Gross profit 17,536 19,331 Selling, general and administrative expenses 12,482 13,509 Operating income 5,053 5,822 Non-operating income
Interest income 15 25 Dividend income 738 656 Other 139 191 Total non-operating income 893 873
Non-operating expense Interest expenses 94 85 Equity in losses of affiliated companies 130 68 Other 147 75 Total non-operating expenses 372 230
Recurring profit 5,574 6,466 Extraordinary income
Gain on sales of fixed assets 2 0 Gain on sale of investment securities 0 10 Total extraordinary income 3 10
Extraordinary loss Loss on retirement of fixed assets 9 20 Office transfer expenses - 75 Other - 56 Total extraordinary loss 9 152
Income before income taxes 5,567 6,324 Income taxes: current 739 914 Income taxes: deferred 1,039 939 Total income taxes 1,778 1,854 Net income 3,789 4,469 Net income attributable to non-controlling interests 95 137 Net income attributable to owners of the parent company 3,694 4,331
- 8 -
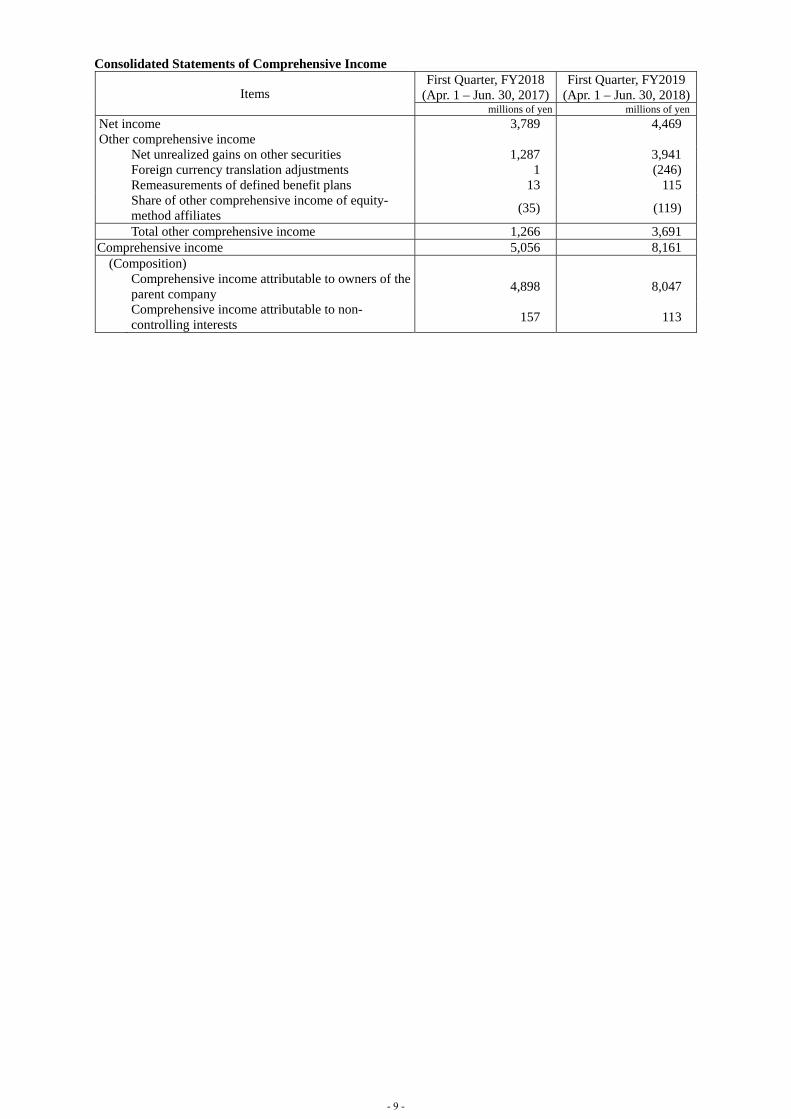
Consolidated Statements of Comprehensive Income
Items First Quarter, FY2018
(Apr. 1 – Jun. 30, 2017)First Quarter, FY2019
(Apr. 1 – Jun. 30, 2018)millions of yen millions of yen
Net income 3,789 4,469 Other comprehensive income
Net unrealized gains on other securities 1,287 3,941 Foreign currency translation adjustments 1 (246)
Remeasurements of defined benefit plans 13 115 Share of other comprehensive income of equity-method affiliates
(35) (119)
Total other comprehensive income 1,266 3,691 Comprehensive income 5,056 8,161
(Composition)
Comprehensive income attributable to owners of the parent company
4,898 8,047
Comprehensive income attributable to non-controlling interests
157 113
- 9 -

(3) Notes on the Consolidated Financial Statements (Notes on the Going-concern Assumption)
Not applicable
(Notes on Significant Changes in the Amount of Shareholders’ Equity) Not applicable
(Additional Information) As the Company has adopted Partial Amendments to Accounting Standard for Tax Effect
Accounting (ASBJ Statement No.28, February 16, 2018) and other related standards from the beginning of the first quarter of the fiscal year ending March 31, 2019, “deferred tax assets” is presented in the category of investments and other assets, and “deferred tax liabilities” is presented in the category of non-current liabilities.
- 10 -