2018 scorecard on state health system performance...2018 scorecard on state health system...
TRANSCRIPT

David C. Radley Senior Scientist The Commonwealth Fund
Douglas McCarthy Senior Research Director The Commonwealth Fund
Susan L. Hayes Senior Researcher The Commonwealth Fund
MAY 2018
2018Scorecard on State Health System Performance
2018Scorecard on State Health System Performance
OVERVIEW
Hawaii, Massachusetts, Minnesota, Vermont, and Utah are the top-ranked states according to the Commonwealth Fund’s 2018 Scorecard on State Health System Performance, which assesses all 50 states and the District of Columbia on more than 40 measures of access to health care, quality of care, efficiency in care delivery, health outcomes, and income-based health care disparities.
The 2018 Scorecard reveals that states are losing ground on key measures related to life expectancy. On most other measures, performance continues to vary widely across states; even within individual states, large disparities are common.
Still, on balance, the Scorecard finds more improvement than decline between 2013 and 2016 in the functioning of state health care systems. This represents a reversal of sorts from the first decade of the century, when stagnating or worsening performance was the norm.
Overall, four major trends emerge from our analysis of the Scorecard results:
Rising death rates, high levels of obesity, and gaps in care are pressing challenges for states
Regional differences in performance persist, as do within-state disparities
Many states are not getting good value for their health care dollars
States made progress in areas that were the target of efforts to improve

commonwealthfund.org May 2018
2018 Scorecard on State Health System Performance 3
Source: David C. Radley, Douglas McCarthy, and Susan L. Hayes, 2018 Scorecard on State Health System Performance(The Commonwealth Fund, May 2018).
Overall health system performance varies greatly among states
States are arranged in rank order from left (best) to right (worst), based on their overall 2018 Scorecard rank.
Exhibit 1
Better performance
Worse performance
INTERACTIVE
HI
MAMN
VTUT
IA WA
WI CTCO NH OR RI
CA ID ME SDMT NY
MD NE DE ND PANJ IL
MI VA AZDC NM KS WY AK
NCOH
IN SC
NVGA TN KY AL
MO TX AR WVFL
LAOK
MS
U.S. average
Overall health system performance varies greatly among states
SCORECARD HIGHLIGHTS
Which states lead the rankings? Hawaii, Massachusetts, Minnesota, Vermont, and Utah.
Which states are ranked at the bottom? Louisiana, Oklahoma, and Mississippi.
Which states moved up the most in the rankings between 2013 and 2016? California and Oregon rose the highest, jumping 9 and 10 spots, respectively. Both states expanded eligibility for Medicaid.
Which states improved on the most indicators? New York improved on 18 of the 37 indicators we track over time — the most of any state. Arkansas, Louisiana, Oklahoma, and West Virginia each improved on 17 indicators.
Did the Medicaid expansion make a difference? In 47 states, the uninsured rate for adults ages 19 to 64 was at least five percentage points lower in 2016 than it had been in 2013. Eleven of the 13 states with at least a 10-point drop had expanded Medicaid by January 2016. During this time, there was also a drop in the percentage of people reporting they had not gone to the doctor when needed because of the cost. States that expanded Medicaid saw greater improvement, on average, than states that did not.
How does performance vary regionally? New England, the Upper Midwest, and several states in the West are at the top of our overall
States are arranged in rank order from left (best) to right (worst), based on their overall 2018 Scorecard rank.

commonwealthfund.org May 2018
2018 Scorecard on State Health System Performance 4
Source: David C. Radley, Douglas McCarthy, and Susan L. Hayes, 2018 Scorecard on State Health System Performance(The Commonwealth Fund, May 2018).
More improvement than decline
Notes: Based on trends for 37 of 43 total indicators (Disparity dimension not included); trend data are not available for all indicators. Bar length equals the total number of indicators with any improvement or worsening with an absolute value greater than 0.5 standard deviations (StDev) of the state distribution. Lighter portion of bars represents the number of indicators with a change of 0.5–0.9 StDevs between baseline and current time periods, darker portions represent indicators with 1.0 or greater StDev change.
Exhibit 2IN
DIC
ATO
RS
WO
RSE
NED
IND
ICA
TOR
S IM
PR
OV
ED
New YorkMOST IMPROVED
Worsened
Improved
Greatly worsened
Greatly improved
More improvement than decline
rankings. Southern states generally rank at the bottom. The Scorecard shows how states perform relative to their geographic neighbors.
What’s the trend? Following a long period of decline, premature death rates are flattening or trending upward in many states. Nonetheless, across all dimensions of performance there was more improvement than decline between 2013 and 2016 — a reversal of what happened during the 2000s, when progress stalled or worsened.
Notes: Based on trends for 37 of 43 total indicators (Disparity dimension not included); trend data are not available for all indicators. Bar length equals the total number of indicators with any improvement or worsening with an absolute value greater than 0.5 standard deviations (StDev) of the state distribution. Lighter portion of bars represents the number of indicators with a change of 0.5–0.9 StDevs between baseline and current time periods, darker portions represent indicators with 1.0 or greater StDev change.
Note: Regions are U.S. Census regions. Regional shading is based on performance among states within the region only. See Scorecard Methods for additional detail.
Source: David C. Radley, Douglas McCarthy, and Susan L. Hayes, 2018 Scorecard on State Health System Performance(The Commonwealth Fund, May 2018).
State health system performance varies within regionsExhibit 3B
West
Midwest
Northeast
South
Note: Regions are U.S. Census regions. Regional shading is based on performance among states within the region only. See Scorecard Methods for additional detail.
INTERACTIVE
Worse-than-average states in each regionBetter-than-average states in each region
Top 3 states in each region
State health system performance varies within regions
commonwealthfund.org May 2018
2018 Scorecard on State Health System Performance 5
KEY TRENDS
Rising death rates, high levels of obesity, and gaps in care are pressing challenges for states.
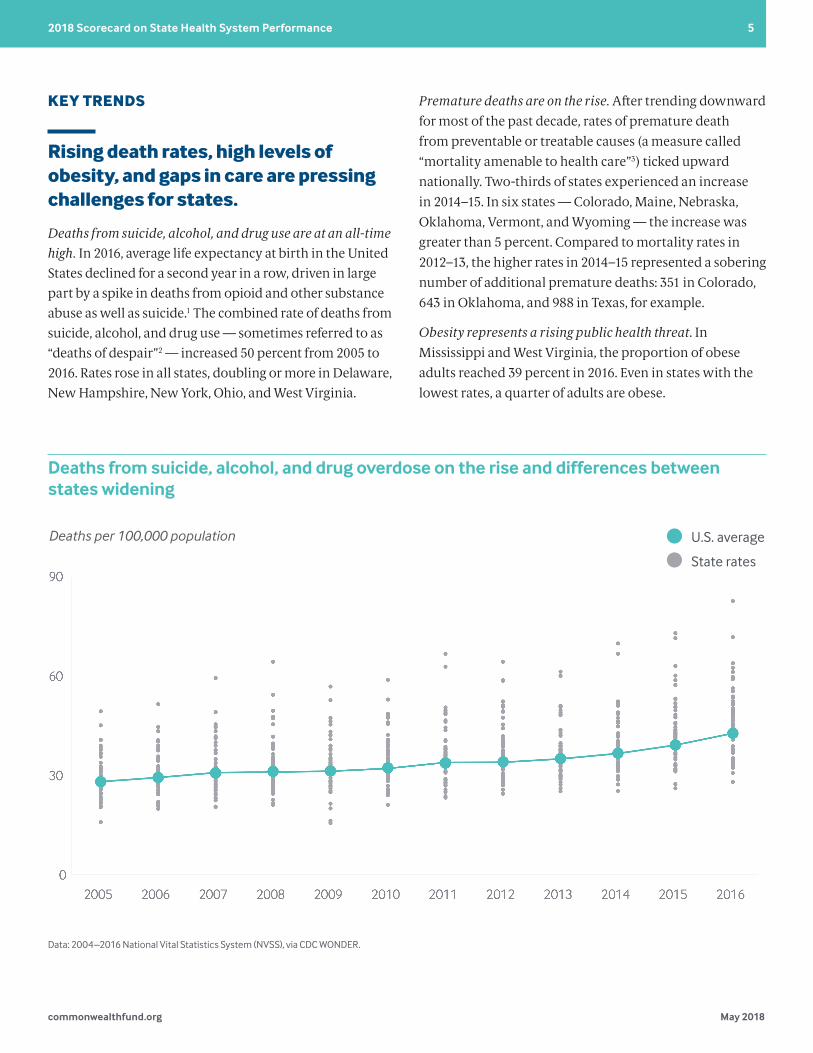
Deaths from suicide, alcohol, and drug use are at an all-time high. In 2016, average life expectancy at birth in the United States declined for a second year in a row, driven in large part by a spike in deaths from opioid and other substance abuse as well as suicide.1 The combined rate of deaths from suicide, alcohol, and drug use — sometimes referred to as “deaths of despair”2 — increased 50 percent from 2005 to 2016. Rates rose in all states, doubling or more in Delaware, New Hampshire, New York, Ohio, and West Virginia.
Premature deaths are on the rise. After trending downward for most of the past decade, rates of premature death from preventable or treatable causes (a measure called “mortality amenable to health care”3) ticked upward nationally. Two-thirds of states experienced an increase in 2014–15. In six states — Colorado, Maine, Nebraska, Oklahoma, Vermont, and Wyoming — the increase was greater than 5 percent. Compared to mortality rates in 2012–13, the higher rates in 2014–15 represented a sobering number of additional premature deaths: 351 in Colorado, 643 in Oklahoma, and 988 in Texas, for example.
Obesity represents a rising public health threat. In Mississippi and West Virginia, the proportion of obese adults reached 39 percent in 2016. Even in states with the lowest rates, a quarter of adults are obese.
Source: David C. Radley, Douglas McCarthy, and Susan L. Hayes, 2018 Scorecard on State Health System Performance(The Commonwealth Fund, May 2018).
Deaths from suicide, alcohol, and drug overdose on the rise and differences between states widening
Exhibit 4
Deaths per 100,000 population
Data: 2004–2016 National Vital Statistics System (NVSS), via CDC WONDER.
State rates
U.S. average
Deaths from suicide, alcohol, and drug overdose on the rise and differences between states widening
Data: 2004–2016 National Vital Statistics System (NVSS), via CDC WONDER.

commonwealthfund.org May 2018
2018 Scorecard on State Health System Performance 6
In the worst-performing states:
of adults with mental illness received no treatment
56%
of children with mental health needs received no treatment
18%
66%
34%
of adults in Nevada received no treatment
of children in Georgia received no treatment
Notes: Y-axis starts at 50 deaths per 100,000. Dashed line represents the expected premature death rate if the historical trend from 2004–05 to 2012–13 had continued in 2014–15. Premature deaths reported here do not include deaths from suicide, alcohol, or drug use; see Appendix H for a complete list of health care–amenable deaths.
Data: 2004–2015 National Vital Statistics System (NVSS) Mortality All-County Micro Data Files.
Source: David C. Radley, Douglas McCarthy, and Susan L. Hayes, 2018 Scorecard on State Health System Performance(The Commonwealth Fund, May 2018).
Premature death rates from treatable medical conditions rose slightly following decade-long decline
Notes: Y-axis starts at 50 deaths per 100,000. Dashed line represents the expected premature death rate if the historical trend from 2004–05 to 2012–13 had continued in 2014–15. Premature deaths reported here do not include deaths from suicide, alcohol, or drug use; see Appendix H for a complete list of health care–amenable deaths.
Data: 2004–2015 National Vital Statistics System (NVSS) Mortality All-County Micro Data Files.
Exhibit 5
Mortality amenable to health care: deaths per 100,000 population
U.S. average if historical trend
had continued
State rates
U.S. average
Premature death rates from treatable medical conditions rose slightly following decade-long decline
Gaps in mental health care are pervasive. Up to one-quarter of adults with a mental illness reported a need for care that wasn’t met during the 2013–15 period. Meanwhile, up to one-third of children needing mental health treatment in 2016 did not receive it, according to their parents. Across states, 41 percent to 66 percent of adults with symptoms of a mental illness (some of whom may not have been diagnosed) received no treatment in 2013–15.
What Can Be Done? Reversing these trends and closing gaps in care will likely require cooperation across sectors as well as greater integration of medical, behavioral, public health, and social services.4
Data: 2013–15 National Survey of Drug Use and Health, as reported in The State of Mental Health Care in America, 2017; 2016 National Survey of Children’s Health, as reported by the Child and Adolescent Health Measurement Initiative.
commonwealthfund.org May 2018
2018 Scorecard on State Health System Performance 7
What Are States Doing? Some states and Medicaid managed care organizations are realizing the importance of investing in, and fostering linkages to, social services in the community that can address the “social determinants of health,” such as stable housing and access to nutritious food.5 Medicaid programs are starting to integrate behavioral and physical health care, for example, by establishing “health homes” where teams of health professionals deliver coordinated care for patients with chronic illnesses and provide screenings, referrals to substance abuse treatment, and other services.6
Regional differences in performance persist, as do within-state disparities.
Geographic disparities persist. As previous Commonwealth Fund scorecards have documented, the highest-ranked state generally performs two to three times better overall than the lowest-ranked state. It’s a stark reminder that where you live can affect both your ability to access high-quality health care and your prospects for a healthy life. Differences between states are most pronounced for hospital admission rates among children with asthma: Vermont had 11 times fewer admissions per 100,000 children than New York did (22 vs. 243).
Source: David C. Radley, Douglas McCarthy, and Susan L. Hayes, 2018 Scorecard on State Health System Performance(The Commonwealth Fund, May 2018).
America’s health care divideExhibit 7
Worse-than-average statesBetter-than-average states
America’s health care divide
Source: David C. Radley, Douglas McCarthy, and Susan L. Hayes, 2018 Scorecard on State Health System Performance(The Commonwealth Fund, May 2018).
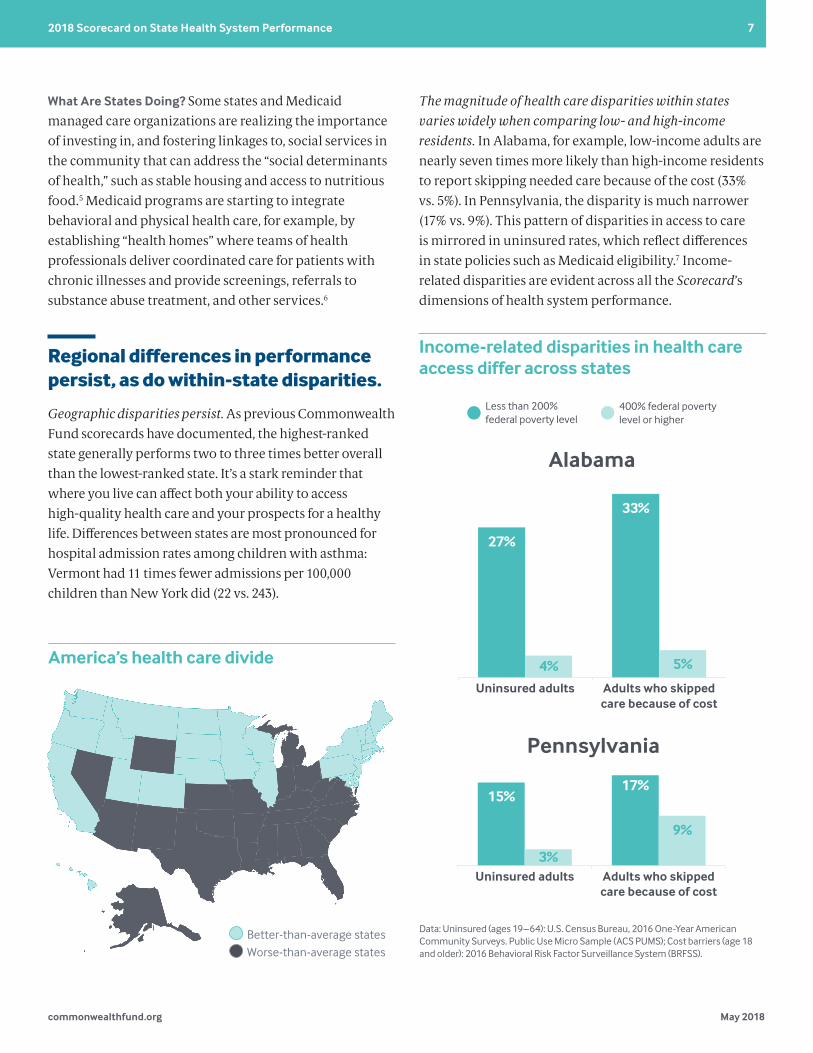
Income-related disparities in health care access differ across states Exhibit 8
27%
33%
4% 5%
Uninsured adults Adults who skippedcare because of cost
Less than 200% federal poverty level
400% federal poverty level or higher
Data: Uninsured (ages 19–64): U.S. Census Bureau, 2016 One-Year American Community Surveys. Public Use Micro Sample (ACS PUMS); Cost barriers (age 18 and older): 2016 Behavioral Risk Factor Surveillance System (BRFSS).
Alabama
15%17%
3%
9%
Uninsured adults Adults who skippedcare because of cost
Pennsylvania
Source: David C. Radley, Douglas McCarthy, and Susan L. Hayes, 2018 Scorecard on State Health System Performance(The Commonwealth Fund, May 2018).
Income-related disparities in health care access differ across states Exhibit 8
27%
33%
4% 5%
Uninsured adults Adults who skippedcare because of cost
Less than 200% federal poverty level
400% federal poverty level or higher
Data: Uninsured (ages 19–64): U.S. Census Bureau, 2016 One-Year American Community Surveys. Public Use Micro Sample (ACS PUMS); Cost barriers (age 18 and older): 2016 Behavioral Risk Factor Surveillance System (BRFSS).
Alabama
15%17%
3%
9%
Uninsured adults Adults who skippedcare because of cost
Pennsylvania
Income-related disparities in health care access differ across states
Data: Uninsured (ages 19–64): U.S. Census Bureau, 2016 One-Year American Community Surveys. Public Use Micro Sample (ACS PUMS); Cost barriers (age 18 and older): 2016 Behavioral Risk Factor Surveillance System (BRFSS).
The magnitude of health care disparities within states varies widely when comparing low- and high-income residents. In Alabama, for example, low-income adults are nearly seven times more likely than high-income residents to report skipping needed care because of the cost (33% vs. 5%). In Pennsylvania, the disparity is much narrower (17% vs. 9%). This pattern of disparities in access to care is mirrored in uninsured rates, which reflect differences in state policies such as Medicaid eligibility.7 Income-related disparities are evident across all the Scorecard’s dimensions of health system performance.
commonwealthfund.org May 2018
2018 Scorecard on State Health System Performance 8
What Can Be Done? Socioeconomic disadvantages are a major contributor to disparities in health care and health outcomes across the country.8 In general, people of color are disproportionately more likely than whites to have lower incomes and to be at risk for health care disparities.9 Measuring disparities in health care can help to raise awareness of the need for action, but this is only a first step toward achieving equal opportunity for health.10
What Are States Doing? Many states are promoting health equity by expanding Medicaid eligibility, engaging in multisector partnerships, increasing health care workforce diversity, promoting standards for culturally appropriate services, and addressing the social determinants of health.11 Oregon’s Medicaid Coordinated Care Organizations, for example, demonstrate how state policy can help narrow disparities in access to care by improving how health services are delivered to patients.12
Many states are not getting good value for their health care dollars.
Quality of care is not in line with the level of state health spending. Health care spending in the United States is much greater than in other wealthy countries, but U.S. health outcomes are not better.13 Our analysis finds that for every state, health spending exceeds median per capita spending in each of 10 other high-income countries.14 In general, research shows that higher spending in the U.S. is attributable to higher prices.15
Here are just a few examples of gaps in quality across the U.S.:
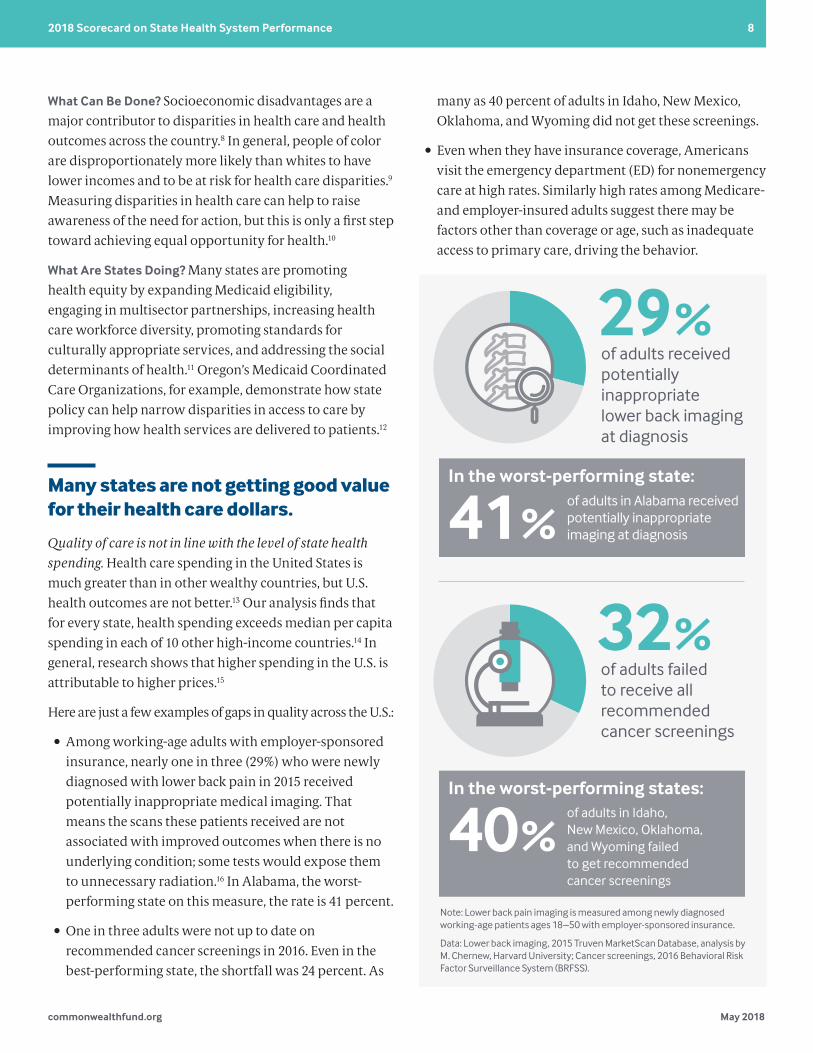
• Among working-age adults with employer-sponsored insurance, nearly one in three (29%) who were newly diagnosed with lower back pain in 2015 received potentially inappropriate medical imaging. That means the scans these patients received are not associated with improved outcomes when there is no underlying condition; some tests would expose them to unnecessary radiation.16 In Alabama, the worst-performing state on this measure, the rate is 41 percent.
• One in three adults were not up to date on recommended cancer screenings in 2016. Even in the best-performing state, the shortfall was 24 percent. As
many as 40 percent of adults in Idaho, New Mexico, Oklahoma, and Wyoming did not get these screenings.
• Even when they have insurance coverage, Americans visit the emergency department (ED) for nonemergency care at high rates. Similarly high rates among Medicare- and employer-insured adults suggest there may be factors other than coverage or age, such as inadequate access to primary care, driving the behavior.
of adults received potentially inappropriate lower back imaging at diagnosis
29%
of adults failed to receive all recommended cancer screenings
32%
In the worst-performing state:
41%of adults in Alabama received potentially inappropriate imaging at diagnosis
In the worst-performing states:
40%of adults in Idaho, New Mexico, Oklahoma, and Wyoming failed to get recommended cancer screenings
Note: Lower back pain imaging is measured among newly diagnosed working-age patients ages 18–50 with employer-sponsored insurance.
Data: Lower back imaging, 2015 Truven MarketScan Database, analysis by M. Chernew, Harvard University; Cancer screenings, 2016 Behavioral Risk Factor Surveillance System (BRFSS).
commonwealthfund.org May 2018
2018 Scorecard on State Health System Performance 9
Mixed findings on health care spending. The average amount Medicare spends on care for each beneficiary has leveled off in recent years across all states. Spending per enrollee in employer-sponsored insurance plans was nearly flat nationally from 2013 to 2015. However, 18 states saw increases of at least $300 per enrollee during this time, or 5 percent on average — more than twice the rate of general inflation.17 These data do not include prescription drug costs, which have been rising rapidly in recent years. Both across states and within individual states, there is often no consistent relationship between health care spending by Medicare and by employer-sponsored insurance.18
What Can Be Done? Efforts to control health care costs must be tailored to reflect the unique characteristics of each market.19 Greater pricing transparency, coupled with value-based benefit design and payment approaches, could encourage better-informed choices and movement toward higher-value health services and providers.20 Evidence from states and from countries around the world show that health systems with a strong primary care orientation generally achieve better health outcomes at lower cost.21 Making primary care more accessible and patient-centered also can help reduce use of the ED for conditions that could be treated in primary care settings.22
What Are States Doing? Several states participate in initiatives involving both public and private insurers to foster the transformation of primary care practices into patient-centered medical homes, which can improve patient care and reduce costs.23 State and federal partnerships to integrate care for Medicare and Medicaid beneficiaries aim to reduce hospitalizations and ED use among patients with complex care needs while improving their quality of life.24 In Rhode Island, health plans are required to measure and increase the proportion of health care spending devoted to primary care, without increasing medical costs or premiums.25
States made progress in areas that were the target of efforts to improve.
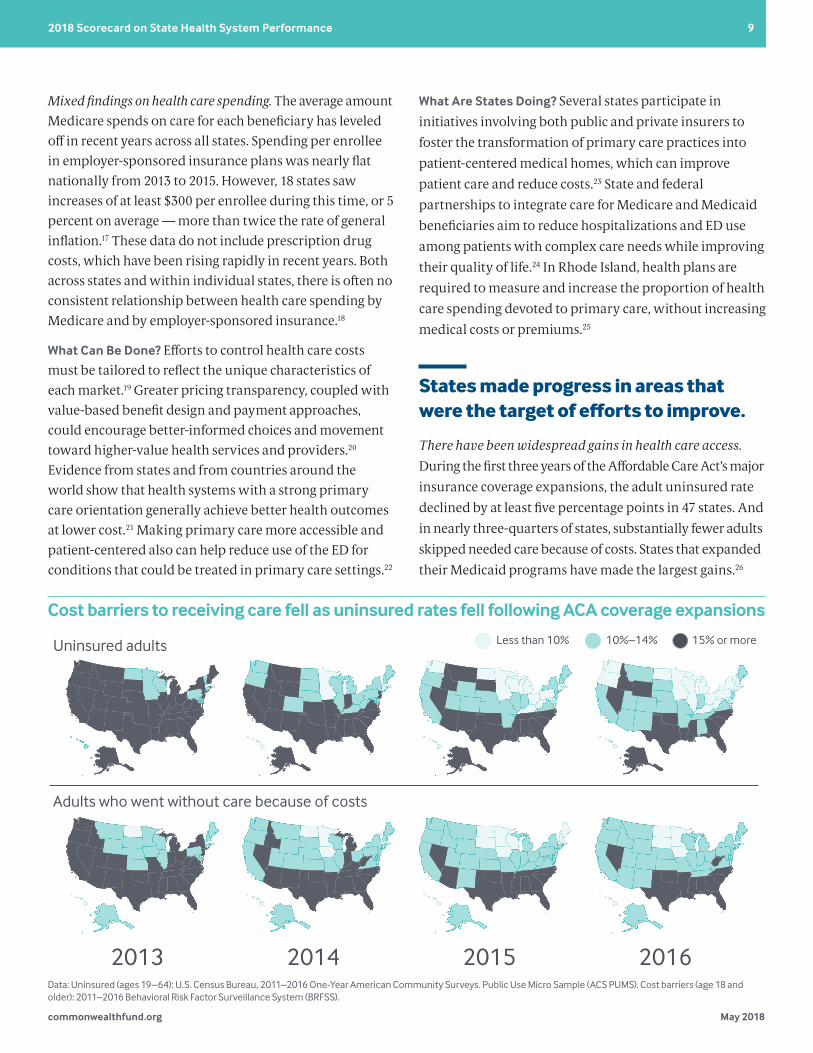
There have been widespread gains in health care access. During the first three years of the Affordable Care Act’s major insurance coverage expansions, the adult uninsured rate declined by at least five percentage points in 47 states. And in nearly three-quarters of states, substantially fewer adults skipped needed care because of costs. States that expanded their Medicaid programs have made the largest gains.26
Source: David C. Radley, Douglas McCarthy, and Susan L. Hayes, 2018 Scorecard on State Health System Performance(The Commonwealth Fund, May 2018).
Cost barriers to receiving care fell as uninsured rates fell following ACA coverage expansions
Notes:
Data: Uninsured (ages 19–64): U.S. Census Bureau, 2011–2016 One-Year American Community Surveys. Public Use Micro Sample (ACS PUMS); Cost barriers (age 18 and older): 2011–2016 Behavioral Risk Factor Surveillance System (BRFSS).
Exhibit 10
Uninsured adults
Adults who went without care because of costs
2013 2014 2015 2016
15% or moreLess than 10% 10%–14%
INTERACTIVE
Cost barriers to receiving care fell as uninsured rates fell following ACA coverage expansions
Data: Uninsured (ages 19–64): U.S. Census Bureau, 2011–2016 One-Year American Community Surveys. Public Use Micro Sample (ACS PUMS). Cost barriers (age 18 and older): 2011–2016 Behavioral Risk Factor Surveillance System (BRFSS).
commonwealthfund.org May 2018
2018 Scorecard on State Health System Performance 10
NEW HAMPSHIRE AND MAINE: TWO STATES WHERE MEDICAID EXPANSION IS IN FLUX
Before the Affordable Care Act expanded coverage, New Hampshire greatly lagged Maine in terms of access to health care for low-income adults. But in August 2014, New Hampshire expanded its Medicaid program and has since caught up to its New England neighbor, matching Maine on its uninsured rate among low-income adults and nearly closing the gap on several other key Scorecard measures of health care access. Maine has not only failed to take advan- tage of its early lead, it has lost ground on some measures.
In November 2017, Maine residents voted to expand Medicaid under a citizen-initiated ballot referendum. The expansion is estimated to extend Medicaid coverage to 70,000 to 80,000 Mainers45 with incomes up to 138 percent of the federal poverty level ($16,753 for a single person in 2018), although implementation has been stalled because of funding conditions set by the governor. New Hampshire is facing the expiration of its Medicaid expansion in December 2018, and it’s not clear whether the state legislature will reauthorize it. The result could be a loss of coverage for an estimated 50,000 Granite State adults.46
The Scorecard offers an inkling of what New Hampshire could lose by dropping Medicaid expansion and what Maine might gain by adding it.
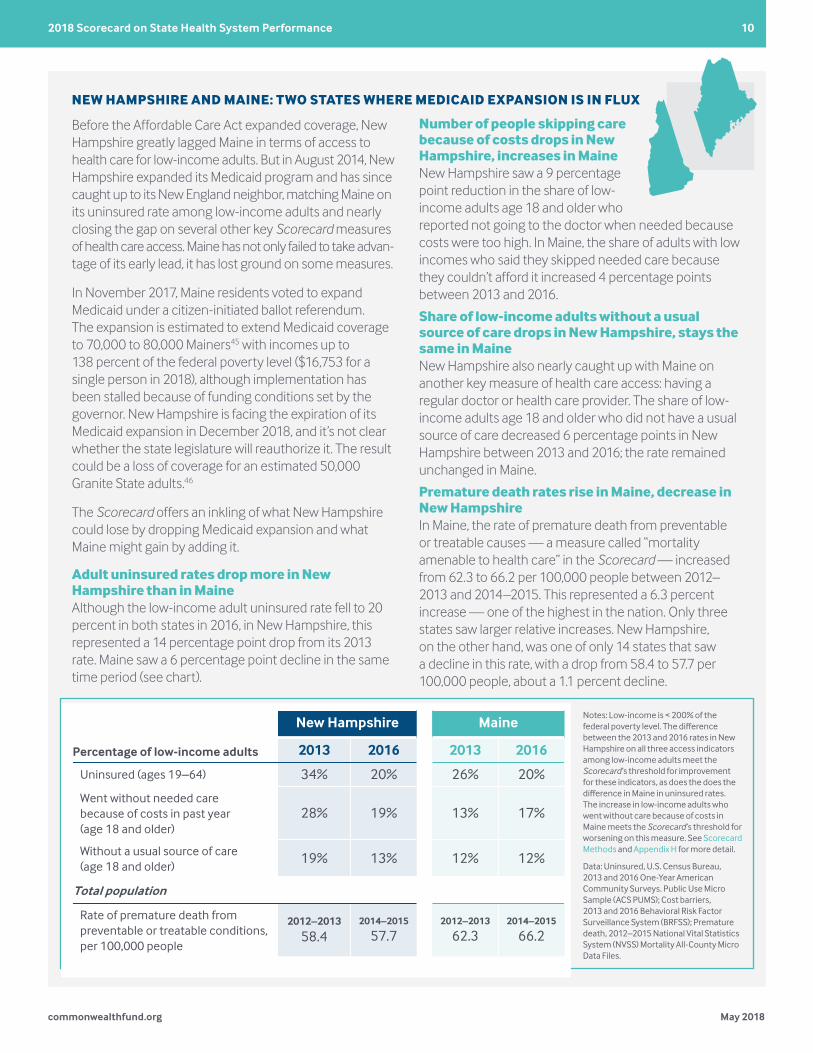
Adult uninsured rates drop more in New Hampshire than in MaineAlthough the low-income adult uninsured rate fell to 20 percent in both states in 2016, in New Hampshire, this represented a 14 percentage point drop from its 2013 rate. Maine saw a 6 percentage point decline in the same time period (see chart).
Number of people skipping care because of costs drops in New Hampshire, increases in MaineNew Hampshire saw a 9 percentage point reduction in the share of low-income adults age 18 and older who reported not going to the doctor when needed because costs were too high. In Maine, the share of adults with low incomes who said they skipped needed care because they couldn’t afford it increased 4 percentage points between 2013 and 2016.
Share of low-income adults without a usual source of care drops in New Hampshire, stays the same in MaineNew Hampshire also nearly caught up with Maine on another key measure of health care access: having a regular doctor or health care provider. The share of low-income adults age 18 and older who did not have a usual source of care decreased 6 percentage points in New Hampshire between 2013 and 2016; the rate remained unchanged in Maine.
Premature death rates rise in Maine, decrease in New HampshireIn Maine, the rate of premature death from preventable or treatable causes — a measure called “mortality amenable to health care” in the Scorecard — increased from 62.3 to 66.2 per 100,000 people between 2012–2013 and 2014–2015. This represented a 6.3 percent increase — one of the highest in the nation. Only three states saw larger relative increases. New Hampshire, on the other hand, was one of only 14 states that saw a decline in this rate, with a drop from 58.4 to 57.7 per 100,000 people, about a 1.1 percent decline.
Notes: Low-income is < 200% of the federal poverty level. The difference between the 2013 and 2016 rates in New Hampshire on all three access indicators among low-income adults meet the Scorecard ’s threshold for improvement for these indicators, as does the does the difference in Maine in uninsured rates. The increase in low-income adults who went without care because of costs in Maine meets the Scorecard ’s threshold for worsening on this measure. See Scorecard Methods and Appendix H for more detail.
Data: Uninsured, U.S. Census Bureau, 2013 and 2016 One-Year American Community Surveys. Public Use Micro Sample (ACS PUMS); Cost barriers, 2013 and 2016 Behavioral Risk Factor Surveillance System (BRFSS); Premature death, 2012–2015 National Vital Statistics System (NVSS) Mortality All-County Micro Data Files.
Source: D. Radley, D. McCarthy, and S. Hayes, Aiming Higher: Results from the Commonwealth Fund Scorecard on State Health System Performance 2018 Edition, The Commonwealth Fund, TK 2018.
New Hampshire Maine
Percentage of low-income adults 2013 2016 2013 2016
Uninsured (ages 19–64) 34% 20% 26% 20%
Went without needed care because of costs in past year (age 18 and older)
28% 19% 13% 17%
Without a usual source of care (age 18 and older)
19% 13% 12% 12%
Total population
Rate of premature death from preventable or treatable conditions, per 100,000 people
2012–2013
58.42014–2015
57.72012–2013
62.32014–2015
66.2
A Tale of Two States: New Hampshire and Maine
Notes: Low-income is < 200% of the federal poverty level. The difference between the 2013 and 2016 rates in New Hampshire on all three access indicators among low-income adults meet the Scorecard’s threshold for improvement for these indicators, as does the does the difference in Maine in uninsured rates. The increase in low-income adults who went without care because of costs in Maine meets the Scorecard’s threshold for worsening on this measure. See Scorecard Methods and Appendix H for more detail.
Data: ??.

commonwealthfund.org May 2018
2018 Scorecard on State Health System Performance 11
Nursing home care has improved, and home health patients have gained physical mobility. The percentage of home health patients who got better at walking or moving around — a key measure of quality of care — rose substantially in every state. In nursing homes, the potentially harmful use of antipsychotic drugs as “chemical restraints” has fallen in nearly all states. This change likely reflects the goals of the National Partnership to Improve Dementia Care in Nursing Homes, which supports state-based coalitions in efforts to reduce inappropriate antipsychotic drug use and improve care for residents with dementia.27
Tobacco use continues to wane. Adult smoking rates fell by at least three percentage points in all but four states between 2011 and 2016. States with some of the highest rates, such as Nevada and Oklahoma, saw the largest declines.28 States like California with long-standing comprehensive tobacco control policies have seen substantial reductions in health care spending because of lower smoking rates.29 Limiting tobacco use continues to represent a major opportunity for states to improve public health.30
increased the number of home health patients who got better at walking or moving around
50 STATESAND D.C.
STATESAND D.C.
decreased the use of chemical restraints in nursing homes
48
Source: David C. Radley, Douglas McCarthy, and Susan L. Hayes, 2018 Scorecard on State Health System Performance(The Commonwealth Fund, May 2018).
Tobacco use continues to decline: Nevada and Oklahoma had among the largest reductions in adult smoking between 2011 and 2016
Data: 2011, 2013, and 2016 Behavioral Risk Factor Surveillance System (BRFSS).
Exhibit 12
20%23%
26%
18% 19%
24%
16% 16%19%
U.S. average Nevada Oklahoma
2011 2013 2016
Percent of adults who smoke
Note: Chemical restraints means use of antipsychotic medication.
Data: OASIS (via CMS Home Health Compare); MDS (via CMS Nursing Home Compare).
Tobacco use continues to decline: Nevada and Oklahoma had among the largest reductions in adult smoking between 2011 and 2016
Data: 2011, 2013, and 2016 Behavioral Risk Factor Surveillance System (BRFSS).

commonwealthfund.org May 2018
2018 Scorecard on State Health System Performance 12
Avoidable hospital use has declined. Hospital readmission rates for elderly Medicare beneficiaries continued to fall in nearly half the states (particularly those with the highest rates) during the 2012–15 period. This reduction was the goal of federal financial penalties, as well as initiatives that brought hospitals and postacute care providers together to improve patients’ transitions in care.31 There was also a continuing reduction in potentially preventable hospital admissions in several states, possibly because of better ambulatory care management.
What Is Being Done? States’ gains likely reflect the influence of government policies, regulatory actions, and collaborative improvement efforts, all of which may be reinforced by the public reporting of performance data by the federal government, states, and other groups. With federal assistance, many states also are working with health plans, care providers, and other stakeholders to promote quality measurement and improvement in Medicaid and to spread payment and delivery system transformation more broadly.32
At the same time, recognition that performance incentives can sometimes be gamed, or can unfairly penalize providers treating a large share of vulnerable or high-need patients, is prompting discussions of how to improve these incentives.33
CONCLUSION
All states can improve their health care performance, including those that topped the Scorecard rankings. On certain health system indicators, states ranked lower overall performed better than the overall leaders. This suggests that even the lower-ranking states have something to teach.
If every state achieved the performance of the top-ranked state on each Scorecard indicator, the gains in health care access, quality, efficiency, and outcomes would be dramatic. At current rates of improvement, however, it may take many years or decades for states and the nation to see such progress.
National gains if all states achieved top rates* of performance
* Performance benchmarks set at the level achieved by the top-performing state with available data for this indicator.a Estimate based on working-age population ages 18–64 with employer-sponsored insurance and Medicare beneficiaries age 65 and older.
Source: David C. Radley, Douglas McCarthy, and Susan L. Hayes, 2018 Scorecard on State Health System Performance(The Commonwealth Fund, May 2018).
18 million more adults and children insured, beyond those who already gained coverage through the ACA
14 million fewer adults skipping care because of its cost
26 million more adults with a usual source of care
11 million more adults receiving recommended cancer screenings
837,000 more young children receiving all recommended vaccines
1 million fewer Medicare beneficiaries receiving a high-risk prescription drug
440,000afewer hospital readmissions
5.7 millionafewer emergency room visits for nonemergency care or conditions treatable with primary care
89,000 fewer deaths before age 75 from treatable diseases
National gains if all states achieved top rates* of performance
* Performance benchmarks set at the level achieved by the top-performing state with available data for this indicator.a Estimate based on working-age population, ages 18–64, with employer-sponsored insurance, and Medicare beneficiaries age 65 and older.
Exhibit 13

commonwealthfund.org May 2018
2018 Scorecard on State Health System Performance 13
States have many opportunities to lead and to collaborate with other stakeholders to promote health system improvement.34 Many states are already doing so by:
• expanding Medicaid eligibility under the Affordable Care Act (ACA)35
• establishing rules to ensure well-functioning insurance markets36
• using “value-based purchasing” in Medicaid and state employee benefits programs in order to promote higher-quality, lower-cost care37
• promoting secure and efficient methods for care providers, health plans, and state programs to share electronic health information for quality improvement38
• supporting sustainable efforts to address the social determinants of health39
• ensuring an adequate primary care workforce, especially in underserved areas.40
Some states are in better economic shape than others and have more resources to support improvement. But the gains in access to care and narrowing of disparities associated with the ACA’s coverage expansions highlight the role that public programs can play in equalizing opportunity across and within states.41 (For example, see box on New York’s improvement on next page.)
These gains in access to care may be compromised, however, by the repeal of the ACA’s individual mandate penalty and by regulatory changes to state insurance markets currently under way.42 Although states have tools to strengthen their individual insurance markets, such as reinsurance mechanisms that can help moderate premium increases,43 there are limits to what the health law can do. Insurance coverage is a necessary but not sufficient condition for improving health care and outcomes. Urgent concerns such as the opioid crisis may call for new initiatives.44
With states assuming ever greater responsibility for the future of health policy, it will be more important than ever to continue tracking the performance of the health system throughout the country.
A CLOSER LOOK AT HOSPITAL MORTALITY
The Scorecard measures deaths within 30 days of hospital discharge among Medicare beneficiaries who were treated for four common conditions: heart attack, stroke, congestive heart failure, and pneumonia. Hospital 30-day mortality rates rose in nearly all states between the two measurement periods reported in the Scorecard, driving the national average from 13.2 percent to 14.1 percent.47 The increase in this rate, which represents a reversal in an earlier improvement trend, appears to be driven by a sharp uptick in mortality among pneumonia patients.
Source: D. Radley, D. McCarthy, and S. Hayes, Aiming Higher: Results from the Commonwealth Fund Scorecard on State Health System Performance 2018 Edition, The Commonwealth Fund, TK 2018.
Hospital mortality has risen among patients admitted for pneumonia
Data: CMS Hospital Compare, 2014 and 2017 4th Quarter, National-Level Summary Estimates.
14.9
15.3
11.9
11.9
13.6
14.6
11.9
15.9
Heart attack
Stroke
Congestiveheart failure
Pneumonia
Average 30-day hospital mortality by condition (%)
13.214.1
Total
2010–2013
2013–2016
Average 30-day mortality among patients discharged for heart attack, stroke, congestive heart failure, or pneumonia (%)
Data: CMS Hospital Compare, 2014 and 2017 4th Quarter, National-Level Summary Estimates.
Hospital mortality has risen among patients admitted for pneumonia
commonwealthfund.org May 2018
2018 Scorecard on State Health System Performance 14
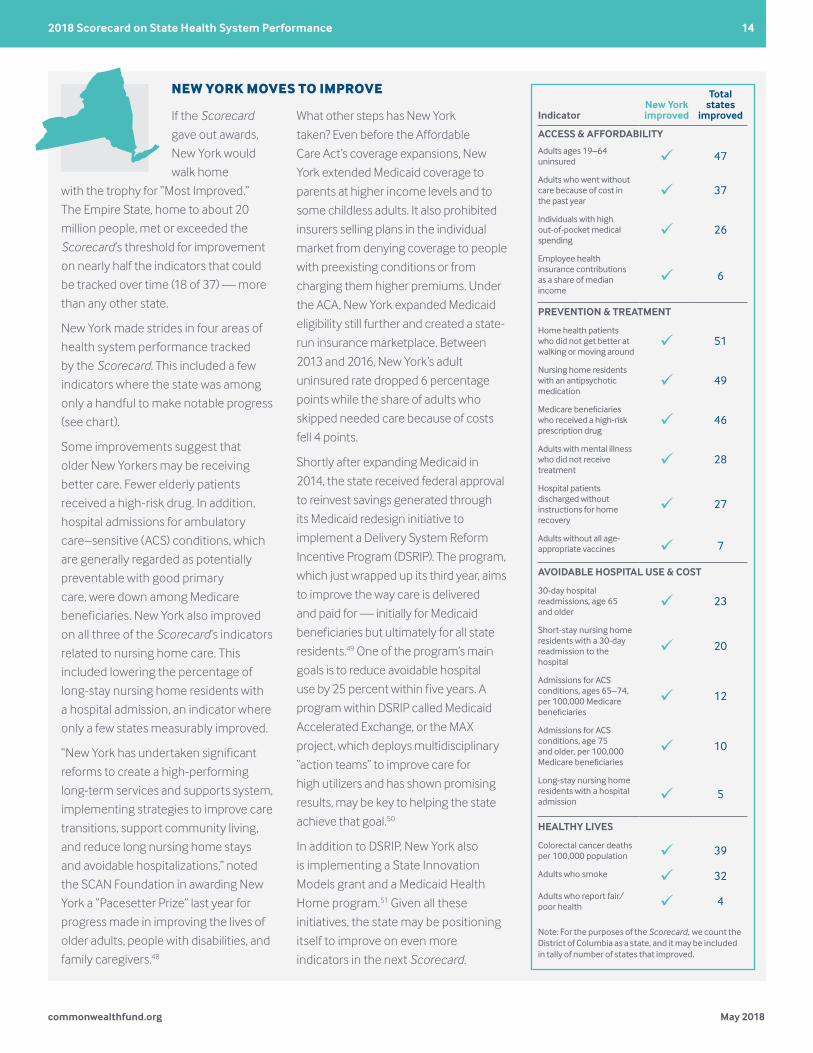
Note: For the purposes of the Scorecard, we count the District of Columbia as a state, and it may be included in tally of number of states that improved.
IndicatorNew York improved
Total states
improved
ACCESS & AFFORDABILITY
Adults ages 19–64 uninsured ü 47
Adults who went without care because of cost in the past year
ü 37
Individuals with high out-of-pocket medical spending
ü 26
Employee health insurance contributions as a share of median income
ü 6
PREVENTION & TREATMENT
Home health patients who did not get better at walking or moving around
ü 51
Nursing home residents with an antipsychotic medication
ü 49
Medicare beneficiaries who received a high-risk prescription drug
ü 46
Adults with mental illness who did not receive treatment
ü 28
Hospital patients discharged without instructions for home recovery
ü 27
Adults without all age-appropriate vaccines ü 7
AVOIDABLE HOSPITAL USE & COST
30-day hospital readmissions, age 65 and older
ü 23
Short-stay nursing home residents with a 30-day readmission to the hospital
ü 20
Admissions for ACS conditions, ages 65–74, per 100,000 Medicare beneficiaries
ü 12
Admissions for ACS conditions, age 75 and older, per 100,000 Medicare beneficiaries
ü 10
Long-stay nursing home residents with a hospital admission ü 5
HEALTHY LIVES
Colorectal cancer deaths per 100,000 population ü 39
Adults who smoke ü 32
Adults who report fair/poor health ü 4
NEW YORK MOVES TO IMPROVE
If the Scorecard
gave out awards,
New York would
walk home
with the trophy for “Most Improved.”
The Empire State, home to about 20
million people, met or exceeded the
Scorecard ’s threshold for improvement
on nearly half the indicators that could
be tracked over time (18 of 37) — more
than any other state.
New York made strides in four areas of
health system performance tracked
by the Scorecard. This included a few
indicators where the state was among
only a handful to make notable progress
(see chart).
Some improvements suggest that
older New Yorkers may be receiving
better care. Fewer elderly patients
received a high-risk drug. In addition,
hospital admissions for ambulatory
care–sensitive (ACS) conditions, which
are generally regarded as potentially
preventable with good primary
care, were down among Medicare
beneficiaries. New York also improved
on all three of the Scorecard ’s indicators
related to nursing home care. This
included lowering the percentage of
long-stay nursing home residents with
a hospital admission, an indicator where
only a few states measurably improved.
“New York has undertaken significant
reforms to create a high-performing
long-term services and supports system,
implementing strategies to improve care
transitions, support community living,
and reduce long nursing home stays
and avoidable hospitalizations,” noted
the SCAN Foundation in awarding New
York a “Pacesetter Prize” last year for
progress made in improving the lives of
older adults, people with disabilities, and
family caregivers.48
What other steps has New York
taken? Even before the Affordable
Care Act’s coverage expansions, New
York extended Medicaid coverage to
parents at higher income levels and to
some childless adults. It also prohibited
insurers selling plans in the individual
market from denying coverage to people
with preexisting conditions or from
charging them higher premiums. Under
the ACA, New York expanded Medicaid
eligibility still further and created a state-
run insurance marketplace. Between
2013 and 2016, New York’s adult
uninsured rate dropped 6 percentage
points while the share of adults who
skipped needed care because of costs
fell 4 points.
Shortly after expanding Medicaid in
2014, the state received federal approval
to reinvest savings generated through
its Medicaid redesign initiative to
implement a Delivery System Reform
Incentive Program (DSRIP). The program,
which just wrapped up its third year, aims
to improve the way care is delivered
and paid for — initially for Medicaid
beneficiaries but ultimately for all state
residents.49 One of the program’s main
goals is to reduce avoidable hospital
use by 25 percent within five years. A
program within DSRIP called Medicaid
Accelerated Exchange, or the MAX
project, which deploys multidisciplinary
“action teams” to improve care for
high utilizers and has shown promising
results, may be key to helping the state
achieve that goal.50
In addition to DSRIP, New York also
is implementing a State Innovation
Models grant and a Medicaid Health
Home program.51 Given all these
initiatives, the state may be positioning
itself to improve on even more
indicators in the next Scorecard.

commonwealthfund.org May 2018
2018 Scorecard on State Health System Performance 15
SCORECARD METHODS
The 2018 Scorecard on State Health System Performance, evaluates 43 performance indicators grouped into four dimensions:
• Access and Affordability (7 indicators): includes rates of insurance coverage for children and adults, as well as individuals’ out-of-pocket expenses for health insurance and medical care, cost-related barriers to receiving care, and dental visits.
• Prevention and Treatment (16 indicators): includes measures of receiving preventive care and needed mental health care, as well as measures of quality in ambulatory, hospital, postacute, and long-term care settings.
• Potentially Avoidable Hospital Use and Cost (10 indicators; including several measures reported separately for distinct age groups): includes indicators of hospital and emergency department use that might be reduced with timely and effective care and follow-up care, as well as estimates of per-person spending among Medicare beneficiaries and working-age adults with employer-sponsored insurance.
• Healthy Lives (10 indicators): includes measures of premature death, health status, health risk behaviors including smoking and obesity, and tooth loss.
DISPARITY DIMENSION. The 2018 Scorecard evaluates performance differences within states associated with individuals’ income level for a subset of 19 indicators that span the other four dimensions of performance. For each state and indicator, we evaluate the difference in rates for the state’s low-income population (generally under 200% of the federal poverty level) and higher-income population (generally over 400% of the federal poverty level). States are ranked on the relative magnitude of the resulting disparities in performance. This method represents a change from that used in previous scorecard editions. Racial and ethnic disparities in state health system performance will be evaluated separately in a forthcoming report.
The following principles guided the development of the Scorecard:
PERFORMANCE METRICS. The 43 metrics selected for this report span health care system performance, representing important dimensions and measurable aspects of care. Where possible, indicators align with those used in previous state scorecards. Several indicators used in previous versions of the scorecard have been dropped either because all states improved to the point where no meaningful variations existed (e.g., hospital quality process-of-care measures) or the data to construct the measures were no longer available. New indicators have been added to the scorecard series over time, ensuring the Scorecard reflects current and evolving priorities. See below for more detail on changes in indicators.

commonwealthfund.org May 2018
2018 Scorecard on State Health System Performance 16
MEASURING CHANGE OVER TIME. We were able to construct a time series for 37 indicators. Not all indicators could be trended over time because of changes in the underlying data or measure definitions.
There were generally two to three years between indicators’ baseline and current year data observation, though the starting and ending points depended on data availability. We chose this short time horizon to capture the immediate effects of changes relative to the policy and delivery system environment, such as recent coverage expansions under the Affordable Care Act, and other reforms as they are or may be enacted and implemented in the future.
We considered a change in an indicator’s value between the baseline and current year data points to be meaningful if it was at least one-half (0.5) of a standard deviation larger than the indictor’s combined distribution over the two time points — a common approach used in social science research.
To assess change over time in the Disparity dimension, we counted how often the within-state disparity narrowed, so long as there was also an improvement in observed rate for the state’s low-income population.
DATA SOURCES. Indicators draw from publicly available data sources, including government-sponsored surveys, registries, publicly reported quality indicators, vital statistics, mortality data, and administrative databases. The most current data available were used in this report whenever possible. Appendix B provides detail on the data sources and time frames.
SCORING AND RANKING METHODS. For the 2018 Scorecard, we introduce a new method of ranking states based on a standardized measure of variation known as the “z-score.”
For each indicator, a state’s standardized z-score is calculated by subtracting the 51-state average (including the District of Columbia as if it were a state) from the state’s observed rate, and dividing by the standard deviation of all observed state rates. States’ standardized z-scores are averaged across all performance indicators within the performance dimension, and dimension scores are averaged into an overall score. Ranks are assigned based on the overall score. This approach gives each dimension equal weight, and within dimensions weights the indicators equally.
The z-score more precisely portrays differences in performance across states (as shown in Exhibit 1) than our prior simple ranking approach used in prior scorecards. It is also better suited to accommodate the different scales used across Scorecard indicators (e.g., percentages, dollars, and population-based rates). This method also aligns with methods used in Commonwealth Fund international health system ranking reports.
As in previous state scorecards, if historical data were not available for a particular indicator in the baseline period, the current year data point was used as a substitute, thus ensuring that ranks in each time period were based on the same number of indicators. Three indicators in the Avoidable Hospital Use and Cost dimension are stratified by age: preventable hospitalizations, 30-day
commonwealthfund.org May 2018
2018 Scorecard on State Health System Performance 17
readmissions, and avoidable emergency room visits. For these indicators, states’ z-scores are averaged across age groups into a single, measure-specific composite before determining the state’s dimension score.
CHANGES IN SCORECARD INDICATORS
The 2018 Scorecard includes several changes to the set of performance measures on which each state is evaluated. New performance indicators were added, including:
• two new measures of access to and use of mental health services by adults
• a new measure of employee contributions to the cost of their employer-sponsored health insurance costs
• several new quality and utilization measures to better capture the health care experience of working-age adults with employer-sponsored insurance:
– adult diabetics with an annual hemoglobin A1c test
– potentially inappropriate medical imaging for low-back pain
– potentially avoidable hospital admissions for ambulatory care–sensitive conditions
– potentially avoidable emergency department use for nonemergency conditions
– 30-day hospital readmissions.
We expanded our previously reported measure of suicide deaths to also include death from alcohol and drug use — collectively called “deaths of despair.”
Finally, we dropped several performance measures that no longer differentiated state-level performance or for methodological reasons, including:
• At-risk adults without a routine doctor visit in past two years
• Medicare beneficiaries with dementia, hip/pelvic fracture, or chronic renal failure who received a prescription drug that is contraindicated for that condition
• Medicare fee-for-service patients whose health provider always listens, explains, shows respect, and spends enough time with them
• Home health patients whose wounds improved or healed after an operation
• High-risk nursing home residents with pressure sores
• Years of potential life lost before age 75.
Additional information regarding the rationale for these changes is available upon request.
Because of changes in indicators and methods, the 2018 Scorecard rankings are not comparable to those reported in previous scorecard reports.

commonwealthfund.org May 2018
2018 Scorecard on State Health System Performance 18
NOTES1 David Blumenthal, “Drop in U.S. Life Expectancy
Is an ‘Indictment of the American Health Care System,’” STAT, Jan. 4, 2018, https://www.statnews.com/2018/01/04/life-expectancy-us-health-care/; and Kenneth D. Kochanek et al., Mortality in the United States, 2016, NCHS Data Brief No. 293 (National Center for Health Statistics, Dec. 2017), https://www.cdc.gov/nchs/data/databriefs/db293.pdf.
2 Anne Case and Angus Deaton, “Rising Morbidity and Mortality in Midlife Among White Non-Hispanic Americans in the 21st Century,” Proceedings of the National Academy of Sciences of the United States of America 112, no. 49 (Dec. 8, 2015): 15078–83, http://www.pnas.org/content/112/49/15078.
3 Ellen Nolte and Martin McKee, “Variations in Amenable Mortality — Trends in 16 High-Income Nations,” Health Policy 103, no. 1 (Nov. 2011): 47–52, http://www.commonwealthfund.org/publications/in-the-literature/2011/sep/variations-in-amenable-mortality.
4 Melinda K. Abrams and Donald Moulds, “Integrating Medical and Social Services: A Pressing Priority for Health Systems and Payers,” Health Affairs Blog, July 5, 2016, https://www.healthaffairs.org/do/10.1377/hblog20160705.055717/full/; KPMG Government Institute, Investing in Social Services as a Core Strategy for Healthcare Organizations (The Commonwealth Fund, Mar. 2018), http://www.commonwealthfund.org/publications/other/2018/investing-in-social-services; and Institute of Medicine, Primary Care and Public Health: Exploring Integration to Improve Population Health (National Academies Press, 2012), http://www.nationalacademies.org/hmd/Reports/2012/Primary-Care-and-Public-Health.aspx.
5 Anna Spencer et al., Measuring Social Determinants of Health Among Medicaid Beneficiaries: Early State Lessons (Center for Health Care Strategies, Dec. 2016), https://www.chcs.org/resource/measuring-social-determinants-health-among-medicaid-beneficiaries-early-state-lessons; Laura M. Gottlieb et al., “Clinical
Interventions Addressing Nonmedical Health Determinants in Medicaid Managed Care,” American Journal of Managed Care 22, no. 5 (May 2016): 370–76, http://www.commonwealthfund.org/publications/in-brief/2016/jun/addressing-nonmedical-health-determinants-medicaid; and Deborah Bachrach et al., Enabling Sustainable Investment in Social Interventions: A Review of Medicaid Managed Care Rate-Setting Tools (The Commonwealth Fund, Jan. 2018), http://www.commonwealthfund.org/publications/fund-reports/2018/jan/social-inteventions-medicaid-managed-care-rate-setting.
6 Deborah Bachrach, Stephanie Anthony, and Andrew Detty, State Strategies for Integrating Physical and Behavioral Health Services in a Changing Medicaid Environment (The Commonwealth Fund, Aug. 2014), http://www.commonwealthfund.org/publications/fund-reports/2014/aug/state-strategies-behavioral-health; Deborah Bachrach, Patricia M. Boozang, and Hailey E. Davis, How Arizona Medicaid Accelerated the Integration of Physical and Behavioral Health Services (The Commonwealth Fund, May 2017), http://www.commonwealthfund.org/publications/issue-briefs/2017/may/arizona-medicaid-integration-behavioral-health; Hannah Dorr, State Strategies for Integrating Substance Use Disorder Treatment and Primary Care (National Academy for State Health Policy, Mar. 2017), https://nashp.org/state-strategies-for-integrating-substance-use-disorder-treatment-and-primary-care; and Lisa Clemans-Cope et al., “Experiences of Three States Implementing the Medicaid Health Home Model to Address Opioid Use Disorder — Case Studies in Maryland, Rhode Island, and Vermont,” Journal of Substance Abuse Treatment 83 (Dec. 2017): 27–35, http://www.journalofsubstanceabusetreatment.com/article/S0740-5472(17)30195-2/fulltext.
7 Henry J. Kaiser Family Foundation, Where Are States Today? Medicaid and CHIP Eligibility Levels for Children, Pregnant Women, and Adults (KFF, Mar. 2018), https://www.kff.org/medicaid/fact-sheet/where-are-states-today-medicaid-and-chip.

commonwealthfund.org May 2018
2018 Scorecard on State Health System Performance 19
8 Nancy Adler et al., Reaching for a Healthier Life: Facts on Socioeconomic Status and Health in the U.S. (John D. and Catherine T. MacArthur Foundation Research Network on Socioeconomic Status and Health, n.d.), http://www.macses.ucsf.edu/downloads/Reaching_for_a_Healthier_Life.pdf.
9 Jessica L. Semega, Kayla R. Fontenot, and Melissa A. Kollar, Income and Poverty in the United States: 2016 (Current Population Reports, U.S. Government Printing Office, Sept. 2017), https://census.gov/content/dam/Census/library/publications/2017/demo/P60-259.pdf; and Agency for Healthcare Research and Quality, 2016 National Healthcare Quality and Disparities Report: Executive Summary (U.S. Department of Health and Human Services, July 2017), http://www.ahrq.gov/research/findings/nhqrdr/nhqdr16/summary.html.
10 John E. McDonough et al., A State Policy Agenda to Eliminate Racial and Ethnic Disparities (The Commonwealth Fund, June 2004), http://www.commonwealthfund.org/programs/minority/mcdonough_statepolicyagenda_746.pdf; and National Partnership for Action to End Health Disparities, National Stakeholder Strategy for Achieving Health Equity (U.S. Department of Health and Human Services, Office of Minority Health, n.d.), https://minorityhealth.hhs.gov/npa/files/Plans/NSS/CompleteNSS.pdf.
11 National Conference of State Legislatures, State Approaches to Reducing Health Disparities (NCSL, June 2017), http://www.ncsl.org/research/health/state-approaches-to-reducing-health-disparities.aspx; Association of State and Territorial Health Officials, Health Equity Snapshots (ASTHO, 2014), http://www.astho.org/Programs/Health-Equity/Minority-Health-Survey/2014/State-Snapshots/Map/; and Office of Minority Health, National Standards for Culturally and Linguistically Appropriate Services in Health and Health Care: Compendium of State-Sponsored National CLAS Standards Implementation Activities (U.S. Department of Health and Human Services, 2016), https://www.thinkculturalhealth.hhs.gov/assets/pdfs/CLASCompendium.pdf.
12 K. John McConnell et al., “Oregon’s Emphasis on Equity Shows Signs of Early Success for Black and American Indian Medicaid Enrollees,” Health Affairs 37, no. 3 (Mar. 2018): 386–93, https://www.healthaffairs.org/doi/abs/10.1377/hlthaff.2017.1282.
13 Eric C. Schneider et al., Mirror, Mirror 2017: International Comparison Reflects Flaws and Opportunities for Better U.S. Health Care (The Commonwealth Fund, July 2017), http://www.commonwealthfund.org/interactives/2017/july/mirror-mirror/.
14 Centers for Medicare and Medicaid Services, Health Expenditures by State of Residence, 1991–2014 (CMS, n.d.), https://www.cms.gov/Research-Statistics-Data-and-Systems/Statistics-Trends-and-Reports/NationalHealthExpendData/NationalHealth AccountsStateHealthAccountsResidence.html.
15 Austin Frakt and Aaron E. Carroll, “Why the U.S. Spends So Much More Than Other Nations on Health Care,” The Upshot (blog), New York Times, Jan. 2, 2018, https://www.nytimes.com/2018/01/02/upshot/us-health-care-expensive-country-comparison.html; and Joseph L. Dieleman et al., “Factors Associated with Increases in U.S. Health Care Spending, 1996–2013,” JAMA 318, no. 17 (Nov. 7, 2017): 1668–78, https://jamanetwork.com/journals/jama/article-abstract/2661579.
16 The measure specification excludes patients with underlying conditions for which imaging may be appropriate, to the degree these conditions are captured in claims data; see National Quality Measures Clearinghouse, Measure Summary: Use of Imaging Studies for Low Back Pain: Percentage of Members with a Primary Diagnosis of Low Back Pain Who Did Not Have an Imaging Study (Plain X-ray, MRI, CT Scan) Within 28 Days of the Diagnosis (Agency for Healthcare Research and Quality, 2016), https://www.qualitymeasures.ahrq.gov/summaries/summary/49748 (site discontinued as of July 17, 2018).
17 Bureau of Labor Statistics, Consumer Price Index (U.S. Department of Labor, 2018), https://data.bls.gov.

commonwealthfund.org May 2018
2018 Scorecard on State Health System Performance 20
18 Kevin Quealy and Margot Sanger-Katz, “The Experts Were Wrong About the Best Places for Better and Cheaper Health Care,” The Upshot (blog), New York Times, Dec. 15, 2015, https://www.nytimes.com/interactive/2015/12/15/upshot/the-best-places-for-better-cheaper-health-care-arent-what-experts-thought.html; and Zack Cooper et al., The Price Ain’t Right? Hospital Prices and Health Spending on the Privately Insured, NBER Working Paper No. 21815 (National Bureau of Economic Research, Dec. 2015), https://www.nber.org/papers/w21815.
19 Dominique Hall and Mark A. Zezza, “McAllen, Texas: Tailored Solutions to High Spending Are Needed,” To the Point (blog), The Commonwealth Fund, May 5, 2015, http://www.commonwealthfund.org/publications/blog/2015/may/mcallen-texas-health-spending.
20 Anna D. Sinaiko, Karen E. Joynt, and Meredith B. Rosenthal, “Association Between Viewing Health Care Price Information and Choice of Health Care Facility,” JAMA Internal Medicine 176, no. 12 (Dec. 1, 2016): 1868–70, https://jamanetwork.com/journals/jamainternalmedicine/fullarticle/2571612; Suzanne F. Delbanco et al., Benefit Designs: How They Work (Urban Institute and the Catalyst for Payment Reform, Apr. 2016), https://www.urban.org/research/publication/benefit-designs-how-they-work; Mark B. McClellan et al., Payment Reform for Better Value and Medical Innovation: A Vital Direction for Health and Health Care (National Academy of Medicine, Mar. 2017), https://nam.edu/wp-content/uploads/2017/03/Payment-Reform-for-Better-Value-and-Medical-Innovation.pdf; and Zirui Song et al., “Changes in Health Care Spending and Quality 4 Years into Global Payment,” New England Journal of Medicine 371, no. 18 (Oct. 30, 2014): 1704–14, http://www.nejm.org/doi/10.1056/NEJMsa1404026.
21 Barbara Starfield, Leiyu Shi, and James Macinko, “Contribution of Primary Care to Health Systems and Health,” Milbank Quarterly 83, no. 3 (2005): 457–502, http://www.commonwealthfund.org/usr_doc/Starfield_Milbank.pdf; and Mark W. Friedberg, Peter S. Hussey, and Eric C. Schneider, “Primary Care: A Critical Review
of the Evidence on Quality and Costs of Health Care,” Health Affairs 29, no. 5 (May 2010): 766–72, https://www.healthaffairs.org/doi/abs/10.1377/hlthaff.2010.0025.
22 Cathy Schoen et al., “Access, Affordability, and Insurance Complexity Are Often Worse in the United States Compared to Ten Other Countries,” Health Affairs 32, no. 12 (Dec. 2013): 2205–15, http://www.commonwealthfund.org/publications/in-the-literature/2013/nov/access-affordability-and-insurance; and John Billings, Nina Parikh, and Tod Mijanovich, Emergency Department Use in New York City: A Substitute for Primary Care? (The Commonwealth Fund, March 2000), http://www.commonwealthfund.org/publications/issue-briefs/2000/mar/emergency-department-use-in-new-york-city--a-substitute-for-primary-care.
23 Marci Nielsen et al., The Patient-Centered Medical Home’s Impact on Cost and Quality: Annual Review of Evidence, 2014–2015 (Patient-Centered Primary Care Collaborative, Feb. 2016), https://www.pcpcc.org/resource/patient-centered-medical-homes-impact-cost-and-quality-2014-2015; and Amanda R. Markovitz et al., “Patient-Centered Medical Home Implementation and Use of Preventive Services,” JAMA Internal Medicine 175, no. 4 (Apr. 2015): 598–606, https://jamanetwork.com/journals/jamainternalmedicine/fullarticle/2110999.
24 Sarah Klein, Martha Hostetter, and Douglas McCarthy, The “One Care” Program at Commonwealth Care Alliance: Partnering with Medicare and Medicaid to Improve Care for Nonelderly Dual Eligibles (The Commonwealth Fund, Dec. 2016), http://www.commonwealthfund.org/publications/case-studies/2016/dec/commonwealth-care-alliance; and Alexandra Kruse, Stephanie Gibbs, and Leah Smith, Advancing Medicare and Medicaid Integration: Key Program Features and Factors Driving State Investment (Center for Health Care Strategies, Nov. 2017), https://www.chcs.org/resource/advancing-medicare-medicaid-integration-key-program-features-factors-driving-state-investment.
commonwealthfund.org May 2018
2018 Scorecard on State Health System Performance 21
25 Christopher F. Koller and Dhruv Khullar, “Primary Care Spending Rate — A Lever for Encouraging Investment in Primary Care,” New England Journal of Medicine 377, no. 18 (Nov. 2, 2017): 1709–11, http://www.nejm.org/doi/10.1056/NEJMp1709538; and Office of the Health Insurance Commissioner, Primary Care Spending in Rhode Island: Commercial Health Insurer Compliance (State of Rhode Island, Jan. 2014), http://www.ohic.ri.gov/documents/Primary-Care-Spending-generalprimary-care-Jan-2014.pdf.
26 Susan L. Hayes et al., What’s at Stake: States’ Progress on Health Coverage and Access to Care, 2013–2016 (The Commonwealth Fund, Dec. 2017), http://www.commonwealthfund.org/publications/issue-briefs/2017/dec/states-progress-health-coverage-and-access.
27 Centers for Medicare and Medicaid Services, National Partnership to Improve Dementia Care in Nursing Homes (CMS, n.d.), https://www.cms.gov/Medicare/Provider-Enrollment-and-Certification/SurveyCertificationGenInfo/National-Partnership-to-Improve-Dementia-Care-in-Nursing-Homes.html. The Partnership built on the Advancing Excellence in America’s Nursing Homes Campaign, launched in 2007 with support from the Commonwealth Fund; see: National Nursing Home Quality Improvement Campaign, Campaign History (NNHQIC, n.d.), https://www.nhqualitycampaign.org/history.aspx.
28 Rebekah R. Rhoades and Laura A. Beebe, “Tobacco Control and Prevention in Oklahoma: Best Practices in a Preemptive State,” American Journal of Preventive Medicine 48, no. 1, Suppl. 1 (Jan. 2015): S6–S12, http://www.ajpmonline.org/article/S0749-3797(14)00497-8/fulltext.
29 James Lightwood and Stanton A. Glantz, “The Effect of the California Tobacco Control Program on Smoking Prevalence, Cigarette Consumption and Healthcare Costs: 1989–2008,” PLoS ONE 8, no. 2 (Feb. 2013), https://doi.org/10.1371/journal.pone.0047145.
30 National Center for Chronic Disease Prevention and Health Promotion, Best Practices for Comprehensive Tobacco Control Programs — 2014 (Centers for Disease Control and Prevention, 2014), https://www.cdc.gov/tobacco/stateandcommunity/best_practices/index.htm?s_cid=cs_3281; and National Governors Association, Health Investments That Pay Off: Taking a Comprehensive Approach to Tobacco Control (NGA Center for Best Practices, Aug. 16, 2016), https://www.nga.org/files/live/sites/NGA/files/pdf/2016/1608HealthInvestmentsTobacco.pdf.
31 Robert Fornango et al., Project Evaluation Activity in Support of Partnership for Patients Interim Evaluation Report, Final September 2015 (Centers for Medicare and Medicaid Services, revised Dec. 29, 2015), https://downloads.cms.gov/files/cmmi/pfp-interimevalrpt.pdf; and David Ruiz et al., Evaluation of the Community-Based Care Transitions Program: Final Evaluation Report (Centers for Medicare and Medicaid Services, Nov. 2017), https://downloads.cms.gov/files/cmmi/cctp-final-eval-rpt.pdf.
32 Lauren S. Hughes, Alon Peltz, and Patrick H. Conway, “State Innovation Model Initiative: A State-Led Approach to Accelerating Health Care System Transformation,” JAMA 313, no. 13 (Apr. 7, 2015): 1317–18, https://jamanetwork.com/journals/jama/article-abstract/2190630; Julia C. Martinez, Martha P. King, and Richard Cauchi, Improving the Health Care System: Seven State Strategies (National Conference of State Legislatures, July 2016), http://www.ncsl.org/Portals/1/Documents/Health/ImprovingHealthSystemsBrief16.pdf; Martha Hostetter, Sarah Klein, and Douglas McCarthy, Hennepin Health: A Care Delivery Paradigm for New Medicaid Beneficiaries (The Commonwealth Fund, Oct. 2016), http://www.commonwealthfund.org/publications/case-studies/2016/oct/hennepin-health; and Sara Rosenbaum et al., Medicaid Payment and Delivery System Reform: Early Insights from 10 Medicaid Expansion States (The Commonwealth Fund, Oct. 2017), http://www.commonwealthfund.org/publications/issue-briefs/2017/oct/medicaid-payment-reform-10-expansion-states.
commonwealthfund.org May 2018
2018 Scorecard on State Health System Performance 22
33 Qian Gu et al., “The Medicare Hospital Readmissions Reduction Program: Potential Unintended Consequences for Hospitals Serving Vulnerable Populations,” Health Services Research 49, no. 3 (June 2014): 818–37, https://onlinelibrary.wiley.com/doi/abs/10.1111/1475-6773.12150; Andrew M. Ibrahim et al., “Association of Coded Severity with Readmission Reduction After the Hospital Readmissions Reduction Program,” JAMA Internal Medicine 178, no. 2 (Feb. 1, 2018): 290–92, https://jamanetwork.com/journals/jamainternalmedicine/article-abstract/2663252; and Ashish K. Jha, “To Fix the Hospital Readmissions Program, Prioritize What Matters,” JAMA 319, no. 5 (Feb. 6, 2018): 431–33, https://jamanetwork.com/journals/jama/fullarticle/2671454.
34 Sharon Silow-Carroll and Greg Moody, Lessons from High- and Low-Performing States for Raising Overall Health System Performance (The Commonwealth Fund, May 2011), http://www.commonwealthfund.org/publications/issue-briefs/2011/may/high-and-low-performing-states.
35 Benjamin D. Sommers et al., “Changes in Utilization and Health Among Low-Income Adults After Medicaid Expansion or Expanded Private Insurance,” JAMA Internal Medicine, published online Aug. 8, 2016, http://www.commonwealthfund.org/publications/in-the-literature/2016/aug/changes-utilization-health-low-income; and Benjamin D. Sommers et al., “Three-Year Impacts of the Affordable Care Act: Improved Medical Care and Health Among Low-Income Adults,” Health Affairs Web First, published online May 17, 2017; http://www.commonwealthfund.org/publications/in-the-literature/2017/may/aca-improved-medical-care-and-health.
36 Sabrina Corlette, Kevin Lucia, and Maanasa Kona, “States Step Up to Protect Consumers in Wake of Cuts to ACA Cost-Sharing Reduction Payments,” To the Point (blog), The Commonwealth Fund, Oct. 27, 2017, http://www.commonwealthfund.org/publications/blog/2017/oct/states-protect-consumers-in-wake-of-aca-cost-sharing-payment-cuts; Justin Giovannelli and
Ashley Williams, “Regulation of Narrow Networks: With Federal Protections in Jeopardy, State Approaches Take on Added Significance,” To the Point (blog), The Commonwealth Fund, Jan. 31, 2017, http://www.commonwealthfund.org/publications/blog/2017/feb/regulation-of-narrow-networks.
37 Bailit Health and National Association of Medicaid Directors, The Role of State Medicaid Programs in Improving the Health Care System (NAMD, Mar. 22, 2016), http://medicaiddirectors.org/wp-content/uploads/2016/03/NAMD_Bailit-Health_Value-Based-Purchasing-in-Medicaid.pdf; and Michael Bailit, Megan Burns, and Mary Beth Dyer, Value-Based-Innovation by State Public Employee Health Benefits Programs (State Health and Value Strategies, Princeton University Woodrow Wilson School of Public and International Affairs, Nov. 2017), https://www.shvs.org/resource/value-based-innovation-by-state-public-employee-health-benefits-programs.
38 Kate Johnson et al., Getting the Right Information to the Right Health Care Providers at the Right Time: A Road Map for States to Improve Health Information Flow Between Providers (National Governors Association Center for Best Practices, Dec. 2016), https://www.nga.org/cms/center/publications/health/health-information-flow.
39 Deborah Bachrach, Jocelyn Guyer, and Ariel Levin, Medicaid Coverage of Social Interventions: A Road Map for States (Milbank Memorial Fund, July 2016), https://www.milbank.org/publications/medicaid-coverage-social-interventions-road-map-states.
40 National Conference of State Legislatures, Primary Care Workforce: A Health Care Safety-Net Toolkit for State Legislators (NCSL, 2013), http://www.ncsl.org/documents/health/PCWorkforceTK13.pdf.
41 Michelle M. Doty, Munira Z. Gunja, and Sara R. Collins, “Coverage Gains Among Lower-Income Blacks and Latinos Highlight ACA’s Successes and Areas for Improvement,” To the Point (blog), The
commonwealthfund.org May 2018
2018 Scorecard on State Health System Performance 23
Commonwealth Fund, Aug. 15, 2017, http://www.commonwealthfund.org/publications/blog/2017/aug/coverage-gains-blacks-and-latinos; and Susan L. Hayes et al., Reducing Racial and Ethnic Disparities in Access to Care: Has the Affordable Care Act Made a Difference? (The Commonwealth Fund, Aug. 2017), http://www.commonwealthfund.org/publications/issue-briefs/2017/aug/racial-ethnic-disparities-care.
42 David Blumenthal, “The ACA at Eight: Resilient But Still at Risk,” To the Point (blog), The Commonwealth Fund, Mar. 23, 2018, http://www.commonwealthfund.org/publications/blog/2018/mar/aca-at-eight.
43 Kevin Lucia et al., State Regulation of Coverage Options Outside of the Affordable Care Act: Limiting the Risk to the Individual Market (The Commonwealth Fund, Mar. 2018), http://www.commonwealthfund.org/publications/fund-reports/2018/mar/state-regulation-coverage-options-outside-aca; and Michael Ollove, “To Curb Rising Health Insurance Costs, Some States Try ‘Reinsurance Pools’,” Stateline (blog), Pew Charitable Trusts, Apr. 9, 2018, http://www.pewtrusts.org/en/research-and-analysis/blogs/stateline/2018/04/09/to-curb-rising-health-insurance-costs-some-states-try-reinsurance-pools.
44 Kelly Murphy et al., Finding Solutions to the Prescription Opioid and Heroin Crisis: A Road Map for States (National Governors Association Center for Best Practices, July 2016), https://www.nga.org/cms/finding-solutions-to-the-prescription-opioid-and-heroin-crisis-a-road-map-for-states.
45 April Grady, Patricia M. Boozang, and Cindy Mann, Estimated Budget Impacts of Expanding MaineCare, Prepared for the Maine Health Access Foundation (Manatt Health, Feb. 28, 2018), https://www.manatt.com/Insights/White-Papers/2018/Estimated-Budget-Impacts-of-Expanding-MaineCare; Elizabeth H. Kilbreth, The Real Impact of Medicaid Expansion in Maine (Maine Equal Justice Partners, Sept. 26, 2017), http://www.mejp.org/sites/default/files/Medicaid-Expansion-The-Real-Impact-Kilbreth-Sep2017.pdf; and
Yes on 2, Mainers for Health Care, “Get the Facts on Question 2: Medicaid Expansion Will Help Maine,” (see question 14 in document), http://mejp.org/sites/default/files/Medicaid-Expansion-Get-the-Facts-10-5-17.pdf.
46 New Hampshire Fiscal Policy Institute, “Medicaid Expansion in New Hampshire and the State Senate’s Proposed Changes,” Mar. 30, 2018, http://nhfpi.org/research/health-policy/medicaid-expansion-in-new-hampshire-and-the-state-senates-proposed-changes.html.
47 The Centers for Medicare and Medicaid Services reports hospital mortality over a three-year time frame.
48 SCAN Foundation Pacesetter Prize winners are selected based on data in the AARP LTSS State Scorecard, published with support from the Commonwealth Fund, http://www.thescanfoundation.org/new-york-wins-pacesetter-prize-effective-transitions.
49 Deborah Bachrach et al., Implementing New York’s DSRIP Program: Implications for Medicaid Payment and Delivery System Reform (The Commonwealth Fund, Apr. 2016), http://www.commonwealthfund.org/publications/fund-reports/2016/apr/new-york-dsrip-medicaid.
50 “MAX: Achieving Large-Scale Transformation By Engaging Front-Line Action Teams,” Health Affairs Blog, Mar. 30, 2018, https://www.healthaffairs.org/do/10.1377/hblog20180327.761736/full/.
51 New York State Department of Health, The New York State Health Innovation Plan (NYSDOH, n.d.), https://www.health.ny.gov/technology/innovation_plan_initiative/; and New York State Department of Health, Medicaid Health Homes — Comprehensive Care Management (NYSDOH, n.d.), https://www.health.ny.gov/health_care/medicaid/program/medicaid_health_homes/.
commonwealthfund.org May 2018
2018 Scorecard on State Health System Performance 24
ABOUT THE AUTHORS
David C. Radley, Ph.D., M.P.H., is senior scientist for the Commonwealth Fund’s Tracking Health System Performance initiative, working on the Scorecard project. Dr. Radley and his team develop national, state, and substate regional analyses on health care system performance and related insurance and care system market structure analyses. He is also a senior study director at Westat, a research firm that supports the Scorecard project. Previously, he was associate in domestic health policy for Abt Associates, with responsibility for a number of projects related to measuring long-term care quality and evaluating health information technology initiatives. Dr. Radley received his Ph.D. in health policy from the Dartmouth Institute for Health Policy and Clinical Practice, and holds a B.A. from Syracuse University and an M.P.H. from Yale University.
Douglas McCarthy, M.B.A., is senior research director for the Commonwealth Fund. He leads a team that has conducted more than 100 case studies of promising practices and innovations in health care delivery. He helped develop the Fund’s Scorecards on State Health System Performance and led their production from 2014 to 2018. His 30-year career has spanned roles in government, corporate, and nonprofit organizations, including the Institute for Healthcare Improvement and UnitedHealth Group’s Center for Health Care Policy and Evaluation. He was a public policy fellow at the University of Minnesota’s Humphrey School of Public Affairs and a leadership fellow of the Denver-based Regional Institute for Health and Environmental Leadership. He serves on the board of Colorado’s Center for Improving Value in Health Care.
Susan L. Hayes, M.P.A., is senior researcher for the Commonwealth Fund’s Tracking Health System Performance initiative. In this role she supports the Scorecard project, actively participating in the selection/development, research, and analysis of national, state, local, and special-population-level health system performance measures, and coauthoring Scorecard reports and related publications. Ms. Hayes holds an M.P.A. from New York University’s Wagner School of Public Service, where she won the Martin Dworkis Memorial Award for academic achievement and public service. She graduated from Dartmouth College with an A.B. in English and began a
distinguished career in journalism, working as an editorial assistant at PC Magazine and a senior editor at National Geographic Kids and later at Woman’s Day magazine. Following that period, Ms. Hayes was a freelance health writer and a contributing editor to Parent & Child magazine and cowrote a book on raising bilingual children with a pediatrician at Tufts Medical Center.
ACKNOWLEDGMENTS
We owe our sincere appreciation to all of the researchers who developed indicators and conducted data analyses for this Scorecard. These include: Michael E. Chernew, Ph.D., and Andrew Hicks, M.S., Department of Health Care Policy, Harvard Medical School; Sherry Glied, Ph.D., and Ougni Chakraborty, New York University Robert F. Wagner Graduate School of Public Service; Ashish Jha, M.D., M.P.H., and Jie Zheng, Ph.D., Harvard School of Public Health; Vincent Mor, Ph.D., Julie Lima, Ph.D., Zhanlian Feng, Ph.D., Brown University; and Yuting Zhang, Ph.D., University of Pittsburgh. We acknowledge Mental Health America for data reported in The State of Mental Health Care in America.
We also would like to thank the following Commonwealth Fund staff: David Blumenthal, Donald Moulds, Eric Schneider, Sara Collins, Melinda Abrams, and Rachel Nuzum for providing constructive guidance throughout; and the Fund’s communications and support teams, including Barry Scholl, Chris Hollander, Deborah Lorber, Mary Mahon, Christine Haran, Josh Tallman, Jen Wilson, Paul Frame, and Jeanne Moore, for their guidance, editorial and production support, and public dissemination efforts. We also thank Bethanne Fox and Maya Brod of Burness for their assistance with media outreach. We are grateful to the members of the Advisory Group who provided advice on improvements to the scorecard series: Joel C. Cantor, Sc.D., Rebekah Gee, M.D., Sherry Glied, Ph.D., Christopher F. Koller, David Lansky, Ph.D., Noam N. Levey, Karen Minyard, Ph.D., Elizabeth Mitchell, and Ernest Moy, M.D., M.P.H.
Finally, the authors wish to acknowledge Westat for its support of the research unit, which enabled the analysis and development of the Scorecard report, as well as Helen Liu for her analytic support of the project.
Editorial support was provided by Christopher Hollander and Deborah Lorber.
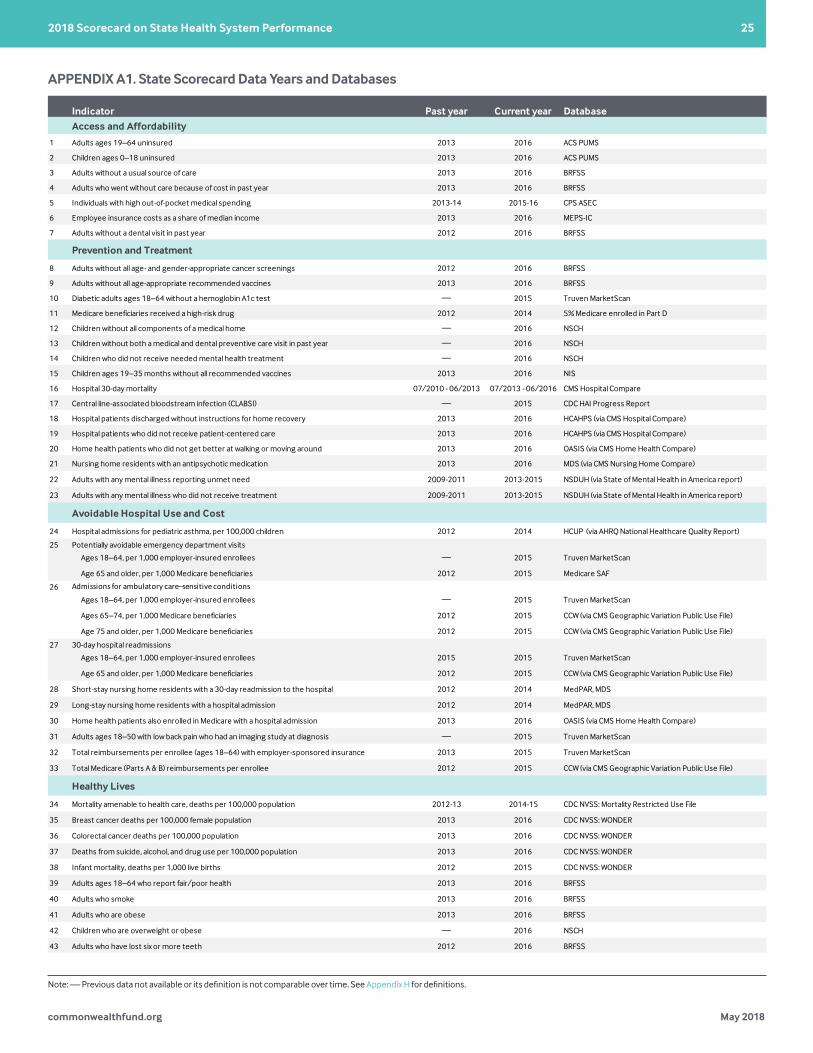
commonwealthfund.org May 2018
2018 Scorecard on State Health System Performance 25
Indicator Past year Current year DatabaseAccess and Affordability
1 Adults ages 19–64 uninsured 2013 2016 ACS PUMS
2 Children ages 0–18 uninsured 2013 2016 ACS PUMS
3 Adults without a usual source of care 2013 2016 BRFSS
4 Adults who went without care because of cost in past year 2013 2016 BRFSS
5 Individuals with high out-of-pocket medical spending 2013-14 2015-16 CPS ASEC
6 Employee insurance costs as a share of median income 2013 2016 MEPS-IC
7 Adults without a dental visit in past year 2012 2016 BRFSS
Prevention and Treatment
8 Adults without all age- and gender-appropriate cancer screenings 2012 2016 BRFSS
9 Adults without all age-appropriate recommended vaccines 2013 2016 BRFSS
10 Diabetic adults ages 18–64 without a hemoglobin A1c test — 2015 Truven MarketScan
11 Medicare beneficiaries received a high-risk drug 2012 2014 5% Medicare enrolled in Part D
12 Children without all components of a medical home — 2016 NSCH
13 Children without both a medical and dental preventive care visit in past year — 2016 NSCH
14 Children who did not receive needed mental health treatment — 2016 NSCH
15 Children ages 19–35 months without all recommended vaccines 2013 2016 NIS
16 Hospital 30-day mortality 07/2010 - 06/2013 07/2013 - 06/2016 CMS Hospital Compare
17 Central line-associated bloodstream infection (CLABSI) — 2015 CDC HAI Progress Report
18 Hospital patients discharged without instructions for home recovery 2013 2016 HCAHPS (via CMS Hospital Compare)
19 Hospital patients who did not receive patient-centered care 2013 2016 HCAHPS (via CMS Hospital Compare)
20 Home health patients who did not get better at walking or moving around 2013 2016 OASIS (via CMS Home Health Compare)
21 Nursing home residents with an antipsychotic medication 2013 2016 MDS (via CMS Nursing Home Compare)
22 Adults with any mental illness reporting unmet need 2009-2011 2013-2015 NSDUH (via State of Mental Health in America report)
23 Adults with any mental illness who did not receive treatment 2009-2011 2013-2015 NSDUH (via State of Mental Health in America report)
Avoidable Hospital Use and Cost
24 Hospital admissions for pediatric asthma, per 100,000 children 2012 2014 HCUP (via AHRQ National Healthcare Quality Report)
Potentially avoidable emergency department visits
Ages 18–64, per 1,000 employer-insured enrollees — 2015 Truven MarketScan
Age 65 and older, per 1,000 Medicare beneficiaries 2012 2015 Medicare SAF
Admissions for ambulatory care–sensitive conditions
Ages 18–64, per 1,000 employer-insured enrollees — 2015 Truven MarketScan
Ages 65–74, per 1,000 Medicare beneficiaries 2012 2015 CCW (via CMS Geographic Variation Public Use File)
Age 75 and older, per 1,000 Medicare beneficiaries 2012 2015 CCW (via CMS Geographic Variation Public Use File)
30-day hospital readmissions
Ages 18–64, per 1,000 employer-insured enrollees 2015 2015 Truven MarketScan
Age 65 and older, per 1,000 Medicare beneficiaries 2012 2015 CCW (via CMS Geographic Variation Public Use File)
28 Short-stay nursing home residents with a 30-day readmission to the hospital 2012 2014 MedPAR, MDS
29 Long-stay nursing home residents with a hospital admission 2012 2014 MedPAR, MDS
30 Home health patients also enrolled in Medicare with a hospital admission 2013 2016 OASIS (via CMS Home Health Compare)
31 Adults ages 18–50 with low back pain who had an imaging study at diagnosis — 2015 Truven MarketScan
32 Total reimbursements per enrollee (ages 18–64) with employer-sponsored insurance 2013 2015 Truven MarketScan
33 Total Medicare (Parts A & B) reimbursements per enrollee 2012 2015 CCW (via CMS Geographic Variation Public Use File)
Healthy Lives
34 Mortality amenable to health care, deaths per 100,000 population 2012-13 2014-15 CDC NVSS: Mortality Restricted Use File
35 Breast cancer deaths per 100,000 female population 2013 2016 CDC NVSS: WONDER
36 Colorectal cancer deaths per 100,000 population 2013 2016 CDC NVSS: WONDER
37 Deaths from suicide, alcohol, and drug use per 100,000 population 2013 2016 CDC NVSS: WONDER
38 Infant mortality, deaths per 1,000 live births 2012 2015 CDC NVSS: WONDER
39 Adults ages 18–64 who report fair/poor health 2013 2016 BRFSS
40 Adults who smoke 2013 2016 BRFSS
41 Adults who are obese 2013 2016 BRFSS
42 Children who are overweight or obese — 2016 NSCH
43 Adults who have lost six or more teeth 2012 2016 BRFSS
Appendix A1. State Scorecard Data Years and Databases
Note: (—) Previous data not available or its definition is not comparable over time.
25
26
27
APPENDIX A1. State Scorecard Data Years and Databases
Note: — Previous data not available or its definition is not comparable over time. See Appendix H for definitions.

commonwealthfund.org May 2018
2018 Scorecard on State Health System Performance 26
Indicator Baseline2018
Scorecard Baseline2018
Scorecard Baseline 2018 Scorecard
Access and Affordability1 Adults ages 19–64 uninsured 2013 2016 20 12 ** 5 - 30 4 - 23
2 Children ages 0–18 uninsured 2013 2016 8 5 ** 2 - 14 1 - 11
3 Adults without a usual source of care 2013 2016 24 22 12 - 35 11 - 32
4 Adults who went without care because of cost 2013 2016 16 13 * 7 - 22 7 - 19
5 Individuals with high out-of-pocket medical spending 2013-14 2015-16 15 14 10 - 22 9 - 19
6 Employee insurance costs as a share of median income 2013 2016 6 6 3 - 8 4 - 9
7 Adults without a dental visit in past year 2012 2016 15 16 10 - 20 10 - 20
Prevention and Treatment8 Adults without all age- and gender-appropriate cancer screenings 2012 2016 31 32 21 - 40 24 - 40
9 Adults without all age-appropriate recommended vaccines 2013 2016 64 63 53 - 72 54 - 70
10 Diabetic adults ages 18–64 without a hemoglobin A1c test — 2015 — 17 — 11 - 24
11 Medicare beneficiaries received a high-risk drug 2012 2014 17 13 ** 9 - 24 7 - 21
12 Children without all components of a medical home — 2016 — 51 — 40 - 66
13 Children without both a medical and dental preventive care visit — 2016 — 32 — 20 - 41
14 Children who did not receive needed mental health treatment — 2016 — 18 — 5 - 34
15 Children ages 19–35 months without all recommended vaccines 2013 2016 30 29 18 - 43 15 - 42
16 Hospital 30-day mortality 2010-13 2013-16 13.2 14.1 ** 12.2 - 14.1 13 - 15.4
17 Central line-associated bloodstream infection (CLABSI) — 2015 — 0.99 — 0.32 - 1.43
18 Hospital patients discharged without instructions 2013 2016 14 13 10 - 22 9 - 18
19 Hospital patients who did not receive patient-centered care 2013 2016 32 32 28 - 42 27 - 43
20 Home health patients without improved mobility 2013 2016 39 29 ** 34 - 51 23 - 40
21 Nursing home residents with an antipsychotic medication 2013 2016 21 16 ** 11 - 27 8 - 20
22 Adults with any mental illness reporting unmet need 2009-2011 2013-2015 21 20 14 - 30 14 - 25
23 Adults with any mental illness who did not receive treatment 2009-2011 2013-2015 59 56 * 45 - 73 41 - 66
Avoidable Hospital Use and Cost24 Hospital admissions for pediatric asthma, per 100,000 children 2012 2014 143 106 * 28 - 231 22 - 243
Potentially avoidable emergency department visits a
Ages 18–64, per 1,000 employer-insured enrollees — 2015 — 159 — 130 - 203
Age 65 and older, per 1,000 Medicare beneficiaries 2012 2015 188 197 131 - 248 138 - 251
Admissions for ambulatory care–sensitive conditions a
Ages 18–64, per 1,000 employer-insured enrollees — 2015 — 5 — 3 - 6
Ages 65–74, per 1,000 Medicare beneficiaries 2012 2015 29 26 13 - 51 14 - 45
Age 75 and older, per 1,000 Medicare beneficiaries 2012 2015 70 66 41 - 100 33 - 9330-day hospital readmissions a
Ages 18–64, per 1,000 employer-insured enrollees — 2015 — 2.9 — 1.2 - 5.46
Age 65 and older, per 1,000 Medicare beneficiaries 2012 2015 49 42 * 26 - 65 21 - 55
28 Skilled nursing facility patients with a hospital readmission 2012 2014 20 19 13 - 26 11 - 25
29 Long-stay nursing home residents with a hospital admission 2012 2014 17 16 7 - 30 5 - 28
30 Home health patients with a hospital admission 2013 2016 16 16.4 14 - 18 14 - 18.4
31 Adults with inappropriate lower back imaging — 2015 29 29 16 - 41 16 - 41
32 Total employer-sponsored insurance spending per enrollee 2013 2015 $4,697 $4,736 $3,117 - $7,186 $3,347 - $8,902
33 Total Medicare (Parts A & B) reimbursements per enrollee 2012 2015 $8,854 $9,025 $5,399 - $10,868 $5,586 - $10,851
Healthy Lives34 Mortality amenable to health care, deaths per 100,000 population 2012-13 2014-15 83.7 84.3 55.6 - 136.7 54.7 - 142.4
35 Breast cancer deaths per 100,000 female population 2013 2016 21 20 15.5 - 29.8 13.6 - 23.7
36 Colorectal cancer deaths per 100,000 population 2013 2016 14.6 13.1 * 10.9 - 19.8 10.1 - 17.4
37 Deaths from suicide, alcohol, and drug use per 100,000 population 2013 2016 35.6 43.2 * 25.7 - 61.8 28.5 - 83.1
38 Infant mortality, deaths per 1,000 live births 2012 2015 6.0 5.9 4.2 - 8.9 4.1 - 9.5
39 Adults who report fair/poor health 2013 2016 16 16 10 - 22 10 - 24
40 Adults who smoke 2013 2016 18 16 * 10 - 27 9 - 25
41 Adults who are obese 2013 2016 29 30 22 - 37 22 - 39
42 Children who are overweight or obese — 2016 — 31 — 19 - 38
43 Adults who have lost six or more teeth 2012 2016 10 10 6 - 23 6 - 21
25
26
27
Notes: (a) State rates are averaged across age cohorts for purposes of scoring, but indicators are counted separately for evaluating change over time. (—) Previous data are not shown because of changes in the indicators' definitions or data were not available.
U.S. average rateData years represented Range of state performance
Appendix A2. List of 43 Indicators in the 2018 Scorecard on State Health System PerformanceAPPENDIX A2. List of 43 Indicators in the 2018 Scorecard on State Health System Performance
Notes: (a) State rates are averaged across age cohorts for purposes of scoring, but indicators are counted separately for evaluating change over time. * Denotes a change of at least 0.5 standard deviations. ** Denotes a change of 1.0 standard deviation or more. — Previous data are not shown because of changes in the indicators’ definitions or data were not available.

commonwealthfund.org May 2018
2018 Scorecard on State Health System Performance 27
Indicator Rate Best state(s)a Rate Best state(s)a Rate Best state(s)a Rate Best state(s)a Rate Best state(s)a
Access and Affordability1 Adults ages 19–64 uninsured 4 MA 6 IA, MN 4 MA 5 DC 5 HI
2 Children ages 0–18 uninsured 1 MA 2 IA 1 MA 2 WV 2 HI
3 Adults without a usual source of care 11 MA 15 MI 11 MA 15 MD 15 HI
4 Adults who went without care because of cost 7 HI 8 IA, ND 8 VT 9 DC 7 HI
5 Individuals with high out-of-pocket medical spending 9 DC, RI 10 MN 9 RI 9 DC 11 HI
6 Employee insurance costs as a share of median income 4 HI, MI 4 MI 5CT, MA, NH, NJ,
NY, PA, VT5 DC, MD 4 HI
7 Adults without a dental visit in past year 10 CT 12 IA, MN, WI 10 CT 14 DC, DE, VA 12 HI
Prevention and Treatment8 Adults without all age- and gender-appropriate cancer screenings 24 CT 28 WI 24 CT 25 DC 26 HI
9 Adults without all age-appropriate recommended vaccines 54 SD 54 SD 56 RI 58 MD, NC, WV 59 CO
10 Diabetic adults ages 18–64 without a hemoglobin A1c test 11 MN 11 MN 16 MA 13 NC, TN 13 WA
11 Medicare beneficiaries received a high-risk drug 7 MN 7 MN 9 MA, NY, RI, VT 11 DE 9 HI
12 Children without all components of a medical home 40 VT 42 IA 40 VT 42 MD 43 UT
13 Children without both a medical and dental preventive care visit 20 VT 28 IL 20 VT 25 SC 27 WA
14 Children who did not receive needed mental health treatment 5 NH 7 IA, MI 5 NH 9 DE 7 WY
15 Children ages 19–35 months without all recommended vaccines 15 MA 19 NE 15 MA 22 DE, NC 24 CO, WA
16 Hospital 30-day mortality 13 DE, MA 13.6 OH 13 MA 13 DE 13.7 CA
17 Central line-associated bloodstream infection (CLABSI) 0.32 HI 0.65 SD 0.75 MA 0.74 WV 0.32 HI
18 Hospital patients discharged without instructions 9 VT 10 NE, WI 9 VT 12 NC, SC, VA 10 ID, UT
19 Hospital patients who did not receive patient-centered care 27 LA, SD 27 SD 29 ME 27 LA 29 ID, MT, WY
20 Home health patients without improved mobility 23 MS 28 MO, ND 27 PA 23 MS 25 UT
21 Nursing home residents with an antipsychotic medication 8 HI 13 MI, WI 12 NJ 12 DC 8 HI
22 Adults with any mental illness reporting unmet need 14 HI 19 NE, WI 16 MA 17 DE, TX 14 HI
23 Adults with any mental illness who did not receive treatment 41 ME 44 MN 41 ME 50 NC 48 MT
Avoidable Hospital Use and Cost24 Hospital admissions for pediatric asthma, per 100,000 children 22 VT 61 ND 22 VT 74 TN 48 OR
Potentially avoidable emergency department visits a
Ages 18–64, per 1,000 employer-insured enrollees 130 CA 139 MN 142 MA 148 MD 130 CA
Age 65 and older, per 1,000 Medicare beneficiaries 138 HI 155 SD 174 VT 179 DE 138 HI
Admissions for ambulatory care–sensitive conditions a
Ages 18–64, per 1,000 employer-insured enrollees 3 WA 4IA, MN, ND, SD,
WI4
CT, MA, ME, NH, RI, VT
4 NC 3 WA
Ages 65–74, per 1,000 Medicare beneficiaries 14 CO, UT 19 MN 20 VT 23 VA 14 CO, UTAge 75 and older, per 1,000 Medicare beneficiaries 33 HI 52 MN 58 VT 62 SC, VA 33 HI
30-day hospital readmissions a
Ages 18–64, per 1,000 employer-insured enrollees 1.2 AL 2.68 IA 2.14 ME 1.2 AL 1.37 UT
Age 65 and older, per 1,000 Medicare beneficiaries 21 HI 31 SD 32 VT 37 SC 21 HI
28 Skilled nursing facility patients with a hospital readmission 11 AK 14 ND, SD 15 VT 18 NC 11 AK
29 Nursing home residents with a hospital admission 5 HI 7 MN 9 RI 16 DE, MD, NC 5 HI
30 Home health patients with a hospital admission 14 UT 16.2 WI 16.3 RI 15.9 FL, TX 14 UT
31 Adults with inappropriate lower back imaging 16 ND 16 ND 23 ME, VT 28 DE 20 OR
32 Total employer-sponsored insurance spending per enrollee $3,347 MS $3,818 MI $4,333 RI $3,347 MS $3,667 HI
33 Total Medicare (Parts A & B) reimbursements per enrollee $5,586 HI $7,682 SD $7,231 VT $8,172 VA $5,586 HI
Healthy Lives34 Mortality amenable to health care, deaths per 100,000 population 54.7 MN 54.7 MN 57.7 NH 80.2 VA 60.7 UT
35 Breast cancer deaths per 100,000 female population 13.6 VT 17 MN 14 VT 19 FL 15 HI
36 Colorectal cancer deaths per 100,000 population 10.1 UT 11.9 MN 10.4 CT 12.4 NC 10.1 UT
37 Deaths from suicide, alcohol, and drug use per 100,000 population 28.5 NE 28.5 NE 32.8 NY 35.1 GA 31.2 HI
38 Infant mortality, deaths per 1,000 live births 4.1 NH 4.2 IA 4.1 NH 5.7 TX 4.4 CA
39 Adults who report fair/poor health 10 DC 11 MN, SD 12 VT 10 DC 11 UT
40 Adults who smoke 9 UT 15 MN 13 CT 14 MD, TX 9 UT
41 Adults who are obese 22 DC 28 MN 23 MA 22 DC 23 CO
42 Children who are overweight or obese 19 UT 27 IL 22 VT 27 VA 19 UT
43 Adults who have lost six or more teeth 6 CA, DC, HI, UT 7 MN, NE 7 CT 6 DC 6 CA, HI, UT
Appendix A3. National and Regional Performance Benchmarks
25
26
27
Note: (a) State rates are averaged across age cohorts for purposes of scoring, but indicators are counted separately for evaluating change over time.
National Midwest WestNortheast South
APPENDIX A3. National and Regional Performance Benchmarks
Note: (a) State rates are averaged across age cohorts for purposes of scoring, but indicators are counted separately for evaluating change over time.

commonwealthfund.org May 2018
2018 Scorecard on State Health System Performance 28
• Improveda • No Changeb • Worseneda
Access and Affordability 0Adults ages 19–64 uninsured
Adults who went without care because of costChildren ages 0–18 uninsured
Individuals with high out-of-pocket medical spendingAdults without a usual source of care
Adults without a dental visit in past yearEmployee health insurance contributions as a share of median income
Prevention and TreatmentHome health patients who did not get better at walking or moving around
Nursing home residents with an antipsychotic medicationMedicare beneficiaries received a high-risk drug
Adults with any mental illness who did not receive treatmentHospital patients discharged without instructions for home recovery
Children ages 19–35 months without all recommended vaccinesAdults with any mental illness reporting unmet need
Adults without all age-appropriate recommended vaccinesHospital patients who did not receive patient-centered care
Adults without all age- and gender-appropriate cancer screeningsHospital 30-day mortality
Avoidable Hospital Use and Cost30-day readmissions, Medicare, age 65+
Skilled nursing facility patients with a hospital readmissionPreventable hospitalizations, Medicare, ages 65–74
Preventable hospitalizations, Medicare, age 75+Hospital admissions for pediatric asthma
Nursing home residents with a hospital admissionAvoidable emergency department visits, Medicare, age 65+
Home health patients with a hospital admissionEmployer-sponsored insurance spending per enrollee
Medicare spending per beneficiaryHealthy Lives
Colorectal cancer deaths per 100,000 populationAdults who smoke
Breast cancer deaths per 100,000 female populationAdults who have lost six or more teeth
Infant mortality, deaths per 1,000 live birthsAdults who report fair/poor health
Adults who are obeseMortality amenable to health care, deaths per 100,000 population
Deaths from suicide, alcohol, and drug use per 100,000 population
Appendix A4. Change in State Health System Performance by Indicator
Indicator (arranged by number of states with improvement within dimension)
Number of states that:
Notes: Only Scorecard indicators with trends are shown. Trend data generally reflect the two- to three-year period ending in 2015 or 2016; refer to Appendix A1 for additional detail (trend data were not available for all indicators). For purposes of this analysis we count the District of Columbia as a state. (a) Improvement or worsening refers to a change between the baseline and current time periods of at least 0.5 standard deviations. (b) Includes the number of states with no change or without sufficient data for this subpopulation to assess change over time.
47
37
33
26
11
7
6
51
49
46
28
27
21
19
7
4
2
23
20
12
10
6
5
4
3
2
39
32
16
8
6
4
1
4
14
17
23
39
35
28
2
5
17
24
16
17
37
46
41
1
28
31
39
41
44
45
32
19
43
49
10
18
30
42
38
40
32
51
18
1
2
1
9
17
6
14
15
7
1
8
50
1
1
15
29
6
2
2
1
5
1
7
7
18
33
APPENDIX A4. Change in State Health System Performance by Indicator
Notes: Only Scorecard indicators with trends are shown. Trend data generally reflect the two- to three-year period ending in 2015 or 2016; refer to Appendix A1 for additional detail (trend data were not available for all indicators). For purposes of this analysis we count the District of Columbia as a state. (a) Improvement or worsening refers to a change between the baseline and current time periods of at least 0.5 standard deviations. (b) Includes the number of states with no change or without sufficient data for this subpopulation to assess change over time.

commonwealthfund.org May 2018
2018 Scorecard on State Health System Performance 29
Indicator
Insured adults 15,435,831 more adults (ages 19–64) would be covered by health insurance (public or private), and therefore would be more likely to receive health care when needed.
Insured children 3,126,010 more children (ages 0–18) would be covered by health insurance (public or private), and therefore would be more likely to receive health care when needed.
Went without care because of cost 14,779,499 fewer adults (age 18 and older) would go without needed health care because of cost.
High out-of-pocket medical spending 13,554,907 fewer individuals would be burdened by high out-of-pocket spending on medical care.
Adult usual source of care 26,451,243 more adults (age 18 and older) would have a usual source of care to help ensure that care is coordinated and accessible when needed.
Adult cancer screening 11,063,985 more adults would receive age- and gender-appropriate recommended cancer screenings, including tests for colon, breast, and cervical cancers.
Adult vaccines 24,308,576 more adults would receive age- appropriate recommended vaccines.
Children with a medical home 8,470,792 more children (ages 0–17) would have a medical home to help ensure that care is coordinated and accessible when needed.
Children vaccines 837,144 more children (ages 19–35 months) would receive all recommended vaccines.
Children with preventive medical and dental visits
9,332,953 more children (ages 0–17) would receive annual preventive medical and dental care visits each year.
Medicare received a high-risk drug 1,066,097 fewer Medicare beneficiaries would receive an inappropriately prescribed medication.
Preventable hospital admissions among children
62,199 fewer children (ages 2–17) would be hospitalized for asthma exacerbations.
Hospital readmissions 440,000 fewer hospital readmissions would occur.a
Potentially avoidable emergency department visits
5.7 millionfewer emergency department visits for nonemergent or primary care–treatable conditions would occur.a
Mortality amenable to health care 89,462 fewer premature deaths (before age 75) might occur from causes that are potentially treatable or preventable with timely and appropriate health care.
Breast cancer deaths 10,623 fewer women would die from breast cancer.
Colon cancer deaths 9,611 fewer individuals would die from colon cancer.
Deaths of despair 47,095 fewer deaths from alcohol, suicide, alcohol, and drug use.
Infant mortality 7,161 more infants would live to see their first birthday.
Adults who smoke 17,242,749 fewer adults would smoke, reducing their risk of lung and heart disease.
Adults who are obese 15,764,091 fewer adults would be obese, with body weights that increase their risk for disease and long-term complications.
Children who are overweight or obese 4,049,354 fewer children (ages 10–17) would be overweight or obese, thus reducing the potential for poor health as they transition into adulthood.
Adults with tooth loss 7,882,045 fewer adults (ages 18–64) would have lost six or more teeth to decay, infection, or gum disease.
* Performance benchmarks set at the level achieved by the top-performing state with available data for this indicator.(a) Estimate based on working-age population ages 18–64 with employer-sponsored insurance and Medicare beneficiaries age 65 and older.
Appendix A5. National Cumulative Impact if All States Achieved Top State Rate
If all states improved their performance to the level of the best-performing state* for this indicator, then:
APPENDIX A5. National Cumulative Impact if All States Achieved Top State Rate
* Performance benchmarks set at the level achieved by the top-performing state with available data for this indicator. (a) Estimate based on working-age population ages 18–64 with employer-sponsored insurance and Medicare beneficiaries age 65 and older.

commonwealthfund.org May 2018
2018 Scorecard on State Health System Performance 30
Appendix B1. State Scorecard Summary of Health System Performance Across Dimensions
Access and
Afford
ability
Preventio
n and
Treatm
ent
Avoidable H
ospital
Use and Cost
Healthy Lives
Disparity
Access and
Afford
ability
Preventio
n and
Treatm
ent
Avoidable H
ospital
Use and Cost
Healthy Lives
Disparity
Current Ranking Baseline Ranking
1 Hawaii 1 1 1 1 1 1 Hawaii 1 2 1 1 1
2 Massachusetts 1 1 3 1 1 2 Massachusetts 1 1 3 1 1
3 Minnesota 1 1 1 1 1 3 Minnesota 1 1 1 1 1
4 Vermont 1 1 2 1 2 4 Vermont 1 1 2 1 1
5 Utah 3 2 1 1 1 5 Utah 3 2 1 1 1
6 Iowa 1 1 2 1 2 6 New Hampshire 1 1 1 2 2
7 Washington 2 2 1 1 1 7 Iowa 1 3 1 1 3
8 Wisconsin 1 1 2 2 1 8 Maine 1 1 2 2 2
9 Connecticut 1 2 3 1 2 9 Connecticut 1 2 3 1 1
10 Colorado 3 2 1 1 2 10 Colorado 3 2 1 1 2
11 New Hampshire 1 1 2 2 3 10 South Dakota 2 1 2 1 3
11 Oregon 2 3 1 2 2 12 Wisconsin 1 3 1 1 3
11 Rhode Island 1 1 3 2 2 13 Washington 2 1 2 2 2
14 California 2 4 1 1 2 14 Nebraska 2 4 2 1 2
15 Idaho 4 2 1 1 1 14 North Dakota 2 2 1 2 2
16 Maine 2 1 2 3 2 16 Rhode Island 2 1 2 2 1
16 South Dakota 2 1 1 3 1 17 Maryland 1 1 1 3 1
18 Montana 3 2 1 2 2 18 Delaware 2 3 1 2 2
18 New York 2 3 4 1 1 19 Idaho 3 3 4 2 1
20 Maryland 1 2 3 3 3 20 Pennsylvania 1 1 3 2 2
21 Nebraska 2 2 2 2 3 21 Montana 4 2 2 1 3
22 Delaware 2 1 2 3 3 21 Oregon 3 1 2 3 1
22 North Dakota 2 2 1 3 3 23 California 3 2 1 3 2
24 Pennsylvania 2 1 3 3 1 24 New York 2 1 3 3 1
25 New Jersey 2 3 3 2 2 25 Wyoming 3 3 3 2 3
26 Illinois 2 3 3 2 1 26 Virginia 2 3 3 3 2
27 Michigan 1 2 4 3 3 27 Kansas 2 2 3 4 3
28 Virginia 3 2 2 2 4 27 New Jersey 2 2 3 2 4
29 Arizona 4 4 2 2 2 29 Illinois 2 4 2 2 3
30 District of Columbia 1 3 4 3 3 29 Michigan 2 3 4 3 2
31 New Mexico 4 4 2 3 1 31 New Mexico 4 4 1 3 1
32 Kansas 3 3 3 2 4 32 Alaska 3 2 3 2 3
33 Wyoming 4 3 2 2 3 33 District of Columbia 1 2 2 2 2
34 Alaska 4 4 1 3 3 34 Arizona 4 4 2 3 2
35 North Carolina 3 2 2 3 4 34 Ohio 2 2 2 3 4
36 Ohio 2 2 4 4 4 36 North Carolina 3 3 4 4 4
37 Indiana 3 3 3 4 3 37 South Carolina 3 3 4 4 4
38 South Carolina 4 3 2 4 3 38 Missouri 3 3 2 4 4
39 Nevada 4 4 3 3 2 39 Indiana 3 4 3 3 2
40 Georgia 4 4 3 4 4 40 Alabama 3 4 3 3 4
40 Tennessee 3 3 3 4 4 41 Georgia 4 2 3 4 4
42 Kentucky 3 3 4 4 4 42 Texas 4 3 4 4 4
43 Alabama 3 3 4 4 3 43 Florida 4 3 4 4 4
44 Missouri 3 4 4 4 4 43 Nevada 4 4 4 4 4
44 Texas 4 4 4 2 4 45 Tennessee 4 4 4 3 3
46 Arkansas 3 4 3 4 4 46 Kentucky 3 4 3 4 3
46 West Virginia 3 3 4 4 3 47 West Virginia 3 3 4 4 3
48 Florida 4 4 4 3 4 48 Arkansas 4 4 4 3 4
49 Louisiana 4 4 4 4 2 48 Oklahoma 4 4 4 4 3
50 Oklahoma 4 4 4 4 4 50 Louisiana 4 4 4 4 4
51 Mississippi 4 4 4 4 4 51 Mississippi 4 4 4 4 3
APPENDIX B1. State Scorecard Summary of Health System Performance Across Dimensions
Overall performanceTop quartileSecond quartileThird quartileBottom quartileData not available

commonwealthfund.org May 2018
2018 Scorecard on State Health System Performance 31
Hawaii*IdahoIllinois*Indiana*Iowa*KansasKentucky*LouisianaMaineMaryland*Massachusetts*Michigan*Minnesota*MississippiMissouriMontana*NebraskaNevada*New Hampshire*New Jersey*New Mexico*New York*North CarolinaNorth Dakota*Ohio*OklahomaOregon*Pennsylvania*Rhode Island*South CarolinaSouth DakotaTennesseeTexasUtahVermont*VirginiaWashington*West Virginia*WisconsinWyoming
StateOverall ranking
Access and Affordability
Prevention and Treatment
Avoidable Hospital Use
and CostHealthy
Lives Disparity
Overall ranking in the baseline
time perioda
Alabama 43 38 34 42 44 34 40Alaska* 34 39 48 10 30 33 32Arizona* 29 42 39 17 17 13 34Arkansas* 46 35 43 38 49 39 48California* 14 23 40 11 5 22 23Colorado* 10 26 17 7 9 21 10Connecticut* 9 5 14 32 6 14 9Delaware* 22 16 6 22 36 27 18District of Columbia* 30 8 38 43 38 28 33Florida 48 49 49 49 31 49 43Georgia 40 46 41 31 40 47 41Hawaii* 1 1 9 1 2 1 1Idaho 15 39 24 5 11 5 19Illinois* 26 21 26 34 23 8 29Indiana* 37 28 35 37 41 38 39Iowa* 6 6 4 14 12 19 7Kansas 32 27 30 30 25 44 27Kentucky* 42 30 30 47 48 41 46Louisiana 49 47 47 50 47 19 50Maine 16 17 5 19 32 18 8Maryland* 20 10 13 26 27 31 17Massachusetts* 2 2 1 29 3 2 2Michigan* 27 12 15 39 37 32 29Minnesota* 3 9 2 8 4 7 3Mississippi 51 50 50 51 50 43 51Missouri 44 34 44 44 39 51 38Montana* 18 33 22 6 15 25 21Nebraska 21 22 19 16 16 35 14Nevada* 39 45 51 28 35 17 43New Hampshire* 11 7 7 21 14 35 6New Jersey* 25 14 26 36 19 24 27New Mexico* 31 44 42 15 29 8 31New York* 18 13 29 46 10 4 24North Carolina 35 37 16 24 33 44 36North Dakota* 22 24 23 9 27 26 14Ohio* 36 18 19 39 43 47 34Oklahoma 50 48 44 45 46 50 48Oregon* 11 19 36 4 13 15 21Pennsylvania* 24 15 12 33 34 11 20Rhode Island* 11 4 11 27 18 22 16South Carolina 38 41 32 23 42 35 37South Dakota 16 25 10 12 26 12 10Tennessee 40 36 33 35 44 42 45Texas 44 51 46 39 24 40 42Utah 5 32 21 2 1 3 5Vermont* 4 3 8 13 6 15 4Virginia 28 29 18 25 19 44 26Washington* 7 20 25 3 8 6 13West Virginia* 46 31 28 48 51 29 47Wisconsin 8 11 3 18 21 10 12Wyoming 33 42 36 20 22 29 25
2018 Scorecard rankings
Appendix B2. Summary of State Rankings in 2018 Scorecard
Notes: (*) Indicates state implemented Medicaid expansion under the Affordable Care Act as of January 1, 2016. Louisiana subsequently implemented Medicaid expansion, in July 2016. (a) The baseline period generally reflects two to three years prior to the time of observation for the latest year of data available. This is not the same ranking as reported in our 2017 State Scorecard and should not be compared to the 2017 ranking because of changes in the underlying set of performance indicators evaluated in the two reports.
APPENDIX B2. Summary of State Rankings in 2018 Scorecard
Notes: * Indicates state implemented Medicaid expansion under the Affordable Care Act as of January 1, 2016. Louisiana subsequently implemented Medicaid expansion, in July 2016. (a) The baseline period generally reflects two to three years prior to the time of observation for the latest year of data available. This is not the same ranking as reported in our 2017 State Scorecard and should not be compared to the 2017 ranking because of changes in the underlying set of performance indicators evaluated in the two reports.

commonwealthfund.org May 2018
2018 Scorecard on State Health System Performance 32
Overall ranking State
No. of indicators scored(of 43) Top 5 states Top quartile 2nd quartile 3rd quartile
Botto Bottom 5 states
No. of indicators with trend
(of 37)No. of indicators
improvedNo. of indicators
worsened Net change43 Alabama 42 3 7 6 13 12 36 10 7 334 Alaska* 42 5 12 9 7 8 33 9 6 329 Arizona* 43 2 7 15 12 3 37 15 3 1246 Arkansas* 43 2 3 8 13 13 37 17 6 1114 California* 43 9 16 11 9 5 37 15 2 1310 Colorado* 43 8 18 15 8 1 37 10 4 69 Connecticut* 43 10 21 10 5 2 37 12 5 7
22 Delaware* 42 3 10 17 13 2 36 13 9 430 District of Columbia* 38 9 13 5 9 10 30 11 5 648 Florida 43 0 5 5 11 13 37 11 5 640 Georgia 43 0 5 4 19 8 37 10 4 61 Hawaii* 43 23 31 7 2 2 34 13 5 8
15 Idaho 42 6 18 7 11 4 36 13 5 826 Illinois* 43 1 6 14 19 1 37 14 4 1037 Indiana* 43 1 2 9 23 1 37 14 4 106 Iowa* 43 13 22 18 1 1 37 11 4 7
32 Kansas 43 1 4 18 15 3 37 12 6 642 Kentucky* 43 2 8 5 12 11 37 15 5 1049 Louisiana 43 1 2 6 11 17 37 17 6 1116 Maine 42 3 16 13 10 0 36 7 5 220 Maryland* 43 7 17 11 11 1 37 12 5 72 Massachusetts* 42 20 26 9 6 0 36 9 5 4
27 Michigan* 43 4 9 11 18 1 37 14 3 113 Minnesota* 43 16 31 5 4 0 37 9 4 5
51 Mississippi 42 2 5 1 4 25 36 14 7 744 Missouri 43 0 2 6 23 5 37 11 6 518 Montana* 43 4 16 12 10 6 36 13 2 1121 Nebraska 43 8 16 14 10 3 37 6 8 -239 Nevada* 43 0 1 11 11 12 37 10 3 711 New Hampshire* 42 12 21 12 4 2 36 8 5 325 New Jersey* 43 6 14 7 13 4 37 16 5 1131 New Mexico* 43 1 6 14 11 8 36 13 7 618 New York* 43 7 11 17 9 5 37 18 5 1335 North Carolina 43 2 8 15 12 2 37 11 5 622 North Dakota* 43 7 15 14 8 4 36 10 8 236 Ohio* 42 1 5 16 12 2 36 12 3 950 Oklahoma 43 0 2 6 12 12 37 17 5 1211 Oregon* 43 7 17 15 5 4 37 12 6 624 Pennsylvania* 43 1 11 15 12 1 36 11 3 811 Rhode Island* 42 10 20 8 9 2 36 10 5 538 South Carolina 40 0 3 12 16 5 36 12 7 516 South Dakota 43 10 14 14 9 1 36 10 5 540 Tennessee 43 1 5 9 13 6 37 14 5 944 Texas 43 3 6 6 13 10 37 11 5 65 Utah 42 15 20 8 11 1 36 8 4 44 Vermont* 42 15 24 9 4 1 35 10 6 4
28 Virginia 43 0 5 21 14 0 37 11 7 47 Washington* 43 8 21 14 4 1 37 14 5 9
46 West Virginia* 43 3 5 8 11 11 37 17 7 108 Wisconsin 43 7 19 17 6 1 37 13 2 11
33 Wyoming 43 4 10 15 6 10 35 7 6 1
Notes: (*) Indicates state implemented Medicaid expansion under the Affordable Care Act as of January 1, 2016. Louisiana subsequently implemented Medicaid expansion, in July 2016. Improvement or worsening refers to a change between the baseline and current time periods of at least 0.5 standard deviations.
Appendix B3. Summary of Indicator Rankings by StateAPPENDIX B3. Summary of Indicator Rankings by State
Notes: * Indicates state implemented Medicaid expansion under the Affordable Care Act as of January 1, 2016. Louisiana subsequently implemented Medicaid expansion, in July 2016. (a) The baseline period generally reflects two to three years prior to the time of observation for the latest year of data available. This is not the same ranking as reported in our 2017 State Scorecard and should not be compared to the 2017 ranking because of changes in the underlying set of performance indicators evaluated in the two reports.
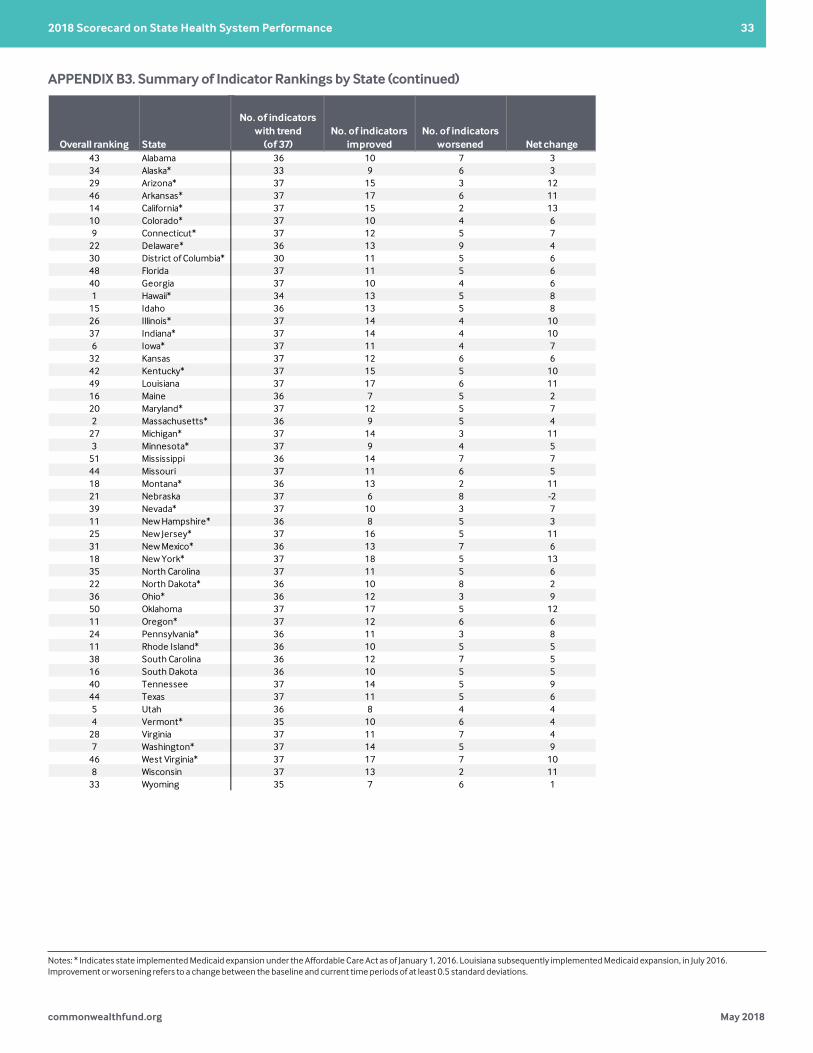
commonwealthfund.org May 2018
2018 Scorecard on State Health System Performance 33
Overall ranking State
No. of indicators scored(of 43) Top 5 states Top quartile 2nd quartile 3rd quartile
Botto Bottom 5 states
No. of indicators with trend
(of 37)No. of indicators
improvedNo. of indicators
worsened Net change43 Alabama 42 3 7 6 13 12 36 10 7 334 Alaska* 42 5 12 9 7 8 33 9 6 329 Arizona* 43 2 7 15 12 3 37 15 3 1246 Arkansas* 43 2 3 8 13 13 37 17 6 1114 California* 43 9 16 11 9 5 37 15 2 1310 Colorado* 43 8 18 15 8 1 37 10 4 69 Connecticut* 43 10 21 10 5 2 37 12 5 7
22 Delaware* 42 3 10 17 13 2 36 13 9 430 District of Columbia* 38 9 13 5 9 10 30 11 5 648 Florida 43 0 5 5 11 13 37 11 5 640 Georgia 43 0 5 4 19 8 37 10 4 61 Hawaii* 43 23 31 7 2 2 34 13 5 8
15 Idaho 42 6 18 7 11 4 36 13 5 826 Illinois* 43 1 6 14 19 1 37 14 4 1037 Indiana* 43 1 2 9 23 1 37 14 4 106 Iowa* 43 13 22 18 1 1 37 11 4 7
32 Kansas 43 1 4 18 15 3 37 12 6 642 Kentucky* 43 2 8 5 12 11 37 15 5 1049 Louisiana 43 1 2 6 11 17 37 17 6 1116 Maine 42 3 16 13 10 0 36 7 5 220 Maryland* 43 7 17 11 11 1 37 12 5 72 Massachusetts* 42 20 26 9 6 0 36 9 5 4
27 Michigan* 43 4 9 11 18 1 37 14 3 113 Minnesota* 43 16 31 5 4 0 37 9 4 5
51 Mississippi 42 2 5 1 4 25 36 14 7 744 Missouri 43 0 2 6 23 5 37 11 6 518 Montana* 43 4 16 12 10 6 36 13 2 1121 Nebraska 43 8 16 14 10 3 37 6 8 -239 Nevada* 43 0 1 11 11 12 37 10 3 711 New Hampshire* 42 12 21 12 4 2 36 8 5 325 New Jersey* 43 6 14 7 13 4 37 16 5 1131 New Mexico* 43 1 6 14 11 8 36 13 7 618 New York* 43 7 11 17 9 5 37 18 5 1335 North Carolina 43 2 8 15 12 2 37 11 5 622 North Dakota* 43 7 15 14 8 4 36 10 8 236 Ohio* 42 1 5 16 12 2 36 12 3 950 Oklahoma 43 0 2 6 12 12 37 17 5 1211 Oregon* 43 7 17 15 5 4 37 12 6 624 Pennsylvania* 43 1 11 15 12 1 36 11 3 811 Rhode Island* 42 10 20 8 9 2 36 10 5 538 South Carolina 40 0 3 12 16 5 36 12 7 516 South Dakota 43 10 14 14 9 1 36 10 5 540 Tennessee 43 1 5 9 13 6 37 14 5 944 Texas 43 3 6 6 13 10 37 11 5 65 Utah 42 15 20 8 11 1 36 8 4 44 Vermont* 42 15 24 9 4 1 35 10 6 4
28 Virginia 43 0 5 21 14 0 37 11 7 47 Washington* 43 8 21 14 4 1 37 14 5 9
46 West Virginia* 43 3 5 8 11 11 37 17 7 108 Wisconsin 43 7 19 17 6 1 37 13 2 11
33 Wyoming 43 4 10 15 6 10 35 7 6 1
Notes: (*) Indicates state implemented Medicaid expansion under the Affordable Care Act as of January 1, 2016. Louisiana subsequently implemented Medicaid expansion, in July 2016. Improvement or worsening refers to a change between the baseline and current time periods of at least 0.5 standard deviations.
Appendix B3. Summary of Indicator Rankings by State
Overall ranking State
No. of indicators scored(of 43) Top 5 states Top quartile 2nd quartile 3rd quartile
Botto Bottom 5 states
No. of indicators with trend
(of 37)No. of indicators
improvedNo. of indicators
worsened Net change43 Alabama 42 3 7 6 13 12 36 10 7 334 Alaska* 42 5 12 9 7 8 33 9 6 329 Arizona* 43 2 7 15 12 3 37 15 3 1246 Arkansas* 43 2 3 8 13 13 37 17 6 1114 California* 43 9 16 11 9 5 37 15 2 1310 Colorado* 43 8 18 15 8 1 37 10 4 69 Connecticut* 43 10 21 10 5 2 37 12 5 7
22 Delaware* 42 3 10 17 13 2 36 13 9 430 District of Columbia* 38 9 13 5 9 10 30 11 5 648 Florida 43 0 5 5 11 13 37 11 5 640 Georgia 43 0 5 4 19 8 37 10 4 61 Hawaii* 43 23 31 7 2 2 34 13 5 8
15 Idaho 42 6 18 7 11 4 36 13 5 826 Illinois* 43 1 6 14 19 1 37 14 4 1037 Indiana* 43 1 2 9 23 1 37 14 4 106 Iowa* 43 13 22 18 1 1 37 11 4 7
32 Kansas 43 1 4 18 15 3 37 12 6 642 Kentucky* 43 2 8 5 12 11 37 15 5 1049 Louisiana 43 1 2 6 11 17 37 17 6 1116 Maine 42 3 16 13 10 0 36 7 5 220 Maryland* 43 7 17 11 11 1 37 12 5 72 Massachusetts* 42 20 26 9 6 0 36 9 5 4
27 Michigan* 43 4 9 11 18 1 37 14 3 113 Minnesota* 43 16 31 5 4 0 37 9 4 5
51 Mississippi 42 2 5 1 4 25 36 14 7 744 Missouri 43 0 2 6 23 5 37 11 6 518 Montana* 43 4 16 12 10 6 36 13 2 1121 Nebraska 43 8 16 14 10 3 37 6 8 -239 Nevada* 43 0 1 11 11 12 37 10 3 711 New Hampshire* 42 12 21 12 4 2 36 8 5 325 New Jersey* 43 6 14 7 13 4 37 16 5 1131 New Mexico* 43 1 6 14 11 8 36 13 7 618 New York* 43 7 11 17 9 5 37 18 5 1335 North Carolina 43 2 8 15 12 2 37 11 5 622 North Dakota* 43 7 15 14 8 4 36 10 8 236 Ohio* 42 1 5 16 12 2 36 12 3 950 Oklahoma 43 0 2 6 12 12 37 17 5 1211 Oregon* 43 7 17 15 5 4 37 12 6 624 Pennsylvania* 43 1 11 15 12 1 36 11 3 811 Rhode Island* 42 10 20 8 9 2 36 10 5 538 South Carolina 40 0 3 12 16 5 36 12 7 516 South Dakota 43 10 14 14 9 1 36 10 5 540 Tennessee 43 1 5 9 13 6 37 14 5 944 Texas 43 3 6 6 13 10 37 11 5 65 Utah 42 15 20 8 11 1 36 8 4 44 Vermont* 42 15 24 9 4 1 35 10 6 4
28 Virginia 43 0 5 21 14 0 37 11 7 47 Washington* 43 8 21 14 4 1 37 14 5 9
46 West Virginia* 43 3 5 8 11 11 37 17 7 108 Wisconsin 43 7 19 17 6 1 37 13 2 11
33 Wyoming 43 4 10 15 6 10 35 7 6 1
Notes: (*) Indicates state implemented Medicaid expansion under the Affordable Care Act as of January 1, 2016. Louisiana subsequently implemented Medicaid expansion, in July 2016. Improvement or worsening refers to a change between the baseline and current time periods of at least 0.5 standard deviations.
Appendix B3. Summary of Indicator Rankings by StateAPPENDIX B3. Summary of Indicator Rankings by State (continued)
Notes: * Indicates state implemented Medicaid expansion under the Affordable Care Act as of January 1, 2016. Louisiana subsequently implemented Medicaid expansion, in July 2016. Improvement or worsening refers to a change between the baseline and current time periods of at least 0.5 standard deviations.

commonwealthfund.org May 2018
2018 Scorecard on State Health System Performance 34
Appendix C1. Access & Affordability: Dimension and Indicator Ranking
Uninsure
d adults
Uninsure
d childre
n
Adults w
ithout a
usual sourc
e of care
Went with
out care
because of cost
High out-of-p
ocket
medical s
pending
Emplo
yee
insura
nce costs
Adults w
ithout a
dental v
isit
1 Hawaii 1 1 1 1 1 1 1
2 Massachusetts 1 1 1 1 1 1 1
3 Vermont 1 0 1 1 1 1 1
4 Rhode Island 1 0 1 1 1 2 1
5 Connecticut 1 1 1 1 1 1 1
6 Iowa 1 1 1 1 2 1 1
7 New Hampshire 2 1 1 1 1 1 1
8 District of Columbia 1 0 3 1 1 1 2
9 Minnesota 1 1 4 1 1 1 1
10 Maryland 1 1 1 2 1 1 2
11 Wisconsin 1 1 1 1 3 1 1
12 Michigan 1 1 1 3 2 1 2
13 New York 2 1 1 2 1 1 2
14 New Jersey 2 1 2 3 1 1 1
15 Pennsylvania 1 3 1 2 1 1 2
16 Delaware 1 2 1 2 1 2 2
17 Maine 2 3 1 2 2 2 1
18 Ohio 1 2 1 2 2 1 2
19 Oregon 2 1 2 2 3 1 2
20 Washington 2 1 3 1 2 2 2
21 Illinois 2 1 2 2 2 2 3
22 Nebraska 3 3 2 2 2 1 2
23 California 2 1 3 2 1 2 3
24 North Dakota 2 4 3 1 2 1 2
25 South Dakota 3 3 3 1 3 2 1
26 Colorado 2 2 3 2 2 1 3
27 Kansas 3 3 3 2 2 2 2
28 Indiana 2 3 2 3 3 1 3
29 Virginia 3 3 2 3 2 2 2
30 Kentucky 1 1 2 2 3 3 4
31 West Virginia 1 1 2 4 4 2 3
32 Utah 3 3 4 2 4 1 2
33 Montana 3 3 3 2 4 3 2
34 Missouri 3 3 2 3 3 3 3
35 Arkansas 3 2 2 4 4 3 3
36 Tennessee 3 2 2 2 4 3 4
37 North Carolina 4 3 2 4 4 2 2
38 Alabama 3 1 2 4 4 3 3
39 Alaska 4 4 4 3 1 1 2
39 Idaho 4 3 4 3 3 3 3
41 South Carolina 4 2 2 4 4 3 4
42 Arizona 3 4 4 3 3 3 3
42 Wyoming 4 4 4 3 4 2 2
44 New Mexico 3 3 4 3 2 4 4
45 Nevada 4 3 4 4 2 3 4
46 Georgia 4 4 4 4 2 3 3
47 Louisiana 4 2 3 4 3 4 4
48 Oklahoma 4 4 3 4 3 3 4
49 Florida 4 4 4 4 3 4 3
50 Mississippi 4 3 3 4 4 4 4
51 Texas 4 4 4 4 2 3 4
APPENDIX C1. Access & Affordability: Dimension and Indicator Ranking
Overall performanceTop quartileSecond quartileThird quartileBottom quartileData not available
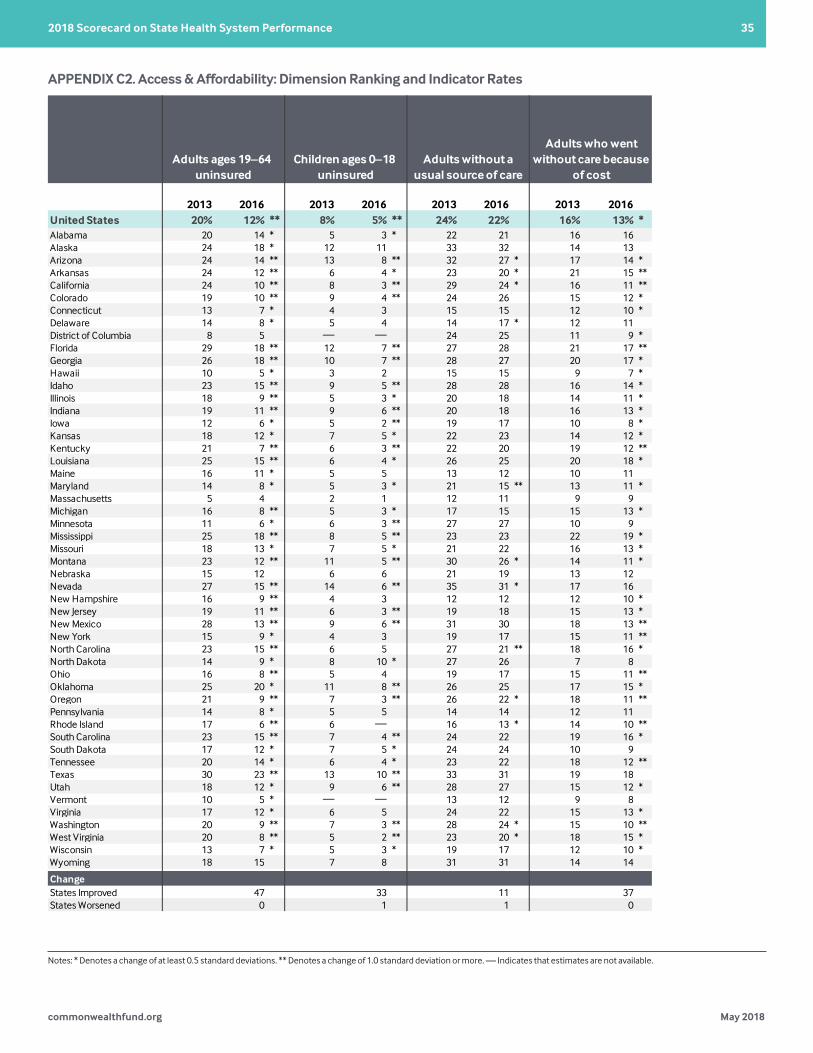
commonwealthfund.org May 2018
2018 Scorecard on State Health System Performance 35
Appendix C2. Access & Affordability: Dimension Ranking and Indicator Rates
2013 2016 2013 2016 2013 2016 2013 2016 2013-14 2015-16 2013 2016 2012 2016United States 20% 12% ** 8% 5% ** 24% 22% 16% 13% * 15% 14% 6% 6% 15% 16%Alabama 20 14 * 5 3 * 22 21 16 16 16 19 ** 6 7 * 18 16 *Alaska 24 18 * 12 11 33 32 14 13 18 12 ** 5 5 14 15Arizona 24 14 ** 13 8 ** 32 27 * 17 14 * 16 15 7 7 17 17Arkansas 24 12 ** 6 4 * 23 20 * 21 15 ** 21 18 ** 7 7 19 16 **California 24 10 ** 8 3 ** 29 24 * 16 11 ** 13 12 6 6 16 16Colorado 19 10 ** 9 4 ** 24 26 15 12 * 15 14 5 5 16 16Connecticut 13 7 * 4 3 15 15 12 10 * 13 12 5 5 11 10Delaware 14 8 * 5 4 14 17 * 12 11 13 11 * 7 6 * 12 14 *District of Columbia 8 5 — — 24 25 11 9 * 11 9 * 5 5 16 14 *Florida 29 18 ** 12 7 ** 27 28 21 17 ** 15 16 8 8 18 17Georgia 26 18 ** 10 7 ** 28 27 20 17 * 15 14 7 7 16 17Hawaii 10 5 * 3 2 15 15 9 7 * 14 11 ** 3 4 * 15 12 **Idaho 23 15 ** 9 5 ** 28 28 16 14 * 22 16 ** 5 7 ** 13 16 **Illinois 18 9 ** 5 3 * 20 18 14 11 * 13 13 6 6 15 17 *Indiana 19 11 ** 9 6 ** 20 18 16 13 * 16 15 6 5 * 15 16Iowa 12 6 * 5 2 ** 19 17 10 8 * 15 13 * 5 5 12 12Kansas 18 12 * 7 5 * 22 23 14 12 * 15 14 6 6 13 14Kentucky 21 7 ** 6 3 ** 22 20 19 12 ** 18 15 ** 7 7 16 18 *Louisiana 25 15 ** 6 4 * 26 25 20 18 * 19 16 ** 7 8 * 20 20Maine 16 11 * 5 5 13 12 10 11 15 13 * 6 6 13 13Maryland 14 8 * 5 3 * 21 15 ** 13 11 * 10 10 5 5 13 15 *Massachusetts 5 4 2 1 12 11 9 9 11 11 5 5 11 12Michigan 16 8 ** 5 3 * 17 15 15 13 * 15 13 * 5 4 * 14 14Minnesota 11 6 * 6 3 ** 27 27 10 9 12 10 * 4 5 * 11 12Mississippi 25 18 ** 8 5 ** 23 23 22 19 * 20 17 ** 7 9 ** 19 18Missouri 18 13 * 7 5 * 21 22 16 13 * 17 15 * 6 7 * 15 17 *Montana 23 12 ** 11 5 ** 30 26 * 14 11 * 19 17 * 5 7 ** 17 15 *Nebraska 15 12 6 6 21 19 13 12 15 13 * 5 5 15 14Nevada 27 15 ** 14 6 ** 35 31 * 17 16 18 13 ** 7 7 20 19New Hampshire 16 9 ** 4 3 12 12 12 10 * 12 12 5 5 10 11New Jersey 19 11 ** 6 3 ** 19 18 15 13 * 13 11 * 5 5 15 13 *New Mexico 28 13 ** 9 6 ** 31 30 18 13 ** 16 14 * 7 8 * 18 19New York 15 9 * 4 3 19 17 15 11 ** 12 10 * 6 5 * 15 15North Carolina 23 15 ** 6 5 27 21 ** 18 16 * 18 18 7 6 * 15 15North Dakota 14 9 * 8 10 * 27 26 7 8 17 13 ** 4 5 * 15 14Ohio 16 8 ** 5 4 19 17 15 11 ** 15 14 5 5 14 15Oklahoma 25 20 * 11 8 ** 26 25 17 15 * 19 16 ** 7 7 18 18Oregon 21 9 ** 7 3 ** 26 22 * 18 11 ** 20 15 ** 6 5 * 15 14Pennsylvania 14 8 * 5 5 14 14 12 11 12 12 5 5 13 15 *Rhode Island 17 6 ** 6 — 16 13 * 14 10 ** 13 9 ** 5 6 * 12 11South Carolina 23 15 ** 7 4 ** 24 22 19 16 * 17 17 6 7 * 18 18South Dakota 17 12 * 7 5 * 24 24 10 9 16 16 6 6 11 13 *Tennessee 20 14 * 6 4 * 23 22 18 12 ** 22 17 ** 7 7 17 18Texas 30 23 ** 13 10 ** 33 31 19 18 17 14 ** 7 7 18 19Utah 18 12 * 9 6 ** 28 27 15 12 * 16 17 4 5 * 16 14 *Vermont 10 5 * — — 13 12 9 8 12 11 5 5 11 12Virginia 17 12 * 6 5 24 22 15 13 * 12 14 * 5 6 * 12 14 *Washington 20 9 ** 7 3 ** 28 24 * 15 10 ** 13 13 4 6 ** 14 15West Virginia 20 8 ** 5 2 ** 23 20 * 18 15 * 17 17 5 6 * 18 17Wisconsin 13 7 * 5 3 * 19 17 12 10 * 16 15 5 5 12 12Wyoming 18 15 7 8 31 31 14 14 18 17 5 6 * 15 15
ChangeStates Improved 47 33 11 37 26 6 7States Worsened 0 1 1 0 2 17 9
Notes: * Denotes a change of at least 0.5 standard deviations. ** Denotes a change of 1.0 standard deviation or more. — Indicates that estimates are not available.
Adults without a dental visit in past
yearAdults ages 19–64
uninsuredChildren ages 0–18
uninsured
Individuals with high out-of-pocket
medical spendingAdults without a
usual source of care
Adults who went without care because
of cost
Employee health insurance
contributions as a share of median
income
APPENDIX C2. Access & Affordability: Dimension Ranking and Indicator Rates
Notes: * Denotes a change of at least 0.5 standard deviations. ** Denotes a change of 1.0 standard deviation or more. — Indicates that estimates are not available.

commonwealthfund.org May 2018
2018 Scorecard on State Health System Performance 36
Appendix C2. Access & Affordability: Dimension Ranking and Indicator Rates
2013 2016 2013 2016 2013 2016 2013 2016 2013-14 2015-16 2013 2016 2012 2016United States 20% 12% ** 8% 5% ** 24% 22% 16% 13% * 15% 14% 6% 6% 15% 16%Alabama 20 14 * 5 3 * 22 21 16 16 16 19 ** 6 7 * 18 16 *Alaska 24 18 * 12 11 33 32 14 13 18 12 ** 5 5 14 15Arizona 24 14 ** 13 8 ** 32 27 * 17 14 * 16 15 7 7 17 17Arkansas 24 12 ** 6 4 * 23 20 * 21 15 ** 21 18 ** 7 7 19 16 **California 24 10 ** 8 3 ** 29 24 * 16 11 ** 13 12 6 6 16 16Colorado 19 10 ** 9 4 ** 24 26 15 12 * 15 14 5 5 16 16Connecticut 13 7 * 4 3 15 15 12 10 * 13 12 5 5 11 10Delaware 14 8 * 5 4 14 17 * 12 11 13 11 * 7 6 * 12 14 *District of Columbia 8 5 — — 24 25 11 9 * 11 9 * 5 5 16 14 *Florida 29 18 ** 12 7 ** 27 28 21 17 ** 15 16 8 8 18 17Georgia 26 18 ** 10 7 ** 28 27 20 17 * 15 14 7 7 16 17Hawaii 10 5 * 3 2 15 15 9 7 * 14 11 ** 3 4 * 15 12 **Idaho 23 15 ** 9 5 ** 28 28 16 14 * 22 16 ** 5 7 ** 13 16 **Illinois 18 9 ** 5 3 * 20 18 14 11 * 13 13 6 6 15 17 *Indiana 19 11 ** 9 6 ** 20 18 16 13 * 16 15 6 5 * 15 16Iowa 12 6 * 5 2 ** 19 17 10 8 * 15 13 * 5 5 12 12Kansas 18 12 * 7 5 * 22 23 14 12 * 15 14 6 6 13 14Kentucky 21 7 ** 6 3 ** 22 20 19 12 ** 18 15 ** 7 7 16 18 *Louisiana 25 15 ** 6 4 * 26 25 20 18 * 19 16 ** 7 8 * 20 20Maine 16 11 * 5 5 13 12 10 11 15 13 * 6 6 13 13Maryland 14 8 * 5 3 * 21 15 ** 13 11 * 10 10 5 5 13 15 *Massachusetts 5 4 2 1 12 11 9 9 11 11 5 5 11 12Michigan 16 8 ** 5 3 * 17 15 15 13 * 15 13 * 5 4 * 14 14Minnesota 11 6 * 6 3 ** 27 27 10 9 12 10 * 4 5 * 11 12Mississippi 25 18 ** 8 5 ** 23 23 22 19 * 20 17 ** 7 9 ** 19 18Missouri 18 13 * 7 5 * 21 22 16 13 * 17 15 * 6 7 * 15 17 *Montana 23 12 ** 11 5 ** 30 26 * 14 11 * 19 17 * 5 7 ** 17 15 *Nebraska 15 12 6 6 21 19 13 12 15 13 * 5 5 15 14Nevada 27 15 ** 14 6 ** 35 31 * 17 16 18 13 ** 7 7 20 19New Hampshire 16 9 ** 4 3 12 12 12 10 * 12 12 5 5 10 11New Jersey 19 11 ** 6 3 ** 19 18 15 13 * 13 11 * 5 5 15 13 *New Mexico 28 13 ** 9 6 ** 31 30 18 13 ** 16 14 * 7 8 * 18 19New York 15 9 * 4 3 19 17 15 11 ** 12 10 * 6 5 * 15 15North Carolina 23 15 ** 6 5 27 21 ** 18 16 * 18 18 7 6 * 15 15North Dakota 14 9 * 8 10 * 27 26 7 8 17 13 ** 4 5 * 15 14Ohio 16 8 ** 5 4 19 17 15 11 ** 15 14 5 5 14 15Oklahoma 25 20 * 11 8 ** 26 25 17 15 * 19 16 ** 7 7 18 18Oregon 21 9 ** 7 3 ** 26 22 * 18 11 ** 20 15 ** 6 5 * 15 14Pennsylvania 14 8 * 5 5 14 14 12 11 12 12 5 5 13 15 *Rhode Island 17 6 ** 6 — 16 13 * 14 10 ** 13 9 ** 5 6 * 12 11South Carolina 23 15 ** 7 4 ** 24 22 19 16 * 17 17 6 7 * 18 18South Dakota 17 12 * 7 5 * 24 24 10 9 16 16 6 6 11 13 *Tennessee 20 14 * 6 4 * 23 22 18 12 ** 22 17 ** 7 7 17 18Texas 30 23 ** 13 10 ** 33 31 19 18 17 14 ** 7 7 18 19Utah 18 12 * 9 6 ** 28 27 15 12 * 16 17 4 5 * 16 14 *Vermont 10 5 * — — 13 12 9 8 12 11 5 5 11 12Virginia 17 12 * 6 5 24 22 15 13 * 12 14 * 5 6 * 12 14 *Washington 20 9 ** 7 3 ** 28 24 * 15 10 ** 13 13 4 6 ** 14 15West Virginia 20 8 ** 5 2 ** 23 20 * 18 15 * 17 17 5 6 * 18 17Wisconsin 13 7 * 5 3 * 19 17 12 10 * 16 15 5 5 12 12Wyoming 18 15 7 8 31 31 14 14 18 17 5 6 * 15 15
ChangeStates Improved 47 33 11 37 26 6 7States Worsened 0 1 1 0 2 17 9
Notes: * Denotes a change of at least 0.5 standard deviations. ** Denotes a change of 1.0 standard deviation or more. — Indicates that estimates are not available.
Adults without a dental visit in past
yearAdults ages 19–64
uninsuredChildren ages 0–18
uninsured
Individuals with high out-of-pocket
medical spendingAdults without a
usual source of care
Adults who went without care because
of cost
Employee health insurance
contributions as a share of median
income
APPENDIX C2. Access & Affordability: Dimension Ranking and Indicator Rates (continued)
Notes: * Denotes a change of at least 0.5 standard deviations. ** Denotes a change of 1.0 standard deviation or more.
Appendix C2. Access & Affordability: Dimension Ranking and Indicator Rates
2013 2016 2013 2016 2013 2016 2013 2016 2013-14 2015-16 2013 2016 2012 2016United States 20% 12% ** 8% 5% ** 24% 22% 16% 13% * 15% 14% 6% 6% 15% 16%Alabama 20 14 * 5 3 * 22 21 16 16 16 19 ** 6 7 * 18 16 *Alaska 24 18 * 12 11 33 32 14 13 18 12 ** 5 5 14 15Arizona 24 14 ** 13 8 ** 32 27 * 17 14 * 16 15 7 7 17 17Arkansas 24 12 ** 6 4 * 23 20 * 21 15 ** 21 18 ** 7 7 19 16 **California 24 10 ** 8 3 ** 29 24 * 16 11 ** 13 12 6 6 16 16Colorado 19 10 ** 9 4 ** 24 26 15 12 * 15 14 5 5 16 16Connecticut 13 7 * 4 3 15 15 12 10 * 13 12 5 5 11 10Delaware 14 8 * 5 4 14 17 * 12 11 13 11 * 7 6 * 12 14 *District of Columbia 8 5 — — 24 25 11 9 * 11 9 * 5 5 16 14 *Florida 29 18 ** 12 7 ** 27 28 21 17 ** 15 16 8 8 18 17Georgia 26 18 ** 10 7 ** 28 27 20 17 * 15 14 7 7 16 17Hawaii 10 5 * 3 2 15 15 9 7 * 14 11 ** 3 4 * 15 12 **Idaho 23 15 ** 9 5 ** 28 28 16 14 * 22 16 ** 5 7 ** 13 16 **Illinois 18 9 ** 5 3 * 20 18 14 11 * 13 13 6 6 15 17 *Indiana 19 11 ** 9 6 ** 20 18 16 13 * 16 15 6 5 * 15 16Iowa 12 6 * 5 2 ** 19 17 10 8 * 15 13 * 5 5 12 12Kansas 18 12 * 7 5 * 22 23 14 12 * 15 14 6 6 13 14Kentucky 21 7 ** 6 3 ** 22 20 19 12 ** 18 15 ** 7 7 16 18 *Louisiana 25 15 ** 6 4 * 26 25 20 18 * 19 16 ** 7 8 * 20 20Maine 16 11 * 5 5 13 12 10 11 15 13 * 6 6 13 13Maryland 14 8 * 5 3 * 21 15 ** 13 11 * 10 10 5 5 13 15 *Massachusetts 5 4 2 1 12 11 9 9 11 11 5 5 11 12Michigan 16 8 ** 5 3 * 17 15 15 13 * 15 13 * 5 4 * 14 14Minnesota 11 6 * 6 3 ** 27 27 10 9 12 10 * 4 5 * 11 12Mississippi 25 18 ** 8 5 ** 23 23 22 19 * 20 17 ** 7 9 ** 19 18Missouri 18 13 * 7 5 * 21 22 16 13 * 17 15 * 6 7 * 15 17 *Montana 23 12 ** 11 5 ** 30 26 * 14 11 * 19 17 * 5 7 ** 17 15 *Nebraska 15 12 6 6 21 19 13 12 15 13 * 5 5 15 14Nevada 27 15 ** 14 6 ** 35 31 * 17 16 18 13 ** 7 7 20 19New Hampshire 16 9 ** 4 3 12 12 12 10 * 12 12 5 5 10 11New Jersey 19 11 ** 6 3 ** 19 18 15 13 * 13 11 * 5 5 15 13 *New Mexico 28 13 ** 9 6 ** 31 30 18 13 ** 16 14 * 7 8 * 18 19New York 15 9 * 4 3 19 17 15 11 ** 12 10 * 6 5 * 15 15North Carolina 23 15 ** 6 5 27 21 ** 18 16 * 18 18 7 6 * 15 15North Dakota 14 9 * 8 10 * 27 26 7 8 17 13 ** 4 5 * 15 14Ohio 16 8 ** 5 4 19 17 15 11 ** 15 14 5 5 14 15Oklahoma 25 20 * 11 8 ** 26 25 17 15 * 19 16 ** 7 7 18 18Oregon 21 9 ** 7 3 ** 26 22 * 18 11 ** 20 15 ** 6 5 * 15 14Pennsylvania 14 8 * 5 5 14 14 12 11 12 12 5 5 13 15 *Rhode Island 17 6 ** 6 — 16 13 * 14 10 ** 13 9 ** 5 6 * 12 11South Carolina 23 15 ** 7 4 ** 24 22 19 16 * 17 17 6 7 * 18 18South Dakota 17 12 * 7 5 * 24 24 10 9 16 16 6 6 11 13 *Tennessee 20 14 * 6 4 * 23 22 18 12 ** 22 17 ** 7 7 17 18Texas 30 23 ** 13 10 ** 33 31 19 18 17 14 ** 7 7 18 19Utah 18 12 * 9 6 ** 28 27 15 12 * 16 17 4 5 * 16 14 *Vermont 10 5 * — — 13 12 9 8 12 11 5 5 11 12Virginia 17 12 * 6 5 24 22 15 13 * 12 14 * 5 6 * 12 14 *Washington 20 9 ** 7 3 ** 28 24 * 15 10 ** 13 13 4 6 ** 14 15West Virginia 20 8 ** 5 2 ** 23 20 * 18 15 * 17 17 5 6 * 18 17Wisconsin 13 7 * 5 3 * 19 17 12 10 * 16 15 5 5 12 12Wyoming 18 15 7 8 31 31 14 14 18 17 5 6 * 15 15
ChangeStates Improved 47 33 11 37 26 6 7States Worsened 0 1 1 0 2 17 9
Notes: * Denotes a change of at least 0.5 standard deviations. ** Denotes a change of 1.0 standard deviation or more. — Indicates that estimates are not available.
Adults without a dental visit in past
yearAdults ages 19–64
uninsuredChildren ages 0–18
uninsured
Individuals with high out-of-pocket
medical spendingAdults without a
usual source of care
Adults who went without care because
of cost
Employee health insurance
contributions as a share of median
income
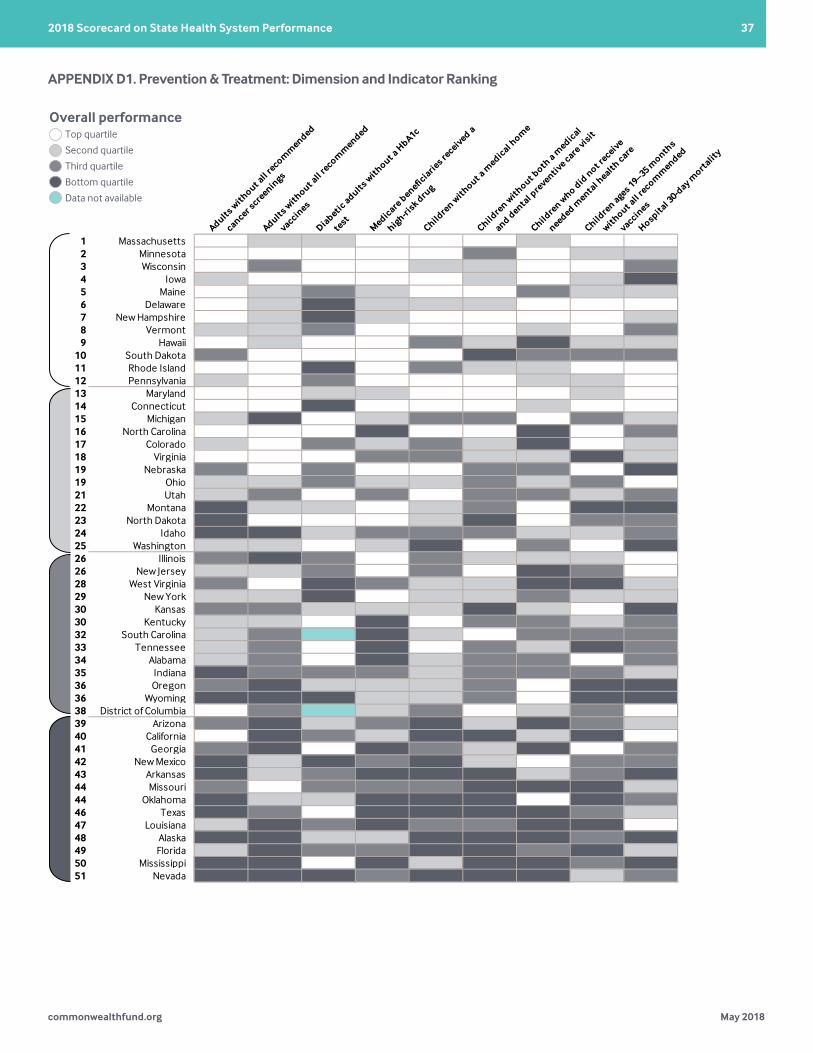
commonwealthfund.org May 2018
2018 Scorecard on State Health System Performance 37
Appendix D1. Prevention & Treatment: Dimension and Indicator Ranking
Adults w
ithout a
ll recom
mended
cancer scre
enings
Adults w
ithout a
ll recom
mended
vaccines
Diabetic adults
with
out a H
bA1c
test
Medicare benefic
iaries re
ceived a
high-risk dru
g
Childre
n with
out a m
edical hom
e
Childre
n with
out both
a medical
and dental p
reventiv
e care visit
Childre
n who did
not receive
needed menta
l health
care
Childre
n ages 19–35 month
s
without a
ll recom
mended
vaccines
Hospital 3
0-day m
ortalit
y
Central li
ne-associated
bloodstre
am in
fection (C
LABSI)
Hospital p
atients
discharged
without i
nstructio
ns
Hospital p
atients
did not r
eceive
patient-c
entere
d care
Home health
patients
with
out
impro
ved mobili
ty
Nursin
g home re
sidents
with
an
antipsychotic
drug
Mentally
ill adults
reporti
ng
unmet n
eed
Mentally
ill adults
who did
not
receive tr
eatment
Central L
ine-associated Blood
Stream
Infe
ction (C
LABSI), SIR
*
state rank1 Massachusetts 1 2 2 1 1 1 2 1 1 1 1 3 2 3 1 1
2 Minnesota 1 1 1 1 1 3 1 2 2 1 1 1 4 1 4 1
3 Wisconsin 1 3 1 1 2 2 1 1 3 1 1 1 3 1 1 2
4 Iowa 2 1 1 1 1 2 1 2 4 2 1 1 2 2 2 1
5 Maine 1 2 3 2 1 1 3 2 2 1 1 1 3 3 1 1
6 Delaware 1 2 4 2 2 2 1 1 1 3 3 3 2 1 1 1
7 New Hampshire 1 2 4 2 1 1 1 1 2 3 1 1 3 3 4 1
8 Vermont 2 2 3 1 1 1 2 1 3 4 1 1 4 3 2 1
9 Hawaii 1 2 1 1 3 2 4 2 2 1 3 2 4 1 1 4
10 South Dakota 3 1 1 1 1 4 3 3 3 1 1 1 4 2 2 2
11 Rhode Island 1 1 4 1 3 2 2 1 1 3 3 3 2 3 1 1
12 Pennsylvania 2 1 3 1 1 1 2 2 1 2 2 3 1 2 2 2
13 Maryland 1 1 2 2 1 1 1 2 1 4 3 4 1 1 2 4
14 Connecticut 1 1 4 1 1 1 2 1 1 4 2 4 4 2 3 2
15 Michigan 2 4 1 2 3 3 1 3 2 2 1 2 3 1 2 2
16 North Carolina 1 1 1 4 1 1 4 1 3 3 2 3 2 1 4 1
17 Colorado 2 1 3 2 3 2 4 1 2 2 1 1 2 2 3 3
18 Virginia 1 1 1 3 3 2 2 4 2 2 2 4 3 2 3 2
19 Nebraska 3 1 3 1 1 3 3 1 4 4 1 1 2 4 1 3
19 Ohio 2 2 3 2 2 3 2 3 1 2 1 2 2 3 2 2
21 Utah 2 3 1 3 1 3 3 2 3 2 1 3 1 3 4 3
22 Montana 4 2 2 1 2 3 1 4 4 2 3 1 4 2 1 1
23 North Dakota 4 1 1 1 2 4 1 3 3 1 4 1 2 3 2 3
24 Idaho 4 4 2 3 3 3 2 2 3 1 1 1 1 3 4 2
25 Washington 2 2 1 2 4 1 3 1 4 2 2 4 3 2 4 3
26 Illinois 3 4 3 1 3 2 2 2 1 2 3 3 3 4 2 2
26 New Jersey 2 2 3 1 3 1 4 3 1 4 4 4 2 1 1 3
28 West Virginia 3 1 4 3 2 2 4 4 2 1 3 3 1 2 3 2
29 New York 2 2 4 1 2 2 3 2 2 3 3 4 2 1 1 3
30 Kansas 3 3 2 2 2 4 2 1 4 1 2 1 3 4 4 2
30 Kentucky 2 2 1 4 1 3 3 2 3 3 3 1 1 4 4 1
32 South Carolina 2 3 0 4 2 1 3 3 3 3 2 2 1 1 2 3
33 Tennessee 2 3 1 4 1 3 2 4 3 2 3 3 1 3 2 3
34 Alabama 2 3 1 4 2 3 3 1 3 4 3 1 1 4 2 2
35 Indiana 4 3 3 3 2 3 3 3 2 4 1 2 3 2 4 3
36 Oregon 3 4 2 2 2 3 1 4 4 1 1 2 4 2 4 1
36 Wyoming 4 4 4 2 2 3 1 4 4 1 2 1 4 1 2 2
38 District of Columbia 1 3 0 2 3 1 2 3 1 4 4 4 1 1 4 4
39 Arizona 3 4 2 3 4 2 4 3 2 2 3 4 4 2 2 4
40 California 1 4 3 2 4 4 2 4 1 3 4 4 3 1 1 4
41 Georgia 3 4 1 4 3 2 4 1 3 4 3 3 1 4 1 3
42 New Mexico 4 2 4 3 4 2 1 3 3 3 4 4 4 3 1 3
43 Arkansas 4 2 3 4 4 4 2 3 4 3 4 2 1 2 1 3
44 Missouri 3 1 3 3 3 4 4 4 2 3 3 3 2 4 4 2
44 Oklahoma 4 2 2 4 4 4 1 4 3 2 3 1 2 4 3 3
46 Texas 4 3 1 4 4 4 4 3 2 3 3 2 4 3 1 4
47 Louisiana 2 4 3 4 3 3 4 4 1 4 3 1 2 4 2 3
48 Alaska 4 4 2 2 4 4 4 3 4 3 2 2 4 1 1 4
49 Florida 2 4 3 3 4 4 3 4 2 3 4 4 1 2 1 4
50 Mississippi 4 4 1 4 2 4 4 3 4 4 4 1 1 4 4 3
51 Nevada 4 4 4 3 4 4 4 2 3 2 4 4 4 2 3 4
Notes: * SIR = Standardized Infection Ratio.
APPENDIX D1. Prevention & Treatment: Dimension and Indicator Ranking
Overall performanceTop quartileSecond quartileThird quartileBottom quartileData not available

commonwealthfund.org May 2018
2018 Scorecard on State Health System Performance 38
Appendix D1. Prevention & Treatment: Dimension and Indicator Ranking
Adults w
ithout a
ll recom
mended
cancer scre
enings
Adults w
ithout a
ll recom
mended
vaccines
Diabetic adults
with
out a H
bA1c
test
Medicare benefic
iaries re
ceived a
high-risk dru
g
Childre
n with
out a m
edical hom
e
Childre
n with
out both
a medical
and dental p
reventiv
e care visit
Childre
n who did
not receive
needed menta
l health
care
Childre
n ages 19–35 month
s
without a
ll recom
mended
vaccines
Hospital 3
0-day m
ortalit
y
Central li
ne-associated
bloodstre
am in
fection (C
LABSI)
Hospital p
atients
discharged
without i
nstructio
ns
Hospital p
atients
did not r
eceive
patient-c
entere
d care
Home health
patients
with
out
impro
ved mobili
ty
Nursin
g home re
sidents
with
an
antipsychotic
drug
Mentally
ill adults
reporti
ng
unmet n
eed
Mentally
ill adults
who did
not
receive tr
eatment
Central L
ine-associated Blood
Stream
Infe
ction (C
LABSI), SIR
*
state rank1 Massachusetts 1 2 2 1 1 1 2 1 1 1 1 3 2 3 1 1
2 Minnesota 1 1 1 1 1 3 1 2 2 1 1 1 4 1 4 1
3 Wisconsin 1 3 1 1 2 2 1 1 3 1 1 1 3 1 1 2
4 Iowa 2 1 1 1 1 2 1 2 4 2 1 1 2 2 2 1
5 Maine 1 2 3 2 1 1 3 2 2 1 1 1 3 3 1 1
6 Delaware 1 2 4 2 2 2 1 1 1 3 3 3 2 1 1 1
7 New Hampshire 1 2 4 2 1 1 1 1 2 3 1 1 3 3 4 1
8 Vermont 2 2 3 1 1 1 2 1 3 4 1 1 4 3 2 1
9 Hawaii 1 2 1 1 3 2 4 2 2 1 3 2 4 1 1 4
10 South Dakota 3 1 1 1 1 4 3 3 3 1 1 1 4 2 2 2
11 Rhode Island 1 1 4 1 3 2 2 1 1 3 3 3 2 3 1 1
12 Pennsylvania 2 1 3 1 1 1 2 2 1 2 2 3 1 2 2 2
13 Maryland 1 1 2 2 1 1 1 2 1 4 3 4 1 1 2 4
14 Connecticut 1 1 4 1 1 1 2 1 1 4 2 4 4 2 3 2
15 Michigan 2 4 1 2 3 3 1 3 2 2 1 2 3 1 2 2
16 North Carolina 1 1 1 4 1 1 4 1 3 3 2 3 2 1 4 1
17 Colorado 2 1 3 2 3 2 4 1 2 2 1 1 2 2 3 3
18 Virginia 1 1 1 3 3 2 2 4 2 2 2 4 3 2 3 2
19 Nebraska 3 1 3 1 1 3 3 1 4 4 1 1 2 4 1 3
19 Ohio 2 2 3 2 2 3 2 3 1 2 1 2 2 3 2 2
21 Utah 2 3 1 3 1 3 3 2 3 2 1 3 1 3 4 3
22 Montana 4 2 2 1 2 3 1 4 4 2 3 1 4 2 1 1
23 North Dakota 4 1 1 1 2 4 1 3 3 1 4 1 2 3 2 3
24 Idaho 4 4 2 3 3 3 2 2 3 1 1 1 1 3 4 2
25 Washington 2 2 1 2 4 1 3 1 4 2 2 4 3 2 4 3
26 Illinois 3 4 3 1 3 2 2 2 1 2 3 3 3 4 2 2
26 New Jersey 2 2 3 1 3 1 4 3 1 4 4 4 2 1 1 3
28 West Virginia 3 1 4 3 2 2 4 4 2 1 3 3 1 2 3 2
29 New York 2 2 4 1 2 2 3 2 2 3 3 4 2 1 1 3
30 Kansas 3 3 2 2 2 4 2 1 4 1 2 1 3 4 4 2
30 Kentucky 2 2 1 4 1 3 3 2 3 3 3 1 1 4 4 1
32 South Carolina 2 3 0 4 2 1 3 3 3 3 2 2 1 1 2 3
33 Tennessee 2 3 1 4 1 3 2 4 3 2 3 3 1 3 2 3
34 Alabama 2 3 1 4 2 3 3 1 3 4 3 1 1 4 2 2
35 Indiana 4 3 3 3 2 3 3 3 2 4 1 2 3 2 4 3
36 Oregon 3 4 2 2 2 3 1 4 4 1 1 2 4 2 4 1
36 Wyoming 4 4 4 2 2 3 1 4 4 1 2 1 4 1 2 2
38 District of Columbia 1 3 0 2 3 1 2 3 1 4 4 4 1 1 4 4
39 Arizona 3 4 2 3 4 2 4 3 2 2 3 4 4 2 2 4
40 California 1 4 3 2 4 4 2 4 1 3 4 4 3 1 1 4
41 Georgia 3 4 1 4 3 2 4 1 3 4 3 3 1 4 1 3
42 New Mexico 4 2 4 3 4 2 1 3 3 3 4 4 4 3 1 3
43 Arkansas 4 2 3 4 4 4 2 3 4 3 4 2 1 2 1 3
44 Missouri 3 1 3 3 3 4 4 4 2 3 3 3 2 4 4 2
44 Oklahoma 4 2 2 4 4 4 1 4 3 2 3 1 2 4 3 3
46 Texas 4 3 1 4 4 4 4 3 2 3 3 2 4 3 1 4
47 Louisiana 2 4 3 4 3 3 4 4 1 4 3 1 2 4 2 3
48 Alaska 4 4 2 2 4 4 4 3 4 3 2 2 4 1 1 4
49 Florida 2 4 3 3 4 4 3 4 2 3 4 4 1 2 1 4
50 Mississippi 4 4 1 4 2 4 4 3 4 4 4 1 1 4 4 3
51 Nevada 4 4 4 3 4 4 4 2 3 2 4 4 4 2 3 4
Notes: * SIR = Standardized Infection Ratio.
APPENDIX D1. Prevention & Treatment: Dimension and Indicator Ranking (continued)
Appendix D1. Prevention & Treatment: Dimension and Indicator Ranking
Adults w
ithout a
ll recom
mended
cancer scre
enings
Adults w
ithout a
ll recom
mended
vaccines
Diabetic adults
with
out a H
bA1c
test
Medicare benefic
iaries re
ceived a
high-risk dru
g
Childre
n with
out a m
edical hom
e
Childre
n with
out both
a medical
and dental p
reventiv
e care visit
Childre
n who did
not receive
needed menta
l health
care
Childre
n ages 19–35 month
s
without a
ll recom
mended
vaccines
Hospital 3
0-day m
ortalit
y
Central li
ne-associated
bloodstre
am in
fection (C
LABSI)
Hospital p
atients
discharged
without i
nstructio
ns
Hospital p
atients
did not r
eceive
patient-c
entere
d care
Home health
patients
with
out
impro
ved mobili
ty
Nursin
g home re
sidents
with
an
antipsychotic
drug
Mentally
ill adults
reporti
ng
unmet n
eed
Mentally
ill adults
who did
not
receive tr
eatment
Central L
ine-associated Blood
Stream
Infe
ction (C
LABSI), SIR
*
state rank1 Massachusetts 1 2 2 1 1 1 2 1 1 1 1 3 2 3 1 1
2 Minnesota 1 1 1 1 1 3 1 2 2 1 1 1 4 1 4 1
3 Wisconsin 1 3 1 1 2 2 1 1 3 1 1 1 3 1 1 2
4 Iowa 2 1 1 1 1 2 1 2 4 2 1 1 2 2 2 1
5 Maine 1 2 3 2 1 1 3 2 2 1 1 1 3 3 1 1
6 Delaware 1 2 4 2 2 2 1 1 1 3 3 3 2 1 1 1
7 New Hampshire 1 2 4 2 1 1 1 1 2 3 1 1 3 3 4 1
8 Vermont 2 2 3 1 1 1 2 1 3 4 1 1 4 3 2 1
9 Hawaii 1 2 1 1 3 2 4 2 2 1 3 2 4 1 1 4
10 South Dakota 3 1 1 1 1 4 3 3 3 1 1 1 4 2 2 2
11 Rhode Island 1 1 4 1 3 2 2 1 1 3 3 3 2 3 1 1
12 Pennsylvania 2 1 3 1 1 1 2 2 1 2 2 3 1 2 2 2
13 Maryland 1 1 2 2 1 1 1 2 1 4 3 4 1 1 2 4
14 Connecticut 1 1 4 1 1 1 2 1 1 4 2 4 4 2 3 2
15 Michigan 2 4 1 2 3 3 1 3 2 2 1 2 3 1 2 2
16 North Carolina 1 1 1 4 1 1 4 1 3 3 2 3 2 1 4 1
17 Colorado 2 1 3 2 3 2 4 1 2 2 1 1 2 2 3 3
18 Virginia 1 1 1 3 3 2 2 4 2 2 2 4 3 2 3 2
19 Nebraska 3 1 3 1 1 3 3 1 4 4 1 1 2 4 1 3
19 Ohio 2 2 3 2 2 3 2 3 1 2 1 2 2 3 2 2
21 Utah 2 3 1 3 1 3 3 2 3 2 1 3 1 3 4 3
22 Montana 4 2 2 1 2 3 1 4 4 2 3 1 4 2 1 1
23 North Dakota 4 1 1 1 2 4 1 3 3 1 4 1 2 3 2 3
24 Idaho 4 4 2 3 3 3 2 2 3 1 1 1 1 3 4 2
25 Washington 2 2 1 2 4 1 3 1 4 2 2 4 3 2 4 3
26 Illinois 3 4 3 1 3 2 2 2 1 2 3 3 3 4 2 2
26 New Jersey 2 2 3 1 3 1 4 3 1 4 4 4 2 1 1 3
28 West Virginia 3 1 4 3 2 2 4 4 2 1 3 3 1 2 3 2
29 New York 2 2 4 1 2 2 3 2 2 3 3 4 2 1 1 3
30 Kansas 3 3 2 2 2 4 2 1 4 1 2 1 3 4 4 2
30 Kentucky 2 2 1 4 1 3 3 2 3 3 3 1 1 4 4 1
32 South Carolina 2 3 0 4 2 1 3 3 3 3 2 2 1 1 2 3
33 Tennessee 2 3 1 4 1 3 2 4 3 2 3 3 1 3 2 3
34 Alabama 2 3 1 4 2 3 3 1 3 4 3 1 1 4 2 2
35 Indiana 4 3 3 3 2 3 3 3 2 4 1 2 3 2 4 3
36 Oregon 3 4 2 2 2 3 1 4 4 1 1 2 4 2 4 1
36 Wyoming 4 4 4 2 2 3 1 4 4 1 2 1 4 1 2 2
38 District of Columbia 1 3 0 2 3 1 2 3 1 4 4 4 1 1 4 4
39 Arizona 3 4 2 3 4 2 4 3 2 2 3 4 4 2 2 4
40 California 1 4 3 2 4 4 2 4 1 3 4 4 3 1 1 4
41 Georgia 3 4 1 4 3 2 4 1 3 4 3 3 1 4 1 3
42 New Mexico 4 2 4 3 4 2 1 3 3 3 4 4 4 3 1 3
43 Arkansas 4 2 3 4 4 4 2 3 4 3 4 2 1 2 1 3
44 Missouri 3 1 3 3 3 4 4 4 2 3 3 3 2 4 4 2
44 Oklahoma 4 2 2 4 4 4 1 4 3 2 3 1 2 4 3 3
46 Texas 4 3 1 4 4 4 4 3 2 3 3 2 4 3 1 4
47 Louisiana 2 4 3 4 3 3 4 4 1 4 3 1 2 4 2 3
48 Alaska 4 4 2 2 4 4 4 3 4 3 2 2 4 1 1 4
49 Florida 2 4 3 3 4 4 3 4 2 3 4 4 1 2 1 4
50 Mississippi 4 4 1 4 2 4 4 3 4 4 4 1 1 4 4 3
51 Nevada 4 4 4 3 4 4 4 2 3 2 4 4 4 2 3 4
Notes: * SIR = Standardized Infection Ratio.
Overall performanceTop quartileSecond quartileThird quartileBottom quartileData not available

commonwealthfund.org May 2018
2018 Scorecard on State Health System Performance 39
Appendix D2. Prevention & Treatment: Dimension Ranking and Indicator Rates
2012 2016 2013 2016 2015 2012 2014 2016 2016 2016 2013 20162010-2013
2013-2016 2015 2013 2016 2013 2016 2013 2016 2013 2016
2009-2011
2013-2015
2009-2011
2013-2015
United States 31% 32% 64% 63% 17% 17% 13% ** 51% 32% 18% 30% 29% 13.2% 14.1% ** 0.99 14% 13% 32% 32% 39% 29% ** 21% 16% ** 21% 20% 59% 56% *
Alabama 32 32 62 65 * 15 24 18 ** 49 32 19 23 23 13.7 14.6 ** 1.41 15 14 31 30 35 24 ** 22 19 * 21 20 59 54 *Alaska 37 36 67 67 16 17 12 ** 52 37 24 36 31 * 13.7 14.9 ** 1.09 12 12 30 31 51 40 ** 13 12 22 19 * 67 64 *Arizona 37 35 69 66 * 16 17 13 ** 55 31 22 35 30 * 13.1 13.9 ** 0.85 14 13 34 34 42 32 ** 20 16 ** 30 21 ** 59 59Arkansas 39 36 * 63 63 18 17 16 52 41 15 43 32 ** 14.1 15.2 ** 1.1 17 15 * 32 31 39 24 ** 24 16 ** 28 19 ** 58 55 *California 27 28 66 66 19 16 11 ** 58 39 16 31 35 * 13 13.7 * 0.97 16 15 36 36 41 31 ** 17 12 ** 21 18 * 64 61 *Colorado 31 32 58 59 17 16 12 ** 51 29 27 31 24 ** 12.9 14.2 ** 0.9 12 11 30 30 38 28 ** 17 15 * 23 22 55 57Connecticut 25 24 63 59 * 21 13 10 * 46 23 15 22 24 13 13.5 * 1.16 15 12 ** 35 35 41 32 ** 21 16 ** 25 22 * 58 53 *Delaware 25 28 * 57 61 * 21 16 11 ** 48 28 9 28 22 ** 12.2 13 ** 1.05 15 13 * 34 32 * 42 28 ** 17 13 ** 16 17 58 51 **District of Columbia 25 25 64 64 — 13 12 51 26 16 23 32 ** 12.4 13.6 ** 1.16 22 18 ** 42 43 40 26 ** 16 12 ** 24 25 65 59 **Florida 32 33 72 68 * 19 16 14 * 58 38 18 30 33 * 13.1 13.9 ** 1.1 17 15 * 37 36 35 26 ** 22 16 ** 20 18 * 63 62Georgia 28 34 ** 68 66 15 21 16 ** 51 28 34 30 23 ** 13.4 14.4 ** 1.17 16 14 * 34 33 39 27 ** 22 19 * 20 19 59 57Hawaii 30 26 * 57 63 ** 15 21 9 ** 50 31 23 34 25 ** 13.4 14.3 ** 0.32 15 14 31 31 45 34 ** 11 8 * 14 14 73 64 **Idaho 39 40 68 67 16 16 13 * 50 33 13 30 26 * 13.6 14.6 ** 0.64 12 10 * 30 29 37 27 ** 20 17 * 23 25 * 54 52Illinois 33 34 66 66 18 13 10 * 50 28 15 33 29 * 12.9 13.8 ** 0.82 14 13 33 32 39 30 ** 25 19 ** 22 21 58 53 *Indiana 37 37 67 64 * 18 17 13 ** 47 32 18 31 31 13.4 14.3 ** 1.12 13 11 * 31 31 41 30 ** 21 16 ** 23 25 * 57 55Iowa 29 31 56 55 15 12 9 * 42 30 7 22 27 * 13.4 15 ** 0.93 12 11 31 30 38 29 ** 20 15 ** 18 21 * 55 46 **Kansas 32 34 60 64 * 16 15 12 * 49 36 14 31 24 ** 13 14.7 ** 0.8 14 12 * 30 28 * 39 30 ** 22 20 * 30 23 ** 49 54 *Kentucky 35 33 62 63 14 23 17 ** 46 33 18 27 25 13.3 14.4 ** 1.07 14 13 31 30 36 25 ** 22 20 * 19 23 ** 55 51 *Louisiana 33 32 61 69 ** 17 24 21 * 51 32 25 31 33 13.3 13.8 * 1.43 14 13 28 27 40 29 ** 27 19 ** 23 20 * 65 58 **Maine 27 29 59 60 17 12 12 46 22 17 32 29 * 13.4 14.2 ** 0.8 11 11 28 29 38 30 ** 21 17 ** 16 19 * 47 41 **Maryland 25 29 * 58 58 16 15 12 * 42 26 11 24 26 12.8 13.7 ** 1.12 15 14 39 38 37 25 ** 16 14 * 20 20 57 60 *Massachusetts 21 26 ** 53 60 ** 16 9 9 42 22 13 21 15 ** 12.4 13 * 0.75 13 11 * 33 33 37 28 ** 22 18 ** 21 16 ** 49 46 *Michigan 29 31 67 66 15 14 12 * 50 33 7 30 30 13 13.9 ** 0.94 13 11 * 32 31 39 30 ** 15 13 * 23 20 * 60 54 **Minnesota 27 29 56 57 11 10 7 * 45 35 9 26 26 12.8 13.9 ** 0.78 12 11 29 29 43 33 ** 16 14 * 25 24 57 44 **Mississippi 37 36 65 66 15 22 19 * 49 41 22 25 30 * 13.4 14.8 ** 1.11 17 15 * 30 30 36 23 ** 25 20 ** 21 23 * 67 58 **Missouri 34 35 60 59 18 16 14 * 51 38 22 32 33 13.2 14.2 ** 1.06 13 13 33 33 38 28 ** 24 19 ** 27 25 * 56 52 *Montana 40 38 63 62 16 13 10 * 47 32 8 35 36 13.2 14.9 ** 0.93 15 13 * 33 29 ** 44 34 ** 18 15 * 24 18 ** 51 48 *Nebraska 34 35 57 57 19 13 10 * 45 35 20 21 19 13.3 14.9 ** 1.16 12 10 * 28 28 41 29 ** 23 19 ** 16 19 * 53 58 *Nevada 37 36 71 70 20 17 13 ** 66 38 26 39 28 ** 13.8 14.5 * 0.95 16 15 36 37 40 32 ** 21 16 ** 22 22 68 66New Hampshire 25 27 61 60 21 13 11 * 42 21 5 25 22 * 13.3 14 * 1.04 12 10 * 31 30 41 30 ** 21 17 ** 24 24 57 49 **New Jersey 31 31 66 63 * 19 15 10 ** 50 26 23 27 30 * 12.7 13.3 * 1.13 18 16 * 37 37 37 28 ** 16 12 ** 15 17 * 68 58 **New Mexico 37 40 * 64 62 20 18 13 ** 55 28 9 34 32 13.3 14.5 ** 1 16 15 34 34 41 32 ** 19 17 * 25 18 ** 55 57New York 28 31 * 65 62 * 21 12 9 * 48 31 17 28 28 13.1 13.9 ** 1.07 16 14 * 37 37 41 29 ** 19 14 ** 17 19 * 61 56 *North Carolina 29 28 56 58 13 20 15 ** 46 27 30 28 22 ** 13.7 14.5 ** 1.06 13 12 31 32 39 28 ** 16 14 * 22 24 * 59 50 **North Dakota 36 36 61 59 15 11 8 * 49 41 10 28 32 * 12.7 14.6 ** 0.79 18 15 ** 30 29 44 28 ** 19 17 * 17 21 ** 55 56Ohio 33 33 62 63 18 17 12 ** 48 32 15 38 32 ** 12.9 13.6 * 0.88 13 11 * 32 31 39 29 ** 23 18 ** 20 20 54 53Oklahoma 39 40 59 61 16 22 18 ** 55 36 11 37 33 * 13.2 14.5 ** 0.95 15 13 * 30 30 40 28 ** 23 20 * 18 22 ** 60 56 *Oregon 33 34 67 66 16 16 11 ** 49 33 10 33 42 ** 13.9 14.9 ** 0.8 14 11 ** 32 31 44 35 ** 18 16 * 26 25 56 51 *Pennsylvania 31 33 63 59 * 19 13 10 * 45 26 13 24 26 12.9 13.7 ** 0.94 14 12 * 33 32 37 27 ** 19 16 * 21 21 54 53Rhode Island 24 26 58 56 24 11 9 * 50 28 16 18 24 ** 13.2 13.1 1.07 14 13 33 32 37 28 ** 18 18 27 18 ** 47 49South Carolina 32 33 63 64 — 20 17 * 49 25 19 33 30 * 13.5 14.4 ** 1.1 14 12 * 31 31 36 27 ** 17 14 * 22 21 54 58 *South Dakota 32 34 53 54 13 10 8 * 46 39 17 26 30 * 13.1 14.6 ** 0.65 13 11 * 28 27 42 32 ** 19 16 * 17 20 * 53 54Tennessee 33 33 58 65 ** 13 21 16 ** 46 34 15 32 33 13.5 14.6 ** 0.9 15 14 32 32 37 26 ** 24 18 ** 16 20 ** 57 58Texas 34 37 * 66 65 15 19 16 * 59 36 24 28 31 * 13 13.9 ** 0.97 14 13 31 31 44 34 ** 27 18 ** 20 17 * 65 60 *Utah 32 33 65 65 15 18 13 ** 43 34 18 25 28 * 13.5 14.6 ** 0.82 10 10 30 32 * 34 25 ** 25 17 ** 23 23 57 56Vermont 27 30 * 58 60 19 11 9 * 40 20 16 33 23 ** 13.8 14.6 ** 1.13 12 9 ** 31 30 40 32 ** 20 17 * 24 21 * 45 44Virginia 28 29 59 59 14 17 13 ** 51 28 14 31 34 * 13.5 14.1 * 0.92 14 12 * 34 34 37 30 ** 20 16 ** 22 22 53 53Washington 31 32 61 62 13 16 12 ** 52 27 20 29 24 * 13.9 14.9 ** 0.87 13 12 34 34 44 30 ** 19 15 ** 26 24 * 53 56 *West Virginia 34 35 58 58 20 17 14 * 48 28 24 34 35 13.2 14.2 ** 0.74 15 13 * 33 32 37 24 ** 18 16 * 26 22 ** 48 54 **Wisconsin 29 28 65 65 14 11 9 * 48 31 9 27 21 ** 13.5 14.4 ** 0.77 11 10 29 28 41 30 ** 16 13 * 22 19 * 60 52 **Wyoming 39 40 68 67 22 13 12 48 34 7 30 37 ** 13 15.4 ** 0.67 12 12 31 29 * 42 34 ** 18 13 ** 17 21 ** 61 52 **
ChangeStates Improved 2 7 46 21 0 0 27 4 51 49 19 28States Worsened 8 7 0 14 50 0 0 1 0 0 15 6
q001a_0 q001a_1 q001b_0 q001b_1 q026_1 q014_0 q014_1 q003_1 q004_0 q005_0 q006_0 q006_1 q009_0 q009_1 q022_1 q010_0 q010_1 q011_0 q011_1 q017_0 q017_1 q020_0 q020_1 q024_0 q024_1 q025_0 q025_1Notes: * Denotes a change of at least 0.5 standard deviations. ** Denotes a change of 1.0 standard deviation or more. — Indicates that estimates are not available.
Children without both a
medical and dental
preventive care visit
Children who did not receive
needed mental health treatment
Children ages 19–35 months who did not
receive all recommended
vaccinesHospital 30-day
mortality
Central line-associated
bloodstream infection (CLABSI)
Adults without all age- and gender-
appropriate cancer screenings
Adults without all age-appropriate recommended
vaccinesMedicare beneficiaries
received a high-risk drug
Adults with any mental illness who did not receive treatment
Diabetic adults ages 18–64 without a
hemoglobin A1c test
Children without all
components of a medical
home
Hospital patients discharged without
instructions for home recovery
Home health patients who did not get better at walking or moving
around
Nursing home residents with an
antipsychotic medication
Adults with any mental illness reporting
unmet need
Hospital patients who did not receive patient-
centered care
APPENDIX D2. Prevention & Treatment: Dimension Ranking and Indicator Rates
Notes: * Denotes a change of at least 0.5 standard deviations. ** Denotes a change of 1.0 standard deviation or more. — Indicates that estimates are not available.

commonwealthfund.org May 2018
2018 Scorecard on State Health System Performance 40
APPENDIX D2. Prevention & Treatment: Dimension Ranking and Indicator Rates (continued)
Notes: * Denotes a change of at least 0.5 standard deviations. ** Denotes a change of 1.0 standard deviation or more. — Indicates that estimates are not available.
Appendix D2. Prevention & Treatment: Dimension Ranking and Indicator Rates
2012 2016 2013 2016 2015 2012 2014 2016 2016 2016 2013 20162010-2013
2013-2016 2015 2013 2016 2013 2016 2013 2016 2013 2016
2009-2011
2013-2015
2009-2011
2013-2015
United States 31% 32% 64% 63% 17% 17% 13% ** 51% 32% 18% 30% 29% 13.2% 14.1% ** 0.99 14% 13% 32% 32% 39% 29% ** 21% 16% ** 21% 20% 59% 56% *
Alabama 32 32 62 65 * 15 24 18 ** 49 32 19 23 23 13.7 14.6 ** 1.41 15 14 31 30 35 24 ** 22 19 * 21 20 59 54 *Alaska 37 36 67 67 16 17 12 ** 52 37 24 36 31 * 13.7 14.9 ** 1.09 12 12 30 31 51 40 ** 13 12 22 19 * 67 64 *Arizona 37 35 69 66 * 16 17 13 ** 55 31 22 35 30 * 13.1 13.9 ** 0.85 14 13 34 34 42 32 ** 20 16 ** 30 21 ** 59 59Arkansas 39 36 * 63 63 18 17 16 52 41 15 43 32 ** 14.1 15.2 ** 1.1 17 15 * 32 31 39 24 ** 24 16 ** 28 19 ** 58 55 *California 27 28 66 66 19 16 11 ** 58 39 16 31 35 * 13 13.7 * 0.97 16 15 36 36 41 31 ** 17 12 ** 21 18 * 64 61 *Colorado 31 32 58 59 17 16 12 ** 51 29 27 31 24 ** 12.9 14.2 ** 0.9 12 11 30 30 38 28 ** 17 15 * 23 22 55 57Connecticut 25 24 63 59 * 21 13 10 * 46 23 15 22 24 13 13.5 * 1.16 15 12 ** 35 35 41 32 ** 21 16 ** 25 22 * 58 53 *Delaware 25 28 * 57 61 * 21 16 11 ** 48 28 9 28 22 ** 12.2 13 ** 1.05 15 13 * 34 32 * 42 28 ** 17 13 ** 16 17 58 51 **District of Columbia 25 25 64 64 — 13 12 51 26 16 23 32 ** 12.4 13.6 ** 1.16 22 18 ** 42 43 40 26 ** 16 12 ** 24 25 65 59 **Florida 32 33 72 68 * 19 16 14 * 58 38 18 30 33 * 13.1 13.9 ** 1.1 17 15 * 37 36 35 26 ** 22 16 ** 20 18 * 63 62Georgia 28 34 ** 68 66 15 21 16 ** 51 28 34 30 23 ** 13.4 14.4 ** 1.17 16 14 * 34 33 39 27 ** 22 19 * 20 19 59 57Hawaii 30 26 * 57 63 ** 15 21 9 ** 50 31 23 34 25 ** 13.4 14.3 ** 0.32 15 14 31 31 45 34 ** 11 8 * 14 14 73 64 **Idaho 39 40 68 67 16 16 13 * 50 33 13 30 26 * 13.6 14.6 ** 0.64 12 10 * 30 29 37 27 ** 20 17 * 23 25 * 54 52Illinois 33 34 66 66 18 13 10 * 50 28 15 33 29 * 12.9 13.8 ** 0.82 14 13 33 32 39 30 ** 25 19 ** 22 21 58 53 *Indiana 37 37 67 64 * 18 17 13 ** 47 32 18 31 31 13.4 14.3 ** 1.12 13 11 * 31 31 41 30 ** 21 16 ** 23 25 * 57 55Iowa 29 31 56 55 15 12 9 * 42 30 7 22 27 * 13.4 15 ** 0.93 12 11 31 30 38 29 ** 20 15 ** 18 21 * 55 46 **Kansas 32 34 60 64 * 16 15 12 * 49 36 14 31 24 ** 13 14.7 ** 0.8 14 12 * 30 28 * 39 30 ** 22 20 * 30 23 ** 49 54 *Kentucky 35 33 62 63 14 23 17 ** 46 33 18 27 25 13.3 14.4 ** 1.07 14 13 31 30 36 25 ** 22 20 * 19 23 ** 55 51 *Louisiana 33 32 61 69 ** 17 24 21 * 51 32 25 31 33 13.3 13.8 * 1.43 14 13 28 27 40 29 ** 27 19 ** 23 20 * 65 58 **Maine 27 29 59 60 17 12 12 46 22 17 32 29 * 13.4 14.2 ** 0.8 11 11 28 29 38 30 ** 21 17 ** 16 19 * 47 41 **Maryland 25 29 * 58 58 16 15 12 * 42 26 11 24 26 12.8 13.7 ** 1.12 15 14 39 38 37 25 ** 16 14 * 20 20 57 60 *Massachusetts 21 26 ** 53 60 ** 16 9 9 42 22 13 21 15 ** 12.4 13 * 0.75 13 11 * 33 33 37 28 ** 22 18 ** 21 16 ** 49 46 *Michigan 29 31 67 66 15 14 12 * 50 33 7 30 30 13 13.9 ** 0.94 13 11 * 32 31 39 30 ** 15 13 * 23 20 * 60 54 **Minnesota 27 29 56 57 11 10 7 * 45 35 9 26 26 12.8 13.9 ** 0.78 12 11 29 29 43 33 ** 16 14 * 25 24 57 44 **Mississippi 37 36 65 66 15 22 19 * 49 41 22 25 30 * 13.4 14.8 ** 1.11 17 15 * 30 30 36 23 ** 25 20 ** 21 23 * 67 58 **Missouri 34 35 60 59 18 16 14 * 51 38 22 32 33 13.2 14.2 ** 1.06 13 13 33 33 38 28 ** 24 19 ** 27 25 * 56 52 *Montana 40 38 63 62 16 13 10 * 47 32 8 35 36 13.2 14.9 ** 0.93 15 13 * 33 29 ** 44 34 ** 18 15 * 24 18 ** 51 48 *Nebraska 34 35 57 57 19 13 10 * 45 35 20 21 19 13.3 14.9 ** 1.16 12 10 * 28 28 41 29 ** 23 19 ** 16 19 * 53 58 *Nevada 37 36 71 70 20 17 13 ** 66 38 26 39 28 ** 13.8 14.5 * 0.95 16 15 36 37 40 32 ** 21 16 ** 22 22 68 66New Hampshire 25 27 61 60 21 13 11 * 42 21 5 25 22 * 13.3 14 * 1.04 12 10 * 31 30 41 30 ** 21 17 ** 24 24 57 49 **New Jersey 31 31 66 63 * 19 15 10 ** 50 26 23 27 30 * 12.7 13.3 * 1.13 18 16 * 37 37 37 28 ** 16 12 ** 15 17 * 68 58 **New Mexico 37 40 * 64 62 20 18 13 ** 55 28 9 34 32 13.3 14.5 ** 1 16 15 34 34 41 32 ** 19 17 * 25 18 ** 55 57New York 28 31 * 65 62 * 21 12 9 * 48 31 17 28 28 13.1 13.9 ** 1.07 16 14 * 37 37 41 29 ** 19 14 ** 17 19 * 61 56 *North Carolina 29 28 56 58 13 20 15 ** 46 27 30 28 22 ** 13.7 14.5 ** 1.06 13 12 31 32 39 28 ** 16 14 * 22 24 * 59 50 **North Dakota 36 36 61 59 15 11 8 * 49 41 10 28 32 * 12.7 14.6 ** 0.79 18 15 ** 30 29 44 28 ** 19 17 * 17 21 ** 55 56Ohio 33 33 62 63 18 17 12 ** 48 32 15 38 32 ** 12.9 13.6 * 0.88 13 11 * 32 31 39 29 ** 23 18 ** 20 20 54 53Oklahoma 39 40 59 61 16 22 18 ** 55 36 11 37 33 * 13.2 14.5 ** 0.95 15 13 * 30 30 40 28 ** 23 20 * 18 22 ** 60 56 *Oregon 33 34 67 66 16 16 11 ** 49 33 10 33 42 ** 13.9 14.9 ** 0.8 14 11 ** 32 31 44 35 ** 18 16 * 26 25 56 51 *Pennsylvania 31 33 63 59 * 19 13 10 * 45 26 13 24 26 12.9 13.7 ** 0.94 14 12 * 33 32 37 27 ** 19 16 * 21 21 54 53Rhode Island 24 26 58 56 24 11 9 * 50 28 16 18 24 ** 13.2 13.1 1.07 14 13 33 32 37 28 ** 18 18 27 18 ** 47 49South Carolina 32 33 63 64 — 20 17 * 49 25 19 33 30 * 13.5 14.4 ** 1.1 14 12 * 31 31 36 27 ** 17 14 * 22 21 54 58 *South Dakota 32 34 53 54 13 10 8 * 46 39 17 26 30 * 13.1 14.6 ** 0.65 13 11 * 28 27 42 32 ** 19 16 * 17 20 * 53 54Tennessee 33 33 58 65 ** 13 21 16 ** 46 34 15 32 33 13.5 14.6 ** 0.9 15 14 32 32 37 26 ** 24 18 ** 16 20 ** 57 58Texas 34 37 * 66 65 15 19 16 * 59 36 24 28 31 * 13 13.9 ** 0.97 14 13 31 31 44 34 ** 27 18 ** 20 17 * 65 60 *Utah 32 33 65 65 15 18 13 ** 43 34 18 25 28 * 13.5 14.6 ** 0.82 10 10 30 32 * 34 25 ** 25 17 ** 23 23 57 56Vermont 27 30 * 58 60 19 11 9 * 40 20 16 33 23 ** 13.8 14.6 ** 1.13 12 9 ** 31 30 40 32 ** 20 17 * 24 21 * 45 44Virginia 28 29 59 59 14 17 13 ** 51 28 14 31 34 * 13.5 14.1 * 0.92 14 12 * 34 34 37 30 ** 20 16 ** 22 22 53 53Washington 31 32 61 62 13 16 12 ** 52 27 20 29 24 * 13.9 14.9 ** 0.87 13 12 34 34 44 30 ** 19 15 ** 26 24 * 53 56 *West Virginia 34 35 58 58 20 17 14 * 48 28 24 34 35 13.2 14.2 ** 0.74 15 13 * 33 32 37 24 ** 18 16 * 26 22 ** 48 54 **Wisconsin 29 28 65 65 14 11 9 * 48 31 9 27 21 ** 13.5 14.4 ** 0.77 11 10 29 28 41 30 ** 16 13 * 22 19 * 60 52 **Wyoming 39 40 68 67 22 13 12 48 34 7 30 37 ** 13 15.4 ** 0.67 12 12 31 29 * 42 34 ** 18 13 ** 17 21 ** 61 52 **
ChangeStates Improved 2 7 46 21 0 0 27 4 51 49 19 28States Worsened 8 7 0 14 50 0 0 1 0 0 15 6
q001a_0 q001a_1 q001b_0 q001b_1 q026_1 q014_0 q014_1 q003_1 q004_0 q005_0 q006_0 q006_1 q009_0 q009_1 q022_1 q010_0 q010_1 q011_0 q011_1 q017_0 q017_1 q020_0 q020_1 q024_0 q024_1 q025_0 q025_1Notes: * Denotes a change of at least 0.5 standard deviations. ** Denotes a change of 1.0 standard deviation or more. — Indicates that estimates are not available.
Children without both a
medical and dental
preventive care visit
Children who did not receive
needed mental health treatment
Children ages 19–35 months who did not
receive all recommended
vaccinesHospital 30-day
mortality
Central line-associated
bloodstream infection (CLABSI)
Adults without all age- and gender-
appropriate cancer screenings
Adults without all age-appropriate recommended
vaccinesMedicare beneficiaries
received a high-risk drug
Adults with any mental illness who did not receive treatment
Diabetic adults ages 18–64 without a
hemoglobin A1c test
Children without all
components of a medical
home
Hospital patients discharged without
instructions for home recovery
Home health patients who did not get better at walking or moving
around
Nursing home residents with an
antipsychotic medication
Adults with any mental illness reporting
unmet need
Hospital patients who did not receive patient-
centered care

commonwealthfund.org May 2018
2018 Scorecard on State Health System Performance 41
APPENDIX D2. Prevention & Treatment: Dimension Ranking and Indicator Rates (continued)
Notes: * Denotes a change of at least 0.5 standard deviations. ** Denotes a change of 1.0 standard deviation or more. — Indicates that estimates are not available.
Appendix D2. Prevention & Treatment: Dimension Ranking and Indicator Rates
2012 2016 2013 2016 2015 2012 2014 2016 2016 2016 2013 20162010-2013
2013-2016 2015 2013 2016 2013 2016 2013 2016 2013 2016
2009-2011
2013-2015
2009-2011
2013-2015
United States 31% 32% 64% 63% 17% 17% 13% ** 51% 32% 18% 30% 29% 13.2% 14.1% ** 0.99 14% 13% 32% 32% 39% 29% ** 21% 16% ** 21% 20% 59% 56% *
Alabama 32 32 62 65 * 15 24 18 ** 49 32 19 23 23 13.7 14.6 ** 1.41 15 14 31 30 35 24 ** 22 19 * 21 20 59 54 *Alaska 37 36 67 67 16 17 12 ** 52 37 24 36 31 * 13.7 14.9 ** 1.09 12 12 30 31 51 40 ** 13 12 22 19 * 67 64 *Arizona 37 35 69 66 * 16 17 13 ** 55 31 22 35 30 * 13.1 13.9 ** 0.85 14 13 34 34 42 32 ** 20 16 ** 30 21 ** 59 59Arkansas 39 36 * 63 63 18 17 16 52 41 15 43 32 ** 14.1 15.2 ** 1.1 17 15 * 32 31 39 24 ** 24 16 ** 28 19 ** 58 55 *California 27 28 66 66 19 16 11 ** 58 39 16 31 35 * 13 13.7 * 0.97 16 15 36 36 41 31 ** 17 12 ** 21 18 * 64 61 *Colorado 31 32 58 59 17 16 12 ** 51 29 27 31 24 ** 12.9 14.2 ** 0.9 12 11 30 30 38 28 ** 17 15 * 23 22 55 57Connecticut 25 24 63 59 * 21 13 10 * 46 23 15 22 24 13 13.5 * 1.16 15 12 ** 35 35 41 32 ** 21 16 ** 25 22 * 58 53 *Delaware 25 28 * 57 61 * 21 16 11 ** 48 28 9 28 22 ** 12.2 13 ** 1.05 15 13 * 34 32 * 42 28 ** 17 13 ** 16 17 58 51 **District of Columbia 25 25 64 64 — 13 12 51 26 16 23 32 ** 12.4 13.6 ** 1.16 22 18 ** 42 43 40 26 ** 16 12 ** 24 25 65 59 **Florida 32 33 72 68 * 19 16 14 * 58 38 18 30 33 * 13.1 13.9 ** 1.1 17 15 * 37 36 35 26 ** 22 16 ** 20 18 * 63 62Georgia 28 34 ** 68 66 15 21 16 ** 51 28 34 30 23 ** 13.4 14.4 ** 1.17 16 14 * 34 33 39 27 ** 22 19 * 20 19 59 57Hawaii 30 26 * 57 63 ** 15 21 9 ** 50 31 23 34 25 ** 13.4 14.3 ** 0.32 15 14 31 31 45 34 ** 11 8 * 14 14 73 64 **Idaho 39 40 68 67 16 16 13 * 50 33 13 30 26 * 13.6 14.6 ** 0.64 12 10 * 30 29 37 27 ** 20 17 * 23 25 * 54 52Illinois 33 34 66 66 18 13 10 * 50 28 15 33 29 * 12.9 13.8 ** 0.82 14 13 33 32 39 30 ** 25 19 ** 22 21 58 53 *Indiana 37 37 67 64 * 18 17 13 ** 47 32 18 31 31 13.4 14.3 ** 1.12 13 11 * 31 31 41 30 ** 21 16 ** 23 25 * 57 55Iowa 29 31 56 55 15 12 9 * 42 30 7 22 27 * 13.4 15 ** 0.93 12 11 31 30 38 29 ** 20 15 ** 18 21 * 55 46 **Kansas 32 34 60 64 * 16 15 12 * 49 36 14 31 24 ** 13 14.7 ** 0.8 14 12 * 30 28 * 39 30 ** 22 20 * 30 23 ** 49 54 *Kentucky 35 33 62 63 14 23 17 ** 46 33 18 27 25 13.3 14.4 ** 1.07 14 13 31 30 36 25 ** 22 20 * 19 23 ** 55 51 *Louisiana 33 32 61 69 ** 17 24 21 * 51 32 25 31 33 13.3 13.8 * 1.43 14 13 28 27 40 29 ** 27 19 ** 23 20 * 65 58 **Maine 27 29 59 60 17 12 12 46 22 17 32 29 * 13.4 14.2 ** 0.8 11 11 28 29 38 30 ** 21 17 ** 16 19 * 47 41 **Maryland 25 29 * 58 58 16 15 12 * 42 26 11 24 26 12.8 13.7 ** 1.12 15 14 39 38 37 25 ** 16 14 * 20 20 57 60 *Massachusetts 21 26 ** 53 60 ** 16 9 9 42 22 13 21 15 ** 12.4 13 * 0.75 13 11 * 33 33 37 28 ** 22 18 ** 21 16 ** 49 46 *Michigan 29 31 67 66 15 14 12 * 50 33 7 30 30 13 13.9 ** 0.94 13 11 * 32 31 39 30 ** 15 13 * 23 20 * 60 54 **Minnesota 27 29 56 57 11 10 7 * 45 35 9 26 26 12.8 13.9 ** 0.78 12 11 29 29 43 33 ** 16 14 * 25 24 57 44 **Mississippi 37 36 65 66 15 22 19 * 49 41 22 25 30 * 13.4 14.8 ** 1.11 17 15 * 30 30 36 23 ** 25 20 ** 21 23 * 67 58 **Missouri 34 35 60 59 18 16 14 * 51 38 22 32 33 13.2 14.2 ** 1.06 13 13 33 33 38 28 ** 24 19 ** 27 25 * 56 52 *Montana 40 38 63 62 16 13 10 * 47 32 8 35 36 13.2 14.9 ** 0.93 15 13 * 33 29 ** 44 34 ** 18 15 * 24 18 ** 51 48 *Nebraska 34 35 57 57 19 13 10 * 45 35 20 21 19 13.3 14.9 ** 1.16 12 10 * 28 28 41 29 ** 23 19 ** 16 19 * 53 58 *Nevada 37 36 71 70 20 17 13 ** 66 38 26 39 28 ** 13.8 14.5 * 0.95 16 15 36 37 40 32 ** 21 16 ** 22 22 68 66New Hampshire 25 27 61 60 21 13 11 * 42 21 5 25 22 * 13.3 14 * 1.04 12 10 * 31 30 41 30 ** 21 17 ** 24 24 57 49 **New Jersey 31 31 66 63 * 19 15 10 ** 50 26 23 27 30 * 12.7 13.3 * 1.13 18 16 * 37 37 37 28 ** 16 12 ** 15 17 * 68 58 **New Mexico 37 40 * 64 62 20 18 13 ** 55 28 9 34 32 13.3 14.5 ** 1 16 15 34 34 41 32 ** 19 17 * 25 18 ** 55 57New York 28 31 * 65 62 * 21 12 9 * 48 31 17 28 28 13.1 13.9 ** 1.07 16 14 * 37 37 41 29 ** 19 14 ** 17 19 * 61 56 *North Carolina 29 28 56 58 13 20 15 ** 46 27 30 28 22 ** 13.7 14.5 ** 1.06 13 12 31 32 39 28 ** 16 14 * 22 24 * 59 50 **North Dakota 36 36 61 59 15 11 8 * 49 41 10 28 32 * 12.7 14.6 ** 0.79 18 15 ** 30 29 44 28 ** 19 17 * 17 21 ** 55 56Ohio 33 33 62 63 18 17 12 ** 48 32 15 38 32 ** 12.9 13.6 * 0.88 13 11 * 32 31 39 29 ** 23 18 ** 20 20 54 53Oklahoma 39 40 59 61 16 22 18 ** 55 36 11 37 33 * 13.2 14.5 ** 0.95 15 13 * 30 30 40 28 ** 23 20 * 18 22 ** 60 56 *Oregon 33 34 67 66 16 16 11 ** 49 33 10 33 42 ** 13.9 14.9 ** 0.8 14 11 ** 32 31 44 35 ** 18 16 * 26 25 56 51 *Pennsylvania 31 33 63 59 * 19 13 10 * 45 26 13 24 26 12.9 13.7 ** 0.94 14 12 * 33 32 37 27 ** 19 16 * 21 21 54 53Rhode Island 24 26 58 56 24 11 9 * 50 28 16 18 24 ** 13.2 13.1 1.07 14 13 33 32 37 28 ** 18 18 27 18 ** 47 49South Carolina 32 33 63 64 — 20 17 * 49 25 19 33 30 * 13.5 14.4 ** 1.1 14 12 * 31 31 36 27 ** 17 14 * 22 21 54 58 *South Dakota 32 34 53 54 13 10 8 * 46 39 17 26 30 * 13.1 14.6 ** 0.65 13 11 * 28 27 42 32 ** 19 16 * 17 20 * 53 54Tennessee 33 33 58 65 ** 13 21 16 ** 46 34 15 32 33 13.5 14.6 ** 0.9 15 14 32 32 37 26 ** 24 18 ** 16 20 ** 57 58Texas 34 37 * 66 65 15 19 16 * 59 36 24 28 31 * 13 13.9 ** 0.97 14 13 31 31 44 34 ** 27 18 ** 20 17 * 65 60 *Utah 32 33 65 65 15 18 13 ** 43 34 18 25 28 * 13.5 14.6 ** 0.82 10 10 30 32 * 34 25 ** 25 17 ** 23 23 57 56Vermont 27 30 * 58 60 19 11 9 * 40 20 16 33 23 ** 13.8 14.6 ** 1.13 12 9 ** 31 30 40 32 ** 20 17 * 24 21 * 45 44Virginia 28 29 59 59 14 17 13 ** 51 28 14 31 34 * 13.5 14.1 * 0.92 14 12 * 34 34 37 30 ** 20 16 ** 22 22 53 53Washington 31 32 61 62 13 16 12 ** 52 27 20 29 24 * 13.9 14.9 ** 0.87 13 12 34 34 44 30 ** 19 15 ** 26 24 * 53 56 *West Virginia 34 35 58 58 20 17 14 * 48 28 24 34 35 13.2 14.2 ** 0.74 15 13 * 33 32 37 24 ** 18 16 * 26 22 ** 48 54 **Wisconsin 29 28 65 65 14 11 9 * 48 31 9 27 21 ** 13.5 14.4 ** 0.77 11 10 29 28 41 30 ** 16 13 * 22 19 * 60 52 **Wyoming 39 40 68 67 22 13 12 48 34 7 30 37 ** 13 15.4 ** 0.67 12 12 31 29 * 42 34 ** 18 13 ** 17 21 ** 61 52 **
ChangeStates Improved 2 7 46 21 0 0 27 4 51 49 19 28States Worsened 8 7 0 14 50 0 0 1 0 0 15 6
q001a_0 q001a_1 q001b_0 q001b_1 q026_1 q014_0 q014_1 q003_1 q004_0 q005_0 q006_0 q006_1 q009_0 q009_1 q022_1 q010_0 q010_1 q011_0 q011_1 q017_0 q017_1 q020_0 q020_1 q024_0 q024_1 q025_0 q025_1Notes: * Denotes a change of at least 0.5 standard deviations. ** Denotes a change of 1.0 standard deviation or more. — Indicates that estimates are not available.
Children without both a
medical and dental
preventive care visit
Children who did not receive
needed mental health treatment
Children ages 19–35 months who did not
receive all recommended
vaccinesHospital 30-day
mortality
Central line-associated
bloodstream infection (CLABSI)
Adults without all age- and gender-
appropriate cancer screenings
Adults without all age-appropriate recommended
vaccinesMedicare beneficiaries
received a high-risk drug
Adults with any mental illness who did not receive treatment
Diabetic adults ages 18–64 without a
hemoglobin A1c test
Children without all
components of a medical
home
Hospital patients discharged without
instructions for home recovery
Home health patients who did not get better at walking or moving
around
Nursing home residents with an
antipsychotic medication
Adults with any mental illness reporting
unmet need
Hospital patients who did not receive patient-
centered care
Appendix D2. Prevention & Treatment: Dimension Ranking and Indicator Rates
2012 2016 2013 2016 2015 2012 2014 2016 2016 2016 2013 20162010-2013
2013-2016 2015 2013 2016 2013 2016 2013 2016 2013 2016
2009-2011
2013-2015
2009-2011
2013-2015
United States 31% 32% 64% 63% 17% 17% 13% ** 51% 32% 18% 30% 29% 13.2% 14.1% ** 0.99 14% 13% 32% 32% 39% 29% ** 21% 16% ** 21% 20% 59% 56% *
Alabama 32 32 62 65 * 15 24 18 ** 49 32 19 23 23 13.7 14.6 ** 1.41 15 14 31 30 35 24 ** 22 19 * 21 20 59 54 *Alaska 37 36 67 67 16 17 12 ** 52 37 24 36 31 * 13.7 14.9 ** 1.09 12 12 30 31 51 40 ** 13 12 22 19 * 67 64 *Arizona 37 35 69 66 * 16 17 13 ** 55 31 22 35 30 * 13.1 13.9 ** 0.85 14 13 34 34 42 32 ** 20 16 ** 30 21 ** 59 59Arkansas 39 36 * 63 63 18 17 16 52 41 15 43 32 ** 14.1 15.2 ** 1.1 17 15 * 32 31 39 24 ** 24 16 ** 28 19 ** 58 55 *California 27 28 66 66 19 16 11 ** 58 39 16 31 35 * 13 13.7 * 0.97 16 15 36 36 41 31 ** 17 12 ** 21 18 * 64 61 *Colorado 31 32 58 59 17 16 12 ** 51 29 27 31 24 ** 12.9 14.2 ** 0.9 12 11 30 30 38 28 ** 17 15 * 23 22 55 57Connecticut 25 24 63 59 * 21 13 10 * 46 23 15 22 24 13 13.5 * 1.16 15 12 ** 35 35 41 32 ** 21 16 ** 25 22 * 58 53 *Delaware 25 28 * 57 61 * 21 16 11 ** 48 28 9 28 22 ** 12.2 13 ** 1.05 15 13 * 34 32 * 42 28 ** 17 13 ** 16 17 58 51 **District of Columbia 25 25 64 64 — 13 12 51 26 16 23 32 ** 12.4 13.6 ** 1.16 22 18 ** 42 43 40 26 ** 16 12 ** 24 25 65 59 **Florida 32 33 72 68 * 19 16 14 * 58 38 18 30 33 * 13.1 13.9 ** 1.1 17 15 * 37 36 35 26 ** 22 16 ** 20 18 * 63 62Georgia 28 34 ** 68 66 15 21 16 ** 51 28 34 30 23 ** 13.4 14.4 ** 1.17 16 14 * 34 33 39 27 ** 22 19 * 20 19 59 57Hawaii 30 26 * 57 63 ** 15 21 9 ** 50 31 23 34 25 ** 13.4 14.3 ** 0.32 15 14 31 31 45 34 ** 11 8 * 14 14 73 64 **Idaho 39 40 68 67 16 16 13 * 50 33 13 30 26 * 13.6 14.6 ** 0.64 12 10 * 30 29 37 27 ** 20 17 * 23 25 * 54 52Illinois 33 34 66 66 18 13 10 * 50 28 15 33 29 * 12.9 13.8 ** 0.82 14 13 33 32 39 30 ** 25 19 ** 22 21 58 53 *Indiana 37 37 67 64 * 18 17 13 ** 47 32 18 31 31 13.4 14.3 ** 1.12 13 11 * 31 31 41 30 ** 21 16 ** 23 25 * 57 55Iowa 29 31 56 55 15 12 9 * 42 30 7 22 27 * 13.4 15 ** 0.93 12 11 31 30 38 29 ** 20 15 ** 18 21 * 55 46 **Kansas 32 34 60 64 * 16 15 12 * 49 36 14 31 24 ** 13 14.7 ** 0.8 14 12 * 30 28 * 39 30 ** 22 20 * 30 23 ** 49 54 *Kentucky 35 33 62 63 14 23 17 ** 46 33 18 27 25 13.3 14.4 ** 1.07 14 13 31 30 36 25 ** 22 20 * 19 23 ** 55 51 *Louisiana 33 32 61 69 ** 17 24 21 * 51 32 25 31 33 13.3 13.8 * 1.43 14 13 28 27 40 29 ** 27 19 ** 23 20 * 65 58 **Maine 27 29 59 60 17 12 12 46 22 17 32 29 * 13.4 14.2 ** 0.8 11 11 28 29 38 30 ** 21 17 ** 16 19 * 47 41 **Maryland 25 29 * 58 58 16 15 12 * 42 26 11 24 26 12.8 13.7 ** 1.12 15 14 39 38 37 25 ** 16 14 * 20 20 57 60 *Massachusetts 21 26 ** 53 60 ** 16 9 9 42 22 13 21 15 ** 12.4 13 * 0.75 13 11 * 33 33 37 28 ** 22 18 ** 21 16 ** 49 46 *Michigan 29 31 67 66 15 14 12 * 50 33 7 30 30 13 13.9 ** 0.94 13 11 * 32 31 39 30 ** 15 13 * 23 20 * 60 54 **Minnesota 27 29 56 57 11 10 7 * 45 35 9 26 26 12.8 13.9 ** 0.78 12 11 29 29 43 33 ** 16 14 * 25 24 57 44 **Mississippi 37 36 65 66 15 22 19 * 49 41 22 25 30 * 13.4 14.8 ** 1.11 17 15 * 30 30 36 23 ** 25 20 ** 21 23 * 67 58 **Missouri 34 35 60 59 18 16 14 * 51 38 22 32 33 13.2 14.2 ** 1.06 13 13 33 33 38 28 ** 24 19 ** 27 25 * 56 52 *Montana 40 38 63 62 16 13 10 * 47 32 8 35 36 13.2 14.9 ** 0.93 15 13 * 33 29 ** 44 34 ** 18 15 * 24 18 ** 51 48 *Nebraska 34 35 57 57 19 13 10 * 45 35 20 21 19 13.3 14.9 ** 1.16 12 10 * 28 28 41 29 ** 23 19 ** 16 19 * 53 58 *Nevada 37 36 71 70 20 17 13 ** 66 38 26 39 28 ** 13.8 14.5 * 0.95 16 15 36 37 40 32 ** 21 16 ** 22 22 68 66New Hampshire 25 27 61 60 21 13 11 * 42 21 5 25 22 * 13.3 14 * 1.04 12 10 * 31 30 41 30 ** 21 17 ** 24 24 57 49 **New Jersey 31 31 66 63 * 19 15 10 ** 50 26 23 27 30 * 12.7 13.3 * 1.13 18 16 * 37 37 37 28 ** 16 12 ** 15 17 * 68 58 **New Mexico 37 40 * 64 62 20 18 13 ** 55 28 9 34 32 13.3 14.5 ** 1 16 15 34 34 41 32 ** 19 17 * 25 18 ** 55 57New York 28 31 * 65 62 * 21 12 9 * 48 31 17 28 28 13.1 13.9 ** 1.07 16 14 * 37 37 41 29 ** 19 14 ** 17 19 * 61 56 *North Carolina 29 28 56 58 13 20 15 ** 46 27 30 28 22 ** 13.7 14.5 ** 1.06 13 12 31 32 39 28 ** 16 14 * 22 24 * 59 50 **North Dakota 36 36 61 59 15 11 8 * 49 41 10 28 32 * 12.7 14.6 ** 0.79 18 15 ** 30 29 44 28 ** 19 17 * 17 21 ** 55 56Ohio 33 33 62 63 18 17 12 ** 48 32 15 38 32 ** 12.9 13.6 * 0.88 13 11 * 32 31 39 29 ** 23 18 ** 20 20 54 53Oklahoma 39 40 59 61 16 22 18 ** 55 36 11 37 33 * 13.2 14.5 ** 0.95 15 13 * 30 30 40 28 ** 23 20 * 18 22 ** 60 56 *Oregon 33 34 67 66 16 16 11 ** 49 33 10 33 42 ** 13.9 14.9 ** 0.8 14 11 ** 32 31 44 35 ** 18 16 * 26 25 56 51 *Pennsylvania 31 33 63 59 * 19 13 10 * 45 26 13 24 26 12.9 13.7 ** 0.94 14 12 * 33 32 37 27 ** 19 16 * 21 21 54 53Rhode Island 24 26 58 56 24 11 9 * 50 28 16 18 24 ** 13.2 13.1 1.07 14 13 33 32 37 28 ** 18 18 27 18 ** 47 49South Carolina 32 33 63 64 — 20 17 * 49 25 19 33 30 * 13.5 14.4 ** 1.1 14 12 * 31 31 36 27 ** 17 14 * 22 21 54 58 *South Dakota 32 34 53 54 13 10 8 * 46 39 17 26 30 * 13.1 14.6 ** 0.65 13 11 * 28 27 42 32 ** 19 16 * 17 20 * 53 54Tennessee 33 33 58 65 ** 13 21 16 ** 46 34 15 32 33 13.5 14.6 ** 0.9 15 14 32 32 37 26 ** 24 18 ** 16 20 ** 57 58Texas 34 37 * 66 65 15 19 16 * 59 36 24 28 31 * 13 13.9 ** 0.97 14 13 31 31 44 34 ** 27 18 ** 20 17 * 65 60 *Utah 32 33 65 65 15 18 13 ** 43 34 18 25 28 * 13.5 14.6 ** 0.82 10 10 30 32 * 34 25 ** 25 17 ** 23 23 57 56Vermont 27 30 * 58 60 19 11 9 * 40 20 16 33 23 ** 13.8 14.6 ** 1.13 12 9 ** 31 30 40 32 ** 20 17 * 24 21 * 45 44Virginia 28 29 59 59 14 17 13 ** 51 28 14 31 34 * 13.5 14.1 * 0.92 14 12 * 34 34 37 30 ** 20 16 ** 22 22 53 53Washington 31 32 61 62 13 16 12 ** 52 27 20 29 24 * 13.9 14.9 ** 0.87 13 12 34 34 44 30 ** 19 15 ** 26 24 * 53 56 *West Virginia 34 35 58 58 20 17 14 * 48 28 24 34 35 13.2 14.2 ** 0.74 15 13 * 33 32 37 24 ** 18 16 * 26 22 ** 48 54 **Wisconsin 29 28 65 65 14 11 9 * 48 31 9 27 21 ** 13.5 14.4 ** 0.77 11 10 29 28 41 30 ** 16 13 * 22 19 * 60 52 **Wyoming 39 40 68 67 22 13 12 48 34 7 30 37 ** 13 15.4 ** 0.67 12 12 31 29 * 42 34 ** 18 13 ** 17 21 ** 61 52 **
ChangeStates Improved 2 7 46 21 0 0 27 4 51 49 19 28States Worsened 8 7 0 14 50 0 0 1 0 0 15 6
q001a_0 q001a_1 q001b_0 q001b_1 q026_1 q014_0 q014_1 q003_1 q004_0 q005_0 q006_0 q006_1 q009_0 q009_1 q022_1 q010_0 q010_1 q011_0 q011_1 q017_0 q017_1 q020_0 q020_1 q024_0 q024_1 q025_0 q025_1Notes: * Denotes a change of at least 0.5 standard deviations. ** Denotes a change of 1.0 standard deviation or more. — Indicates that estimates are not available.
Children without both a
medical and dental
preventive care visit
Children who did not receive
needed mental health treatment
Children ages 19–35 months who did not
receive all recommended
vaccinesHospital 30-day
mortality
Central line-associated
bloodstream infection (CLABSI)
Adults without all age- and gender-
appropriate cancer screenings
Adults without all age-appropriate recommended
vaccinesMedicare beneficiaries
received a high-risk drug
Adults with any mental illness who did not receive treatment
Diabetic adults ages 18–64 without a
hemoglobin A1c test
Children without all
components of a medical
home
Hospital patients discharged without
instructions for home recovery
Home health patients who did not get better at walking or moving
around
Nursing home residents with an
antipsychotic medication
Adults with any mental illness reporting
unmet need
Hospital patients who did not receive patient-
centered care
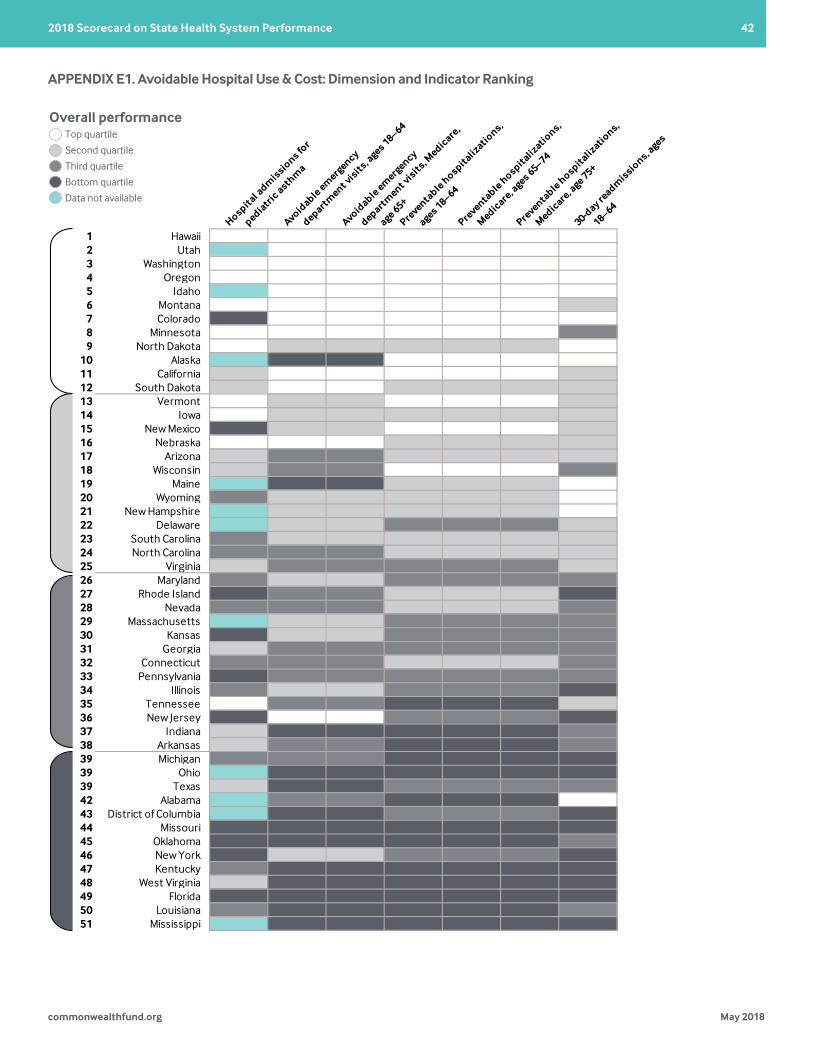
commonwealthfund.org May 2018
2018 Scorecard on State Health System Performance 42
Appendix E1. Avoidable Hospital Use & Cost: Dimension and Indicator Ranking
Hospital a
dmissio
ns for
pediatric asth
ma
Avoidable em
ergency
department v
isits, a
ges 18–64
Avoidable em
ergency
department v
isits, M
edicare,
age 65+
Preventa
ble hospitaliz
ations,
ages 18–64
Preventa
ble hospitaliz
ations,
Medicare, a
ges 65–74
Preventa
ble hospitaliz
ations,
Medicare, a
ge 75+
30-day re
admissio
ns, ages
18–64
30-day re
admissio
ns, Medicare
,
age 65+
Skilled nurs
ing fa
cility
patients
with a hospita
l readm
ission
Nursin
g home re
sidents
with
a
hospital a
dmissio
n
Home health
patients
with
a
hospital a
dmissio
n
Adults w
ith in
appropria
te
lower b
ack imagin
g
Emplo
yer-sponsore
d
insura
nce spending per
enrolle
e
Medicare spendin
g per
beneficiary
state rank1 Hawaii 1 1 1 1 1 1 1 1 1 1 1 1 1 1
2 Utah 0 1 1 1 1 1 1 1 1 1 1 2 2 2
3 Washington 1 1 1 1 1 1 1 1 1 1 1 1 2 1
4 Oregon 1 1 1 1 1 1 1 1 1 1 1 1 3 1
5 Idaho 0 1 1 1 1 1 1 1 1 1 1 1 4 1
6 Montana 1 1 1 1 1 1 2 2 1 1 1 1 3 1
7 Colorado 4 1 1 1 1 1 1 1 1 1 1 2 3 1
8 Minnesota 1 1 1 1 1 1 3 3 1 1 3 1 3 1
9 North Dakota 1 2 2 2 2 2 1 1 1 2 3 1 2 2
10 Alaska 0 4 4 1 1 1 1 1 1 1 1 2 4 1
11 California 2 1 1 1 1 1 2 2 3 3 1 2 3 2
12 South Dakota 2 1 1 2 2 2 2 2 1 2 4 1 4 1
13 Vermont 1 2 2 1 1 1 2 2 1 2 4 1 4 1
14 Iowa 1 2 2 2 2 2 2 2 1 2 4 1 1 2
15 New Mexico 4 2 2 1 1 1 2 2 2 2 1 2 3 1
16 Nebraska 1 1 1 2 2 2 2 2 1 2 2 1 3 2
17 Arizona 2 3 3 2 2 2 2 2 2 1 1 3 2 2
18 Wisconsin 2 3 3 1 1 1 3 3 1 1 2 2 4 2
19 Maine 0 4 4 2 2 2 1 1 1 1 3 1 3 2
20 Wyoming 3 2 2 2 2 2 1 1 1 2 3 2 4 1
21 New Hampshire 0 2 2 2 2 2 1 1 2 2 4 2 4 2
22 Delaware 0 2 2 3 3 3 2 2 3 2 2 2 2 3
23 South Carolina 3 2 2 2 2 2 2 2 3 3 3 0 0 2
24 North Carolina 3 3 3 2 2 2 2 2 2 2 2 4 3 2
25 Virginia 2 3 3 3 3 3 2 2 3 3 3 4 2 2
26 Maryland 3 2 2 3 3 3 3 3 3 2 2 4 1 3
27 Rhode Island 4 3 3 2 2 2 4 4 3 1 2 3 1 3
28 Nevada 3 3 3 2 2 2 3 3 4 3 2 3 2 2
29 Massachusetts 0 2 2 3 3 3 3 3 2 2 4 2 2 3
30 Kansas 4 2 2 3 3 3 3 3 2 3 4 2 2 3
31 Georgia 2 3 3 3 3 3 3 3 3 3 3 4 2 3
32 Connecticut 3 3 3 2 2 2 3 3 2 2 4 3 4 4
33 Pennsylvania 4 3 3 3 3 3 3 3 2 2 4 2 1 4
34 Illinois 3 2 2 3 3 3 4 4 3 4 2 3 3 3
35 Tennessee 1 3 3 4 4 4 2 2 2 3 4 4 1 4
36 New Jersey 4 1 1 3 3 3 4 4 4 4 3 3 3 4
37 Indiana 2 4 4 4 4 4 3 3 2 3 2 3 4 4
38 Arkansas 2 3 3 4 4 4 3 3 4 4 4 3 1 3
39 Michigan 3 3 3 4 4 4 4 4 4 3 2 3 1 4
39 Ohio 0 4 4 4 4 4 4 4 3 2 2 3 3 3
39 Texas 2 4 4 3 3 3 3 3 3 4 1 4 4 4
42 Alabama 0 3 3 4 4 4 1 1 3 3 4 4 1 4
43 District of Columbia 0 4 4 3 3 3 4 4 2 3 2 0 0 3
44 Missouri 4 4 4 4 4 4 4 4 3 3 3 2 1 3
45 Oklahoma 4 4 4 4 4 4 3 3 4 4 2 3 2 4
46 New York 4 2 2 3 3 3 4 4 4 2 3 3 4 3
47 Kentucky 3 4 4 4 4 4 4 4 3 4 4 3 1 4
48 West Virginia 2 4 4 4 4 4 4 4 3 3 3 4 4 3
49 Florida 4 4 4 4 4 4 4 4 4 4 1 4 3 4
50 Louisiana 3 4 4 4 4 4 3 3 4 4 3 4 2 4
51 Mississippi 0 4 4 4 4 4 4 4 4 4 4 4 1 4
APPENDIX E1. Avoidable Hospital Use & Cost: Dimension and Indicator Ranking
Overall performanceTop quartileSecond quartileThird quartileBottom quartileData not available

commonwealthfund.org May 2018
2018 Scorecard on State Health System Performance 43
APPENDIX E1. Avoidable Hospital Use & Cost: Dimension and Indicator Ranking (continued)Appendix E1. Avoidable Hospital Use & Cost: Dimension and Indicator Ranking
Hospital a
dmissio
ns for
pediatric asth
ma
Avoidable em
ergency
department v
isits, a
ges 18–64
Avoidable em
ergency
department v
isits, M
edicare,
age 65+
Preventa
ble hospitaliz
ations,
ages 18–64
Preventa
ble hospitaliz
ations,
Medicare, a
ges 65–74
Preventa
ble hospitaliz
ations,
Medicare, a
ge 75+
30-day re
admissio
ns, ages
18–64
30-day re
admissio
ns, Medicare
,
age 65+
Skilled nurs
ing fa
cility
patients
with a hospita
l readm
ission
Nursin
g home re
sidents
with
a
hospital a
dmissio
n
Home health
patients
with
a
hospital a
dmissio
n
Adults w
ith in
appropria
te
lower b
ack imagin
g
Emplo
yer-sponsore
d
insura
nce spending per
enrolle
e
Medicare spendin
g per
beneficiary
state rank1 Hawaii 1 1 1 1 1 1 1 1 1 1 1 1 1 1
2 Utah 0 1 1 1 1 1 1 1 1 1 1 2 2 2
3 Washington 1 1 1 1 1 1 1 1 1 1 1 1 2 1
4 Oregon 1 1 1 1 1 1 1 1 1 1 1 1 3 1
5 Idaho 0 1 1 1 1 1 1 1 1 1 1 1 4 1
6 Montana 1 1 1 1 1 1 2 2 1 1 1 1 3 1
7 Colorado 4 1 1 1 1 1 1 1 1 1 1 2 3 1
8 Minnesota 1 1 1 1 1 1 3 3 1 1 3 1 3 1
9 North Dakota 1 2 2 2 2 2 1 1 1 2 3 1 2 2
10 Alaska 0 4 4 1 1 1 1 1 1 1 1 2 4 1
11 California 2 1 1 1 1 1 2 2 3 3 1 2 3 2
12 South Dakota 2 1 1 2 2 2 2 2 1 2 4 1 4 1
13 Vermont 1 2 2 1 1 1 2 2 1 2 4 1 4 1
14 Iowa 1 2 2 2 2 2 2 2 1 2 4 1 1 2
15 New Mexico 4 2 2 1 1 1 2 2 2 2 1 2 3 1
16 Nebraska 1 1 1 2 2 2 2 2 1 2 2 1 3 2
17 Arizona 2 3 3 2 2 2 2 2 2 1 1 3 2 2
18 Wisconsin 2 3 3 1 1 1 3 3 1 1 2 2 4 2
19 Maine 0 4 4 2 2 2 1 1 1 1 3 1 3 2
20 Wyoming 3 2 2 2 2 2 1 1 1 2 3 2 4 1
21 New Hampshire 0 2 2 2 2 2 1 1 2 2 4 2 4 2
22 Delaware 0 2 2 3 3 3 2 2 3 2 2 2 2 3
23 South Carolina 3 2 2 2 2 2 2 2 3 3 3 0 0 2
24 North Carolina 3 3 3 2 2 2 2 2 2 2 2 4 3 2
25 Virginia 2 3 3 3 3 3 2 2 3 3 3 4 2 2
26 Maryland 3 2 2 3 3 3 3 3 3 2 2 4 1 3
27 Rhode Island 4 3 3 2 2 2 4 4 3 1 2 3 1 3
28 Nevada 3 3 3 2 2 2 3 3 4 3 2 3 2 2
29 Massachusetts 0 2 2 3 3 3 3 3 2 2 4 2 2 3
30 Kansas 4 2 2 3 3 3 3 3 2 3 4 2 2 3
31 Georgia 2 3 3 3 3 3 3 3 3 3 3 4 2 3
32 Connecticut 3 3 3 2 2 2 3 3 2 2 4 3 4 4
33 Pennsylvania 4 3 3 3 3 3 3 3 2 2 4 2 1 4
34 Illinois 3 2 2 3 3 3 4 4 3 4 2 3 3 3
35 Tennessee 1 3 3 4 4 4 2 2 2 3 4 4 1 4
36 New Jersey 4 1 1 3 3 3 4 4 4 4 3 3 3 4
37 Indiana 2 4 4 4 4 4 3 3 2 3 2 3 4 4
38 Arkansas 2 3 3 4 4 4 3 3 4 4 4 3 1 3
39 Michigan 3 3 3 4 4 4 4 4 4 3 2 3 1 4
39 Ohio 0 4 4 4 4 4 4 4 3 2 2 3 3 3
39 Texas 2 4 4 3 3 3 3 3 3 4 1 4 4 4
42 Alabama 0 3 3 4 4 4 1 1 3 3 4 4 1 4
43 District of Columbia 0 4 4 3 3 3 4 4 2 3 2 0 0 3
44 Missouri 4 4 4 4 4 4 4 4 3 3 3 2 1 3
45 Oklahoma 4 4 4 4 4 4 3 3 4 4 2 3 2 4
46 New York 4 2 2 3 3 3 4 4 4 2 3 3 4 3
47 Kentucky 3 4 4 4 4 4 4 4 3 4 4 3 1 4
48 West Virginia 2 4 4 4 4 4 4 4 3 3 3 4 4 3
49 Florida 4 4 4 4 4 4 4 4 4 4 1 4 3 4
50 Louisiana 3 4 4 4 4 4 3 3 4 4 3 4 2 4
51 Mississippi 0 4 4 4 4 4 4 4 4 4 4 4 1 4
Appendix E1. Avoidable Hospital Use & Cost: Dimension and Indicator Ranking
Hospital a
dmissio
ns for
pediatric asth
ma
Avoidable em
ergency
department v
isits, a
ges 18–64
Avoidable em
ergency
department v
isits, M
edicare,
age 65+
Preventa
ble hospitaliz
ations,
ages 18–64
Preventa
ble hospitaliz
ations,
Medicare, a
ges 65–74
Preventa
ble hospitaliz
ations,
Medicare, a
ge 75+
30-day re
admissio
ns, ages
18–64
30-day re
admissio
ns, Medicare
,
age 65+
Skilled nurs
ing fa
cility
patients
with a hospita
l readm
ission
Nursin
g home re
sidents
with
a
hospital a
dmissio
n
Home health
patients
with
a
hospital a
dmissio
n
Adults w
ith in
appropria
te
lower b
ack imagin
g
Emplo
yer-sponsore
d
insura
nce spending per
enrolle
e
Medicare spendin
g per
beneficiary
state rank1 Hawaii 1 1 1 1 1 1 1 1 1 1 1 1 1 1
2 Utah 0 1 1 1 1 1 1 1 1 1 1 2 2 2
3 Washington 1 1 1 1 1 1 1 1 1 1 1 1 2 1
4 Oregon 1 1 1 1 1 1 1 1 1 1 1 1 3 1
5 Idaho 0 1 1 1 1 1 1 1 1 1 1 1 4 1
6 Montana 1 1 1 1 1 1 2 2 1 1 1 1 3 1
7 Colorado 4 1 1 1 1 1 1 1 1 1 1 2 3 1
8 Minnesota 1 1 1 1 1 1 3 3 1 1 3 1 3 1
9 North Dakota 1 2 2 2 2 2 1 1 1 2 3 1 2 2
10 Alaska 0 4 4 1 1 1 1 1 1 1 1 2 4 1
11 California 2 1 1 1 1 1 2 2 3 3 1 2 3 2
12 South Dakota 2 1 1 2 2 2 2 2 1 2 4 1 4 1
13 Vermont 1 2 2 1 1 1 2 2 1 2 4 1 4 1
14 Iowa 1 2 2 2 2 2 2 2 1 2 4 1 1 2
15 New Mexico 4 2 2 1 1 1 2 2 2 2 1 2 3 1
16 Nebraska 1 1 1 2 2 2 2 2 1 2 2 1 3 2
17 Arizona 2 3 3 2 2 2 2 2 2 1 1 3 2 2
18 Wisconsin 2 3 3 1 1 1 3 3 1 1 2 2 4 2
19 Maine 0 4 4 2 2 2 1 1 1 1 3 1 3 2
20 Wyoming 3 2 2 2 2 2 1 1 1 2 3 2 4 1
21 New Hampshire 0 2 2 2 2 2 1 1 2 2 4 2 4 2
22 Delaware 0 2 2 3 3 3 2 2 3 2 2 2 2 3
23 South Carolina 3 2 2 2 2 2 2 2 3 3 3 0 0 2
24 North Carolina 3 3 3 2 2 2 2 2 2 2 2 4 3 2
25 Virginia 2 3 3 3 3 3 2 2 3 3 3 4 2 2
26 Maryland 3 2 2 3 3 3 3 3 3 2 2 4 1 3
27 Rhode Island 4 3 3 2 2 2 4 4 3 1 2 3 1 3
28 Nevada 3 3 3 2 2 2 3 3 4 3 2 3 2 2
29 Massachusetts 0 2 2 3 3 3 3 3 2 2 4 2 2 3
30 Kansas 4 2 2 3 3 3 3 3 2 3 4 2 2 3
31 Georgia 2 3 3 3 3 3 3 3 3 3 3 4 2 3
32 Connecticut 3 3 3 2 2 2 3 3 2 2 4 3 4 4
33 Pennsylvania 4 3 3 3 3 3 3 3 2 2 4 2 1 4
34 Illinois 3 2 2 3 3 3 4 4 3 4 2 3 3 3
35 Tennessee 1 3 3 4 4 4 2 2 2 3 4 4 1 4
36 New Jersey 4 1 1 3 3 3 4 4 4 4 3 3 3 4
37 Indiana 2 4 4 4 4 4 3 3 2 3 2 3 4 4
38 Arkansas 2 3 3 4 4 4 3 3 4 4 4 3 1 3
39 Michigan 3 3 3 4 4 4 4 4 4 3 2 3 1 4
39 Ohio 0 4 4 4 4 4 4 4 3 2 2 3 3 3
39 Texas 2 4 4 3 3 3 3 3 3 4 1 4 4 4
42 Alabama 0 3 3 4 4 4 1 1 3 3 4 4 1 4
43 District of Columbia 0 4 4 3 3 3 4 4 2 3 2 0 0 3
44 Missouri 4 4 4 4 4 4 4 4 3 3 3 2 1 3
45 Oklahoma 4 4 4 4 4 4 3 3 4 4 2 3 2 4
46 New York 4 2 2 3 3 3 4 4 4 2 3 3 4 3
47 Kentucky 3 4 4 4 4 4 4 4 3 4 4 3 1 4
48 West Virginia 2 4 4 4 4 4 4 4 3 3 3 4 4 3
49 Florida 4 4 4 4 4 4 4 4 4 4 1 4 3 4
50 Louisiana 3 4 4 4 4 4 3 3 4 4 3 4 2 4
51 Mississippi 0 4 4 4 4 4 4 4 4 4 4 4 1 4
Overall performanceTop quartileSecond quartileThird quartileBottom quartileData not available
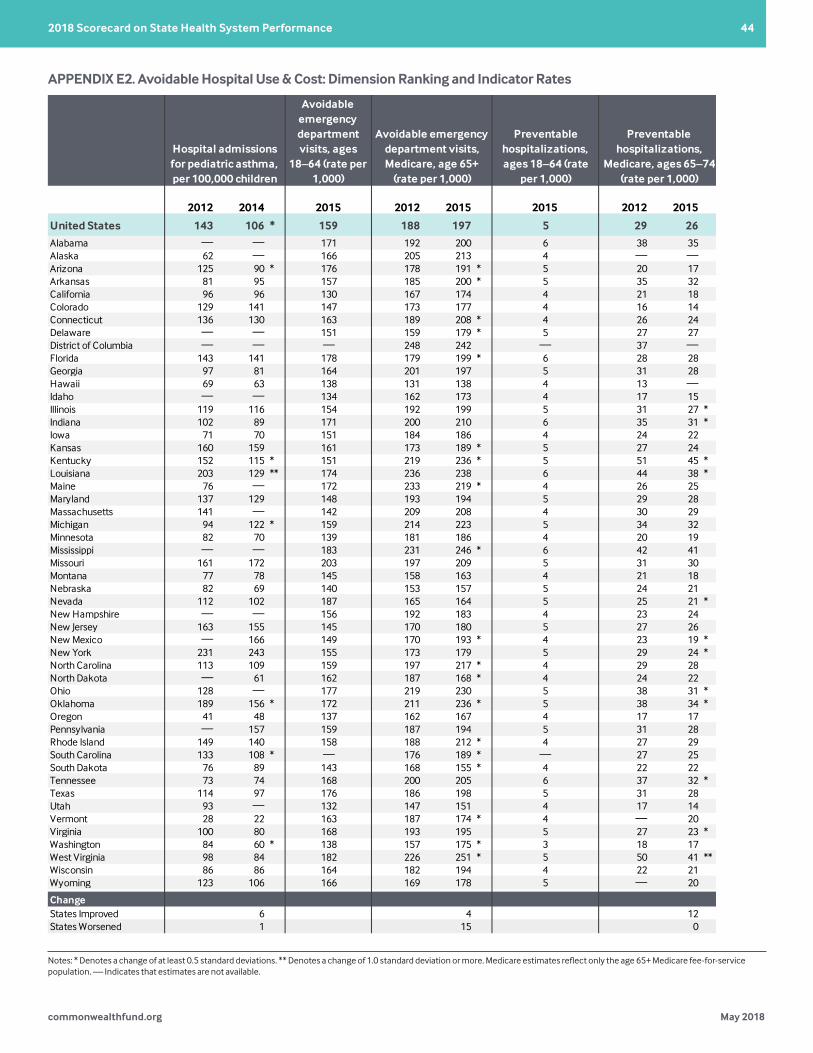
commonwealthfund.org May 2018
2018 Scorecard on State Health System Performance 44
Appendix E2. Avoidable Hospital Use & Cost: Dimension Ranking and Indicator Rates
2012 2014 2015 2012 2015 2015 2012 2015 2012 2015 2015 2012 2015 2012 2014 2012 2014 2013 2016 2015 2013 2015 2012 2015
United States 143 106 * 159 188 197 5 29 26 70 66 2.9 49 42 * 20% 19% 17% 16% 16.0% 16.4% 29% $4,697 $4,736 $8,854 $9,025
Alabama — — 171 192 200 6 38 35 82 76 1.2 50 45 22 20 * 21 19 17.0 18.0 * 41 3,706 3,706 9,344 9,623Alaska 62 — 166 205 213 4 — — 52 48 2.6 29 25 — 11 — 11 14.0 14.4 25 7,186 8,902 ** 5,399 6,318 *Arizona 125 90 * 176 178 191 * 5 20 17 51 47 3.32 38 32 * 20 19 9 8 15.0 14.6 32 4,453 4,509 7,998 8,168Arkansas 81 95 157 185 200 * 5 35 32 83 78 2.99 51 44 * 25 23 * 26 24 17.0 18.4 ** 32 3,117 3,609 * 8,619 9,022California 96 96 130 167 174 4 21 18 55 52 2.39 43 37 * 22 20 * 20 19 15.0 14.9 25 4,915 5,151 8,310 8,295Colorado 129 141 147 173 177 4 16 14 50 45 2.29 31 27 16 14 * 10 9 14.0 15.3 ** 26 4,625 4,811 7,460 7,635Connecticut 136 130 163 189 208 * 4 26 24 75 70 2.4 52 46 * 20 19 16 14 16.0 17.4 ** 33 5,067 5,358 8,936 9,335Delaware — — 151 159 179 * 5 27 27 68 65 2.68 42 39 20 20 19 16 * 16.0 16.5 * 28 4,509 4,643 8,514 8,980District of Columbia — — — 248 242 — 37 — — 65 — 65 50 ** — 19 — 19 18.0 16.0 ** — 3,548 — 8,887 8,838Florida 143 141 178 179 199 * 6 28 28 68 71 3.87 54 51 22 22 23 22 15.0 15.9 * 35 4,748 5,050 10,597 10,638Georgia 97 81 164 201 197 5 31 28 73 68 2.94 46 40 * 21 20 19 17 16.0 16.9 * 35 4,951 4,507 * 8,743 8,974Hawaii 69 63 138 131 138 4 13 — 41 33 * 2.81 26 21 — 12 — 5 14.0 14.4 23 3,460 3,667 5,408 5,586Idaho — — 134 162 173 4 17 15 45 42 2.49 26 24 14 14 11 12 14.0 15.2 ** 22 4,906 5,243 7,198 7,589Illinois 119 116 154 192 199 5 31 27 * 73 73 3.22 59 48 ** 23 20 * 22 20 16.0 16.3 30 4,575 4,847 9,219 9,211Indiana 102 89 171 200 210 6 35 31 * 77 72 3.13 51 43 * 20 18 * 19 17 16.0 16.6 * 32 4,955 5,317 9,045 9,291Iowa 71 70 151 184 186 4 24 22 64 60 2.68 39 35 17 16 15 15 16.0 17.2 ** 23 3,784 4,118 7,496 7,905Kansas 160 159 161 173 189 * 5 27 24 71 67 2.85 43 39 19 18 20 19 17.0 17.7 * 25 4,079 4,362 8,586 9,034Kentucky 152 115 * 151 219 236 * 5 51 45 * 100 93 * 3.02 63 54 * 22 20 * 24 21 * 18.0 17.7 33 4,393 4,033 9,167 9,351Louisiana 203 129 ** 174 236 238 6 44 38 * 97 88 * 2.98 56 47 * 26 25 30 27 * 16.0 16.9 * 39 4,404 4,452 10,868 10,851Maine 76 — 172 233 219 * 4 26 25 65 64 2.14 39 37 17 16 12 12 16.0 17.1 ** 23 4,661 4,868 7,606 8,083Maryland 137 129 148 193 194 5 29 28 69 65 2.63 54 43 ** 22 20 * 17 16 17.0 16.3 * 34 3,683 3,848 8,472 8,927Massachusetts 141 — 142 209 208 4 30 29 80 79 2.75 54 50 19 19 14 13 16.0 17.6 ** 27 4,659 4,648 9,041 9,158Michigan 94 122 * 159 214 223 5 34 32 73 74 3.36 61 55 * 23 21 * 18 17 16.0 16.4 33 3,903 3,818 9,565 9,714Minnesota 82 70 139 181 186 4 20 19 55 52 3.13 41 37 17 16 7 7 16.0 16.9 * 21 4,483 4,726 7,225 7,791Mississippi — — 183 231 246 * 6 42 41 91 91 2.88 56 50 * 24 22 * 29 28 17.0 18.2 ** 37 3,982 3,347 * 10,046 10,352Missouri 161 172 203 197 209 5 31 30 73 69 3.47 51 46 22 20 * 20 19 16.0 17.0 * 29 4,266 4,187 8,698 8,976Montana 77 78 145 158 163 4 21 18 — 53 3.28 30 27 13 13 12 12 15.0 15.4 23 4,553 4,858 6,585 7,004Nebraska 82 69 140 153 157 5 24 21 63 61 2.98 39 35 16 15 16 16 16.0 16.5 * 24 4,507 4,972 * 8,062 8,654 *Nevada 112 102 187 165 164 5 25 21 * 60 55 3.63 41 37 23 22 20 19 15.0 16.1 ** 32 4,022 4,400 8,328 8,488New Hampshire — — 156 192 183 4 23 24 64 67 2.3 36 36 16 17 14 14 17.0 17.6 * 29 5,245 5,487 7,618 7,839New Jersey 163 155 145 170 180 5 27 26 73 70 3.21 57 48 * 24 22 * 21 20 16.0 16.7 * 32 4,771 5,101 9,556 9,757New Mexico — 166 149 170 193 * 4 23 19 * 59 51 * 2.92 33 30 18 18 13 15 15.0 15.3 26 4,407 4,716 6,791 7,183New York 231 243 155 173 179 5 29 24 * 73 65 * 5.46 59 47 ** 23 21 * 17 14 * 17.0 17.0 30 5,279 5,866 * 8,977 9,191North Carolina 113 109 159 197 217 * 4 29 28 67 65 2.59 45 40 20 18 * 18 16 16.0 16.1 34 4,497 4,852 8,158 8,590North Dakota — 61 162 187 168 * 4 24 22 65 63 2.7 42 32 * 16 14 * 15 14 15.0 16.8 ** 16 4,306 4,438 7,529 7,867Ohio 128 — 177 219 230 5 38 31 * 82 74 * 3.36 59 47 ** 21 20 15 13 16.0 16.6 * 32 4,464 4,770 9,492 9,254Oklahoma 189 156 * 172 211 236 * 5 38 34 * 80 73 * 3.19 49 42 * 23 21 * 24 23 16.0 16.5 * 32 4,312 4,356 9,182 9,721Oregon 41 48 137 162 167 4 17 17 48 47 2.65 28 28 17 16 8 9 14.0 15.5 ** 20 4,300 4,721 * 6,300 6,827Pennsylvania — 157 159 187 194 5 31 28 74 70 3.09 54 46 * 21 19 * 16 14 17.0 17.4 27 4,185 4,344 9,391 9,432Rhode Island 149 140 158 188 212 * 4 27 29 66 65 3.36 50 48 21 20 10 9 15.0 16.3 ** 30 4,018 4,333 8,557 8,803South Carolina 133 108 * — 176 189 * — 27 25 65 62 — 41 37 20 20 20 19 16.0 16.7 * — — — 8,529 8,671South Dakota 76 89 143 168 155 * 4 22 22 — 61 3.38 36 31 15 14 15 16 17.0 17.3 18 5,042 5,278 7,204 7,682Tennessee 73 74 168 200 205 6 37 32 * 84 79 1.94 53 45 * 21 19 * 22 19 * 17.0 17.4 36 4,081 4,134 9,197 9,316Texas 114 97 176 186 198 5 31 28 76 70 3.45 46 41 22 20 * 23 21 15.0 15.9 * 35 5,110 5,424 10,135 10,364Utah 93 — 132 147 151 4 17 14 42 38 1.37 28 23 14 14 11 11 14.0 14.0 26 4,322 4,508 8,011 8,207Vermont 28 22 163 187 174 * 4 — 20 65 58 * 3.21 33 32 16 15 15 14 16.0 17.2 ** 23 5,384 5,660 6,816 7,231Virginia 100 80 168 193 195 5 27 23 * 71 62 * 2.5 48 39 * 21 20 20 18 17.0 16.7 34 4,203 4,498 8,000 8,172Washington 84 60 * 138 157 175 * 3 18 17 49 47 2.21 35 30 17 16 13 11 15.0 15.0 22 4,545 4,596 7,106 7,361West Virginia 98 84 182 226 251 * 5 50 41 ** 98 88 * 3 64 54 * 23 20 * 19 17 18.0 16.9 ** 35 5,345 5,389 8,637 8,904Wisconsin 86 86 164 182 194 4 22 21 60 56 3.24 41 35 * 17 16 12 12 16.0 16.2 27 5,871 6,149 7,615 7,905Wyoming 123 106 166 169 178 5 — 20 — — 2.86 34 30 15 14 13 16 * 17.0 16.8 27 5,779 6,312 * 6,818 7,269##ChangeStates Improved 6 4 12 10 23 20 5 3 2 0States Worsened 1 15 0 0 0 0 1 29 6 2
Preventable hospitalizations, ages 18–64 (rate
per 1,000)
30-day readmissions,
ages 18–64 (rate per 1,000)
Adults with inappropriate
lower back imaging
Notes: * Denotes a change of at least 0.5 standard deviations. ** Denotes a change of 1.0 standard deviation or more. Spending estimates exclude prescription drug costs and are adjusted for regional wage differences; Medicare estimates reflect only the age 65+ Medicare fee-for-service population. — Indicates that estimates are not available.
Total Medicare (Parts A & B)
reimbursements per enrollee
Preventable hospitalizations,
Medicare, age 75+ (rate per 1,000)
Home health patients with a hospital
admission
Hospital admissions for pediatric asthma, per 100,000 children
Avoidable emergency department visits, ages
18–64 (rate per 1,000)
Avoidable emergency department visits, Medicare, age 65+
(rate per 1,000)
Preventable hospitalizations,
Medicare, ages 65–74 (rate per 1,000)
Total employer-sponsored insurance
spending per enrollee
Short-stay nursing home residents with a 30-day readmission to
the hospital
Long-stay nursing home residents with a
hospital admission
30-day readmissions, Medicare, age 65+
(rate per 1,000)
APPENDIX E2. Avoidable Hospital Use & Cost: Dimension Ranking and Indicator Rates
Notes: * Denotes a change of at least 0.5 standard deviations. ** Denotes a change of 1.0 standard deviation or more. Medicare estimates reflect only the age 65+ Medicare fee-for-service population. — Indicates that estimates are not available.
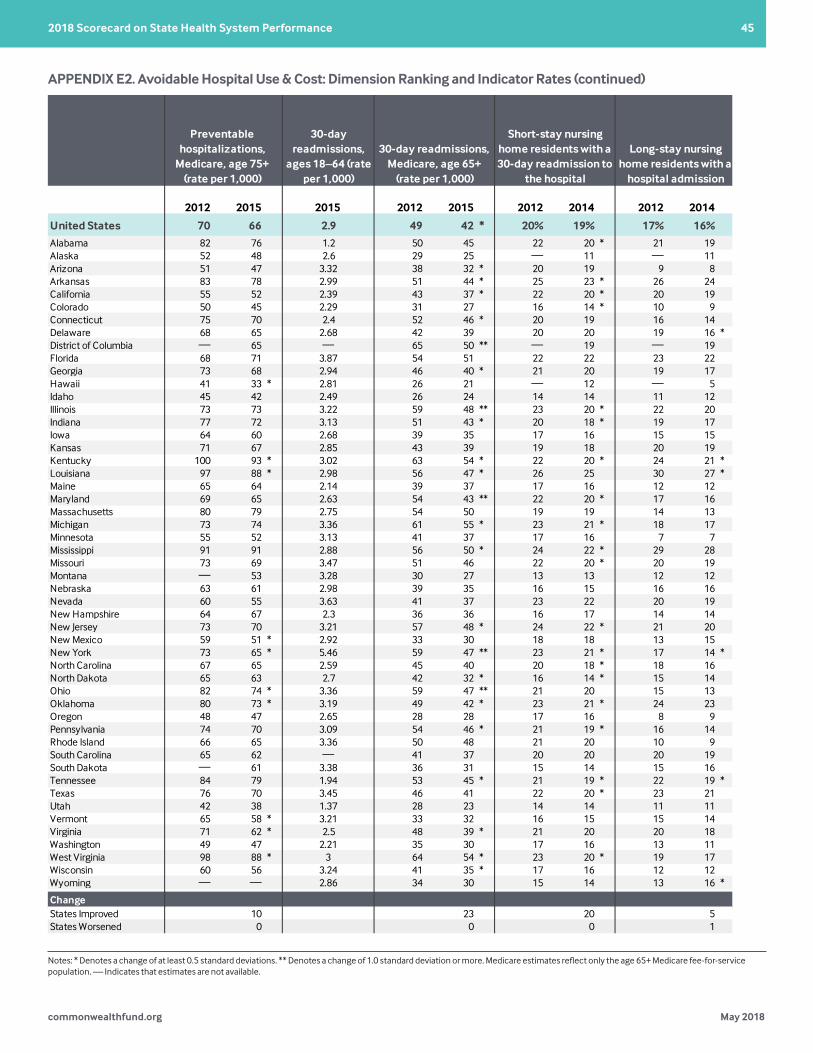
commonwealthfund.org May 2018
2018 Scorecard on State Health System Performance 45
Appendix E2. Avoidable Hospital Use & Cost: Dimension Ranking and Indicator Rates
2012 2014 2015 2012 2015 2015 2012 2015 2012 2015 2015 2012 2015 2012 2014 2012 2014 2013 2016 2015 2013 2015 2012 2015
United States 143 106 * 159 188 197 5 29 26 70 66 2.9 49 42 * 20% 19% 17% 16% 16.0% 16.4% 29% $4,697 $4,736 $8,854 $9,025
Alabama — — 171 192 200 6 38 35 82 76 1.2 50 45 22 20 * 21 19 17.0 18.0 * 41 3,706 3,706 9,344 9,623Alaska 62 — 166 205 213 4 — — 52 48 2.6 29 25 — 11 — 11 14.0 14.4 25 7,186 8,902 ** 5,399 6,318 *Arizona 125 90 * 176 178 191 * 5 20 17 51 47 3.32 38 32 * 20 19 9 8 15.0 14.6 32 4,453 4,509 7,998 8,168Arkansas 81 95 157 185 200 * 5 35 32 83 78 2.99 51 44 * 25 23 * 26 24 17.0 18.4 ** 32 3,117 3,609 * 8,619 9,022California 96 96 130 167 174 4 21 18 55 52 2.39 43 37 * 22 20 * 20 19 15.0 14.9 25 4,915 5,151 8,310 8,295Colorado 129 141 147 173 177 4 16 14 50 45 2.29 31 27 16 14 * 10 9 14.0 15.3 ** 26 4,625 4,811 7,460 7,635Connecticut 136 130 163 189 208 * 4 26 24 75 70 2.4 52 46 * 20 19 16 14 16.0 17.4 ** 33 5,067 5,358 8,936 9,335Delaware — — 151 159 179 * 5 27 27 68 65 2.68 42 39 20 20 19 16 * 16.0 16.5 * 28 4,509 4,643 8,514 8,980District of Columbia — — — 248 242 — 37 — — 65 — 65 50 ** — 19 — 19 18.0 16.0 ** — 3,548 — 8,887 8,838Florida 143 141 178 179 199 * 6 28 28 68 71 3.87 54 51 22 22 23 22 15.0 15.9 * 35 4,748 5,050 10,597 10,638Georgia 97 81 164 201 197 5 31 28 73 68 2.94 46 40 * 21 20 19 17 16.0 16.9 * 35 4,951 4,507 * 8,743 8,974Hawaii 69 63 138 131 138 4 13 — 41 33 * 2.81 26 21 — 12 — 5 14.0 14.4 23 3,460 3,667 5,408 5,586Idaho — — 134 162 173 4 17 15 45 42 2.49 26 24 14 14 11 12 14.0 15.2 ** 22 4,906 5,243 7,198 7,589Illinois 119 116 154 192 199 5 31 27 * 73 73 3.22 59 48 ** 23 20 * 22 20 16.0 16.3 30 4,575 4,847 9,219 9,211Indiana 102 89 171 200 210 6 35 31 * 77 72 3.13 51 43 * 20 18 * 19 17 16.0 16.6 * 32 4,955 5,317 9,045 9,291Iowa 71 70 151 184 186 4 24 22 64 60 2.68 39 35 17 16 15 15 16.0 17.2 ** 23 3,784 4,118 7,496 7,905Kansas 160 159 161 173 189 * 5 27 24 71 67 2.85 43 39 19 18 20 19 17.0 17.7 * 25 4,079 4,362 8,586 9,034Kentucky 152 115 * 151 219 236 * 5 51 45 * 100 93 * 3.02 63 54 * 22 20 * 24 21 * 18.0 17.7 33 4,393 4,033 9,167 9,351Louisiana 203 129 ** 174 236 238 6 44 38 * 97 88 * 2.98 56 47 * 26 25 30 27 * 16.0 16.9 * 39 4,404 4,452 10,868 10,851Maine 76 — 172 233 219 * 4 26 25 65 64 2.14 39 37 17 16 12 12 16.0 17.1 ** 23 4,661 4,868 7,606 8,083Maryland 137 129 148 193 194 5 29 28 69 65 2.63 54 43 ** 22 20 * 17 16 17.0 16.3 * 34 3,683 3,848 8,472 8,927Massachusetts 141 — 142 209 208 4 30 29 80 79 2.75 54 50 19 19 14 13 16.0 17.6 ** 27 4,659 4,648 9,041 9,158Michigan 94 122 * 159 214 223 5 34 32 73 74 3.36 61 55 * 23 21 * 18 17 16.0 16.4 33 3,903 3,818 9,565 9,714Minnesota 82 70 139 181 186 4 20 19 55 52 3.13 41 37 17 16 7 7 16.0 16.9 * 21 4,483 4,726 7,225 7,791Mississippi — — 183 231 246 * 6 42 41 91 91 2.88 56 50 * 24 22 * 29 28 17.0 18.2 ** 37 3,982 3,347 * 10,046 10,352Missouri 161 172 203 197 209 5 31 30 73 69 3.47 51 46 22 20 * 20 19 16.0 17.0 * 29 4,266 4,187 8,698 8,976Montana 77 78 145 158 163 4 21 18 — 53 3.28 30 27 13 13 12 12 15.0 15.4 23 4,553 4,858 6,585 7,004Nebraska 82 69 140 153 157 5 24 21 63 61 2.98 39 35 16 15 16 16 16.0 16.5 * 24 4,507 4,972 * 8,062 8,654 *Nevada 112 102 187 165 164 5 25 21 * 60 55 3.63 41 37 23 22 20 19 15.0 16.1 ** 32 4,022 4,400 8,328 8,488New Hampshire — — 156 192 183 4 23 24 64 67 2.3 36 36 16 17 14 14 17.0 17.6 * 29 5,245 5,487 7,618 7,839New Jersey 163 155 145 170 180 5 27 26 73 70 3.21 57 48 * 24 22 * 21 20 16.0 16.7 * 32 4,771 5,101 9,556 9,757New Mexico — 166 149 170 193 * 4 23 19 * 59 51 * 2.92 33 30 18 18 13 15 15.0 15.3 26 4,407 4,716 6,791 7,183New York 231 243 155 173 179 5 29 24 * 73 65 * 5.46 59 47 ** 23 21 * 17 14 * 17.0 17.0 30 5,279 5,866 * 8,977 9,191North Carolina 113 109 159 197 217 * 4 29 28 67 65 2.59 45 40 20 18 * 18 16 16.0 16.1 34 4,497 4,852 8,158 8,590North Dakota — 61 162 187 168 * 4 24 22 65 63 2.7 42 32 * 16 14 * 15 14 15.0 16.8 ** 16 4,306 4,438 7,529 7,867Ohio 128 — 177 219 230 5 38 31 * 82 74 * 3.36 59 47 ** 21 20 15 13 16.0 16.6 * 32 4,464 4,770 9,492 9,254Oklahoma 189 156 * 172 211 236 * 5 38 34 * 80 73 * 3.19 49 42 * 23 21 * 24 23 16.0 16.5 * 32 4,312 4,356 9,182 9,721Oregon 41 48 137 162 167 4 17 17 48 47 2.65 28 28 17 16 8 9 14.0 15.5 ** 20 4,300 4,721 * 6,300 6,827Pennsylvania — 157 159 187 194 5 31 28 74 70 3.09 54 46 * 21 19 * 16 14 17.0 17.4 27 4,185 4,344 9,391 9,432Rhode Island 149 140 158 188 212 * 4 27 29 66 65 3.36 50 48 21 20 10 9 15.0 16.3 ** 30 4,018 4,333 8,557 8,803South Carolina 133 108 * — 176 189 * — 27 25 65 62 — 41 37 20 20 20 19 16.0 16.7 * — — — 8,529 8,671South Dakota 76 89 143 168 155 * 4 22 22 — 61 3.38 36 31 15 14 15 16 17.0 17.3 18 5,042 5,278 7,204 7,682Tennessee 73 74 168 200 205 6 37 32 * 84 79 1.94 53 45 * 21 19 * 22 19 * 17.0 17.4 36 4,081 4,134 9,197 9,316Texas 114 97 176 186 198 5 31 28 76 70 3.45 46 41 22 20 * 23 21 15.0 15.9 * 35 5,110 5,424 10,135 10,364Utah 93 — 132 147 151 4 17 14 42 38 1.37 28 23 14 14 11 11 14.0 14.0 26 4,322 4,508 8,011 8,207Vermont 28 22 163 187 174 * 4 — 20 65 58 * 3.21 33 32 16 15 15 14 16.0 17.2 ** 23 5,384 5,660 6,816 7,231Virginia 100 80 168 193 195 5 27 23 * 71 62 * 2.5 48 39 * 21 20 20 18 17.0 16.7 34 4,203 4,498 8,000 8,172Washington 84 60 * 138 157 175 * 3 18 17 49 47 2.21 35 30 17 16 13 11 15.0 15.0 22 4,545 4,596 7,106 7,361West Virginia 98 84 182 226 251 * 5 50 41 ** 98 88 * 3 64 54 * 23 20 * 19 17 18.0 16.9 ** 35 5,345 5,389 8,637 8,904Wisconsin 86 86 164 182 194 4 22 21 60 56 3.24 41 35 * 17 16 12 12 16.0 16.2 27 5,871 6,149 7,615 7,905Wyoming 123 106 166 169 178 5 — 20 — — 2.86 34 30 15 14 13 16 * 17.0 16.8 27 5,779 6,312 * 6,818 7,269##ChangeStates Improved 6 4 12 10 23 20 5 3 2 0States Worsened 1 15 0 0 0 0 1 29 6 2
Preventable hospitalizations, ages 18–64 (rate
per 1,000)
30-day readmissions,
ages 18–64 (rate per 1,000)
Adults with inappropriate
lower back imaging
Notes: * Denotes a change of at least 0.5 standard deviations. ** Denotes a change of 1.0 standard deviation or more. Spending estimates exclude prescription drug costs and are adjusted for regional wage differences; Medicare estimates reflect only the age 65+ Medicare fee-for-service population. — Indicates that estimates are not available.
Total Medicare (Parts A & B)
reimbursements per enrollee
Preventable hospitalizations,
Medicare, age 75+ (rate per 1,000)
Home health patients with a hospital
admission
Hospital admissions for pediatric asthma, per 100,000 children
Avoidable emergency department visits, ages
18–64 (rate per 1,000)
Avoidable emergency department visits, Medicare, age 65+
(rate per 1,000)
Preventable hospitalizations,
Medicare, ages 65–74 (rate per 1,000)
Total employer-sponsored insurance
spending per enrollee
Short-stay nursing home residents with a 30-day readmission to
the hospital
Long-stay nursing home residents with a
hospital admission
30-day readmissions, Medicare, age 65+
(rate per 1,000)
APPENDIX E2. Avoidable Hospital Use & Cost: Dimension Ranking and Indicator Rates (continued)
Notes: * Denotes a change of at least 0.5 standard deviations. ** Denotes a change of 1.0 standard deviation or more. Medicare estimates reflect only the age 65+ Medicare fee-for-service population. — Indicates that estimates are not available.
Appendix E2. Avoidable Hospital Use & Cost: Dimension Ranking and Indicator Rates
2012 2014 2015 2012 2015 2015 2012 2015 2012 2015 2015 2012 2015 2012 2014 2012 2014 2013 2016 2015 2013 2015 2012 2015
United States 143 106 * 159 188 197 5 29 26 70 66 2.9 49 42 * 20% 19% 17% 16% 16.0% 16.4% 29% $4,697 $4,736 $8,854 $9,025
Alabama — — 171 192 200 6 38 35 82 76 1.2 50 45 22 20 * 21 19 17.0 18.0 * 41 3,706 3,706 9,344 9,623Alaska 62 — 166 205 213 4 — — 52 48 2.6 29 25 — 11 — 11 14.0 14.4 25 7,186 8,902 ** 5,399 6,318 *Arizona 125 90 * 176 178 191 * 5 20 17 51 47 3.32 38 32 * 20 19 9 8 15.0 14.6 32 4,453 4,509 7,998 8,168Arkansas 81 95 157 185 200 * 5 35 32 83 78 2.99 51 44 * 25 23 * 26 24 17.0 18.4 ** 32 3,117 3,609 * 8,619 9,022California 96 96 130 167 174 4 21 18 55 52 2.39 43 37 * 22 20 * 20 19 15.0 14.9 25 4,915 5,151 8,310 8,295Colorado 129 141 147 173 177 4 16 14 50 45 2.29 31 27 16 14 * 10 9 14.0 15.3 ** 26 4,625 4,811 7,460 7,635Connecticut 136 130 163 189 208 * 4 26 24 75 70 2.4 52 46 * 20 19 16 14 16.0 17.4 ** 33 5,067 5,358 8,936 9,335Delaware — — 151 159 179 * 5 27 27 68 65 2.68 42 39 20 20 19 16 * 16.0 16.5 * 28 4,509 4,643 8,514 8,980District of Columbia — — — 248 242 — 37 — — 65 — 65 50 ** — 19 — 19 18.0 16.0 ** — 3,548 — 8,887 8,838Florida 143 141 178 179 199 * 6 28 28 68 71 3.87 54 51 22 22 23 22 15.0 15.9 * 35 4,748 5,050 10,597 10,638Georgia 97 81 164 201 197 5 31 28 73 68 2.94 46 40 * 21 20 19 17 16.0 16.9 * 35 4,951 4,507 * 8,743 8,974Hawaii 69 63 138 131 138 4 13 — 41 33 * 2.81 26 21 — 12 — 5 14.0 14.4 23 3,460 3,667 5,408 5,586Idaho — — 134 162 173 4 17 15 45 42 2.49 26 24 14 14 11 12 14.0 15.2 ** 22 4,906 5,243 7,198 7,589Illinois 119 116 154 192 199 5 31 27 * 73 73 3.22 59 48 ** 23 20 * 22 20 16.0 16.3 30 4,575 4,847 9,219 9,211Indiana 102 89 171 200 210 6 35 31 * 77 72 3.13 51 43 * 20 18 * 19 17 16.0 16.6 * 32 4,955 5,317 9,045 9,291Iowa 71 70 151 184 186 4 24 22 64 60 2.68 39 35 17 16 15 15 16.0 17.2 ** 23 3,784 4,118 7,496 7,905Kansas 160 159 161 173 189 * 5 27 24 71 67 2.85 43 39 19 18 20 19 17.0 17.7 * 25 4,079 4,362 8,586 9,034Kentucky 152 115 * 151 219 236 * 5 51 45 * 100 93 * 3.02 63 54 * 22 20 * 24 21 * 18.0 17.7 33 4,393 4,033 9,167 9,351Louisiana 203 129 ** 174 236 238 6 44 38 * 97 88 * 2.98 56 47 * 26 25 30 27 * 16.0 16.9 * 39 4,404 4,452 10,868 10,851Maine 76 — 172 233 219 * 4 26 25 65 64 2.14 39 37 17 16 12 12 16.0 17.1 ** 23 4,661 4,868 7,606 8,083Maryland 137 129 148 193 194 5 29 28 69 65 2.63 54 43 ** 22 20 * 17 16 17.0 16.3 * 34 3,683 3,848 8,472 8,927Massachusetts 141 — 142 209 208 4 30 29 80 79 2.75 54 50 19 19 14 13 16.0 17.6 ** 27 4,659 4,648 9,041 9,158Michigan 94 122 * 159 214 223 5 34 32 73 74 3.36 61 55 * 23 21 * 18 17 16.0 16.4 33 3,903 3,818 9,565 9,714Minnesota 82 70 139 181 186 4 20 19 55 52 3.13 41 37 17 16 7 7 16.0 16.9 * 21 4,483 4,726 7,225 7,791Mississippi — — 183 231 246 * 6 42 41 91 91 2.88 56 50 * 24 22 * 29 28 17.0 18.2 ** 37 3,982 3,347 * 10,046 10,352Missouri 161 172 203 197 209 5 31 30 73 69 3.47 51 46 22 20 * 20 19 16.0 17.0 * 29 4,266 4,187 8,698 8,976Montana 77 78 145 158 163 4 21 18 — 53 3.28 30 27 13 13 12 12 15.0 15.4 23 4,553 4,858 6,585 7,004Nebraska 82 69 140 153 157 5 24 21 63 61 2.98 39 35 16 15 16 16 16.0 16.5 * 24 4,507 4,972 * 8,062 8,654 *Nevada 112 102 187 165 164 5 25 21 * 60 55 3.63 41 37 23 22 20 19 15.0 16.1 ** 32 4,022 4,400 8,328 8,488New Hampshire — — 156 192 183 4 23 24 64 67 2.3 36 36 16 17 14 14 17.0 17.6 * 29 5,245 5,487 7,618 7,839New Jersey 163 155 145 170 180 5 27 26 73 70 3.21 57 48 * 24 22 * 21 20 16.0 16.7 * 32 4,771 5,101 9,556 9,757New Mexico — 166 149 170 193 * 4 23 19 * 59 51 * 2.92 33 30 18 18 13 15 15.0 15.3 26 4,407 4,716 6,791 7,183New York 231 243 155 173 179 5 29 24 * 73 65 * 5.46 59 47 ** 23 21 * 17 14 * 17.0 17.0 30 5,279 5,866 * 8,977 9,191North Carolina 113 109 159 197 217 * 4 29 28 67 65 2.59 45 40 20 18 * 18 16 16.0 16.1 34 4,497 4,852 8,158 8,590North Dakota — 61 162 187 168 * 4 24 22 65 63 2.7 42 32 * 16 14 * 15 14 15.0 16.8 ** 16 4,306 4,438 7,529 7,867Ohio 128 — 177 219 230 5 38 31 * 82 74 * 3.36 59 47 ** 21 20 15 13 16.0 16.6 * 32 4,464 4,770 9,492 9,254Oklahoma 189 156 * 172 211 236 * 5 38 34 * 80 73 * 3.19 49 42 * 23 21 * 24 23 16.0 16.5 * 32 4,312 4,356 9,182 9,721Oregon 41 48 137 162 167 4 17 17 48 47 2.65 28 28 17 16 8 9 14.0 15.5 ** 20 4,300 4,721 * 6,300 6,827Pennsylvania — 157 159 187 194 5 31 28 74 70 3.09 54 46 * 21 19 * 16 14 17.0 17.4 27 4,185 4,344 9,391 9,432Rhode Island 149 140 158 188 212 * 4 27 29 66 65 3.36 50 48 21 20 10 9 15.0 16.3 ** 30 4,018 4,333 8,557 8,803South Carolina 133 108 * — 176 189 * — 27 25 65 62 — 41 37 20 20 20 19 16.0 16.7 * — — — 8,529 8,671South Dakota 76 89 143 168 155 * 4 22 22 — 61 3.38 36 31 15 14 15 16 17.0 17.3 18 5,042 5,278 7,204 7,682Tennessee 73 74 168 200 205 6 37 32 * 84 79 1.94 53 45 * 21 19 * 22 19 * 17.0 17.4 36 4,081 4,134 9,197 9,316Texas 114 97 176 186 198 5 31 28 76 70 3.45 46 41 22 20 * 23 21 15.0 15.9 * 35 5,110 5,424 10,135 10,364Utah 93 — 132 147 151 4 17 14 42 38 1.37 28 23 14 14 11 11 14.0 14.0 26 4,322 4,508 8,011 8,207Vermont 28 22 163 187 174 * 4 — 20 65 58 * 3.21 33 32 16 15 15 14 16.0 17.2 ** 23 5,384 5,660 6,816 7,231Virginia 100 80 168 193 195 5 27 23 * 71 62 * 2.5 48 39 * 21 20 20 18 17.0 16.7 34 4,203 4,498 8,000 8,172Washington 84 60 * 138 157 175 * 3 18 17 49 47 2.21 35 30 17 16 13 11 15.0 15.0 22 4,545 4,596 7,106 7,361West Virginia 98 84 182 226 251 * 5 50 41 ** 98 88 * 3 64 54 * 23 20 * 19 17 18.0 16.9 ** 35 5,345 5,389 8,637 8,904Wisconsin 86 86 164 182 194 4 22 21 60 56 3.24 41 35 * 17 16 12 12 16.0 16.2 27 5,871 6,149 7,615 7,905Wyoming 123 106 166 169 178 5 — 20 — — 2.86 34 30 15 14 13 16 * 17.0 16.8 27 5,779 6,312 * 6,818 7,269##ChangeStates Improved 6 4 12 10 23 20 5 3 2 0States Worsened 1 15 0 0 0 0 1 29 6 2
Preventable hospitalizations, ages 18–64 (rate
per 1,000)
30-day readmissions,
ages 18–64 (rate per 1,000)
Adults with inappropriate
lower back imaging
Notes: * Denotes a change of at least 0.5 standard deviations. ** Denotes a change of 1.0 standard deviation or more. Spending estimates exclude prescription drug costs and are adjusted for regional wage differences; Medicare estimates reflect only the age 65+ Medicare fee-for-service population. — Indicates that estimates are not available.
Total Medicare (Parts A & B)
reimbursements per enrollee
Preventable hospitalizations,
Medicare, age 75+ (rate per 1,000)
Home health patients with a hospital
admission
Hospital admissions for pediatric asthma, per 100,000 children
Avoidable emergency department visits, ages
18–64 (rate per 1,000)
Avoidable emergency department visits, Medicare, age 65+
(rate per 1,000)
Preventable hospitalizations,
Medicare, ages 65–74 (rate per 1,000)
Total employer-sponsored insurance
spending per enrollee
Short-stay nursing home residents with a 30-day readmission to
the hospital
Long-stay nursing home residents with a
hospital admission
30-day readmissions, Medicare, age 65+
(rate per 1,000)

commonwealthfund.org May 2018
2018 Scorecard on State Health System Performance 46
APPENDIX E2. Avoidable Hospital Use & Cost: Dimension Ranking and Indicator Rates (continued)
Notes: * Denotes a change of at least 0.5 standard deviations. ** Denotes a change of 1.0 standard deviation or more. Spending estimates exclude prescription drug costs and are adjusted for regional wage differences; Medicare estimates reflect only the age 65+ Medicare fee-for-service population. — Indicates that estimates are not available.
Appendix E2. Avoidable Hospital Use & Cost: Dimension Ranking and Indicator Rates
2012 2014 2015 2012 2015 2015 2012 2015 2012 2015 2015 2012 2015 2012 2014 2012 2014 2013 2016 2015 2013 2015 2012 2015
United States 143 106 * 159 188 197 5 29 26 70 66 2.9 49 42 * 20% 19% 17% 16% 16.0% 16.4% 29% $4,697 $4,736 $8,854 $9,025
Alabama — — 171 192 200 6 38 35 82 76 1.2 50 45 22 20 * 21 19 17.0 18.0 * 41 3,706 3,706 9,344 9,623Alaska 62 — 166 205 213 4 — — 52 48 2.6 29 25 — 11 — 11 14.0 14.4 25 7,186 8,902 ** 5,399 6,318 *Arizona 125 90 * 176 178 191 * 5 20 17 51 47 3.32 38 32 * 20 19 9 8 15.0 14.6 32 4,453 4,509 7,998 8,168Arkansas 81 95 157 185 200 * 5 35 32 83 78 2.99 51 44 * 25 23 * 26 24 17.0 18.4 ** 32 3,117 3,609 * 8,619 9,022California 96 96 130 167 174 4 21 18 55 52 2.39 43 37 * 22 20 * 20 19 15.0 14.9 25 4,915 5,151 8,310 8,295Colorado 129 141 147 173 177 4 16 14 50 45 2.29 31 27 16 14 * 10 9 14.0 15.3 ** 26 4,625 4,811 7,460 7,635Connecticut 136 130 163 189 208 * 4 26 24 75 70 2.4 52 46 * 20 19 16 14 16.0 17.4 ** 33 5,067 5,358 8,936 9,335Delaware — — 151 159 179 * 5 27 27 68 65 2.68 42 39 20 20 19 16 * 16.0 16.5 * 28 4,509 4,643 8,514 8,980District of Columbia — — — 248 242 — 37 — — 65 — 65 50 ** — 19 — 19 18.0 16.0 ** — 3,548 — 8,887 8,838Florida 143 141 178 179 199 * 6 28 28 68 71 3.87 54 51 22 22 23 22 15.0 15.9 * 35 4,748 5,050 10,597 10,638Georgia 97 81 164 201 197 5 31 28 73 68 2.94 46 40 * 21 20 19 17 16.0 16.9 * 35 4,951 4,507 * 8,743 8,974Hawaii 69 63 138 131 138 4 13 — 41 33 * 2.81 26 21 — 12 — 5 14.0 14.4 23 3,460 3,667 5,408 5,586Idaho — — 134 162 173 4 17 15 45 42 2.49 26 24 14 14 11 12 14.0 15.2 ** 22 4,906 5,243 7,198 7,589Illinois 119 116 154 192 199 5 31 27 * 73 73 3.22 59 48 ** 23 20 * 22 20 16.0 16.3 30 4,575 4,847 9,219 9,211Indiana 102 89 171 200 210 6 35 31 * 77 72 3.13 51 43 * 20 18 * 19 17 16.0 16.6 * 32 4,955 5,317 9,045 9,291Iowa 71 70 151 184 186 4 24 22 64 60 2.68 39 35 17 16 15 15 16.0 17.2 ** 23 3,784 4,118 7,496 7,905Kansas 160 159 161 173 189 * 5 27 24 71 67 2.85 43 39 19 18 20 19 17.0 17.7 * 25 4,079 4,362 8,586 9,034Kentucky 152 115 * 151 219 236 * 5 51 45 * 100 93 * 3.02 63 54 * 22 20 * 24 21 * 18.0 17.7 33 4,393 4,033 9,167 9,351Louisiana 203 129 ** 174 236 238 6 44 38 * 97 88 * 2.98 56 47 * 26 25 30 27 * 16.0 16.9 * 39 4,404 4,452 10,868 10,851Maine 76 — 172 233 219 * 4 26 25 65 64 2.14 39 37 17 16 12 12 16.0 17.1 ** 23 4,661 4,868 7,606 8,083Maryland 137 129 148 193 194 5 29 28 69 65 2.63 54 43 ** 22 20 * 17 16 17.0 16.3 * 34 3,683 3,848 8,472 8,927Massachusetts 141 — 142 209 208 4 30 29 80 79 2.75 54 50 19 19 14 13 16.0 17.6 ** 27 4,659 4,648 9,041 9,158Michigan 94 122 * 159 214 223 5 34 32 73 74 3.36 61 55 * 23 21 * 18 17 16.0 16.4 33 3,903 3,818 9,565 9,714Minnesota 82 70 139 181 186 4 20 19 55 52 3.13 41 37 17 16 7 7 16.0 16.9 * 21 4,483 4,726 7,225 7,791Mississippi — — 183 231 246 * 6 42 41 91 91 2.88 56 50 * 24 22 * 29 28 17.0 18.2 ** 37 3,982 3,347 * 10,046 10,352Missouri 161 172 203 197 209 5 31 30 73 69 3.47 51 46 22 20 * 20 19 16.0 17.0 * 29 4,266 4,187 8,698 8,976Montana 77 78 145 158 163 4 21 18 — 53 3.28 30 27 13 13 12 12 15.0 15.4 23 4,553 4,858 6,585 7,004Nebraska 82 69 140 153 157 5 24 21 63 61 2.98 39 35 16 15 16 16 16.0 16.5 * 24 4,507 4,972 * 8,062 8,654 *Nevada 112 102 187 165 164 5 25 21 * 60 55 3.63 41 37 23 22 20 19 15.0 16.1 ** 32 4,022 4,400 8,328 8,488New Hampshire — — 156 192 183 4 23 24 64 67 2.3 36 36 16 17 14 14 17.0 17.6 * 29 5,245 5,487 7,618 7,839New Jersey 163 155 145 170 180 5 27 26 73 70 3.21 57 48 * 24 22 * 21 20 16.0 16.7 * 32 4,771 5,101 9,556 9,757New Mexico — 166 149 170 193 * 4 23 19 * 59 51 * 2.92 33 30 18 18 13 15 15.0 15.3 26 4,407 4,716 6,791 7,183New York 231 243 155 173 179 5 29 24 * 73 65 * 5.46 59 47 ** 23 21 * 17 14 * 17.0 17.0 30 5,279 5,866 * 8,977 9,191North Carolina 113 109 159 197 217 * 4 29 28 67 65 2.59 45 40 20 18 * 18 16 16.0 16.1 34 4,497 4,852 8,158 8,590North Dakota — 61 162 187 168 * 4 24 22 65 63 2.7 42 32 * 16 14 * 15 14 15.0 16.8 ** 16 4,306 4,438 7,529 7,867Ohio 128 — 177 219 230 5 38 31 * 82 74 * 3.36 59 47 ** 21 20 15 13 16.0 16.6 * 32 4,464 4,770 9,492 9,254Oklahoma 189 156 * 172 211 236 * 5 38 34 * 80 73 * 3.19 49 42 * 23 21 * 24 23 16.0 16.5 * 32 4,312 4,356 9,182 9,721Oregon 41 48 137 162 167 4 17 17 48 47 2.65 28 28 17 16 8 9 14.0 15.5 ** 20 4,300 4,721 * 6,300 6,827Pennsylvania — 157 159 187 194 5 31 28 74 70 3.09 54 46 * 21 19 * 16 14 17.0 17.4 27 4,185 4,344 9,391 9,432Rhode Island 149 140 158 188 212 * 4 27 29 66 65 3.36 50 48 21 20 10 9 15.0 16.3 ** 30 4,018 4,333 8,557 8,803South Carolina 133 108 * — 176 189 * — 27 25 65 62 — 41 37 20 20 20 19 16.0 16.7 * — — — 8,529 8,671South Dakota 76 89 143 168 155 * 4 22 22 — 61 3.38 36 31 15 14 15 16 17.0 17.3 18 5,042 5,278 7,204 7,682Tennessee 73 74 168 200 205 6 37 32 * 84 79 1.94 53 45 * 21 19 * 22 19 * 17.0 17.4 36 4,081 4,134 9,197 9,316Texas 114 97 176 186 198 5 31 28 76 70 3.45 46 41 22 20 * 23 21 15.0 15.9 * 35 5,110 5,424 10,135 10,364Utah 93 — 132 147 151 4 17 14 42 38 1.37 28 23 14 14 11 11 14.0 14.0 26 4,322 4,508 8,011 8,207Vermont 28 22 163 187 174 * 4 — 20 65 58 * 3.21 33 32 16 15 15 14 16.0 17.2 ** 23 5,384 5,660 6,816 7,231Virginia 100 80 168 193 195 5 27 23 * 71 62 * 2.5 48 39 * 21 20 20 18 17.0 16.7 34 4,203 4,498 8,000 8,172Washington 84 60 * 138 157 175 * 3 18 17 49 47 2.21 35 30 17 16 13 11 15.0 15.0 22 4,545 4,596 7,106 7,361West Virginia 98 84 182 226 251 * 5 50 41 ** 98 88 * 3 64 54 * 23 20 * 19 17 18.0 16.9 ** 35 5,345 5,389 8,637 8,904Wisconsin 86 86 164 182 194 4 22 21 60 56 3.24 41 35 * 17 16 12 12 16.0 16.2 27 5,871 6,149 7,615 7,905Wyoming 123 106 166 169 178 5 — 20 — — 2.86 34 30 15 14 13 16 * 17.0 16.8 27 5,779 6,312 * 6,818 7,269##ChangeStates Improved 6 4 12 10 23 20 5 3 2 0States Worsened 1 15 0 0 0 0 1 29 6 2
Preventable hospitalizations, ages 18–64 (rate
per 1,000)
30-day readmissions,
ages 18–64 (rate per 1,000)
Adults with inappropriate
lower back imaging
Notes: * Denotes a change of at least 0.5 standard deviations. ** Denotes a change of 1.0 standard deviation or more. Spending estimates exclude prescription drug costs and are adjusted for regional wage differences; Medicare estimates reflect only the age 65+ Medicare fee-for-service population. — Indicates that estimates are not available.
Total Medicare (Parts A & B)
reimbursements per enrollee
Preventable hospitalizations,
Medicare, age 75+ (rate per 1,000)
Home health patients with a hospital
admission
Hospital admissions for pediatric asthma, per 100,000 children
Avoidable emergency department visits, ages
18–64 (rate per 1,000)
Avoidable emergency department visits, Medicare, age 65+
(rate per 1,000)
Preventable hospitalizations,
Medicare, ages 65–74 (rate per 1,000)
Total employer-sponsored insurance
spending per enrollee
Short-stay nursing home residents with a 30-day readmission to
the hospital
Long-stay nursing home residents with a
hospital admission
30-day readmissions, Medicare, age 65+
(rate per 1,000)

commonwealthfund.org May 2018
2018 Scorecard on State Health System Performance 47
Appendix F1. Healthy Lives: Dimension and Indicator Ranking
Mortalit
y amenable to
health
careBre
ast cancer d
eaths
Colore
ctal c
ancer death
s
Suicide, a
lcohol, and dru
g use
deaths
Infant m
ortalit
y
Adults w
ho report
fair/poor
health
Adults w
ho smoke
Adults w
ho are obese
Overweight o
r obese child
ren
Adults w
ho have lost s
ix or
more
teeth
state rank1 Utah 1 1 1 3 1 1 1 1 1 1
2 Hawaii 2 1 1 1 2 1 1 1 1 1
3 Massachusetts 1 1 1 3 1 1 1 1 1 1
4 Minnesota 1 1 1 1 2 1 1 2 2 1
5 California 2 1 1 1 1 3 1 1 2 1
6 Connecticut 1 1 1 2 2 1 1 1 2 1
6 Vermont 1 1 4 3 1 1 2 1 1 2
8 Washington 1 2 1 2 1 1 1 2 1 1
9 Colorado 1 2 1 3 1 2 2 1 1 1
10 New York 2 2 2 1 1 2 1 1 3 2
11 Idaho 1 3 1 2 1 2 1 2 1 1
12 Iowa 2 2 2 1 1 1 2 3 2 1
13 Oregon 1 4 2 2 2 3 2 2 1 2
14 New Hampshire 1 1 2 4 1 1 3 1 1 2
15 Montana 2 2 2 3 2 1 3 1 1 3
16 Nebraska 1 2 3 1 2 1 2 3 2 1
17 Arizona 2 1 1 4 2 3 1 2 1 1
18 Rhode Island 1 1 1 4 2 2 1 1 4 1
19 New Jersey 2 3 3 1 1 3 1 1 3 2
19 Virginia 3 3 2 2 2 2 1 2 1 2
21 Wisconsin 2 2 2 2 2 2 2 2 2 2
22 Wyoming 2 2 1 4 1 2 3 2 1 3
23 Illinois 3 3 3 1 3 3 2 3 1 1
24 Texas 3 2 3 1 2 3 1 4 3 1
25 Kansas 3 3 3 1 3 2 2 3 2 2
26 South Dakota 2 2 4 2 4 1 3 2 2 2
27 Maryland 3 3 2 3 3 1 1 2 3 1
27 North Dakota 2 1 2 2 4 1 3 3 4 1
29 New Mexico 3 2 2 4 2 4 2 2 1 2
30 Alaska 2 2 3 4 3 1 3 3 1 2
31 Florida 3 1 2 3 3 4 1 2 4 3
32 Maine 1 1 2 4 3 3 3 2 2 4
33 North Carolina 3 2 2 2 4 3 3 3 2 3
34 Pennsylvania 3 4 3 4 3 2 3 2 3 3
35 Nevada 4 4 4 4 2 4 2 1 2 3
36 Delaware 3 3 2 3 4 3 3 3 2 3
37 Michigan 3 3 2 3 3 3 3 3 3 3
38 District of Columbia 4 4 4 3 4 1 1 1 3 1
39 Missouri 4 3 3 3 3 3 4 3 2 4
40 Georgia 4 4 3 1 4 4 3 3 3 4
41 Indiana 3 3 3 3 4 3 4 3 3 3
42 South Carolina 4 4 3 2 3 4 3 3 3 4
43 Ohio 3 4 4 4 4 3 4 3 3 4
44 Alabama 4 3 3 2 4 4 4 4 4 4
44 Tennessee 4 4 4 3 3 4 4 4 4 4
46 Oklahoma 4 4 4 4 4 4 3 3 3 4
47 Louisiana 4 4 4 2 4 4 4 4 3 4
48 Kentucky 4 4 4 4 3 4 4 4 3 4
49 Arkansas 4 3 4 2 4 4 4 4 3 4
50 Mississippi 4 4 4 1 4 4 4 4 4 4
51 West Virginia 4 4 4 4 3 4 4 4 4 4
APPENDIX F1. Healthy Lives: Dimension and Indicator Ranking
Overall performanceTop quartileSecond quartileThird quartileBottom quartileData not available

commonwealthfund.org May 2018
2018 Scorecard on State Health System Performance 48
Appendix F2. Healthy Lives: Dimension Ranking and Indicator Rates
2012-13 2014-15 2013 2016 2013 2016 2013 2016 2012 2015 2013 2016 2013 2016 2013 2016 2016 2012 2016United States 83.7 84.3 20.8 20.1 14.6 13.1 * 35.6 43.2 * 6.0 5.9 16% 16% 18% 16% * 29% 30% 31% 10% 10%Alabama 111.3 110.4 21.4 21.1 17.7 14.3 ** 36.7 44.7 * 8.9 8.3 20 20 21 21 33 37 ** 35 17 15 *Alaska 71.6 73.2 19.3 20.0 16.4 14.0 ** 51.4 60.2 * 5.1 6.9 ** 14 13 23 19 ** 28 31 * 26 9 10Arizona 72.4 73.5 20.6 18.9 * 13.3 11.6 * 50.1 52.9 5.8 5.5 16 17 16 15 28 30 * 27 10 8 *Arkansas 118.9 123.6 21.4 20.6 17.7 15.7 ** 36.9 43.2 * 7.1 7.5 22 24 * 26 24 * 37 38 34 17 16California 72.0 70.8 20.1 18.5 * 13.2 11.8 * 32.3 33.3 4.5 4.4 18 16 * 12 10 * 25 25 31 7 6Colorado 59.2 62.7 18.1 19.5 * 12.3 11.2 * 44.2 48.0 4.6 4.7 12 14 * 18 16 * 22 23 27 7 7Connecticut 61.3 59.1 18.7 18.3 11.9 10.4 * 32.0 45.3 ** 5.3 5.7 11 13 * 16 13 * 25 26 30 8 7Delaware 85.0 83.4 21.3 21.1 13.8 12.6 * 38.2 49.0 ** 7.6 9.1 ** 16 15 20 18 * 31 31 31 10 11District of Columbia 123.9 127.9 29.8 23.7 ** 14.3 16.4 ** 27.7 51.8 ** 7.9 8.8 * 11 10 19 15 ** 23 22 34 7 6Florida 80.0 80.9 19.6 18.8 13.7 12.6 * 35.5 48.3 ** 6.1 6.2 18 18 17 15 * 27 28 37 11 12Georgia 100.4 103.5 22.5 21.7 14.9 14.3 30.6 35.1 6.2 7.8 ** 17 18 19 18 31 32 32 13 13Hawaii 75.3 76.1 15.5 14.5 * 14.2 11.5 ** 28.4 31.2 4.9 5.7 * 12 13 13 13 23 26 * 25 6 6Idaho 66.7 64.9 22.1 21.4 13.4 11.7 * 42.5 44.6 5.4 4.7 * 13 14 17 15 * 30 28 * 26 9 8Illinois 87.1 87.7 22.2 21.0 * 15.9 13.8 ** 30.1 38.3 * 6.5 6.0 15 16 18 16 * 30 32 * 27 9 8Indiana 91.0 92.2 21.8 20.7 * 15.4 13.6 * 40.2 50.1 * 6.7 7.3 16 17 22 21 32 33 34 13 12Iowa 71.8 70.6 18.7 19.2 15.6 13.4 ** 31.6 33.7 5.3 4.2 * 12 12 19 17 * 32 32 30 9 8Kansas 78.1 80.1 18.5 21.4 ** 15.4 13.6 * 33.7 37.3 6.3 6.0 14 14 20 17 * 31 32 31 10 9Kentucky 105.8 108.6 21.1 21.7 17.1 15.9 * 48.9 61.7 ** 7.2 6.7 21 20 26 25 34 35 34 16 17Louisiana 123.5 124.9 23.9 22.2 * 18.4 15.5 ** 39.5 45.3 * 8.1 7.6 20 19 24 23 33 36 * 34 17 14 *Maine 62.3 66.2 18.8 18.8 12.5 13.4 38.0 53.9 ** 7.0 6.6 13 15 * 20 20 29 30 28 14 14Maryland 88.7 90.3 21.5 21.3 14.3 13.4 30.0 48.8 ** 6.4 6.6 13 13 16 14 * 29 30 34 9 7 *Massachusetts 60.4 59.9 18.4 16.9 * 13.1 11.0 ** 30.8 50.2 ** 4.2 4.3 12 13 17 14 * 24 23 27 9 8Michigan 91.3 92.2 21.2 20.5 14.8 13.1 * 37.7 47.1 * 6.9 6.5 16 17 21 20 32 33 32 11 11Minnesota 55.6 54.7 19.6 17.0 ** 12.8 11.9 29.3 34.4 5.0 5.2 11 11 18 15 * 26 28 * 28 7 7Mississippi 136.7 142.4 23.3 23.3 18.8 17.2 * 33.2 35.5 8.9 9.5 21 20 25 23 * 37 39 * 37 18 18Missouri 95.1 95.7 22.0 21.1 15.7 13.8 * 40.0 49.5 * 6.6 6.5 17 17 22 22 31 32 29 12 14 *Montana 70.3 71.2 19.9 19.4 12.4 12.2 48.8 50.2 5.9 5.8 14 13 19 18 25 26 23 11 11Nebraska 64.9 68.2 21.0 20.1 15.2 13.6 * 26.6 28.5 4.7 5.7 * 12 13 18 17 30 33 * 29 8 7Nevada 91.7 95.5 22.5 21.6 16.8 16.4 49.4 52.3 4.9 5.2 16 20 ** 19 16 * 27 26 30 11 11New Hampshire 58.4 57.7 19.8 19.0 12.8 12.6 34.7 64.3 ** 4.2 4.1 11 13 * 16 18 * 27 27 24 10 10New Jersey 75.1 73.1 23.2 21.2 ** 14.9 13.7 * 29.7 37.7 * 4.4 4.7 15 16 16 14 * 27 27 32 9 9New Mexico 78.6 80.0 17.3 20.3 ** 14.5 12.2 ** 61.8 72.2 * 6.8 5.1 ** 19 19 19 16 * 28 30 * 25 10 10New York 79.0 77.1 20.6 19.9 14.0 12.1 * 25.7 32.8 * 5.0 4.6 16 14 * 17 14 * 25 26 32 10 9North Carolina 92.5 93.6 20.4 20.1 13.3 12.4 34.5 41.8 * 7.4 7.4 17 17 20 18 * 30 33 * 31 13 12North Dakota 70.5 73.3 17.9 17.9 15.9 12.8 ** 32.1 41.7 * 6.3 7.2 * 12 13 21 20 31 32 37 9 8Ohio 94.5 94.5 22.9 21.6 * 16.3 15.0 * 42.6 63.0 ** 7.5 7.2 16 16 23 23 31 32 33 13 14Oklahoma 117.5 126.3 22.9 22.2 17.5 16.3 * 51.1 56.8 * 7.5 7.3 19 18 24 19 ** 34 33 34 14 14Oregon 61.9 62.6 19.9 21.5 * 14.4 12.7 * 39.2 41.3 5.4 5.2 16 15 17 16 27 29 * 20 10 10Pennsylvania 82.0 82.6 21.8 21.5 15.9 14.1 * 39.4 59.5 ** 7.1 6.2 * 15 14 21 18 * 30 30 32 11 11Rhode Island 68.5 68.2 19.4 18.4 * 13.2 11.9 * 43.3 54.3 ** 6.5 5.9 14 14 17 14 * 27 27 36 9 8South Carolina 99.2 99.2 21.3 22.4 * 15.0 13.7 * 38.3 45.4 * 7.5 6.9 17 18 22 20 * 33 33 33 15 13 *South Dakota 74.5 75.8 19.9 19.8 16.7 14.6 ** 38.0 44.8 * 8.3 7.3 * 10 11 20 18 * 30 30 31 9 9Tennessee 110.0 113.3 22.4 22.0 16.6 14.4 ** 44.1 51.9 * 7.2 7.0 21 18 * 23 22 35 37 * 38 18 13 **Texas 93.4 95.3 20.2 19.7 14.7 13.5 * 33.1 35.7 5.8 5.7 17 16 16 14 * 32 34 * 33 8 7Utah 61.4 60.7 20.3 19.0 * 10.9 10.1 48.7 50.7 4.8 5.0 11 11 10 9 24 25 19 6 6Vermont 57.2 61.4 18.5 13.6 ** 14.3 15.7 * 39.3 46.1 * 4.3 4.6 11 12 17 17 25 27 * 22 11 10Virginia 81.3 80.2 21.1 20.9 13.8 13.0 30.4 38.4 * 6.5 5.9 14 14 19 15 ** 27 30 * 27 11 9 *Washington 62.2 62.4 20.5 19.4 * 12.8 11.6 * 38.6 39.3 5.3 4.9 15 13 * 16 14 * 27 29 * 25 8 7West Virginia 103.5 106.9 21.6 21.9 19.8 17.4 ** 60.5 83.1 ** 7.2 7.1 22 24 * 27 25 * 37 39 * 35 23 21 *Wisconsin 69.4 69.4 20.4 19.3 * 14.1 12.3 * 37.3 42.9 * 5.7 5.8 14 14 19 17 * 29 30 30 11 10Wyoming 68.0 73.8 20.5 20.3 12.6 11.0 * 51.5 55.9 5.6 4.9 * 14 14 21 19 * 29 28 27 11 12
ChangeStates Improved 0 16 39 0 6 4 32 1 8States Worsened 0 5 2 33 7 7 1 18 1
Notes: * Denotes a change of at least 0.5 standard deviations. ** Denotes a change of 1.0 standard deviation or more.
Mortality amenable to health care, deaths per
100,000 population
Breast cancer deaths per 100,000 female
populationColorectal cancer deaths per 100,000 population
Deaths from suicide, alcohol, and drug use per
100,000 populationInfant mortality, deaths
per 1,000 live birthsAdults who report
fair/poor health Adults who smoke Adults who are obese
Children who are
overweight or obese
Adults who have lost six or more teeth
APPENDIX F2. Healthy Lives: Dimension Ranking and Indicator Rates
Notes: * Denotes a change of at least 0.5 standard deviations. ** Denotes a change of 1.0 standard deviation or more.
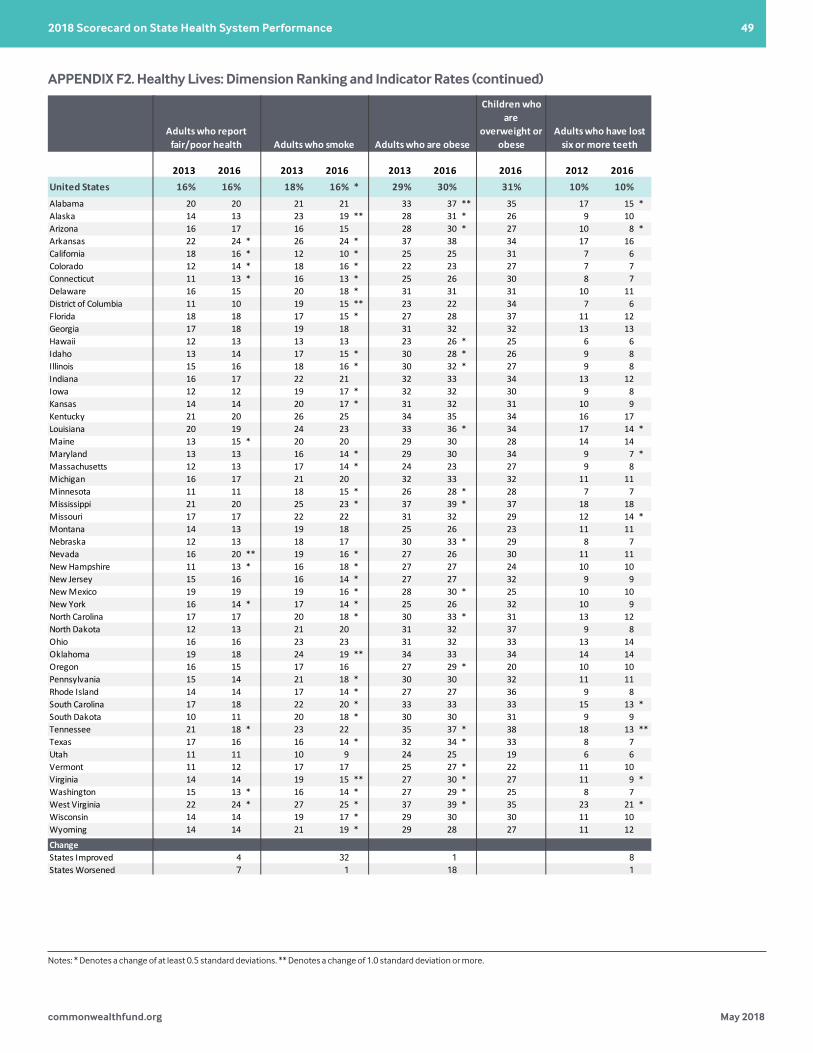
commonwealthfund.org May 2018
2018 Scorecard on State Health System Performance 49
Appendix F2. Healthy Lives: Dimension Ranking and Indicator Rates
2012-13 2014-15 2013 2016 2013 2016 2013 2016 2012 2015 2013 2016 2013 2016 2013 2016 2016 2012 2016United States 83.7 84.3 20.8 20.1 14.6 13.1 * 35.6 43.2 * 6.0 5.9 16% 16% 18% 16% * 29% 30% 31% 10% 10%Alabama 111.3 110.4 21.4 21.1 17.7 14.3 ** 36.7 44.7 * 8.9 8.3 20 20 21 21 33 37 ** 35 17 15 *Alaska 71.6 73.2 19.3 20.0 16.4 14.0 ** 51.4 60.2 * 5.1 6.9 ** 14 13 23 19 ** 28 31 * 26 9 10Arizona 72.4 73.5 20.6 18.9 * 13.3 11.6 * 50.1 52.9 5.8 5.5 16 17 16 15 28 30 * 27 10 8 *Arkansas 118.9 123.6 21.4 20.6 17.7 15.7 ** 36.9 43.2 * 7.1 7.5 22 24 * 26 24 * 37 38 34 17 16California 72.0 70.8 20.1 18.5 * 13.2 11.8 * 32.3 33.3 4.5 4.4 18 16 * 12 10 * 25 25 31 7 6Colorado 59.2 62.7 18.1 19.5 * 12.3 11.2 * 44.2 48.0 4.6 4.7 12 14 * 18 16 * 22 23 27 7 7Connecticut 61.3 59.1 18.7 18.3 11.9 10.4 * 32.0 45.3 ** 5.3 5.7 11 13 * 16 13 * 25 26 30 8 7Delaware 85.0 83.4 21.3 21.1 13.8 12.6 * 38.2 49.0 ** 7.6 9.1 ** 16 15 20 18 * 31 31 31 10 11District of Columbia 123.9 127.9 29.8 23.7 ** 14.3 16.4 ** 27.7 51.8 ** 7.9 8.8 * 11 10 19 15 ** 23 22 34 7 6Florida 80.0 80.9 19.6 18.8 13.7 12.6 * 35.5 48.3 ** 6.1 6.2 18 18 17 15 * 27 28 37 11 12Georgia 100.4 103.5 22.5 21.7 14.9 14.3 30.6 35.1 6.2 7.8 ** 17 18 19 18 31 32 32 13 13Hawaii 75.3 76.1 15.5 14.5 * 14.2 11.5 ** 28.4 31.2 4.9 5.7 * 12 13 13 13 23 26 * 25 6 6Idaho 66.7 64.9 22.1 21.4 13.4 11.7 * 42.5 44.6 5.4 4.7 * 13 14 17 15 * 30 28 * 26 9 8Illinois 87.1 87.7 22.2 21.0 * 15.9 13.8 ** 30.1 38.3 * 6.5 6.0 15 16 18 16 * 30 32 * 27 9 8Indiana 91.0 92.2 21.8 20.7 * 15.4 13.6 * 40.2 50.1 * 6.7 7.3 16 17 22 21 32 33 34 13 12Iowa 71.8 70.6 18.7 19.2 15.6 13.4 ** 31.6 33.7 5.3 4.2 * 12 12 19 17 * 32 32 30 9 8Kansas 78.1 80.1 18.5 21.4 ** 15.4 13.6 * 33.7 37.3 6.3 6.0 14 14 20 17 * 31 32 31 10 9Kentucky 105.8 108.6 21.1 21.7 17.1 15.9 * 48.9 61.7 ** 7.2 6.7 21 20 26 25 34 35 34 16 17Louisiana 123.5 124.9 23.9 22.2 * 18.4 15.5 ** 39.5 45.3 * 8.1 7.6 20 19 24 23 33 36 * 34 17 14 *Maine 62.3 66.2 18.8 18.8 12.5 13.4 38.0 53.9 ** 7.0 6.6 13 15 * 20 20 29 30 28 14 14Maryland 88.7 90.3 21.5 21.3 14.3 13.4 30.0 48.8 ** 6.4 6.6 13 13 16 14 * 29 30 34 9 7 *Massachusetts 60.4 59.9 18.4 16.9 * 13.1 11.0 ** 30.8 50.2 ** 4.2 4.3 12 13 17 14 * 24 23 27 9 8Michigan 91.3 92.2 21.2 20.5 14.8 13.1 * 37.7 47.1 * 6.9 6.5 16 17 21 20 32 33 32 11 11Minnesota 55.6 54.7 19.6 17.0 ** 12.8 11.9 29.3 34.4 5.0 5.2 11 11 18 15 * 26 28 * 28 7 7Mississippi 136.7 142.4 23.3 23.3 18.8 17.2 * 33.2 35.5 8.9 9.5 21 20 25 23 * 37 39 * 37 18 18Missouri 95.1 95.7 22.0 21.1 15.7 13.8 * 40.0 49.5 * 6.6 6.5 17 17 22 22 31 32 29 12 14 *Montana 70.3 71.2 19.9 19.4 12.4 12.2 48.8 50.2 5.9 5.8 14 13 19 18 25 26 23 11 11Nebraska 64.9 68.2 21.0 20.1 15.2 13.6 * 26.6 28.5 4.7 5.7 * 12 13 18 17 30 33 * 29 8 7Nevada 91.7 95.5 22.5 21.6 16.8 16.4 49.4 52.3 4.9 5.2 16 20 ** 19 16 * 27 26 30 11 11New Hampshire 58.4 57.7 19.8 19.0 12.8 12.6 34.7 64.3 ** 4.2 4.1 11 13 * 16 18 * 27 27 24 10 10New Jersey 75.1 73.1 23.2 21.2 ** 14.9 13.7 * 29.7 37.7 * 4.4 4.7 15 16 16 14 * 27 27 32 9 9New Mexico 78.6 80.0 17.3 20.3 ** 14.5 12.2 ** 61.8 72.2 * 6.8 5.1 ** 19 19 19 16 * 28 30 * 25 10 10New York 79.0 77.1 20.6 19.9 14.0 12.1 * 25.7 32.8 * 5.0 4.6 16 14 * 17 14 * 25 26 32 10 9North Carolina 92.5 93.6 20.4 20.1 13.3 12.4 34.5 41.8 * 7.4 7.4 17 17 20 18 * 30 33 * 31 13 12North Dakota 70.5 73.3 17.9 17.9 15.9 12.8 ** 32.1 41.7 * 6.3 7.2 * 12 13 21 20 31 32 37 9 8Ohio 94.5 94.5 22.9 21.6 * 16.3 15.0 * 42.6 63.0 ** 7.5 7.2 16 16 23 23 31 32 33 13 14Oklahoma 117.5 126.3 22.9 22.2 17.5 16.3 * 51.1 56.8 * 7.5 7.3 19 18 24 19 ** 34 33 34 14 14Oregon 61.9 62.6 19.9 21.5 * 14.4 12.7 * 39.2 41.3 5.4 5.2 16 15 17 16 27 29 * 20 10 10Pennsylvania 82.0 82.6 21.8 21.5 15.9 14.1 * 39.4 59.5 ** 7.1 6.2 * 15 14 21 18 * 30 30 32 11 11Rhode Island 68.5 68.2 19.4 18.4 * 13.2 11.9 * 43.3 54.3 ** 6.5 5.9 14 14 17 14 * 27 27 36 9 8South Carolina 99.2 99.2 21.3 22.4 * 15.0 13.7 * 38.3 45.4 * 7.5 6.9 17 18 22 20 * 33 33 33 15 13 *South Dakota 74.5 75.8 19.9 19.8 16.7 14.6 ** 38.0 44.8 * 8.3 7.3 * 10 11 20 18 * 30 30 31 9 9Tennessee 110.0 113.3 22.4 22.0 16.6 14.4 ** 44.1 51.9 * 7.2 7.0 21 18 * 23 22 35 37 * 38 18 13 **Texas 93.4 95.3 20.2 19.7 14.7 13.5 * 33.1 35.7 5.8 5.7 17 16 16 14 * 32 34 * 33 8 7Utah 61.4 60.7 20.3 19.0 * 10.9 10.1 48.7 50.7 4.8 5.0 11 11 10 9 24 25 19 6 6Vermont 57.2 61.4 18.5 13.6 ** 14.3 15.7 * 39.3 46.1 * 4.3 4.6 11 12 17 17 25 27 * 22 11 10Virginia 81.3 80.2 21.1 20.9 13.8 13.0 30.4 38.4 * 6.5 5.9 14 14 19 15 ** 27 30 * 27 11 9 *Washington 62.2 62.4 20.5 19.4 * 12.8 11.6 * 38.6 39.3 5.3 4.9 15 13 * 16 14 * 27 29 * 25 8 7West Virginia 103.5 106.9 21.6 21.9 19.8 17.4 ** 60.5 83.1 ** 7.2 7.1 22 24 * 27 25 * 37 39 * 35 23 21 *Wisconsin 69.4 69.4 20.4 19.3 * 14.1 12.3 * 37.3 42.9 * 5.7 5.8 14 14 19 17 * 29 30 30 11 10Wyoming 68.0 73.8 20.5 20.3 12.6 11.0 * 51.5 55.9 5.6 4.9 * 14 14 21 19 * 29 28 27 11 12
ChangeStates Improved 0 16 39 0 6 4 32 1 8States Worsened 0 5 2 33 7 7 1 18 1
Notes: * Denotes a change of at least 0.5 standard deviations. ** Denotes a change of 1.0 standard deviation or more.
Mortality amenable to health care, deaths per
100,000 population
Breast cancer deaths per 100,000 female
populationColorectal cancer deaths per 100,000 population
Deaths from suicide, alcohol, and drug use per
100,000 populationInfant mortality, deaths
per 1,000 live birthsAdults who report
fair/poor health Adults who smoke Adults who are obese
Children who are
overweight or obese
Adults who have lost six or more teeth
APPENDIX F2. Healthy Lives: Dimension Ranking and Indicator Rates (continued)
Notes: * Denotes a change of at least 0.5 standard deviations. ** Denotes a change of 1.0 standard deviation or more.

commonwealthfund.org May 2018
2018 Scorecard on State Health System Performance 50
Appendix F3. Mortality Amenable to Health Care by Race, Deaths per 100,000 population, 2012–13 & 2014–15
2012-13 2014-15Change in
rate% change
in rate 2012-13 2014-15Change in
rate% change
in rate 2012-13 2014-15Change in
rate% change
in rate 2012-13 2014-15Change in
rate% change
in rate
United States 83.7 84.3 0.6 1% 77.4 78.4 1.0 1% 155.2 154.7 -0.6 0% 66.6 66.2 -0.4 -1%
Alabama 111.3 110.4 -0.9 -1% 97.2 95.9 -1.3 -1% 165.5 165.3 -0.2 0% 43.3 42.5 -0.8 -2%
Alaska 71.6 73.2 1.6 2% 64.2 61.8 -2.4 -4% 97.5 96.5 -1.1 -1% — 43.8 — —
Arizona 72.4 73.5 1.1 2% 69.2 71.4 2.2 3% 126.5 126.2 -0.3 0% 68.7 68.1 -0.5 -1%
Arkansas 118.9 123.6 4.6 4% 110.8 116.2 5.4 5% 197.3 195.8 -1.5 -1% 50.2 47.4 -2.9 -6%
California 72.0 70.8 -1.2 -2% 71.8 70.4 -1.4 -2% 147.6 148.1 0.6 0% 65.8 64.5 -1.3 -2%
Colorado 59.2 62.7 3.4 6% 55.9 59.3 3.4 6% 105.8 116.9 11.1 11% 70.2 73.1 2.8 4%
Connecticut 61.3 59.1 -2.1 -3% 57.0 54.8 -2.1 -4% 109.3 102.2 -7.1 -7% 61.4 59.7 -1.6 -3%
Delaware 85.0 83.4 -1.6 -2% 75.2 77.5 2.3 3% 132.6 122.7 -10.0 -8% 57.0 50.5 -6.5 -11%
District of Columbia 123.9 127.9 4.0 3% 41.4 43.2 1.8 4% 186.4 193.4 7.0 4% 49.0 49.7 0.6 1%
Florida 80.0 80.9 0.9 1% 77.0 79.0 1.9 3% 138.7 136.9 -1.9 -1% 56.2 55.5 -0.7 -1%
Georgia 100.4 103.5 3.2 3% 86.4 88.5 2.1 2% 151.4 155.7 4.3 3% 38.0 43.9 5.8 15%
Hawaii 75.3 76.1 0.8 1% 59.3 66.2 6.9 12% 106.4 98.2 -8.2 -8% 84.5 91.1 6.6 8%
Idaho 66.7 64.9 -1.7 -3% 67.5 66.1 -1.5 -2% — — — — 52.9 51.0 -1.9 -4%
Illinois 87.1 87.7 0.6 1% 76.4 78.6 2.2 3% 178.4 176.1 -2.3 -1% 59.6 58.7 -1.0 -2%
Indiana 91.0 92.2 1.2 1% 86.6 88.2 1.7 2% 159.3 155.5 -3.8 -2% 61.9 58.9 -3.0 -5%
Iowa 71.8 70.6 -1.2 -2% 70.5 70.5 0.0 0% 151.4 129.1 -22.3 -15% 47.4 36.4 -11.0 -23%
Kansas 78.1 80.1 2.0 3% 75.0 77.2 2.2 3% 146.9 155.3 8.4 6% 63.7 60.9 -2.8 -4%
Kentucky 105.8 108.6 2.8 3% 104.0 107.0 3.0 3% 155.4 155.7 0.4 0% 36.8 43.8 7.0 19%
Louisiana 123.5 124.9 1.4 1% 100.8 101.5 0.7 1% 188.7 190.3 1.6 1% 43.2 52.1 9.0 21%
Maine 62.3 66.2 3.9 6% 62.5 66.2 3.6 6% 98.9 83.8 -15.1 -15% — — — —
Maryland 88.7 90.3 1.6 2% 76.0 78.5 2.5 3% 135.2 135.1 -0.1 0% 39.2 41.9 2.7 7%
Massachusetts 60.4 59.9 -0.5 -1% 60.0 59.9 -0.1 0% 89.5 85.0 -4.5 -5% 54.4 55.3 0.8 2%
Michigan 91.3 92.2 0.9 1% 77.5 79.8 2.3 3% 190.3 186.8 -3.5 -2% 77.3 74.7 -2.6 -3%
Minnesota 55.6 54.7 -0.9 -2% 53.0 51.0 -2.0 -4% 99.6 105.5 5.9 6% 45.6 47.7 2.1 5%
Mississippi 136.7 142.4 5.6 4% 109.1 114.9 5.8 5% 198.4 201.6 3.2 2% 46.9 42.8 -4.1 -9%
Missouri 95.1 95.7 0.7 1% 88.6 89.1 0.5 1% 165.7 168.6 2.8 2% 55.8 56.2 0.5 1%
Montana 70.3 71.2 0.9 1% 66.1 66.4 0.3 0% — — — — 49.4 — — —
Nebraska 64.9 68.2 3.3 5% 62.3 67.3 4.9 8% 140.7 126.4 -14.3 -10% 44.4 51.8 7.4 17%
Nevada 91.7 95.5 3.9 4% 97.0 99.3 2.3 2% 144.7 157.1 12.4 9% 61.9 65.0 3.2 5%
New Hampshire 58.4 57.7 -0.6 -1% 59.7 59.0 -0.6 -1% — 74.4 — — — — — —
New Jersey 75.1 73.1 -2.0 -3% 71.1 68.7 -2.4 -3% 143.6 140.8 -2.8 -2% 55.5 55.2 -0.4 -1%
New Mexico 78.6 80.0 1.3 2% 71.6 77.5 5.9 8% 105.6 130.0 24.4 23% 84.0 78.5 -5.5 -7%
New York 79.0 77.1 -1.9 -2% 71.1 70.2 -0.9 -1% 139.8 135.3 -4.6 -3% 73.6 68.8 -4.8 -7%
North Carolina 92.5 93.6 1.0 1% 80.8 81.9 1.1 1% 151.0 150.2 -0.8 -1% 34.7 41.7 7.0 20%
North Dakota 70.5 73.3 2.8 4% 65.9 68.4 2.6 4% — — — — — 68.6 — —
Ohio 94.5 94.5 0.1 0% 87.3 87.2 -0.1 0% 163.5 164.9 1.4 1% 58.9 55.8 -3.1 -5%
Oklahoma 117.5 126.3 8.8 7% 112.9 120.0 7.1 6% 189.2 200.5 11.3 6% 75.7 77.7 2.0 3%
Oregon 61.9 62.6 0.7 1% 62.6 63.5 0.8 1% 112.5 104.2 -8.2 -7% 50.7 46.0 -4.7 -9%
Pennsylvania 82.0 82.6 0.5 1% 74.6 75.7 1.1 1% 161.9 157.3 -4.6 -3% 67.2 75.5 8.4 12%
Rhode Island 68.5 68.2 -0.2 0% 70.1 67.6 -2.5 -4% 102.2 102.4 0.1 0% 46.9 48.8 1.9 4%
South Carolina 99.2 99.2 0.0 0% 83.1 82.5 -0.6 -1% 156.3 155.7 -0.6 0% 40.0 45.6 5.6 14%
South Dakota 74.5 75.8 1.3 2% 66.3 66.4 0.1 0% — — — — — 55.3 — —
Tennessee 110.0 113.3 3.3 3% 101.1 105.5 4.3 4% 179.1 177.1 -2.0 -1% 42.6 48.0 5.4 13%
Texas 93.4 95.3 1.9 2% 87.9 90.0 2.1 2% 164.2 167.2 3.0 2% 85.3 86.9 1.6 2%
Utah 61.4 60.7 -0.7 -1% 59.8 60.3 0.4 1% 160.9 122.6 -38.3 -24% 62.0 50.7 -11.3 -18%
Vermont 57.2 61.4 4.2 7% 57.5 61.7 4.3 7% — — — — — — — —
Virginia 81.3 80.2 -1.0 -1% 72.1 72.8 0.8 1% 140.4 135.0 -5.4 -4% 35.4 38.5 3.1 9%
Washington 62.2 62.4 0.2 0% 61.8 62.2 0.4 1% 99.3 110.0 10.7 11% 45.7 51.3 5.6 12%
West Virginia 103.5 106.9 3.4 3% 103.3 106.5 3.3 3% 154.2 153.5 -0.6 0% — — — —
Wisconsin 69.4 69.4 0.0 0% 63.9 63.6 -0.3 0% 159.9 171.7 11.8 7% 51.9 55.6 3.7 7%
Wyoming 68.0 73.8 5.8 9% 67.3 73.7 6.4 9% — — — — 61.5 52.4 -9.1 -15%
Notes: — Indicates that estimates are not available.
Total White Black Hispanic
APPENDIX F3. Mortality Amenable to Health Care by Race, Deaths per 100,000 population, 2012–13 & 2014–15
Notes: — Indicates that estimates are not available.

commonwealthfund.org May 2018
2018 Scorecard on State Health System Performance 51
Appendix G1. Disparity: Dimension and Indicator Ranking
Uninsure
d adults
Uninsure
d childre
n
Adults w
ithout a
usual sourc
e of
careWent w
ithout c
are because of
costAdults
with
out a denta
l visit
Adults w
ithout a
ll recom
mended
cancer scre
enings
Adults w
ithout a
ll recom
mended
vaccines
Childre
n with
out a m
edical hom
e
Childre
n with
out a m
edical and
dental p
reventiv
e care visit
Childre
n ages 19–35 month
s
without a
ll recom
mended
vaccines
Medicare benefic
iaries re
ceived a
high-risk dru
g
Hospital a
dmissio
ns for p
ediatric
asthm
a
Preventa
ble hospitaliz
ations,
Medicare duals, a
ge 65+
30-day re
admissio
ns, Medicare
duals, age 65+
Avoidable em
ergency departm
ent
visits, M
edicare duals, a
ge 65+
Adults w
ho smoke
Adults w
ho are obese
Adults w
ho have lost s
ix or more
teeth
Adults w
ho report
fair/poor
health
Central L
ine-associated Blood
Stream
Infe
ction (C
LABSI), SIR
*
state rank1 Hawaii 1 1 2 2 1 4 2 1 2 2 3 0 1 1 1 1 1 1 1
2 Massachusetts 1 1 1 1 1 3 1 2 1 2 2 2 2 1 1 3 2 1
3 Utah 3 4 3 2 2 2 3 1 3 2 1 1 2 1 1 1 1 1
4 New York 1 1 2 1 1 1 1 2 2 2 1 4 1 2 1 1 2 1 1
5 Idaho 3 1 3 3 4 1 4 1 1 1 1 1 1 1 3 1 2 2
6 Washington 2 2 2 2 4 2 3 2 1 2 1 1 1 1 2 2 3 2 2
7 Minnesota 1 1 2 1 1 2 2 2 4 3 2 3 1 1 1 2 4 2 1
8 Illinois 2 1 2 2 1 1 1 3 2 2 1 3 4 3 3 1 1 1 2
8 New Mexico 2 2 4 2 2 1 3 3 3 3 1 2 1 1 2 1 1 1 2
10 Wisconsin 2 2 2 2 2 1 1 2 4 1 1 4 2 2 2 3 1 3 4
11 Pennsylvania 2 3 1 1 2 1 1 3 3 1 1 4 2 2 1 2 1 3 1
12 South Dakota 3 3 1 2 2 4 2 1 2 3 3 1 2 1 1 4 1 2 1
13 Arizona 3 4 4 3 3 1 3 3 2 1 1 1 1 2 4 1 3 1 3
14 Connecticut 1 1 3 1 1 3 2 3 3 3 1 2 3 3 1 4 2 2
15 Oregon 1 2 1 2 2 4 1 2 4 2 3 1 1 1 1 3 3 3 4
15 Vermont 1 1 1 1 4 4 3 1 3 3 3 0 1 1 2 4 1 4 3
17 Nevada 3 4 4 3 3 2 1 3 2 3 1 2 2 3 1 1 2 2 2
18 Maine 2 2 1 1 3 3 2 2 1 1 3 3 2 2 4 1 4 2
19 Iowa 1 1 1 1 3 2 2 3 3 2 3 3 2 2 2 3 2 2 4
19 Louisiana 3 1 3 4 3 1 1 4 1 1 1 2 3 3 4 1 1 3 2
21 Colorado 2 3 3 2 2 1 4 4 4 1 1 2 1 1 2 2 2 2 2
22 California 2 2 4 1 4 1 2 4 4 2 1 2 1 2 1 1 3 1 3
22 Rhode Island 1 1 2 3 2 1 1 4 2 4 2 4 3 2 4 1 4 1 1
24 New Jersey 3 3 3 3 2 1 1 3 3 4 3 4 2 4 1 1 2 1 2
25 Montana 3 3 3 2 1 4 4 1 2 1 3 2 1 4 4 2 4 1
26 North Dakota 3 4 1 1 4 4 2 1 2 3 4 0 1 1 3 3 3 3 1
27 Delaware 2 3 3 3 4 4 2 3 1 1 1 4 4 3 2 1 2 2
28 District of Columbia 1 3 1 3 1 2 4 2 1 3 1 4 3 4 2 4 1 3
29 West Virginia 1 1 1 1 4 2 1 1 4 4 1 0 4 3 4 4 1 4 4
29 Wyoming 3 2 4 3 2 1 3 1 1 4 2 0 3 3 2 4 3 2 3
31 Maryland 2 2 3 3 4 2 3 1 2 3 1 4 2 3 2 2 3 2 3
32 Michigan 1 2 2 1 1 3 2 2 4 4 3 3 3 3 2 4 2 4 2
33 Alaska 4 4 1 3 1 1 4 3 4 4 1 2 1 4 4 1 4 1
34 Alabama 4 2 3 4 2 3 3 1 1 3 3 3 3 3 3 2 3 4
35 Nebraska 4 4 3 3 4 3 3 4 4 3 4 2 3 2 2 3 1 1 2
35 New Hampshire 2 3 1 2 1 4 1 1 3 3 3 4 2 3 4 4 4 4
35 South Carolina 3 2 2 4 4 4 2 2 1 2 1 2 3 4 4 3 4 3 3
38 Indiana 3 4 3 3 4 4 3 3 3 2 3 4 3 4 3 3 1 3 2
39 Arkansas 2 2 3 3 3 2 4 2 4 4 3 0 4 4 3 4 1 3 3
40 Texas 4 4 4 4 4 4 4 4 2 2 1 1 3 3 2 1 2 1 1
41 Kentucky 1 3 1 2 2 4 2 2 1 1 4 3 4 4 3 4 3 4 4
42 Tennessee 3 2 1 3 3 2 1 4 2 4 4 1 4 4 4 3 3 4 3
43 Mississippi 4 3 3 4 2 2 2 4 1 3 2 4 4 4 1 3 3 2
44 Kansas 4 4 4 3 3 3 4 4 4 3 3 1 2 2 2 3 3 2 2
44 North Carolina 4 3 3 4 1 3 3 1 2 3 3 2 3 4 4 2 4 2 4
44 Virginia 4 4 4 4 2 2 3 2 2 2 2 3 4 4 4 2 3 3 2
47 Georgia 4 4 4 4 3 3 4 3 1 1 1 1 3 3 3 1 4 3 4
47 Ohio 1 2 2 1 2 2 3 2 3 4 3 4 4 3 4 4 4 3
49 Florida 4 3 4 4 2 2 3 2 2 3 3 3 4 4 3 1 3 3 4
50 Oklahoma 4 3 4 4 2 3 3 4 2 1 4 3 4 3 4 3 4 4 4
51 Missouri 3 3 1 4 4 4 4 4 4 4 4 4 3 3 3 4 1 4 4
APPENDIX G1. Disparity: Dimension and Indicator Ranking
Overall performanceTop quartileSecond quartileThird quartileBottom quartileData not available

commonwealthfund.org May 2018
2018 Scorecard on State Health System Performance 52
Appendix G1. Disparity: Dimension and Indicator Ranking
Uninsure
d adults
Uninsure
d childre
n
Adults w
ithout a
usual sourc
e of
careWent w
ithout c
are because of
costAdults
with
out a denta
l visit
Adults w
ithout a
ll recom
mended
cancer scre
enings
Adults w
ithout a
ll recom
mended
vaccines
Childre
n with
out a m
edical hom
e
Childre
n with
out a m
edical and
dental p
reventiv
e care visit
Childre
n ages 19–35 month
s
without a
ll recom
mended
vaccines
Medicare benefic
iaries re
ceived a
high-risk dru
g
Hospital a
dmissio
ns for p
ediatric
asthm
a
Preventa
ble hospitaliz
ations,
Medicare duals, a
ge 65+
30-day re
admissio
ns, Medicare
duals, age 65+
Avoidable em
ergency departm
ent
visits, M
edicare duals, a
ge 65+
Adults w
ho smoke
Adults w
ho are obese
Adults w
ho have lost s
ix or more
teeth
Adults w
ho report
fair/poor
health
Central L
ine-associated Blood
Stream
Infe
ction (C
LABSI), SIR
*
state rank1 Hawaii 1 1 2 2 1 4 2 1 2 2 3 0 1 1 1 1 1 1 1
2 Massachusetts 1 1 1 1 1 3 1 2 1 2 2 2 2 1 1 3 2 1
3 Utah 3 4 3 2 2 2 3 1 3 2 1 1 2 1 1 1 1 1
4 New York 1 1 2 1 1 1 1 2 2 2 1 4 1 2 1 1 2 1 1
5 Idaho 3 1 3 3 4 1 4 1 1 1 1 1 1 1 3 1 2 2
6 Washington 2 2 2 2 4 2 3 2 1 2 1 1 1 1 2 2 3 2 2
7 Minnesota 1 1 2 1 1 2 2 2 4 3 2 3 1 1 1 2 4 2 1
8 Illinois 2 1 2 2 1 1 1 3 2 2 1 3 4 3 3 1 1 1 2
8 New Mexico 2 2 4 2 2 1 3 3 3 3 1 2 1 1 2 1 1 1 2
10 Wisconsin 2 2 2 2 2 1 1 2 4 1 1 4 2 2 2 3 1 3 4
11 Pennsylvania 2 3 1 1 2 1 1 3 3 1 1 4 2 2 1 2 1 3 1
12 South Dakota 3 3 1 2 2 4 2 1 2 3 3 1 2 1 1 4 1 2 1
13 Arizona 3 4 4 3 3 1 3 3 2 1 1 1 1 2 4 1 3 1 3
14 Connecticut 1 1 3 1 1 3 2 3 3 3 1 2 3 3 1 4 2 2
15 Oregon 1 2 1 2 2 4 1 2 4 2 3 1 1 1 1 3 3 3 4
15 Vermont 1 1 1 1 4 4 3 1 3 3 3 0 1 1 2 4 1 4 3
17 Nevada 3 4 4 3 3 2 1 3 2 3 1 2 2 3 1 1 2 2 2
18 Maine 2 2 1 1 3 3 2 2 1 1 3 3 2 2 4 1 4 2
19 Iowa 1 1 1 1 3 2 2 3 3 2 3 3 2 2 2 3 2 2 4
19 Louisiana 3 1 3 4 3 1 1 4 1 1 1 2 3 3 4 1 1 3 2
21 Colorado 2 3 3 2 2 1 4 4 4 1 1 2 1 1 2 2 2 2 2
22 California 2 2 4 1 4 1 2 4 4 2 1 2 1 2 1 1 3 1 3
22 Rhode Island 1 1 2 3 2 1 1 4 2 4 2 4 3 2 4 1 4 1 1
24 New Jersey 3 3 3 3 2 1 1 3 3 4 3 4 2 4 1 1 2 1 2
25 Montana 3 3 3 2 1 4 4 1 2 1 3 2 1 4 4 2 4 1
26 North Dakota 3 4 1 1 4 4 2 1 2 3 4 0 1 1 3 3 3 3 1
27 Delaware 2 3 3 3 4 4 2 3 1 1 1 4 4 3 2 1 2 2
28 District of Columbia 1 3 1 3 1 2 4 2 1 3 1 4 3 4 2 4 1 3
29 West Virginia 1 1 1 1 4 2 1 1 4 4 1 0 4 3 4 4 1 4 4
29 Wyoming 3 2 4 3 2 1 3 1 1 4 2 0 3 3 2 4 3 2 3
31 Maryland 2 2 3 3 4 2 3 1 2 3 1 4 2 3 2 2 3 2 3
32 Michigan 1 2 2 1 1 3 2 2 4 4 3 3 3 3 2 4 2 4 2
33 Alaska 4 4 1 3 1 1 4 3 4 4 1 2 1 4 4 1 4 1
34 Alabama 4 2 3 4 2 3 3 1 1 3 3 3 3 3 3 2 3 4
35 Nebraska 4 4 3 3 4 3 3 4 4 3 4 2 3 2 2 3 1 1 2
35 New Hampshire 2 3 1 2 1 4 1 1 3 3 3 4 2 3 4 4 4 4
35 South Carolina 3 2 2 4 4 4 2 2 1 2 1 2 3 4 4 3 4 3 3
38 Indiana 3 4 3 3 4 4 3 3 3 2 3 4 3 4 3 3 1 3 2
39 Arkansas 2 2 3 3 3 2 4 2 4 4 3 0 4 4 3 4 1 3 3
40 Texas 4 4 4 4 4 4 4 4 2 2 1 1 3 3 2 1 2 1 1
41 Kentucky 1 3 1 2 2 4 2 2 1 1 4 3 4 4 3 4 3 4 4
42 Tennessee 3 2 1 3 3 2 1 4 2 4 4 1 4 4 4 3 3 4 3
43 Mississippi 4 3 3 4 2 2 2 4 1 3 2 4 4 4 1 3 3 2
44 Kansas 4 4 4 3 3 3 4 4 4 3 3 1 2 2 2 3 3 2 2
44 North Carolina 4 3 3 4 1 3 3 1 2 3 3 2 3 4 4 2 4 2 4
44 Virginia 4 4 4 4 2 2 3 2 2 2 2 3 4 4 4 2 3 3 2
47 Georgia 4 4 4 4 3 3 4 3 1 1 1 1 3 3 3 1 4 3 4
47 Ohio 1 2 2 1 2 2 3 2 3 4 3 4 4 3 4 4 4 3
49 Florida 4 3 4 4 2 2 3 2 2 3 3 3 4 4 3 1 3 3 4
50 Oklahoma 4 3 4 4 2 3 3 4 2 1 4 3 4 3 4 3 4 4 4
51 Missouri 3 3 1 4 4 4 4 4 4 4 4 4 3 3 3 4 1 4 4
APPENDIX G1. Disparity: Dimension and Indicator Ranking (continued)
Appendix G1. Disparity: Dimension and Indicator Ranking
Uninsure
d adults
Uninsure
d childre
n
Adults w
ithout a
usual sourc
e of
careWent w
ithout c
are because of
costAdults
with
out a denta
l visit
Adults w
ithout a
ll recom
mended
cancer scre
enings
Adults w
ithout a
ll recom
mended
vaccines
Childre
n with
out a m
edical hom
e
Childre
n with
out a m
edical and
dental p
reventiv
e care visit
Childre
n ages 19–35 month
s
without a
ll recom
mended
vaccines
Medicare benefic
iaries re
ceived a
high-risk dru
g
Hospital a
dmissio
ns for p
ediatric
asthm
a
Preventa
ble hospitaliz
ations,
Medicare duals, a
ge 65+
30-day re
admissio
ns, Medicare
duals, age 65+
Avoidable em
ergency departm
ent
visits, M
edicare duals, a
ge 65+
Adults w
ho smoke
Adults w
ho are obese
Adults w
ho have lost s
ix or more
teeth
Adults w
ho report
fair/poor
health
Central L
ine-associated Blood
Stream
Infe
ction (C
LABSI), SIR
*
state rank1 Hawaii 1 1 2 2 1 4 2 1 2 2 3 0 1 1 1 1 1 1 1
2 Massachusetts 1 1 1 1 1 3 1 2 1 2 2 2 2 1 1 3 2 1
3 Utah 3 4 3 2 2 2 3 1 3 2 1 1 2 1 1 1 1 1
4 New York 1 1 2 1 1 1 1 2 2 2 1 4 1 2 1 1 2 1 1
5 Idaho 3 1 3 3 4 1 4 1 1 1 1 1 1 1 3 1 2 2
6 Washington 2 2 2 2 4 2 3 2 1 2 1 1 1 1 2 2 3 2 2
7 Minnesota 1 1 2 1 1 2 2 2 4 3 2 3 1 1 1 2 4 2 1
8 Illinois 2 1 2 2 1 1 1 3 2 2 1 3 4 3 3 1 1 1 2
8 New Mexico 2 2 4 2 2 1 3 3 3 3 1 2 1 1 2 1 1 1 2
10 Wisconsin 2 2 2 2 2 1 1 2 4 1 1 4 2 2 2 3 1 3 4
11 Pennsylvania 2 3 1 1 2 1 1 3 3 1 1 4 2 2 1 2 1 3 1
12 South Dakota 3 3 1 2 2 4 2 1 2 3 3 1 2 1 1 4 1 2 1
13 Arizona 3 4 4 3 3 1 3 3 2 1 1 1 1 2 4 1 3 1 3
14 Connecticut 1 1 3 1 1 3 2 3 3 3 1 2 3 3 1 4 2 2
15 Oregon 1 2 1 2 2 4 1 2 4 2 3 1 1 1 1 3 3 3 4
15 Vermont 1 1 1 1 4 4 3 1 3 3 3 0 1 1 2 4 1 4 3
17 Nevada 3 4 4 3 3 2 1 3 2 3 1 2 2 3 1 1 2 2 2
18 Maine 2 2 1 1 3 3 2 2 1 1 3 3 2 2 4 1 4 2
19 Iowa 1 1 1 1 3 2 2 3 3 2 3 3 2 2 2 3 2 2 4
19 Louisiana 3 1 3 4 3 1 1 4 1 1 1 2 3 3 4 1 1 3 2
21 Colorado 2 3 3 2 2 1 4 4 4 1 1 2 1 1 2 2 2 2 2
22 California 2 2 4 1 4 1 2 4 4 2 1 2 1 2 1 1 3 1 3
22 Rhode Island 1 1 2 3 2 1 1 4 2 4 2 4 3 2 4 1 4 1 1
24 New Jersey 3 3 3 3 2 1 1 3 3 4 3 4 2 4 1 1 2 1 2
25 Montana 3 3 3 2 1 4 4 1 2 1 3 2 1 4 4 2 4 1
26 North Dakota 3 4 1 1 4 4 2 1 2 3 4 0 1 1 3 3 3 3 1
27 Delaware 2 3 3 3 4 4 2 3 1 1 1 4 4 3 2 1 2 2
28 District of Columbia 1 3 1 3 1 2 4 2 1 3 1 4 3 4 2 4 1 3
29 West Virginia 1 1 1 1 4 2 1 1 4 4 1 0 4 3 4 4 1 4 4
29 Wyoming 3 2 4 3 2 1 3 1 1 4 2 0 3 3 2 4 3 2 3
31 Maryland 2 2 3 3 4 2 3 1 2 3 1 4 2 3 2 2 3 2 3
32 Michigan 1 2 2 1 1 3 2 2 4 4 3 3 3 3 2 4 2 4 2
33 Alaska 4 4 1 3 1 1 4 3 4 4 1 2 1 4 4 1 4 1
34 Alabama 4 2 3 4 2 3 3 1 1 3 3 3 3 3 3 2 3 4
35 Nebraska 4 4 3 3 4 3 3 4 4 3 4 2 3 2 2 3 1 1 2
35 New Hampshire 2 3 1 2 1 4 1 1 3 3 3 4 2 3 4 4 4 4
35 South Carolina 3 2 2 4 4 4 2 2 1 2 1 2 3 4 4 3 4 3 3
38 Indiana 3 4 3 3 4 4 3 3 3 2 3 4 3 4 3 3 1 3 2
39 Arkansas 2 2 3 3 3 2 4 2 4 4 3 0 4 4 3 4 1 3 3
40 Texas 4 4 4 4 4 4 4 4 2 2 1 1 3 3 2 1 2 1 1
41 Kentucky 1 3 1 2 2 4 2 2 1 1 4 3 4 4 3 4 3 4 4
42 Tennessee 3 2 1 3 3 2 1 4 2 4 4 1 4 4 4 3 3 4 3
43 Mississippi 4 3 3 4 2 2 2 4 1 3 2 4 4 4 1 3 3 2
44 Kansas 4 4 4 3 3 3 4 4 4 3 3 1 2 2 2 3 3 2 2
44 North Carolina 4 3 3 4 1 3 3 1 2 3 3 2 3 4 4 2 4 2 4
44 Virginia 4 4 4 4 2 2 3 2 2 2 2 3 4 4 4 2 3 3 2
47 Georgia 4 4 4 4 3 3 4 3 1 1 1 1 3 3 3 1 4 3 4
47 Ohio 1 2 2 1 2 2 3 2 3 4 3 4 4 3 4 4 4 3
49 Florida 4 3 4 4 2 2 3 2 2 3 3 3 4 4 3 1 3 3 4
50 Oklahoma 4 3 4 4 2 3 3 4 2 1 4 3 4 3 4 3 4 4 4
51 Missouri 3 3 1 4 4 4 4 4 4 4 4 4 3 3 3 4 1 4 4
Overall performanceTop quartileSecond quartileThird quartileBottom quartileData not available

commonwealthfund.org May 2018
2018 Scorecard on State Health System Performance 53
Appendix G2. Disparity: Indicator Rates for Low-Income Population and Difference from Higher-Income Population
Rate Rate Rate Rate Rate Rate Rate Rate Rate Rate Rate Rate Rate Rate Rate Rate Rate Rate RateUnited States 23% -19 6% -4 27% -12 23% -16 24% -13 35% -10 67% -8 63% -26 38% -15 33% -10 16% -4 166 -95 99 -56 63 -33 366 -191 23% -12 38% -9 17% -12 29% -22Alabama 27 * -23 4 * -3 26 -11 33 * -28 25 * -13 37 * -13 71 * -9 51 -12 27 0 27 * -14 22 * -5 — — — 118 * -66 69 * -36 396 * -226 31 -16 46 * -9 22 * -15 34 * -25Alaska 34 * -24 14 * -10 34 * -6 28 * -20 14 * -5 34 * 1 77 * -16 65 -27 49 -20 42 -23 13 * -1 — — — 77 -52 34 * -19 453 -282 37 * -25 35 -4 23 * -18 21 * -14Arizona 22 * -17 10 * -7 32 * -14 23 * -16 26 * -14 34 * -6 70 * -9 65 -27 34 -13 27 * 9 13 * 0 115 * -62 64 * -36 46 * -22 413 * -236 18 * -9 37 * -10 12 * -8 30 * -23Arkansas 18 * -13 5 -3 23 * -11 23 * -16 23 * -14 38 * -10 70 * -13 59 -23 44 -17 36 -16 21 * -6 113 — 120 -75 70 * -41 385 * -215 33 * -21 40 * 0 23 -17 34 * -24California 19 * -15 4 * -3 35 * -19 18 * -11 25 * -15 29 * -6 70 -8 70 -32 48 -27 38 -10 13 * -2 144 * -85 68 * -40 51 * -28 301 * -156 13 * -5 33 * -11 9 * -6 30 * -23Colorado 19 * -15 7 * -5 31 -13 21 * -14 24 * -13 34 * -7 65 -12 66 -28 44 -22 23 -3 13 * -1 214 * -101 61 -37 36 * -18 339 * -178 25 -15 30 * -8 14 * -11 28 * -22Connecticut 14 * -11 2 * 0 19 * -10 15 * -9 17 * -10 31 * -11 61 * -7 61 -27 32 -14 30 * -13 12 -3 — — — 94 -51 66 * -33 379 * -209 21 * -12 36 -12 13 * -10 28 * -22Delaware 15 * -12 6 -4 21 * -10 21 * -17 24 * -16 35 * -16 65 * -8 60 -25 32 -8 22 * -3 12 * -2 — — — 109 -67 70 * -43 385 * -228 25 * -14 34 * -3 18 -12 26 * -21District of Columbia 8 * -6 5 * -4 20 * -3 20 * -16 14 * -4 28 * -8 72 * -17 62 -23 30 -7 35 * -11 15 -2 — — — 109 * -72 61 * -35 430 * -259 22 * -13 45 * -26 12 * -9 27 * -24Florida 31 * -24 8 * -5 36 -15 29 * -22 26 -12 36 * -8 73 -10 67 -22 42 -12 41 -15 18 -6 192 -126 122 * -75 91 * -56 369 * -192 22 * -12 35 * -10 21 * -16 32 * -26Georgia 35 * -29 9 * -6 33 * -15 31 * -25 25 -14 36 -12 73 * -13 62 -26 30 -8 25 * -3 19 * -3 103 * -46 101 * -58 63 * -35 396 * -228 24 * -12 45 * -15 22 -15 34 * -27Hawaii 10 * -8 3 * -1 17 * -7 16 -12 18 -8 36 * -18 66 -7 59 -14 37 -13 28 -10 13 * -5 — — — 52 * -29 29 * -14 232 * -101 21 * -12 33 -7 12 * -9 20 * -11Idaho 27 * -21 6 * -2 33 -11 27 * -18 25 * -15 39 * -5 74 * -12 55 -13 36 -3 24 * -3 15 * -3 — — — 61 -36 28 * -14 294 * -135 24 * -17 33 * -7 14 * -12 26 * -19Illinois 19 * -16 3 * -2 19 * -8 17 * -12 21 * -8 33 * -6 68 * -5 62 -27 33 -10 32 * -10 13 * -3 197 -109 119 * -70 74 * -38 400 * -216 20 * -7 39 -7 12 * -7 27 -20Indiana 21 * -17 8 * -6 24 * -11 23 * -17 25 * -15 42 * -14 69 -9 60 -25 35 -15 30 -6 18 * -6 172 * -127 112 -65 69 * -40 408 * -223 31 * -18 38 * -5 21 * -15 29 * -21Iowa 11 * -9 3 * -2 18 * -4 15 * -11 22 * -14 33 * -8 59 * -7 53 -26 40 -16 32 -10 14 * -6 163 * -118 88 * -49 43 * -20 353 * -183 30 * -18 39 * -9 16 * -12 31 * -25Kansas 27 * -23 8 * -6 30 * -15 25 * -20 23 * -14 38 -11 70 -12 65 -30 49 -29 33 * -14 17 -6 193 * -50 92 * -50 53 * -28 349 * -175 28 * -17 41 * -11 16 -12 26 -20Kentucky 11 * -9 5 * -4 17 * 0 19 * -13 24 * -13 38 -14 66 * -8 52 -23 36 -8 23 * 4 23 -8 156 * -112 146 * -88 80 * -44 427 * -225 39 * -23 44 -11 33 * -25 38 * -31Louisiana 26 * -21 4 -2 28 * -10 31 * -23 29 * -14 33 * -7 70 * -4 65 -32 33 -2 32 * 8 23 -3 165 -98 115 -63 61 * -29 441 -248 27 * -10 41 * -6 22 * -14 30 * -22Maine 20 * -16 7 * -3 12 * -3 17 * -11 21 * -14 35 * -13 62 -7 57 -24 25 -5 30 -3 16 * -6 — — — 93 * -55 42 * -20 355 * -177 31 * -21 36 * -7 25 * -19 26 -19Maryland 18 * -15 5 * -3 22 * -13 21 * -16 26 * -16 33 -8 63 * -11 55 -20 33 -12 33 * -14 14 -3 478 * -402 99 * -54 66 * -30 358 * -184 22 * -13 40 * -11 14 * -10 30 * -23Massachusetts 6 * -4 2 -1 11 * -4 12 * -6 17 * -9 33 * -11 61 -6 56 -24 27 -8 19 -7 12 -4 — — — 97 * -44 63 * -24 343 * -154 20 * -10 33 -11 16 -12 23 * -17Michigan 14 * -11 4 * -3 16 * -7 18 * -10 19 * -10 35 -12 69 * -8 63 -24 43 -27 38 -19 16 -5 195 * -121 110 * -56 77 * -36 398 * -190 33 * -20 39 * -9 23 * -19 30 * -22Minnesota 11 * -9 4 * -2 30 * -7 16 * -10 18 * -10 33 * -9 61 * -8 57 -22 44 -18 34 * -13 11 * -4 162 -109 68 * -28 43 * -16 332 * -156 25 * -15 38 * -12 16 * -13 24 * -18Mississippi 31 * -26 6 * -4 26 -10 32 * -21 24 * -11 34 * -10 68 -8 59 -37 40 -2 32 * -11 22 * -4 — — — 128 * -81 72 -42 466 * -278 28 * -11 48 -11 26 * -17 29 * -21Missouri 26 * -22 7 * -4 22 * -6 28 * -22 29 * -16 43 * -19 67 * -14 63 -29 52 -29 41 * -28 19 * -7 271 * -162 109 -62 70 * -36 411 * -219 37 * -22 36 -4 28 * -22 33 -25Montana 23 * -19 7 -4 32 * -10 18 * -13 20 * -6 47 * -15 69 * -15 55 -19 36 -10 40 * -5 14 * -5 — — — 76 -44 29 * -14 384 * -239 31 -19 33 -9 24 * -20 24 * -16Nebraska 29 * -26 10 -8 25 -13 25 -20 24 * -16 39 * -12 61 * -9 58 -28 44 -18 26 * -12 15 * -7 108 * -75 98 * -60 46 * -23 320 * -175 28 -16 39 -7 12 -8 25 -19Nevada 26 * -20 9 * -7 36 * -15 26 * -19 25 * -14 36 * -8 67 * 1 75 -27 45 -13 33 -13 13 * 0 144 * -77 85 -54 58 * -34 305 * -158 21 * -9 31 -9 16 * -11 29 -19New Hampshire 20 * -16 6 -5 13 * -5 19 * -14 15 * -9 38 * -16 62 * -6 53 -19 30 -15 31 * -15 16 * -6 — — — 117 * -71 50 * -25 390 * -218 33 * -22 40 * -15 23 * -19 34 * -27New Jersey 25 * -21 5 * -4 22 * -13 22 * -17 20 * -11 32 * -5 62 * -2 63 -26 34 -14 39 * -20 14 -5 278 * -169 103 * -54 77 * -40 320 * -157 19 * -8 36 * -9 15 * -9 29 * -21New Mexico 20 * -15 6 -3 37 * -14 19 * -13 24 * -13 39 -6 65 * -10 66 -26 32 -15 35 * -14 14 -1 141 -74 63 -34 40 * -19 348 * -181 22 -12 32 * -5 11 * -7 27 -20New York 15 * -11 3 * -2 18 * -8 17 * -11 20 * -9 33 * -7 63 * -4 59 -24 38 -13 32 * -8 12 -3 584 * -452 87 * -40 59 * -21 283 -121 19 * -9 33 -9 13 -8 25 * -18North Carolina 29 * -25 6 * -4 27 * -11 31 * -22 19 * -7 33 * -11 63 -11 53 -20 29 -10 25 * -13 19 * -6 131 * -85 108 * -66 66 * -39 445 * -265 27 * -15 47 -15 19 * -13 39 * -33North Dakota 20 * -17 14 * -11 28 * -6 14 * -10 25 * -15 43 -15 62 -7 58 -15 49 -10 40 -15 14 -7 — — — 83 * -42 32 -13 358 * -200 32 * -18 41 * -10 18 * -14 24 * -17Ohio 14 * -11 4 * -3 20 * -8 18 * -11 22 * -13 36 -10 67 -9 59 -23 39 -16 43 * -28 17 * -6 — — — 121 -68 74 * -39 436 * -227 37 * -24 43 * -13 26 * -21 31 * -24Oklahoma 35 * -28 8 * -4 28 * -14 27 * -22 26 * -13 41 * -11 63 * -10 69 -33 42 -11 33 * -1 24 -7 201 -121 126 -79 69 * -38 458 * -247 28 * -17 45 * -14 26 * -20 36 * -29Oregon 15 * -11 4 * -3 21 * -4 18 * -13 21 * -11 42 * -18 65 * -5 59 -21 45 -24 41 * -8 15 -5 51 -6 62 * -33 32 * -14 309 * -158 26 * -16 37 -10 19 * -16 30 * -25Pennsylvania 15 * -12 7 * -5 17 -6 17 * -8 22 -11 33 * -6 60 * -3 57 -27 33 -15 28 -2 12 * -3 423 -348 101 * -50 64 * -28 330 * -150 27 * -15 37 * -7 21 * -15 24 * -17Rhode Island 10 * -8 1 * 0 16 * -9 19 * -15 17 * -11 26 * -5 56 * -6 66 -29 34 -13 32 * -19 13 * -4 270 * -186 111 * -62 61 * -22 437 * -255 21 * -12 39 * -16 12 * -9 24 * -18South Carolina 27 * -22 5 * -3 24 * -9 27 * -21 27 * -17 38 * -15 67 * -7 57 -22 24 -2 34 -9 19 * -3 131 * -97 101 -61 69 * -42 440 * -274 29 * -18 43 * -12 21 -17 29 * -23South Dakota 26 * -22 5 * -5 26 * -4 17 * -13 20 -11 38 -15 56 * -8 56 -19 43 -12 36 * -15 13 * -6 94 -13 89 -52 39 -19 289 * -147 33 -19 36 -1 17 * -11 22 * -17Tennessee 24 * -20 4 * -3 24 * -6 22 * -15 27 -14 35 * -10 67 -4 58 -30 41 -13 41 * -28 22 * -7 93 * -59 121 -75 73 * -42 411 * -232 32 * -17 47 -11 24 * -18 31 * -23Texas 42 * -35 12 * -8 41 * -22 32 * -23 31 * -19 44 * -19 70 -12 69 -29 39 -11 31 -6 18 * -2 126 * -70 100 * -57 59 * -30 360 * -182 16 * -5 42 -8 10 * -6 24 * -17Utah 24 * -20 9 * -7 34 -11 21 * -13 22 * -12 36 * -10 72 * -10 47 -11 43 -15 31 -10 13 * -1 — — — 53 * -30 38 * -21 276 -131 13 * -7 31 * -5 9 * -6 19 * -13Vermont 7 * -4 1 * 0 13 * -5 10 * -4 22 * -16 42 * -18 68 -11 50 -16 27 -14 29 -15 13 -5 — — — 75 -42 30 * -11 321 * -172 31 -21 32 * -7 24 * -19 28 * -23Virginia 29 * -25 9 -7 30 * -16 31 * -25 21 * -12 33 * -9 65 * -11 63 -21 30 -11 37 * -6 16 * -4 168 -123 112 -71 76 * -46 423 * -245 24 * -13 38 -10 20 * -16 30 -22Washington 16 * -13 4 * -3 27 * -9 18 * -12 26 -15 35 * -8 65 * -10 65 -24 32 -8 28 * -10 13 * -1 50 12 70 * -40 40 * -19 317 * -160 22 * -13 37 * -10 14 * -11 25 * -19West Virginia 11 * -8 1 * -1 20 * -4 19 * -10 25 * -15 36 * -10 60 * -6 53 -20 33 -17 43 * -24 17 * -3 93 — 132 -74 68 * -30 444 * -229 38 * -23 42 * -2 33 -24 36 -26Wisconsin 15 * -12 5 * -3 20 -9 18 -12 17 * -11 29 * -7 69 * -6 58 -21 41 -20 21 * 1 12 -3 215 * -153 89 * -49 45 * -20 369 * -190 28 * -16 32 * 0 19 * -15 33 * -26Wyoming 26 * -20 8 * -3 40 * -21 24 * -16 22 -12 40 * -6 72 * -10 54 -17 33 -2 48 * -20 15 * -4 — — — 101 * -66 48 * -29 341 * -177 31 * -20 36 * -10 19 * -12 29 * -23
Adults ages 19–64 uninsured
Children ages 0–18 uninsured
Adults without a usual source of care
Adults who went without care
because of cost
Adults without a dental visit in past
year
Adults without all age- and gender-
appropriate cancer screenings
Adults without all age-appropriate recommended
vaccines
Children without all components of a
medical home
Children without a medical and dental
preventive care visitAdults who report
fair/poor health
Notes: Rates are for the states' low-income population, generally those whose household income is under 200% FPL. Disparity is the difference between the states' low-income and higher-income (400%+ FPL) populations. (*) denotes meaningful improvement or worsening from the baseline period. Baseline data not shown; refer to state profiles at datacenter.commonwealthfund.org for baseline data.
Adults who have lost six or more teeth
Adults who are obeseAdults who smoke
Avoidable emergency department visits,
Medicare duals, age 65+ (rate per 100,000)
30-day readmissions, Medicare duals, age
65+ (rate per 100,000)
Preventable hospitalizations,
Medicare duals, age 65+ (rate per
100,000)
Hospital admissions for pediatric asthma (rate per 100,000)
Medicare beneficiaries
received a high-risk drug
Children ages 19–35 months without all
recommended vaccines
2016 2016 2016 2016 2016 2016 2016 2016 2016 2016 2016 2016 20162016 2014 2014 2015 2015 2015
Disparity DisparityDisparityDisparityDisparityDisparityDisparity DisparityDisparityDisparity DisparityDisparityDisparityDisparityDisparityDisparityDisparityDisparityDisparity
APPENDIX G2. Disparity: Indicator Rates for Low-Income Population and Difference from Higher-Income Population
Notes: Rates are for the states’ low-income population, generally those whose household income is under 200% FPL. Disparity is the difference between the states’ low-income and higher-income (400%+ FPL) populations. * Denotes meaningful improvement or worsening from the baseline period. Baseline data not shown; refer to state profiles at datacenter.commonwealthfund.org for baseline data.
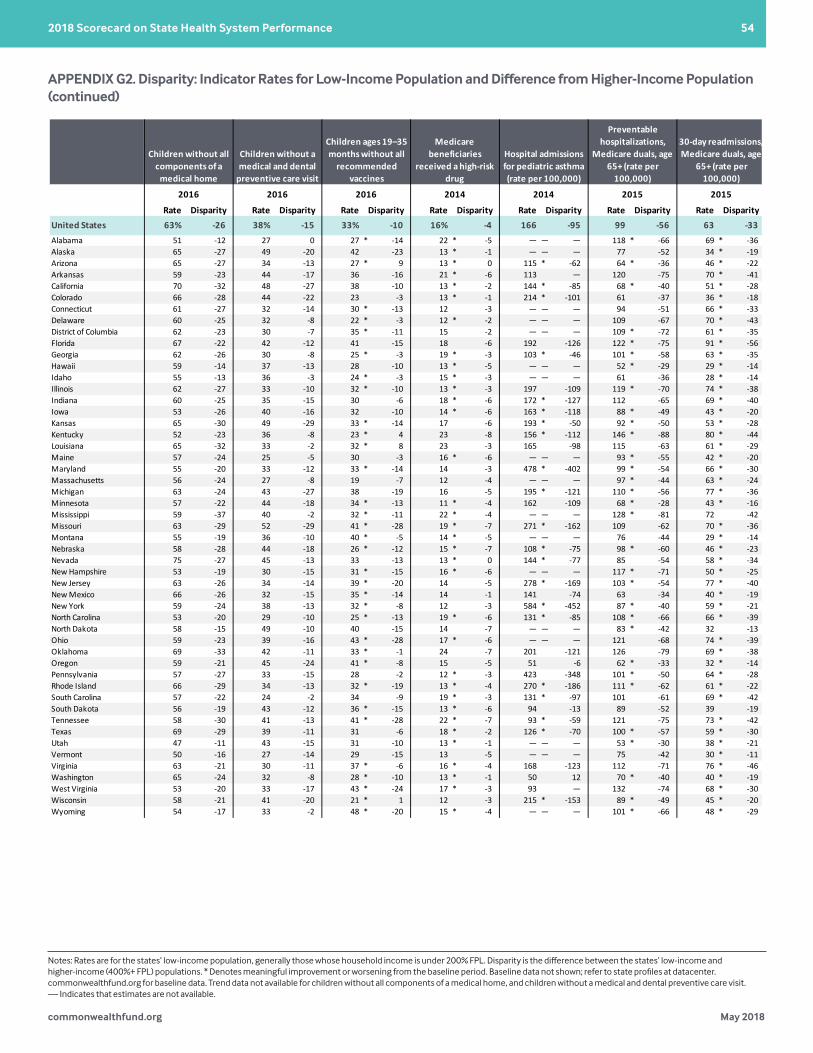
commonwealthfund.org May 2018
2018 Scorecard on State Health System Performance 54
Appendix G2. Disparity: Indicator Rates for Low-Income Population and Difference from Higher-Income Population
Rate Rate Rate Rate Rate Rate Rate Rate Rate Rate Rate Rate Rate Rate Rate Rate Rate Rate RateUnited States 23% -19 6% -4 27% -12 23% -16 24% -13 35% -10 67% -8 63% -26 38% -15 33% -10 16% -4 166 -95 99 -56 63 -33 366 -191 23% -12 38% -9 17% -12 29% -22Alabama 27 * -23 4 * -3 26 -11 33 * -28 25 * -13 37 * -13 71 * -9 51 -12 27 0 27 * -14 22 * -5 — — — 118 * -66 69 * -36 396 * -226 31 -16 46 * -9 22 * -15 34 * -25Alaska 34 * -24 14 * -10 34 * -6 28 * -20 14 * -5 34 * 1 77 * -16 65 -27 49 -20 42 -23 13 * -1 — — — 77 -52 34 * -19 453 -282 37 * -25 35 -4 23 * -18 21 * -14Arizona 22 * -17 10 * -7 32 * -14 23 * -16 26 * -14 34 * -6 70 * -9 65 -27 34 -13 27 * 9 13 * 0 115 * -62 64 * -36 46 * -22 413 * -236 18 * -9 37 * -10 12 * -8 30 * -23Arkansas 18 * -13 5 -3 23 * -11 23 * -16 23 * -14 38 * -10 70 * -13 59 -23 44 -17 36 -16 21 * -6 113 — 120 -75 70 * -41 385 * -215 33 * -21 40 * 0 23 -17 34 * -24California 19 * -15 4 * -3 35 * -19 18 * -11 25 * -15 29 * -6 70 -8 70 -32 48 -27 38 -10 13 * -2 144 * -85 68 * -40 51 * -28 301 * -156 13 * -5 33 * -11 9 * -6 30 * -23Colorado 19 * -15 7 * -5 31 -13 21 * -14 24 * -13 34 * -7 65 -12 66 -28 44 -22 23 -3 13 * -1 214 * -101 61 -37 36 * -18 339 * -178 25 -15 30 * -8 14 * -11 28 * -22Connecticut 14 * -11 2 * 0 19 * -10 15 * -9 17 * -10 31 * -11 61 * -7 61 -27 32 -14 30 * -13 12 -3 — — — 94 -51 66 * -33 379 * -209 21 * -12 36 -12 13 * -10 28 * -22Delaware 15 * -12 6 -4 21 * -10 21 * -17 24 * -16 35 * -16 65 * -8 60 -25 32 -8 22 * -3 12 * -2 — — — 109 -67 70 * -43 385 * -228 25 * -14 34 * -3 18 -12 26 * -21District of Columbia 8 * -6 5 * -4 20 * -3 20 * -16 14 * -4 28 * -8 72 * -17 62 -23 30 -7 35 * -11 15 -2 — — — 109 * -72 61 * -35 430 * -259 22 * -13 45 * -26 12 * -9 27 * -24Florida 31 * -24 8 * -5 36 -15 29 * -22 26 -12 36 * -8 73 -10 67 -22 42 -12 41 -15 18 -6 192 -126 122 * -75 91 * -56 369 * -192 22 * -12 35 * -10 21 * -16 32 * -26Georgia 35 * -29 9 * -6 33 * -15 31 * -25 25 -14 36 -12 73 * -13 62 -26 30 -8 25 * -3 19 * -3 103 * -46 101 * -58 63 * -35 396 * -228 24 * -12 45 * -15 22 -15 34 * -27Hawaii 10 * -8 3 * -1 17 * -7 16 -12 18 -8 36 * -18 66 -7 59 -14 37 -13 28 -10 13 * -5 — — — 52 * -29 29 * -14 232 * -101 21 * -12 33 -7 12 * -9 20 * -11Idaho 27 * -21 6 * -2 33 -11 27 * -18 25 * -15 39 * -5 74 * -12 55 -13 36 -3 24 * -3 15 * -3 — — — 61 -36 28 * -14 294 * -135 24 * -17 33 * -7 14 * -12 26 * -19Illinois 19 * -16 3 * -2 19 * -8 17 * -12 21 * -8 33 * -6 68 * -5 62 -27 33 -10 32 * -10 13 * -3 197 -109 119 * -70 74 * -38 400 * -216 20 * -7 39 -7 12 * -7 27 -20Indiana 21 * -17 8 * -6 24 * -11 23 * -17 25 * -15 42 * -14 69 -9 60 -25 35 -15 30 -6 18 * -6 172 * -127 112 -65 69 * -40 408 * -223 31 * -18 38 * -5 21 * -15 29 * -21Iowa 11 * -9 3 * -2 18 * -4 15 * -11 22 * -14 33 * -8 59 * -7 53 -26 40 -16 32 -10 14 * -6 163 * -118 88 * -49 43 * -20 353 * -183 30 * -18 39 * -9 16 * -12 31 * -25Kansas 27 * -23 8 * -6 30 * -15 25 * -20 23 * -14 38 -11 70 -12 65 -30 49 -29 33 * -14 17 -6 193 * -50 92 * -50 53 * -28 349 * -175 28 * -17 41 * -11 16 -12 26 -20Kentucky 11 * -9 5 * -4 17 * 0 19 * -13 24 * -13 38 -14 66 * -8 52 -23 36 -8 23 * 4 23 -8 156 * -112 146 * -88 80 * -44 427 * -225 39 * -23 44 -11 33 * -25 38 * -31Louisiana 26 * -21 4 -2 28 * -10 31 * -23 29 * -14 33 * -7 70 * -4 65 -32 33 -2 32 * 8 23 -3 165 -98 115 -63 61 * -29 441 -248 27 * -10 41 * -6 22 * -14 30 * -22Maine 20 * -16 7 * -3 12 * -3 17 * -11 21 * -14 35 * -13 62 -7 57 -24 25 -5 30 -3 16 * -6 — — — 93 * -55 42 * -20 355 * -177 31 * -21 36 * -7 25 * -19 26 -19Maryland 18 * -15 5 * -3 22 * -13 21 * -16 26 * -16 33 -8 63 * -11 55 -20 33 -12 33 * -14 14 -3 478 * -402 99 * -54 66 * -30 358 * -184 22 * -13 40 * -11 14 * -10 30 * -23Massachusetts 6 * -4 2 -1 11 * -4 12 * -6 17 * -9 33 * -11 61 -6 56 -24 27 -8 19 -7 12 -4 — — — 97 * -44 63 * -24 343 * -154 20 * -10 33 -11 16 -12 23 * -17Michigan 14 * -11 4 * -3 16 * -7 18 * -10 19 * -10 35 -12 69 * -8 63 -24 43 -27 38 -19 16 -5 195 * -121 110 * -56 77 * -36 398 * -190 33 * -20 39 * -9 23 * -19 30 * -22Minnesota 11 * -9 4 * -2 30 * -7 16 * -10 18 * -10 33 * -9 61 * -8 57 -22 44 -18 34 * -13 11 * -4 162 -109 68 * -28 43 * -16 332 * -156 25 * -15 38 * -12 16 * -13 24 * -18Mississippi 31 * -26 6 * -4 26 -10 32 * -21 24 * -11 34 * -10 68 -8 59 -37 40 -2 32 * -11 22 * -4 — — — 128 * -81 72 -42 466 * -278 28 * -11 48 -11 26 * -17 29 * -21Missouri 26 * -22 7 * -4 22 * -6 28 * -22 29 * -16 43 * -19 67 * -14 63 -29 52 -29 41 * -28 19 * -7 271 * -162 109 -62 70 * -36 411 * -219 37 * -22 36 -4 28 * -22 33 -25Montana 23 * -19 7 -4 32 * -10 18 * -13 20 * -6 47 * -15 69 * -15 55 -19 36 -10 40 * -5 14 * -5 — — — 76 -44 29 * -14 384 * -239 31 -19 33 -9 24 * -20 24 * -16Nebraska 29 * -26 10 -8 25 -13 25 -20 24 * -16 39 * -12 61 * -9 58 -28 44 -18 26 * -12 15 * -7 108 * -75 98 * -60 46 * -23 320 * -175 28 -16 39 -7 12 -8 25 -19Nevada 26 * -20 9 * -7 36 * -15 26 * -19 25 * -14 36 * -8 67 * 1 75 -27 45 -13 33 -13 13 * 0 144 * -77 85 -54 58 * -34 305 * -158 21 * -9 31 -9 16 * -11 29 -19New Hampshire 20 * -16 6 -5 13 * -5 19 * -14 15 * -9 38 * -16 62 * -6 53 -19 30 -15 31 * -15 16 * -6 — — — 117 * -71 50 * -25 390 * -218 33 * -22 40 * -15 23 * -19 34 * -27New Jersey 25 * -21 5 * -4 22 * -13 22 * -17 20 * -11 32 * -5 62 * -2 63 -26 34 -14 39 * -20 14 -5 278 * -169 103 * -54 77 * -40 320 * -157 19 * -8 36 * -9 15 * -9 29 * -21New Mexico 20 * -15 6 -3 37 * -14 19 * -13 24 * -13 39 -6 65 * -10 66 -26 32 -15 35 * -14 14 -1 141 -74 63 -34 40 * -19 348 * -181 22 -12 32 * -5 11 * -7 27 -20New York 15 * -11 3 * -2 18 * -8 17 * -11 20 * -9 33 * -7 63 * -4 59 -24 38 -13 32 * -8 12 -3 584 * -452 87 * -40 59 * -21 283 -121 19 * -9 33 -9 13 -8 25 * -18North Carolina 29 * -25 6 * -4 27 * -11 31 * -22 19 * -7 33 * -11 63 -11 53 -20 29 -10 25 * -13 19 * -6 131 * -85 108 * -66 66 * -39 445 * -265 27 * -15 47 -15 19 * -13 39 * -33North Dakota 20 * -17 14 * -11 28 * -6 14 * -10 25 * -15 43 -15 62 -7 58 -15 49 -10 40 -15 14 -7 — — — 83 * -42 32 -13 358 * -200 32 * -18 41 * -10 18 * -14 24 * -17Ohio 14 * -11 4 * -3 20 * -8 18 * -11 22 * -13 36 -10 67 -9 59 -23 39 -16 43 * -28 17 * -6 — — — 121 -68 74 * -39 436 * -227 37 * -24 43 * -13 26 * -21 31 * -24Oklahoma 35 * -28 8 * -4 28 * -14 27 * -22 26 * -13 41 * -11 63 * -10 69 -33 42 -11 33 * -1 24 -7 201 -121 126 -79 69 * -38 458 * -247 28 * -17 45 * -14 26 * -20 36 * -29Oregon 15 * -11 4 * -3 21 * -4 18 * -13 21 * -11 42 * -18 65 * -5 59 -21 45 -24 41 * -8 15 -5 51 -6 62 * -33 32 * -14 309 * -158 26 * -16 37 -10 19 * -16 30 * -25Pennsylvania 15 * -12 7 * -5 17 -6 17 * -8 22 -11 33 * -6 60 * -3 57 -27 33 -15 28 -2 12 * -3 423 -348 101 * -50 64 * -28 330 * -150 27 * -15 37 * -7 21 * -15 24 * -17Rhode Island 10 * -8 1 * 0 16 * -9 19 * -15 17 * -11 26 * -5 56 * -6 66 -29 34 -13 32 * -19 13 * -4 270 * -186 111 * -62 61 * -22 437 * -255 21 * -12 39 * -16 12 * -9 24 * -18South Carolina 27 * -22 5 * -3 24 * -9 27 * -21 27 * -17 38 * -15 67 * -7 57 -22 24 -2 34 -9 19 * -3 131 * -97 101 -61 69 * -42 440 * -274 29 * -18 43 * -12 21 -17 29 * -23South Dakota 26 * -22 5 * -5 26 * -4 17 * -13 20 -11 38 -15 56 * -8 56 -19 43 -12 36 * -15 13 * -6 94 -13 89 -52 39 -19 289 * -147 33 -19 36 -1 17 * -11 22 * -17Tennessee 24 * -20 4 * -3 24 * -6 22 * -15 27 -14 35 * -10 67 -4 58 -30 41 -13 41 * -28 22 * -7 93 * -59 121 -75 73 * -42 411 * -232 32 * -17 47 -11 24 * -18 31 * -23Texas 42 * -35 12 * -8 41 * -22 32 * -23 31 * -19 44 * -19 70 -12 69 -29 39 -11 31 -6 18 * -2 126 * -70 100 * -57 59 * -30 360 * -182 16 * -5 42 -8 10 * -6 24 * -17Utah 24 * -20 9 * -7 34 -11 21 * -13 22 * -12 36 * -10 72 * -10 47 -11 43 -15 31 -10 13 * -1 — — — 53 * -30 38 * -21 276 -131 13 * -7 31 * -5 9 * -6 19 * -13Vermont 7 * -4 1 * 0 13 * -5 10 * -4 22 * -16 42 * -18 68 -11 50 -16 27 -14 29 -15 13 -5 — — — 75 -42 30 * -11 321 * -172 31 -21 32 * -7 24 * -19 28 * -23Virginia 29 * -25 9 -7 30 * -16 31 * -25 21 * -12 33 * -9 65 * -11 63 -21 30 -11 37 * -6 16 * -4 168 -123 112 -71 76 * -46 423 * -245 24 * -13 38 -10 20 * -16 30 -22Washington 16 * -13 4 * -3 27 * -9 18 * -12 26 -15 35 * -8 65 * -10 65 -24 32 -8 28 * -10 13 * -1 50 12 70 * -40 40 * -19 317 * -160 22 * -13 37 * -10 14 * -11 25 * -19West Virginia 11 * -8 1 * -1 20 * -4 19 * -10 25 * -15 36 * -10 60 * -6 53 -20 33 -17 43 * -24 17 * -3 93 — 132 -74 68 * -30 444 * -229 38 * -23 42 * -2 33 -24 36 -26Wisconsin 15 * -12 5 * -3 20 -9 18 -12 17 * -11 29 * -7 69 * -6 58 -21 41 -20 21 * 1 12 -3 215 * -153 89 * -49 45 * -20 369 * -190 28 * -16 32 * 0 19 * -15 33 * -26Wyoming 26 * -20 8 * -3 40 * -21 24 * -16 22 -12 40 * -6 72 * -10 54 -17 33 -2 48 * -20 15 * -4 — — — 101 * -66 48 * -29 341 * -177 31 * -20 36 * -10 19 * -12 29 * -23
Adults ages 19–64 uninsured
Children ages 0–18 uninsured
Adults without a usual source of care
Adults who went without care
because of cost
Adults without a dental visit in past
year
Adults without all age- and gender-
appropriate cancer screenings
Adults without all age-appropriate recommended
vaccines
Children without all components of a
medical home
Children without a medical and dental
preventive care visitAdults who report
fair/poor health
Notes: Rates are for the states' low-income population, generally those whose household income is under 200% FPL. Disparity is the difference between the states' low-income and higher-income (400%+ FPL) populations. (*) denotes meaningful improvement or worsening from the baseline period. Baseline data not shown; refer to state profiles at datacenter.commonwealthfund.org for baseline data.
Adults who have lost six or more teeth
Adults who are obeseAdults who smoke
Avoidable emergency department visits,
Medicare duals, age 65+ (rate per 100,000)
30-day readmissions, Medicare duals, age
65+ (rate per 100,000)
Preventable hospitalizations,
Medicare duals, age 65+ (rate per
100,000)
Hospital admissions for pediatric asthma (rate per 100,000)
Medicare beneficiaries
received a high-risk drug
Children ages 19–35 months without all
recommended vaccines
2016 2016 2016 2016 2016 2016 2016 2016 2016 2016 2016 2016 20162016 2014 2014 2015 2015 2015
Disparity DisparityDisparityDisparityDisparityDisparityDisparity DisparityDisparityDisparity DisparityDisparityDisparityDisparityDisparityDisparityDisparityDisparityDisparity
APPENDIX G2. Disparity: Indicator Rates for Low-Income Population and Difference from Higher-Income Population (continued)
Notes: Rates are for the states’ low-income population, generally those whose household income is under 200% FPL. Disparity is the difference between the states’ low-income and higher-income (400%+ FPL) populations. * Denotes meaningful improvement or worsening from the baseline period. Baseline data not shown; refer to state profiles at datacenter.commonwealthfund.org for baseline data. Trend data not available for children without all components of a medical home, and children without a medical and dental preventive care visit. — Indicates that estimates are not available.
Appendix G2. Disparity: Indicator Rates for Low-Income Population and Difference from Higher-Income Population
Rate Rate Rate Rate Rate Rate Rate Rate Rate Rate Rate Rate Rate Rate Rate Rate Rate Rate RateUnited States 23% -19 6% -4 27% -12 23% -16 24% -13 35% -10 67% -8 63% -26 38% -15 33% -10 16% -4 166 -95 99 -56 63 -33 366 -191 23% -12 38% -9 17% -12 29% -22Alabama 27 * -23 4 * -3 26 -11 33 * -28 25 * -13 37 * -13 71 * -9 51 -12 27 0 27 * -14 22 * -5 — — — 118 * -66 69 * -36 396 * -226 31 -16 46 * -9 22 * -15 34 * -25Alaska 34 * -24 14 * -10 34 * -6 28 * -20 14 * -5 34 * 1 77 * -16 65 -27 49 -20 42 -23 13 * -1 — — — 77 -52 34 * -19 453 -282 37 * -25 35 -4 23 * -18 21 * -14Arizona 22 * -17 10 * -7 32 * -14 23 * -16 26 * -14 34 * -6 70 * -9 65 -27 34 -13 27 * 9 13 * 0 115 * -62 64 * -36 46 * -22 413 * -236 18 * -9 37 * -10 12 * -8 30 * -23Arkansas 18 * -13 5 -3 23 * -11 23 * -16 23 * -14 38 * -10 70 * -13 59 -23 44 -17 36 -16 21 * -6 113 — 120 -75 70 * -41 385 * -215 33 * -21 40 * 0 23 -17 34 * -24California 19 * -15 4 * -3 35 * -19 18 * -11 25 * -15 29 * -6 70 -8 70 -32 48 -27 38 -10 13 * -2 144 * -85 68 * -40 51 * -28 301 * -156 13 * -5 33 * -11 9 * -6 30 * -23Colorado 19 * -15 7 * -5 31 -13 21 * -14 24 * -13 34 * -7 65 -12 66 -28 44 -22 23 -3 13 * -1 214 * -101 61 -37 36 * -18 339 * -178 25 -15 30 * -8 14 * -11 28 * -22Connecticut 14 * -11 2 * 0 19 * -10 15 * -9 17 * -10 31 * -11 61 * -7 61 -27 32 -14 30 * -13 12 -3 — — — 94 -51 66 * -33 379 * -209 21 * -12 36 -12 13 * -10 28 * -22Delaware 15 * -12 6 -4 21 * -10 21 * -17 24 * -16 35 * -16 65 * -8 60 -25 32 -8 22 * -3 12 * -2 — — — 109 -67 70 * -43 385 * -228 25 * -14 34 * -3 18 -12 26 * -21District of Columbia 8 * -6 5 * -4 20 * -3 20 * -16 14 * -4 28 * -8 72 * -17 62 -23 30 -7 35 * -11 15 -2 — — — 109 * -72 61 * -35 430 * -259 22 * -13 45 * -26 12 * -9 27 * -24Florida 31 * -24 8 * -5 36 -15 29 * -22 26 -12 36 * -8 73 -10 67 -22 42 -12 41 -15 18 -6 192 -126 122 * -75 91 * -56 369 * -192 22 * -12 35 * -10 21 * -16 32 * -26Georgia 35 * -29 9 * -6 33 * -15 31 * -25 25 -14 36 -12 73 * -13 62 -26 30 -8 25 * -3 19 * -3 103 * -46 101 * -58 63 * -35 396 * -228 24 * -12 45 * -15 22 -15 34 * -27Hawaii 10 * -8 3 * -1 17 * -7 16 -12 18 -8 36 * -18 66 -7 59 -14 37 -13 28 -10 13 * -5 — — — 52 * -29 29 * -14 232 * -101 21 * -12 33 -7 12 * -9 20 * -11Idaho 27 * -21 6 * -2 33 -11 27 * -18 25 * -15 39 * -5 74 * -12 55 -13 36 -3 24 * -3 15 * -3 — — — 61 -36 28 * -14 294 * -135 24 * -17 33 * -7 14 * -12 26 * -19Illinois 19 * -16 3 * -2 19 * -8 17 * -12 21 * -8 33 * -6 68 * -5 62 -27 33 -10 32 * -10 13 * -3 197 -109 119 * -70 74 * -38 400 * -216 20 * -7 39 -7 12 * -7 27 -20Indiana 21 * -17 8 * -6 24 * -11 23 * -17 25 * -15 42 * -14 69 -9 60 -25 35 -15 30 -6 18 * -6 172 * -127 112 -65 69 * -40 408 * -223 31 * -18 38 * -5 21 * -15 29 * -21Iowa 11 * -9 3 * -2 18 * -4 15 * -11 22 * -14 33 * -8 59 * -7 53 -26 40 -16 32 -10 14 * -6 163 * -118 88 * -49 43 * -20 353 * -183 30 * -18 39 * -9 16 * -12 31 * -25Kansas 27 * -23 8 * -6 30 * -15 25 * -20 23 * -14 38 -11 70 -12 65 -30 49 -29 33 * -14 17 -6 193 * -50 92 * -50 53 * -28 349 * -175 28 * -17 41 * -11 16 -12 26 -20Kentucky 11 * -9 5 * -4 17 * 0 19 * -13 24 * -13 38 -14 66 * -8 52 -23 36 -8 23 * 4 23 -8 156 * -112 146 * -88 80 * -44 427 * -225 39 * -23 44 -11 33 * -25 38 * -31Louisiana 26 * -21 4 -2 28 * -10 31 * -23 29 * -14 33 * -7 70 * -4 65 -32 33 -2 32 * 8 23 -3 165 -98 115 -63 61 * -29 441 -248 27 * -10 41 * -6 22 * -14 30 * -22Maine 20 * -16 7 * -3 12 * -3 17 * -11 21 * -14 35 * -13 62 -7 57 -24 25 -5 30 -3 16 * -6 — — — 93 * -55 42 * -20 355 * -177 31 * -21 36 * -7 25 * -19 26 -19Maryland 18 * -15 5 * -3 22 * -13 21 * -16 26 * -16 33 -8 63 * -11 55 -20 33 -12 33 * -14 14 -3 478 * -402 99 * -54 66 * -30 358 * -184 22 * -13 40 * -11 14 * -10 30 * -23Massachusetts 6 * -4 2 -1 11 * -4 12 * -6 17 * -9 33 * -11 61 -6 56 -24 27 -8 19 -7 12 -4 — — — 97 * -44 63 * -24 343 * -154 20 * -10 33 -11 16 -12 23 * -17Michigan 14 * -11 4 * -3 16 * -7 18 * -10 19 * -10 35 -12 69 * -8 63 -24 43 -27 38 -19 16 -5 195 * -121 110 * -56 77 * -36 398 * -190 33 * -20 39 * -9 23 * -19 30 * -22Minnesota 11 * -9 4 * -2 30 * -7 16 * -10 18 * -10 33 * -9 61 * -8 57 -22 44 -18 34 * -13 11 * -4 162 -109 68 * -28 43 * -16 332 * -156 25 * -15 38 * -12 16 * -13 24 * -18Mississippi 31 * -26 6 * -4 26 -10 32 * -21 24 * -11 34 * -10 68 -8 59 -37 40 -2 32 * -11 22 * -4 — — — 128 * -81 72 -42 466 * -278 28 * -11 48 -11 26 * -17 29 * -21Missouri 26 * -22 7 * -4 22 * -6 28 * -22 29 * -16 43 * -19 67 * -14 63 -29 52 -29 41 * -28 19 * -7 271 * -162 109 -62 70 * -36 411 * -219 37 * -22 36 -4 28 * -22 33 -25Montana 23 * -19 7 -4 32 * -10 18 * -13 20 * -6 47 * -15 69 * -15 55 -19 36 -10 40 * -5 14 * -5 — — — 76 -44 29 * -14 384 * -239 31 -19 33 -9 24 * -20 24 * -16Nebraska 29 * -26 10 -8 25 -13 25 -20 24 * -16 39 * -12 61 * -9 58 -28 44 -18 26 * -12 15 * -7 108 * -75 98 * -60 46 * -23 320 * -175 28 -16 39 -7 12 -8 25 -19Nevada 26 * -20 9 * -7 36 * -15 26 * -19 25 * -14 36 * -8 67 * 1 75 -27 45 -13 33 -13 13 * 0 144 * -77 85 -54 58 * -34 305 * -158 21 * -9 31 -9 16 * -11 29 -19New Hampshire 20 * -16 6 -5 13 * -5 19 * -14 15 * -9 38 * -16 62 * -6 53 -19 30 -15 31 * -15 16 * -6 — — — 117 * -71 50 * -25 390 * -218 33 * -22 40 * -15 23 * -19 34 * -27New Jersey 25 * -21 5 * -4 22 * -13 22 * -17 20 * -11 32 * -5 62 * -2 63 -26 34 -14 39 * -20 14 -5 278 * -169 103 * -54 77 * -40 320 * -157 19 * -8 36 * -9 15 * -9 29 * -21New Mexico 20 * -15 6 -3 37 * -14 19 * -13 24 * -13 39 -6 65 * -10 66 -26 32 -15 35 * -14 14 -1 141 -74 63 -34 40 * -19 348 * -181 22 -12 32 * -5 11 * -7 27 -20New York 15 * -11 3 * -2 18 * -8 17 * -11 20 * -9 33 * -7 63 * -4 59 -24 38 -13 32 * -8 12 -3 584 * -452 87 * -40 59 * -21 283 -121 19 * -9 33 -9 13 -8 25 * -18North Carolina 29 * -25 6 * -4 27 * -11 31 * -22 19 * -7 33 * -11 63 -11 53 -20 29 -10 25 * -13 19 * -6 131 * -85 108 * -66 66 * -39 445 * -265 27 * -15 47 -15 19 * -13 39 * -33North Dakota 20 * -17 14 * -11 28 * -6 14 * -10 25 * -15 43 -15 62 -7 58 -15 49 -10 40 -15 14 -7 — — — 83 * -42 32 -13 358 * -200 32 * -18 41 * -10 18 * -14 24 * -17Ohio 14 * -11 4 * -3 20 * -8 18 * -11 22 * -13 36 -10 67 -9 59 -23 39 -16 43 * -28 17 * -6 — — — 121 -68 74 * -39 436 * -227 37 * -24 43 * -13 26 * -21 31 * -24Oklahoma 35 * -28 8 * -4 28 * -14 27 * -22 26 * -13 41 * -11 63 * -10 69 -33 42 -11 33 * -1 24 -7 201 -121 126 -79 69 * -38 458 * -247 28 * -17 45 * -14 26 * -20 36 * -29Oregon 15 * -11 4 * -3 21 * -4 18 * -13 21 * -11 42 * -18 65 * -5 59 -21 45 -24 41 * -8 15 -5 51 -6 62 * -33 32 * -14 309 * -158 26 * -16 37 -10 19 * -16 30 * -25Pennsylvania 15 * -12 7 * -5 17 -6 17 * -8 22 -11 33 * -6 60 * -3 57 -27 33 -15 28 -2 12 * -3 423 -348 101 * -50 64 * -28 330 * -150 27 * -15 37 * -7 21 * -15 24 * -17Rhode Island 10 * -8 1 * 0 16 * -9 19 * -15 17 * -11 26 * -5 56 * -6 66 -29 34 -13 32 * -19 13 * -4 270 * -186 111 * -62 61 * -22 437 * -255 21 * -12 39 * -16 12 * -9 24 * -18South Carolina 27 * -22 5 * -3 24 * -9 27 * -21 27 * -17 38 * -15 67 * -7 57 -22 24 -2 34 -9 19 * -3 131 * -97 101 -61 69 * -42 440 * -274 29 * -18 43 * -12 21 -17 29 * -23South Dakota 26 * -22 5 * -5 26 * -4 17 * -13 20 -11 38 -15 56 * -8 56 -19 43 -12 36 * -15 13 * -6 94 -13 89 -52 39 -19 289 * -147 33 -19 36 -1 17 * -11 22 * -17Tennessee 24 * -20 4 * -3 24 * -6 22 * -15 27 -14 35 * -10 67 -4 58 -30 41 -13 41 * -28 22 * -7 93 * -59 121 -75 73 * -42 411 * -232 32 * -17 47 -11 24 * -18 31 * -23Texas 42 * -35 12 * -8 41 * -22 32 * -23 31 * -19 44 * -19 70 -12 69 -29 39 -11 31 -6 18 * -2 126 * -70 100 * -57 59 * -30 360 * -182 16 * -5 42 -8 10 * -6 24 * -17Utah 24 * -20 9 * -7 34 -11 21 * -13 22 * -12 36 * -10 72 * -10 47 -11 43 -15 31 -10 13 * -1 — — — 53 * -30 38 * -21 276 -131 13 * -7 31 * -5 9 * -6 19 * -13Vermont 7 * -4 1 * 0 13 * -5 10 * -4 22 * -16 42 * -18 68 -11 50 -16 27 -14 29 -15 13 -5 — — — 75 -42 30 * -11 321 * -172 31 -21 32 * -7 24 * -19 28 * -23Virginia 29 * -25 9 -7 30 * -16 31 * -25 21 * -12 33 * -9 65 * -11 63 -21 30 -11 37 * -6 16 * -4 168 -123 112 -71 76 * -46 423 * -245 24 * -13 38 -10 20 * -16 30 -22Washington 16 * -13 4 * -3 27 * -9 18 * -12 26 -15 35 * -8 65 * -10 65 -24 32 -8 28 * -10 13 * -1 50 12 70 * -40 40 * -19 317 * -160 22 * -13 37 * -10 14 * -11 25 * -19West Virginia 11 * -8 1 * -1 20 * -4 19 * -10 25 * -15 36 * -10 60 * -6 53 -20 33 -17 43 * -24 17 * -3 93 — 132 -74 68 * -30 444 * -229 38 * -23 42 * -2 33 -24 36 -26Wisconsin 15 * -12 5 * -3 20 -9 18 -12 17 * -11 29 * -7 69 * -6 58 -21 41 -20 21 * 1 12 -3 215 * -153 89 * -49 45 * -20 369 * -190 28 * -16 32 * 0 19 * -15 33 * -26Wyoming 26 * -20 8 * -3 40 * -21 24 * -16 22 -12 40 * -6 72 * -10 54 -17 33 -2 48 * -20 15 * -4 — — — 101 * -66 48 * -29 341 * -177 31 * -20 36 * -10 19 * -12 29 * -23
Adults ages 19–64 uninsured
Children ages 0–18 uninsured
Adults without a usual source of care
Adults who went without care
because of cost
Adults without a dental visit in past
year
Adults without all age- and gender-
appropriate cancer screenings
Adults without all age-appropriate recommended
vaccines
Children without all components of a
medical home
Children without a medical and dental
preventive care visitAdults who report
fair/poor health
Notes: Rates are for the states' low-income population, generally those whose household income is under 200% FPL. Disparity is the difference between the states' low-income and higher-income (400%+ FPL) populations. (*) denotes meaningful improvement or worsening from the baseline period. Baseline data not shown; refer to state profiles at datacenter.commonwealthfund.org for baseline data.
Adults who have lost six or more teeth
Adults who are obeseAdults who smoke
Avoidable emergency department visits,
Medicare duals, age 65+ (rate per 100,000)
30-day readmissions, Medicare duals, age
65+ (rate per 100,000)
Preventable hospitalizations,
Medicare duals, age 65+ (rate per
100,000)
Hospital admissions for pediatric asthma (rate per 100,000)
Medicare beneficiaries
received a high-risk drug
Children ages 19–35 months without all
recommended vaccines
2016 2016 2016 2016 2016 2016 2016 2016 2016 2016 2016 2016 20162016 2014 2014 2015 2015 2015
Disparity DisparityDisparityDisparityDisparityDisparityDisparity DisparityDisparityDisparity DisparityDisparityDisparityDisparityDisparityDisparityDisparityDisparityDisparity

commonwealthfund.org May 2018
2018 Scorecard on State Health System Performance 55
Appendix G2. Disparity: Indicator Rates for Low-Income Population and Difference from Higher-Income Population
Rate Rate Rate Rate Rate Rate Rate Rate Rate Rate Rate Rate Rate Rate Rate Rate Rate Rate RateUnited States 23% -19 6% -4 27% -12 23% -16 24% -13 35% -10 67% -8 63% -26 38% -15 33% -10 16% -4 166 -95 99 -56 63 -33 366 -191 23% -12 38% -9 17% -12 29% -22Alabama 27 * -23 4 * -3 26 -11 33 * -28 25 * -13 37 * -13 71 * -9 51 -12 27 0 27 * -14 22 * -5 — — — 118 * -66 69 * -36 396 * -226 31 -16 46 * -9 22 * -15 34 * -25Alaska 34 * -24 14 * -10 34 * -6 28 * -20 14 * -5 34 * 1 77 * -16 65 -27 49 -20 42 -23 13 * -1 — — — 77 -52 34 * -19 453 -282 37 * -25 35 -4 23 * -18 21 * -14Arizona 22 * -17 10 * -7 32 * -14 23 * -16 26 * -14 34 * -6 70 * -9 65 -27 34 -13 27 * 9 13 * 0 115 * -62 64 * -36 46 * -22 413 * -236 18 * -9 37 * -10 12 * -8 30 * -23Arkansas 18 * -13 5 -3 23 * -11 23 * -16 23 * -14 38 * -10 70 * -13 59 -23 44 -17 36 -16 21 * -6 113 — 120 -75 70 * -41 385 * -215 33 * -21 40 * 0 23 -17 34 * -24California 19 * -15 4 * -3 35 * -19 18 * -11 25 * -15 29 * -6 70 -8 70 -32 48 -27 38 -10 13 * -2 144 * -85 68 * -40 51 * -28 301 * -156 13 * -5 33 * -11 9 * -6 30 * -23Colorado 19 * -15 7 * -5 31 -13 21 * -14 24 * -13 34 * -7 65 -12 66 -28 44 -22 23 -3 13 * -1 214 * -101 61 -37 36 * -18 339 * -178 25 -15 30 * -8 14 * -11 28 * -22Connecticut 14 * -11 2 * 0 19 * -10 15 * -9 17 * -10 31 * -11 61 * -7 61 -27 32 -14 30 * -13 12 -3 — — — 94 -51 66 * -33 379 * -209 21 * -12 36 -12 13 * -10 28 * -22Delaware 15 * -12 6 -4 21 * -10 21 * -17 24 * -16 35 * -16 65 * -8 60 -25 32 -8 22 * -3 12 * -2 — — — 109 -67 70 * -43 385 * -228 25 * -14 34 * -3 18 -12 26 * -21District of Columbia 8 * -6 5 * -4 20 * -3 20 * -16 14 * -4 28 * -8 72 * -17 62 -23 30 -7 35 * -11 15 -2 — — — 109 * -72 61 * -35 430 * -259 22 * -13 45 * -26 12 * -9 27 * -24Florida 31 * -24 8 * -5 36 -15 29 * -22 26 -12 36 * -8 73 -10 67 -22 42 -12 41 -15 18 -6 192 -126 122 * -75 91 * -56 369 * -192 22 * -12 35 * -10 21 * -16 32 * -26Georgia 35 * -29 9 * -6 33 * -15 31 * -25 25 -14 36 -12 73 * -13 62 -26 30 -8 25 * -3 19 * -3 103 * -46 101 * -58 63 * -35 396 * -228 24 * -12 45 * -15 22 -15 34 * -27Hawaii 10 * -8 3 * -1 17 * -7 16 -12 18 -8 36 * -18 66 -7 59 -14 37 -13 28 -10 13 * -5 — — — 52 * -29 29 * -14 232 * -101 21 * -12 33 -7 12 * -9 20 * -11Idaho 27 * -21 6 * -2 33 -11 27 * -18 25 * -15 39 * -5 74 * -12 55 -13 36 -3 24 * -3 15 * -3 — — — 61 -36 28 * -14 294 * -135 24 * -17 33 * -7 14 * -12 26 * -19Illinois 19 * -16 3 * -2 19 * -8 17 * -12 21 * -8 33 * -6 68 * -5 62 -27 33 -10 32 * -10 13 * -3 197 -109 119 * -70 74 * -38 400 * -216 20 * -7 39 -7 12 * -7 27 -20Indiana 21 * -17 8 * -6 24 * -11 23 * -17 25 * -15 42 * -14 69 -9 60 -25 35 -15 30 -6 18 * -6 172 * -127 112 -65 69 * -40 408 * -223 31 * -18 38 * -5 21 * -15 29 * -21Iowa 11 * -9 3 * -2 18 * -4 15 * -11 22 * -14 33 * -8 59 * -7 53 -26 40 -16 32 -10 14 * -6 163 * -118 88 * -49 43 * -20 353 * -183 30 * -18 39 * -9 16 * -12 31 * -25Kansas 27 * -23 8 * -6 30 * -15 25 * -20 23 * -14 38 -11 70 -12 65 -30 49 -29 33 * -14 17 -6 193 * -50 92 * -50 53 * -28 349 * -175 28 * -17 41 * -11 16 -12 26 -20Kentucky 11 * -9 5 * -4 17 * 0 19 * -13 24 * -13 38 -14 66 * -8 52 -23 36 -8 23 * 4 23 -8 156 * -112 146 * -88 80 * -44 427 * -225 39 * -23 44 -11 33 * -25 38 * -31Louisiana 26 * -21 4 -2 28 * -10 31 * -23 29 * -14 33 * -7 70 * -4 65 -32 33 -2 32 * 8 23 -3 165 -98 115 -63 61 * -29 441 -248 27 * -10 41 * -6 22 * -14 30 * -22Maine 20 * -16 7 * -3 12 * -3 17 * -11 21 * -14 35 * -13 62 -7 57 -24 25 -5 30 -3 16 * -6 — — — 93 * -55 42 * -20 355 * -177 31 * -21 36 * -7 25 * -19 26 -19Maryland 18 * -15 5 * -3 22 * -13 21 * -16 26 * -16 33 -8 63 * -11 55 -20 33 -12 33 * -14 14 -3 478 * -402 99 * -54 66 * -30 358 * -184 22 * -13 40 * -11 14 * -10 30 * -23Massachusetts 6 * -4 2 -1 11 * -4 12 * -6 17 * -9 33 * -11 61 -6 56 -24 27 -8 19 -7 12 -4 — — — 97 * -44 63 * -24 343 * -154 20 * -10 33 -11 16 -12 23 * -17Michigan 14 * -11 4 * -3 16 * -7 18 * -10 19 * -10 35 -12 69 * -8 63 -24 43 -27 38 -19 16 -5 195 * -121 110 * -56 77 * -36 398 * -190 33 * -20 39 * -9 23 * -19 30 * -22Minnesota 11 * -9 4 * -2 30 * -7 16 * -10 18 * -10 33 * -9 61 * -8 57 -22 44 -18 34 * -13 11 * -4 162 -109 68 * -28 43 * -16 332 * -156 25 * -15 38 * -12 16 * -13 24 * -18Mississippi 31 * -26 6 * -4 26 -10 32 * -21 24 * -11 34 * -10 68 -8 59 -37 40 -2 32 * -11 22 * -4 — — — 128 * -81 72 -42 466 * -278 28 * -11 48 -11 26 * -17 29 * -21Missouri 26 * -22 7 * -4 22 * -6 28 * -22 29 * -16 43 * -19 67 * -14 63 -29 52 -29 41 * -28 19 * -7 271 * -162 109 -62 70 * -36 411 * -219 37 * -22 36 -4 28 * -22 33 -25Montana 23 * -19 7 -4 32 * -10 18 * -13 20 * -6 47 * -15 69 * -15 55 -19 36 -10 40 * -5 14 * -5 — — — 76 -44 29 * -14 384 * -239 31 -19 33 -9 24 * -20 24 * -16Nebraska 29 * -26 10 -8 25 -13 25 -20 24 * -16 39 * -12 61 * -9 58 -28 44 -18 26 * -12 15 * -7 108 * -75 98 * -60 46 * -23 320 * -175 28 -16 39 -7 12 -8 25 -19Nevada 26 * -20 9 * -7 36 * -15 26 * -19 25 * -14 36 * -8 67 * 1 75 -27 45 -13 33 -13 13 * 0 144 * -77 85 -54 58 * -34 305 * -158 21 * -9 31 -9 16 * -11 29 -19New Hampshire 20 * -16 6 -5 13 * -5 19 * -14 15 * -9 38 * -16 62 * -6 53 -19 30 -15 31 * -15 16 * -6 — — — 117 * -71 50 * -25 390 * -218 33 * -22 40 * -15 23 * -19 34 * -27New Jersey 25 * -21 5 * -4 22 * -13 22 * -17 20 * -11 32 * -5 62 * -2 63 -26 34 -14 39 * -20 14 -5 278 * -169 103 * -54 77 * -40 320 * -157 19 * -8 36 * -9 15 * -9 29 * -21New Mexico 20 * -15 6 -3 37 * -14 19 * -13 24 * -13 39 -6 65 * -10 66 -26 32 -15 35 * -14 14 -1 141 -74 63 -34 40 * -19 348 * -181 22 -12 32 * -5 11 * -7 27 -20New York 15 * -11 3 * -2 18 * -8 17 * -11 20 * -9 33 * -7 63 * -4 59 -24 38 -13 32 * -8 12 -3 584 * -452 87 * -40 59 * -21 283 -121 19 * -9 33 -9 13 -8 25 * -18North Carolina 29 * -25 6 * -4 27 * -11 31 * -22 19 * -7 33 * -11 63 -11 53 -20 29 -10 25 * -13 19 * -6 131 * -85 108 * -66 66 * -39 445 * -265 27 * -15 47 -15 19 * -13 39 * -33North Dakota 20 * -17 14 * -11 28 * -6 14 * -10 25 * -15 43 -15 62 -7 58 -15 49 -10 40 -15 14 -7 — — — 83 * -42 32 -13 358 * -200 32 * -18 41 * -10 18 * -14 24 * -17Ohio 14 * -11 4 * -3 20 * -8 18 * -11 22 * -13 36 -10 67 -9 59 -23 39 -16 43 * -28 17 * -6 — — — 121 -68 74 * -39 436 * -227 37 * -24 43 * -13 26 * -21 31 * -24Oklahoma 35 * -28 8 * -4 28 * -14 27 * -22 26 * -13 41 * -11 63 * -10 69 -33 42 -11 33 * -1 24 -7 201 -121 126 -79 69 * -38 458 * -247 28 * -17 45 * -14 26 * -20 36 * -29Oregon 15 * -11 4 * -3 21 * -4 18 * -13 21 * -11 42 * -18 65 * -5 59 -21 45 -24 41 * -8 15 -5 51 -6 62 * -33 32 * -14 309 * -158 26 * -16 37 -10 19 * -16 30 * -25Pennsylvania 15 * -12 7 * -5 17 -6 17 * -8 22 -11 33 * -6 60 * -3 57 -27 33 -15 28 -2 12 * -3 423 -348 101 * -50 64 * -28 330 * -150 27 * -15 37 * -7 21 * -15 24 * -17Rhode Island 10 * -8 1 * 0 16 * -9 19 * -15 17 * -11 26 * -5 56 * -6 66 -29 34 -13 32 * -19 13 * -4 270 * -186 111 * -62 61 * -22 437 * -255 21 * -12 39 * -16 12 * -9 24 * -18South Carolina 27 * -22 5 * -3 24 * -9 27 * -21 27 * -17 38 * -15 67 * -7 57 -22 24 -2 34 -9 19 * -3 131 * -97 101 -61 69 * -42 440 * -274 29 * -18 43 * -12 21 -17 29 * -23South Dakota 26 * -22 5 * -5 26 * -4 17 * -13 20 -11 38 -15 56 * -8 56 -19 43 -12 36 * -15 13 * -6 94 -13 89 -52 39 -19 289 * -147 33 -19 36 -1 17 * -11 22 * -17Tennessee 24 * -20 4 * -3 24 * -6 22 * -15 27 -14 35 * -10 67 -4 58 -30 41 -13 41 * -28 22 * -7 93 * -59 121 -75 73 * -42 411 * -232 32 * -17 47 -11 24 * -18 31 * -23Texas 42 * -35 12 * -8 41 * -22 32 * -23 31 * -19 44 * -19 70 -12 69 -29 39 -11 31 -6 18 * -2 126 * -70 100 * -57 59 * -30 360 * -182 16 * -5 42 -8 10 * -6 24 * -17Utah 24 * -20 9 * -7 34 -11 21 * -13 22 * -12 36 * -10 72 * -10 47 -11 43 -15 31 -10 13 * -1 — — — 53 * -30 38 * -21 276 -131 13 * -7 31 * -5 9 * -6 19 * -13Vermont 7 * -4 1 * 0 13 * -5 10 * -4 22 * -16 42 * -18 68 -11 50 -16 27 -14 29 -15 13 -5 — — — 75 -42 30 * -11 321 * -172 31 -21 32 * -7 24 * -19 28 * -23Virginia 29 * -25 9 -7 30 * -16 31 * -25 21 * -12 33 * -9 65 * -11 63 -21 30 -11 37 * -6 16 * -4 168 -123 112 -71 76 * -46 423 * -245 24 * -13 38 -10 20 * -16 30 -22Washington 16 * -13 4 * -3 27 * -9 18 * -12 26 -15 35 * -8 65 * -10 65 -24 32 -8 28 * -10 13 * -1 50 12 70 * -40 40 * -19 317 * -160 22 * -13 37 * -10 14 * -11 25 * -19West Virginia 11 * -8 1 * -1 20 * -4 19 * -10 25 * -15 36 * -10 60 * -6 53 -20 33 -17 43 * -24 17 * -3 93 — 132 -74 68 * -30 444 * -229 38 * -23 42 * -2 33 -24 36 -26Wisconsin 15 * -12 5 * -3 20 -9 18 -12 17 * -11 29 * -7 69 * -6 58 -21 41 -20 21 * 1 12 -3 215 * -153 89 * -49 45 * -20 369 * -190 28 * -16 32 * 0 19 * -15 33 * -26Wyoming 26 * -20 8 * -3 40 * -21 24 * -16 22 -12 40 * -6 72 * -10 54 -17 33 -2 48 * -20 15 * -4 — — — 101 * -66 48 * -29 341 * -177 31 * -20 36 * -10 19 * -12 29 * -23
Adults ages 19–64 uninsured
Children ages 0–18 uninsured
Adults without a usual source of care
Adults who went without care
because of cost
Adults without a dental visit in past
year
Adults without all age- and gender-
appropriate cancer screenings
Adults without all age-appropriate recommended
vaccines
Children without all components of a
medical home
Children without a medical and dental
preventive care visitAdults who report
fair/poor health
Notes: Rates are for the states' low-income population, generally those whose household income is under 200% FPL. Disparity is the difference between the states' low-income and higher-income (400%+ FPL) populations. (*) denotes meaningful improvement or worsening from the baseline period. Baseline data not shown; refer to state profiles at datacenter.commonwealthfund.org for baseline data.
Adults who have lost six or more teeth
Adults who are obeseAdults who smoke
Avoidable emergency department visits,
Medicare duals, age 65+ (rate per 100,000)
30-day readmissions, Medicare duals, age
65+ (rate per 100,000)
Preventable hospitalizations,
Medicare duals, age 65+ (rate per
100,000)
Hospital admissions for pediatric asthma (rate per 100,000)
Medicare beneficiaries
received a high-risk drug
Children ages 19–35 months without all
recommended vaccines
2016 2016 2016 2016 2016 2016 2016 2016 2016 2016 2016 2016 20162016 2014 2014 2015 2015 2015
Disparity DisparityDisparityDisparityDisparityDisparityDisparity DisparityDisparityDisparity DisparityDisparityDisparityDisparityDisparityDisparityDisparityDisparityDisparity
APPENDIX G2. Disparity: Indicator Rates for Low-Income Population and Difference from Higher-Income Population (continued)
Notes: Rates are for the states’ low-income population, generally those whose household income is under 200% FPL. Disparity is the difference between the states’ low-income and higher-income (400%+ FPL) populations. * Denotes meaningful improvement or worsening from the baseline period. Baseline data not shown; refer to state profiles at datacenter.commonwealthfund.org for baseline data.
Appendix G2. Disparity: Indicator Rates for Low-Income Population and Difference from Higher-Income Population
Rate Rate Rate Rate Rate Rate Rate Rate Rate Rate Rate Rate Rate Rate Rate Rate Rate Rate RateUnited States 23% -19 6% -4 27% -12 23% -16 24% -13 35% -10 67% -8 63% -26 38% -15 33% -10 16% -4 166 -95 99 -56 63 -33 366 -191 23% -12 38% -9 17% -12 29% -22Alabama 27 * -23 4 * -3 26 -11 33 * -28 25 * -13 37 * -13 71 * -9 51 -12 27 0 27 * -14 22 * -5 — — — 118 * -66 69 * -36 396 * -226 31 -16 46 * -9 22 * -15 34 * -25Alaska 34 * -24 14 * -10 34 * -6 28 * -20 14 * -5 34 * 1 77 * -16 65 -27 49 -20 42 -23 13 * -1 — — — 77 -52 34 * -19 453 -282 37 * -25 35 -4 23 * -18 21 * -14Arizona 22 * -17 10 * -7 32 * -14 23 * -16 26 * -14 34 * -6 70 * -9 65 -27 34 -13 27 * 9 13 * 0 115 * -62 64 * -36 46 * -22 413 * -236 18 * -9 37 * -10 12 * -8 30 * -23Arkansas 18 * -13 5 -3 23 * -11 23 * -16 23 * -14 38 * -10 70 * -13 59 -23 44 -17 36 -16 21 * -6 113 — 120 -75 70 * -41 385 * -215 33 * -21 40 * 0 23 -17 34 * -24California 19 * -15 4 * -3 35 * -19 18 * -11 25 * -15 29 * -6 70 -8 70 -32 48 -27 38 -10 13 * -2 144 * -85 68 * -40 51 * -28 301 * -156 13 * -5 33 * -11 9 * -6 30 * -23Colorado 19 * -15 7 * -5 31 -13 21 * -14 24 * -13 34 * -7 65 -12 66 -28 44 -22 23 -3 13 * -1 214 * -101 61 -37 36 * -18 339 * -178 25 -15 30 * -8 14 * -11 28 * -22Connecticut 14 * -11 2 * 0 19 * -10 15 * -9 17 * -10 31 * -11 61 * -7 61 -27 32 -14 30 * -13 12 -3 — — — 94 -51 66 * -33 379 * -209 21 * -12 36 -12 13 * -10 28 * -22Delaware 15 * -12 6 -4 21 * -10 21 * -17 24 * -16 35 * -16 65 * -8 60 -25 32 -8 22 * -3 12 * -2 — — — 109 -67 70 * -43 385 * -228 25 * -14 34 * -3 18 -12 26 * -21District of Columbia 8 * -6 5 * -4 20 * -3 20 * -16 14 * -4 28 * -8 72 * -17 62 -23 30 -7 35 * -11 15 -2 — — — 109 * -72 61 * -35 430 * -259 22 * -13 45 * -26 12 * -9 27 * -24Florida 31 * -24 8 * -5 36 -15 29 * -22 26 -12 36 * -8 73 -10 67 -22 42 -12 41 -15 18 -6 192 -126 122 * -75 91 * -56 369 * -192 22 * -12 35 * -10 21 * -16 32 * -26Georgia 35 * -29 9 * -6 33 * -15 31 * -25 25 -14 36 -12 73 * -13 62 -26 30 -8 25 * -3 19 * -3 103 * -46 101 * -58 63 * -35 396 * -228 24 * -12 45 * -15 22 -15 34 * -27Hawaii 10 * -8 3 * -1 17 * -7 16 -12 18 -8 36 * -18 66 -7 59 -14 37 -13 28 -10 13 * -5 — — — 52 * -29 29 * -14 232 * -101 21 * -12 33 -7 12 * -9 20 * -11Idaho 27 * -21 6 * -2 33 -11 27 * -18 25 * -15 39 * -5 74 * -12 55 -13 36 -3 24 * -3 15 * -3 — — — 61 -36 28 * -14 294 * -135 24 * -17 33 * -7 14 * -12 26 * -19Illinois 19 * -16 3 * -2 19 * -8 17 * -12 21 * -8 33 * -6 68 * -5 62 -27 33 -10 32 * -10 13 * -3 197 -109 119 * -70 74 * -38 400 * -216 20 * -7 39 -7 12 * -7 27 -20Indiana 21 * -17 8 * -6 24 * -11 23 * -17 25 * -15 42 * -14 69 -9 60 -25 35 -15 30 -6 18 * -6 172 * -127 112 -65 69 * -40 408 * -223 31 * -18 38 * -5 21 * -15 29 * -21Iowa 11 * -9 3 * -2 18 * -4 15 * -11 22 * -14 33 * -8 59 * -7 53 -26 40 -16 32 -10 14 * -6 163 * -118 88 * -49 43 * -20 353 * -183 30 * -18 39 * -9 16 * -12 31 * -25Kansas 27 * -23 8 * -6 30 * -15 25 * -20 23 * -14 38 -11 70 -12 65 -30 49 -29 33 * -14 17 -6 193 * -50 92 * -50 53 * -28 349 * -175 28 * -17 41 * -11 16 -12 26 -20Kentucky 11 * -9 5 * -4 17 * 0 19 * -13 24 * -13 38 -14 66 * -8 52 -23 36 -8 23 * 4 23 -8 156 * -112 146 * -88 80 * -44 427 * -225 39 * -23 44 -11 33 * -25 38 * -31Louisiana 26 * -21 4 -2 28 * -10 31 * -23 29 * -14 33 * -7 70 * -4 65 -32 33 -2 32 * 8 23 -3 165 -98 115 -63 61 * -29 441 -248 27 * -10 41 * -6 22 * -14 30 * -22Maine 20 * -16 7 * -3 12 * -3 17 * -11 21 * -14 35 * -13 62 -7 57 -24 25 -5 30 -3 16 * -6 — — — 93 * -55 42 * -20 355 * -177 31 * -21 36 * -7 25 * -19 26 -19Maryland 18 * -15 5 * -3 22 * -13 21 * -16 26 * -16 33 -8 63 * -11 55 -20 33 -12 33 * -14 14 -3 478 * -402 99 * -54 66 * -30 358 * -184 22 * -13 40 * -11 14 * -10 30 * -23Massachusetts 6 * -4 2 -1 11 * -4 12 * -6 17 * -9 33 * -11 61 -6 56 -24 27 -8 19 -7 12 -4 — — — 97 * -44 63 * -24 343 * -154 20 * -10 33 -11 16 -12 23 * -17Michigan 14 * -11 4 * -3 16 * -7 18 * -10 19 * -10 35 -12 69 * -8 63 -24 43 -27 38 -19 16 -5 195 * -121 110 * -56 77 * -36 398 * -190 33 * -20 39 * -9 23 * -19 30 * -22Minnesota 11 * -9 4 * -2 30 * -7 16 * -10 18 * -10 33 * -9 61 * -8 57 -22 44 -18 34 * -13 11 * -4 162 -109 68 * -28 43 * -16 332 * -156 25 * -15 38 * -12 16 * -13 24 * -18Mississippi 31 * -26 6 * -4 26 -10 32 * -21 24 * -11 34 * -10 68 -8 59 -37 40 -2 32 * -11 22 * -4 — — — 128 * -81 72 -42 466 * -278 28 * -11 48 -11 26 * -17 29 * -21Missouri 26 * -22 7 * -4 22 * -6 28 * -22 29 * -16 43 * -19 67 * -14 63 -29 52 -29 41 * -28 19 * -7 271 * -162 109 -62 70 * -36 411 * -219 37 * -22 36 -4 28 * -22 33 -25Montana 23 * -19 7 -4 32 * -10 18 * -13 20 * -6 47 * -15 69 * -15 55 -19 36 -10 40 * -5 14 * -5 — — — 76 -44 29 * -14 384 * -239 31 -19 33 -9 24 * -20 24 * -16Nebraska 29 * -26 10 -8 25 -13 25 -20 24 * -16 39 * -12 61 * -9 58 -28 44 -18 26 * -12 15 * -7 108 * -75 98 * -60 46 * -23 320 * -175 28 -16 39 -7 12 -8 25 -19Nevada 26 * -20 9 * -7 36 * -15 26 * -19 25 * -14 36 * -8 67 * 1 75 -27 45 -13 33 -13 13 * 0 144 * -77 85 -54 58 * -34 305 * -158 21 * -9 31 -9 16 * -11 29 -19New Hampshire 20 * -16 6 -5 13 * -5 19 * -14 15 * -9 38 * -16 62 * -6 53 -19 30 -15 31 * -15 16 * -6 — — — 117 * -71 50 * -25 390 * -218 33 * -22 40 * -15 23 * -19 34 * -27New Jersey 25 * -21 5 * -4 22 * -13 22 * -17 20 * -11 32 * -5 62 * -2 63 -26 34 -14 39 * -20 14 -5 278 * -169 103 * -54 77 * -40 320 * -157 19 * -8 36 * -9 15 * -9 29 * -21New Mexico 20 * -15 6 -3 37 * -14 19 * -13 24 * -13 39 -6 65 * -10 66 -26 32 -15 35 * -14 14 -1 141 -74 63 -34 40 * -19 348 * -181 22 -12 32 * -5 11 * -7 27 -20New York 15 * -11 3 * -2 18 * -8 17 * -11 20 * -9 33 * -7 63 * -4 59 -24 38 -13 32 * -8 12 -3 584 * -452 87 * -40 59 * -21 283 -121 19 * -9 33 -9 13 -8 25 * -18North Carolina 29 * -25 6 * -4 27 * -11 31 * -22 19 * -7 33 * -11 63 -11 53 -20 29 -10 25 * -13 19 * -6 131 * -85 108 * -66 66 * -39 445 * -265 27 * -15 47 -15 19 * -13 39 * -33North Dakota 20 * -17 14 * -11 28 * -6 14 * -10 25 * -15 43 -15 62 -7 58 -15 49 -10 40 -15 14 -7 — — — 83 * -42 32 -13 358 * -200 32 * -18 41 * -10 18 * -14 24 * -17Ohio 14 * -11 4 * -3 20 * -8 18 * -11 22 * -13 36 -10 67 -9 59 -23 39 -16 43 * -28 17 * -6 — — — 121 -68 74 * -39 436 * -227 37 * -24 43 * -13 26 * -21 31 * -24Oklahoma 35 * -28 8 * -4 28 * -14 27 * -22 26 * -13 41 * -11 63 * -10 69 -33 42 -11 33 * -1 24 -7 201 -121 126 -79 69 * -38 458 * -247 28 * -17 45 * -14 26 * -20 36 * -29Oregon 15 * -11 4 * -3 21 * -4 18 * -13 21 * -11 42 * -18 65 * -5 59 -21 45 -24 41 * -8 15 -5 51 -6 62 * -33 32 * -14 309 * -158 26 * -16 37 -10 19 * -16 30 * -25Pennsylvania 15 * -12 7 * -5 17 -6 17 * -8 22 -11 33 * -6 60 * -3 57 -27 33 -15 28 -2 12 * -3 423 -348 101 * -50 64 * -28 330 * -150 27 * -15 37 * -7 21 * -15 24 * -17Rhode Island 10 * -8 1 * 0 16 * -9 19 * -15 17 * -11 26 * -5 56 * -6 66 -29 34 -13 32 * -19 13 * -4 270 * -186 111 * -62 61 * -22 437 * -255 21 * -12 39 * -16 12 * -9 24 * -18South Carolina 27 * -22 5 * -3 24 * -9 27 * -21 27 * -17 38 * -15 67 * -7 57 -22 24 -2 34 -9 19 * -3 131 * -97 101 -61 69 * -42 440 * -274 29 * -18 43 * -12 21 -17 29 * -23South Dakota 26 * -22 5 * -5 26 * -4 17 * -13 20 -11 38 -15 56 * -8 56 -19 43 -12 36 * -15 13 * -6 94 -13 89 -52 39 -19 289 * -147 33 -19 36 -1 17 * -11 22 * -17Tennessee 24 * -20 4 * -3 24 * -6 22 * -15 27 -14 35 * -10 67 -4 58 -30 41 -13 41 * -28 22 * -7 93 * -59 121 -75 73 * -42 411 * -232 32 * -17 47 -11 24 * -18 31 * -23Texas 42 * -35 12 * -8 41 * -22 32 * -23 31 * -19 44 * -19 70 -12 69 -29 39 -11 31 -6 18 * -2 126 * -70 100 * -57 59 * -30 360 * -182 16 * -5 42 -8 10 * -6 24 * -17Utah 24 * -20 9 * -7 34 -11 21 * -13 22 * -12 36 * -10 72 * -10 47 -11 43 -15 31 -10 13 * -1 — — — 53 * -30 38 * -21 276 -131 13 * -7 31 * -5 9 * -6 19 * -13Vermont 7 * -4 1 * 0 13 * -5 10 * -4 22 * -16 42 * -18 68 -11 50 -16 27 -14 29 -15 13 -5 — — — 75 -42 30 * -11 321 * -172 31 -21 32 * -7 24 * -19 28 * -23Virginia 29 * -25 9 -7 30 * -16 31 * -25 21 * -12 33 * -9 65 * -11 63 -21 30 -11 37 * -6 16 * -4 168 -123 112 -71 76 * -46 423 * -245 24 * -13 38 -10 20 * -16 30 -22Washington 16 * -13 4 * -3 27 * -9 18 * -12 26 -15 35 * -8 65 * -10 65 -24 32 -8 28 * -10 13 * -1 50 12 70 * -40 40 * -19 317 * -160 22 * -13 37 * -10 14 * -11 25 * -19West Virginia 11 * -8 1 * -1 20 * -4 19 * -10 25 * -15 36 * -10 60 * -6 53 -20 33 -17 43 * -24 17 * -3 93 — 132 -74 68 * -30 444 * -229 38 * -23 42 * -2 33 -24 36 -26Wisconsin 15 * -12 5 * -3 20 -9 18 -12 17 * -11 29 * -7 69 * -6 58 -21 41 -20 21 * 1 12 -3 215 * -153 89 * -49 45 * -20 369 * -190 28 * -16 32 * 0 19 * -15 33 * -26Wyoming 26 * -20 8 * -3 40 * -21 24 * -16 22 -12 40 * -6 72 * -10 54 -17 33 -2 48 * -20 15 * -4 — — — 101 * -66 48 * -29 341 * -177 31 * -20 36 * -10 19 * -12 29 * -23
Adults ages 19–64 uninsured
Children ages 0–18 uninsured
Adults without a usual source of care
Adults who went without care
because of cost
Adults without a dental visit in past
year
Adults without all age- and gender-
appropriate cancer screenings
Adults without all age-appropriate recommended
vaccines
Children without all components of a
medical home
Children without a medical and dental
preventive care visitAdults who report
fair/poor health
Notes: Rates are for the states' low-income population, generally those whose household income is under 200% FPL. Disparity is the difference between the states' low-income and higher-income (400%+ FPL) populations. (*) denotes meaningful improvement or worsening from the baseline period. Baseline data not shown; refer to state profiles at datacenter.commonwealthfund.org for baseline data.
Adults who have lost six or more teeth
Adults who are obeseAdults who smoke
Avoidable emergency department visits,
Medicare duals, age 65+ (rate per 100,000)
30-day readmissions, Medicare duals, age
65+ (rate per 100,000)
Preventable hospitalizations,
Medicare duals, age 65+ (rate per
100,000)
Hospital admissions for pediatric asthma (rate per 100,000)
Medicare beneficiaries
received a high-risk drug
Children ages 19–35 months without all
recommended vaccines
2016 2016 2016 2016 2016 2016 2016 2016 2016 2016 2016 2016 20162016 2014 2014 2015 2015 2015
Disparity DisparityDisparityDisparityDisparityDisparityDisparity DisparityDisparityDisparity DisparityDisparityDisparityDisparityDisparityDisparityDisparityDisparityDisparity

commonwealthfund.org May 2018
2018 Scorecard on State Health System Performance 56
• Improveda • No Changeb • Worseneda
Income 0Adults ages 19–64 uninsured
Children ages 0–18 uninsuredAdults without a usual source of care
Adults who went without care because of costAdults without a dental visit in past year
Adults without all age- and gender-appropriate cancer screeningsAdults without all age-appropriate recommended vaccines
Children ages 19–35 months without all recommended vaccinesMedicare beneficiaries received a high-risk drug
Hospital admissions for pediatric asthma, per 100,000 childrenPreventable hospitalizations, Medicare duals, age 65+
30-day readmissions, Medicare duals, age 65+Avoidable emergency department visits, Medicare duals, age 65+
Adults who smokeAdults who are obese
Adults who have lost six or more teethAdults who report fair/poor health
Appendix G3. Disparity: Summary of Indicator Change Over Time
Disparity Indicator
Number of states where disparity for the low-income population:
Notes: Selected indicators only. Trend data generally reflect the two-year period ending in 2015 or 2016; refer to Appendix A1 for additional detail. For the purposes of this analysis we count the District of Columbia as a state. (a) Improvement indicates that the rate for the low-income population within the state improved and the disparity between the low-income population and the higher-income population narrowed. (b) Includes the number of states with no change or without sufficient data for this subpopulation to assess change over time.
51
37
36
4227
29
19
16
32
12
5
45
6
28
11
19
17
0
9
9
38
9
15
18
17
30
20
3
4
7
18
9
9
0
5
6
616
13
17
17
2
9
26
3
41
16
22
23
25
APPENDIX G3. Disparity: Summary of Indicator Change Over Time
Notes: Selected indicators only. Trend data generally reflect the two-year period ending in 2015 or 2016; refer to Appendix A1 for additional detail. For the purposes of this analysis we count the District of Columbia as a state. (a) Improvement indicates that the rate for the low-income population within the state improved and the disparity between the low-income population and the higher-income population narrowed. (b) Includes the number of states with no change or without sufficient data for this subpopulation to assess change over time.
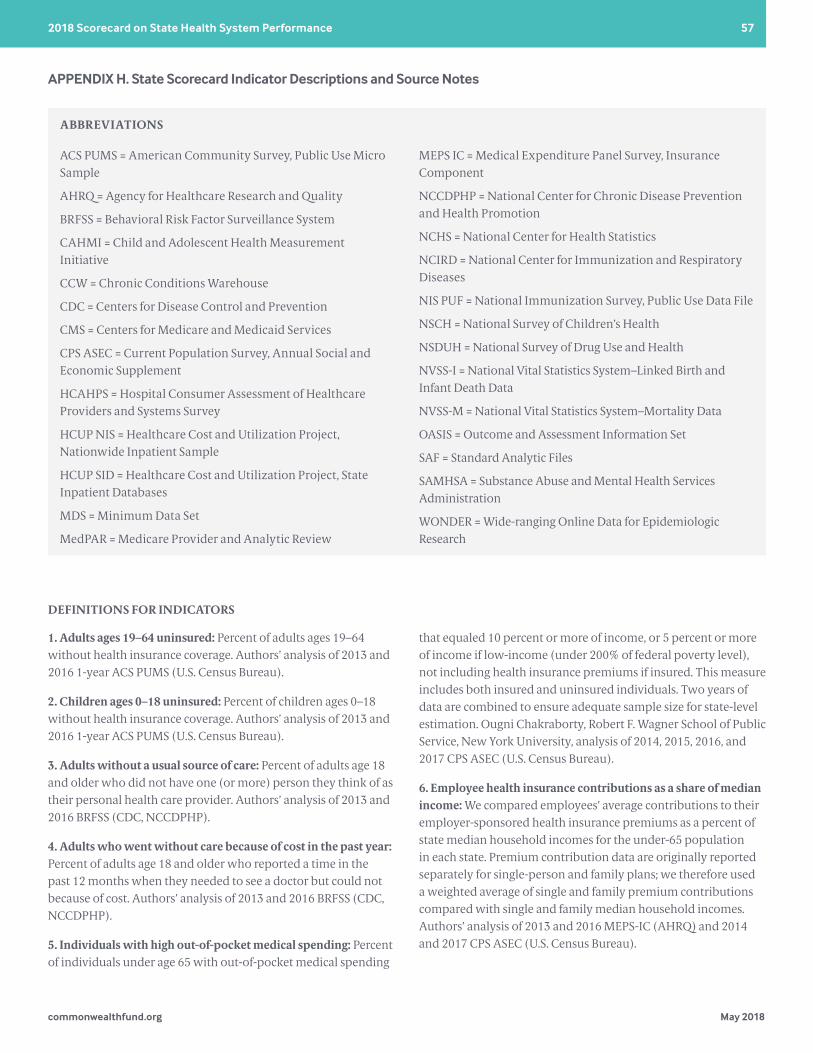
commonwealthfund.org May 2018
2018 Scorecard on State Health System Performance 57
APPENDIX H. State Scorecard Indicator Descriptions and Source Notes
ABBREVIATIONS
ACS PUMS = American Community Survey, Public Use Micro Sample
AHRQ = Agency for Healthcare Research and Quality
BRFSS = Behavioral Risk Factor Surveillance System
CAHMI = Child and Adolescent Health Measurement Initiative
CCW = Chronic Conditions Warehouse
CDC = Centers for Disease Control and Prevention
CMS = Centers for Medicare and Medicaid Services
CPS ASEC = Current Population Survey, Annual Social and Economic Supplement
HCAHPS = Hospital Consumer Assessment of Healthcare Providers and Systems Survey
HCUP NIS = Healthcare Cost and Utilization Project, Nationwide Inpatient Sample
HCUP SID = Healthcare Cost and Utilization Project, State Inpatient Databases
MDS = Minimum Data Set
MedPAR = Medicare Provider and Analytic Review
MEPS IC = Medical Expenditure Panel Survey, Insurance Component
NCCDPHP = National Center for Chronic Disease Prevention and Health Promotion
NCHS = National Center for Health Statistics
NCIRD = National Center for Immunization and Respiratory Diseases
NIS PUF = National Immunization Survey, Public Use Data File
NSCH = National Survey of Children’s Health
NSDUH = National Survey of Drug Use and Health
NVSS-I = National Vital Statistics System–Linked Birth and Infant Death Data
NVSS-M = National Vital Statistics System–Mortality Data
OASIS = Outcome and Assessment Information Set
SAF = Standard Analytic Files
SAMHSA = Substance Abuse and Mental Health Services Administration
WONDER = Wide-ranging Online Data for Epidemiologic Research
DEFINITIONS FOR INDICATORS
1. Adults ages 19–64 uninsured: Percent of adults ages 19–64 without health insurance coverage. Authors’ analysis of 2013 and 2016 1-year ACS PUMS (U.S. Census Bureau).
2. Children ages 0–18 uninsured: Percent of children ages 0–18 without health insurance coverage. Authors’ analysis of 2013 and 2016 1-year ACS PUMS (U.S. Census Bureau).
3. Adults without a usual source of care: Percent of adults age 18 and older who did not have one (or more) person they think of as their personal health care provider. Authors’ analysis of 2013 and 2016 BRFSS (CDC, NCCDPHP).
4. Adults who went without care because of cost in the past year: Percent of adults age 18 and older who reported a time in the past 12 months when they needed to see a doctor but could not because of cost. Authors’ analysis of 2013 and 2016 BRFSS (CDC, NCCDPHP).
5. Individuals with high out-of-pocket medical spending: Percent of individuals under age 65 with out-of-pocket medical spending
that equaled 10 percent or more of income, or 5 percent or more of income if low-income (under 200% of federal poverty level), not including health insurance premiums if insured. This measure includes both insured and uninsured individuals. Two years of data are combined to ensure adequate sample size for state-level estimation. Ougni Chakraborty, Robert F. Wagner School of Public Service, New York University, analysis of 2014, 2015, 2016, and 2017 CPS ASEC (U.S. Census Bureau).
6. Employee health insurance contributions as a share of median income: We compared employees’ average contributions to their employer-sponsored health insurance premiums as a percent of state median household incomes for the under-65 population in each state. Premium contribution data are originally reported separately for single-person and family plans; we therefore used a weighted average of single and family premium contributions compared with single and family median household incomes. Authors’ analysis of 2013 and 2016 MEPS-IC (AHRQ) and 2014 and 2017 CPS ASEC (U.S. Census Bureau).

commonwealthfund.org May 2018
2018 Scorecard on State Health System Performance 58
APPENDIX H. State Scorecard Indicator Descriptions and Source Notes (continued)
7. Adults without a dental visit in past year: Percent of adults age 18 and older who did not visit a dentist, or dental clinic within the past year. Authors’ analysis of 2012 and 2016 BRFSS (CDC, NCCDPHP).
8. Adults without all age- and gender-appropriate cancer screenings: Percent of adults ages 50–74 who did not receive sigmoidoscopy or colonoscopy in the last ten years or a fecal occult blood test in the last two years; a mammogram in the last two years (women ages 50–74 only); and a pap smear in the last three years (women ages 25–64 only). Authors’ analysis of 2012 and 2016 BRFSS (CDC, NCCDPHP).
9. Adults without all age-appropriate vaccines: Percent of adults age 18 and older who did not receive a flu shot in the past year and a pneumonia vaccine ever if age 65 and older. Authors’ analysis of 2013 and 2016 BRFSS (CDC, NCCDPHP).
10. Diabetic adults ages 18–64 without a hemoglobin A1c test: The share of adult diabetic patients ages 18–64 who did not have at least one hemoglobin A1c test during the year (expressed as a rate per 100 employer-insured enrollees). Michael E. Chernew and Andrew Hicks, Harvard Medical School Department of Health Care Policy, analysis of the 2015 Truven Marketscan Database.
11. Medicare beneficiaries received a high-risk drug: Percent of fee-for-service Medicare beneficiaries ages 65 and older who received at least one drug from a list of 13 classes of high-risk prescriptions that should be avoided by the elderly. Yuting Zhang, University of Pittsburgh, analysis of 2012 and 2014 5% sample of Medicare beneficiaries enrolled in stand-alone Medicare Part D plans.
12. Children without all components of a medical home: Percent of children ages 0–17 who did not have all of the following, according to parents’ reports: a personal doctor or nurse, a usual source for sick and well care, family-centered care, any problems getting needed referrals, and effective care coordination when needed. For more information, see www.childhealthdata.org. Authors’ analysis of 2016 NSCH (CAHMI).
13. Children without a medical and dental preventive care visit in the past year: Percent of children ages 0–17 who did not have a preventive medical visit and, if ages 1–17, a preventive dental visit in the past year, according to parents’ reports. For more information, see www.childhealthdata.org. Authors’ analysis of 2016 NSCH (CAHMI).
14. Children who did not receive needed mental health treatment: Percent of children ages 3–17 who had any kind of emotional, developmental, or behavioral problem that required
treatment or counseling and who did not receive treatment from a mental health professional (as defined) during the past 12 months, according to parents’ reports. For more information, see www.childhealthdata.org. Authors’ analysis of 2016 NSCH (CAHMI).
15. Children ages 19–35 months who did not receive all recommended vaccines: Percent of children ages 19–35 months who did not receive at least 4 doses of diphtheria, tetanus, and accellular pertussis (DTaP/DT/DTP) vaccine; at least 3 doses of poliovirus vaccine; at least 1 dose of measles-containing vaccine (including mumps-rubella (MMR) vaccine); the full series of Haemophilus influenza type b (Hib) vaccine (3 or 4 doses depending on product type); at least 3 doses of hepatitis B vaccine (HepB); at least 1 dose of varicella vaccine, and at least 4 doses of pneumococcal conjugate vaccine (PCV). Data from the 2013, 2014, 2015, and 2016 NIS-PUF (CDC, NCIRD).
16. Hospital 30-day mortality: Risk-standardized, all-cause 30-day mortality rates for fee-for-service Medicare patients age 65 and older hospitalized with a principal diagnosis of heart attack, heart failure, pneumonia or stroke between July 2010 and June 2013, and July 2013 and June 2016. All-cause mortality is defined as death from any cause within 30 days after the index admission, regardless of whether the patient dies while still in the hospital or after discharge. Authors’ analysis of Medicare enrollment and claims data retrieved from 4th Quarter 2017 and 4th Quarter 2014 Hospital Compare (CMS).
17. Central line-associated bloodstream infections (CLABSI), Standardized Infection Ratio (SIR): All CLABSIs reported to the National Healthcare Safety Network from all applicable hospital locations, including intensive care units, neonatal intensive care units, and wards. The standardized infection ratio compares the observed number of CLABSIs reported by hospitals within the state to the predicted number of infections based on the referent period, adjusting for key risk factors. Data are from the CDC’s 2015 National and State Healthcare-Associated Infections Progress Reports.
18. Hospital patients discharged without instructions for home recovery: Percent of hospitalized patients who were not given information about what to do during their recovery at home. Authors’ analysis of 2013 and 2016 HCAHPS as administered to adults discharged from acute care hospitals. Retrieved from 4th Quarter 2017 and 4th Quarter 2014 Hospital Compare (CMS).
19. Hospital patients who did not receive patient-centered care: Percent of patients who reported hospital staff did not always manage pain well, did not always respond when they needed help to get to the bathroom or pressed a call button, and did not always explain medicines and side effects. Authors’ analysis of

commonwealthfund.org May 2018
2018 Scorecard on State Health System Performance 59
APPENDIX H. State Scorecard Indicator Descriptions and Source Notes (continued)
2013 and 2016 HCAHPS, as administered to adults discharged from acute care hospitals. Retrieved from retrieved from 4th Quarter 2017 and 4th Quarter 2014 Hospital Compare (CMS).
20. Home health patients who did not get better at walking or moving around: Percent of all home health episodes in which a person did not improve at walking or moving around compared to a prior assessment. Episodes for which the patient, at start or resumption of care, was able to ambulate independently are excluded. Authors’ analysis of 2013 and 2016 OASIS. Data retrieved from 3rd quarter 2017 and 2nd quarter 2014 Home Health Compare (CMS).
21. Nursing home residents with an antipsychotic medication: Percent of long-stay nursing home residents who received an antipsychotic medication, excluding residents with Schizophrenia, Tourette’s syndrome, and Huntington’s disease. Authors’ analysis of 2013–2016 MDS. Data retrieved from June 2017 and June 2014 Nursing Home Compare (CMS).
22. Adults with any mental illness (AMI) reporting unmet need: Percent of adults ages 18 or older with AMI (defined below) who reported a perceived need for mental health treatment or counseling in the past 12 months that was not received. This measure could include adults who reported that they received some type of mental health service in the past 12 months; an unmet need for services after adults had received some services would indicate a perceived need for additional services that they did not receive. Data are from the 2009–2011 and 2013–2015 NSDUH (SAMHSA), as reported in Mental Health America’s 2018 State of Mental Health in America (http://www.mentalhealthamerica.net).
23. Adults with any mental illness (AMI) who did not receive treatment: Percent of adults ages 18 or older with AMI (defined below) who reported they did not receive mental health treatment in the past 12 months. Mental health treatment is defined as receiving treatment or counseling for any problem with emotions, nerves, or mental health in the 12 months prior to the interview in any inpatient or outpatient setting, or the use of prescription medication for treatment of any mental or emotional condition that was not caused by the use of alcohol or drugs. Data are from the 2009–2011 and 2013–2015 NSDUH (SAMHSA), as reported in Mental Health America’s 2018 State of Mental Health in America (http://www.mentalhealthamerica.net).
Note: Adults with any mental illness (AMI) is defined as adults ages 18 or older who currently or at any time in the past year have had a diagnosable mental, behavioral, or emotional disorder (other than a developmental or substance use disorder) of sufficient duration to meet diagnostic criteria specified within the Diagnostic and Statistical Manual of
Mental Disorders, 4th edition, regardless of the level of impairment in carrying out major life activities. AMI was estimated based on a statistical model of a clinical diagnosis and responses to questions on distress, impairment, past year major depressive episode, past year suicidal thoughts, and age. For more information, see: SAMHSA, NSDUH, Methodological Summary and Definitions, https://www.samhsa.gov/data/sites/default/files/NSDUH-MethodSummDefsHTML-2015/NSDUH-MethodSummDefsHTML-2015/NSDUH-MethodSummDefs-2015.htm.
24. Hospital admissions for pediatric asthma, per 100,000 children: Excludes patients with cystic fibrosis or anomalies of the respiratory system, and transfers from other institutions. Authors’ analysis of 2012 and 2014 HCUP SID (AHRQ); not all states participate in HCUP. Estimates for total U.S. are from the HCUP NIS (AHRQ).
25. Potentially avoidable emergency department (ED) visits: Potentially avoidable ED visits were those that, based on diagnoses recorded during the visit and the health care service the patient received, were considered to be either nonemergent (care was not needed within 12 hours), or emergent (care needed within 12 hours) but that could have been treated safely and effectively in a primary care setting. This definition excludes any ED visit that resulted in an admission, as well as ED visits where the level of care provided in the ED was clinically indicated. This approach uses the New York University Center for Health and Public Service Research emergency department algorithm developed by John Billings, Nina Parikh, and Tod Mijanovich (see: Emergency Room Use — The New York Story, The Commonwealth Fund, Nov. 2000, http://www.commonwealthfund.org/publications/issue-briefs/2000/nov/emergency-room-use--the-new-york-story).
Ages 18–64, per 1,000 employer-insured enrollees: Michael E. Chernew and Andrew Hicks, Harvard Medical School Department of Health Care Policy, analysis of the 2015 Truven Marketscan Database.
Ages 65 and older, per 1,000 Medicare beneficiaries: Jie Zheng, Harvard University, analysis of 2012 and 2015 Medicare Enrollment and SAF Claims Data 20% sample of fee-for-service Medicare beneficences ages 65 and older (CMS, CCW).
26. Admissions for ambulatory care–sensitive conditions: Hospital admissions for one of the following eight ambulatory care–sensitive (ACS) conditions: long-term diabetes complications, lower extremity amputation among patients with diabetes, asthma or chronic obstructive pulmonary disease, hypertension, congestive heart failure, dehydration, bacterial pneumonia, and urinary tract infection.

commonwealthfund.org May 2018
2018 Scorecard on State Health System Performance 60
APPENDIX H. State Scorecard Indicator Descriptions and Source Notes (continued)
Ages 18–64, per 1,000 employer-insured enrollees: Michael E. Chernew and Andrew Hicks, Harvard Medical School Department of Health Care Policy, analysis of the 2015 Truven Marketscan Database.
Ages 65–74 and age 75 and older, per 1,000 Medicare beneficiaries: Admissions of fee-for-service Medicare beneficiaries ages 65–74 or ages 75 and older (measure reported separately for each age group). Authors’ analysis of 2012 and 2015 CCW data, retrieved from the April 2017 CMS Geographic Variation Public Use File (CMS, Office of Information Products and Analytics).
27. 30-day hospital readmissions: All hospital admissions among patients who were readmitted within 30 days of an acute hospital stay for any cause. A correction was made to account for likely transfers between hospitals.
Ages 18–64, per 1,000 employer-insured enrollees: Michael E. Chernew and Andrew Hicks, Harvard Medical School Department of Health Care Policy, analysis of the 2015 Truven Marketscan Database.
Age 65 and older, per 1,000 Medicare beneficiaries: Readmissions among fee-for-service Medicare beneficiaries ages 65 and older. Authors’ analysis of 2012 and 2015 CCW data, retrieved from the April 2017 CMS Geographic Variation Public Use File (CMS, Office of Information Products and Analytics).
28. Short-stay nursing home residents with a 30-day readmission to the hospital: Percent of newly admitted nursing home residents who are rehospitalized within 30 days of being discharged from a hospital to the nursing home. Vincent Mor, Brown University, analysis of 2012 and 2014 Medicare enrollment data, MDS, and MedPAR File (CMS).
29. Long-stay nursing home residents with a hospital admission: Percent of long-stay residents (residing in a nursing home for at least 90 consecutive days) who were hospitalized within six months of baseline assessment. Vincent Mor, Brown University, analysis of 2012 and 2014 Medicare enrollment data, MDS, and MedPAR File (CMS).
30. Home health patients with a hospital admission: Percent of home health episodes among fee-for-service Medicare beneficiaries during which the patient was admitted to an acute-care hospital. Authors’ analysis data from CMS Medicare claims data. Data retrieved from 4th quarter 2017 and 3rd quarter 2014 Home Health Compare (CMS), representing patient experiences in 2016 and 2013.
31. Adults ages 18–50 with low back pain who had an imaging study at diagnosis: The share of employer-insured adults ages 18–50 who had a new primary diagnosis of low back pain with an imaging study (plain X-ray, MRI, or CT scan) within 28 days of the diagnosis (expressed as a rate per 100 enrollees). Enrollees who have a diagnosis for which an imaging study may be clinically appropriate (cancer, recent trauma, IV drug abuse, or neurologic impairment) are excluded. Michael E. Chernew and Andrew Hicks, Harvard Medical School Department of Health Care Policy, analysis of the 2015 Truven Marketscan Database.
32. Total employer-sponsored insurance spending per enrollee: Total spending per enrollee in employer-sponsored insurance plans estimated from a regression model of reimbursed costs for health care services from all sources of payment including the health plan, enrollee, and any third party payers incurred in 2013 and in 2015. Outpatient prescription drug charges are excluded. Enrollees with capitated plans and their associated claims are also excluded. Estimates for each state were adjusted for enrollees’ age and sex, the interaction of age and sex, partial year enrollment and regional wage differences. Michael E. Chernew and Andrew Hicks, Harvard Medical School Department of Health Care Policy, analysis of the 2015 Truven Marketscan Database.
33. Total Medicare (Parts A and B) reimbursements per enrollee: Total Medicare fee-for-service reimbursements include payments for both Part A and Part B but exclude Part D (prescription drug costs) and extra CMS payments for graduate medical education and for treating low-income patients. Reimbursements reflect only the age 65 and older Medicare fee-for-service population. Authors’ analysis of 2012 and 2015 CCW data, retrieved from the April 2017 CMS Geographic Variation Public Use File (CMS, Office of Information Products and Analytics).
34. Mortality amenable to health care, deaths per 100,000 population: Number of deaths before age 75 per 100,000 population that resulted from causes considered at least partially treatable or preventable with timely and appropriate medical care (see list), as described in E. Nolte and M. McKee, “Measuring the Health of Nations: Analysis of Mortality Amenable to Health Care,” British Medical Journal, Nov. 15, 2003, 327 (7424): 1129–32. Authors’ analysis of mortality data from CDC restricted-use Multiple Cause-of-Death file (NCHS) and U.S. Census Bureau population data, 2003–2015.
Causes of death AgesIntestinal infections 0–14Tuberculosis 0–74Other infections (diphtheria, tetanus, septicaemia, poliomyelitis) 0–74Whooping cough 0–14Measles 1–14
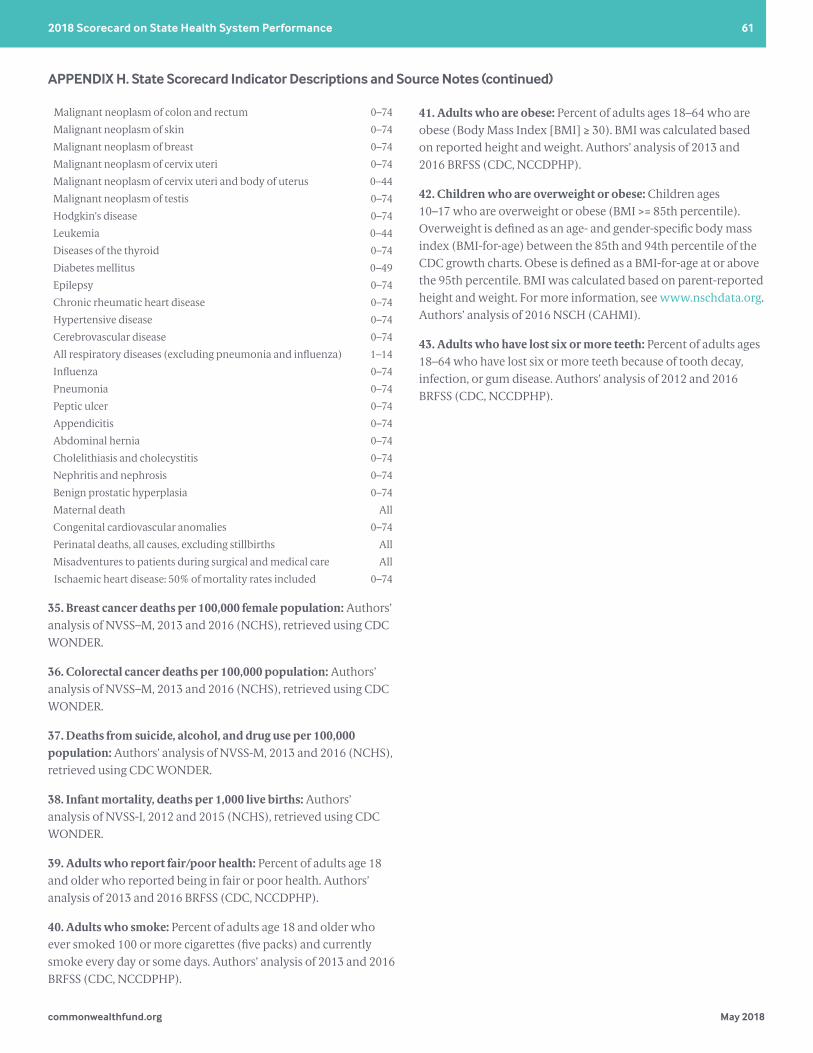
commonwealthfund.org May 2018
2018 Scorecard on State Health System Performance 61
APPENDIX H. State Scorecard Indicator Descriptions and Source Notes (continued)
Malignant neoplasm of colon and rectum 0–74Malignant neoplasm of skin 0–74Malignant neoplasm of breast 0–74Malignant neoplasm of cervix uteri 0–74Malignant neoplasm of cervix uteri and body of uterus 0–44Malignant neoplasm of testis 0–74Hodgkin’s disease 0–74Leukemia 0–44Diseases of the thyroid 0–74Diabetes mellitus 0–49Epilepsy 0–74Chronic rheumatic heart disease 0–74Hypertensive disease 0–74Cerebrovascular disease 0–74All respiratory diseases (excluding pneumonia and influenza) 1–14Influenza 0–74Pneumonia 0–74Peptic ulcer 0–74Appendicitis 0–74Abdominal hernia 0–74Cholelithiasis and cholecystitis 0–74Nephritis and nephrosis 0–74Benign prostatic hyperplasia 0–74Maternal death AllCongenital cardiovascular anomalies 0–74Perinatal deaths, all causes, excluding stillbirths AllMisadventures to patients during surgical and medical care AllIschaemic heart disease: 50% of mortality rates included 0–74
35. Breast cancer deaths per 100,000 female population: Authors’ analysis of NVSS–M, 2013 and 2016 (NCHS), retrieved using CDC WONDER.
36. Colorectal cancer deaths per 100,000 population: Authors’ analysis of NVSS–M, 2013 and 2016 (NCHS), retrieved using CDC WONDER.
37. Deaths from suicide, alcohol, and drug use per 100,000 population: Authors’ analysis of NVSS-M, 2013 and 2016 (NCHS), retrieved using CDC WONDER.
38. Infant mortality, deaths per 1,000 live births: Authors’ analysis of NVSS-I, 2012 and 2015 (NCHS), retrieved using CDC WONDER.
39. Adults who report fair/poor health: Percent of adults age 18 and older who reported being in fair or poor health. Authors’ analysis of 2013 and 2016 BRFSS (CDC, NCCDPHP).
40. Adults who smoke: Percent of adults age 18 and older who ever smoked 100 or more cigarettes (five packs) and currently smoke every day or some days. Authors’ analysis of 2013 and 2016 BRFSS (CDC, NCCDPHP).
41. Adults who are obese: Percent of adults ages 18–64 who are obese (Body Mass Index [BMI] ≥ 30). BMI was calculated based on reported height and weight. Authors’ analysis of 2013 and 2016 BRFSS (CDC, NCCDPHP).
42. Children who are overweight or obese: Children ages 10–17 who are overweight or obese (BMI >= 85th percentile). Overweight is defined as an age- and gender-specific body mass index (BMI-for-age) between the 85th and 94th percentile of the CDC growth charts. Obese is defined as a BMI-for-age at or above the 95th percentile. BMI was calculated based on parent-reported height and weight. For more information, see www.nschdata.org. Authors’ analysis of 2016 NSCH (CAHMI).
43. Adults who have lost six or more teeth: Percent of adults ages 18–64 who have lost six or more teeth because of tooth decay, infection, or gum disease. Authors’ analysis of 2012 and 2016 BRFSS (CDC, NCCDPHP).

For more information about this report, please contact:
David C. Radley, Ph.D., M.P.H., Senior Scientist, Westat and The Commonwealth Fund Health System Scorecard Project, at drcmwf.org.
About The Commonwealth Fund
The Commonwealth Fund, among the first private foundations started by a woman philanthropist — Anna M. Harkness — was established in 1918 with the broad charge to enhance the common good.
The mission of the Commonwealth Fund is to promote a high performance health care system. The Fund carries out this mandate by supporting independent research on health care issues and making grants to improve health care practice and policy. An international program in health policy is designed to stimulate innovative policies and practices in the United States and other industrialized countries.
Support for this research was provided by the Commonwealth Fund. The views presented here are those of the authors and not necessarily those of the Commonwealth Fund or its directors, officers, or staff.
To learn more about new publications when they become available, visit the Fund’s website and register to receive email alerts.