2018 investor days21.q4cdn.com/840201055/files/doc_presentations/201… · · 2018-03-02this...
TRANSCRIPT

2018 INVESTOR DAY
NYSE: DOOR
March 2, 2018
22
Safe Harbor / Non-GAAP Financial Measures
SAFE HARBOR / FORWARD LOOKING STATEMENT
This investor presentation contains forward-looking information and other forward-looking statements within the meaning of applicable Canadian and/or U.S. securities laws, including our discussion of
our 2018 outlook and long term growth framework, housing and other markets, and the effects of our strategic initiatives. When used in this investor presentation, such forward-looking statements may
be identified by the use of such words as “may,” “might,” “could,” “will,” “would,” “should,” “expect,” “believes,” “outlook,” “predict,” “forecast,” “objective,” “remain,” “anticipate,” “estimate,” “potential,”
“continue,” “plan,” “project,” “targeting,” or the negative of these terms or other similar terminology. Forward-looking statements involve significant known and unknown risks, uncertainties and other
factors that may cause the actual results, performance or achievements of Masonite, or industry results, to be materially different from any future plans, goals, targets, objectives, results, performance
or achievements expressed or implied by such forward-looking statements. As a result, such forward-looking statements should not be read as guarantees of future performance or results, should not
be unduly relied upon, and will not necessarily be accurate indications of whether or not such results will be achieved. Factors that could cause actual results to differ materially from the results
discussed in the forward-looking statements include, but are not limited to, our ability to successfully implement our business strategy; general economic, market and business conditions; levels of
residential new construction; residential repair, renovation and remodeling; and non-residential building construction activity; the United Kingdom's formal trigger of the two year process for its exit from
the European Union and related negotiations; competition; our ability to manage our operations including integrating our recent acquisitions and companies or assets we acquire in the future; our ability
to generate sufficient cash flows to fund our capital expenditure requirements, to meet our pension obligations, and to meet our debt service obligations, including our obligations under our senior notes
and our ABL Facility; labor relations (i.e., disruptions, strikes or work stoppages), labor costs and availability of labor; increases in the costs of raw materials or any shortage in supplies; our ability to
keep pace with technological developments; cyber security threats and attacks; the actions taken by, and the continued success of, certain key customers; our ability to maintain relationships with
certain customers; the ability to generate the benefits of our restructuring activities; retention of key management personnel; environmental and other government regulations; and limitations on
operating our business as a result of covenant restrictions under our existing and future indebtedness, including our senior notes and our ABL Facility.
NON-GAAP FINANCIAL MEASURES
Our management reviews net sales and Adjusted EBITDA (as defined below) to evaluate segment performance and allocate resources. Net assets are not allocated to the reportable segments.
Adjusted EBITDA is a non-GAAP financial measure which does not have a standardized meaning under GAAP and is unlikely to be comparable to similar measures used by other companies. Adjusted
EBITDA should not be considered as an alternative to either net income or operating cash flows determined in accordance with GAAP. Additionally, Adjusted EBITDA is not intended to be a measure of
free cash flow for management's discretionary use, as it does not include certain cash requirements such as interest payments, tax payments and debt service requirements. Beginning with the fourth
quarter of 2015, we revised our calculation of Adjusted EBITDA to separately exclude loss (gain) on disposal of subsidiaries. This definition of Adjusted EBITDA differs from the definitions of EBITDA
contained in the indenture governing the 2023 Notes and the credit agreement governing the ABL Facility. Adjusted EBITDA, as calculated under our ABL Facility or senior notes would also include,
among other things, additional add-backs for amounts related to: cost savings projected by us in good faith to be realized as a result of actions taken or expected to be taken prior to or during the
relevant period; fees and expenses in connection with certain plant closures and layoffs; and the amount of any restructuring charges, integration costs or other business optimization expenses or
reserve deducted in the relevant period in computing consolidated net income, including any one-time costs incurred in connection with acquisitions. The tables in the appendix to this presentation
reconcile Adjusted EBITDA to net income (loss) attributable to Masonite for the periods indicated. We are not providing a quantitative reconciliation of our Adjusted EBITDA or diluted Adjusted EPS
outlook to the corresponding GAAP information because the GAAP measures that we exclude from our Adjusted EBITDA outlook are difficult to predict and are primarily dependent on future
uncertainties.
Adjusted EBITDA margin is defined as Adjusted EBITDA divided by Net Sales. Management believes this measure provides supplemental information on how successfully we operate our business.
Adjusted EPS is diluted earnings per common share attributable to Masonite (EPS) less asset impairment charges, loss (gain) on disposal of subsidiaries, and other items, if any, that do not relate to
Masonite’s underlying business performance (each net of related tax expense (benefit)). Beginning in the fourth quarter of 2017, we revised our calculation of Adjusted EPS to exclude the beneficial
impact of the deferred tax revaluation recognized as a result of The Tax Cuts and Jobs Act of 2017 and the release of a valuation allowance in Canada as such tax assets are likely to be realized in
future periods. The revision to this definition had no impact on our reported Adjusted EPS for the three months or year ended January 1, 2017. Management uses this measure to evaluate the overall
performance of the Company and believes this measure provides investors with helpful supplemental information regarding the underlying performance of the Company from period to period. This
measure may be inconsistent with similar measures presented by other companies.
Return on Invested Capial (ROIC) is defined as net operating profit after tax (NOPAT) divided by average invested capital.
Free cash flow is defined as Cash Flow from Operations less capital expenditures.

3
Agenda
a1 Opening Remarks & Purpose
a2 North American Residential
a3 Architectural
a4 Europe
a5 Break / Coffee
a6 Operations
a7 Financial Review
a8 Summary / Q&A

44
Masonite’s Management Team

5
COMPANY OVERVIEW

6
Fred LynchPresident & Chief Executive Officer
1 OUR FOOTPRINT
2 PURPOSE

77
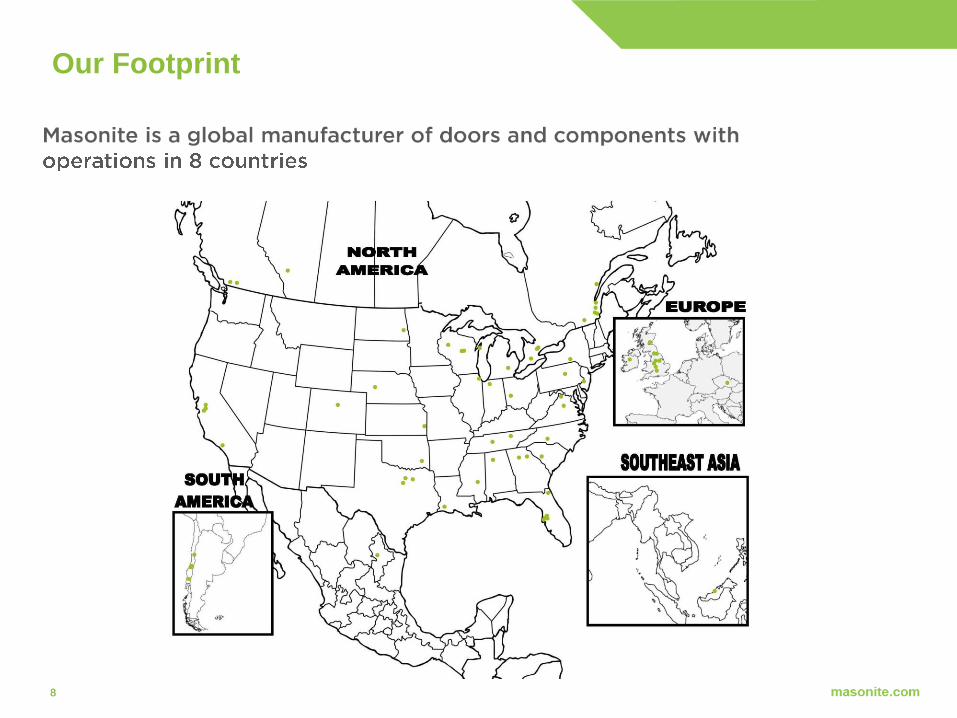
Our Footprint
88
Our Footprint

99
Our Footprint
•
•
•
•
•
•
Note: North American facilities
•
•
•
Note: North American facilities
1010
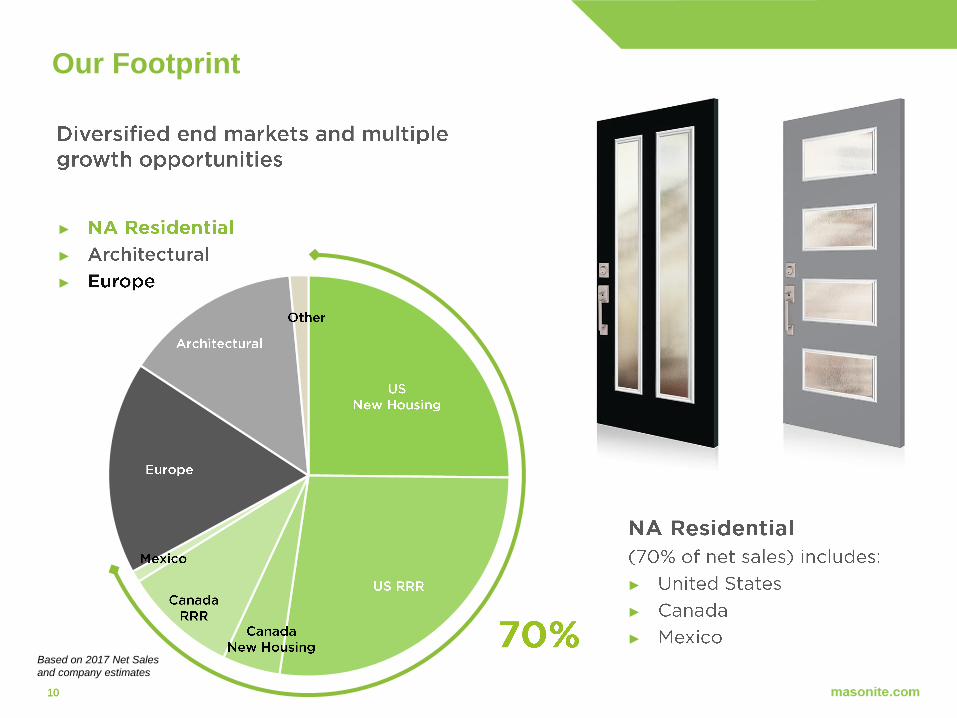
Our Footprint
►
►
►
►
►
►
Based on 2017 Net Sales
and company estimates

1111
What We’ll Talk About
1
Growth withPurpose
2
Demonstrated
Success
3
Cash FlowOpportunity
4
DrivingShareholder
Value

1212
Safety Is Our Top Priority
2007 2008 2009 2010 2011 2012 2013 2014 2015 2016 2017
* Source: Bureau of Labor Statistics (NAICS category)

1313
Environmental Stewardship

1414

1515

1616

1717

1818

19
NORTH AMERICA RESIDENTIAL

20
Tony HairPresident, Global Residential
1 BUSINESS OPPORTUNITY
2 STRATEGY FOR WINNING
3 LOOKING FORWARD

2121
1968 1972 1976 1980 1984 1988 1992 1996 2000 2004 2008 2012 2016 2020F
Business Opportunity
•
•
Source: US Census Bureau
2018-2020 forecasts from NAHB, ITR, Fannie Mae
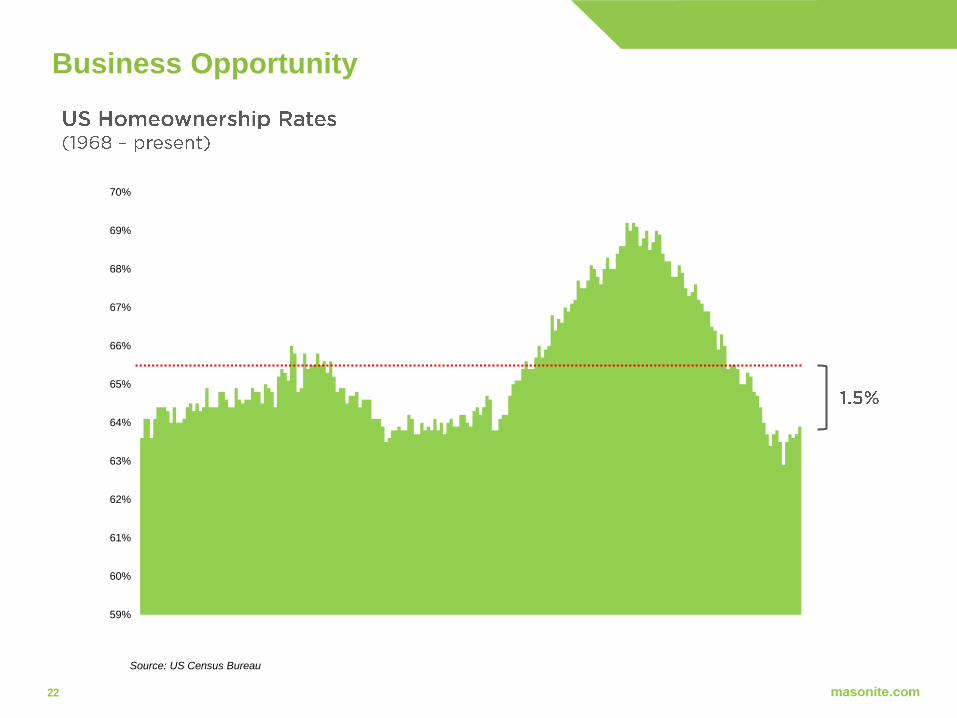
2222
Business Opportunity
59%
60%
61%
62%
63%
64%
65%
66%
67%
68%
69%
70%
Source: US Census Bureau

2323
Business Opportunity
Source: US Census Bureau
0
50
100
150
200
250
300
350
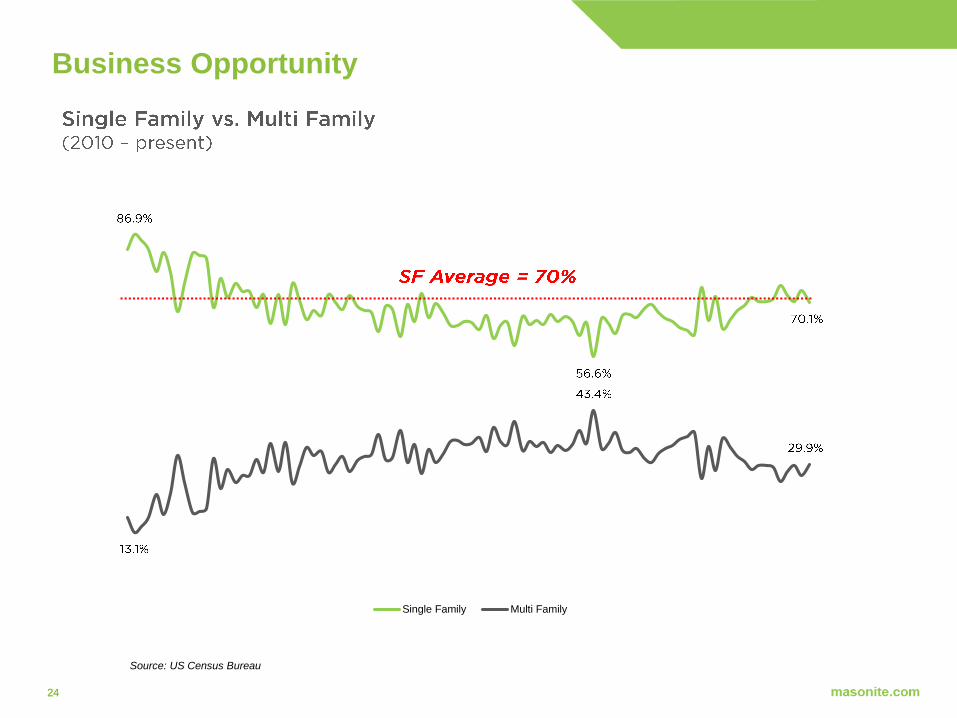
2424
Single Family Multi Family
Business Opportunity
Source: US Census Bureau

25
Residential Value Proposition

2626
Trend Leading Products

2727
Changing Design Trends
2014 2015 2016 2017 2018E 2019E 2020E
Note: Masonite percentages
2011 2012 2013 2014 2015 2016 2017
Note: Masonite percentages & estimates

2828
Changing the Conversation in Doors

29
Driving Increased Sales

3030
Digital Initiatives

3131
Digital Initiatives

3232
Digital Initiatives
•
•
•
•

3333
Segment Long Term Growth Framework^
( )̂ - Company long term growth f ramework is a f orward-looking statement and subject to risks and uncertainties. See "Saf e Harbor/Forward Looking Statement” (*) – See def inition of Adjusted EBITDA on page 2. We are not prov iding a quantitativ e reconciliation of our Adjusted EBITDA or Adjusted EPS outlook to the corresponding GAAP inf ormation because the GAAP measures that we exclude f rom our Adjusted EBITDA and Adjusted EPS outlook are dif f icult to predict and are primarily dependent on f uture uncertainties.

34
ARCHITECTURAL

35
Graham ThayerSVP, Architectural
1 BUSINESS OPPORTUNITY
2 STRATEGY FOR WINNING
3 LOOKING FORWARD

3636
Business Opportunity
Source: Dodge Analytics
35
40
45
50
55
60
2007 2008 2009 2010 2011 2012 2013 2014 2015 2016 2017
Source: Architectural Billings Index (Rolling 12 month average)
Score above 50 indicates a positive outlook for spending
2007 2008 2009 2010 2011 2012 2013 2014 2015 2016 2017

3737
Business Opportunity
* Other consists of stock doors, multifamily and retail
►
►
►
►
►

3838
Business Opportunity
* $ spend in billions
Source: FMI Global
3.3%

3939
Business Opportunity
Source: Company estimates
4040
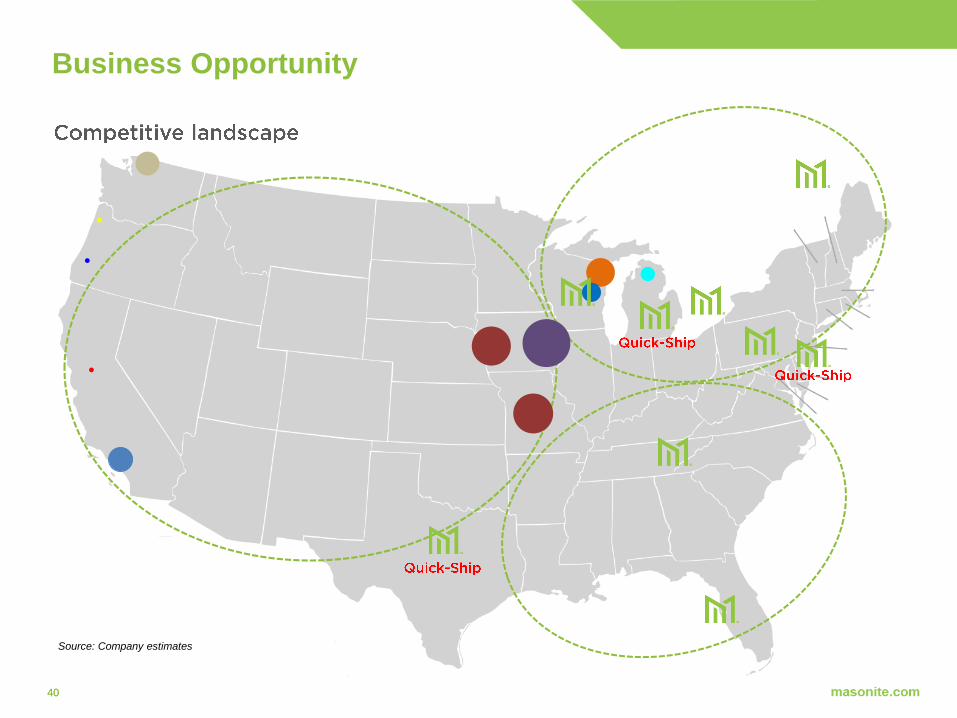
Business Opportunity
Source: Company estimates
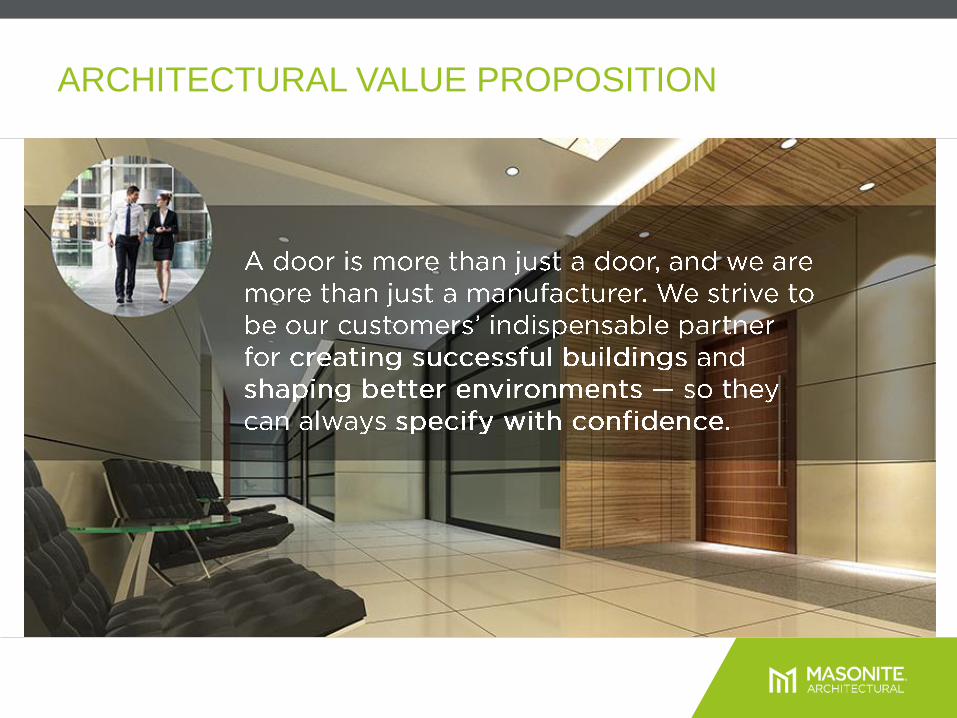
ARCHITECTURAL VALUE PROPOSITION

42
ARCHITECTURAL BUSINESS TRANSFORMATION

WHO WE ARE (BECOMING): BRAND PILLARS

Pre-Design Site AnalysisSchematic
DesignDesign
DevelopmentConstruction
DocumentationBidding & Post-Bid
Construction Administration
Post Construction
Services
COMMERCIAL CONSTRUCTION LIFE CYCLE
44
Concept Development Planning the space Product Research & Bids Purchase & Installation

Pre-Design Site AnalysisSchematic
DesignDesign
DevelopmentConstruction
DocumentationBidding & Post-Bid
Construction Administration
Post Construction
Services
DIGITAL ENABLEMENT
45
Architect Designer Spec Writer
D&H Consultant
GC / Distributor GC / Distributor
DoorSelector™
Concept Development Planning the space Product Research & Bids Purchase & Installation
DoorSpecifier™ DoorBuilder™
4646
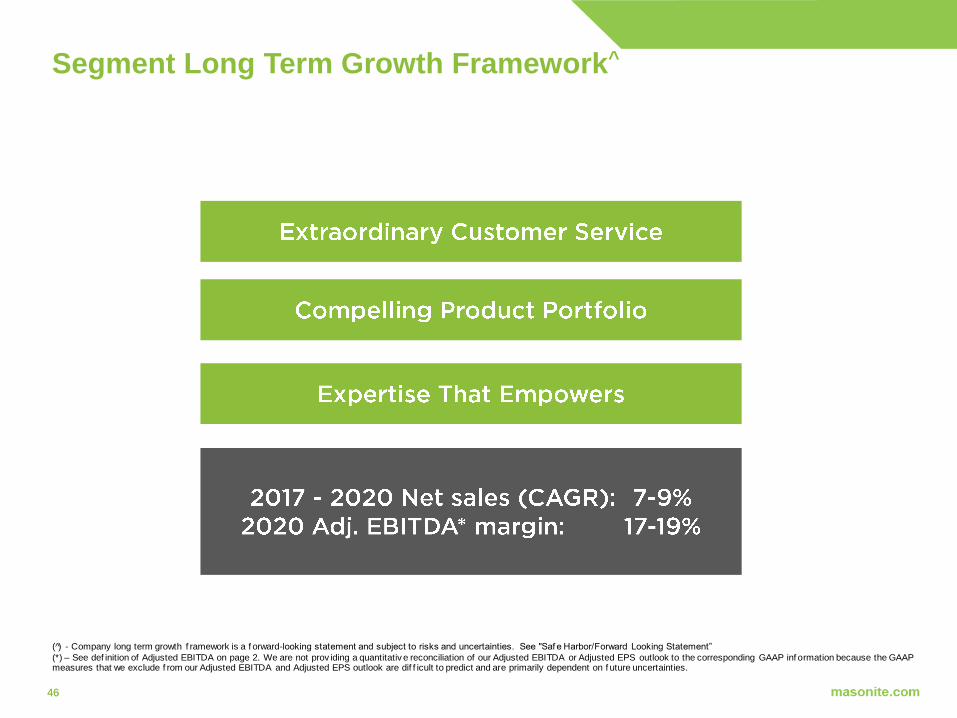
Segment Long Term Growth Framework^
( )̂ - Company long term growth f ramework is a f orward-looking statement and subject to risks and uncertainties. See "Saf e Harbor/Forward Looking Statement” (*) – See def inition of Adjusted EBITDA on page 2. We are not prov iding a quantitativ e reconciliation of our Adjusted EBITDA or Adjusted EPS outlook to the corresponding GAAP inf ormation because the GAAP measures that we exclude f rom our Adjusted EBITDA and Adjusted EPS outlook are dif f icult to predict and are primarily dependent on f uture uncertainties.

47
EUROPE

48
Tony HairPresident, Global Residential
1 BUSINESS OPPORTUNITY
2 STRATEGY FOR WINNING
3 LOOKING FORWARD
4949
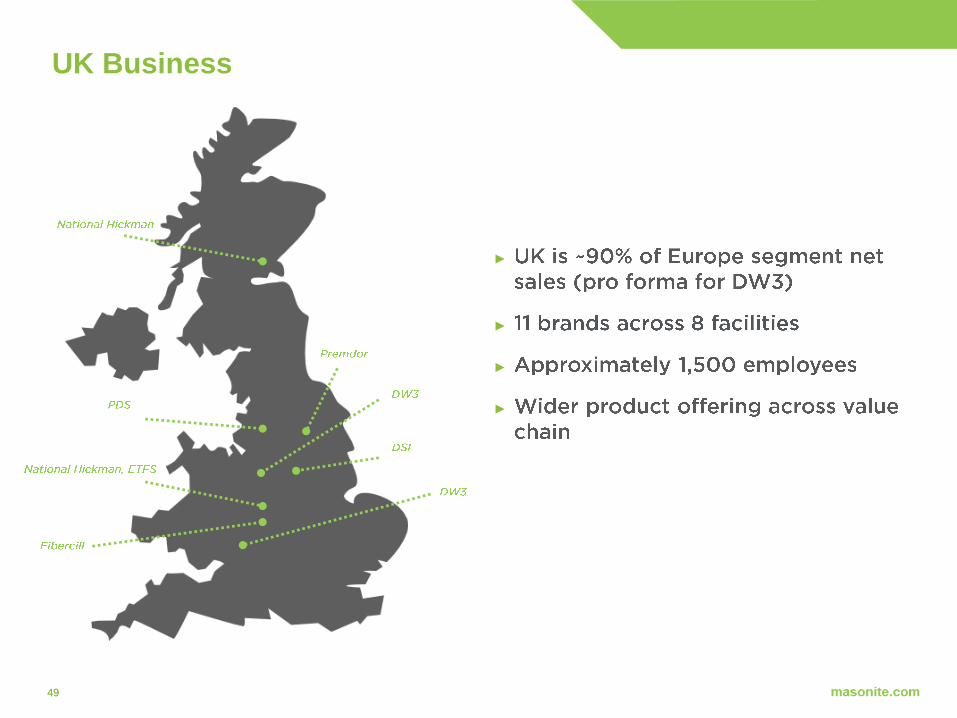
UK Business
►
►
►
►

5050
2016 2017 2018 2019 2020
2016 2017 2018 2019 2020
Business Opportunity
►
►
►
►
►
►
Source: ONS and Experian Construction Forecast 2017
Source: NHBC Housing Tracker
(in 000s)
5151
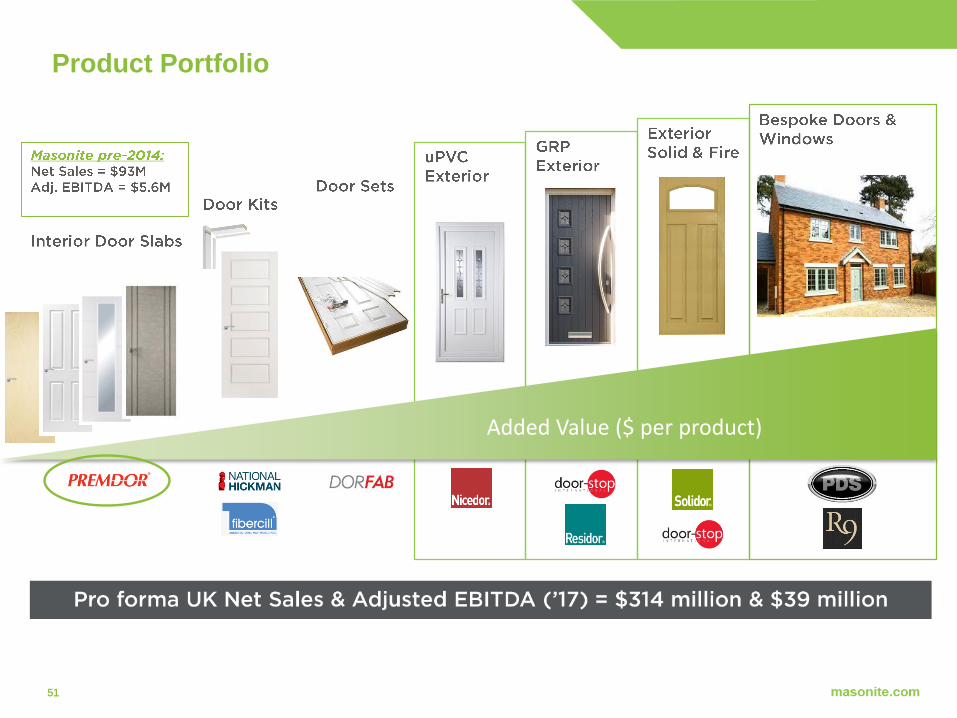
Product Portfolio
Added Value ($ per product)
5252
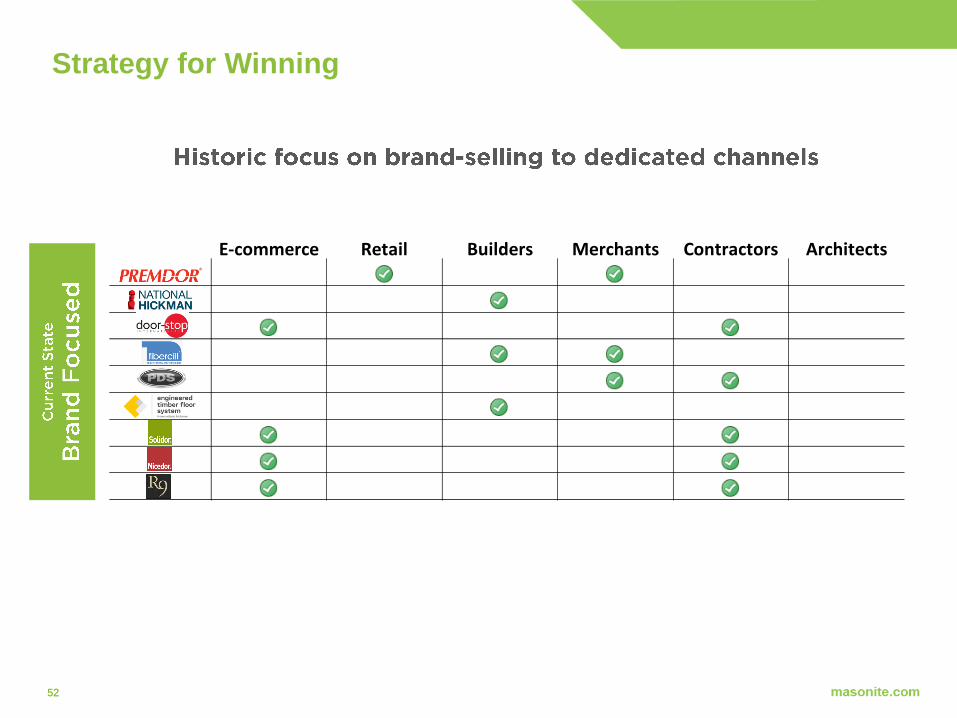
Strategy for Winning
E-commerce Retail Builders Merchants Contractors Architects
5353
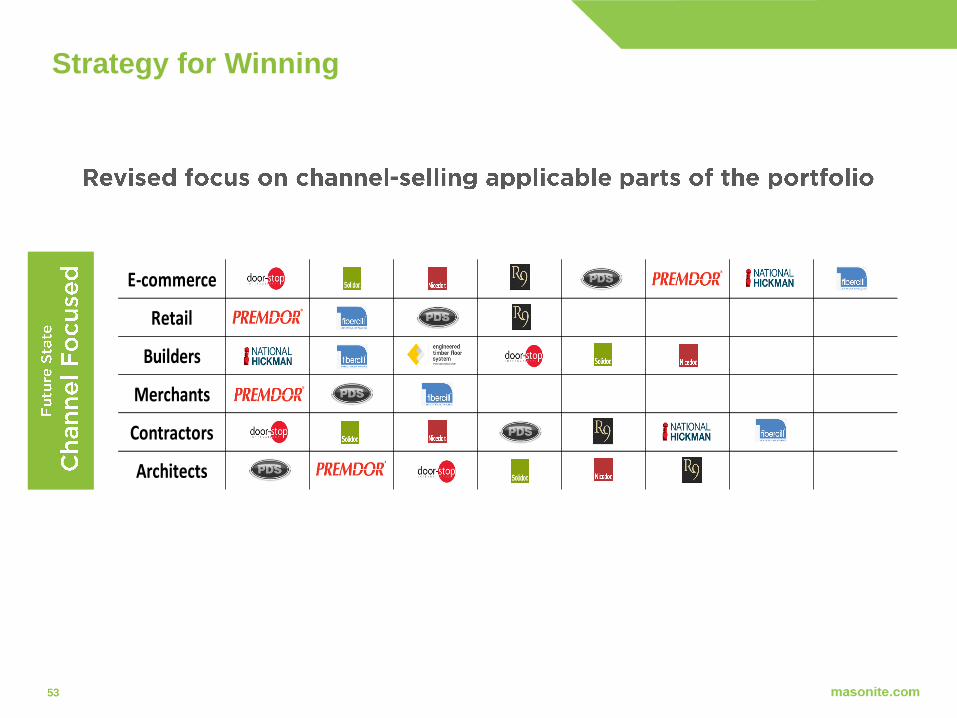
E-commerce
Retail
Builders
Merchants
Contractors
Architects
Strategy for Winning

5454
Digital Initiatives
►
►
►
►
►
►
►
►
►
►

5555
Segment Long Term Growth Framework^
( )̂ - Company long term growth f ramework is a f orward-looking statement and subject to risks and uncertainties. See "Saf e Harbor/Forward Looking Statement” (*) – See def inition of Adjusted EBITDA on page 2. We are not prov iding a quantitativ e reconciliation of our Adjusted EBITDA or Adjusted EPS outlook to the corresponding GAAP inf ormation because the GAAP measures that we exclude f rom our Adjusted EBITDA and Adjusted EPS outlook are dif f icult to predict and are primarily dependent on f uture uncertainties.

5656

57
OPERATIONS

58
Randy WhiteSVP, Global Operations &
Supply Chain
1 LEVERAGE MVANTAGE PLATFORM
2 SERVICE, QUALITY, DELIVERY
3 TARGETED AUTOMATION
5959
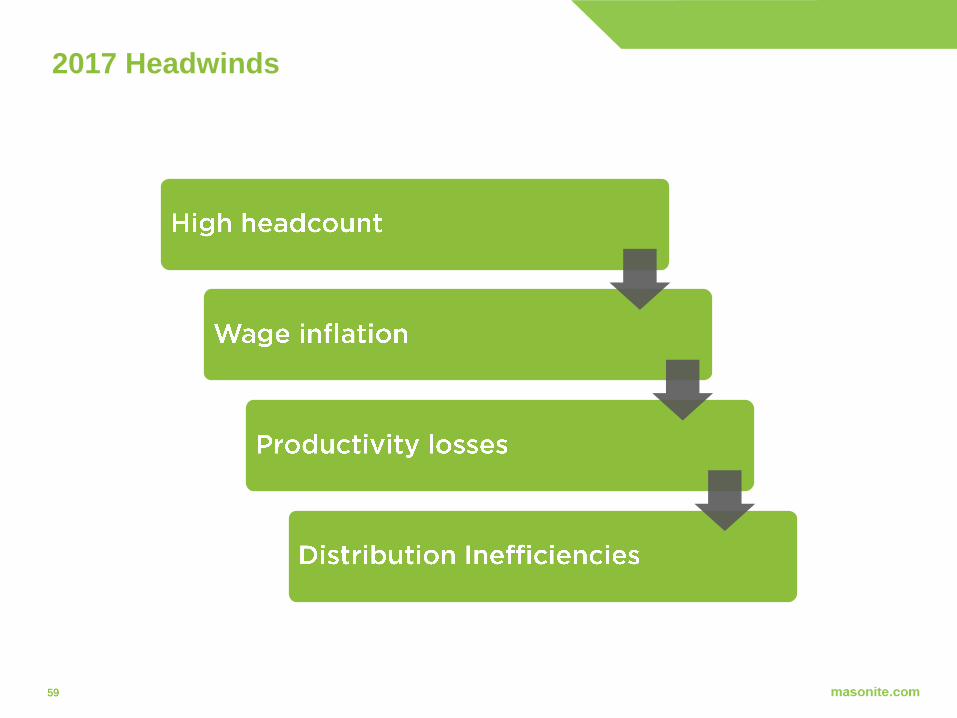
2017 Headwinds
6060
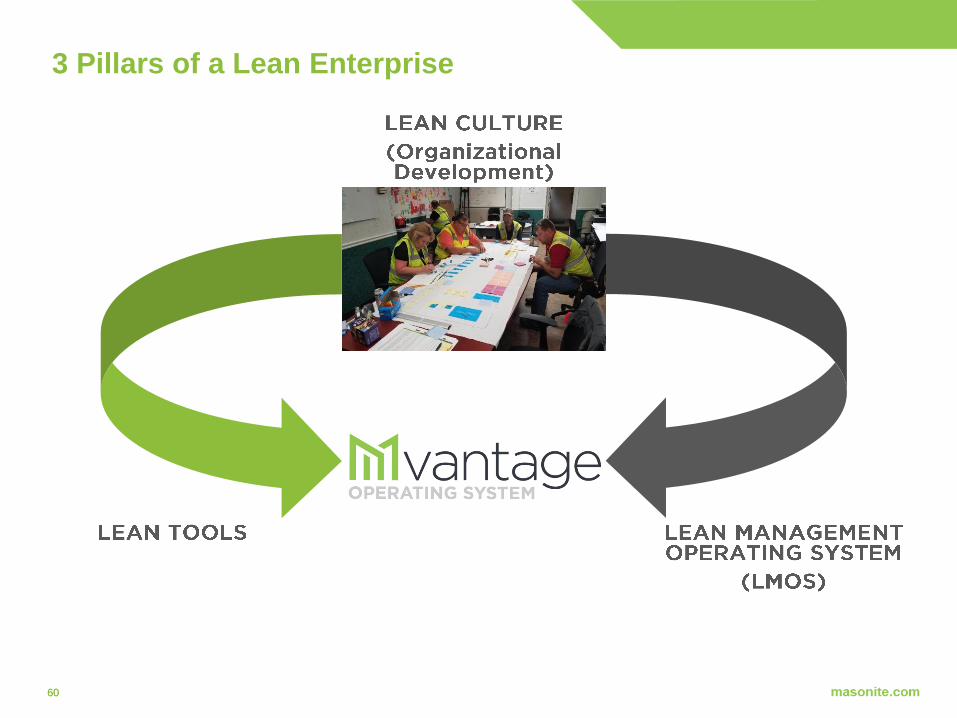
3 Pillars of a Lean Enterprise

61 masonite.com
2018 Continuous Improvement Focus
6262
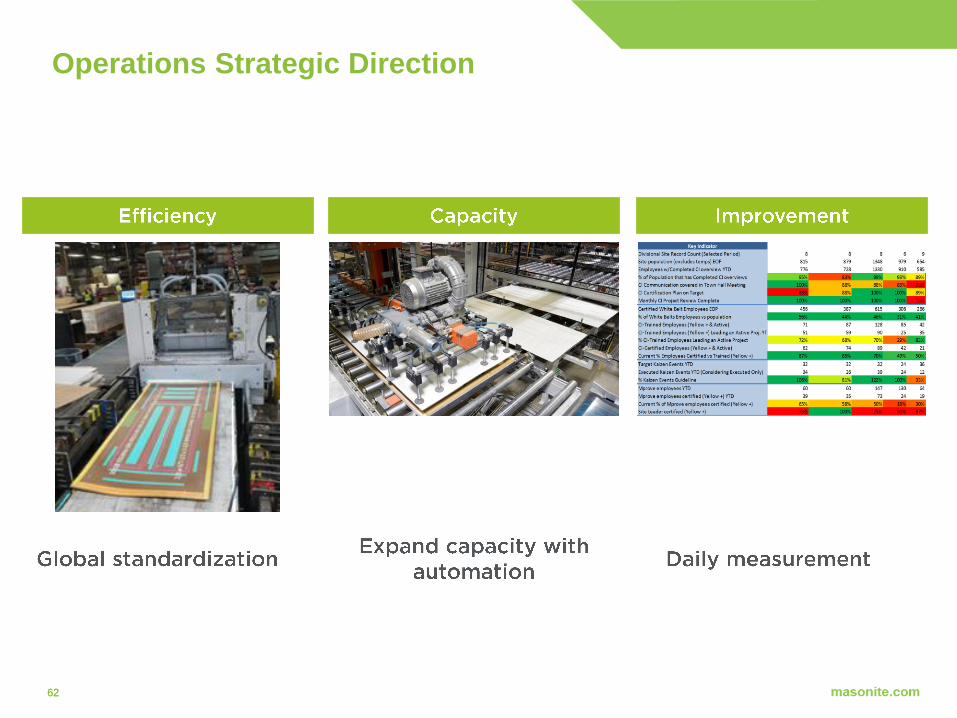
Operations Strategic Direction

6363
Operations Strategic Direction
►
►
►

6464
Operations Strategic Direction
►
►
►

6565
92
94
96
98
100
102
104
106
0%
2%
4%
6%
8%
10%
12%
Source: Bureau of Labor Statistics
Tightening Labor Market
Source: Bureau of Labor Statistics
* Indexed to 2005 dollars

6666
Automation
►
►
►
►
►
►
►
►

6767
Automation

6868
Long Term Growth Framework^
( )̂ - Company long term growth framework is a forward-looking statement and subject to risks and uncertainties. See "Safe Harbor/Forward Looking Statement”
69
FINANCIAL REVIEW

70
Russ TiejemaChief Financial Officer
1 FINANCIAL OVERVIEW
2 LONG TERM GROWTH FRAMEWORK
3 CASH FLOW & CAPITAL DEPLOYMENT

7171
Historical Performance & Growth
2013 2014 2015 2016 2017 2013 2014 2015 2016 2017
(*) – See safe harbor/non-GAAP financial measures on page 2 for definitions and other information and appendix for non-GAAP reconciliations
7272
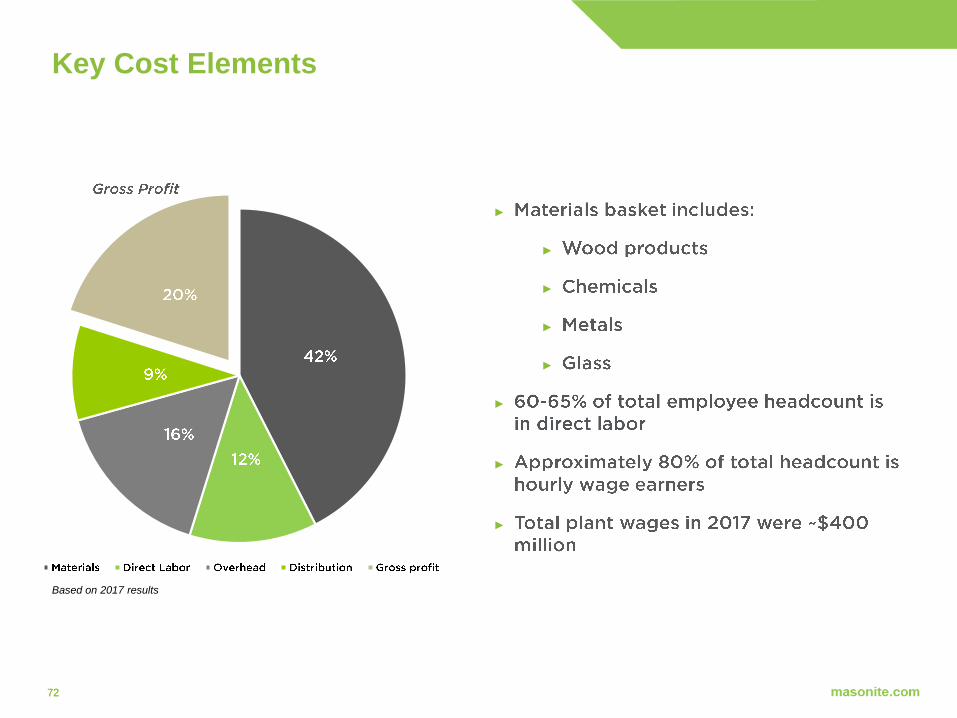
Key Cost Elements
~$400-
$430M
►
►
►
►
►
►
►
►
Based on 2017 results

7373
2018 Outlook*
(*) –Our 2018 outlook is a forward-looking statement and subject to risks and uncertainties. See "Safe Harbor/Forward Looking Statement”
( )̂ – See definition of non-GAAP financial measures on page 2. We are not providing a quantitative reconciliation of our Adjusted EBITDA or Adjusted EPS outlook to the
corresponding GAAP information because the GAAP measures that we exclude from our Adjusted EBITDA and Adjusted EPS outlook are difficult to predict and are
primarily dependent on future uncertainties.

7474
Long Term Growth Framework^
2017 and 2020 $ in billions
^ Europe increase includes DW3
( )̂ - Company long term growth framework is a forward-looking statement and subject to risks and uncertainties. See "Safe Harbor/Forward Looking Statement”
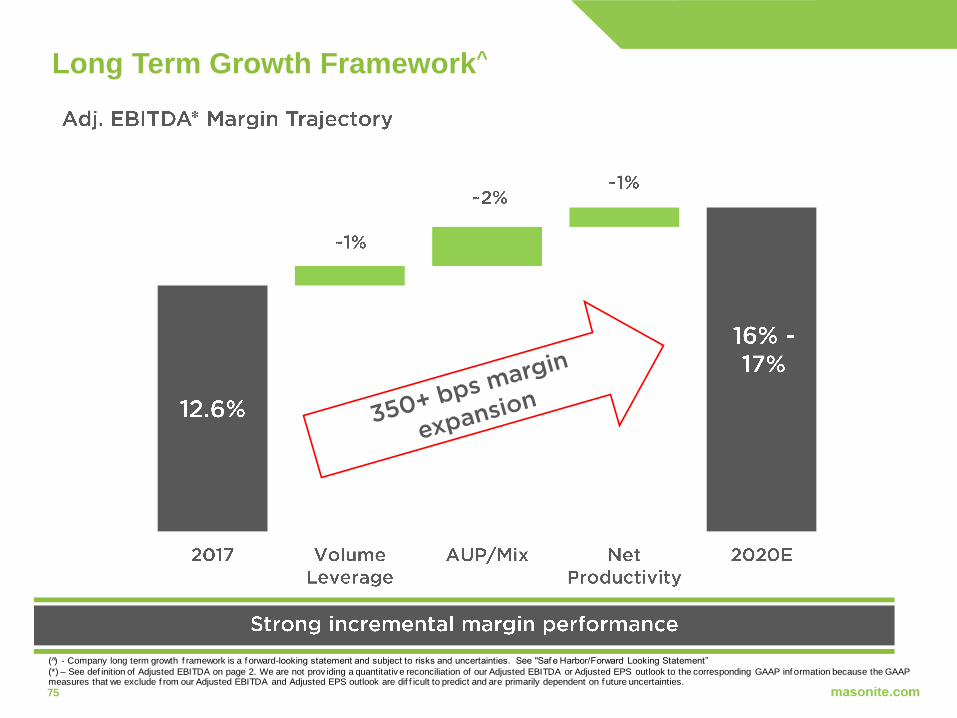
7575
Long Term Growth Framework^
( )̂ - Company long term growth f ramework is a f orward-looking statement and subject to risks and uncertainties. See "Saf e Harbor/Forward Looking Statement” (*) – See def inition of Adjusted EBITDA on page 2. We are not prov iding a quantitativ e reconciliation of our Adjusted EBITDA or Adjusted EPS outlook to the corresponding GAAP inf ormation because the GAAP measures that we exclude f rom our Adjusted EBITDA and Adjusted EPS outlook are dif f icult to predict and are primarily dependent on f uture uncertainties.

7676
Cash Flow Priorities
►
►
►
►

7777
Growth in Cash Flow & Cash Spend
$ in millions
2013 2014 2015 2016 2017
(*) – See safe harbor/non-GAAP financial measures on page 2 for definitions and other information and appendix for non-GAAP reconciliations
7878
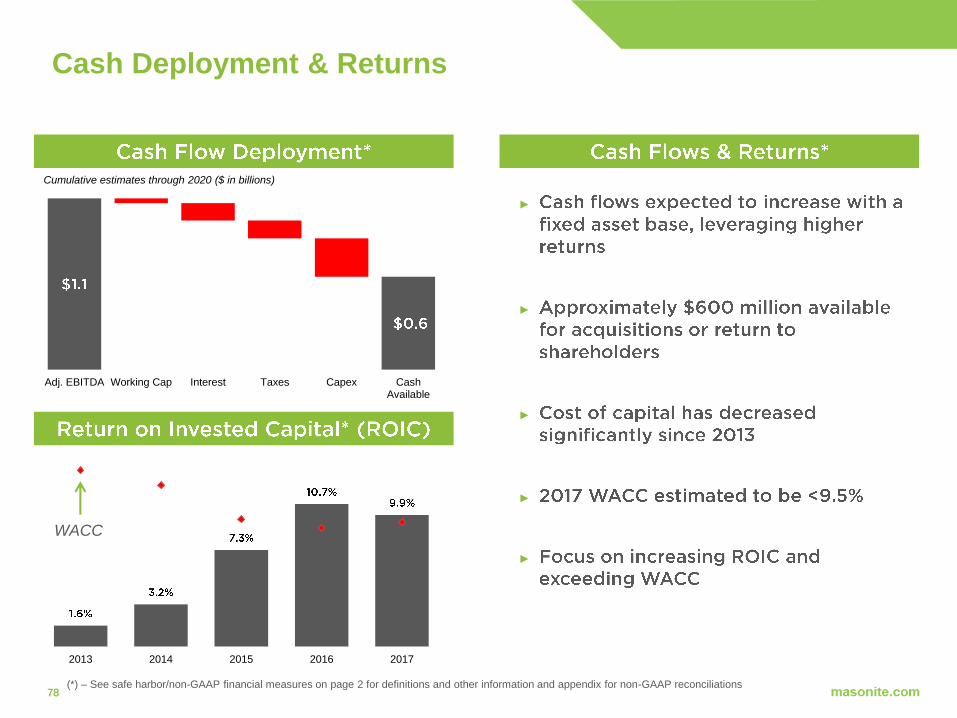
Adj. EBITDA Working Cap Interest Taxes Capex CashAvailable
Cash Deployment & Returns
(*) – See safe harbor/non-GAAP financial measures on page 2 for definitions and other information and appendix for non-GAAP reconciliations
WACC
►
►
►
►
►
Cumulative estimates through 2020 ($ in billions)
2013 2014 2015 2016 2017

7979
Organic Investment - Capital Expenditures
►
►
►
►
►
►
►
►
Based on ~$80 million per year

8080
Maximize Shareholder Returns
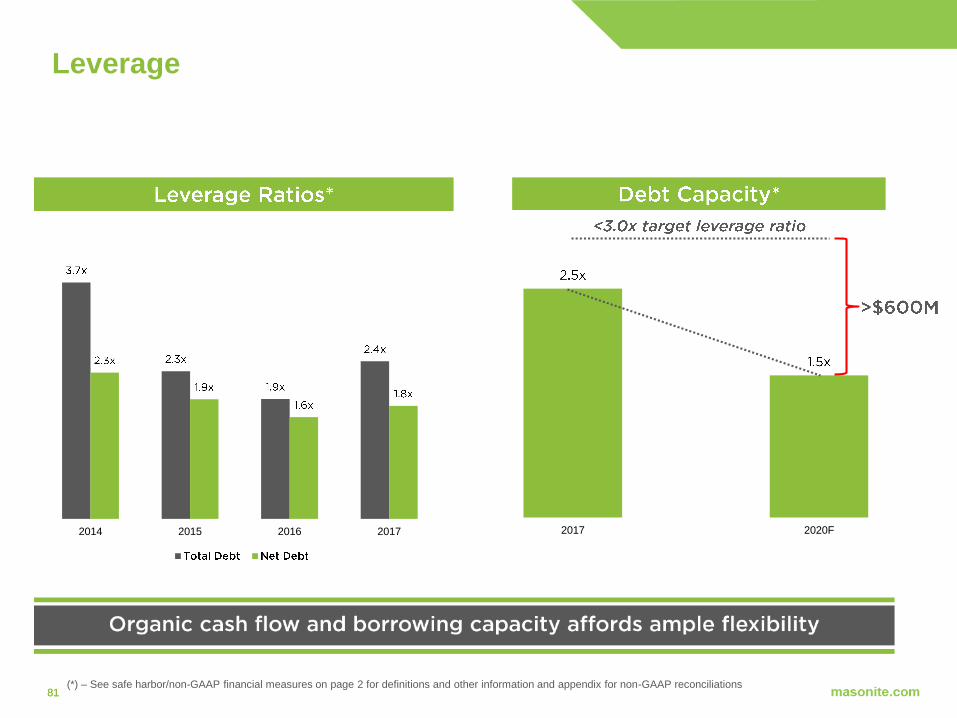
8181
Leverage
2017 2020F2014 2015 2016 2017
(*) – See safe harbor/non-GAAP financial measures on page 2 for definitions and other information and appendix for non-GAAP reconciliations

8282
Shareholder Value
► ►
83
Fred LynchPresident & Chief Executive Officer
1 SUMMARY
2 Q&A

84
Summary
▶
▶
▶
▶
▶
▶
▶
▶
▶
▶
▶
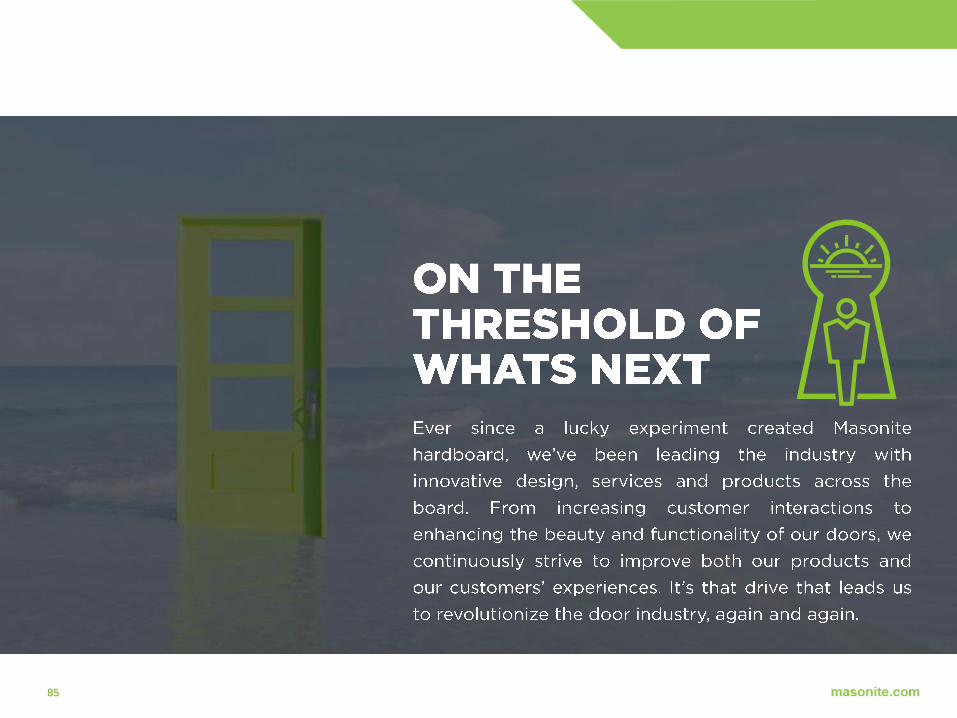
8585

86
NON-GAAP RECONCILIATIONS

8787
Reconciliation of Adj. EBITDA to net income
(loss) attributable to Masonite
(In thousands)
December 31,
2017
January 1,
2017
January 3,
2016
December 28,
2014
December 29,
2013
Adjusted EBITDA 255,568$ 252,513$ 204,197$ 137,087$ 105,877$
Less (plus):
Depreciation 57,528 57,604 59,160 60,622 62,080
Amortization 24,375 24,727 23,725 21,722 17,058
Share based compensation expense 11,644 18,790 13,236 9,605 7,752
Loss (gain) on disposal of property, plant and equipment 1,893 2,111 1,371 3,816 (1,775)
Registration and listing fees — — — — 2,421
Restructuring costs 850 1,445 5,678 11,137 10,630
Asset impairment — 1,511 9,439 18,202 1,904
Loss (gain) on disposal of subsidiaries 212 (6,575) 59,984 — —
Interest expense (income), net 30,153 28,178 32,884 41,525 33,230
Loss on extinguishment of debt (1,091) — 28,046 — —
Other expense (income), net — (1,959) (1,757) (587) 2,316
Income tax expense (benefit) (27,560) 21,787 14,172 4,533 (21,377)
Loss (income) from discontinued operations, net of tax 583 752 908 630 598
Net income (loss) attributable to non-controlling interest 5,242 5,520 4,462 3,222 2,050
Net income (loss) attributable to Masonite 151,739 98,622 (47,111) (37,340) (11,010)
Twelve months ended,
8888
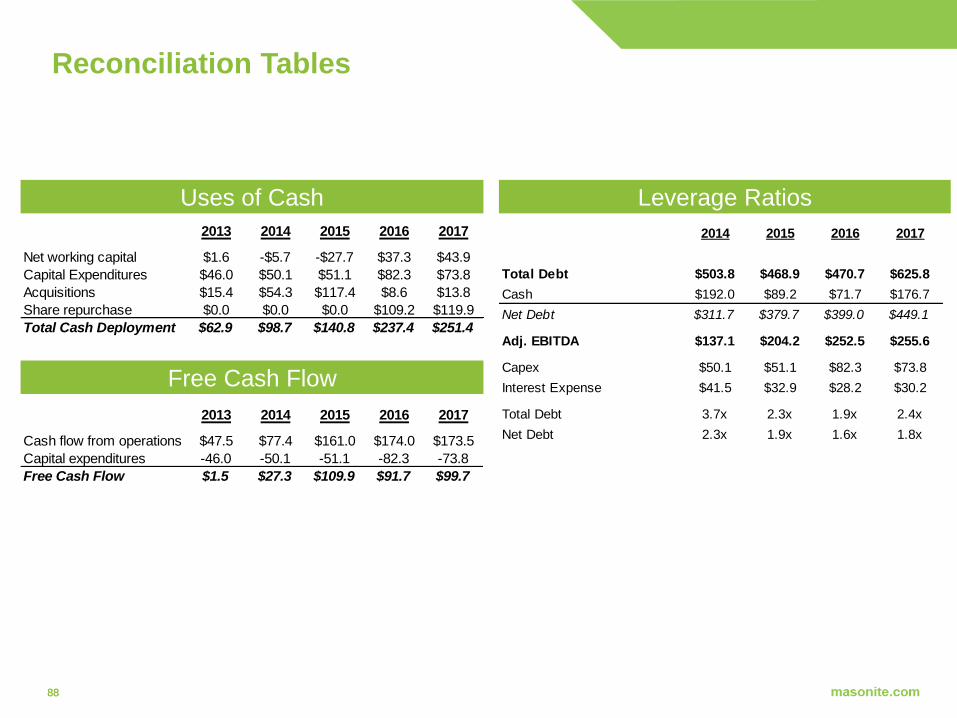
Reconciliation Tables
Uses of Cash Leverage Ratios
2014 2015 2016 2017
Total Debt $503.8 $468.9 $470.7 $625.8
Cash $192.0 $89.2 $71.7 $176.7
Net Debt $311.7 $379.7 $399.0 $449.1
Adj. EBITDA $137.1 $204.2 $252.5 $255.6
Capex $50.1 $51.1 $82.3 $73.8
Interest Expense $41.5 $32.9 $28.2 $30.2
Total Debt 3.7x 2.3x 1.9x 2.4x
Net Debt 2.3x 1.9x 1.6x 1.8x
2013 2014 2015 2016 2017
Net working capital $1.6 -$5.7 -$27.7 $37.3 $43.9
Capital Expenditures $46.0 $50.1 $51.1 $82.3 $73.8
Acquisitions $15.4 $54.3 $117.4 $8.6 $13.8
Share repurchase $0.0 $0.0 $0.0 $109.2 $119.9
Total Cash Deployment $62.9 $98.7 $140.8 $237.4 $251.4
Free Cash Flow
2013 2014 2015 2016 2017
Cash flow from operations $47.5 $77.4 $161.0 $174.0 $173.5
Capital expenditures -46.0 -50.1 -51.1 -82.3 -73.8
Free Cash Flow $1.5 $27.3 $109.9 $91.7 $99.7

8989
Reconciliation Tables
2013 2014 2015 2016 2017
Adj. EBITDA $105.9 $137.1 $204.2 $252.5 255.6
Less: D&A $79.1 $82.3 $82.9 $82.3 81.9
EBIT $26.8 $54.8 $121.3 $170.2 $173.7
Tax Rate 29.0% 29.0% 29.0% 29.0% 29.0%
Taxes $7.8 $15.9 $35.2 $49.4 $50.4
NOPAT $19.0 $38.9 $86.1 $120.8 $123.3
Debt $377.9 $511.9 $468.9 $470.7 $625.7
Equity $825.6 $735.5 $655.6 $659.8 $736.4
Inv. Capital 1,203.4 1,247.4 1,124.4 1,130.5 1,362.1
Total Assets 1,566.3 1,616.1 1,499.1 1,475.9 1,680.3
ROIC 1.6% 3.2% 7.3% 10.7% 9.9%
ROA 1.2% 2.4% 5.5% 8.1% 7.8%