2018 himss u.s. leadership and workforce survey. hospitals more likely to modify it projects due to...
TRANSCRIPT

2018HIMSS U.S. Leadership and Workforce Survey
www.himss.org
1 | P a g e
2018 HIMSS U.S. Leadership and Workforce Survey
Table of Contents 1. Executive Summary .......................................................................................................................... 2
2. Methodology/Respondent Demographics ............................................................................... 3
Leadership Status ................................................................................................ 4
3. Key Observations and Implications ............................................................................................ 6
LEADERSHIP SURVEY ........................................................................................................................... 6
Information and Technology Priorities ............................................................... 6
Information and Technology Leadership ........................................................... 12
Information and Technology Projected Demand .............................................. 14
WORKFORCE SURVEY ......................................................................................................................... 15
Health IT Workforce Size ................................................................................... 15
Impact of Health IT Workforce Challenges and Use of External Resources .... 16
4. Conclusion .......................................................................................................................................... 17
5. About HIMSS ..................................................................................................................................... 18
6. How to Cite This Study .................................................................................................................. 18
7. For More Information .................................................................................................................... 18
APPENDIX A – 2017-2018 Priority Crosswalk ........................................................................... 19
APPENDIX B – Provider Survey ....................................................................................................... 20
APPENDIX C – Vendor/Consultant Survey ................................................................................. 25
APPENDIX D – Organization Type/Focus .................................................................................... 29
2 | P a g e
1. Executive Summary
The 2018 HIMSS U.S. Leadership and Workforce Survey reflects the perspectives of U.S. health
information and technology leaders on a myriad of topics influencing the healthcare sector. The present
report provides a robust profile of U.S. health information and technology priorities, especially as it relates to
hospitals, as well as their linkage to various hospital strategic initiatives (e.g. employment of select information
and technology leaders) and industry economic measures (e.g. workforce projections).
Based on the feedback from 369 U.S. health information and technology leaders (224 from a healthcare
Provider organization; 145 from a health IT Vendor/Consulting organization), the findings yield these
notable themes:
1. There is a high level of consistency between leaders’ reporting of top information and technology
priorities from 2017 to 2018.
2. However, the information and technology priorities of leaders in different health settings vary
notably.
3. Hospitals employ an array of information and technology executives and their influence appears to
be growing.
4. Vendors/Consultants and Providers are at odds regarding the projected demand for information and
technology resources this coming year.
5. Employment prospects for health IT professionals are more favorable in Vendor/Consulting
organizations than in hospitals.
6. Hospitals more likely to modify IT projects due to health IT staffing/workforce challenges than
Vendors/Consultants.

3 | P a g e
2. Methodology/Respondent Demographics
Respondents provide insights into the information and technology
experiences of various care delivery settings with study findings strongest in
relation to hospital-based organizations.
Findings from the 2018 HIMSS U.S. Leadership and Workforce Survey reflect the feedback from 369
qualified1 U.S. health information and technology leaders participating in a web survey commissioned by
HIMSS, between late November 2017 and mid-February 2018.
This year’s survey is similar to the 2017 HIMSS Leadership and Workforce Survey in design and distribution
with the following modifications:
1. References to “information technology” were changed to “information and technology”
This change more accurately reflects the array of issues health leaders currently address.
2. The information and technology priorities considered changed to reflect the list of HIMSS18
education topics
While the list of priorities presented survey respondents continues to reflect the education
topics presented at the annual HIMSS Global Conference & Exhibition, the 2018 list of
topics is not an exact replica of the 2017 list. The 2018 list of education topics expanded in
comparison to the 2017 topics (see Appendix A for a crosswalk between the two lists).
3. The number of workforce related questions were reduced
Given the length of the long form workforce questionnaire, HIMSS alternates between the
expanded survey instrument and the abbreviated questionnaire used this year, biennially.
Individuals responding to the survey invite completed one of two parallel survey instruments based on the
type of healthcare organization most closely reflecting their current employer; a Provider survey (Appendix
B) for those employed by a healthcare provider organization or a Health IT Vendor/Consultant survey
(Appendix C). Respondents not meeting the criteria of these two classifications were excluded from the
study.
Organization Type/Focus
In order to allow for a comparison of provider types, Provider survey responses partitioned into one of the
following three general care sites (see Appendix D to see how individual care sites group together):
1. Hospitals and hospital-associated entities (e.g. health system corporate office)
2. Ambulatory organizations (e.g. physician office; freestanding outpatient clinics)
3. LTPAC (Long Term / Post-Acute Care) (e.g. nursing homes)
Over half (61 percent; N = 224) of the 369 respondents included in this year’s study answered the Provider
questionnaire (Graphic 1). With 81 percent of Provider survey respondents representing a hospital-based care
setting, the insights from those representing a hospital setting is quite strong. Given the dominance of
1 To participate in the survey Provider respondents had to have some level of IT oversight at their organization. Respondents were qualified by asking the extent to which they had “oversight of IT” at their healthcare organization. Of the 266 individuals representing a provider organization responding to the survey invite, 42 indicated they had “no oversight/influence at all” and excluded from the analysis.
4 | P a g e
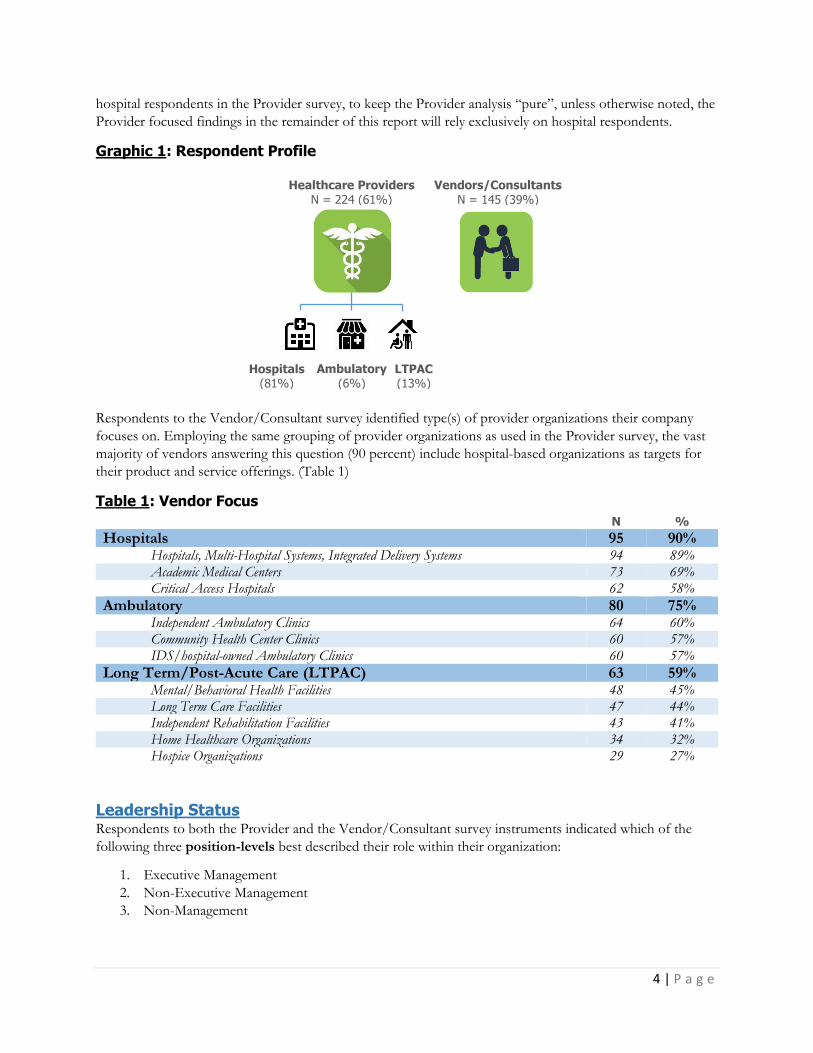
hospital respondents in the Provider survey, to keep the Provider analysis “pure”, unless otherwise noted, the
Provider focused findings in the remainder of this report will rely exclusively on hospital respondents.
Graphic 1: Respondent Profile
Respondents to the Vendor/Consultant survey identified type(s) of provider organizations their company
focuses on. Employing the same grouping of provider organizations as used in the Provider survey, the vast
majority of vendors answering this question (90 percent) include hospital-based organizations as targets for
their product and service offerings. (Table 1)
Table 1: Vendor Focus
N %
Hospitals 95 90% Hospitals, Multi-Hospital Systems, Integrated Delivery Systems 94 89% Academic Medical Centers 73 69% Critical Access Hospitals 62 58%
Ambulatory 80 75% Independent Ambulatory Clinics 64 60% Community Health Center Clinics 60 57% IDS/hospital-owned Ambulatory Clinics 60 57%
Long Term/Post-Acute Care (LTPAC) 63 59% Mental/Behavioral Health Facilities 48 45% Long Term Care Facilities 47 44% Independent Rehabilitation Facilities 43 41% Home Healthcare Organizations 34 32% Hospice Organizations 29 27%
Leadership Status Respondents to both the Provider and the Vendor/Consultant survey instruments indicated which of the
following three position-levels best described their role within their organization:
1. Executive Management
2. Non-Executive Management
3. Non-Management
Vendors/Consultants
N = 145 (39%) Healthcare Providers
N = 224 (61%)
Hospitals
(81%) Ambulatory
(6%) LTPAC
(13%)

5 | P a g e
With almost two-thirds (65 percent) of all respondents reported to be in a management role, and over 36
percent associating themselves with an “Executive Management” position, respondents generally represent the
information and technology leaders within their respective healthcare organizations. (Table 2) Interestingly, a
much higher percentage of hospital respondents reflected a managerial role (90 percent) than those employed
by a Vendor/Consultant organization (51 percent). It is unclear as to why there is a difference in managerial
representation between these two groups. Likewise, we are uncertain why 27 percent of Vendor/Consultant
respondents failed to identify with one of the three presented leadership status roles. It is possible that the
roles presented to Vendors/Consultants are not as mutually exclusive as originally thought and therefore
warrants reconsideration in next year’s survey.
Table 2: Leadership Status
Leadership Status All Respondents Vendor Hospital
Executive Management 36% 28% 50%
Non-Executive Management 29% 23% 40%
Non-Management 23% 21% 10%
No Answer 12% 27% -

6 | P a g e
3. Key Observations and Implications
LEADERSHIP SURVEY
Information and Technology Priorities Presented with a list of information and technology priorities, Provider and Vendor/Consultant respondents
were asked to indicate the extent to which each issue would be a priority in the coming year using a seven-
point scale (1 = “not a priority”; 7 = “essential priority”). Of significance were the following features:
1. The 24 issues presented to the respondents mirror the education tracks offered at the HIMSS18
Global Conference & Exhibition
2. Provider and Vendor/Consultant respondents were presented slightly different questions
Providers were asked to identify the information and technology issues of greatest priority
for their organization in the year ahead
Vendor/Consultant respondents were asked to identify the information and technology
issues of greatest priority for their clients in the year ahead
This approach yielded a number of significant observations and resulting implications.
Observation: Vendors/Consultants and Hospitals continue to be generally
aligned on information and technology priorities.
Implication: Efforts to address a broad array of information and technology
issues should enjoy synergies from a broad spectrum of
industry stakeholders.
Vendors/Consultants and Hospitals evaluate many information and technology priorities with the
same degree of intensity
When comparing the mean scores for each information and technology priority as assigned by the
Vendor/Consultant respondents with the mean scores on the same issues as assessed by Hospital
respondents, there is a remarkable consistency. As reflected in Table 3, using a 1 to 7 scale (1 = “not a priority”;
7 = “essential priority”), the two respondent pools are within 0.50 points of one another on 19 of the 24
priorities considered in the survey.

7 | P a g e
Table 3: Vendor/Consultants & Hospitals – Mean Scores (2018)
Based on a 1 to 7 scale where 1 = “not a priority”; 7 = “essential priority”; ordered by the absolute difference in mean scores
Information and Technology Priority
Vendors/
Consultants Hospitals
Mean
Difference
Population Health 4.83 4.85 0.02
Electronic Health Records (EHRs) 5.52 5.46 0.06
Health Informatics Education, Career Development & Diversity 4.20 4.13 0.06
Innovation, Entrepreneurship and Venture Investment 4.25 4.19 0.07
Connected Health & Telehealth 4.78 4.86 0.08
Clinical Informatics and Clinician Engagement 5.42 5.50 0.08
Improving Quality Outcomes Through Health IT 5.57 5.48 0.09
Precision Medicine/Genomics 3.89 3.76 0.13
Data Analytics/Clinical and Business Intelligence 5.63 5.50 0.13
Human Factors, User Experience and Design 4.78 4.63 0.15
Public Policy 4.13 3.94 0.19
Compliance, Risk Management & Program Integrity 5.27 5.47 0.19
Consumer and Patient Engagement 5.08 5.35 0.27
Privacy, Security and Cybersecurity 5.57 5.90 0.33
Emerging Payment Models for Value Based Care 5.06 4.72 0.34
Social, Psychosocial & Behavioral Determinants of Health 3.98 4.34 0.36
Culture of Care and Care Coordination 4.92 5.34 0.43
Pharmacy Standards & Technology 4.32 4.76 0.44
Process Improvement, Workflow, Change Management 5.21 5.70 0.49
Leadership, Governance, Strategic Planning 4.60 5.10 0.50
HIT Infrastructure and Standards 5.02 4.48 0.54
Supply Chain 3.56 4.16 0.61
Health Information Exchange, Interoperability and Data Integration 5.60 4.85 0.75
Patient Safety 5.30 6.07 0.77
Vendors/Consultants and Hospitals differ remarkably on select information and technology
priorities
While there is a great deal of alignment between the two survey groups, there was a statistically significant
difference between the two audiences on three issues. Hospital respondents consider “Patient Safety” and
“Supply Chain” to be higher priority issues while Vendors/Consultants see “Health Information Exchange,
Interoperability and Data Integration” to be higher concerns for their clients (primarily hospitals) than what the
hospital respondents considered. (Table 4)
Table 4: Notable Vendor/Consultant vs Hospital Priority Mean Differences (2018)
Issue
Vendors/
Consultants Hospital Difference
Patient Safety 5.30 6.07 0.77
Health Information Exchange, Interoperability and Data Integration 5.60 4.85 0.75
Supply Chain 3.56 4.16 0.61

8 | P a g e
Vendors/Consultants and Hospitals differ on the rank order of the top information and technology
priorities
When rank ordering the mean score of all 24 priorities, Vendors/Consultants and Hospital respondents share
only two top five priorities; “Data Analytics/Clinical and Business Intelligence” and “Privacy, Security and
Cybersecurity”. (Table 5) Interestingly, the assessment of “Patient Safety” by Hospital respondents is not only
their top issue but one in which Vendors/Consultants truly assess (statistically) differently. This finding
suggests Vendors/Consultants and their Hospital clients/prospects may be “talking past” each other on this
issue and as such, presents as an opportunity for Vendors/Consultants to re-evaluate their assessment of this
issue.
Table 5: Rank Order of Priorities (2018)
Ordered by the descending priority of hospital respondents
Information and Technology Priority
Vendors/
Consultants Hospitals
Rank
Difference
Patient Safety 7 1 6
Privacy, Security and Cybersecurity 4 2 2
Process Improvement, Workflow, Change Management 9 3 6
Data Analytics/Clinical and Business Intelligence 1 4 3
Clinical Informatics and Clinician Engagement 6 5 1
Improving Quality Outcomes Through Health IT 3 6 3
Compliance, Risk Management & Program Integrity 8 7 1
Electronic Health Records (EHRs) 5 8 3
Consumer and Patient Engagement 10 9 1
Culture of Care and Care Coordination 13 10 3
Leadership, Governance, Strategic Planning 17 11 6
Connected Health & Telehealth 15 12 3
Health Information Exchange, Interoperability and Data Integration 2 13 11
Population Health 14 14 0
Pharmacy Standards & Technology 18 15 3
Emerging Payment Models for Value Based Care 11 16 5
Human Factors, User Experience and Design 16 17 1
HIT Infrastructure and Standards 12 18 6
Social, Psychosocial & Behavioral Determinants of Health 22 19 3
Innovation, Entrepreneurship and Venture Investment 19 20 1
Supply Chain 24 21 3
Health Informatics Education, Career Development & Diversity 20 22 2
Public Policy 21 23 2
Precision Medicine/Genomics 23 24 1
9 | P a g e
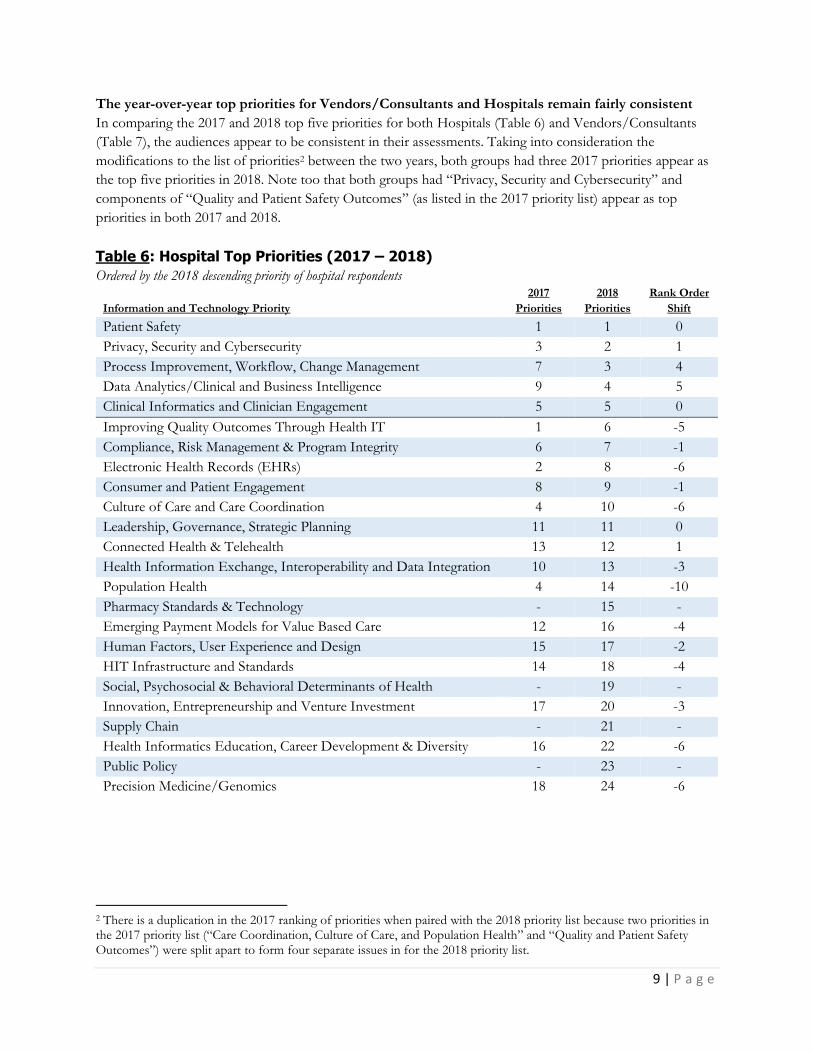
The year-over-year top priorities for Vendors/Consultants and Hospitals remain fairly consistent
In comparing the 2017 and 2018 top five priorities for both Hospitals (Table 6) and Vendors/Consultants
(Table 7), the audiences appear to be consistent in their assessments. Taking into consideration the
modifications to the list of priorities2 between the two years, both groups had three 2017 priorities appear as
the top five priorities in 2018. Note too that both groups had “Privacy, Security and Cybersecurity” and
components of “Quality and Patient Safety Outcomes” (as listed in the 2017 priority list) appear as top
priorities in both 2017 and 2018.
Table 6: Hospital Top Priorities (2017 – 2018)
Ordered by the 2018 descending priority of hospital respondents
Information and Technology Priority
2017
Priorities
2018
Priorities
Rank Order
Shift
Patient Safety 1 1 0
Privacy, Security and Cybersecurity 3 2 1
Process Improvement, Workflow, Change Management 7 3 4
Data Analytics/Clinical and Business Intelligence 9 4 5
Clinical Informatics and Clinician Engagement 5 5 0
Improving Quality Outcomes Through Health IT 1 6 -5
Compliance, Risk Management & Program Integrity 6 7 -1
Electronic Health Records (EHRs) 2 8 -6
Consumer and Patient Engagement 8 9 -1
Culture of Care and Care Coordination 4 10 -6
Leadership, Governance, Strategic Planning 11 11 0
Connected Health & Telehealth 13 12 1
Health Information Exchange, Interoperability and Data Integration 10 13 -3
Population Health 4 14 -10
Pharmacy Standards & Technology - 15 -
Emerging Payment Models for Value Based Care 12 16 -4
Human Factors, User Experience and Design 15 17 -2
HIT Infrastructure and Standards 14 18 -4
Social, Psychosocial & Behavioral Determinants of Health - 19 -
Innovation, Entrepreneurship and Venture Investment 17 20 -3
Supply Chain - 21 -
Health Informatics Education, Career Development & Diversity 16 22 -6
Public Policy - 23 -
Precision Medicine/Genomics 18 24 -6
2 There is a duplication in the 2017 ranking of priorities when paired with the 2018 priority list because two priorities in the 2017 priority list (“Care Coordination, Culture of Care, and Population Health” and “Quality and Patient Safety Outcomes”) were split apart to form four separate issues in for the 2018 priority list.
10 | P a g e
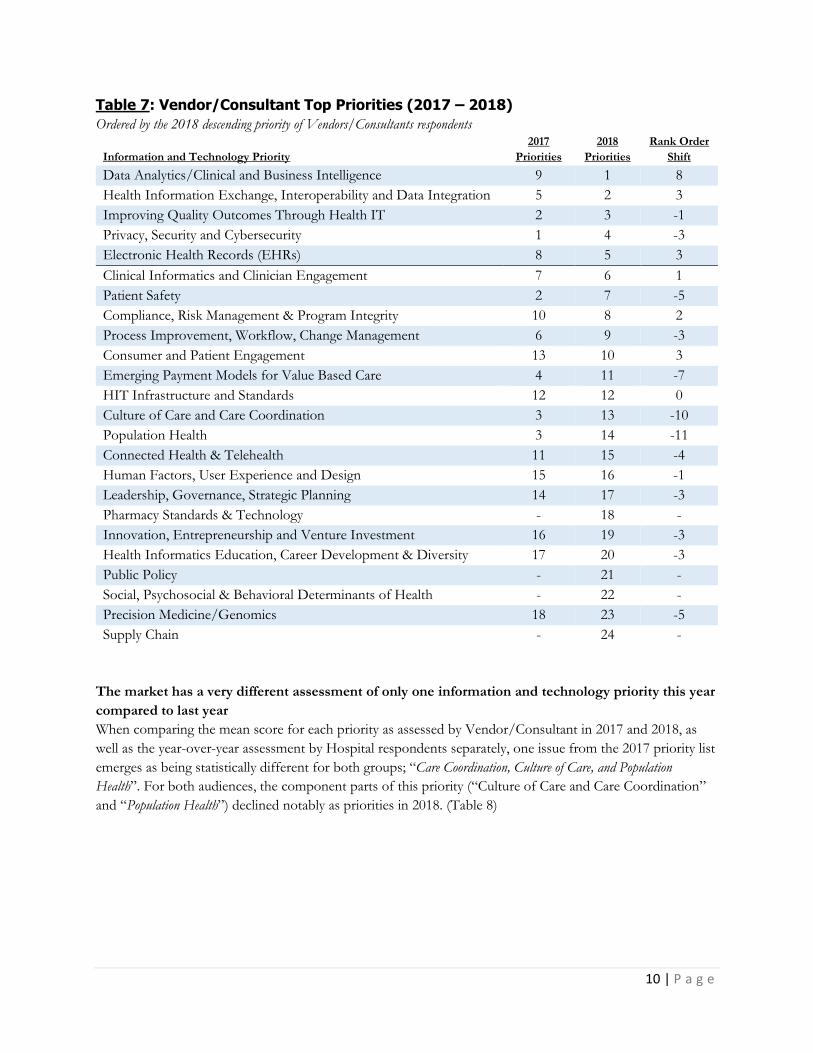
Table 7: Vendor/Consultant Top Priorities (2017 – 2018)
Ordered by the 2018 descending priority of Vendors/Consultants respondents
Information and Technology Priority
2017
Priorities
2018
Priorities
Rank Order
Shift
Data Analytics/Clinical and Business Intelligence 9 1 8
Health Information Exchange, Interoperability and Data Integration 5 2 3
Improving Quality Outcomes Through Health IT 2 3 -1
Privacy, Security and Cybersecurity 1 4 -3
Electronic Health Records (EHRs) 8 5 3
Clinical Informatics and Clinician Engagement 7 6 1
Patient Safety 2 7 -5
Compliance, Risk Management & Program Integrity 10 8 2
Process Improvement, Workflow, Change Management 6 9 -3
Consumer and Patient Engagement 13 10 3
Emerging Payment Models for Value Based Care 4 11 -7
HIT Infrastructure and Standards 12 12 0
Culture of Care and Care Coordination 3 13 -10
Population Health 3 14 -11
Connected Health & Telehealth 11 15 -4
Human Factors, User Experience and Design 15 16 -1
Leadership, Governance, Strategic Planning 14 17 -3
Pharmacy Standards & Technology - 18 -
Innovation, Entrepreneurship and Venture Investment 16 19 -3
Health Informatics Education, Career Development & Diversity 17 20 -3
Public Policy - 21 -
Social, Psychosocial & Behavioral Determinants of Health - 22 -
Precision Medicine/Genomics 18 23 -5
Supply Chain - 24 -
The market has a very different assessment of only one information and technology priority this year
compared to last year
When comparing the mean score for each priority as assessed by Vendor/Consultant in 2017 and 2018, as
well as the year-over-year assessment by Hospital respondents separately, one issue from the 2017 priority list
emerges as being statistically different for both groups; “Care Coordination, Culture of Care, and Population
Health”. For both audiences, the component parts of this priority (“Culture of Care and Care Coordination”
and “Population Health”) declined notably as priorities in 2018. (Table 8)

11 | P a g e
Table 8: Notable Downward Shift in Priorities (2017 – 2018)
Information and Technology Priority
2017
Priorities
2018
Priorities
Rank Order
Shift
Culture of Care and Care Coordination (Hospitals) 4 10 -6
Population Health (Hospitals) 4 14 -10
Culture of Care and Care Coordination (Vendors/Consultants) 3 13 -10
Population Health (Vendors/Consultants) 3 14 -11
We strongly urge readers to exercise caution in the interpretation of this finding as the labeling of the issue in
2017 differs from its presentation in 2018. That said, it is possible the market considers “Care Coordination,
Culture of Care, and Population Health” intrinsically linked so that any effort to separate into distinctive
issues may have diluted the significance of these activities, and resulted in a diminish assessment of these
issues.
It is also very possible the market has come to understand that “Culture of Care”, “Care Coordination” and
“Population Health” cannot be achieved until certain supportive activities (e.g. data analytics) are in place.
Accordingly, the prioritization of “Population Health” and “Culture of Care and Care Coordination”
activities may have been usurped by the market’s increased focus on data analytics as a means to achieve these
desired activities. Indeed, the downward shift in the prioritization of “Culture of Care and Care
Coordination” and “Population Health” is accompanied by an increased intensity on “Data Analytics/Clinical
and Business Intelligence” as priorities. (Table 9)
Table 9: Notable Upward Shift in Priorities (2017 – 2018)
Information and Technology Priority
2017
Priorities
2018
Priorities
Rank Order
Shift
Data Analytics/Clinical and Business Intelligence (Hospitals) 9 4 5
Data Analytics/Clinical and Business Intelligence
(Vendors/Consultants) 9 1 8

12 | P a g e
Information and Technology Leadership
Observation: Information and technology executives appear to have an
increased influence within hospital settings.
Implication: Vendors/Consultants need to be very purposeful in
establishing and managing their relationships with hospital
information and technology executives.
Hospitals employ an array of information and technology executives with whom vendors interact
When presented with a select list of hospital information and technology executive roles, provider
respondents identified those employed by their organization.3 Using a similar list, Vendors/Consultants
identified those Hospital executives with whom they most frequently interact. When comparing the two lists
together, Chief Information Officers understandably emerge as the executive most commonly employed by
hospitals (87 percent) and the executive with whom Vendors/Consultants most usually interact (50 percent).
Clinical Leaders emerged as the second most identified executive for both Providers (67 percent) and
Vendors/Consultants (49 percent). (Table 10)
Table 10: Information and Technology Hospital Leaders (Interact/Employ) Executive Vendor - Interact Hospital - Employ
Chief Information Officer 50% 87% A senior clinical IT leader (e.g. CMIO, CNIO, CHIO) 49% 67% A senior information security leader (e.g. CISO) 28% 42% Chief Technology Officer 39% 36% Chief Innovation Officer 21% 23% Chief Transformation Officer 16% 12%
Note that hospital respondents also identified a select list of executives employed by their hospital in the 2017
survey. Comparing the two lists together reveals that the percentage of Chief Information Officers has
increased notably. (Table 11)
Table 11: Information and Technology Hospital Leaders – Employ (2017 vs 2018) Executive 2017 2018
Chief Information Officer 78% 87% A senior clinical IT leader (e.g. CMIO, CNIO, CHIO) 65% 67% A senior information security leader (e.g. CISO) 41% 42%
3 Given the low number of respondents representing non-hospital settings, the following analysis was limited to those representing a hospital.
13 | P a g e
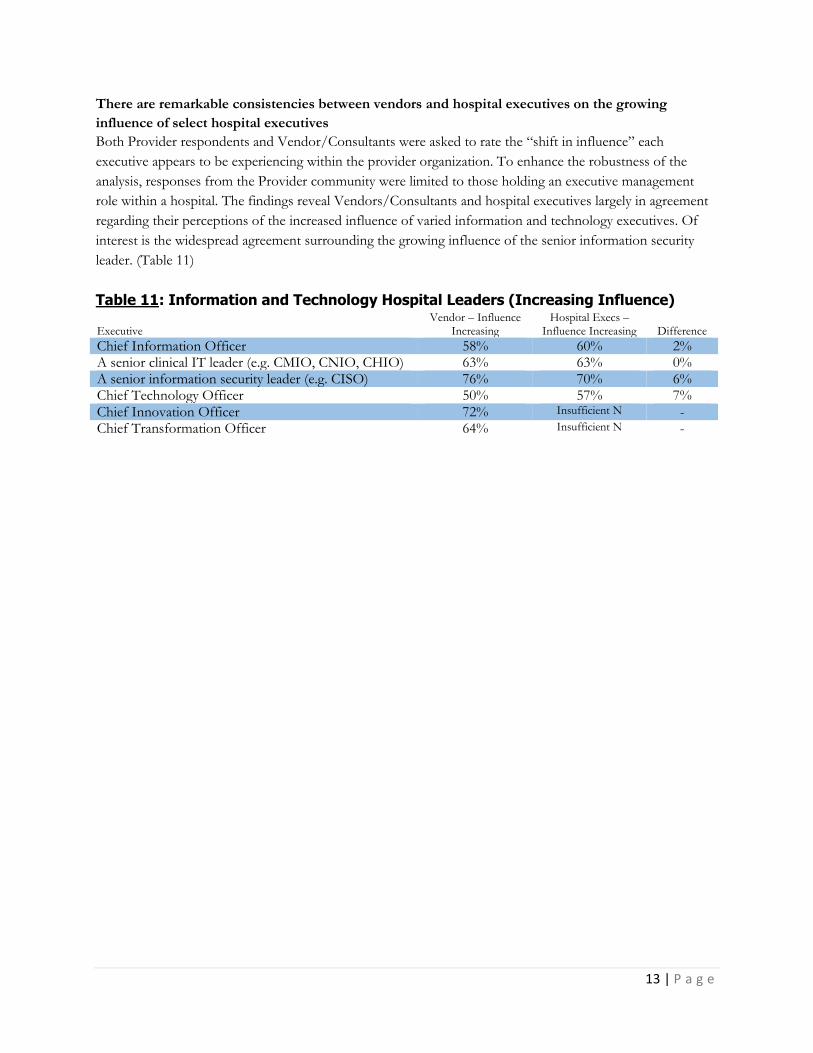
There are remarkable consistencies between vendors and hospital executives on the growing
influence of select hospital executives
Both Provider respondents and Vendor/Consultants were asked to rate the “shift in influence” each
executive appears to be experiencing within the provider organization. To enhance the robustness of the
analysis, responses from the Provider community were limited to those holding an executive management
role within a hospital. The findings reveal Vendors/Consultants and hospital executives largely in agreement
regarding their perceptions of the increased influence of varied information and technology executives. Of
interest is the widespread agreement surrounding the growing influence of the senior information security
leader. (Table 11)
Table 11: Information and Technology Hospital Leaders (Increasing Influence)
Executive Vendor – Influence
Increasing Hospital Execs –
Influence Increasing Difference
Chief Information Officer 58% 60% 2% A senior clinical IT leader (e.g. CMIO, CNIO, CHIO) 63% 63% 0% A senior information security leader (e.g. CISO) 76% 70% 6% Chief Technology Officer 50% 57% 7% Chief Innovation Officer 72% Insufficient N - Chief Transformation Officer 64% Insufficient N -
14 | P a g e
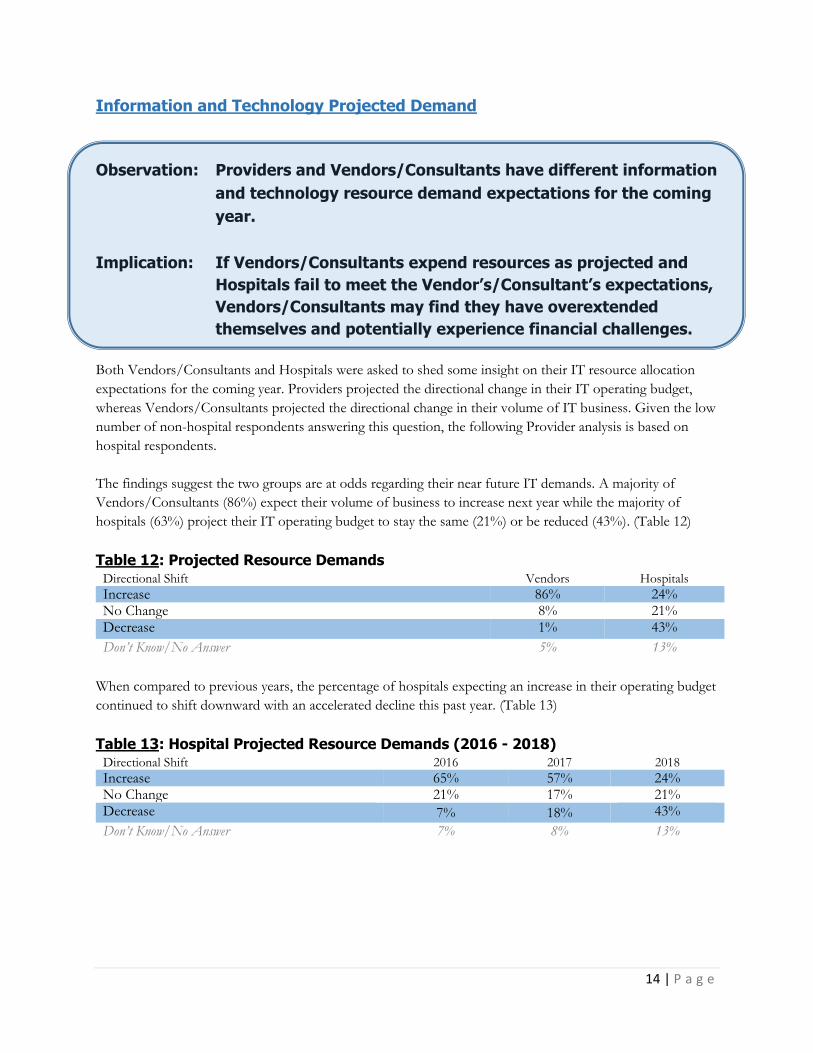
Information and Technology Projected Demand
Observation: Providers and Vendors/Consultants have different information
and technology resource demand expectations for the coming
year.
Implication: If Vendors/Consultants expend resources as projected and
Hospitals fail to meet the Vendor’s/Consultant’s expectations,
Vendors/Consultants may find they have overextended
themselves and potentially experience financial challenges.
Both Vendors/Consultants and Hospitals were asked to shed some insight on their IT resource allocation
expectations for the coming year. Providers projected the directional change in their IT operating budget,
whereas Vendors/Consultants projected the directional change in their volume of IT business. Given the low
number of non-hospital respondents answering this question, the following Provider analysis is based on
hospital respondents.
The findings suggest the two groups are at odds regarding their near future IT demands. A majority of
Vendors/Consultants (86%) expect their volume of business to increase next year while the majority of
hospitals (63%) project their IT operating budget to stay the same (21%) or be reduced (43%). (Table 12)
Table 12: Projected Resource Demands Directional Shift Vendors Hospitals
Increase 86% 24% No Change 8% 21% Decrease 1% 43%
Don’t Know/No Answer 5% 13%
When compared to previous years, the percentage of hospitals expecting an increase in their operating budget
continued to shift downward with an accelerated decline this past year. (Table 13)
Table 13: Hospital Projected Resource Demands (2016 - 2018) Directional Shift 2016 2017 2018
Increase 65% 57% 24% No Change 21% 17% 21% Decrease 7% 18% 43%
Don’t Know/No Answer 7% 8% 13%

15 | P a g e
WORKFORCE SURVEY
Health IT Workforce Size
Observation: The employment opportunities for health information and
technology workers are greater in Vendor/Consultant
organizations than hospitals.
Implication: Hospitals may be challenged to complete information and
technology projects as originally planned.
Similar to the 2017 study, all respondents were asked a series of questions surrounding their organization’s IT
workforce. In comparing the hospital respondents to the Vendor/Consultant respondents, the opportunities
for health information and technology workers are greatest in Vendor/Consultant organizations.
Vendor/Consultant organizations are more likely to be currently in need of health information and
technology workers, have grown the size of their workforce during the past year, and plan to grow the size of
their health information and technology staff next year.
Current Workforce Vacancy While the findings for the Vendor/Consultant respondents this year are similar to last year’s results, the
hospital results are notably different. Only 34 percent of hospitals have open positions to fill in 2018
compared to 61 percent of hospitals with open positions in the 2017 report. (Table 14).
Table 14: Current Workforce Vacancy
Workforce Status Vendors
2017 Vendors
2018 Hospitals
2017 Hospitals
2018
We are fully staffed 32% 24% 29% 56%
We have open positions to fill 61% 69% 61% 34%
Don’t Know/No Answer 7% 7% 10% 10%
Workforce Size – Change Past Year Though the majority of Vendor/Consultant respondents (67 percent) indicated their workforce increased in
size, hospital respondents were not as positive with the shift in the array of response options from 2017 to
2018 suggesting staffing activities may be leveling off. (Table 15)
Table 15: Workforce Size – Change Past Year
Workforce Size Past Year Vendors
2017 Vendors
2018 Hospitals
2017 Hospitals
2018
Increased 61% 67% 53% 37%
Stayed the same 17% 11% 17% 28%
Decreased 15% 15% 17% 22%
Don’t Know/No Answer 7% 7% 13% 13%

16 | P a g e
Workforce Size – Change Next Year Vendor/Consultant respondents (75 percent) were much more positive about their expected workforce
growth than the hospital respondents (40 percent). Comparing the results from 2017 to 2018 reveals a greater
percentage increase of Vendors/Consultants respondents projecting their workforce to expand (9 percentage
point increase from 66 percent to 75 percent) than the percentage increase in hospitals respondents (4
percentage point increase from 36 percent to 40 percent). (Table 16)
Table 16: Workforce Size – Change Next Year
Workforce Size Next Year Vendors
2017 Vendors
2018 Hospitals
2017 Hospitals
2018
Increase 66% 75% 36% 40%
Stayed the same 16% 8% 32% 30%
Decrease 4% 3% 16% 16%
Don’t Know/No Answer 14% 14% 16% 14%
Impact of Health IT Workforce Challenges and Use of External Resources
Both Vendors/Consultants and Provider respondents were asked if their organization had been negatively
impacted by a workforce challenge during the past year. Over one-third of Vendors/Consultant (38 percent)
and over half of hospital respondents (51 percent) claimed their organization elected to place on hold or scale
back an IT project or initiative in the past year due to a workforce challenge. (Table 17) The pervasiveness of
the staffing impact in the hospital market appears to be the same (possibly expanding) compared to the
previous year, whereas the impact appears to be lessening in Vendor/Consultant organizations.
Table 17: Workforce Challenges – Impact
IT Project Impact Vendors
2017 Vendors
2018 Hospitals
2017 Hospitals
2018
Negatively Impacted - Yes 37% 33% 47% 51%
Place on Hold 26% 33% 44% 47%
Scaled back 30% 28% 40% 41%
One of the solutions to assist employers in overcoming workforce recruitment challenges is to leverage the
services of an executive search firm. Interestingly, Vendors/Consultants and hospital respondents were fairly
undifferentiated in their use of a search firm (Table 18) despite the fact that information and technology
projects are more likely to be negatively impacted in a hospital than in a Vendor/Consultant organization.
Table 18: Workforce Solution – Use of a Search Agency
Used a Search Agency Vendors
2017 Vendors
2018 Hospitals
2017 Hospitals
2018
Yes 39% 33% 38% 29%
17 | P a g e
4. Conclusion
Findings from the 2018 HIMSS U.S. Leadership and Workforce Survey provide a valuable insight into the
information and technology concerns of U.S. health leaders, especially those involved in the hospital
marketplace. The information reveals Vendors/Consultants and Hospitals continue to be generally aligned on
the prioritization of hospital information and technology issues, suggesting efforts to address information and
technology issues should enjoy synergies from a broad spectrum of industry stakeholders. That said, there
were a few notable year-over-year prioritization shifts (e.g. “Population Health”, “Culture of Care and Care
Coordination” and “Data Analytics/Clinical and Business Intelligence”) observed warranting further
exploration. As such, the market is too complex for health leaders to employ a “one-size fits all” approach.
The evidence in this report also suggests hospitals employ a wide array of information and technology leaders,
and that the influence of these individuals appears to be expanding. Vendors/Consultants looking to extend
their influence within hospital settings are therefore encouraged to be very purposeful in establishing and
managing their relationships with an array of hospital information and technology executives.
Perhaps one of the more notable findings surrounds the divergent trajectory Vendors/Consultants have
compared to Hospital respondents with respect to projected information and technology resource demands.
Vendors/Consultants present as more positive about the near future than those Providers representing a
hospital. Part of the muted outlook for hospital representatives may be due to past challenges in completing
information and technology projects as originally planned. Given the variance in future projections, leaders
from Vendor/Consultant organizations are encouraged to challenge their assumptions about the market’s
willingness to acquire needed information and technology solutions so that they do not overextend their
organizations and experience financial challenges.

18 | P a g e
5. About HIMSS HIMSS is a global voice, advisor, and thought leader of health transformation through health information and
technology with a unique breadth and depth of expertise and capabilities to improve the quality, safety, and
efficiency of health, healthcare, and care outcomes. HIMSS designs and leverages key data assets, predictive
models and tools to advise global leaders, stakeholders, and influencers of best practices in health information
and technology, so they have the right information at the point of decision.
HIMSS drives innovative, forward thinking around best uses of information and technology in support of
better connected care, improved population health, and low cost of care. HIMSS is a not-for-profit,
headquartered in Chicago, Illinois, with additional offices in North America, Europe, United Kingdom, and
Asia.
6. How to Cite This Study Individuals are encouraged to cite this report and any accompanying graphics in printed matter, publications,
or any other medium, with attribution to the 2018 U.S. HIMSS Leadership and Workforce Survey.
7. For More Information Joyce Lofstrom
Senior Director, Corporate Communications
HIMSS
33 W. Monroe, Suite 1700
Chicago, IL 60603
312-915-9237

19 | P a g e
APPENDIX A – 2017-2018 Priority Crosswalk
2017 Priorities 2018 Priorities
Business of Healthcare and New Payment Models Emerging Payment Models for Value Based Care Care Coordination, Culture of Care, and Population Health
Culture of Care and Care Coordination
Care Coordination, Culture of Care, and Population Health
Population Health
Career/Workforce Development and Diversity Health Informatics Education, Career Development & Diversity
Clinical and Business Intelligence Data Analytics/Clinical and Business Intelligence Clinical Informatics and Clinician Engagement Clinical Informatics and Clinician Engagement Compliance, Risk Management and Program Integrity
Compliance, Risk Management and Program Integrity
Connected Health Connected Health & Telehealth Consumer and Patient Engagement Consumer and Patient Engagement Electronic Health Records (EHRs) Electronic Health Records (EHRs) Genomics/Precision Medicine Precision Medicine/Genomics Health Information Exchange, Interoperability and Data Access
Health Information Exchange, Interoperability and Data Integration
Human Factors, User Experience and Design Human Factors, User Experience and Design Innovation, Entrepreneurship and Venture Investment
Innovation, Entrepreneurship and Venture Investment
IT Infrastructure, HIT Standards and Medical Device Integration
HIT Infrastructure and Standards
Leadership, Governance, Strategic Planning Leadership, Governance, Strategic Planning Privacy, Security and Cybersecurity Privacy, Security and Cybersecurity Process Improvement, Workflow, Change Management
Process Improvement, Workflow, Change Management
Quality and Patient Safety Outcomes Patient Safety Quality and Patient Safety Outcomes Improving Quality Outcomes Through Health IT
Pharmacy Standards & Technology Social, Psychosocial & Behavioral Determinants of Health Public Policy Supply Chain
20 | P a g e
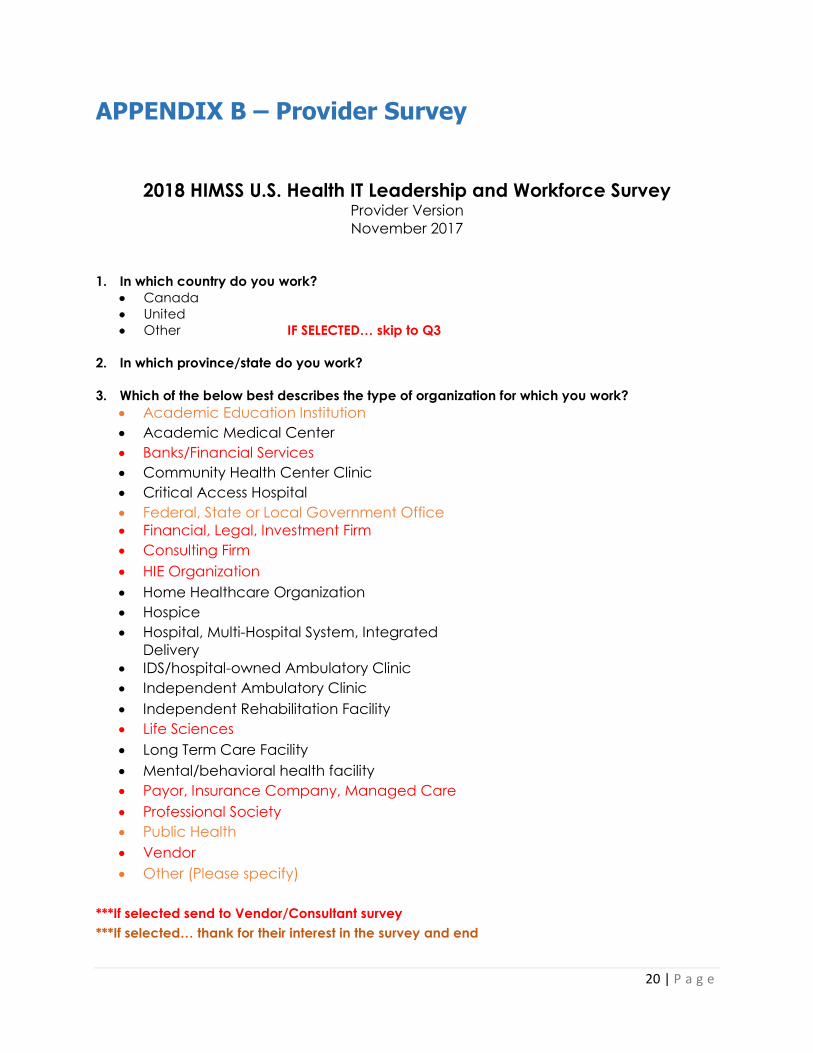
APPENDIX B – Provider Survey
2018 HIMSS U.S. Health IT Leadership and Workforce Survey Provider Version
November 2017
1. In which country do you work?
Canada
United
Other IF SELECTED… skip to Q3
2. In which province/state do you work?
3. Which of the below best describes the type of organization for which you work?
Academic Education Institution
Academic Medical Center
Banks/Financial Services
Community Health Center Clinic
Critical Access Hospital
Federal, State or Local Government Office
Financial, Legal, Investment Firm
Consulting Firm
HIE Organization
Home Healthcare Organization
Hospice
Hospital, Multi-Hospital System, Integrated
Delivery
IDS/hospital-owned Ambulatory Clinic
Independent Ambulatory Clinic
Independent Rehabilitation Facility
Life Sciences
Long Term Care Facility
Mental/behavioral health facility
Payor, Insurance Company, Managed Care
Professional Society
Public Health
Vendor
Other (Please specify)
***If selected send to Vendor/Consultant survey
***If selected… thank for their interest in the survey and end
21 | P a g e
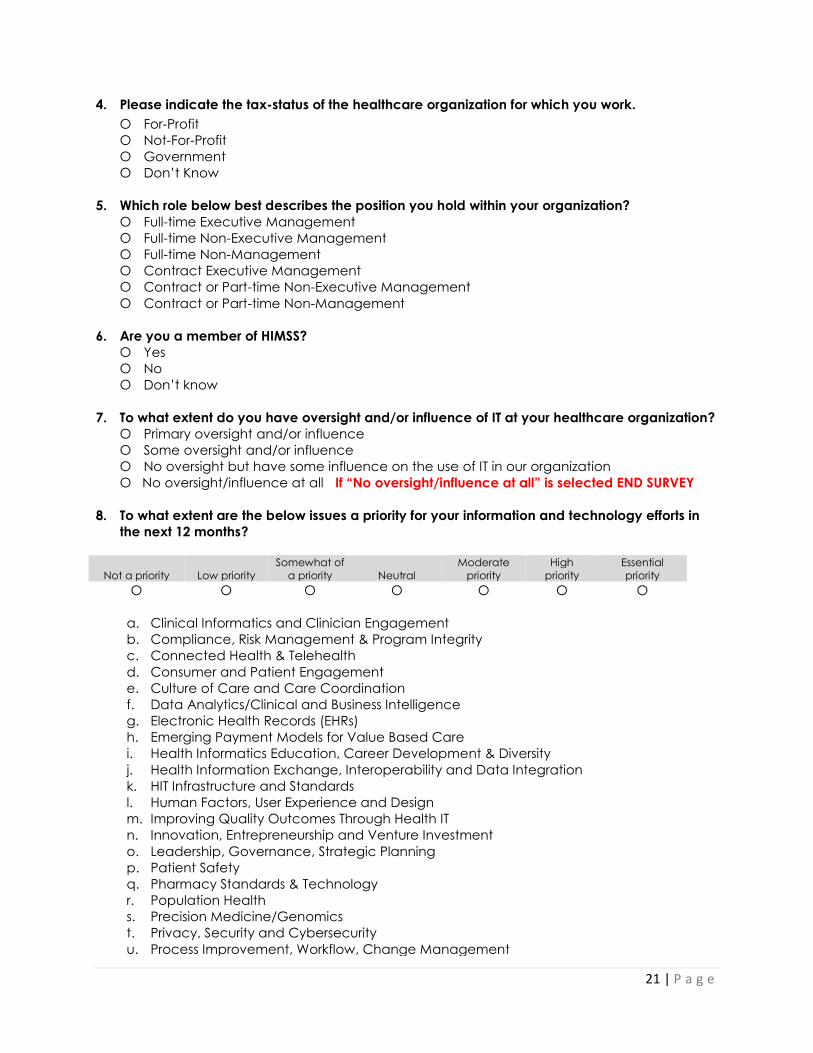
4. Please indicate the tax-status of the healthcare organization for which you work.
О For-Profit
О Not-For-Profit
О Government
О Don’t Know
5. Which role below best describes the position you hold within your organization?
О Full-time Executive Management
О Full-time Non-Executive Management
О Full-time Non-Management
О Contract Executive Management
О Contract or Part-time Non-Executive Management
О Contract or Part-time Non-Management
6. Are you a member of HIMSS?
О Yes
О No
О Don’t know
7. To what extent do you have oversight and/or influence of IT at your healthcare organization?
О Primary oversight and/or influence
О Some oversight and/or influence
О No oversight but have some influence on the use of IT in our organization
О No oversight/influence at all If “No oversight/influence at all” is selected END SURVEY
8. To what extent are the below issues a priority for your information and technology efforts in
the next 12 months?
Not a priority Low priority
Somewhat of
a priority Neutral
Moderate
priority
High
priority
Essential
priority
О О О О О О О
a. Clinical Informatics and Clinician Engagement
b. Compliance, Risk Management & Program Integrity
c. Connected Health & Telehealth
d. Consumer and Patient Engagement
e. Culture of Care and Care Coordination
f. Data Analytics/Clinical and Business Intelligence
g. Electronic Health Records (EHRs)
h. Emerging Payment Models for Value Based Care
i. Health Informatics Education, Career Development & Diversity
j. Health Information Exchange, Interoperability and Data Integration
k. HIT Infrastructure and Standards
l. Human Factors, User Experience and Design
m. Improving Quality Outcomes Through Health IT
n. Innovation, Entrepreneurship and Venture Investment
o. Leadership, Governance, Strategic Planning
p. Patient Safety
q. Pharmacy Standards & Technology
r. Population Health
s. Precision Medicine/Genomics
t. Privacy, Security and Cybersecurity
u. Process Improvement, Workflow, Change Management

22 | P a g e
v. Public Policy
w. Social, Psychosocial & Behavioral Determinants of Health
x. Supply Chain
9. To what extent do you agree with the below statements?
a. The medical staff has a favorable attitude towards the use of clinical IT in our
organization
b. The nursing staff has a favorable attitude towards the use of clinical IT in our
organization
c. The ancillary clinical staff (e.g. pharmacists, dieticians, physical therapists, etc.) have a
favorable attitude towards the use of clinical IT in our organization
Strongly
disagree Disagree
Somewhat
disagree
Neither agree
or disagree
Somewhat
agree Agree
Strongly
disagree
О О О О О О О
10. Which of the below executives does your organization employ? (select all that apply)
О Chief Information Officer
О A senior clinical IT leader (e.g. CMIO, CNIO, CHIO)
О A senior information security leader (e.g. CISO)
О Chief Technology Officer
О Chief Innovation Officer
О Chief Transformation Officer
О None of the above If selected skip to Q9
О Don't know If selected skip to Q9
11. How would you characterize the shift in influence of the following executive positions in your
organization during the past few years?
О No substantive change
О Influence has increased
О Influence has diminished
О Don’t know
Only display if “Chief Information Officer” selected in Q7
a. Chief Information Officer
Only display if “A senior clinical IT leader” selected in Q7
b. The senior clinical IT leader (e.g. CMIO, CNIO, CHIO)
Only display if “A senior Information security leader” selected in Q7
c. The senior information security leader (e.g. CISO)
Only display if “Chief Technology Officer” selected in Q7
d. Chief Technology Officer
Only display if “Chief Innovation Officer” selected in Q7
e. Chief Innovation Officer
Only display if “Chief Transformation Officer” selected in Q7
f. Chief Transformation Officer
23 | P a g e
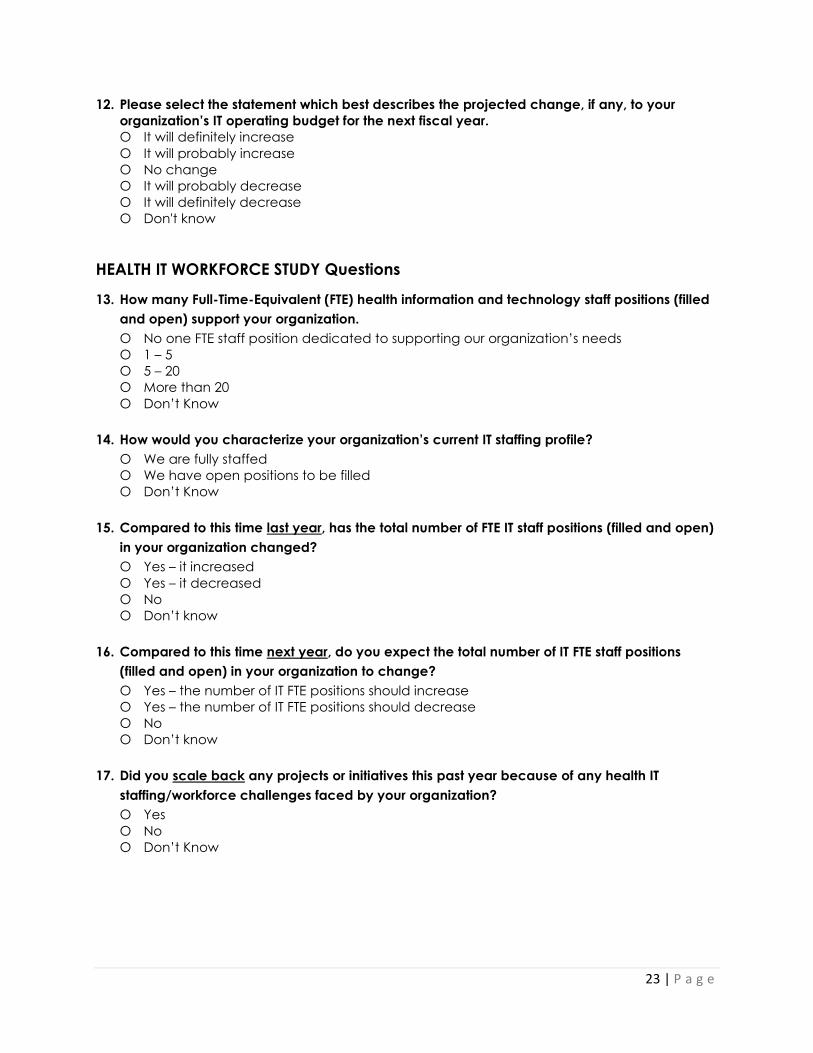
12. Please select the statement which best describes the projected change, if any, to your
organization’s IT operating budget for the next fiscal year.
О It will definitely increase
О It will probably increase
О No change
О It will probably decrease
О It will definitely decrease
О Don't know
HEALTH IT WORKFORCE STUDY Questions
13. How many Full-Time-Equivalent (FTE) health information and technology staff positions (filled
and open) support your organization.
О No one FTE staff position dedicated to supporting our organization’s needs
О 1 – 5
О 5 – 20
О More than 20
О Don’t Know
14. How would you characterize your organization’s current IT staffing profile?
О We are fully staffed
О We have open positions to be filled
О Don’t Know
15. Compared to this time last year, has the total number of FTE IT staff positions (filled and open)
in your organization changed?
О Yes – it increased
О Yes – it decreased
О No
О Don’t know
16. Compared to this time next year, do you expect the total number of IT FTE staff positions
(filled and open) in your organization to change?
О Yes – the number of IT FTE positions should increase
О Yes – the number of IT FTE positions should decrease
О No
О Don’t know
17. Did you scale back any projects or initiatives this past year because of any health IT
staffing/workforce challenges faced by your organization?
О Yes
О No
О Don’t Know

24 | P a g e
18. Did you place on hold any projects or initiatives this past year because of any health IT
staffing/workforce challenges faced by your organization?
О Yes
О No
О Don’t Know
19. Did you use the services of an IT staffing/executive search firm this past year?
О Yes
О No
О Don’t Know

25 | P a g e
APPENDIX C – Vendor/Consultant Survey
2018 HIMSS U.S. Health IT Leadership and Workforce Survey Vendor Version
November 2017
1. In which country do you work?
Canada
United
Other IF SELECTED… skip to Q3
2. In which province/state do you work?
3. Which of the below best describes the type of organization for which you work?
Academic Education Institution
Academic Medical Center
Banks/Financial Services
Community Health Center Clinic
Critical Access Hospital
Federal, State or Local Government Office
Financial, Legal, Investment Firm
Consulting Firm
HIE Organization
Home Healthcare Organization
Hospice
Hospital, Multi-Hospital System, Integrated
Delivery
IDS/hospital-owned Ambulatory Clinic
Independent Ambulatory Clinic
Independent Rehabilitation Facility
Life Sciences
Long Term Care Facility
Mental/Behavioral Health Facility
Payor, Insurance Company, Managed Care
Professional Society
Public Health
Vendor
Other (Please specify)
***If selected send to Provider survey
***If selected… thank for their interest in the survey and end
26 | P a g e
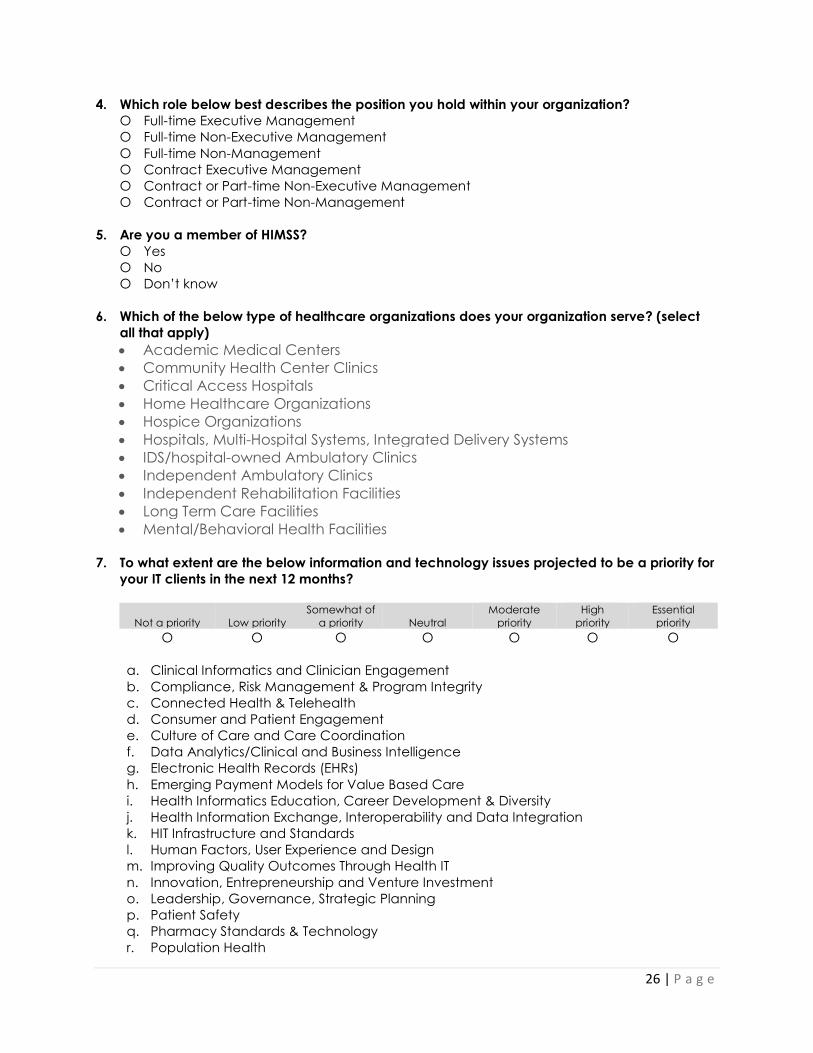
4. Which role below best describes the position you hold within your organization?
О Full-time Executive Management
О Full-time Non-Executive Management
О Full-time Non-Management
О Contract Executive Management
О Contract or Part-time Non-Executive Management
О Contract or Part-time Non-Management
5. Are you a member of HIMSS?
О Yes
О No
О Don’t know
6. Which of the below type of healthcare organizations does your organization serve? (select
all that apply)
Academic Medical Centers
Community Health Center Clinics
Critical Access Hospitals
Home Healthcare Organizations
Hospice Organizations
Hospitals, Multi-Hospital Systems, Integrated Delivery Systems
IDS/hospital-owned Ambulatory Clinics
Independent Ambulatory Clinics
Independent Rehabilitation Facilities
Long Term Care Facilities
Mental/Behavioral Health Facilities
7. To what extent are the below information and technology issues projected to be a priority for
your IT clients in the next 12 months?
Not a priority Low priority
Somewhat of
a priority Neutral
Moderate
priority
High
priority
Essential
priority
О О О О О О О
a. Clinical Informatics and Clinician Engagement
b. Compliance, Risk Management & Program Integrity
c. Connected Health & Telehealth
d. Consumer and Patient Engagement
e. Culture of Care and Care Coordination
f. Data Analytics/Clinical and Business Intelligence
g. Electronic Health Records (EHRs)
h. Emerging Payment Models for Value Based Care
i. Health Informatics Education, Career Development & Diversity
j. Health Information Exchange, Interoperability and Data Integration
k. HIT Infrastructure and Standards
l. Human Factors, User Experience and Design
m. Improving Quality Outcomes Through Health IT
n. Innovation, Entrepreneurship and Venture Investment
o. Leadership, Governance, Strategic Planning
p. Patient Safety
q. Pharmacy Standards & Technology
r. Population Health

27 | P a g e
s. Precision Medicine/Genomics
t. Privacy, Security and Cybersecurity
u. Process Improvement, Workflow, Change Management
v. Public Policy
w. Social, Psychosocial & Behavioral Determinants of Health
x. Supply Chain
8. Which of the below executives does your organization tend to interact with when servicing
your clients? (select all that apply)
О Chief Information Officer
О The senior clinical IT leader (e.g. CMIO, CNIO, CHIO)
О The senior information security leader (e.g. CISO)
О Chief Technology Officer
О Chief Innovation Officer
О Chief Transformation Officer
О None of the above If selected skip to Q10
О Don't know If selected skip to Q10
9. How would you characterize the shift in influence of the following executive positions in your
client’s organizations during the past few years?
О No substantive change
О Influence has increased
О Influence has diminished
О Don’t know
Only display if “Chief Information Officer” selected in Q8
a. Chief Information Officer
Only display if “A senior clinical IT leader” selected in Q8
b. The senior clinical IT leader (e.g. CMIO, CNIO, CHIO)
Only display if “A senior Information security leader” selected in Q8
c. The senior information security leader (e.g. CISO)
Only display if “Chief Technology Officer” selected in Q8
d. Chief Technology Officer
Only display if “Chief Innovation Officer” selected in Q8
e. Chief Innovation Officer
Only display if “Chief Transformation Officer” selected in Q8
f. Chief Transformation Officer
10. Please select the statement which best describes the projected change, if any, to the
volume of IT business your organization addresses during the next fiscal year.
О It will definitely increase
О It will probably increase
О No change
О It will probably decrease
О It will definitely decrease
О Don't know
HEALTH IT WORKFORCE STUDY Questions
11. How would you characterize your organization’s current staffing profile?
28 | P a g e
О We are fully staffed
О We have open positions to be filled
О Don’t Know
12. Compared to this time last year, has the total number of FTE staff positions (filled and open) in
your organization changed?
О Yes – it increased
О Yes – it decreased
О No
О Don’t know
13. Compared to this time next year, do you expect the total number of FTE staff positions (filled
and open) in your organization to change?
О Yes – the number of FTE positions should increase
О Yes – the number of FTE positions should decrease
О No
О Don’t know
14. Did you scale back any client projects or initiatives this past year because of any health IT
staffing/workforce challenges faced by your organization?
О Yes
О No
О Don’t Know
15. Did you place on hold any client projects or initiatives this past year because of any health IT
staffing/workforce challenges faced by your organization?
О Yes
О No
О Don’t Know
16. Did you use the services of an IT staffing/executive search firm this past year?
О Yes
О No
О Don’t Know
29 | P a g e
APPENDIX D – Organization Type/Focus
Hospitals Hospitals, Multi-Hospital Systems, Integrated Delivery Systems Academic Medical Centers Critical Access Hospitals
Ambulatory Independent Ambulatory Clinics Community Health Center Clinics IDS/hospital-owned Ambulatory Clinics
Long Term/Post-Acute Care (LTPAC) Mental/Behavioral Health Facilities Long Term Care Facilities Independent Rehabilitation Facilities Home Healthcare Organizations Hospice Organizations