2018 european semester: assessment of progress on ... · graph 3.4.3: world bank 2017 governance...
TRANSCRIPT
EN EN
EUROPEAN COMMISSION
Brussels, 7.3.2018
SWD(2018) 216 final
COMMISSION STAFF WORKING DOCUMENT
Country Report Malta 2018
Accompanying the document
COMMUNICATION FROM THE COMMISSION TO THE EUROPEAN
PARLIAMENT, THE COUNCIL, THE EUROPEAN CENTRAL BANK AND THE
EUROGROUP
2018 European Semester: Assessment of progress on structural reforms, prevention and
correction of macroeconomic imbalances, and results of in-depth reviews under
Regulation (EU) No 1176/2011
{COM(2018) 120 final}

Executive summary 1
1. Economic situation and outlook 4
2. Progress with country-specific recommendations 12
3. Reform priorities 16
3.1. Public finances and taxation 16
3.2. Financial sector 21
3.3. Labour market, education and social policies 24
3.4. Investment 30
3.5. Sectoral policies 37
Annex A: Overview Table 41
Annex B: Macroecnomic Imbalance Procedure Scoreboard 44
Annex C: Standard Tables 45
References 51
LIST OF TABLES
Table 1.1: Key economic and financial indicators - Malta 11
Table 3.2.1: Financial soundness indicators, total (i.e. domestic and international) banks, Malta (%) 21
Table 3.4.1: Enterprises, employment and value added by firm size class 35
Table 3.5.1: Largest sector of GHG emissions in 2015 (% of total GHG emissions) 39
Table B.1: The MIP scoreboard for Malta (AMR 2018) 44
Table C.1: Financial market indicators 45
Table C.2: Headline Social Scoreboard indicators 46
Table C.3: Labour market and social indicators 47
Table C.4: Social inclusion and health indicators 48
Table C.5: Product market performance and policy indicators 49
Table C.6: Green growth 50
LIST OF GRAPHS
Graph 1.1: Quarterly GDP growth, Malta and euro area 4
Graph 1.2: Core HICP inflation, Malta and euro-area 4
CONTENTS

Graph 1.3: Decomposition of rate of change of unit labour costs 6
Graph 1.4: Export market share decomposition 6
Graph 1.5: Current account in services (% of GDP) 7
Graph 1.6: Current account decomposition (% of GDP) 7
Graph 1.7: Private sector debt: gaps to prudential and fundamental-based benchmarks 9
Graph 1.8: Funding of non-financial corporations 9
Graph 1.9: Government balance and debt (% of GDP) 9
Graph 2.1: Overall multiannual implementation of 2011-2017 CSRs to date 12
Graph 3.1.1: General government balance and the impact of the Individual Investor Programme
(% of GDP) 16
Graph 3.1.2: Average growth 2013-2016 of total current expenditure per inhabitants 16
Graph 3.1.3: Gross fixed capital formation in 2012 and 2016 (% of GDP) 17
Graph 3.2.1: Residential investment and building permits 22
Graph 3.2.2: Overvaluation gap of house prices 23
Graph 3.3.1: Employment rate by age and sex, 2016 24
Graph 3.3.2: Employment gap of persons with disabilities by gender and Member State (age 20-
64), 2015 26
Graph 3.3.3: Share of employers by sector reporting labour shortages in Malta 26
Graph 3.3.4: Early school leaving rate 27
Graph 3.3.5: Participation rate in education and training (25-64 years), 2016 28
Graph 3.4.1: Number of persons employed in SMEs 31
Graph 3.4.2: Value added of SMEs 31
Graph 3.4.3: World Bank 2017 Governance Indicators - Malta 32
Graph 3.4.4: Evolution of business R&D intensity and public R&D intensity in Malta, 2004-2016 33
Graph 3.5.1: Selected road transport indicators - Malta 37
Graph 3.5.2: GHG emission per capita (kg CO2-eq/inhabitant) 39
Graph 3.5.3: WEF Travel and Tourism Competitiveness Index – Selected indicators 40
LIST OF BOXES
Box 1.1: The gaming sector 10
Box 2.2: CSR implementation table 14
Box 2.3: Tangible results delivered through EU support to structural change in Malta 15
Box 3.3. 1: Monitoring performance in the light of the European Pillar of Social Rights 25
Box 3.3.5: Policy highlights 30
Box 3.4.6: Investment Box -challenges and reforms in Malta 36

1
In the context of robust economic growth,
Malta’s key challenges mostly concern its
longer term sustainability. Growth prospects
look favourable and the fiscal outlook remains
positive, on the back of a significant current
account surplus. Yet, the mounting pressure on
infrastructure and natural resources, rising housing
prices, as well as shortages of labour and skills
may create challenges in the future. Reducing the
infrastructure gap, improving labour supply,
strengthening the business environment and
promoting environmental sustainability remain key
policy priorities to sustain long-term growth.
Enhanced supervision in the financial sector is an
additional important factor to safeguard financial
stability and preserve Malta’s attractiveness and
good reputation as investment destination (1).
Growth has remained dynamic. Real GDP
growth was among the highest in the EU in recent
years. It reached its peak in 2014-15, averaging
7.7%, driven also by a surge in investment related
to one-off factors. Despite strong net service
exports and robust private consumption, real GDP
growth moderated in 2016 and is forecast to have
remained robust at 6.9 % in 2017. Moreover,
employment growth is among the highest in the
EU, in particular due to the services sector. The
unemployment rate has dropped to a record low of
under 5 %. Immigration flows were key in
offsetting emerging skills gaps and labour
shortages.
Going forward, growth momentum remains
strong. Real GDP growth is forecast to remain
solid, reaching 4.9 % in 2018. Private consumption
is expected to become the main driver of growth
on the back of an increasing population and
growing disposable income. In addition, improved
consumer confidence and consumption is expected
to result in a somewhat lower household saving
rate. Investment is forecast to recover, led by the
residential construction sector, which is expected
to continue growing strongly in 2018. Exports are
(1) This report assesses Malta’s economy in light of the
European Commission’s Annual Growth Survey published
on 22 November 2017. In the survey, the Commission calls
on EU Member States to implement reforms to make the
European economy more productive, resilient and
inclusive. In so doing, Member States should focus their
efforts on the three elements of the virtuous triangle of
economic policy — boosting investment, pursuing
structural reforms and ensuring responsible fiscal policies.
forecast to continue rising, in line with growing
demand among Malta’s main trading partners.
The current account continues to show a
marked surplus. Since 2014, the current account
surplus averaged close to 8 %. In mid-2017, it
reached a peak of 10 % of GDP. This high level is
mostly attributable to the service sector, reflecting
buoyant activity in the gaming, tourism and
transport sectors. The autumn forecast projects the
surplus to stabilise below 10 %, reflecting rising
exports.
Strong economic growth boosted tax revenues,
in particular direct taxes. In the context of a
fiscal surplus, expenditure remains quite dynamic,
calling for a close monitoring. Gross government
debt has dropped below 60 % of GDP already in
2016 and it is projected to continue falling. Despite
some progress, challenges concerning tax
compliance remain and the corporate debt bias
remains high.
Malta made some progress in addressing the
2017 country-specific recommendations
Initiatives are envisaged to expand the scope of the
spending review and ultimately contribute to
increasing effectiveness in public expenditure.
While cross-border supervision remains essential
in particular in the insurance sector, some progress
has been made in securing more resources in the
supervisory departments.
Regarding the progress in reaching the national
targets under the Europe 2020 strategy Malta has
made progress towards its target on employment.
However, gaps remain with respect to the targets
for reducing greenhouse gases, raising R&D
expenditure, increasing renewable energy
provision, improving energy efficiency, reducing
early school leaving, increasing the tertiary
education attainment, and reducing poverty.
Malta performs relatively well on the indicators
of the Social Scoreboard supporting the
European Pillar of Social Rights. Malta
continues relevant policy action to address labour
market integration and social exclusion, notably
through its ‘make work pay’ policies. However,
high early school leaving rates, the high gender
employment gap and labour market participation
of people with disabilities merit attention.
EXECUTIVE SUMMARY

Executive summary
2
Key structural issues analysed in this report, which
point to particular challenges for Malta’s economy,
are the following:
Short and medium-term fiscal risks appear
contained. Public finances have benefited from
the strengthening of tax revenues, supported by
favourable macroeconomic conditions. The
proceeds related to the Individual Investment
Programme have also contributed to this
improvement. The spending review is expected
to be conducive to more efficient expenditure
performance. In the long-term, age-related
public spending in the healthcare and pension
systems is expected to increase relatively fast
compared to other EU countries, indicating a
possible challenge to fiscal sustainability.
Some indicators suggest that Malta’s tax
rules are used by multinationals engaged in
aggressive tax planning structures. Malta has
taken steps to amend certain aspects of its tax
system that may facilitate aggressive tax
planning. However, the existence of some tax
rules (among them the design of the planned
Notional Interest Deduction regime), the
absence of withholding taxes on payments
made by companies based in Malta, combined
with a lack of some anti-abuse rules, suggest
that Malta's tax rules may still be used in tax
avoidance structures.
Ensuring effective financial supervision
remains a challenge. The financial sector is
characterised by a large number of foreign
institutions, in particular insurance companies,
predominantly operating cross-border. The
effectiveness of the recently adopted anti-
money laundering legislation has to be
thoroughly followed. In this context, ensuring a
strengthened supervisory framework is crucial
to preserve Malta’s good reputation and
attractiveness as an international financial
centre.
House prices have surged and deserve
continuous monitoring. Strong economic
activity, favourable labour market conditions,
investment in real estate by non-residents and
low interest rates have all contributed to a
sustained increase in house prices in the recent
past. Residential construction and mortgage
lending are experiencing rapid growth, which
may lead to increased vulnerability of the
economy to housing market developments, also
considering that the bulk of new mortgages are
at variable interest rates.
Malta’s labour market continues to perform
strongly, however with a still high gender
gap. Employment grows, in line with the high
economic growth. The employment rate
reached 71.8 % in Q3 2017. Wage growth
remains modest, despite the continued fall in
unemployment. A large gender employment
gap persists, as employment rates are high for
women below 30, but they considerably lower
above this age.
Skills shortages have become very
pronounced. Over 30 % of companies report
skills shortages, a significantly higher share
than previous years. These shortages are being
filled with foreign labour across all skills
levels. While investment in education and skills
continues, the rate of early school leaving
remains very high and has not improved much
compared to the previous year. Educational
outcomes remain strongly linked to socio-
economic background. Basic skills attainment
among young people is still weak.
Poverty and social exclusion risks have been
reduced but remain substantial for some
population groups. Poverty and social
exclusion risks declined to levels last seen in
2008. However, single-earner households and
the low-skilled face substantial poverty risks.
There are obstacles to integration of the foreign
population, especially non EU migrants who
face a high risk of poverty and social exclusion
despite a high employment rate. Malta
continues to strengthen its policies for active
inclusion, and has recently adopted a Strategy
on the integration of migrants. Income
inequalities remain below the EU average
thanks to low market inequalities and the
features of Malta’s tax and benefits system.
The SMEs sector has shown a considerable
dynamism in recent years, despite existing
gaps in the R&D framework. Growth in
terms of number of persons employed and
value added has been above EU average and

Executive summary
3
only a minority of firms appears to be finance
constrained. At the same time, the
predominance of micro and small firms, which
have to rely on internal funding to support
R&D activities, and the size of local market
limit their innovation potential. While Malta’s
R&D performance has recently improved, a
better innovation ecosystem would enhance the
capacity of innovative companies to scale up
their activities.
Shortcomings in the judicial and anti-
corruption framework affect the business
climate. The justice system continues to face
challenges concerning its efficiency. According
to a recent Eurobarometer Flash Survey,
corruption is perceived as a problematic factor
for doing business in Malta. The fragmented
landscape of anti-corruption institutions and the
lack of formalised institutional coordination
may hamper effective investigation and
prosecution of corruption allegations.
The road transport sector faces major
infrastructure and sustainability challenges.
Severe traffic congestion constitutes a barrier
to investment, and generates significant
external costs and greenhouse gas emissions
(also given the expected increasing demand for
transport). The authorities have recently
announced a project to upgrade the road
infrastructure over a period of seven years,
which is however expected to reduce
congestion costs and greenhouse gas emissions
only modestly.
Increased economic activity may exacerbate
existing bottlenecks, including in
infrastructure, and put further pressure on
environmental resources. Moving towards a
more circular economy and tackling the
negative externalities from the construction
sector and the property market, for example
concerning waste disposal, environmental
impacts and energy performance, remain
challenging. If not addressed, bottlenecks in
natural resources and infrastructure may also
affect the development of the tourism sector,
still a key pillar of the Maltese economy.
Tourism expansion may itself intensify
pressure on the country’s resources.

4
Economic growth and inflation
Malta’s economic performance has been
outstanding in recent years. Following a
relatively quick recovery after the 2008-09 crisis,
the Maltese economy got a second wind in mid-
2012. As a result, it effectively decoupled from the
euro-area economic cycle, avoiding the double-dip
recession observed there and exhibited growth
rates higher than its pre-2009 peak. Growth has
been job-rich, tapping into the potential of the
domestic labour force and the still relatively low
labour market participation rate. Increasing inflows
of foreign labour have helped maintain the growth
momentum and mitigated skills shortages and
wage pressures.
Graph 1.1: Quarterly GDP growth, Malta and euro area
Note: Growth rates have been calculated on the basis of 4-
quarter moving sums of GDP
Source: European Commission
Growth has been mainly export driven. Net
exports accounted for about half the increase in
real GDP since 2012 as export growth, in
particular of services, more than offset a rise in
imports. The latter is associated with buoyant
domestic demand, reflecting strong household
consumption and a spike in investment. Malta’s
openness to trade (measured by exports plus
imports as a share of GDP) has increased
significantly over the past decade, from around
200 % of GDP in 2006 to over 300 % in 2011-12,
before subsiding somewhat to around 270 % as the
weight of domestic demand in the economy started
to rebound.
Inflation has stabilised at relatively low levels.
Following a period of volatility in the past, Malta
has shown the lowest volatility in its HICP
inflation among the euro-area members since early
2014. To a large extent, this reflects the regulation
of fuel prices by the government. Thus, while
overall HICP inflation has been rising in the euro
area since 2016, in Malta it remained stable,
averaging just over 1 % in the twelve months to
September 2017.
Graph 1.2: Core HICP inflation, Malta and euro-area
Note: Area refers to the range of values in the euro-area
Source: European Commission
Growth momentum remains strong going
forward. Real GDP growth reached 5.5% in 2016
and accelerated in the first three quarters of 2017,
registering a year-on-year increase of 7.2%.
External demand looks to be the main driver of
growth in 2017, with domestic demand playing a
secondary role due to a strong contraction of
investment (reflecting a high base in 2016). Real
GDP growth is forecast to reach [6.9%] in 2017 as
a whole, higher than the rate recorded in 2016. It is
projected to slow somewhat in 2018 to [5.6 %].
Private consumption is expected to become the
main driver of growth, on the back of an increasing
population and growing disposable income. At the
same time, improved consumer confidence and
consumption is expected to result in a somewhat
lower household saving rate. Investment is forecast
to recover, led by the residential construction
sector, expected to continue growing strongly in
2018. Exports are forecast to continue rising, in
line with growing demand among Malta’s main
-2
-1
0
1
2
3
01Q
1
01Q
4
02Q
3
03Q
2
04Q
1
04Q
4
05Q
3
06Q
2
07Q
1
07Q
4
08Q
3
09Q
2
10Q
1
10Q
4
11Q
3
12Q
2
13Q
1
13Q
4
14Q
3
15Q
2
16Q
1
16Q
4
17Q
3
%
EA MT
-6
-4
-2
0
2
4
6
8
Jan
-10
Jul-1
0
Jan
-11
Jul-1
1
Jan
-12
Jul-1
2
Jan
-13
Jul-1
3
Jan
-14
Jul-1
4
Jan
-15
Jul-1
5
Jan
-16
Jul-1
6
Jan
-17
Jul-1
7
%
1. ECONOMIC SITUATION AND OUTLOOK
1. Economic situation and outlook
5
trading partners, resulting in a further increase in
the current account surplus. In 2019, real GDP
growth is projected to slow down to 4.5 %, below
potential output. Private consumption is projected
to remain the main driver of growth, while all
demand components are forecast to contribute
positively.
Risks to the macroeconomic projections are
linked primarily to the outlook for investment
and net exports. A faster realisation of planned
infrastructure projects could boost growth in the
near term. In addition, in view of Malta’s openness
to trade, any volatility in its main exporting sectors
would have a disproportionately large impact on
real GDP growth.
Malta’s key challenges are mostly related to the
long-term sustainability of its growth model.
Overall, Malta’s recent economic performance
appears to have been largely the result of structural
change and, in the medium term, it is expected to
stabilise and remain at a relatively strong rate.
These prospects on economic activity are expected
to exacerbate existing bottlenecks, including in
infrastructure, and to put further pressure on
environmental resources. There are increasing
signals of tightness in the labour market,
constraining firms' expansion plans and growth
prospects (see Section 3.3). Growing reliance on
foreign labour, to address labour and skill
shortages, may pose further risk to the
competiveness of the Maltese economy. In this
context, maintaining Malta as a reliable
jurisdiction for financial and gaming services is
particularly important in light of sustaining Malta’s
attractiveness as an international financial and
business location.
Labour Market and social developments
Labour market conditions continue to be
favourable. The unemployment rate dropped to
4 % in 2017, while employment growth remains
robust. Youth unemployment remains also much
below EU average. Reliance on inward labour
migration to fill vacancies remains substantial.
Strong increases in labour supply, also on the back
of rising inflows of foreign workers, served to
dampen the upward pressure on wages in 2016 and
2017. In 2018 and 2019 the tightening labour
market is expected to put increased upward
pressure on wages.
Nonetheless, the sustainability of the current
employment growth may be hindered by
persisting challenges. Although the employment
rate is at 69.6 %, the gender employment gap is
still 27.6 %. The participation of people with
disabilities in the labour market also remains low,
despite modest improvements in educational
outcomes and participation. Low tertiary
educational attainment and skills levels and higher
risks of poverty affecting children and the lower-
skilled population hamper efforts to reach overall
sustainable and inclusive growth.
While inequality in both income and wealth
remain moderate, there is a risk of unequal
opportunities for the next generation. The share
of income held by the richest 20 % of households
was 4.2 times greater than that of the poorest 20 %
in 2016. This is one of the lowest ratios in the EU,
and unchanged from the previous year. Net wealth
is also relatively evenly distributed, reflecting the
even distribution of housing assets across the
population. However, learning outcomes for
children are more strongly correlated to their
socioeconomic background than in most other EU
countries, as is their risk of poverty (see Section
3.3.3). In addition, rising market inequalities might
in the long run put pressure on the redistributive
impact of the tax and benefits system.
Productivity and competitiveness
Labour productivity is improving strongly.
Nominal unit labour costs are moving broadly in
line with the euro area (+0.9 % compared with
0.8 % in 2016, respectively) , benefiting from
robust productivity gains. In 2016, real labour
productivity per person employed decelerated
compared to 2014-15 but still grew at a
significantly higher pace than the euro area
(+1.7 % vs 0.5 %, respectively).
After moderate wage growth in recent years,
the tightening labour market is expected to put
increasing upward pressure on wages. In 2016
nominal wages increased by 2.7 % and in 2017
nominal wage growth is projected to have slowed
down to 2 %. Real wages increased by 1.1 % in
2016, and are projected to have stabilised in 2017.
In 2018 and 2019 wage growth is expected to
accelerate somewhat, as a result of the tightening

1. Economic situation and outlook
6
labour market (2). Driven by increased nominal
wage growth and moderate productivity gains,
nominal unit labour costs are projected to increase
by 1.3 % in 2018 and 2019 (see Graph 1.3). A
somewhat accelerated wage growth can be
considered sustainable, considering that real wage
growth has remained below productivity growth
over the last years, and given Malta's positive
external position.
Graph 1.3: Decomposition of rate of change of unit labour
costs
Source: European Commission
Malta occupies one of the highest positions in
the EU for export quality in manufacturing.
Around 40 % of the total export value concerns
products of top quality (vs 25 % in 2011). In
exported manufacturing goods, there have been
relatively large swings in the shares of high-tech
and medium-low tech goods in the recent past. In
2016, the share of high-tech manufacturing exports
amounted to 43.2 % (up from 26.8 % in 2015)
while the share of medium-low tech products fell
to 34.8 % (from 50.7 % in 2015).
The services sector contributes strongly to a
positive export performance. Buoyant export
performance in recent years has resulted in rising
export market shares, as gains in services markets
offset losses in goods.
(2) Nominal wages are projected to increase by 3.4 % in 2018
and 3.6 % in 2019. Real wages are expected to increase by
1.3% over the forecast horizon, remaining below
productivity growth (1.8 % in 2018 and 1.9 % in 2019).
Graph 1.4: Export market share decomposition
Source: European Commission
Keeping pace with the rise of new sectors
creates challenges, in terms of governance and
infrastructure. Malta ranks 37th out of 137
countries in the 2017-18 Global Competitiveness
Report, three places higher than last year.
Inefficient public administration, insufficient
capacity to innovate, inadequate supply of
infrastructure and access to finance are reported in
the Global Competitiveness Report as the main
barriers to doing business in Malta.
External sustainability
The external position remained robust, relying
on a high current account surplus and a
positive net international investment position.
The balance of Malta’s net international
investment position reached 64.5 % of GDP in Q2
of 2017, one of the highest in the EU after the
Netherlands. Meanwhile, the surplus in the current
account reached 10 % of GDP in mid-2017
reflecting a strong surplus in the services account
(see Graph 1.5). Exports of services have been
boosted predominantly by the activities of the
gaming industry (see Box 1.1), but supported also
by sizeable gains in tourism and transport sectors.
Imports of goods are falling, related to the
recent contraction in investment. In 2016,
‘machinery and transport equipment’ accounted
for almost half (48.2 %) of the value of imports of
goods. Around two thirds of such products were
imported from extra-EU countries. Real imports
-6
-4
-2
0
2
4
6
8
02 03 04 05 06 07 08 09 10 11 12 13 14 15 16 17*18*19*
Rate
of
change y
-o-y
(%
)
Inflation (GDP deflator growth)Real Compensation per EmployeeProductivity Contribution (negative sign)Nominal unit labour costULC in Euro Area
-20
-15
-10
-5
0
5
10
15
20
25
05 06 07 08 09 10 11 12 13 14 15 16R
ate
of
change y
-o-y
(%
)
Contribution to EMS: goodsContribution to EMS: servicesExport market share growth yoy

1. Economic situation and outlook
7
declined by 4% y-o-y in the first three quarters of
2017, due to the large drop in goods imports (-
11.2 % y-o-y), while imports of services fell only
slightly (-0.2 %). This could be explained largely
by the decline in investment in machinery and
equipment (-34.8 % y-o-y during the same period).
Graph 1.5: Current account in services (% of GDP)
Source: European Commission
The change in Malta’s current account position
seems to be of structural nature. The present
level of the current account surplus significantly
exceeds the current account norm (3), estimated by
the Commission (see Graph 1.6). Even after taking
into account the impact of the cycle and policy
factors there remains a large residual that cannot
be explained by fundamentals. The size of the
residual could reflect the changing structure of the
Maltese economy (4), including its emerging status
as an international financial centre and the growing
(3) The current account 'norm' benchmark is derived from
reduced-form regressions capturing the main determinants
of the saving-investment balance, including fundamental
determinants (e.g. demographics, resources), policy factors
and global financial conditions. The methodology is akin to
that followed by IMF External Balance Assessment. See
also European Commission, 2017, 'Empirical current
account benchmarks: modelling the impact of demographic
variables', LIME Working Group, 24 April 2017.
(4) Another structural factor driving the change in the current
account is the improvement in energy intensity (i.e. kg of
oil equivalent per 1,000 EUR) which decreased from 162.2
in 2004 to 114 in 2014. In 2015 it further declined to 90.8,
below the EU average of 120. This shift reflects both the
reduced importance of exports of goods and the
improvement in the efficiency in the generation of
electricity. Given Malta’s dependence on imported oil,
these developments impacted its current account position.
importance of cross-border activities. Revenues
from the Individual Investment Programme (5) also
contributed sizeably to the external balance, thus
also helping explain the residual factor in 2016.
Graph 1.6: Current account decomposition (% of GDP)
Source: European Commission
Lower import intensity and reliance on physical
capital is coupled with a sustained saving rate.
Underpinning the improvement in the current
account balance is a recovery in the national
saving rate, driven by improved fiscal
performance, and rising corporate and household
savings. The latter are the result of the emergence
of new export-oriented services sectors as well as
the restructuring of previously existing sectors
which has led to higher growth in profits. In
addition, the strong economic growth registered in
recent years, combined with higher dependence on
labour in the new economic sectors, has raised
disposable income. Conversely investment has
slightly declined. In particular, private investment
in 2011-14 was below the average registered since
EU accession. The shift from capital intensive
industries to the more labour intensive sectors is
likely to have led to a compositional effect that has
weighed negatively on total investment growth.
The unusual fluctuation in private investment
related to one-off large investment projects led to a
(5) The Individual Investment Programme was established by
LN 47/2014. This scheme grants naturalisation to foreign
individuals and their dependants following substantial
investment and a due diligence process. In national
accounts, it is recorded as both negative government
expenditure and exports of services.
-40
-20
0
20
40
60
04 05 06 07 08 09 10 11 12 13 14 15 16
% o
f G
DP
Personal, cultural, and recreational servicesFinancial servicesTravelTransportCharges for the use of intellectual property n.i.e.Other business servicesOtherCurrent account in services, balance
-15
-10
-5
0
5
10
15
06 07 08 09 10 11 12 13 14 15 16
ResidualCyclePolicy factorsGlobal financial factors / NIIPFundamentalsCurrent account % of GDP

1. Economic situation and outlook
8
surge in private investment in 2015-16. It is
expected to return to its previous levels going
forward. Public investment, after having reached
its lowest level in 2010, increased until 2015
thanks also to the EU funds. However, in 2016 it
diminished significantly, showing a gap compared
to the average registered since EU accession.
Financial sector
Although the size of the total banking sector in
Malta declined, the domestic sector further
expanded. The size of the total banking sector in
Malta declined to 457 % of GDP by June-2017,
from 510 % end-2015. However, the domestic
sector further expanded, as total assets of domestic
banks reached 218 % of GDP by June 2017, on the
back of increased lending to households. The
banks have continued engaging in mortgage
contracts, growing 8 % y-o-y, while lending to
non-financial corporates remains weak. Growth in
mortgage lending increased balance sheet
concentration for domestic banks, whereby
property-related loans represent almost 60 % of
resident loans. However, the banks apply a
stringent credit risk policy, applying a haircut of
about 30 % on the market value of the property.
Furthermore, according to the authorities,
approximately half of housing purchases are
funded by banks’ lending, while the other half
comes from residents and non-residents’ cash. The
exposure to the general government, both through
direct lending and through holding sovereign
bonds, has declined (6).
Despite the increase in loans to the private
sector, loans to non-financial corporations are
declining. Loans to non-financial corporations
have continued to decline, despite favourable
financing conditions. In yearly terms, the stock of
loans to non-financial corporations fell by 1 % in
October 2017, while growing by 2.5 % in the euro
area. This could be partly explained by the
growing services sector, which is highly labour
intensive and generally requires lower capital
investment, and thus may be contributing to lower
demand for credit (Central Bank of Malta, 2017).
(6) Loans to the general government were 1.6 pps. lower in
June 2017 than end-2016, and represented 6.5 % of the
total domestic banks’ loan portfolio. Similarly, banks
reduced their exposure to the Maltese sovereign, holding
about EUR 1.7bn of short-term bills, representing 7.4 % of
their total balance sheet.
Intercompany loans have become the main funding
source for firms. Direct issuance of debt securities
and credit from non-bank financial institutions
have grown rapidly, albeit from a low base (see
Section 3.4).
On the liabilities side, domestic banks are
highly liquid. The main funding source is retail
deposits, most of which are from domestic
residents, and about one fifth from non-residents.
Deposits cover the total loan portfolio, and
domestic banks have only a marginal exposure to
ECB funding, i.e. 0.4 % of their total funding
needs. The loan-to-deposit ratio has gone down
significantly in the past five years and now
amounts to about 50 %. However, most of the
deposits have a short-term maturity (90 % of them
up to one year), which creates an increasing asset-
liability maturity mismatch, in particular compared
to mortgages, whose maturity is usually 25-30
years. Non-resident deposits, or non-Maltese
residents, represent about 14 % of total deposits
being held in the domestic banking sector. Those
coming from non-EU countries, e.g. Libya, expose
the banks’ funding to volatility risk, especially in
the event of intensified geopolitical tensions.
Whereas the minimum capital and liquidity
requirements for these banks are already higher
than for others, the situation warrants continued
attention by the supervisor (see also Section 3.2).
Private sector debt — non-financial
corporations and households
While private sector debt has eased in recent
years, further deleveraging may be necessary.
Consolidated private sector debt has decreased
relative to the size of the economy from its peak at
over 160 % in 2009 to 121.4 % in 2016, (though
this was marginally higher than 2015). The decline
has been mainly due to passive deleveraging in a
favourable macroeconomic environment by non-
financial corporations, whose debt ratio fell from
100.8 % in 2009 to 68.3 % in 2016. Nevertheless,
both household and corporate debt levels stand
above the prudential thresholds and fundamentals-
based benchmarks (Graph1.7), suggesting that
further deleveraging may be necessary (7).
(7) Fundamental-based benchmarks are derived from reduced-
form regressions capturing the main determinants of credit
growth. Stocks benchmarks are obtained by cumulating the

1. Economic situation and outlook
9
Graph 1.7: Private sector debt: gaps to prudential and
fundamental-based benchmarks
Source: European Commission
The capital market remains underdeveloped.
Maltese companies finance themselves mainly via
debt instruments, while equity financing
constitutes 30.2 % of total funding. By contrast,
equity is the main source of company financing in
the euro area. The amount of corporate bond
issuances in Malta is negligible, yet the stock
exchange is making efforts to promote their use
and expand it even to the SMEs. In the absence of
a sufficiently deep capital market, companies use
intra-group financing as an alternative source. In
addition, companies’ high gross operating surplus
(a result of the current favourable macroeconomic
environment) provides an additional cushion,
enabling them to finance investment through
retained profits.
credit flows predicted by the model. Prudential thresholds
represent the debt threshold beyond which the probability
of a banking crisis is high, obtained from the minimisation
of the probability of missed crisis and that of false alerts.
The methodologies are explained in detail in European
Commission (2017), "Benchmarks for the assessment of
private debt", Note for the Economic Policy Committee.
Graph 1.8: Funding of non-financial corporations
Source: European Central Bank and European Commission
Fiscal developments
Public finances appear sound. The headline
government surplus is set to decrease from 1.1 %
of GDP in 2016 to 0.9 % of GDP in 2017. For
2018 and 2019 a budget surplus of 0.5 % of GDP
is projected (Graph 1.9). As a result of the stronger
primary balances and GDP growth, public debt
ratio has trended downward, falling below the
60 %–of–GDP threshold already in 2016. The
debt-to-GDP ratio is forecast to decrease further, to
below 50 % in 2019.
Graph 1.9: Government balance and debt (% of GDP)
Source: European Commission
-20
-10
0
10
20
30
40
50
60
70
80
04 05 06 07 08 09 10 11 12 13 14 15 16
Prudential threshold - households
Fundamental benchmark - households
Prudential threshold - non-financial corporations
Fundamental benchmark - non-financial corporations
0.000
0.005
0.010
0.015
0.020
0.025
0.030
0
10
20
30
40
50
60
Lis
ted
sha
res; 2016
Debt
securities;
2016
MF
I lo
ans;
2016
Gro
ss
opera
ting
surplus:…
Ve
ntu
recap
ital (r
hs);
2010
% o
f G
DP
Financial2 EU
0
10
20
30
40
50
60
70
80
-4
-3
-2
-1
0
1
2
10 11 12 13 14 15 16 17 18 19 % o
f GD
P
% o
f G
DP
General government balance Debt (rhs)
1. Economic situation and outlook
10
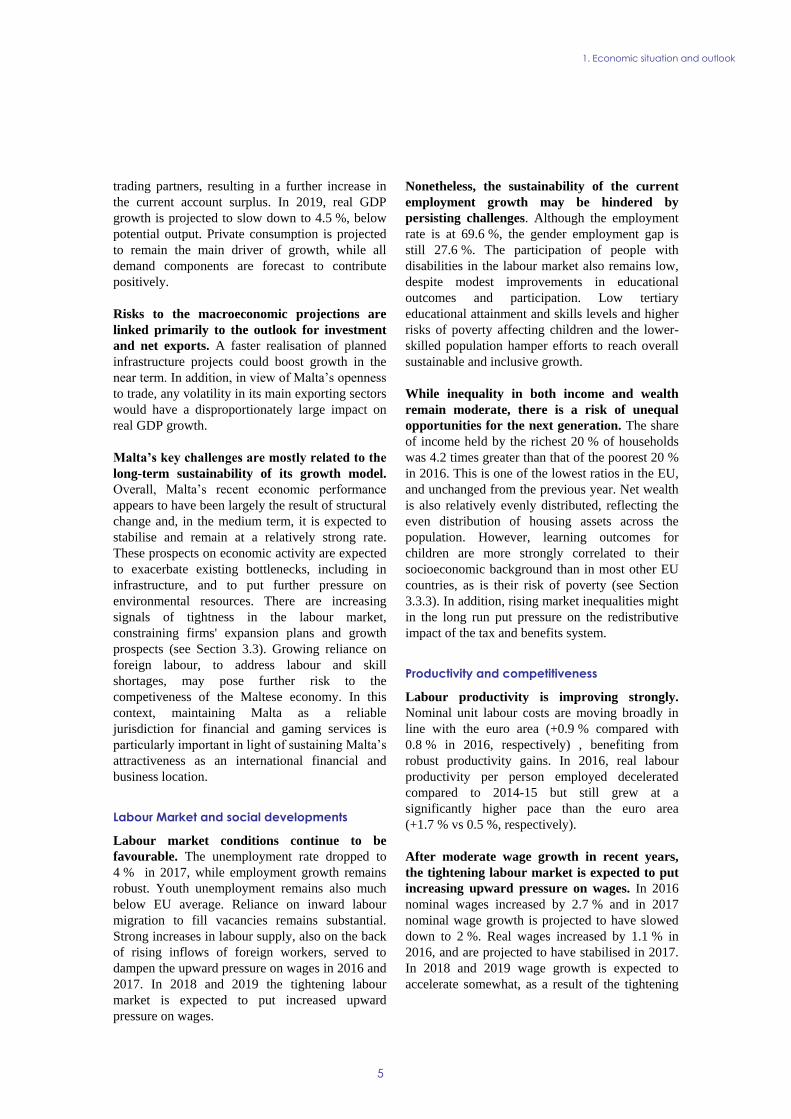
Box 1.1: The gaming sector
The gaming sphere in Malta has grown markedly over the past ten years (see also European
Commission, 2017a). As a result of these developments, the gaming industry has steadily
increased its share in the economic activity and contributed almost 12% of the economic value
added in 2016. The gaming industry has become the third-largest sector in the economy, exceeding
in terms of value added other traditionally important sectors. Gaming contributes also to
generating value added in other major sectors, including professional services, financial and ICT
activities, distributive trades and real estate.
Malta has been able to capitalize on its EU first mover advantage, and has continued to be
proactive in developing its regulatory framework to sustain the island’s competitive edge at the
forefront of the gaming sector. In 2016, the Malta Gaming Authority (MGA) continued working
on the overhaul of its regulatory framework, started in early 2015, which is expected to come into
force in 2018. The new licensing framework will target more effectively the development of
business-to-business activities, enhance the efficiency of regulatory processes and introduce
flexibility to meet current and future dynamics with respect to technological developments,
consumer protection standards and market demands. It will also increase certain powers of the
regulator such as that of oversight.
In addition, the Fourth Anti-Money Laundering Directive, which came into force in June 2015,
was finally transposed into national law on 20 December 2017. The Directive requires iGaming
companies more onerous obligations to prevent money laundering, while bringing about an
obligation for all gambling operators to conduct customer due diligence for transactions over
€2,000. Under the previous Anti-Money Laundering Directive, iGaming operators were not
subject persons. The Fourth Directive also set the obligation for remote gaming operators, as
subject persons, to appoint a Money Laundering Reporting Officer and to notify the appointment
to both the Financial Intelligence Analysis Unit and the MGA. iGaming operators are also required
to have systems and training in place to prevent money laundering and the financing of terrorism,
such as customer due diligence procedures, record keeping and internal reporting procedures.
Table 1:
Gaming sector indicators 2014 2015 2016
Number of companies in operation 289 276 266
Gross value added (EUR mn) 795.2 901.6 1,011.0
% of total GVA 10.7% 11.1% 11.6%
Employment (end of period, full-time equivalent) 3,724 4,707 6,193
of which, land-based 16.7% 17.0% 14.0%
Gaming tax revenue (EUR mn) 52.6 55.2 56.3
% of total taxes on production and imports 4.8% 4.6% 4.4%
Source: Malta Gaming Authority
The land-based activities include, among others, casinos, gaming parlours, commercial bingo halls,
national lottery, etc.

1. Economic situation and outlook
11
Table 1.1: Key economic and financial indicators - Malta
(1) NIIP excluding direct investment and portfolio equity shares (2) domestic banking groups and stand-alone banks, EU and
non-EU foreign-controlled subsidiaries and EU and non-EU foreign-controlled branches.
Source: Eurostat and ECB as of 30 Jan 2018, where available; European Commission for forecast figures (Winter forecast 2018
for real GDP and HICP, Autumn forecast 2017 otherwise)
2004-07 2008-12 2013-14 2015 2016 2017 2018 2019
Real GDP (y-o-y) 2,5 1,7 6,4 7,2 5,5 6,9 5,6 4,5
Potential growth (y-o-y) 2,5 2,5 4,0 6,6 6,6 5,6 5,2 4,7
Private consumption (y-o-y) 2,1 0,8 2,3 5,8 3,1 . . .
Public consumption (y-o-y) 1,0 3,8 3,0 3,7 -2,5 . . .
Gross fixed capital formation (y-o-y) 6,0 -2,9 4,3 49,5 -0,9 . . .
Exports of goods and services (y-o-y) 7,4 6,7 2,5 4,1 4,5 . . .
Imports of goods and services (y-o-y) 7,6 6,3 0,4 7,4 1,6 . . .
Contribution to GDP growth:
Domestic demand (y-o-y) 2,8 0,6 2,7 12,3 0,9 . . .
Inventories (y-o-y) 0,0 0,2 0,2 -1,1 0,4 . . .
Net exports (y-o-y) -0,3 0,7 3,4 -4,0 4,3 . . .
Contribution to potential GDP growth:
Total Labour (hours) (y-o-y) 0,5 0,8 1,6 2,6 3,0 2,8 2,3 1,8
Capital accumulation (y-o-y) 1,4 0,8 0,6 2,3 2,1 1,4 1,4 1,4
Total factor productivity (y-o-y) 0,6 0,9 1,9 1,7 1,5 1,4 1,4 1,4
Output gap 0,3 -1,1 -0,1 2,0 1,0 1,1 0,8 0,3
Unemployment rate 6,9 6,5 6,1 5,4 4,7 4,2 4,0 4,0
GDP deflator (y-o-y) 2,3 2,7 2,1 2,3 1,5 2,0 2,1 2,3
Harmonised index of consumer prices (HICP, y-o-y) 2,1 2,9 0,9 1,2 0,9 1,3 1,5 1,8
Nominal compensation per employee (y-o-y) 3,1 3,2 1,8 3,3 2,7 2,0 3,4 3,6
Labour productivity (real, person employed, y-o-y) 1,1 -0,3 1,8 3,1 1,7 . . .
Unit labour costs (ULC, whole economy, y-o-y) 1,9 3,5 -0,1 0,2 1,0 1,1 1,6 1,9
Real unit labour costs (y-o-y) -0,4 0,7 -2,1 -2,1 -0,6 -0,9 -0,5 -0,4
Real effective exchange rate (ULC, y-o-y) 1,9 0,9 0,6 -3,1 0,5 1,4 1,7 0,2
Real effective exchange rate (HICP, y-o-y) 1,0 -0,7 1,0 -2,2 1,7 0,4 1,6 .
Savings rate of households (net saving as percentage of net
disposable income) . . . . . . . .
Private credit flow, consolidated (% of GDP) 9,8 7,7 3,3 2,8 11,1 . . .
Private sector debt, consolidated (% of GDP) 138,0 159,4 140,0 125,9 128,6 . . .
of which household debt, consolidated (% of GDP) 46,8 58,7 57,9 54,5 53,2 . . .
of which non-financial corporate debt, consolidated (% of GDP) 91,1 100,7 82,1 71,5 75,4 . . .
Gross non-performing debt (% of total debt instruments and total
loans and advances) (2) 1,7 1,6 2,6 2,9 2,6 . . .
Corporations, net lending (+) or net borrowing (-) (% of GDP) . . . . . . . .
Corporations, gross operating surplus (% of GDP) 24,1 25,2 . . . . . .
Households, net lending (+) or net borrowing (-) (% of GDP) . . . . . . . .
Deflated house price index (y-o-y) 13,5 -0,7 0,4 5,1 4,8 . . .
Residential investment (% of GDP) 6,9 3,9 2,6 3,2 3,9 . . .
Current account balance (% of GDP), balance of payments -5,0 -2,2 5,7 4,6 6,6 9,6 9,4 9,8
Trade balance (% of GDP), balance of payments -1,6 1,4 9,2 7,4 11,3 . . .
Terms of trade of goods and services (y-o-y) 0,1 0,0 0,6 -0,1 0,3 0,3 0,3 0,3
Capital account balance (% of GDP) 2,3 1,3 1,7 1,8 0,8 . . .
Net international investment position (% of GDP) 30,7 11,0 35,1 52,2 46,5 . . .
Net marketable external debt (% of GDP) (1) 87,2 172,6 219,1 210,0 214,1 . . .
Gross marketable external debt (% of GDP) (1) 454,5 713,7 680,1 551,3 466,3 . . .
Export performance vs. advanced countries (% change over 5 years) . 36,9 0,4 -0,5 6,3 . . .
Export market share, goods and services (y-o-y) -0,7 2,4 2,1 -0,6 6,2 . . .
Net FDI flows (% of GDP) -155,4 -79,2 -86,2 -96,1 -83,7 . . .
General government balance (% of GDP) -2,9 -3,1 -2,1 -1,1 1,1 0,9 0,5 0,5
Structural budget balance (% of GDP) . -2,6 -2,4 -2,1 0,8 0,6 0,1 0,4
General government gross debt (% of GDP) 67,2 67,1 66,1 60,3 57,7 55,0 51,7 48,9
Tax-to-GDP ratio (%) 33,0 33,4 33,8 33,0 33,6 33,3 33,4 33,4
Tax rate for a single person earning the average wage (%) 17,9 17,5 19,5 19,2 . . . .
Tax rate for a single person earning 50% of the average wage (%) 8,3 8,6 10,0 10,0 . . . .
forecast

12
Progress with the implementation of the
recommendations addressed to Malta in 2017(8)
has to be seen in a longer term perspective since
the introduction of the European Semester in
2011. Looking at the multi-annual assessment of
the implementation of the CSRs since these were
first adopted, 87 % of all the CSRs addressed to
Malta have recorded at least 'some progress'. 13 %
of these CSRs recorded 'limited' or 'no progress'
(see Graph 2.1). Substantial progress and full
implementation have been achieved in the area of
fiscal policy and fiscal governance as well as in
several areas of the labour market. Other areas
with substantial progress have been the business
environment and the energy sector.
Graph 2.1: Overall multiannual implementation of 2011-
2017 CSRs to date
* The overall assessment of the country-specific
recommendations related to fiscal policy excludes
compliance with the Stability and Growth Pact.
** The multiannual CSR assessment looks at the
implementation since the CSRs were first adopted until the
2018 Country Report.
Source: European Commission
Public finances have improved since Malta’s
accession to the EU. The budget balance has
exhibited various trends since Malta’s accession to
the EU, leading to the opening of three excessive
deficit procedures. As a result, the budget deficit
averaged at 3.2 % of GDP in 2004-12. From 2013,
a continuing improvement in the budgetary
situation took place, leading to a budget surplus of
1.1 % of GDP in 2016. The medium-term
objective was achieved three years ahead of
schedule. In the same year, the government debt
fell below the 60 %-of-GDP threshold. The
improvement in the fiscal position was the result of
both budgetary measures implemented in the
(8) For the assessment of other reforms implemented in the
past, see in particular section 3.
recent years and a strengthening of revenues,
supported by favourable macroeconomic
conditions. Conversely, there has been limited
progress in improving the sustainability of public
finances.
Substantial progress has been made in recent
years in diversifying the energy mix. Significant
efforts have been targeted at upgrading the energy
infrastructure, including switching electricity
production from oil to natural gas. Important
measures in this area include the gasification of the
Maltese power plants and the completion of the
electricity interconnector with Italy. Nevertheless,
progress is still limited as regards improving
energy efficiency, increasing energy production
from renewable sources and reducing greenhouse
gas emissions, in particular in the transport sector.
The business environment is improving and
judicial reforms are ongoing, although
inefficiencies remain in some areas. While the
numbers of days to start a business have
diminished and the length of public procurement
procedures was reduced, the justice system
continues to face a number of challenges and
recent improvements to the insolvency framework
still need to be translated into practical effects.
Various initiatives have been put in place to
improve access to finance for SMEs, including the
set-up of the Malta Development Bank. Substantial
improvements were achieved in reducing the
length of public procurement procedures.
Some progress was also achieved in improving
human capital development. This was partly
achieved by reducing early school leaving, and
incentivising the professional development of
teachers. The authorities have also improved skills
governance and participation in adult learning.
Skill levels appear low, as it may take time before
achievements can be seen in key outcome
indicators. Substantial progress has been made on
policies to improve the work-life balance and
"make work pay" which has helped to lower the
gender employment gap, although it remains
substantial.
No Progress3% Limited Progress
10%
Some Progress45%
Substantial Progress
19%
Full Implementation
23%
Malta - Level of implementation today of 2011-2017 CSRs
2. PROGRESS WITH COUNTRY-SPECIFIC RECOMMENDATIONS

2. Progress with country-specific recommendations
13
Malta has made some (9) progress in addressing
the 2017 country-specific recommendations.
There has been some progress expanding the scope
of the ongoing spending reviews to the broader
public sector and in introducing performance-
based public spending. This also contributes to
addressing issues from the 2017 Council
Recommendation for the Euro Area on improving
the composition of public finances. The authorities
have made some progress in ensuring the effective
national supervision of internationally oriented
business by financial institutions licensed in Malta
by strengthening cooperation with the host
supervisors in the countries where they operate.
This is in line with the Euro Area
Recommendation to address viability risks within
the banking sector.
European Structural and Investment (ESI) Funds
are important in addressing key challenges to
inclusive growth and convergence in Malta,
notably by boosting investment in R&D and
innovation and - through their conditionalities –
ensuring the timely transposition of public
procurement and environment directives. ESI
Funds also help improve the relevance of
education and training so as to match skills supply
to labour market needs, they support the
(9) Information on the level of progress and actions taken to
address the policy advice in each respective subpart of a
CSR is presented in the Overview Table in the Annex. This
overall assessment does not include an assessment of
compliance with the Stability and Growth Pact.
participation of low skilled in learning
programmes and the reducing of the number of
people living at risk of poverty (see also Box 2.2).
Member States can request from the
Commission technical support to prepare,
design, and implement growth-enhancing
structural reforms. The Structural Reform
Support Service (SRSS) provides, in cooperation
with the relevant Commission services, tailor-
made technical support, which does not require co-
financing and is provided at a Member State’s
request. The support addresses priorities identified
in the context of the EU economic governance
process (i.e., implementation of country-specific
recommendations), but the scope of the SRSS
support is wider as it can also cover reforms linked
to other Commission priorities, or reforms
undertaken at the initiative of Member States.
Malta has requested technical support from the
SRSS to help implement reforms in various
areas such as: public administration, growth
and the business environment, public financial
management, and the financial sector. In
particular, the SRSS provides support in
implementing spending reviews, introducing
accrual accounting standards, developing a
national energy and climate plan, and designing a
policy framework for promoting alternative fuel
infrastructure in transport.

2. Progress with country-specific recommendations
14
Box 2.1: CSR implementation table
Malta Overall assessment of progress with 2017 CSRs: Some progress
CSR 1: Expand the scope of the ongoing spending reviews to the broader public sector and introduce performance-based public spending.
Some progress in expanding the scope of the ongoing spending reviews to the broader public sector.
CSR 2: Ensure the effective national supervision of internationally oriented business by financial institutions licensed in Malta by strengthening cooperation with the host supervisors in the countries where they operate.
Some progress on ensuring the effective national supervision of internationally oriented business by financial institutions licensed in Malta.

2. Progress with country-specific recommendations
15
Box 2.2: Tangible results delivered through EU support to structural change in Malta
Malta is a beneficiary of European Structural and Investment Funds (ESI Funds) support
with an allocation of up to EUR 828 million until 2020. This represents around 1 % of GDP
annually over the period 2014-18 and 28 % of public investment (1). By end-2017, an estimated
EUR 402 billion (49 % of the total) was allocated to projects on the ground. In this context, over
2 900 firms have been selected to receive support for new productive investments; almost 240 jobs
have been created with the above investments; improvement in road infrastructures has been
achieved with new roads constructed and upgraded, such as the Kappara junction, which is part of
the main EU road network (Ten T). Out of the EU financing EUR 34 million is planned to be
delivered via financial instruments, which is more than a three-fold increase compared to the 2007-
13 period. Malta also contributes EUR 15 million to the SME initiative which has proved to be
very successful, with an implementation rate of 100 %.
ESI Funds help address structural policy challenges and implement country-specific
recommendations. ESI Funds address main structural obstacles to growth and competitiveness by
contributing to improving the effectiveness of the justice system, the increase of the proportion of
GDP invested in R&I, from 0.72 % to at least 2 %. They also contribute to increasing employment
to 70 % of the working age population. A substantial number of measures taken in response to
Malta’s challenges and related CSR are co-financed by the European Social Fund projects, in
particular on the relevance of education and training and on the need to reduce early school
leaving. For example, the Youth Guarantee 2.0 and the Access to Employment projects address the
quality of labour supply and the participation of low skilled in learning programmes. Other
measures contribute to reducing the number of people that face poverty-or-social-exclusion risks.
Various reforms were undertaken already as precondition for ESI Funds support (2). These
include the timely transposition of public procurement and environment directives, as well as
structural reforms in the areas of research, development and innovation, transport infrastructure,
education, employment and social inclusion, water supply including agricultural purposes. The
contribution of JASPERS was pivotal in developing the internal capacity for maintaining,
operating and updating the National Transport Model, with forecasting models up until 2025 and
2050 to facilitate the implementation of more sustainable and efficient mobility measures. Smart
specialisation strategies spur and coordinate innovation investments between public and private
sectors, and transport plans provide a coherent framework. These reforms prepared the ground for
better implementation of public investment projects in general, including those financed from
national sources and from other EU instruments.
Malta is advancing the take up of the European Fund for Strategic Investments (EFSI). As of
December 2017, overall financing volume of operations approved under the EFSI amounted to
EUR 11 million, which is expected to trigger total private and public investment of EUR 34
million. More specifically, 1 multi-country project involving Malta has been approved so far under
the Infrastructure and Innovation Window, amounting to EUR 5 million in EIB financing under
the EFSI. It concerns the RDI sector and is expected to trigger about EUR 17 million in
investments. Under the SME Window, 1 agreement with financial intermediaries has been
approved so far. European Investment Fund financing enabled by the EFSI amounts to EUR 6
million, which is expected to mobilise approximatively EUR 17 million in total investment.
Funding under Horizon 2020, the Connecting Europe Facility and other directly managed
EU funds is additional to the ESI Funds. By the end of 2017, Malta has signed agreements for
EUR 45 million for projects under the Connecting Europe Facility.
https://cohesiondata.ec.europa.eu/countries/MT
(1) Public investment is defined as gross fixed capital formation + investment grants + national expenditure on agriculture
and fisheries.
(2) Before programmes are adopted, Member States are required to comply with a number of so-called ex-ante
conditionalities, which aim at improving conditions for the majority of public investments areas.

16
3.1.1. RECENT DEVELOPMENTS IN FISCAL
BALANCES AND MAIN DRIVERS
The fiscal situation has improved markedly. In
2016 Malta moved from a deficit to a surplus
position, both in nominal and in structural terms.
Also the debt ratio fell below the 60 %–of–GDP
threshold. This improvement was the result of both
budgetary measures implemented in recent years
and favourable macroeconomic conditions.
Some fiscal revenues remain difficult to predict.
The general government balance has benefitted
from the revenue from a particular budget measure
i.e. the Individual Investor Programme (IIP),
which was introduced in 2014. The proceeds
related to this programme are estimated to have
reached 4.3 % of GDP cumulatively in 2014-17.
But it is difficult to predict the outcome of this
measure in the medium term, since it is not linked
to any macroeconomic development.
Graph 3.1.1: General government balance and the impact
of the Individual Investor Programme (% of
GDP)
Source: European Commission
At the same time, current expenditure was
relatively dynamic. At 37.9 % of GDP in 2016,
total public spending appears low compared to the
euro area average of 47.6 %. But Malta had one of
the highest growth rates in public expenditure in
the EU over the last three years (at 5.6 % vs 1.5 %
in the EU). This high growth rate in public
spending was partly due to increased public
investment related to the absorption of EU funds in
2015. Nevertheless, current expenditure was also
very dynamic in the last three years, with a growth
rate of 6.0 %, against 1.8 % in the EU.
Graph 3.1.2: Average growth 2013-2016 of total current
expenditure per inhabitants
Government outlays are measured in purchasing power
parity to take account of the different level of prices across
countries.
Source: European Commission
Expenditure per capita is growing fast,
especially for health and education. While the
level of public expenditure per capita in Malta is
below the EU average, its growth rate is one of the
highest in the EU in the last three years (Graph
3.1.2). The functions where expenditure per
inhabitants has increased most are health and
education. In the long run, these sectors will also
face pressure from the ageing population, thus
putting additional pressure on the expenditure
dynamic (see below). Growth rates above the EU
average have been registered also for economic
affairs and general public services, while social
protection expenditure is growing at a moderate
pace.
Malta has largely achieved fiscal consolidation
without penalising public investment, albeit the
latter is low compared to peer countries. After
-4
-3
-2
-1
0
1
2
12 13 14 15 16 17
General government balance
General government balance without Individual InvestorProgramme
-1
0
1
2
3
4
5
6
RO
LV
EE
LT
MT
PL
SK
HR
BG
CZ
DE
SI
FR
AT
EU
-28
EA
-19
LU
HU
ES
BE
IT UK
SE
EL
FI
DK
PT
CY
IE NL
3. REFORM PRIORITIES
3.1. PUBLIC FINANCES AND TAXATION
3.1. Public finances and taxation
17
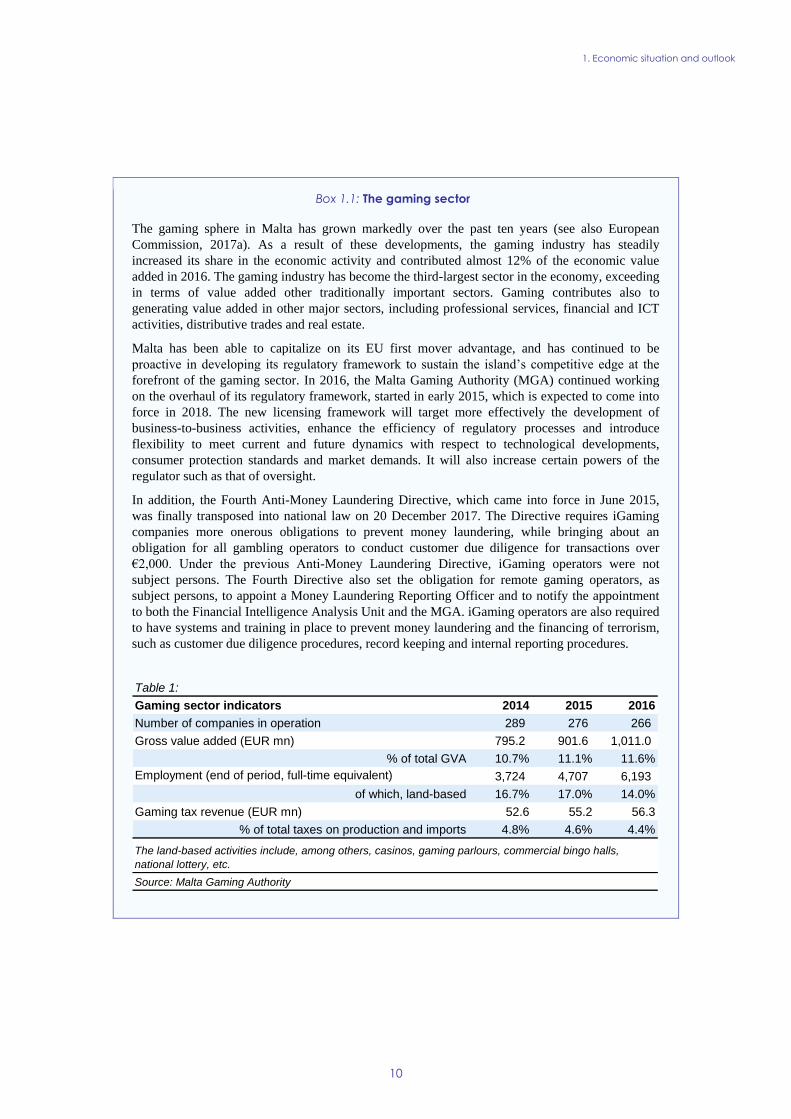
declining to 2.2 % of GDP in 2010, government
investment increased to 4.3 % of GDP in 2015,
reflecting also the necessity to shield EU-funded
projects from cuts, which account for a large share
of public investment. However, in 2016 it fell
significantly to 2.5 % of GDP and it is projected to
increase only marginally in 2017, due also to the
beginning of the new programming period and
despite the accumulation of funds in the National
Development and Social Fund (10) related to the
IIP. As a result, public investment accounted for
3.5 % of GDP on average in 2014-16, above the
EU average of 2.8 % (EA: 2.7 % of GDP), but one
of the lowest among peer countries (small Member
States).
Graph 3.1.3: Gross fixed capital formation in 2012 and 2016
(% of GDP)
Source: European Commission
3.1.2. TAXATION
Malta’s tax system increasingly relies on
corporate income tax. In 2016, Malta had an
overall tax-to-GDP ratio of 32.7 %, well below the
EU average of 38.9 % (11) (European Commission,
forthcoming). While the share of taxes on
production and imports is in line with the EU
(10) The National Development and Social Fund was
established in 2015 and is expected to receive 70% of the
contributions paid by the IIP applicants. The funds it
receives must be used in the public interest, including on
education, research, innovation, social purposes, justice
and the rule of law, employment initiatives, the
environment and public health.
(11) Tax-to-GDP ratio differs from what indicated in Table 1.1
as voluntary actual social contributions are not included.
average, the share of taxes on individual income is
lower than the EU average. Social contributions
(5.5% of GDP) represent a relatively small portion
of tax revenue (against 12.1% in the EU). In
proportion to GDP, corporate income tax revenues
(6.5%) are the highest in the EU and 2.5 times the
EU average (2.6%). Malta’s corporate income tax
to GDP ratio has increased by 2.8 pps. from 2005
to 2016 (from 3.7% to 6.5%), against a decrease of
0.3 pps. on average in the EU. Corporate taxation
therefore stands out as an important and growing
source of tax revenue for Malta. Malta’s narrow
tax base, combined with its tax compliance and
planning challenges (see below), could adversely
affect the country's fiscal position in the case of
economic shocks or international corporate income
tax reforms.
Malta has proposed a measure to address its
relatively high corporate debt bias. Debt
financing seems encouraged in Malta by the
corporate tax advantage offered on debt over
equity. As a result, Malta has one of the highest
debt-equity biases (3.8 %) in the EU (12), and has
made no progress in addressing it in recent
years (13). Some steps have been taken to reduce
the bias, like the Notional Interest Deduction
(NID) regime (available from 2018), which is
expected to make equity financing more attractive.
In particular, it will allow companies and foreign
companies with permanent establishments in Malta
to claim a deduction on their equity against their
tax base. The deduction will be capped at 90 % of
the tax base and any excess may be carried
forward to be deducted in future years. The 90 %
cap may be problematic for young companies, as
they tend to accumulate early-year losses. The
scheme also contains features which could have a
high impact on budget revenues: it applies to all
equity, which gives a windfall for pre-existing
investments; and the scope of risk capital is broad
and the current notional return rate is high, at about
7 % (14).
(12) To be break even, an investment financed by debt needs to
earn a 3.8 % lower return than an equity-financed
investment.
(13) Malta provides a full imputation system, which is not
reflected in this data. This may partially offset the
corporate debt bias.
(14) The 7% consists of (i) the risk-free rate on the current yield
to maturity for government stocks with a remaining term of
approximately 20 years – which is currently around 2 %,
and (ii) a 5 % risk premium.
0
1
2
3
4
5
6
7
EE CY LV LU MT EU28
2012 2016
3.1. Public finances and taxation
18
Some indicators continue to suggest that the
country’s corporate tax rules are used by
companies that engage in aggressive tax
planning. As shown in a study, Malta’s high
inward and outward FDI stock (15) is only partly
explained by real economic activities taking place
in the country (16). The high level of dividend,
interest and royalty payments (17) as a percentage
of GDP continue to suggest that the country’s tax
rules are used by companies to engage in
aggressive tax planning. Companies might choose
to invest in Malta to benefit from these corporate
tax rules. The large majority of FDI is held by
'Special Purpose Entities' (18). The absence of
withholding taxes on dividends, interest and
royalty payments made by Malta based companies
may lead to those payments escaping tax
altogether, if they are also not subject to tax in the
recipient country. This may facilitate aggressive
tax planning19. While Malta’s new NID regime
will help to reduce the debt equity bias, the current
anti-avoidance provisions included in the law are
not detailed or strong enough. For example, the
NID regime includes neither comprehensive anti-
earnings stripping nor adequate anti-cascading
rules. This lack of strong anti-abuse rules,
combined with the high return rate and not-
incremental system of the regime, may provide
opportunities for tax avoidance, thus pointing to
the need to closely monitor the effectiveness of
these anti-avoidance rules. The existence of some
provisions in bilateral tax treaties between Malta
and other EU Member States, coupled with the
Malta’s tax system, where a company being a
resident but not domiciled in Malta is taxed on
(15) In 2016, the level of inward and outward foreign direct
investment (FDI) stock amounted respectively to 1626%
and 626% of GDP (among the 5 highest in the EU).
(16) IHS (2018). Aggressive Tax Planning indicators
forthcoming in Taxation Papers.
(17) The flows of dividends paid (calculated as net income on
FDI) amounted to 86.3 % of GDP (the 2nd highest in the
EU). The royalties paid and received in 2016 amounted
respectively to 2.9 % of GDP and 4.5 % of GDP (the 4th
highest in the EU).
(18) The share of inward and outward FDI stock held by
'Special Purpose Entities' amounted respectively to 96%
and 98% of GDP in 2016. A special purpose entity is a
legal entity that has little or no employment, operations or
physical presence in the jurisdiction where it is located. It
is related to another corporation, often as its subsidiary, and
is typically located in another jurisdiction. 19 For more information on the interaction between
withholding tax and aggressive tax planning structures, see
ZEW (2016), the Impact of Tax Planning on Forward-
Looking Effective Tax Rates, Taxation papers 64.
source and remittance basis, may be used by
companies to engage in tax avoidance practices.
Malta has taken measures to amend some
aspects of the tax system that were facilitating
tax planning. The Code of Conduct on Business
Taxation Group has approved the closure of the
old patent box, to align it with international
developments. However, it is subject to a
grandfathering clause that lasts until June 2021.
While the economic evidence on the effectiveness
of patent boxes as a means to encourage R&D
remains limited (CPB, 2014), they may be used as
tax competition tools (Alstadsæter et. al, 2017).
Finally, the provisions of the EU Anti-Tax
Avoidance Directives (ATAD) will have to be
transposed into national law by the end of 2018
and 2019. The directives will introduce new anti-
abuse rules (20). It will be important to assess to
what extent this change, in conjunction with the
effect of the transposition of the ATAD, will limit
the scope for aggressive tax planning in Malta.
Improving VAT tax compliance remains a
challenge, but significant progress has been
made. Malta recently experienced its biggest
decline in the VAT gap (21). In 2015, as a result of
a 17 % decline in VAT total tax liability, there was
a considerable drop in the VAT gap – to 23 %
from 40 % the previous year. The fall is due
mostly to the impact on the e-gambling regime of
the introduction of the new Mini One Stop Shop
regime (MOSS) (22) introduced in 2015 in
accordance with EU law. However, the VAT gap
remains well above EU average (13 %).
The 2018 budget introduces measures to fight
tax evasion. The authorities aim to fight tax
evasion and unfair competition by increasing
penalties for agreements settled both in and out of
court. And the Joint Enforcement Task Force is
expected to continue fighting tax evasion, also by
increasing the number of inspectors.
(20) Such as CFC rules, interest limitation rules and rules
countering hybrid mismatches.
(21) The VAT gap is the difference between the amount of tax
actually collected and the theoretical net VAT liability for
the economy, under the country’s current VAT system.
(22) The MOSS scheme changed the way VAT was invoiced
for exported electronic services, obliging VAT from
electronic services to be paid to the country where the
customer was resident.
3.1. Public finances and taxation
19
3.1.3. FISCAL FRAMEWORK AND EXPENDITURE
REVIEW
Public finances have also benefited from the
strengthening of the fiscal framework brought
about by the Fiscal Responsibility Act. One of
the new features of the 2014 Fiscal Responsibility
Act was the creation of Malta’s Fiscal Advisory
Council (MFAC), whose members were nominated
in January 2015 (see European Commission,
2017a). The Council is already a firm fixture in the
public debate on fiscal developments. Up to now,
it has expressed broad endorsement of the
government’s forecasts and assessed positively the
compliance with national fiscal rules. But despite
those positive opinions, the Council regularly
appealed to the government to rigorously execute
its budgetary strategy. It also drew attention to the
volatility of population projections and the related
risk in assessing the long-term sustainability of
public finances. Since the Council’s early years of
operation have coincided with fairly benign
macroeconomic and fiscal developments, its
effectiveness is yet to be tested in hard economic
times.
The expenditure review is ongoing. The
authorities started an expenditure review in 2014
in three areas of public spending that are
particularly relevant for fiscal sustainability: social
security, health and education. In 2017, the review
programme focused on other services within the
Ministry for Health, including the Ministry itself,
Primary Care Services, Pharmacy Of Your Choice
and the Contracts Procurement Services Unit. Each
review ended with the publication of a report
which included recommendations, some of which
have been already implemented (mainly for the
first two reviews) and some of which are in the
process of being implemented.
Further initiatives are envisaged both in the
area of spending review and fiscal framework.
The authorities are planning that a review will be
undertaken at the Management Efficiency Unit and
the Malta College for the Arts, Sciences and
Technology. They are also planning to
institutionalise the spending review function under
a directorate in the Ministry for Finance that deals
with public sector performance and evaluation.
This directorate will also be in charge of
monitoring the recommendations issued in past
years in the three areas covered by the spending
review and will coordinate in the future. If
properly implemented, these initiatives could
contribute towards increased effectiveness in
public spending. The fiscal framework would also
benefit from the planned introduction of accrual
accounting in all government departments. This
project, which in its initial stage will cover only
selected departments, should encompass them all
within 30 months. Once finalised, the new system
should generate a much more accurate and
transparent picture of public finances.
3.1.4. FISCAL SUSTAINABILITY
Malta faces medium sustainability risks in the
long term. With government debt below the 60 %-
of-GDP threshold, Malta does not face significant
fiscal risks over the short or the medium term.
However, according to the Commission’s long-
term sustainability gap indicator (the S2
indicator (23)), Malta appears to be at medium risk
in the long term. Risks to long-term sustainability
are driven entirely by the projected cost of
population ageing (5.0 pps of GDP), particularly
higher expenditure on healthcare and long-term
care (2.9 pps. of GDP), but also higher pension
expenditure (1.8 pps. of GDP).
Pension system
The long term sustainability of the pension
system has improved. Mainly thanks to a more
positive assessment of Malta’s long-term growth
potential, the long-term sustainability prospects for
pension expenditure have improved. However, the
measures introduced in the 2016 budget had only a
limited impact on long term sustainability, and this
remains a challenge in Malta.
Measures to improve pension adequacy
continued, but the gender coverage gap in
pensions remains high. Last year's fiscal reform
introduced substantial tax exemptions on pensions.
Efforts towards improved adequacy continue e.g.
with upward adjustments and further fiscal
reforms. Nevertheless, in 2016 the risk of poverty
and social exclusion increased to 26.1 % (2.4 pps)
(23) The S2 indicator measures the upfront adjustment to the
current structural primary balance that is required to
stabilise debt-to-GDP ratio over the infinite horizon, taking
into account any additional expenditure arising from an
ageing population.

3.1. Public finances and taxation
20
for elderly people, against very dynamic work
incomes (see section 3.3). Malta’s 26 pps gender
coverage gap (EU average 5 %) for pensioners
above 65 years remains (24) one of the highest in
the EU. The lower economic activity of women in
earlier decades has led to poor pension coverage
for older cohorts. The authorities envisage changes
to National Insurance contributions seeking to
redress the situation of low contributions by
women in particular (25).
Healthcare and long-term care system
Indicators on health outcomes have improved
and waiting times are being reduced. The
performance of the health system has improved, as
evidenced by high life expectancy, amenable and
preventable mortality rates below the EU average
and generally low levels of unmet need. Access to
innovative medicines, mainly for cancer treatment,
was improved by introducing clinical pathways
and innovative procurement strategies. In addition,
waiting times for surgical interventions and
diagnostics are being tackled thanks to an
increased capacity and commissioning of some
services from the private sector. Nevertheless,
some risk factors may have a negative impact on
fiscal sustainability in the future. In particular,
rising obesity levels pose a significant challenge to
public health (IHME, 2016).
Challenges remain in the redistribution of
resources and activities from hospital to
primary care, and in access to innovative
medicines. The institutional setting of primary
healthcare provision puts pressure on both hospital
and emergency care, also making the management
of care for patients with chronic conditions more
complex. Hospital and primary care are not well
coordinated, emergency care remains inefficiently
used, thus not improving the efficiency of the
health system nor reducing pressure on its long-
term sustainability. Finally, access to innovative
medicines remains a major challenge, also in
(24) Measuring the gap between the proportions of men and
women who are entitled to a pension.
(25) Contributory and non-contributory pensions, for the 3rd
year running, will be increased. Increasing further the tax
exemption ceiling was announced (2018 budget).
Redressing low National Insurance contributions will take
into account contributions made after age 65 and, will be
pro-rata, instead of full-rate, on net incomes of those retired
before 65 years working part-time or self-employed.
budgetary terms (OECD/European Observatory on
Health Systems and Policies, 2017).
Initiatives are being undertaken to cater for
growing demand in the long-term care system.
Due to the increasing demand for long-term care,
the government is incentivising community-based
and home care, which are considered cheaper than
institutional or hospital care. Better coordination
between the health sector and the social sector
would also help the sustainability in the long-term.
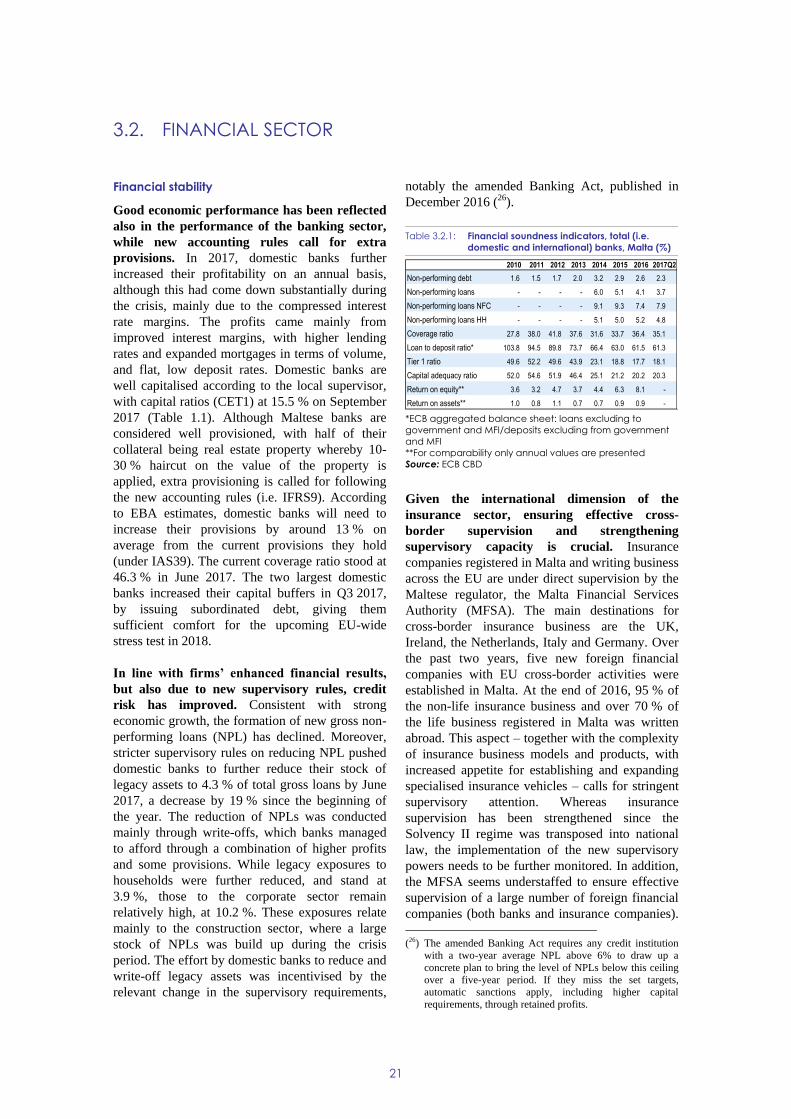
21
Financial stability
Good economic performance has been reflected
also in the performance of the banking sector,
while new accounting rules call for extra
provisions. In 2017, domestic banks further
increased their profitability on an annual basis,
although this had come down substantially during
the crisis, mainly due to the compressed interest
rate margins. The profits came mainly from
improved interest margins, with higher lending
rates and expanded mortgages in terms of volume,
and flat, low deposit rates. Domestic banks are
well capitalised according to the local supervisor,
with capital ratios (CET1) at 15.5 % on September
2017 (Table 1.1). Although Maltese banks are
considered well provisioned, with half of their
collateral being real estate property whereby 10-
30 % haircut on the value of the property is
applied, extra provisioning is called for following
the new accounting rules (i.e. IFRS9). According
to EBA estimates, domestic banks will need to
increase their provisions by around 13 % on
average from the current provisions they hold
(under IAS39). The current coverage ratio stood at
46.3 % in June 2017. The two largest domestic
banks increased their capital buffers in Q3 2017,
by issuing subordinated debt, giving them
sufficient comfort for the upcoming EU-wide
stress test in 2018.
In line with firms’ enhanced financial results,
but also due to new supervisory rules, credit
risk has improved. Consistent with strong
economic growth, the formation of new gross non-
performing loans (NPL) has declined. Moreover,
stricter supervisory rules on reducing NPL pushed
domestic banks to further reduce their stock of
legacy assets to 4.3 % of total gross loans by June
2017, a decrease by 19 % since the beginning of
the year. The reduction of NPLs was conducted
mainly through write-offs, which banks managed
to afford through a combination of higher profits
and some provisions. While legacy exposures to
households were further reduced, and stand at
3.9 %, those to the corporate sector remain
relatively high, at 10.2 %. These exposures relate
mainly to the construction sector, where a large
stock of NPLs was build up during the crisis
period. The effort by domestic banks to reduce and
write-off legacy assets was incentivised by the
relevant change in the supervisory requirements,
notably the amended Banking Act, published in
December 2016 (26).
Table 3.2.1: Financial soundness indicators, total (i.e.
domestic and international) banks, Malta (%)
*ECB aggregated balance sheet: loans excluding to
government and MFI/deposits excluding from government
and MFI
**For comparability only annual values are presented
Source: ECB CBD
Given the international dimension of the
insurance sector, ensuring effective cross-
border supervision and strengthening
supervisory capacity is crucial. Insurance
companies registered in Malta and writing business
across the EU are under direct supervision by the
Maltese regulator, the Malta Financial Services
Authority (MFSA). The main destinations for
cross-border insurance business are the UK,
Ireland, the Netherlands, Italy and Germany. Over
the past two years, five new foreign financial
companies with EU cross-border activities were
established in Malta. At the end of 2016, 95 % of
the non-life insurance business and over 70 % of
the life business registered in Malta was written
abroad. This aspect – together with the complexity
of insurance business models and products, with
increased appetite for establishing and expanding
specialised insurance vehicles – calls for stringent
supervisory attention. Whereas insurance
supervision has been strengthened since the
Solvency II regime was transposed into national
law, the implementation of the new supervisory
powers needs to be further monitored. In addition,
the MFSA seems understaffed to ensure effective
supervision of a large number of foreign financial
companies (both banks and insurance companies).
(26) The amended Banking Act requires any credit institution
with a two-year average NPL above 6% to draw up a
concrete plan to bring the level of NPLs below this ceiling
over a five-year period. If they miss the set targets,
automatic sanctions apply, including higher capital
requirements, through retained profits.
2010 2011 2012 2013 2014 2015 2016 2017Q2
Non-performing debt 1.6 1.5 1.7 2.0 3.2 2.9 2.6 2.3
Non-performing loans - - - - 6.0 5.1 4.1 3.7
Non-performing loans NFC - - - - 9.1 9.3 7.4 7.9
Non-performing loans HH - - - - 5.1 5.0 5.2 4.8
Coverage ratio 27.8 38.0 41.8 37.6 31.6 33.7 36.4 35.1
Loan to deposit ratio* 103.8 94.5 89.8 73.7 66.4 63.0 61.5 61.3
Tier 1 ratio 49.6 52.2 49.6 43.9 23.1 18.8 17.7 18.1
Capital adequacy ratio 52.0 54.6 51.9 46.4 25.1 21.2 20.2 20.3
Return on equity** 3.6 3.2 4.7 3.7 4.4 6.3 8.1 -
Return on assets** 1.0 0.8 1.1 0.7 0.7 0.9 0.9 -
3.2. FINANCIAL SECTOR
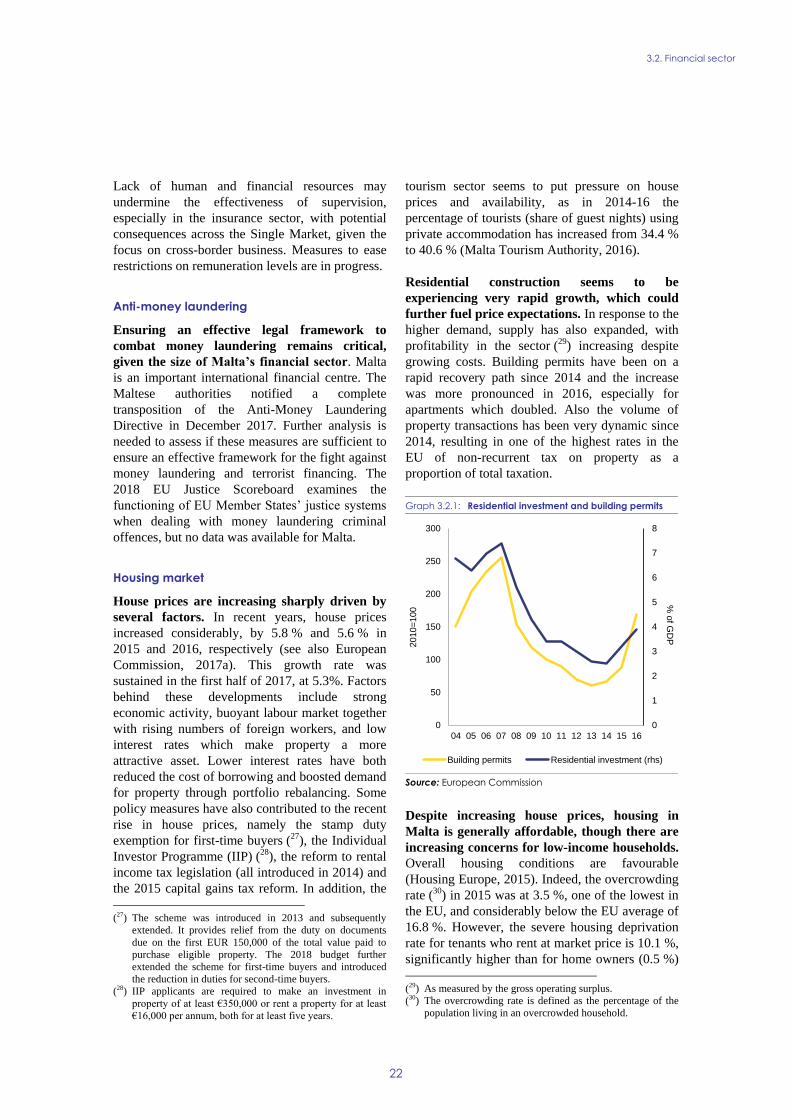
3.2. Financial sector
22
Lack of human and financial resources may
undermine the effectiveness of supervision,
especially in the insurance sector, with potential
consequences across the Single Market, given the
focus on cross-border business. Measures to ease
restrictions on remuneration levels are in progress.
Anti-money laundering
Ensuring an effective legal framework to
combat money laundering remains critical,
given the size of Malta’s financial sector. Malta
is an important international financial centre. The
Maltese authorities notified a complete
transposition of the Anti-Money Laundering
Directive in December 2017. Further analysis is
needed to assess if these measures are sufficient to
ensure an effective framework for the fight against
money laundering and terrorist financing. The
2018 EU Justice Scoreboard examines the
functioning of EU Member States’ justice systems
when dealing with money laundering criminal
offences, but no data was available for Malta.
Housing market
House prices are increasing sharply driven by
several factors. In recent years, house prices
increased considerably, by 5.8 % and 5.6 % in
2015 and 2016, respectively (see also European
Commission, 2017a). This growth rate was
sustained in the first half of 2017, at 5.3%. Factors
behind these developments include strong
economic activity, buoyant labour market together
with rising numbers of foreign workers, and low
interest rates which make property a more
attractive asset. Lower interest rates have both
reduced the cost of borrowing and boosted demand
for property through portfolio rebalancing. Some
policy measures have also contributed to the recent
rise in house prices, namely the stamp duty
exemption for first-time buyers (27), the Individual
Investor Programme (IIP) (28), the reform to rental
income tax legislation (all introduced in 2014) and
the 2015 capital gains tax reform. In addition, the
(27) The scheme was introduced in 2013 and subsequently
extended. It provides relief from the duty on documents
due on the first EUR 150,000 of the total value paid to
purchase eligible property. The 2018 budget further
extended the scheme for first-time buyers and introduced
the reduction in duties for second-time buyers.
(28) IIP applicants are required to make an investment in
property of at least €350,000 or rent a property for at least
€16,000 per annum, both for at least five years.
tourism sector seems to put pressure on house
prices and availability, as in 2014-16 the
percentage of tourists (share of guest nights) using
private accommodation has increased from 34.4 %
to 40.6 % (Malta Tourism Authority, 2016).
Residential construction seems to be
experiencing very rapid growth, which could
further fuel price expectations. In response to the
higher demand, supply has also expanded, with
profitability in the sector (29) increasing despite
growing costs. Building permits have been on a
rapid recovery path since 2014 and the increase
was more pronounced in 2016, especially for
apartments which doubled. Also the volume of
property transactions has been very dynamic since
2014, resulting in one of the highest rates in the
EU of non-recurrent tax on property as a
proportion of total taxation.
Graph 3.2.1: Residential investment and building permits
Source: European Commission
Despite increasing house prices, housing in
Malta is generally affordable, though there are
increasing concerns for low-income households.
Overall housing conditions are favourable
(Housing Europe, 2015). Indeed, the overcrowding
rate (30) in 2015 was at 3.5 %, one of the lowest in
the EU, and considerably below the EU average of
16.8 %. However, the severe housing deprivation
rate for tenants who rent at market price is 10.1 %,
significantly higher than for home owners (0.5 %)
(29) As measured by the gross operating surplus.
(30) The overcrowding rate is defined as the percentage of the
population living in an overcrowded household.
0
1
2
3
4
5
6
7
8
0
50
100
150
200
250
300
04 05 06 07 08 09 10 11 12 13 14 15 16
% o
f GD
P
2010=
100
Building permits Residential investment (rhs)

3.2. Financial sector
23
and also above the EU average (6.4 %). The share
of the population who rent at market prices is
currently relatively low in Malta. Access to
affordable, quality housing might become more
difficult for low-income earners, due to increased
demand for rental housing by new residents and
the already existing waiting lists for social housing
(see also section 3.3).
House prices seem broadly in line with
fundamentals, though recent trends could result
in risks, going forward. The price-to-rent ratio
remains close to its 2007 peak. However, the other
valuation estimates show that the excessive price
growth prior to 2008 has corrected. Overall, these
metrics do not point to significant risks of
overvaluation, although the trend is on the upward
side, thus requiring additional monitoring.
Approximate information on the ratio between
house prices and household income in Malta can
be estimated using the ECB Household Finance
and Consumption Survey. This reflects the number
of years of income per capita needed to buy an
average 100 m2 dwelling, with the value of 10
being the prudential threshold. According to these
data, the ratio of prices to income can be estimated
at around 10 for Malta (31).
(31) See Bricongne, J.-C., P. Pontuch, and A. Turrini
(forthcoming), Assessing House Prices: Insights from
HouseLev, a new dataset of prices in levels, European
Commission Discussion Paper. Calculation using data for
around 3500 transactions in 2012, provided by the Maltese
National Statistical Office is consistent with these findings,
being only 10% below the figure obtained from HFCS.
Graph 3.2.2: Overvaluation gap of house prices
Source: European Commission
Lending to households led to rapid growth in
mortgage lending, mainly at variable rates.
Lending to construction and real estate activities
recovered, in particular in the third quarter of
2017, on the back of positive developments in the
property market. At the same time, mortgage
lending remained buoyant. In recent years, new
mortgages at variable rates have represented
between 70.4 and 98.4 % of the total. A further
rise in interest rates could have some impact on
both households and domestic banks’ balance
sheets, due to their exposure to property-related
loans. In light of this, close monitoring of the
housing market would help prevent possible
adverse developments.
-60
-50
-40
-30
-20
-10
0
10
20
30
40
00
01
02
03
04
05
06
07
08
09
10
11
12
13
14
15
16
Model-based valuations gap
Price to income vs. historical average
Price to rent vs. historical average

24
3.3.1. LABOUR MARKET
On the back of strong economic growth,
Malta’s labour market outcomes have further
improved. The employment rate rose for both
women and men, reaching 71.8 % in Q3 of 2017,
close to the EU average. Activity rates have
continued to rise. The unemployment rate has
reduced further to 4 % in 2017. Long-term
unemployment is very low. Average wage growth
remained moderate despite low unemployment and
increasing labour shortages, but is expected to pick
up in 2018-19 (see Section 1). Labour market
outcomes have improved on the back of strong
economic growth in recent years, supported by a
well-functioning social dialogue. The Malta
Council for Economic and Social Development is
currently being restructured, potentially further
improving social dialogue.
The employment rate for prime age women is
improving but employment rates fall sharply
after the age of 30. The female employment rate
(20-64 years) continued its steady growth to
55.5 % in 2016 but implies a large gender
employment gap, except for women below 30: the
employment rate for women 25-29 years has been
high at 82.9 %. Employment rates drop
considerably for women after 30. By contrast, the
employment rate for men continues to rise or
remains stable above the age of 30, resulting in a
large and growing employment gap from the 30-34
age group onwards. Policies to increase female
labour market participation may so far be more
effective for younger women whereas the
structural change required at older ages is more
challenging.
‘Make work pay’ policies continue to support
female employment, but the sharing of care
responsibilities between women and men
remains unbalanced. The 2018 budget announced
several extensions of the 'make work pay'
measures that could improve work-life balance.
These include income tax rebates for long-term
unemployed women on re-entering work, benefits
and maternity leave for self-employed women,
expanding availability of before and after school
care; leave to care for sick children; financial
incentives for employers to introduce work-life
balance measures. However, fathers still have very
limited entitlement to paid leave (only 1 day of
paternity leave), and parental leave is not
compensated. This often prevents men, generally
main earners, from taking it thereby reinforcing an
imbalance in the share of work and caring
responsibilities between women and men.
Graph 3.3.1: Employment rate by age and sex, 2016
Source: Eurostat – EU Labour Force Survey
Participation by children below 3 years old in
formal childcare remains below EU average.
Despite significant efforts to offer almost
universally free childcare, current take-up is below
EU average and the Barcelona target of 33 %
coverage. (32) Take-up may be linked to female
labour market participation and must be seen in the
context of low education outcomes and high
migrant population, where participation in early
childcare has been associated with improved
outcomes.
The employment rate of people with disabilities
is low. In 2015, the employment rate of people
with disabilities, at 25.8 % (EU average: 47.4 %)
was the lowest in the EU, potentially reflecting the
lack of effectiveness of the measures to support
their employment. Difficulties on the labour
market could be linked to the gap in educational
attainment between people with and without
disabilities (also the largest in the EU), reflecting
partly the difficulties of children with disabilities
in reaching their full education potential.
(32) Administrative data shows an increase in 2014-2017.
0
10
20
30
40
50
60
70
80
90
100
% o
f popula
tion
MT Male MT Female
EU-28 Male EU-28 Female
3.3. LABOUR MARKET, EDUCATION AND SOCIAL POLICIES

3.3. Labour market, education and social policies
25
Box 3.3.1: Monitoring performance in the light of the European Pillar of Social Rights
The European Pillar of Social Rights, proclaimed on 17 November 2017 by the European Parliament, the
Council and the European Commission, sets out 20 principles and rights to benefit citizens in the EU. In light
of the legacy of the crisis and changes in our societies driven by population ageing, digitalisation and new
ways of working, the Pillar serves as a compass for a renewed process of convergence towards better working
and living conditions.
Malta performs relatively well on the indicators of the Social Scoreboard (1) supporting the European
Pillar of Social Rights. The labour market situation is especially good in Malta. Over the year, the
unemployment rate continued to decline to presently favourably low levels. However, Malta has a high
number of early school leavers and low
employment rates for people with disabilities.
Important reforms have significantly increased
female labour market participation especially of
younger women, but the employment rate of
women is still comparatively low.
High early school leaving rates still present
obstacles on ensuring equal opportunities. Efforts to address the high flows of young people
leaving school with low-skill levels and the high
proportion of low-skill levels in the population
have started to bear fruit, but still need to produce
their full effect.
Malta has intensified outreach to
disadvantaged families through well-
coordinated services. Malta's recently
established LEAP centres, with EU funds support,
provide integrated services to families through
holistic and accessible, community services.
These facilitate access for jobseekers and also
identify and reach out to inactive people. These
efforts are in addition to “making work pay”
policies, providing support through free childcare,
in-work benefit and benefit tapering. These all
contribute to reducing inactivity, poverty and
social exclusion. Success is evident through the
strong reduction of inactive NEETs (those young
people neither in education, employment nor
training) and the low proportion of long-term
unemployed
____________________________
1 The Social Scoreboard includes 14 headline indicators, of which 12 are currently used to compare Member States
performance. The indicators "participants in active labour market policies per 100 persons wanting to work" and
"compensation of employees per hour worked (in EUR)" are not used due to technical concerns by Member States. Possible
alternatives will be discussed in the relevant Committees. Abbreviation: GDHI – gross disposable household income.
Early leavers from education
and training (% of population
aged 18-24)
Critical
Gender employment gap Critical
Income quintile ratio (S80/S20) Better than average
At risk of poverty or social
exclusion (in %)Better than average
Youth NEET (% of total
population aged 15-24)Better than average
Employment rate (%
population aged 20-64)Better than average
Unemployment rate (%
population aged 15-74)Better than average
GDHI per capita growth N/A
Impact of social transfers
(other than pensions) on
poverty reduction
On average
Children aged less than 3 years
in formal childcareTo watch
Self-reported unmet need for
medical care Better than average
Individuals' level of digital skills Better than average
Social
protection
and inclusion
Dynamic
labour
markets and
fair working
conditions
Equal
opportunities
and access to
the labour
market
MALTA
Members States are classified according to a statistical methodology agreed with
the EMCO and SPC Committees. The methodology looks jointly at levels and changes
of the indicators in comparison with the respective EU averages and classifies
Member States in seven categories (from "best performers" to "critical situations").
For instance, a country can be flagged as "better than average" if the level of the
indicator is close to EU average but it is improving fast. For methodological details,
please consult the draft Joint Employment Report 2018, COM (2017) 674 final.
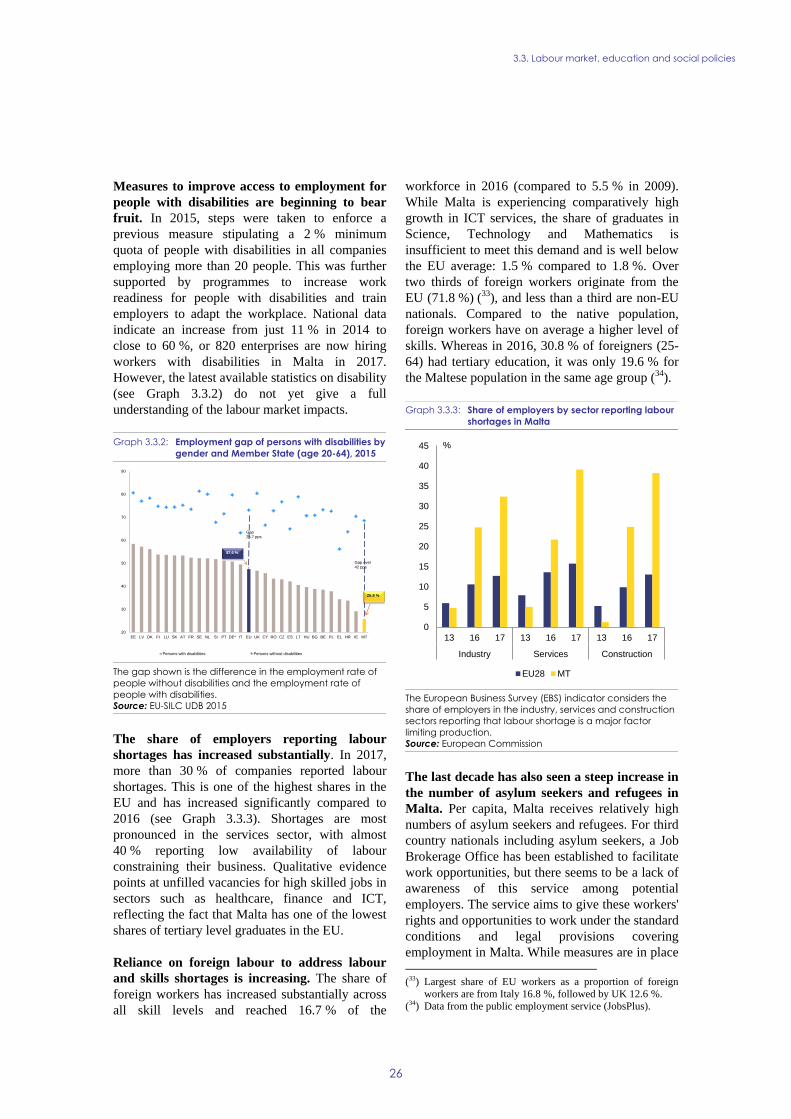
3.3. Labour market, education and social policies
26
Measures to improve access to employment for
people with disabilities are beginning to bear
fruit. In 2015, steps were taken to enforce a
previous measure stipulating a 2 % minimum
quota of people with disabilities in all companies
employing more than 20 people. This was further
supported by programmes to increase work
readiness for people with disabilities and train
employers to adapt the workplace. National data
indicate an increase from just 11 % in 2014 to
close to 60 %, or 820 enterprises are now hiring
workers with disabilities in Malta in 2017.
However, the latest available statistics on disability
(see Graph 3.3.2) do not yet give a full
understanding of the labour market impacts.
Graph 3.3.2: Employment gap of persons with disabilities by
gender and Member State (age 20-64), 2015
The gap shown is the difference in the employment rate of
people without disabilities and the employment rate of
people with disabilities.
Source: EU-SILC UDB 2015
The share of employers reporting labour
shortages has increased substantially. In 2017,
more than 30 % of companies reported labour
shortages. This is one of the highest shares in the
EU and has increased significantly compared to
2016 (see Graph 3.3.3). Shortages are most
pronounced in the services sector, with almost
40 % reporting low availability of labour
constraining their business. Qualitative evidence
points at unfilled vacancies for high skilled jobs in
sectors such as healthcare, finance and ICT,
reflecting the fact that Malta has one of the lowest
shares of tertiary level graduates in the EU.
Reliance on foreign labour to address labour
and skills shortages is increasing. The share of
foreign workers has increased substantially across
all skill levels and reached 16.7 % of the
workforce in 2016 (compared to 5.5 % in 2009).
While Malta is experiencing comparatively high
growth in ICT services, the share of graduates in
Science, Technology and Mathematics is
insufficient to meet this demand and is well below
the EU average: 1.5 % compared to 1.8 %. Over
two thirds of foreign workers originate from the
EU (71.8 %) (33), and less than a third are non-EU
nationals. Compared to the native population,
foreign workers have on average a higher level of
skills. Whereas in 2016, 30.8 % of foreigners (25-
64) had tertiary education, it was only 19.6 % for
the Maltese population in the same age group (34).
Graph 3.3.3: Share of employers by sector reporting labour
shortages in Malta
The European Business Survey (EBS) indicator considers the
share of employers in the industry, services and construction
sectors reporting that labour shortage is a major factor
limiting production.
Source: European Commission
The last decade has also seen a steep increase in
the number of asylum seekers and refugees in
Malta. Per capita, Malta receives relatively high
numbers of asylum seekers and refugees. For third
country nationals including asylum seekers, a Job
Brokerage Office has been established to facilitate
work opportunities, but there seems to be a lack of
awareness of this service among potential
employers. The service aims to give these workers'
rights and opportunities to work under the standard
conditions and legal provisions covering
employment in Malta. While measures are in place
(33) Largest share of EU workers as a proportion of foreign
workers are from Italy 16.8 %, followed by UK 12.6 %.
(34) Data from the public employment service (JobsPlus).
20
30
40
50
60
70
80
90
EE LV DK FI LU SK AT FR SE NL SI PT DE* IT EU UK CY RO CZ ES LT HU BG BE PL EL HR IE MT
Persons with disabilities Persons without disabilities
47.4 %
25.8 %
Gap25.7 pps
Gap over 42 pps
0
5
10
15
20
25
30
35
40
45
13 16 17 13 16 17 13 16 17
Industry Services Construction
%
EU28 MT

3.3. Labour market, education and social policies
27
to facilitate their recruitment, there are indications
that certain third country migrants may not fully
benefit from standard rights and conditions and
may also encounter discrimination (see FRA,
2017).
3.3.2. EDUCATION AND SKILLS
Despite improvement in recent years, the early
school leaving (ESL) rate continues to be a
challenge. In 2016, Malta had one of the highest
ESL rate (19.6 %) in the EU and is still far from
reaching its ambitious Europe 2020 national target
of 10 %. The rate is considerably higher for men
than for women, and is especially high for people
with disabilities (39.5 % compared to the EU
average of 22 % in 2015). And the gender gap (7.3
pps) is well above the EU average of 3 pps. Malta
is implementing a range of measures designed to
prevent or compensate for early school leaving.
Improvements may be seen in the longer term, but
latest progress has not been impressive.
Learning outcomes are strongly influenced by
socio-economic background and type of school.
Basic skills attainment among young people, as
measured by the OECD’s Programme for
International Student Assessment (PISA), has
improved somewhat between 2009 and 2015, but
remains weak. Fifteen year olds perform below the
EU average, and improvement was only significant
in mathematics. Socio-economic status strongly
influences student performance, as does the type of
school, with ‘independent’ (i.e. private) school
students performing best, followed by church
school pupils and then state school pupils. These
findings were confirmed by the 2015 Trends in
International Mathematics and Science Study
survey of 13-14 year olds.
Vocational education and training (VET)
graduates have good employment outcomes.
The employment rate for VET graduates was one
of the highest in the EU in 2016 (96.2 % against
75 % in the EU). Both the availability and quality
of work-based programmes have increased due to
an enhanced partnership with employers.
However, the proportion of upper secondary
students (ISCED 3) in VET decreased slightly in
2015 to 12.7 % and is far below the EU average of
47.3 %. A standardised legal framework –the
‘Work-based learning and the Apprenticeship Act’
– is currently being finalised.
The tertiary educational attainment rate is
rising steadily but still below the EU average.
The rate for people aged 30-34 increased by 6.4
pps over the last five years, though at 29.8 % in
2016, it remains one of the lowest in the EU. The
gender gap is relatively low, at 5 pps against 9.5
pps in the EU. At the same time, the employment
rate for recent tertiary graduates increased by
almost 4 pps between 2013 and 2015 and, at 97 %,
is one of the highest in the EU, reflecting the
demand for highly educated and skilled labour in
Malta. With two additional Bachelor-awarding
state institutions, Malta now has three such
institutions, the University of Malta, MCAST and
ITS. In April 2017 a public consultation was
launched to create a sustainable framework to
support higher education institutions and to
improve the quality of teaching and learning.
Graph 3.3.4: Early school leaving rate
Source: European Commission
Skills levels and participation in adult learning
are growing but remain quite low. Participation
in adult learning (25-64) slightly increased to
7.5 % in 2016, but is still low compared to the EU
average of 10.8 %. Participation rates are
especially low for the low-skilled, increasing only
modestly to 3 % in 2016, against 4.2 % in the EU.
Efforts to enhance participation in education and
adult learning also aim to improve quality and
relevance to the labour market and should facilitate
implementation of the Council Recommendation
10
15
20
25
30
35
40
07 08 09 10 11 12 13 14 15 16
MT EU-28 ES IT PT

3.3. Labour market, education and social policies
28
on Upskilling Pathways (35). The Continuous VET
(CVET) strategy, supported by the ESF, combines
a comprehensive set of measures including: career
guidance, retraining and up-skilling of workers in
shrinking sectors; and a framework and financial
initiatives for employers to invest in CVET for the
low-skilled (see also European Commission,
2017b).
Measures have been undertaken to improve
skills governance by bringing together
education and the labour market. A high level
National Skills Council was set up in December
2016 and has since identified three priority areas:
work-based learning; digital skills; and research
and development. Moreover, Malta is building a
national framework for the validation of non-
formal and informal learning (36) and a skills
forecasting and anticipation system (37). However,
the impact of these measures will become visible
only in the longer term.
Graph 3.3.5: Participation rate in education and training
(25-64 years), 2016
Source: European Commission
Despite improvements in recent years, Malta's
workforce remains relatively low-qualified. In
2016, Malta still had the highest share of low-
(35) OJ C484, 24.12.2016
(36) The validation system is in place for the following sectors:
automotive, building and construction, hair and beauty,
health and social care (childcare). And steps have been
taken in priority sectors such as hospitality and IT.
(37) Since 2016, Malta (in collaboration with Cedefop) is
developing a skills forecasting model, using a
comprehensive ‘skills anticipation’ review.
qualified adults aged 25-64 (54.8 %) in the EU,
although it was decreasing. Performance on basic
digital skills has improved and is now around the
EU average. To address this issue, the Malta
Communications Authority (MCA) and the
Ministry for Education and Employment offers
children regular coding sessions in schools. For the
elderly, both the MCA and the Malta Information
Technology Agency (MITA) have a number of
projects offering training to boost basic digital
skills. And MITA organises summer work
placements for ICT students.
Recent actions to tailor skills to the needs of
innovative firms are an important step forward.
The launch of several schemes (STEPS grants, the
Reach High postdoctoral grant scheme), coupled
with increased public expenditure in tertiary
education (see European Commission, 2018a) and
improved entrepreneurship training are starting to
have a positive impact. Malta ranked first in the
EU in terms of graduates in the field of computing
(6 per thousand of population aged 25-34 in 2014)
and 16th for new graduates in science and
engineering (15 per thousand of population aged
25-34 in 2014).
3.3.3. SOCIAL POLICY
Favourable economic and employment
conditions led to a significant reduction in the
proportion of people at risk of poverty or social
exclusion. Poverty risks reverted to 2008 levels, as
those at risk dropped by a further 2.3 pps to 20.1 %
in 2016, below the EU average (23.4 %). From
2015 to 2016 Malta almost halved severe material
deprivation, to 4.4 % in 2016 (38). Adults and
children living in single-earner households face
higher risks of poverty, highlighting the
importance of facilitating the labour market
participation of second earners, most of them being
women. The low-skilled also face a higher poverty
risk including when at work, as in work poverty
for the low skilled increased to 10.5 % in 2016.
The elderly and people with disabilities face a
relative increase of their risk of poverty, as they
(38) Severe material deprivation reduced by 3.7 pps. This was
the driver of the upward trend seen in the number of people
at risk of poverty or social exclusion between 2008 and
2014 when severe material deprivation reached 10.4 %.
0
5
10
15
20
25
30
35
40
0
5
10
15
20
25
30
35
40
SE FI
NL
EE
UK
EU
ES
DE
MT
BE IE LT
PL
SK
RO
%%
Total Professionals ISCO 1-3

3.3. Labour market, education and social policies
29
mainly depend on social transfers. People with
disabilities (16-64 years) in Malta face a greater
risk of poverty or social exclusion (41.3 %, 2016)
compared to EU averages (37.5 %, 2016). Malta’s
welfare system does go some way protecting
people with disabilities, but the lack of inclusion in
education and the labour market creates a high
degree of benefit dependency. The share of elderly
over 65 years (26.1 %) at risk of poverty continued
to increase, and is higher than the EU average
(17.7 %). However, the comparatively small and
declining poverty gap from the median income
(11.1 % compared to 16.5 % in the EU in 2015)
reflects adequate pension levels overall. People
who mainly depend on social transfers do not
immediately benefit from labour market
improvements, and the impact of recent measures
to upgrade disability benefits cannot yet be seen in
available income data.
Poverty risks for third country nationals have
increased. Despite high employment rates,
poverty risks increased for third country nationals
by 9 pps since 2010 to 29.4 % in 2016, while their
numbers increased more than threefold over that
period. Evidence suggests that migrants in general
are facing difficulties in accessing services needed
for their integration into society, including
language training, affordable housing (see section
on housing rents), access to finance and health
services. In addition, third country migrants face
particular challenges opening bank accounts and
this will impact more on refugees and asylum
seekers. Currently measures are in place to
facilitate the recruitment of migrants (see Section
3.3.1) by speeding up work permit applications
and introducing the Job Brokerage Scheme. And
Malta has recently published a specific migrant
integration strategy.

3.3. Labour market, education and social policies
30
Box 3.3.5: Policy highlights
Building an effective apprenticeship framework
Malta undertook with support from the European Social Fund, a comprehensive reform of their
apprenticeship scheme. More emphasis was put on quality and on a reinforced employers' role in
assessments. Apprenticeships have expanded to new sectors and participation increased more than
five-fold with 900 interested companies and 455 participants (2015/2016). In 2016/17 around 18%
of students in the European Qualifications Framework (EQF) level 3 programmes were
apprentices and in level 4 the take-up was 40% (CEDEFOP, 2017). The quality criteria include
inter alia defining rights and obligations for vocational education and training (VET) providers,
employers and learners, setting a minimum number of hours for work-based learning and linking
remuneration to the minimum wage. They can now offer over half of EQF level 3 and 4
programmes as apprenticeship. A harmonised legal framework "Work-based learning and the
Apprenticeship Act" is also being finalised.
Malta is addressing its social challenges and
strengthening policies for active inclusion.
Income inequalities are relatively stable and below
the EU average, mostly due to low market income
inequalities. The tax and benefit system reduces
disposable income inequality substantially, but to a
lesser extent than the EU average. Still, Malta
performs above EU average for the indicators
related to adequacy of minimum income benefits.
While recent reforms set out to increase the
redistributive impact of the tax and benefit system,
the lagged effects are not yet reflected in aggregate
economic figures. Malta has also invested in
measures to reach the most vulnerable in society
with the support of EU funds. In particular, the
LEAP centres provide personalised integrated
support to families, facilitating access to
employment and social services. More than 25 000
households have received food support through
national and FEAD schemes.
Malta’s social protection coverage is wide, and
gaps are limited. Generally, the social security
system does not distinguish between the self-
employed and employees as regards benefit
entitlement. For those who satisfy the relevant
conditions, entitlements do not differ. While self-
employed people are not entitled to contributory
unemployment benefits, unlike employees, they
may qualify for the means-tested ‘social
assistance’ and the tapering of benefits which was
introduced with the ‘make work pay’ reforms (see
European Commission, 2017c). The share of short
term unemployed receiving unemployment
benefits (39) is significantly below the EU average.
This is partly due to the short duration of benefits
and possibly to a high level of non-take up as
unemployment spells are short and benefits are flat
rate. The qualifying period for the receipt of
unemployment benefit is one of the shortest in the
EU.
(39) According to the indicators related to coverage and
adequacy developed as part of the benchmarking exercise
in the area of unemployment benefits and active labour
market policies conducted within the EMCO Committee.
See the draft Joint Employment Report 2018 for details.
3.4. INVESTMENT

3.4. Investment
31
3.4.1. BUSINESS ENVIRONMENT AND PUBLIC ADMINISTRATION
While investment in Malta has recently been
highly dynamic, most companies consider that
barriers to investment still exist. In 2016
investment registered a marginal increase,
following a sharp rise in 2015 (see also Box 3.4.1).
Data from the EIB show that in 2017 most firms
(94 %) based in Malta considered the availability
of skilled staff as a barrier to investment (EIB,
2017) (see also Section 3.3). Business regulation,
transport infrastructure and energy costs are also
mentioned by around 70% of firms. Transport
infrastructure appears to be a growing concern for
companies operating in Malta, which see this
aspect as the major priority for public investment
(see also section 3.5).
The Maltese SME sector has thrived in recent
years. In 2015-2016, value added and employment
by SMEs rose by 7.0 % and 4.2 % respectively.
This dynamism is also reflected in the large
number of high-growth firms. In 2015, 12.5 % of
all firms with 10 or more employees were high-
growth firms (40), second highest share in the EU.
This upward trend is expected to continue in 2016-
2018. Value added by SMEs is projected to grow
by 15.4 %, along with an increase of 6.3 % in SME
employment, corresponding to around 6,700 new
jobs. The productivity of micro firms SMEs,
calculated as value added per person employed, is
higher than EU average, while it is below EU
average for SMEs (see also Table 3.4.1).
Nevertheless, firms’ innovation activities and
capacity to scale up their investments appear
limited. Firms’ share of turnover relating to
innovation remains low (4.1 %) compared to the
EU average (13.4 %) (41). Recent data show that
although the development of new
products/services is the top investment priority for
small and micro firms, the latter are also less likely
to develop new products, processes or services
than medium and large firms (EIB, 2017). The
prevalence of micro and small size firms (both as a
share of employment and value added) translates
(40) Eurostat defines high-growth enterprises (growth by 10 %
or more) as enterprises with average annualised growth in
number of employees greater than 10 % per year over a
three-year period (t – 3 to t) and having at least 10
employees in the beginning of the growth (t – 3).
(41) Source: Eurostat, Community Innovation Survey 2014.
into firms’ limited capacity to grow and undertake
risky activities. Not surprisingly, the top sectors in
terms of business R&D expenditure (ICT,
electronic components and boards, pharma) are not
amongst the top contributors to gross value-
added (42).
Graph 3.4.1: Number of persons employed in SMEs
Index: 2008=100, estimates from 2015 onwards
Source: European Commission
Graph 3.4.2: Value added of SMEs
Index: 2008=100, estimates from 2015 onwards
Source: European Commission
In relation to the indicators on the digital
economy, Malta’s performance appears mixed.
Malta is a European leader in fast broadband (30
(42) The top sectors in terms of gross value-added in 2016
were: wholesale and retail, public administration,
arts/entertainment, professional, scientific and technical
activities. Source: Eurostat
80
100
120
140
08 09 10 11 12 13 14 15 16* 17* 18*
20
08
= 1
00
SMEs in Malta SMEs in the EU
80
100
120
140
160
180
200
08 09 10 11 12 13 14 15 16* 17* 18*
20
08
= 1
00
SMEs in Malta SMEs in the EU

3.4. Investment
32
Mbps and above), being the only Member State
with full coverage of NGA networks. Malta is also
very advanced in the provision of digital public
services. At the same time, it scores below the EU
average in digital skills and in mobile broadband.
The business environment is improving,
although inefficiencies remain in some areas.
The European Commission’s indicators of the
responsiveness of administration to the needs of
SMEs (European Commission, 2017d) confirm
that significant efforts have been made. For
instance the number of days to start a business (3
days) has improved compared to last year (6.5
days) and time to transfer property (15 days) is
shorter than the EU average (23.8). However, the
costs of transferring property and costs of
enforcing contracts are very high (respectively
13.5 % of property value and 35.9 % of claims
against EU averages of 4.8 % and 22.0 %). Malta’s
performance under the indicators on the ‘second
chance’ area is particularly weak (43). However,
the actual implementation of recent improvements
to the insolvency legal framework (notably efforts
to reduce the time for restructuring and increase
the availability of qualified practitioners) is
expected to translate into practical effects over the
next years.
The perceived quality of governance seems to
have slightly decreased over the last decade.
According to the World Bank’s 2017 Worldwide
Governance Indicators (WGI), Malta’s rank
between 2006 and 2016 in almost all areas of
governance has slightly worsened (see Figure
3.4.3), in particular concerning the areas of ‘Rule
of Law’ and ‘Control of corruption’ (44).
Furthermore, according to the World Economic
Forum Global Competitiveness Index (GCI)
2017/2018 (45), despite an overall rather positive
(43) The strength of the insolvency framework index (0 to 16) is
only 7.5 well below the EU average of 11.88. The index is
the sum of the scores of 4 underlying indices: (1) the
commencement of proceedings index, (2) management of
debtor’s assets index, (3) reorganization proceedings index
and (4) creditor participation index. Furthermore, three
years are needed to solve insolvency compared to 1.97
years on average in the EU.
(44) Between 2006 and 2016, score went from 1.58 to 1.08 in
the area of ‘Rule of Law’, and from 1.01 to 0.72 in the area
of ‘Control of corruption’. Scores on governance
performance range from approximately -2.5 (weak) to 2.5
(strong).
(45) The rank is out of total of 137 countries. Performance
values range from 0 (poor) to 7 (good).
score (37th in ranking, with a value of 4.6), the
ranking is remarkably lower for specific
components such as trust in politicians and
favouritisms in decisions of government officials.
Inefficient government bureaucracy is identified as
the single biggest obstacle in doing business in
Malta according to the GCI survey’s respondents.
The influence of private interests on public
decisions affects the business environment and the
sustainability of Malta’s development model (see
also sections 3.4.4 and 3.5).
Graph 3.4.3: World Bank 2017 Governance Indicators -
Malta
Source: World Bank
Competition in business service sectors is still
constrained by restrictive requirements.
Despite the full transposition of the Professional
Qualifications Directive (46) in the fourth quarter
of 2017, certain services are still subject to specific
requirements. The degree of restrictions in
professional services, which often represent also
key inputs for manufacturing, is higher in Malta
with respect to the EU average (European
Commission, 2015 and 2017e). In particular,
restrictions concern architects, civil engineers,
accountants, tourist guides, and lawyers (47).
(46) Directive 2013/55/EU of the European Parliament and of
the Council of 20 November 2013 amending Directive
2005/36/EC on the recognition of professional
qualifications and Regulation (EU) No 1024/2012 on
administrative cooperation through the Internal Market
Information System (‘the IMI Regulation’))
(47) Requirements on personal liabilities for architects and civil
engineers, uncertainty on reserved activities for
accountants and for tourist guide, limited scope of reserved
50 60 70 80 90 100
Rule of law
Control of Corruption
Government Effectiveness
Political Stability
Regulatory Quality
Voice and Accountability
Percentile rank (0 to 100)2006 2016
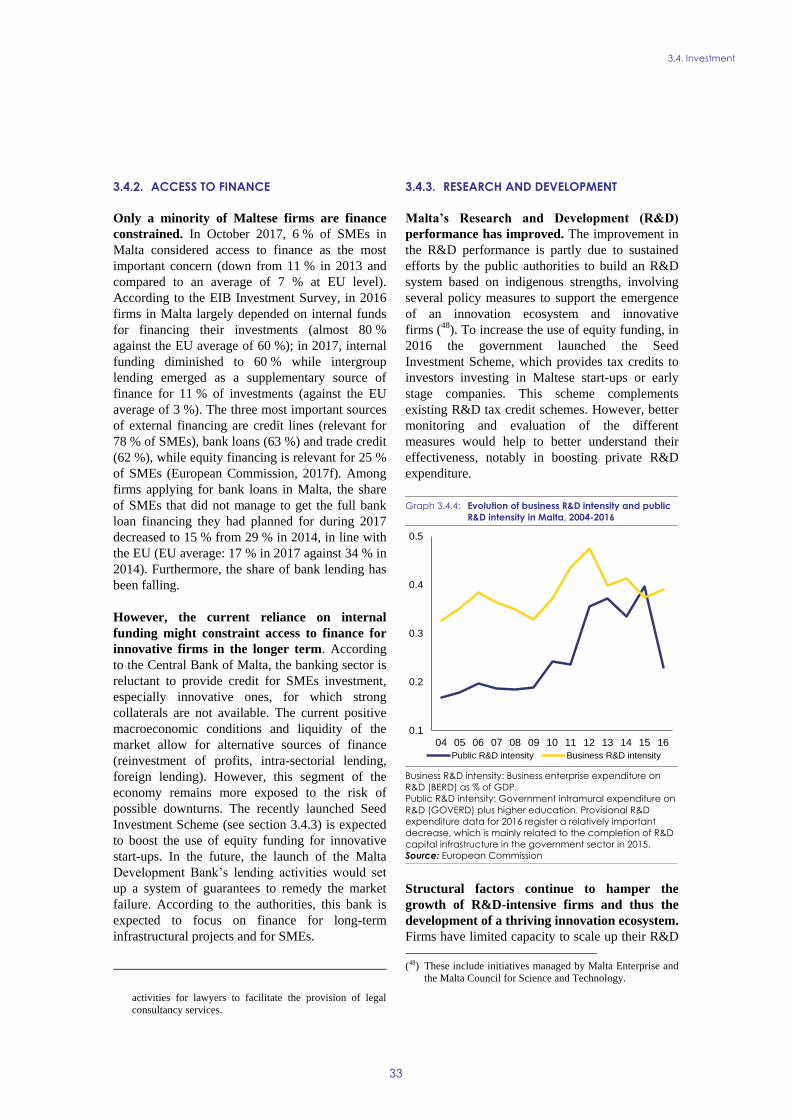
3.4. Investment
33
3.4.2. ACCESS TO FINANCE
Only a minority of Maltese firms are finance
constrained. In October 2017, 6 % of SMEs in
Malta considered access to finance as the most
important concern (down from 11 % in 2013 and
compared to an average of 7 % at EU level).
According to the EIB Investment Survey, in 2016
firms in Malta largely depended on internal funds
for financing their investments (almost 80 %
against the EU average of 60 %); in 2017, internal
funding diminished to 60 % while intergroup
lending emerged as a supplementary source of
finance for 11 % of investments (against the EU
average of 3 %). The three most important sources
of external financing are credit lines (relevant for
78 % of SMEs), bank loans (63 %) and trade credit
(62 %), while equity financing is relevant for 25 %
of SMEs (European Commission, 2017f). Among
firms applying for bank loans in Malta, the share
of SMEs that did not manage to get the full bank
loan financing they had planned for during 2017
decreased to 15 % from 29 % in 2014, in line with
the EU (EU average: 17 % in 2017 against 34 % in
2014). Furthermore, the share of bank lending has
been falling.
However, the current reliance on internal
funding might constraint access to finance for
innovative firms in the longer term. According
to the Central Bank of Malta, the banking sector is
reluctant to provide credit for SMEs investment,
especially innovative ones, for which strong
collaterals are not available. The current positive
macroeconomic conditions and liquidity of the
market allow for alternative sources of finance
(reinvestment of profits, intra-sectorial lending,
foreign lending). However, this segment of the
economy remains more exposed to the risk of
possible downturns. The recently launched Seed
Investment Scheme (see section 3.4.3) is expected
to boost the use of equity funding for innovative
start-ups. In the future, the launch of the Malta
Development Bank’s lending activities would set
up a system of guarantees to remedy the market
failure. According to the authorities, this bank is
expected to focus on finance for long-term
infrastructural projects and for SMEs.
activities for lawyers to facilitate the provision of legal
consultancy services.
3.4.3. RESEARCH AND DEVELOPMENT
Malta’s Research and Development (R&D)
performance has improved. The improvement in
the R&D performance is partly due to sustained
efforts by the public authorities to build an R&D
system based on indigenous strengths, involving
several policy measures to support the emergence
of an innovation ecosystem and innovative
firms (48). To increase the use of equity funding, in
2016 the government launched the Seed
Investment Scheme, which provides tax credits to
investors investing in Maltese start-ups or early
stage companies. This scheme complements
existing R&D tax credit schemes. However, better
monitoring and evaluation of the different
measures would help to better understand their
effectiveness, notably in boosting private R&D
expenditure.
Graph 3.4.4: Evolution of business R&D intensity and public
R&D intensity in Malta, 2004-2016
Business R&D intensity: Business enterprise expenditure on
R&D (BERD) as % of GDP.
Public R&D intensity: Government intramural expenditure on
R&D (GOVERD) plus higher education. Provisional R&D
expenditure data for 2016 register a relatively important
decrease, which is mainly related to the completion of R&D
capital infrastructure in the government sector in 2015.
Source: European Commission
Structural factors continue to hamper the
growth of R&D-intensive firms and thus the
development of a thriving innovation ecosystem.
Firms have limited capacity to scale up their R&D
(48) These include initiatives managed by Malta Enterprise and
the Malta Council for Science and Technology.
0.1
0.2
0.3
0.4
0.5
04 05 06 07 08 09 10 11 12 13 14 15 16
Public R&D intensity Business R&D intensity

3.4. Investment
34
activities, due to their small size (49), reliance on
internal funding for R&D expenditure and the
limited size of the local market. Their investment
in intangible assets (50) has declined in relative
terms since 2016 and revolves around computer
software, databases and organisation/business
processes, which partly reflects Malta’s
specialisation in ICT (EIB, 2017). The overall lack
of critical mass is further evidenced by the low
business enterprise R&D expenditure (BERD)
intensity (with 0.39% of GDP in 2016, Malta
ranked 23th in the EU), which moves the country
further away from its target of 2% R&D intensity
(see Graph 3.4.4). Evidence also indicates the
scope for innovative firms to increase their R&D
intensity, through better science-business linkages.
3.4.4. JUSTICE SYSTEM AND CORRUPTION
Judicial system
The Maltese justice system continues to face a
number of challenges. This concerns in particular
very long proceedings in administrative cases. In
2016, the average disposition time for first instance
administrative law cases was 1,464 days, among
the longest in the EU (European Commission,
2018b). Compared to 2015 (495 days), this
represents an almost threefold increase. In the
important category of first instance litigious civil
and commercial cases, disposition remained high
in 2016 (432 days), although slightly less than in
2015 (445 days).
The implementation of the programme of
judicial reforms has continued. Judicial reforms
in the area of civil, commercial and administrative
justice aim to improve the efficiency and quality of
the judicial system. The 2016 legislation on the
appointment of judges and magistrates has been
implemented, and in 2017 three candidates were
appointed (one judge and two magistrates). Each
judge (but not magistrates) is entitled since 2016 to
be assisted by a court attorney, chosen by the judge
and appointed for a 3-year (renewable) mandate.
(49) R&D expenditure by microenterprises and SMEs
accounted for 85% of business enterprise R&D expenditure
(BERD) in 2014. This figure is one of the highest in the
EU, while the contribution of large enterprises to BERD is
one of the lowest.
(50) Intangible assets are computerised information, innovative
property and economic skills.
According to Maltese authorities, court attorneys
have so far dealt with the preparation of over 2,000
judgments in the civil area, and contributed to
substantially reducing backlogs and increasing the
clearance rate for first instance civil and
commercial litigious cases. Under the programme
of judicial reforms two pieces of legislation have
been adopted, which aim at further court
specialisation, reduced backlogs, improved
insolvency proceedings and strengthened
mediation (51).
Initiatives are ongoing to improve the quality of
the justice system, including e-justice. In March
2017 the ‘MY CASE’ system became operational.
It allows lawyers and their clients to follow
developments in their judicial cases in real time.
The Legal Aid Agency was established in 2014
and offers its services to the most needy. The
budget for legal aid is currently EUR 150,000 and
will be increased to EUR 400,000 in 2018.
Anti-Corruption
Corruption and favouritism are perceived as a
problematic factor for doing business in Malta.
According to a recent Flash Eurobarometer survey,
a majority of business representatives agreed with
the statement that favouritism and corruption
hamper business competition in Malta (85 %, up
from 78 % in 2015, EU average: 74 %). A similar
share of respondents thinks corruption is
widespread in Malta (84 %, EU average: 67 %).
Over half of the managers surveyed identified
corruption as a problem when doing business
(58 %, up from 44 % in 2015, EU average: 37 %),
and disagreed that measures against corruption are
applied impartially and without ulterior motives
(up from 41 % in 2015 to 57 % in 2017, EU
average: 54 %) (European Commission, 2017g).
There is a fragmented landscape of agencies
dealing with corruption allegations. The
Attorney General’s Office, the Police, the
Permanent Commission against Corruption, the
Internal Audit and Investigations Department,
within the scope of their competence, can deal
with allegations of corruption. However, criminal
investigations are carried out by the Police, while
prosecution is co-ordinated between the Attorney
(51) Act XI of 2017 amended to the Code of Organisation &
Civil Procedure; Act VIII of 2017 relative to Mediation.

3.4. Investment
35
General and the Police. The Commissioner of
Police and the Attorney General are appointed by
the government and the Permanent Commission
against Corruption is designed to report its
findings to the government. Other organisations
competent for processing information on
corruption allegations in their own competence
have faced challenges in conducting thorough
enquiries because of lack of necessary means,
powers or resources52. The absence of established
procedures to ensure independent treatment of
cases in responding to corruption allegations may
result in inconsistencies in handling corruption
allegations.
52 "For example, the Ombudsman reports to the House of
Representatives but his/her recommendations are not
binding. The Internal Audit and Investigations Department
carries out financial investigations of suspected corruption
of public officers, but is not empowered to conduct
criminal investigations.
Table 3.4.1: Enterprises, employment and value added by firm size class
These are estimates for 2016 produced by DIW Econ, based on 2008-2014 figures from the Structural Business Statistics
Database (Eurostat). The data cover the ‘non-financial business economy,’ which includes industry, construction, trade, and
services (NACE Rev. 2 sections B to J, L, M and N), but not enterprises in agriculture, forestry and fisheries and the largely non-
market service sectors such as education and health. The following size-class definitions are applied: micro firms (0-9 persons
employed), small firms (10-49 persons employed), medium-sized firms (50-249 persons employed), and large firms (250+
persons employed).
Source: DIW Econ
Class size
EU EU EU
Number Share (%) Share (%) Number Share (%) Share (%) EUR Billion Share (%) Share (%)
Micro 26 808 93.4 93.1 42 497 31.5 29.9 1.7 35.9 21.1
Small 1 497 5.2 5.8 31 384 23.3 20.0 1.2 25.5 17.8
Medium-sized 331 1.2 0.9 33 152 24.6 16.8 1.0 20.7 18.2
SMEs 28 636 99.8 99.8 107 033 79.3 66.6 3.9 82.0 57.1
Large 60 0.2 0.2 27 866 20.7 33.4 0.8 18.0 42.9
Total 28 696 100.0 100.0 134 899 100.0 100.0 4.7 100.0 100.0
Number of enterprises Number of persons employed Value added
Malta Malta Malta

3.4. Investment
36
Box 3.4.6: Investment Box -challenges and reforms in Malta
Section 1. Macroeconomic perspective
The Maltese economy entered into a strong investment cycle as of 2014. The level of investment grew
sharply in 2015 and marginally increased further in 2016. Provisional data from 2017 point out to a
contraction in investment despite dynamic construction activity and improved firms’ balance sheets,
reflecting the still-high base from 2016. The recent investment cycle was driven by both the private sector
and the government, as a result of a number of large scale projects in the energy sector, other private
investments in particular in the aviation sector, and the finalisation of projects funded by the 2007-2013 EU
financial framework.
Section 2. Assessment of barriers to investment and ongoing reforms
Barriers to private investment in Malta are reflected in the European Commission's assessment of investment
environments (1). Some reforms have been adopted or are in the pipeline, in particular in the areas of the
judicial system and skills mismatches, but some barriers remain to be addressed.
Main barriers to investment and priority actions underway
Skill shortages, in particular in the service sector, still weigh on investment. The share of employers
reporting labour shortages has increased substantially in 2017 and is one of the highest in the EU. The
lack of availability of skilled staff has resulted in increasing reliance on foreign labour. A series of
initiatives have been recently put in place to improve skills governance by better aligning education with
business needs (see Section 3.3).
Infrastructure bottleneck, also linked to the country's insular nature, have been exacerbated by the
ongoing economic expansion. In particular, severe traffic congestion constitutes an important barrier to
investment as it increases transport costs and has a negative impact on productivity. While the car fleet
has increased in volume, the quality of road infrastructure is perceived as particularly low. In 2017,
Maltese authorities have announced a project to upgrade the road network over a period of 7 years,
although this is expected to only partially address congestion (see Section 3.5).
The investment climate would benefit from an improved judicial and anti-corruption framework. The
Maltese justice system continues to face challenges concerning its efficiency, in particular regarding the
length of proceeding in administrative cases. Malta is also characterised by a fragmented anti-corruption
landscape. In a recent Flash Eurobarometer Survey, more than half of the surveyed company managers
identified corruption as a problem when doing business. Recent reform measures aim at enhance the
judicial system efficiency by fostering court specialisation, reducing backlogs and improving the
insolvency framework (see Section 3.4).
(1) See ‘Challenges to Member States’ Investment Environments’, SWD (2015) http://ec.europa.eu/europe2020/
challenges-to-member-states-investment-environments/index_en.htm and 2017 Country report for Malta.
Regulatory/ administrative burden Taxation
Public administration Access to finance
Public procurement /PPPs Cooperation btw academia, research and business
Judicial system Financing of R&D&I
Insolvency framework Business services / Regulated professions
Competition and regulatory framework Retail
EPL & framework for labour contracts Construction
Wages & wage setting Digital Economy / Telecom
Education Energy
Legend: Transport
No barrier to investment identified
CSR Investment barriers that are also subject to a CSR Some progress
No progress Substantial progress
Limited progress Fully addressed
Public
administration/
Business
environment
Financial
Sector /
Taxation
R&D&I
Sector
specific
regulation
Labour
market/
Education
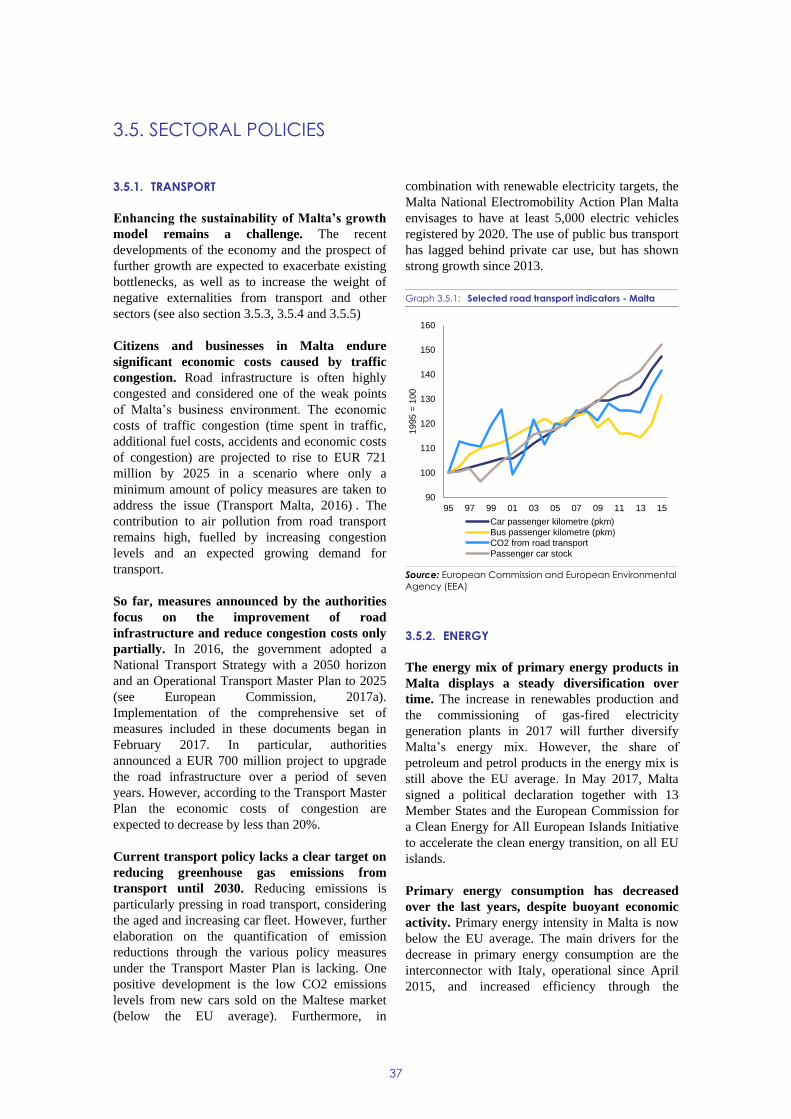
37
3.5.1. TRANSPORT
Enhancing the sustainability of Malta’s growth
model remains a challenge. The recent
developments of the economy and the prospect of
further growth are expected to exacerbate existing
bottlenecks, as well as to increase the weight of
negative externalities from transport and other
sectors (see also section 3.5.3, 3.5.4 and 3.5.5)
Citizens and businesses in Malta endure
significant economic costs caused by traffic
congestion. Road infrastructure is often highly
congested and considered one of the weak points
of Malta’s business environment. The economic
costs of traffic congestion (time spent in traffic,
additional fuel costs, accidents and economic costs
of congestion) are projected to rise to EUR 721
million by 2025 in a scenario where only a
minimum amount of policy measures are taken to
address the issue (Transport Malta, 2016) . The
contribution to air pollution from road transport
remains high, fuelled by increasing congestion
levels and an expected growing demand for
transport.
So far, measures announced by the authorities
focus on the improvement of road
infrastructure and reduce congestion costs only
partially. In 2016, the government adopted a
National Transport Strategy with a 2050 horizon
and an Operational Transport Master Plan to 2025
(see European Commission, 2017a).
Implementation of the comprehensive set of
measures included in these documents began in
February 2017. In particular, authorities
announced a EUR 700 million project to upgrade
the road infrastructure over a period of seven
years. However, according to the Transport Master
Plan the economic costs of congestion are
expected to decrease by less than 20%.
Current transport policy lacks a clear target on
reducing greenhouse gas emissions from
transport until 2030. Reducing emissions is
particularly pressing in road transport, considering
the aged and increasing car fleet. However, further
elaboration on the quantification of emission
reductions through the various policy measures
under the Transport Master Plan is lacking. One
positive development is the low CO2 emissions
levels from new cars sold on the Maltese market
(below the EU average). Furthermore, in
combination with renewable electricity targets, the
Malta National Electromobility Action Plan Malta
envisages to have at least 5,000 electric vehicles
registered by 2020. The use of public bus transport
has lagged behind private car use, but has shown
strong growth since 2013.
Graph 3.5.1: Selected road transport indicators - Malta
Source: European Commission and European Environmental
Agency (EEA)
3.5.2. ENERGY
The energy mix of primary energy products in
Malta displays a steady diversification over
time. The increase in renewables production and
the commissioning of gas-fired electricity
generation plants in 2017 will further diversify
Malta’s energy mix. However, the share of
petroleum and petrol products in the energy mix is
still above the EU average. In May 2017, Malta
signed a political declaration together with 13
Member States and the European Commission for
a Clean Energy for All European Islands Initiative
to accelerate the clean energy transition, on all EU
islands.
Primary energy consumption has decreased
over the last years, despite buoyant economic
activity. Primary energy intensity in Malta is now
below the EU average. The main drivers for the
decrease in primary energy consumption are the
interconnector with Italy, operational since April
2015, and increased efficiency through the
90
100
110
120
130
140
150
160
95 97 99 01 03 05 07 09 11 13 15
1995 =
100
Car passenger kilometre (pkm)
Bus passenger kilometre (pkm)
CO2 from road transport
Passenger car stock
3.5. SECTORAL POLICIES
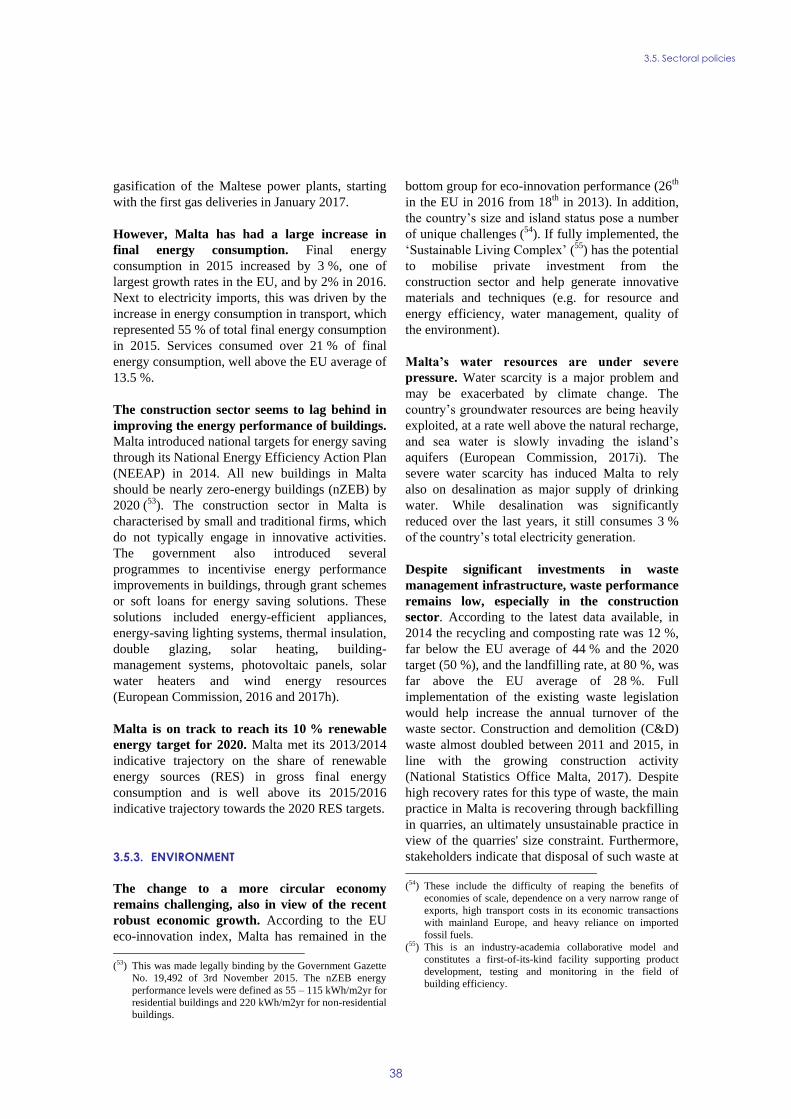
3.5. Sectoral policies
38
gasification of the Maltese power plants, starting
with the first gas deliveries in January 2017.
However, Malta has had a large increase in
final energy consumption. Final energy
consumption in 2015 increased by 3 %, one of
largest growth rates in the EU, and by 2% in 2016.
Next to electricity imports, this was driven by the
increase in energy consumption in transport, which
represented 55 % of total final energy consumption
in 2015. Services consumed over 21 % of final
energy consumption, well above the EU average of
13.5 %.
The construction sector seems to lag behind in
improving the energy performance of buildings.
Malta introduced national targets for energy saving
through its National Energy Efficiency Action Plan
(NEEAP) in 2014. All new buildings in Malta
should be nearly zero-energy buildings (nZEB) by
2020 (53). The construction sector in Malta is
characterised by small and traditional firms, which
do not typically engage in innovative activities.
The government also introduced several
programmes to incentivise energy performance
improvements in buildings, through grant schemes
or soft loans for energy saving solutions. These
solutions included energy-efficient appliances,
energy-saving lighting systems, thermal insulation,
double glazing, solar heating, building-
management systems, photovoltaic panels, solar
water heaters and wind energy resources
(European Commission, 2016 and 2017h).
Malta is on track to reach its 10 % renewable
energy target for 2020. Malta met its 2013/2014
indicative trajectory on the share of renewable
energy sources (RES) in gross final energy
consumption and is well above its 2015/2016
indicative trajectory towards the 2020 RES targets.
3.5.3. ENVIRONMENT
The change to a more circular economy
remains challenging, also in view of the recent
robust economic growth. According to the EU
eco-innovation index, Malta has remained in the
(53) This was made legally binding by the Government Gazette
No. 19,492 of 3rd November 2015. The nZEB energy
performance levels were defined as 55 – 115 kWh/m2yr for
residential buildings and 220 kWh/m2yr for non-residential
buildings.
bottom group for eco-innovation performance (26th
in the EU in 2016 from 18th in 2013). In addition,
the country’s size and island status pose a number
of unique challenges (54). If fully implemented, the
‘Sustainable Living Complex’ (55) has the potential
to mobilise private investment from the
construction sector and help generate innovative
materials and techniques (e.g. for resource and
energy efficiency, water management, quality of
the environment).
Malta’s water resources are under severe
pressure. Water scarcity is a major problem and
may be exacerbated by climate change. The
country’s groundwater resources are being heavily
exploited, at a rate well above the natural recharge,
and sea water is slowly invading the island’s
aquifers (European Commission, 2017i). The
severe water scarcity has induced Malta to rely
also on desalination as major supply of drinking
water. While desalination was significantly
reduced over the last years, it still consumes 3 %
of the country’s total electricity generation.
Despite significant investments in waste
management infrastructure, waste performance
remains low, especially in the construction
sector. According to the latest data available, in
2014 the recycling and composting rate was 12 %,
far below the EU average of 44 % and the 2020
target (50 %), and the landfilling rate, at 80 %, was
far above the EU average of 28 %. Full
implementation of the existing waste legislation
would help increase the annual turnover of the
waste sector. Construction and demolition (C&D)
waste almost doubled between 2011 and 2015, in
line with the growing construction activity
(National Statistics Office Malta, 2017). Despite
high recovery rates for this type of waste, the main
practice in Malta is recovering through backfilling
in quarries, an ultimately unsustainable practice in
view of the quarries' size constraint. Furthermore,
stakeholders indicate that disposal of such waste at
(54) These include the difficulty of reaping the benefits of
economies of scale, dependence on a very narrow range of
exports, high transport costs in its economic transactions
with mainland Europe, and heavy reliance on imported
fossil fuels.
(55) This is an industry-academia collaborative model and
constitutes a first-of-its-kind facility supporting product
development, testing and monitoring in the field of
building efficiency.

3.5. Sectoral policies
39
sea is taking place (56). Malta still has not
developed sufficient recycling infrastructure for
C&D waste. The quality of recycling is generally
low and the resulting products have limited
downstream use (European Commission, 2017h).
The construction sector generates significant
negative externalities that are not adequately
addressed. Construction development projects are
authorised on a stand–alone basis, without a
cumulative assessment of impacts. According to
stakeholders, building regulation and the
environmental authorities are understaffed, so they
would have limited oversight on ongoing projects.
Malta aims to substantially increase green
public procurement. In its 2012 National
Environmental Policy, authorities announced a
specific target (50 % of public procurement in
accordance with green public procurement criteria
by 2015) and other measures for green
procurement. Measures implemented include an
administrative procedure requiring contracting
authorities to use green procurement checklists,
training sessions and specific green procurement
targets for specific product categories (European
Commission, 2017i). These are valuable steps
towards strategic use of public procurement as tool
for sustainable economic growth and
competitiveness, in line with EU policy priorities.
However, specific targets for the 2012-2014 period
were met only partially and authorities do not have
data on actual implementation from 2015 on (57).
3.5.4. CLIMATE ACTION
Current climate policy efforts may not be
sufficient. While Malta has the lowest emissions
per capita in the EU, it is also one of the few
Member States that currently appear to require the
use of flexibility mechanisms to meet its target for
(56) See for instance KPMG and Malta Developers Association
(2017), The Construction Industry and Property Market in
Malta, p. 56.
(57) According to the figures provided by the Maltese
authorities the 10 % target of public procurement set for
2012 was met in the 60 % of cases, the 20 % target for
2013 was fully met, the 30 % target for 2014 was met in
the 70 % of cases; furthermore as of 2015 the responsibility
for managing the process was handed to individual
ministries so that the Ministry of environment that had
centralised the process during the 2012-2014 period no
longer monitors the deliverables in this area.
reducing greenhouse gas emissions under the
Effort Sharing Decision (ESD), for example as
suggested by the 2016 proxy estimates for the
years 2015 and 2016. The main increases in
greenhouse gas emissions in Malta were evidenced
in refrigeration/air conditioning and transport. As a
small island state in the Mediterranean region,
Malta is extremely vulnerable to the impacts of
climate change, with the most vulnerable sectors
being water resources, infrastructure and land use,
natural ecosystems, agriculture and fisheries,
health and tourism.
Table 3.5.1: Largest sector of GHG emissions in 2015 (% of
total GHG emissions)
Source: European Commission and European Environmental
Agency
Graph 3.5.2: GHG emission per capita
(kg CO2-eq/inhabitant)
Source: European Commission and European Environmental
Agency
The robust economic growth as well as the
increase in population put further pressure on
climate policies. Malta is currently developing a
Low Carbon Development Strategy and after a
public consultation closed in June 2017, it is
working on sector-specific strategies. Given
Malta’s climate vulnerabilities, the Low Carbon
Development Strategy will also incorporate the
revised National Adaptation Strategy. This is an
important step to integrate climate-related policies
MT EU28
Energy/power industry 40.0 30.9
Transport 28.4 21.0
Industry 13.1 19.9
Agriculture (including forestry & fishery) 3.7 12.0
Residential & Commercial 8.1 12.8
Waste 6.6 3.2
Other 0.2 0.2
4
5
6
7
8
9
10
11
12
04 05 06 07 08 09 10 11 12 13 14 15 16
EU28 MT
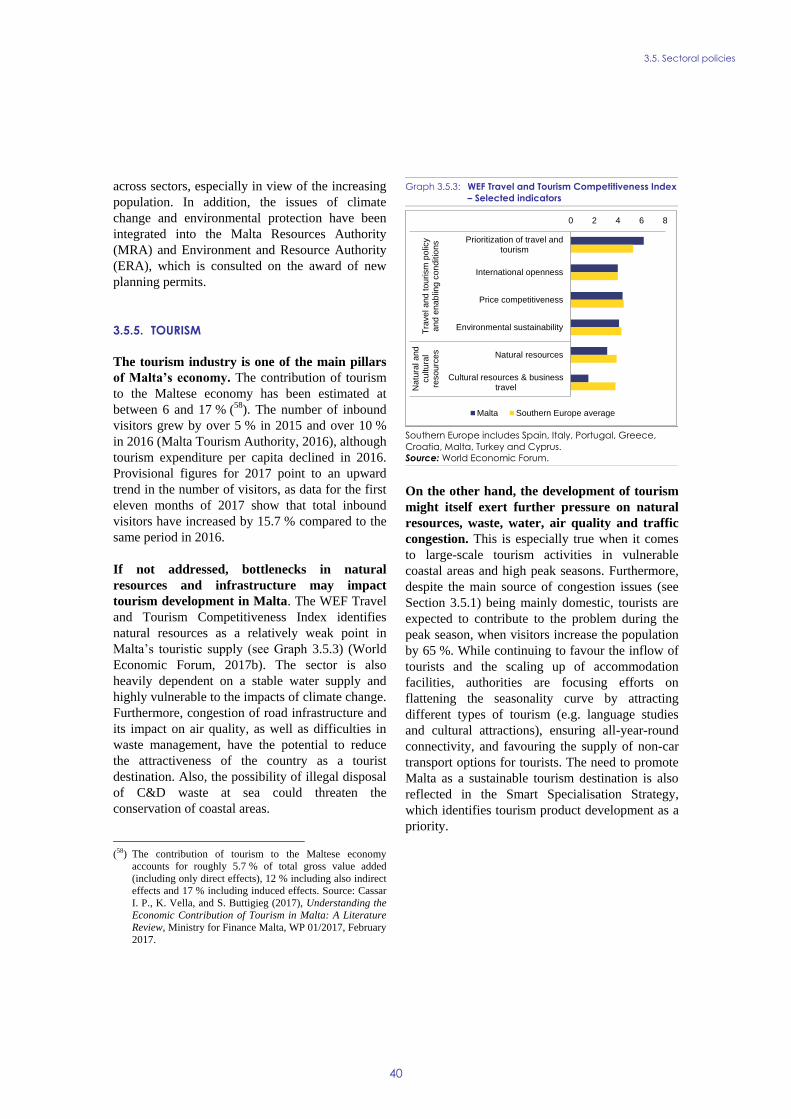
3.5. Sectoral policies
40
across sectors, especially in view of the increasing
population. In addition, the issues of climate
change and environmental protection have been
integrated into the Malta Resources Authority
(MRA) and Environment and Resource Authority
(ERA), which is consulted on the award of new
planning permits.
3.5.5. TOURISM
The tourism industry is one of the main pillars
of Malta’s economy. The contribution of tourism
to the Maltese economy has been estimated at
between 6 and 17 % (58). The number of inbound
visitors grew by over 5 % in 2015 and over 10 %
in 2016 (Malta Tourism Authority, 2016), although
tourism expenditure per capita declined in 2016.
Provisional figures for 2017 point to an upward
trend in the number of visitors, as data for the first
eleven months of 2017 show that total inbound
visitors have increased by 15.7 % compared to the
same period in 2016.
If not addressed, bottlenecks in natural
resources and infrastructure may impact
tourism development in Malta. The WEF Travel
and Tourism Competitiveness Index identifies
natural resources as a relatively weak point in
Malta’s touristic supply (see Graph 3.5.3) (World
Economic Forum, 2017b). The sector is also
heavily dependent on a stable water supply and
highly vulnerable to the impacts of climate change.
Furthermore, congestion of road infrastructure and
its impact on air quality, as well as difficulties in
waste management, have the potential to reduce
the attractiveness of the country as a tourist
destination. Also, the possibility of illegal disposal
of C&D waste at sea could threaten the
conservation of coastal areas.
(58) The contribution of tourism to the Maltese economy
accounts for roughly 5.7 % of total gross value added
(including only direct effects), 12 % including also indirect
effects and 17 % including induced effects. Source: Cassar
I. P., K. Vella, and S. Buttigieg (2017), Understanding the
Economic Contribution of Tourism in Malta: A Literature
Review, Ministry for Finance Malta, WP 01/2017, February
2017.
Graph 3.5.3: WEF Travel and Tourism Competitiveness Index
– Selected indicators
Southern Europe includes Spain, Italy, Portugal, Greece,
Croatia, Malta, Turkey and Cyprus.
Source: World Economic Forum.
On the other hand, the development of tourism
might itself exert further pressure on natural
resources, waste, water, air quality and traffic
congestion. This is especially true when it comes
to large-scale tourism activities in vulnerable
coastal areas and high peak seasons. Furthermore,
despite the main source of congestion issues (see
Section 3.5.1) being mainly domestic, tourists are
expected to contribute to the problem during the
peak season, when visitors increase the population
by 65 %. While continuing to favour the inflow of
tourists and the scaling up of accommodation
facilities, authorities are focusing efforts on
flattening the seasonality curve by attracting
different types of tourism (e.g. language studies
and cultural attractions), ensuring all-year-round
connectivity, and favouring the supply of non-car
transport options for tourists. The need to promote
Malta as a sustainable tourism destination is also
reflected in the Smart Specialisation Strategy,
which identifies tourism product development as a
priority.
0 2 4 6 8
Prioritization of travel andtourism
International openness
Price competitiveness
Environmental sustainability
Natural resources
Cultural resources & businesstravel
Tra
ve
l a
nd
tou
rism
po
licy
an
d e
nab
ling c
on
ditio
ns
Na
tura
l a
nd
cu
ltu
ral
reso
urc
es
Malta Southern Europe average
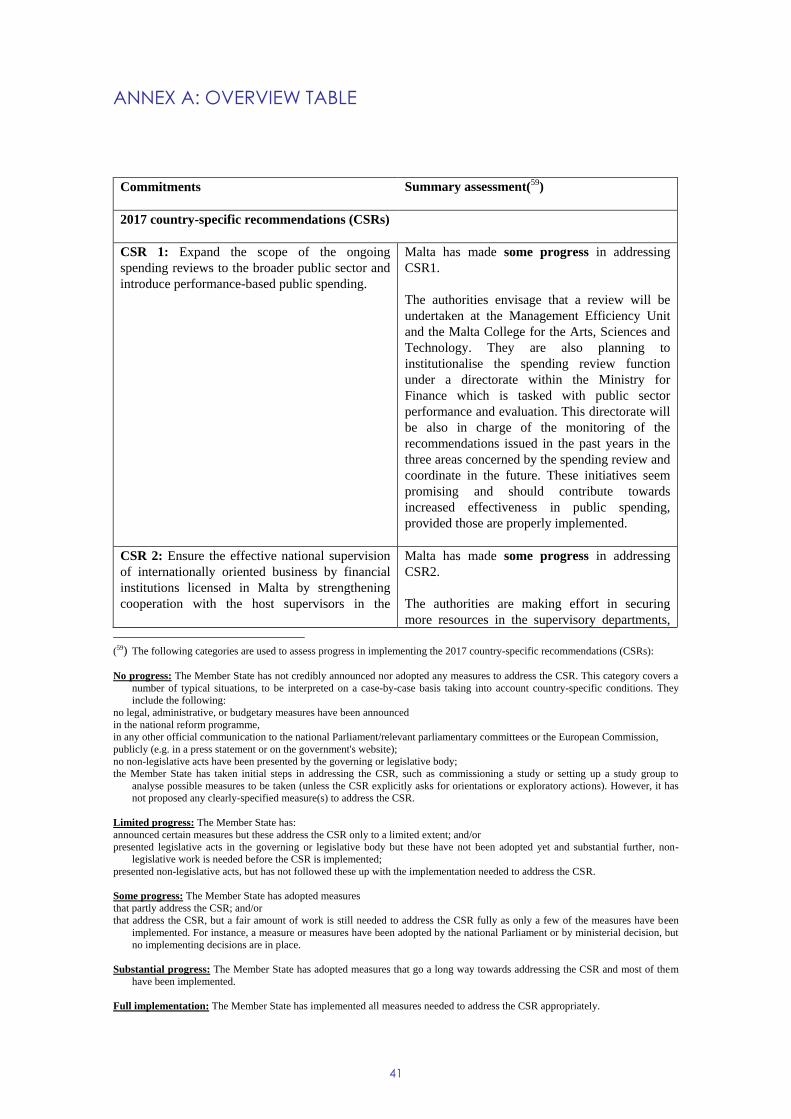
41
Commitments Summary assessment(59
)
2017 country-specific recommendations (CSRs)
CSR 1: Expand the scope of the ongoing
spending reviews to the broader public sector and
introduce performance-based public spending.
Malta has made some progress in addressing
CSR1.
The authorities envisage that a review will be
undertaken at the Management Efficiency Unit
and the Malta College for the Arts, Sciences and
Technology. They are also planning to
institutionalise the spending review function
under a directorate within the Ministry for
Finance which is tasked with public sector
performance and evaluation. This directorate will
be also in charge of the monitoring of the
recommendations issued in the past years in the
three areas concerned by the spending review and
coordinate in the future. These initiatives seem
promising and should contribute towards
increased effectiveness in public spending,
provided those are properly implemented.
CSR 2: Ensure the effective national supervision
of internationally oriented business by financial
institutions licensed in Malta by strengthening
cooperation with the host supervisors in the
Malta has made some progress in addressing
CSR2.
The authorities are making effort in securing
more resources in the supervisory departments,
(59) The following categories are used to assess progress in implementing the 2017 country-specific recommendations (CSRs):
No progress: The Member State has not credibly announced nor adopted any measures to address the CSR. This category covers a
number of typical situations, to be interpreted on a case-by-case basis taking into account country-specific conditions. They
include the following:
no legal, administrative, or budgetary measures have been announced
in the national reform programme,
in any other official communication to the national Parliament/relevant parliamentary committees or the European Commission,
publicly (e.g. in a press statement or on the government's website);
no non-legislative acts have been presented by the governing or legislative body;
the Member State has taken initial steps in addressing the CSR, such as commissioning a study or setting up a study group to
analyse possible measures to be taken (unless the CSR explicitly asks for orientations or exploratory actions). However, it has
not proposed any clearly-specified measure(s) to address the CSR.
Limited progress: The Member State has:
announced certain measures but these address the CSR only to a limited extent; and/or
presented legislative acts in the governing or legislative body but these have not been adopted yet and substantial further, non-
legislative work is needed before the CSR is implemented;
presented non-legislative acts, but has not followed these up with the implementation needed to address the CSR.
Some progress: The Member State has adopted measures
that partly address the CSR; and/or
that address the CSR, but a fair amount of work is still needed to address the CSR fully as only a few of the measures have been
implemented. For instance, a measure or measures have been adopted by the national Parliament or by ministerial decision, but
no implementing decisions are in place.
Substantial progress: The Member State has adopted measures that go a long way towards addressing the CSR and most of them
have been implemented.
Full implementation: The Member State has implemented all measures needed to address the CSR appropriately.
ANNEX A: OVERVIEW TABLE

A. Overview Table
42
countries where they operate. whereby a high number of open vacancies proof
that MFSA is understaffed. However, the process
of reinforcing supervision of cross-border entities
is slow and for the small supervisory body, such
as in Malta, cross-border supervision remains an
issue. In this respect, the Maltese authorities need
to further ensure strong cross border supervisory
cooperation, in order to assure the protection of
freedom of services and also to protect the
reputation of their jurisdiction, given the
importance of the large cross-border financial
sector registered in Malta.
Europe 2020 (national targets and progress)
Employment rate target set in the NRP: 70 % 69.6 % in 2016, up from 67.8 % in 2015.
Early school leaving target: 10 % Despite significant progress over the last 10
years (from 27.2 % in 2008 to 19.6 % in 2016),
Malta is still far from reaching its ambitious
Europe 2020 national target of 10 %.
Tertiary education target: 33 % Rising steadily, but still below target. Tertiary
educational attainment rate for people aged 30-
34 increased by 6.4 percentage points over the
last five years, but at 29.8 % in 2016 it remains
one of the lowest in the EU.
At risk of poverty target in numbers of persons:
Lifting 6,560 individuals from the risk of poverty
or social exclusion
85,000 at risk of poverty or social exclusion, a
decrease of 9,000 people since 2015.
In absolute terms – 5,000 more people are at risk
of poverty or social exclusion in 2016 than in
2008.
Non-ETS 2020 target: + 5%
Greenhouse gas (GHG) emissions target: + 5% in
2020 compared to 2005 (in sectors outside the
scope of the Emissions Trading Scheme).
Non-ETS 2016 target: + 4%
2020 estimate: + 16%
According to the latest national projections
submitted to the Commission, and taking into
account existing measures, it is expected that the
target will not be achieved: emissions are
expected to increase 16% in 2020 as compared
with 2005 (shortfall of 11 percentage points)
2016 estimate: + 20%
Greenhouse gas emissions from sectors not
covered by the Emissions Trading Scheme
increased by 20% between 2005 and 2016,

A. Overview Table
43
according to preliminary data.
2020 Renewable energy target: 10 % of gross final
energy consumption
Malta’s renewable energy share has increased
achieving a share of 6 % in 2016, well above the
indicative trajectory towards the 2020 target.
However, significant renewables deployment is
needed in view of the steeper trajectory towards
2020. Use of cooperation mechanisms with other
Member States could be considered to facilitate
the achievement of the renewable energy target.
National energy efficiency target:
Malta’s 2020 energy efficiency target is 0.822
Mtoe expressed in primary energy consumption
and 0.633 Mtoe expressed in final energy
consumption
Malta’s primary energy consumption in 2016
was 0.72 Mtoe (reduction of 4.2 % from 2010)
and final energy consumption was 0.58 Mtoe
(increase of 2.50 % from 2010). (preliminary
data)
R&D target: 2 % of GDP 0.61 % of GDP in 2016
Malta has decreased its R&D intensity, partly
due to a slower growth of BERD since 2012 and
increasing GDP.
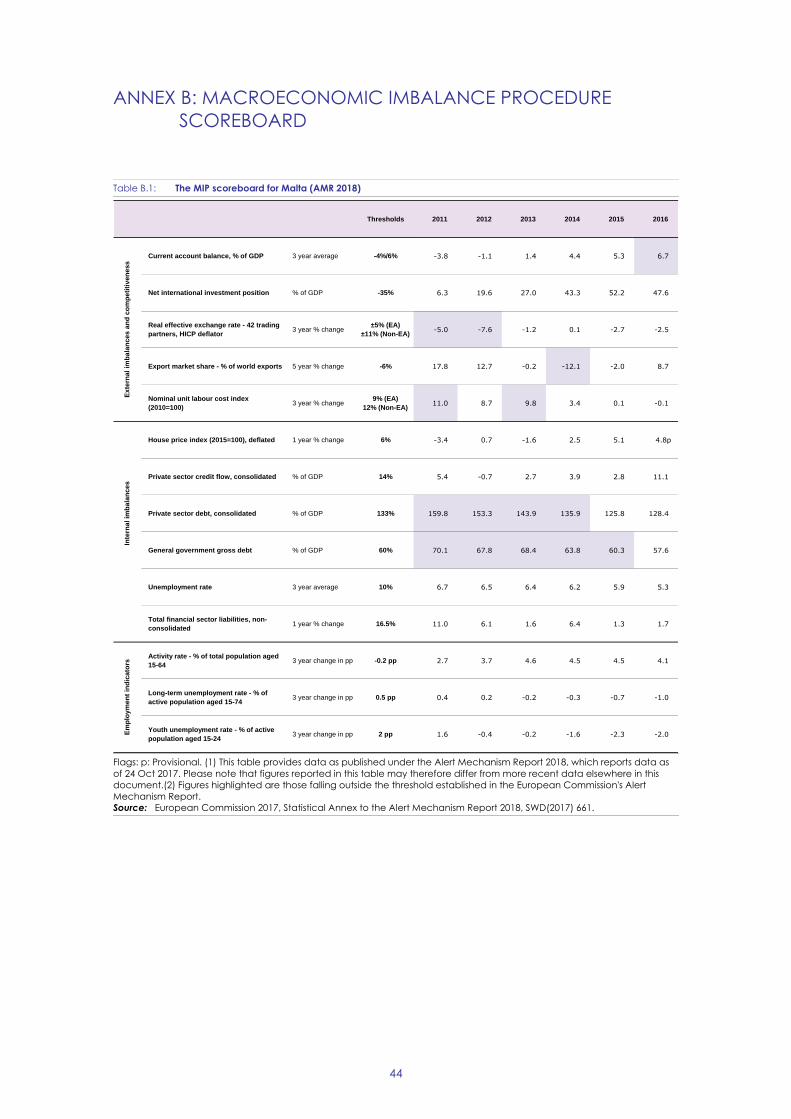
44
ANNEX B: MACROECONOMIC IMBALANCE PROCEDURE
SCOREBOARD
Table B.1: The MIP scoreboard for Malta (AMR 2018)
Flags: p: Provisional. (1) This table provides data as published under the Alert Mechanism Report 2018, which reports data as
of 24 Oct 2017. Please note that figures reported in this table may therefore differ from more recent data elsewhere in this
document.(2) Figures highlighted are those falling outside the threshold established in the European Commission's Alert
Mechanism Report.
Source: European Commission 2017, Statistical Annex to the Alert Mechanism Report 2018, SWD(2017) 661.
Thresholds 2011 2012 2013 2014 2015 2016
Current account balance, % of GDP 3 year average -4%/6% -3.8 -1.1 1.4 4.4 5.3 6.7
Net international investment position % of GDP -35% 6.3 19.6 27.0 43.3 52.2 47.6
Real effective exchange rate - 42 trading
partners, HICP deflator3 year % change
±5% (EA)
±11% (Non-EA)-5.0 -7.6 -1.2 0.1 -2.7 -2.5
Export market share - % of world exports 5 year % change -6% 17.8 12.7 -0.2 -12.1 -2.0 8.7
Nominal unit labour cost index
(2010=100)3 year % change
9% (EA)
12% (Non-EA)11.0 8.7 9.8 3.4 0.1 -0.1
House price index (2015=100), deflated 1 year % change 6% -3.4 0.7 -1.6 2.5 5.1 4.8p
Private sector credit flow, consolidated % of GDP 14% 5.4 -0.7 2.7 3.9 2.8 11.1
Private sector debt, consolidated % of GDP 133% 159.8 153.3 143.9 135.9 125.8 128.4
General government gross debt % of GDP 60% 70.1 67.8 68.4 63.8 60.3 57.6
Unemployment rate 3 year average 10% 6.7 6.5 6.4 6.2 5.9 5.3
Total financial sector liabilities, non-
consolidated1 year % change 16.5% 11.0 6.1 1.6 6.4 1.3 1.7
Activity rate - % of total population aged
15-643 year change in pp -0.2 pp 2.7 3.7 4.6 4.5 4.5 4.1
Long-term unemployment rate - % of
active population aged 15-743 year change in pp 0.5 pp 0.4 0.2 -0.2 -0.3 -0.7 -1.0
Youth unemployment rate - % of active
population aged 15-243 year change in pp 2 pp 1.6 -0.4 -0.2 -1.6 -2.3 -2.0
Ex
tern
al
imb
ala
nc
es
an
d c
om
pe
titi
ve
ne
ss
Inte
rna
l im
ba
lan
ce
sE
mp
loy
me
nt
ind
ica
tors

45
ANNEX C: STANDARD TABLES
Table C.1: Financial market indicators
(1) Latest data Q3 2017. Includes not only banks but all monetary financial institutions excluding central banks. (2) Latest data
Q2 2017. (3) As per ECB definition of gross non-performing debt instruments (4) Quarterly values are not annualised (5) Latest
data February 2017.
* Measured in basis points.
Source: European Commission (long-term interest rates); World Bank (gross external debt); Eurostat (private debt); ECB (all
other indicators).
2012 2013 2014 2015 2016 2017
Total assets of the banking sector (% of GDP)(1) 747.5 659.0 623.0 511.5 466.1 442.5
Share of assets of the five largest banks (% of total assets) 74.4 76.5 81.5 81.3 80.2 -
Foreign ownership of banking system (% of total assets)(2) 78.4 74.9 71.4 66.5 59.6 57.3
Financial soundness indicators:(2)
- non-performing loans (% of total loans)(3)
1.7 2.0 3.2 2.9 2.6 2.3
- capital adequacy ratio (%) 51.9 46.4 25.1 21.2 20.2 20.3
- return on equity (%)(4) 4.7 3.7 4.4 6.3 8.1 3.9
Bank loans to the private sector (year-on-year % change)(1) 3.5 -7.4 10.0 0.7 5.8 9.1
Lending for house purchase (year-on-year % change)(1) 6.8 6.2 9.6 8.6 7.5 8.0
Loan to deposit ratio(1) 89.8 73.7 66.4 63.0 61.5 62.9
Central Bank liquidity as % of liabilities(5) - - 0.9 0.3 - 0.2
Private debt (% of GDP) 153.4 143.9 136.0 125.9 128.6 -
Gross external debt (% of GDP)(2)
- public 8.3 8.6 7.0 6.5 6.6 5.7
- private 719.7 706.0 685.5 652.3 611.6 580.9
Long-term interest rate spread versus Bund (basis points)* 263.1 179.3 144.8 99.2 79.6 98.2
Credit default swap spreads for sovereign securities (5-year)* 346.2 215.8 208.5 208.5 208.7 208.7

C. Standard Tables
46
Table C.2: Headline Social Scoreboard indicators
† The Social Scoreboard includes 14 headline indicators, of which 12 are currently used to compare Member States performance.
The indicators "participants in active labour market policies per 100 persons wanting to work" and "compensation of employees
per hour worked (in EUR)" are not used due to technical concerns by Member States. Possible alternatives will be discussed in the
relevant Committees.
(1) People at risk of poverty or social exclusion (AROPE): individuals who are at risk of poverty (AROP) and/or suffering from severe
material deprivation (SMD) and/or living in households with zero or very low work intensity (LWI).
(2) Unemployed persons are all those who were not employed but had actively sought work and were ready to begin working
immediately or within two weeks.
(3) Gross disposable household income is defined in unadjusted terms, according to the draft Joint Employment Report 2018.
(4) Reduction in percentage of the risk of poverty rate, due to social transfers (calculated comparing at-risk-of poverty rates
before social transfers with those after transfers; pensions are not considered as social transfers in the calculation).
(5) Average of first three quarters of 2017 for the employment rate and gender employment gap.
Source: Eurostat
2012 2013 2014 2015 2016 2017 5
Equal opportunities and access to the labour market
Early leavers from education and training
(% of population aged 18-24)21.1 20.5 20.3 19.8 19.7 :
Gender employment gap (pps) 32.6 29.6 28.4 27.8 27.7 26.2
Income inequality, measured as quintile share ratio (S80/S20) 3.9 4.1 4.0 4.2 4.2 :
At-risk-of-poverty or social exclusion rate1 (AROPE) 23.1 24.0 23.8 22.4 20.1 :
Young people neither in employment nor in education and
training (% of population aged 15-24)10.6 9.9 10.5 10.4 8.5 :
Dynamic labour markets and fair working conditions†
Employment rate (20-64 years) 63.1 64.8 66.4 67.8 69.6 70.8
Unemployment rate2 (15-74 years) 6.3 6.4 5.8 5.4 4.7 4.0
Gross disposable income of households in real terms per capita3
(Index 2008=100) : : : : : :
Public support / Social protection and inclusion
Impact of social transfers (excluding pensions) on poverty
reduction4 37.1 32.6 33.2 31.2 30.7 :
Children aged less than 3 years in formal childcare 17.0 20.0 18.2 17.9 31.3 :
Self-reported unmet need for medical care 1.2 0.9 1.1 0.8 1.0 :
Individuals who have basic or above basic overall digital skills
(% of population aged 16-74): : : 52.0 49.0 56.0
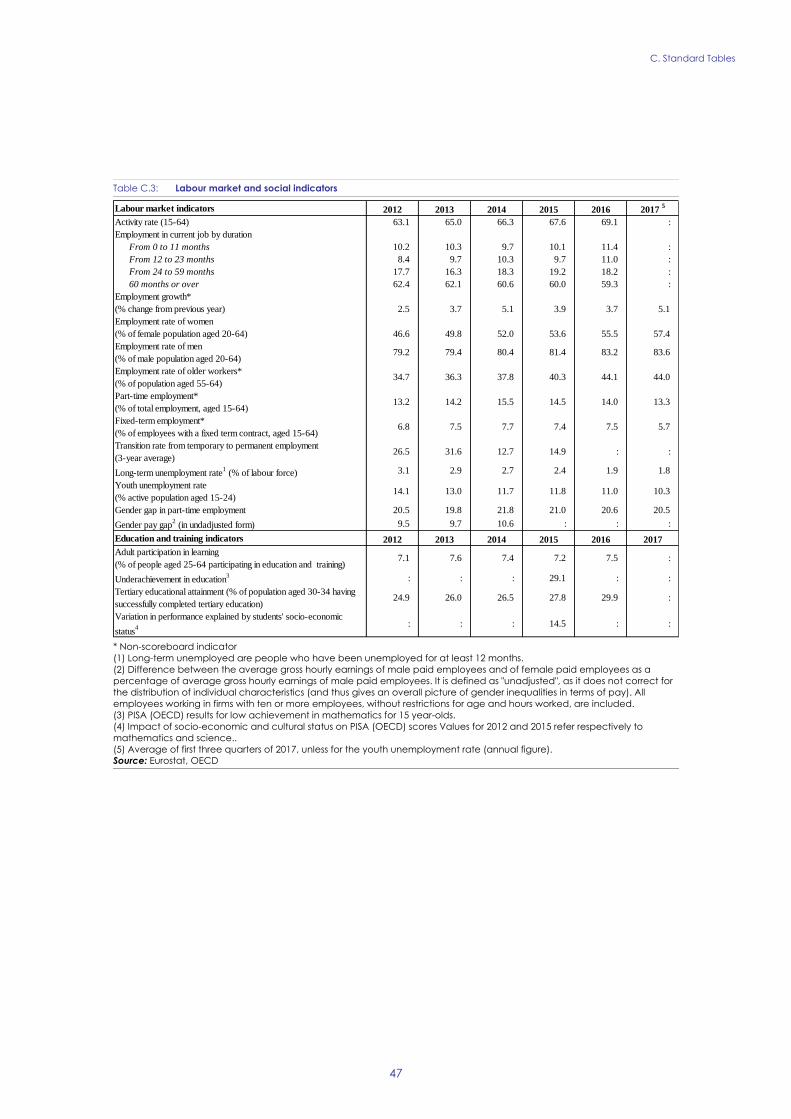
C. Standard Tables
47
Table C.3: Labour market and social indicators
* Non-scoreboard indicator
(1) Long-term unemployed are people who have been unemployed for at least 12 months.
(2) Difference between the average gross hourly earnings of male paid employees and of female paid employees as a
percentage of average gross hourly earnings of male paid employees. It is defined as "unadjusted", as it does not correct for
the distribution of individual characteristics (and thus gives an overall picture of gender inequalities in terms of pay). All
employees working in firms with ten or more employees, without restrictions for age and hours worked, are included.
(3) PISA (OECD) results for low achievement in mathematics for 15 year-olds.
(4) Impact of socio-economic and cultural status on PISA (OECD) scores Values for 2012 and 2015 refer respectively to
mathematics and science..
(5) Average of first three quarters of 2017, unless for the youth unemployment rate (annual figure).
Source: Eurostat, OECD
Labour market indicators 2012 2013 2014 2015 2016 2017 5
Activity rate (15-64) 63.1 65.0 66.3 67.6 69.1 :
Employment in current job by duration
From 0 to 11 months 10.2 10.3 9.7 10.1 11.4 :
From 12 to 23 months 8.4 9.7 10.3 9.7 11.0 :
From 24 to 59 months 17.7 16.3 18.3 19.2 18.2 :
60 months or over 62.4 62.1 60.6 60.0 59.3 :
Employment growth*
(% change from previous year) 2.5 3.7 5.1 3.9 3.7 5.1
Employment rate of women
(% of female population aged 20-64) 46.6 49.8 52.0 53.6 55.5 57.4
Employment rate of men
(% of male population aged 20-64)79.2 79.4 80.4 81.4 83.2 83.6
Employment rate of older workers*
(% of population aged 55-64)34.7 36.3 37.8 40.3 44.1 44.0
Part-time employment*
(% of total employment, aged 15-64)13.2 14.2 15.5 14.5 14.0 13.3
Fixed-term employment*
(% of employees with a fixed term contract, aged 15-64)6.8 7.5 7.7 7.4 7.5 5.7
Transition rate from temporary to permanent employment
(3-year average)26.5 31.6 12.7 14.9 : :
Long-term unemployment rate1 (% of labour force) 3.1 2.9 2.7 2.4 1.9 1.8
Youth unemployment rate
(% active population aged 15-24)14.1 13.0 11.7 11.8 11.0 10.3
Gender gap in part-time employment 20.5 19.8 21.8 21.0 20.6 20.5
Gender pay gap2 (in undadjusted form) 9.5 9.7 10.6 : : :
Education and training indicators 2012 2013 2014 2015 2016 2017
Adult participation in learning
(% of people aged 25-64 participating in education and training)7.1 7.6 7.4 7.2 7.5 :
Underachievement in education3 : : : 29.1 : :
Tertiary educational attainment (% of population aged 30-34 having
successfully completed tertiary education)24.9 26.0 26.5 27.8 29.9 :
Variation in performance explained by students' socio-economic
status4 : : : 14.5 : :

C. Standard Tables
48
Table C.4: Social inclusion and health indicators
* Non-scoreboard indicator
(1) At-risk-of-poverty rate (AROP): proportion of people with an equivalised disposable income below 60 % of the national
equivalised median income.
(2) Proportion of people who experience at least four of the following forms of deprivation: not being able to afford to i) pay
their rent or utility bills, ii) keep their home adequately warm, iii) face unexpected expenses, iv) eat meat, fish or a protein
equivalent every second day, v) enjoy a week of holiday away from home once a year, vi) have a car, vii) have a washing
machine, viii) have a colour TV, or ix) have a telephone.
(3) Percentage of total population living in overcrowded dwellings and exhibiting housing deprivation.
(4) People living in households with very low work intensity: proportion of people aged 0-59 living in households where the adults
(excluding dependent children) worked less than 20 % of their total work-time potential in the previous 12 months.
(5) Ratio of the median individual gross pensions of people aged 65-74 relative to the median individual gross earnings of
people aged 50-59.
(6) Fixed broadband take up (33%), mobile broadband take up (22%), speed (33%) and affordability (11%), from the Digital
Scoreboard.Source: Eurostat, OECD
2012 2013 2014 2015 2016 2017
Expenditure on social protection benefits* (% of GDP)
Sickness/healthcare 5.9 6.1 5.9 5.7 : :
Disability 0.7 0.7 0.7 0.6 : :
Old age and survivors 10.2 9.8 9.3 8.9 : :
Family/children 1.1 1.2 1.3 1.2 : :
Unemployment 0.6 0.6 0.5 0.5 : :
Housing 0.1 0.1 0.1 0.2 : :
Social exclusion n.e.c. 0.3 0.3 0.3 0.2 : :
Total 18.9 18.7 18.1 17.3 : :
of which: means-tested benefits 2.4 2.4 2.3 2.3 : :
General government expenditure by function (% of GDP, COFOG)
Social protection 14.0 13.8 13.1 12.4 12.0 :
Health 5.5 5.7 5.7 5.8 5.6 :
Education 5.8 5.8 5.6 5.5 5.4 :
Out-of-pocket expenditure on healthcare (% of total health expenditure) : : : : : :
Children at risk of poverty or social exclusion (% of people
aged 0-17)*31.0 32.0 31.3 28.2 24.0 :
At-risk-of-poverty rate1 (% of total population) 15.1 15.7 15.9 16.3 16.5 :
In-work at-risk-of-poverty rate (% of persons employed) 5.2 5.9 5.7 5.4 5.8 :
Severe material deprivation rate2 (% of total population) 9.2 9.5 10.2 8.1 4.4 :
Severe housing deprivation rate3, by tenure status
Owner, with mortgage or loan 1.1 0.7 1.0 0.9 0.5 :
Tenant, rent at market price 3.4 4.9 8.0 4.1 10.1 :
Proportion of people living in low work intensity households4
(% of people aged 0-59)9.0 9.0 9.8 9.2 7.3 :
Poverty thresholds, expressed in national currency at constant prices* 6116 6259 6554 6863 6823 :
Healthy life years (at the age of 65)
Females 12.3 12.7 13.7 14.0 : :
Males 12.5 12.8 13.3 13.4 : :
Aggregate replacement ratio for pensions5 (at the age of 65) 0.5 0.6 0.6 0.5 0.5 :
Connectivity dimension of the Digital Economy and Society Inedex
(DESI)6
: : 54.4 62.9 66.1 67.9
GINI coefficient before taxes and transfers* 44.4 45.5 45.7 45.6 : :
GINI coefficient after taxes and transfers* 27.1 27.9 27.7 28.1 : :
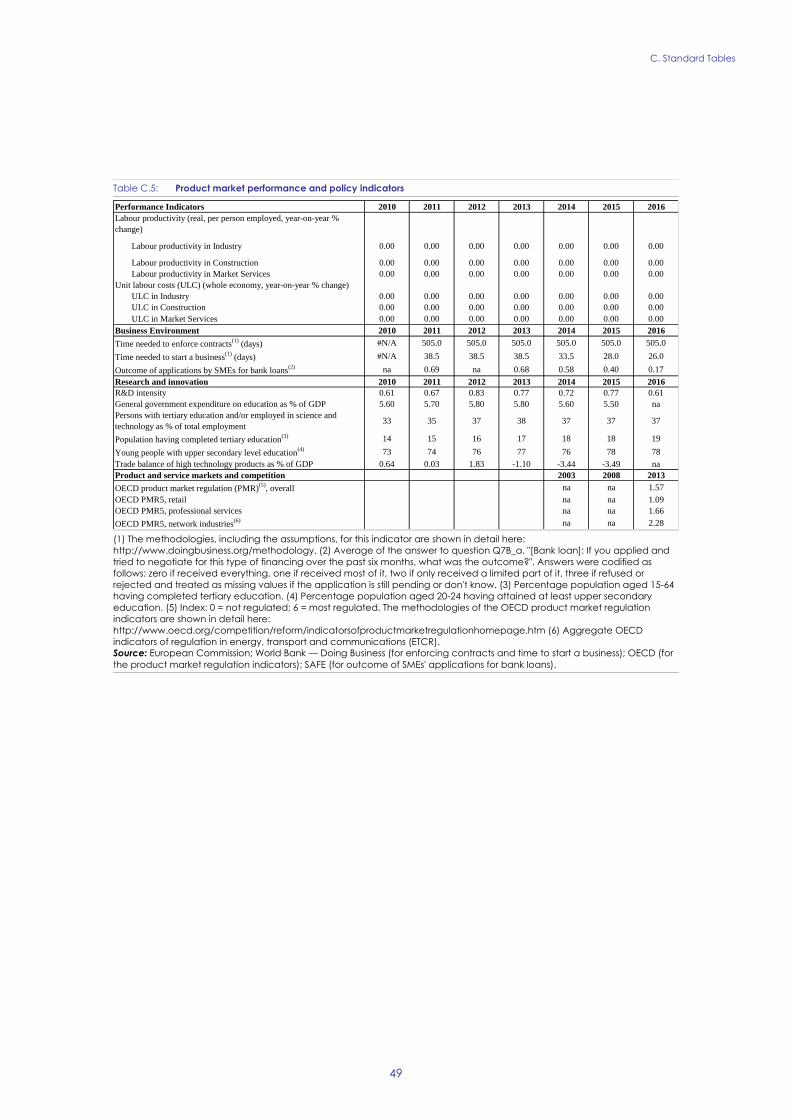
C. Standard Tables
49
Table C.5: Product market performance and policy indicators
(1) The methodologies, including the assumptions, for this indicator are shown in detail here:
http://www.doingbusiness.org/methodology. (2) Average of the answer to question Q7B_a. "[Bank loan]: If you applied and
tried to negotiate for this type of financing over the past six months, what was the outcome?". Answers were codified as
follows: zero if received everything, one if received most of it, two if only received a limited part of it, three if refused or
rejected and treated as missing values if the application is still pending or don't know. (3) Percentage population aged 15-64
having completed tertiary education. (4) Percentage population aged 20-24 having attained at least upper secondary
education. (5) Index: 0 = not regulated; 6 = most regulated. The methodologies of the OECD product market regulation
indicators are shown in detail here:
http://www.oecd.org/competition/reform/indicatorsofproductmarketregulationhomepage.htm (6) Aggregate OECD
indicators of regulation in energy, transport and communications (ETCR).
Source: European Commission; World Bank — Doing Business (for enforcing contracts and time to start a business); OECD (for
the product market regulation indicators); SAFE (for outcome of SMEs' applications for bank loans).
Performance Indicators 2010 2011 2012 2013 2014 2015 2016
Labour productivity (real, per person employed, year-on-year %
change)
Labour productivity in Industry 0.00 0.00 0.00 0.00 0.00 0.00 0.00
Labour productivity in Construction 0.00 0.00 0.00 0.00 0.00 0.00 0.00
Labour productivity in Market Services 0.00 0.00 0.00 0.00 0.00 0.00 0.00
Unit labour costs (ULC) (whole economy, year-on-year % change)
ULC in Industry 0.00 0.00 0.00 0.00 0.00 0.00 0.00
ULC in Construction 0.00 0.00 0.00 0.00 0.00 0.00 0.00
ULC in Market Services 0.00 0.00 0.00 0.00 0.00 0.00 0.00
Business Environment 2010 2011 2012 2013 2014 2015 2016
Time needed to enforce contracts(1)
(days) #N/A 505.0 505.0 505.0 505.0 505.0 505.0
Time needed to start a business(1)
(days) #N/A 38.5 38.5 38.5 33.5 28.0 26.0
Outcome of applications by SMEs for bank loans(2) na 0.69 na 0.68 0.58 0.40 0.17
Research and innovation 2010 2011 2012 2013 2014 2015 2016
R&D intensity 0.61 0.67 0.83 0.77 0.72 0.77 0.61
General government expenditure on education as % of GDP 5.60 5.70 5.80 5.80 5.60 5.50 na
Persons with tertiary education and/or employed in science and
technology as % of total employment33 35 37 38 37 37 37
Population having completed tertiary education(3) 14 15 16 17 18 18 19
Young people with upper secondary level education(4) 73 74 76 77 76 78 78
Trade balance of high technology products as % of GDP 0.64 0.03 1.83 -1.10 -3.44 -3.49 na
Product and service markets and competition 2003 2008 2013
OECD product market regulation (PMR)(5)
, overall na na 1.57
OECD PMR5, retail na na 1.09
OECD PMR5, professional services na na 1.66
OECD PMR5, network industries(6) na na 2.28
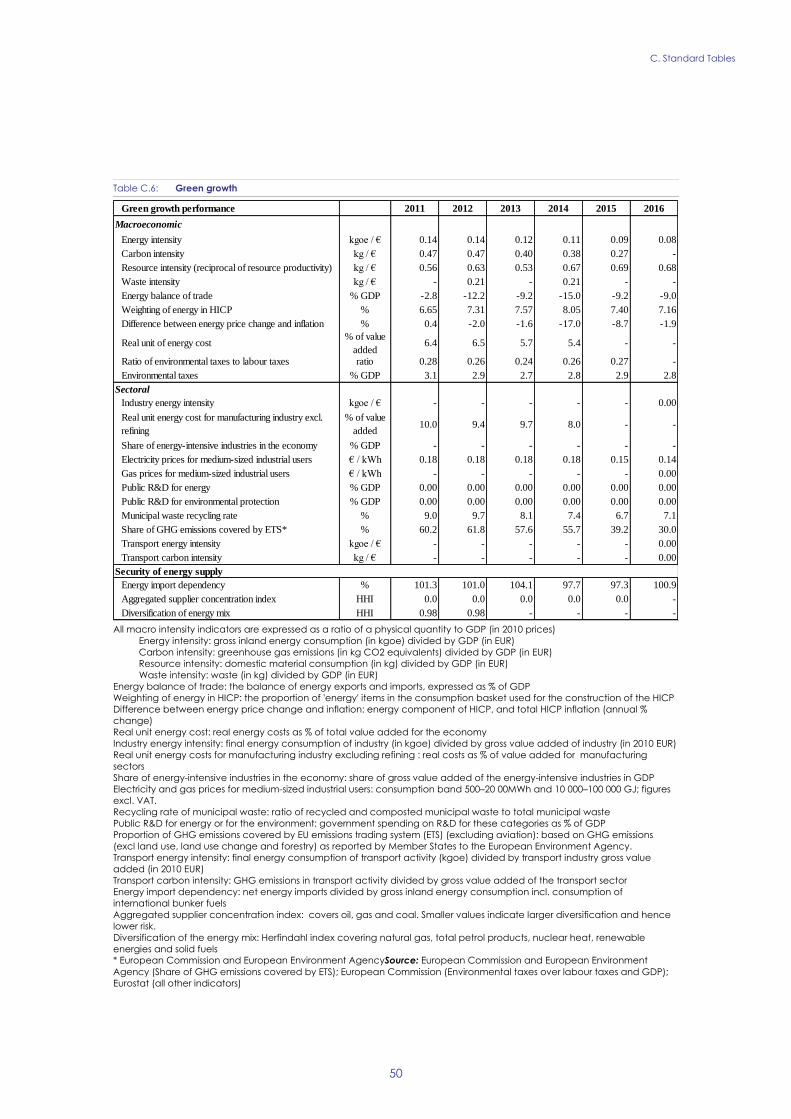
C. Standard Tables
50
Table C.6: Green growth
All macro intensity indicators are expressed as a ratio of a physical quantity to GDP (in 2010 prices)
Energy intensity: gross inland energy consumption (in kgoe) divided by GDP (in EUR)
Carbon intensity: greenhouse gas emissions (in kg CO2 equivalents) divided by GDP (in EUR)
Resource intensity: domestic material consumption (in kg) divided by GDP (in EUR)
Waste intensity: waste (in kg) divided by GDP (in EUR)
Energy balance of trade: the balance of energy exports and imports, expressed as % of GDP
Weighting of energy in HICP: the proportion of 'energy' items in the consumption basket used for the construction of the HICP
Difference between energy price change and inflation: energy component of HICP, and total HICP inflation (annual %
change)
Real unit energy cost: real energy costs as % of total value added for the economy
Industry energy intensity: final energy consumption of industry (in kgoe) divided by gross value added of industry (in 2010 EUR)
Real unit energy costs for manufacturing industry excluding refining : real costs as % of value added for manufacturing
sectors
Share of energy-intensive industries in the economy: share of gross value added of the energy-intensive industries in GDP
Electricity and gas prices for medium-sized industrial users: consumption band 500–20 00MWh and 10 000–100 000 GJ; figures
excl. VAT.
Recycling rate of municipal waste: ratio of recycled and composted municipal waste to total municipal waste
Public R&D for energy or for the environment: government spending on R&D for these categories as % of GDP
Proportion of GHG emissions covered by EU emissions trading system (ETS) (excluding aviation): based on GHG emissions
(excl land use, land use change and forestry) as reported by Member States to the European Environment Agency.
Transport energy intensity: final energy consumption of transport activity (kgoe) divided by transport industry gross value
added (in 2010 EUR)
Transport carbon intensity: GHG emissions in transport activity divided by gross value added of the transport sector
Energy import dependency: net energy imports divided by gross inland energy consumption incl. consumption of
international bunker fuels
Aggregated supplier concentration index: covers oil, gas and coal. Smaller values indicate larger diversification and hence
lower risk.
Diversification of the energy mix: Herfindahl index covering natural gas, total petrol products, nuclear heat, renewable
energies and solid fuels
* European Commission and European Environment AgencySource: European Commission and European Environment
Agency (Share of GHG emissions covered by ETS); European Commission (Environmental taxes over labour taxes and GDP);
Eurostat (all other indicators)
Green growth performance 2011 2012 2013 2014 2015 2016
Macroeconomic
Energy intensity kgoe / € 0.14 0.14 0.12 0.11 0.09 0.08
Carbon intensity kg / € 0.47 0.47 0.40 0.38 0.27 -
Resource intensity (reciprocal of resource productivity) kg / € 0.56 0.63 0.53 0.67 0.69 0.68
Waste intensity kg / € - 0.21 - 0.21 - -
Energy balance of trade % GDP -2.8 -12.2 -9.2 -15.0 -9.2 -9.0
Weighting of energy in HICP % 6.65 7.31 7.57 8.05 7.40 7.16
Difference between energy price change and inflation % 0.4 -2.0 -1.6 -17.0 -8.7 -1.9
Real unit of energy cost% of value
added6.4 6.5 5.7 5.4 - -
Ratio of environmental taxes to labour taxes ratio 0.28 0.26 0.24 0.26 0.27 -
Environmental taxes % GDP 3.1 2.9 2.7 2.8 2.9 2.8
Sectoral
Industry energy intensity kgoe / € - - - - - 0.00
Real unit energy cost for manufacturing industry excl.
refining
% of value
added10.0 9.4 9.7 8.0 - -
Share of energy-intensive industries in the economy % GDP - - - - - -
Electricity prices for medium-sized industrial users € / kWh 0.18 0.18 0.18 0.18 0.15 0.14
Gas prices for medium-sized industrial users € / kWh - - - - - 0.00
Public R&D for energy % GDP 0.00 0.00 0.00 0.00 0.00 0.00
Public R&D for environmental protection % GDP 0.00 0.00 0.00 0.00 0.00 0.00
Municipal waste recycling rate % 9.0 9.7 8.1 7.4 6.7 7.1
Share of GHG emissions covered by ETS* % 60.2 61.8 57.6 55.7 39.2 30.0
Transport energy intensity kgoe / € - - - - - 0.00
Transport carbon intensity kg / € - - - - - 0.00
Security of energy supply
Energy import dependency % 101.3 101.0 104.1 97.7 97.3 100.9
Aggregated supplier concentration index HHI 0.0 0.0 0.0 0.0 0.0 -
Diversification of energy mix HHI 0.98 0.98 - - - -

51
Bricongne, J.-C., P. Pontuch, and A. Turrini (forthcoming), Assessing House Prices: Insights from
HouseLev, a new dataset of prices in levels, European Commission Discussion Paper.
Cassar I. P., K. Vella, and S. Buttigieg (2017), Understanding the Economic Contribution of Tourism in
Malta: A Literature Review, Ministry for Finance Malta, WP 01/2017, February 2017.
Cedefop (2017), Vocational education and training in Malta: short description, Luxembourg,
Publications Office.
EIB (2017), EIB Group Survey on Investment and Investment Finance Country Overview: Malta,
European Investment Bank (EIB).
European Commission (forthcoming), Taxation trends in the European Union, Data for EU Member
States, Iceland and Norway, 2018 edition, European Commission, Brussels.
European Commission (2018a), Warrington, B, Hristov, H; RIO Country Report 2017: Malta, Joint
Research Centre.
European Commission (2018b), EU Justice Scoreboard 2018, European Commission, Brussels.
European Commission (2017a), Country Report Malta 2017, SWD(2017) 83 final, European
Commission, Brussels.
European Commission (2017b), Education and Training Monitor 2017 - Malta, European Commission,
Brussels.
European Commission (2017c), ESPN Thematic Report on Access to social protection of people working
as self-employed or on non-standard contracts - Malta, European Commission, Brussels.
European Commission (2017d), 2017 Small Business Act Fact Sheet — Malta, European Commission,
Brussels.
European Commission (2017e), Communication on reform recommendation for regulation in
professional services, COM(2016) 820 final, European Commission, Brussels.
European Commission (2017f), Survey on the access to finance of enterprises (SAFE) - Analytical Report
2017, Luxembourg, Publication Office.
European Commission (2017g), Flash Eurobarometer 457: Businesses’ attitudes towards corruption in
the EU, European Commission, Brussels.
European Commission (2017h), European Construction Sector Observatory – Malta country profile,
European Commission, Brussels.
European Commission (2017i), The EU environmental Implementation review, Country Report - Malta,
SWD(2017)51, European Commission, Brussels.
European Commission (2016), European Construction Sector Observatory – Malta country profile,
European Commission, Brussels.
European Commission (2015), Business services — Assessment of barriers and their economic impact,
European Commission, Brussels.
REFERENCES

References
52
FRA (2017), Second European Union Minorities and Discrimination Survey - Main results, FRA
European Union Agency for fundamental rights, Luxembourg, Publications Office.
Housing Europe (2015), The State of Housing in the EU 2015.
IHME (2016), Global Health Data Exchange, Institute for Health Metrics and Evaluation, available at
http://ghdx.healthdata.org/gbd-results-tool.
IHS (forthcoming), Aggressive Tax Planning indicators, Institute for Advanced Studies, Vienna.
KPMG and Malta Developers Association (2017), The Construction Industry and Property Market in
Malta, October 2017.
Ministry for Tourism, the Environment and Culture (2012), National environmental Policy, February
2012.
Ministry for Transport and Infrastructure and Transport Malta (2013), The Malta National
Electromobility Action Plan.
Malta Tourism Authority (2016), Tourism in Malta- facts and figures 2016.
National Statistics Office Malta (2017), Solid Waste Management: 2015, January 2017.
OECD/European Observatory on Health Systems and Policies (2017), Malta: Country Health Profile
2017, OECD Publishing, Paris/European Observatory on Health Systems and Policies, Brussels.
Office of the Prime Minister (2017), Malta’s National Energy Efficiency Action Plan, April 2017.
Transport Malta (2016), National Transport Master Plan to 2025.
Van 't Riet, M., and A. Lejour (2017), Optimal Tax Routing: Network Analysis of FDI Diversion,
(CentER Discussion Paper; Vol. 2017-022), Tilburg: CentER, Center for Economic Research.
World Economic Forum (2017a), The Global Competitiveness Report 2017–2018.
World Economic Forum (2017b), Travel and Tourism Competitiveness Report 2017.