2018 annual results - pingan
TRANSCRIPT

2018 Annual ResultsMarch 2019

2
Cautionary Statements Regarding Forward-Looking Statements
To the extent any statements made in this report contain information that is not historical, these statements are essentially forward-
looking. These forward-looking statements include but are not limited to projections, targets, estimates and business plans that the
Company expects or anticipates will or may occur in the future. These forward-looking statements are subject to known and unknown
risks and uncertainties that may be general or specific. Certain statements, such as those including the words or phrases “potential”,
“estimates”, “expects”, “anticipates”, “objective”, “intends”, “plans”, “believes”, “will”, “may”, “should”, and similar expressions or
variations on such expressions may be considered forward-looking statements.
Readers should be cautioned that a variety of factors, many of which are beyond the Company’s control, affect the performance,
operations and results of the Company, and could cause actual results to differ materially from the expectations expressed in any of
the Company’s forward-looking statements. These factors include, but are not limited to, exchange rate fluctuations, market shares,
industry competition, environmental risks, changes in legal, financial and regulatory frameworks, international economic and financial
market conditions and other risks and factors beyond our control. These and other factors should be considered carefully and readers
should not place undue reliance on the Company’s forward-looking statements. In addition, the Company undertakes no obligation to
publicly update or revise any forward-looking statement that is contained in this report as a result of new information, future events or
otherwise. None of the Company, or any of its employees or affiliates is responsible for, or is making, any representations concerning
the future performance of the Company.

Overview & Financial Review
Insurance Business
Banking Business
Fintech & Healthtech Business
Jason Yao, CFO
Xie Yonglin, Co-CEO
Lee Yuansiong, Co-CEO
Jessica Tan, Co-CEO
3
Contents

Overview Financial Review Insurance Business Fintech & Healthtech BusinessBanking Business
4
OverviewJason Yao
CFO

Ping An's strategy: A World-leading Technology-powered
Retail Financial Services Group
Two
Focuses
One
Positioning
N pillars
Two growth
models
5
World-leading
Technology-powered
Retail Financial Services Group
Financial
Services
Ecosystem
Auto
Services
Ecosystem
Real Estate
Services
Ecosystem
Health
Care
Ecosystem
Smart City
Ecosystem
Pan Financial Assets Pan Health Care
Finance + EcosystemFinance + Technology
InsuranceAsset
ManagementBanking

Strong track record since 2004 IPO
04 05 06 07 08 09 10 11 12 13 14 15 16 17 18
28.2
556.5
20.9%
7.4%
RMB0.7
RMB17.2(2)
37.2
1,002.5
7,143.0
264.4
RMB6.02
RMB0.28
Notes:
(1) The dividend refers to the cash dividend paid per ten shares.
(2) The dividend per share was RMB1.72 in 2018. In addition, the Company distributed the 30th Anniversary Special Dividend of RMB0.20 per share in the first quarter of 2018.
(in RMB billion)
04 05 06 07 08 09 10 11 12 13 14 15 16 17 18
6
Shareholders’ Equity CAGR = 23.7%
5-year/15-year average ROE = 18.9%/15.5%
Dividend CAGR = 25.7%
Basic EPS CAGR = 24.5%
Embedded Value CAGR = 26.5%
Total Assets CAGR = 26.5%

7
Jason Yao
CFO
Financial ReviewOverview Insurance Business Fintech & Healthtech BusinessBanking Business
Financial Review

2018 business highlights(in RMB)
8
Embedded
value per share
54.84
+21.5%
112,573 million
+18.9%
Operating profit(1)
107,404 million
+20.6%
21.9%
-0.1 pps
Operating ROE Group
Operating ROEV
23.7%
-3.0 pps
1.72/share
+14.7%
Annual dividend(excluding special)Net profit(1)
Note: (1) Operating profit and net profit refer to the operating profit and net profit attributable to shareholders of the parent company respectively.

1. Customer-centric profit drivers
9
Financial ReviewOverview Insurance Business Fintech & Healthtech BusinessBanking Business
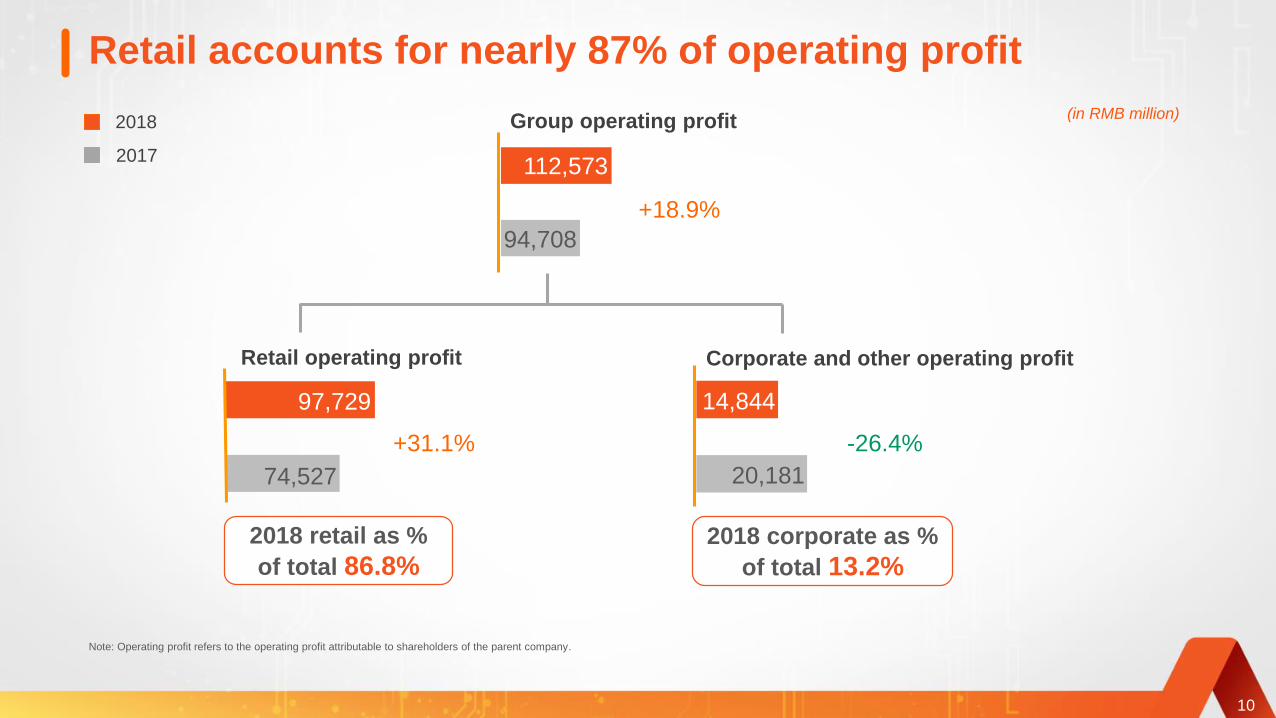
Retail accounts for nearly 87% of operating profit
+18.9%
112,573
94,708
Group operating profit
-26.4%
14,844
Corporate and other operating profit
2018 corporate as %
of total 13.2%
(in RMB million)
2018 retail as %
of total 86.8%
+31.1%
97,729
74,527
Retail operating profit
10
20,181
2018
2017
Note: Operating profit refers to the operating profit attributable to shareholders of the parent company.

Retail profit growth drivers
+31.1%
+11.0%
+18.1%
531.25
449.69
-11.9%
Product profitability
Retail operating profit
(RMBmn)
Retail customers
(mn persons)
Operating profit per
customer (RMB)
New customers
(mn persons)
+9.1%
2.32
2.53
Contracts per customer
-22.5%
-4.7%
New ecosystem
sourced customers
(mn persons)
New traditional channel
sourced customers
(mn persons)
11
97,729
74,527
166
184 40.78
46.30
18.72
14.50
26.28
27.58
2018/Dec 31, 2018
2017/Dec 31, 2017
Notes: (1) Operating profit refers to the operating profit attributable to shareholders of the parent company.
(2) The number of customers as at December 31, 2018 is not equal to the number of customers as at December 31, 2017 plus new customers acquired during the Reporting Period due to customer attrition.
(3) Figures may not match the calculation due to rounding.

109 131166 184
57 99 136 157
184
247300
381
Increased customers and cross-selling
Retail financial customers
Percentage of customers holding
contracts with multiple subsidiaries
Significant potential to further penetrate
our 538mn internet user base
Cross sell penetration ratio has increased materially
despite rapid growth in customers
32.7%
Internet users who are also our
financial customers
Internet users who are not yet our
financial customers
Dec 31, 2016 Dec 31, 2017 Dec 31, 2018Dec 31, 2015
Dec 31, 2016 Dec 31, 2017 Dec 31, 2018Dec 31, 2015
12
346
436
538
242
(million persons)
Note:Figures may not match totals due to rounding.
19.0%
24.0%
28.5%
34.6%

2. Operating profit
13
Financial ReviewOverview Insurance Business Fintech & Healthtech BusinessBanking Business

Group operating profit rose 18.9% YoY
14
12,215
14,394
6,770
70,320
3,008
(3,996)
112,573
2018
10.9
12.8
6.0
62.5
2.7
(3.6)
100.0
Proportion (%)
(8.2)
34.9
7.0
24.9
(23.9)
48.0
18.9
YoY change (%)
13,307
13,449
5,420
52,128
3,953
(2,700)
94,708
2017
1,599
8,264
1.4
7.3
2,043
7,108
(21.7)
16.3
Property and casualty insurance
Banking business
Fintech & healthtech business(3)
Life and health insurance
Trust business
Others & elimination
The Group
Securities business
Other asset management business(2)
(in RMB million)
Notes: (1) In 2018, the Company reviewed the presentation of cross-shareholding within the Company based on the operations of various business lines to provide clearer and more concise information. The 2017 data was
restated for comparison purposes.
(2) The other asset management business represents results of companies that engage in asset management business including Ping An Asset Management, Ping An Financial Leasing, and Ping An Overseas Holdings.
(3) The fintech & healthtech business represents results of companies that engage in fintech & healthtech business including Lufax Holding, Ping An Good Doctor, OneConnect, Ping An HealthKonnect, and Autohome.
(4) Figures may not match totals due to rounding.
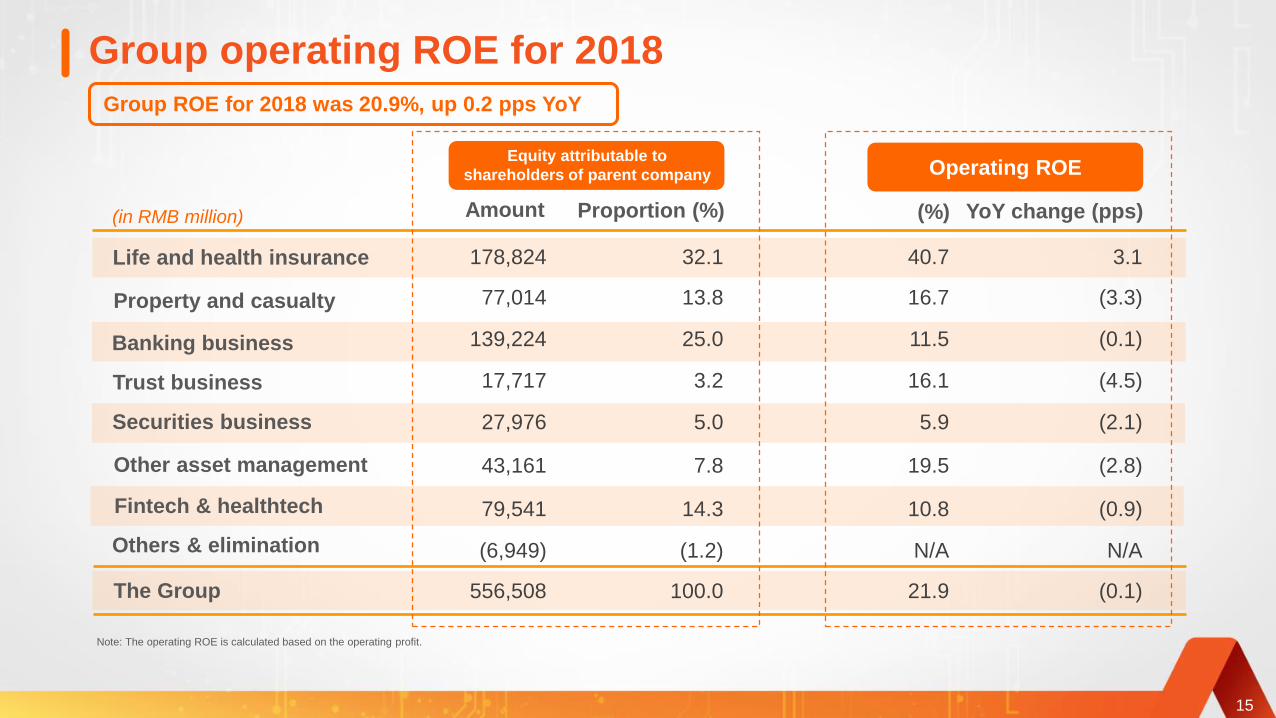
Group operating ROE for 2018
Note: The operating ROE is calculated based on the operating profit.
15
Group ROE for 2018 was 20.9%, up 0.2 pps YoY
178,824 32.1 40.7 3.1
77,014 13.8 16.7 (3.3)
139,224 25.0 11.5 (0.1)
17,717 3.2 16.1 (4.5)
27,976 5.0 5.9 (2.1)
43,161 7.8 19.5 (2.8)
79,541 14.3 10.8 (0.9)
(6,949) (1.2) N/A N/A
556,508 100.0 21.9 (0.1)
Amount Proportion (%) (%) YoY change (pps)
Equity attributable to
shareholders of parent company Operating ROE
Property and casualty
The Group
Banking business
Securities business
Trust business
Other asset management
Fintech & healthtech
Others & elimination
(in RMB million)
Life and health insurance

Operating profit: excluded non-operating items to reflect
underlying results and trend
(in RMB million)
120,452
12,853
(265)(7,236)
125,804
(13,231)
112,573
16
Operating Profit =
Net Profit - Short-term Investment Variance - Impact of Discount Rate Change - One-off Material Non-operating Items
Net profit for
2018
Short-term
investment
variance of L&H (1)
Impact of discount
rate change of
L&H
Operating profit
attributable to
shareholders of the
parent company for 2018
Operating profit
for 2018
Operating profit
attributable to
non-controlling
interests
One-off material
non-operating
items (2)
Notes: (1) Short-term investment variance is the variance between the actual investment return and the EV ultimate investment return assumption (5%), net of the associated impact on insurance and investment contract liability.
(2) The impact of one-off non-operating item in 2018 was the fair value revaluation gain of the convertible bonds issued by Lufax Holding to the Group as the consideration of Puhui transaction. The fair value of
the convertible bonds significantly increased due to Lufax Holding’s Series C financing.
(3) Figures may not match totals due to rounding.

L&H operating profit attributable to shareholders of the
parent company rose 34.9% YoY (in RMB million)
2017
49,811
7,357
10,108
72,912
(20,088)
52,824
2018
62,287
8,959
21,749
98,043
(26,698)
71,345
YoY change
(%)
25.0
21.8
115.2
34.5
32.9
35.1
52,12870,320 34.9
5,6375,048 (10.4)
616,319
177,485
28,498
(62,287)
26,617
786,633
17
End-2017 Residual
margin of L&H
Expected interest
growth
End-2018 Residual
margin of L&H
Contribution from
new business
Release of residual
margin
Lapse variances
and others
Release of residual margin
Return on net worth(1)
Operating variance and others(3)
Total operating profit before tax
Income tax
Total operating profit after tax
Operating profit attributable to the
parent company
Spread income(2)
Notes:(1) Return on net worth is the investment return on shareholder equity based on the EV ultimate investment return assumption (5%).
(2) Spread income is the expected investment return from assets backing contract liability based on the EV ultimate investment return assumption (5%) exceeding the interest required on contract liability.
(3) Operating variance and others include the impacts of operating assumption changes on profit, which were RMB2,649 million and RMB-3,909 million for 2018 and 2017 respectively.
The year-on-year change would be 36.3% if this impact is excluded.
(4) Figures may not match totals due to rounding.

L&H residual margin release rose 25% YoY
11.2%
Other products
Long-term protection
2016 2017 20182014 2015
30%31%
30%
25%
CAGR 29%(in RMB million)
11.5% 11.5% 11.0% 10.1%
Residual Margin Release / Opening Residual Margin
18
58%
22,519
29,267
73%
38,202
49,811
62,287
72%
69%63%
RM release: • Major source of profit • Locked in at issuance • Immune to capital market fluctuation
Notes: (1) The above figures are data of Ping An Life for 2014-2015 and data of the L&H business for 2016-2018.
(2) Long-term protection products cover whole-life, term life, illness and long term accident insurance. The critical illness plus savings combination sold over
the past two years contains high protection elements, though its main products are classified as Long-PPP Protection & Saving hybrid due to conservative classification.

3. Embedded value
19
Financial ReviewOverview Insurance Business Fintech & Healthtech BusinessBanking Business

EV per share was RMB54.84, up 21.5% YoY
825,173
1,002,456
(in RMB million)
45,326
93,237 14,54642,253 1,020,535
7,236
(33,270)
7,955
Group Operating
ROEV = 23.7%
20
Notes: (1) Value generation of new business includes NBV (RMB72,294 million) and risk diversification effects (RMB20,943 million).
(2) Operating contribution of L&H includes operating assumptions and model changes (RMB608 million), L&H operating variance and others (RMB13,938 million).
(3) Non-operating profit of other businesses in 2018 refers to the impact of the fair value revaluation gain of the convertible bonds issued by Lufax Holding to the
Group as the consideration of Puhui transaction. The fair value of the convertible bonds significantly increased due to Lufax Holding’s Series C financing.
(4) Investment variance and others include economic assumption changes, investment variance and market value adjustments.
(5) Dividend paid by the Company to shareholders (RMB33,270 million).
End-2017
Group EV
Expected
return on EVOperating
contribution of
L&H(2)
End-2018
Group EVValue
generation of
new business(1)
Group EV
before non-
operating
contributions
Investment
variance and
others(4)
Dividend
paid(5)
Operating
profit of
other
businesses
Non-operating
profit of other
businesses(3)

Operating ROEV of L&H was 30.8%
496,381
45,326
93,237
14,546 649,489
(5,042)(31,224)
613,223
Operating ROEV
of L&H = 30.8%
Unwind was RMB38,522 million.
ANA return was RMB6,805 million.
(in RMB million)
21
Notes: (1) Expected return on EV consists of the expected return from opening adjusted net assets, the opening value of in-force and the NBV during the Reporting Period.
(2) Value generation of new business includes NBV (RMB72,294 million) and risk diversification effects (RMB20,943 million).
(3) Operating contribution includes operating assumption and model changes (RMB608 million), operating variance and others (RMB13,938 million).
(4) Investment variance and others include the investment variance and market value adjustments.
(5) Dividends paid by Ping An Life to the Group amounted to RMB31,449 million. The Company injected RMB225 million of capital into Ping An Health.
(6) Figures may not match totals due to rounding.
End-2017 L&H EV Expected
return on EV(1)
Operating
contribution(3)
End-2018 L&H EVValue generation of
new business(2)
L&H EV before
non-operating
contributions
Investment
variance and
others(4)
Dividend paid
and capital
injected(5)

Sustained NBV growth of L&H while business quality enhanced
Notes: (1) Long-term protection covers whole-life, term life, critical illness and long term accident insurance.
(2) PPP stands for premium paying period. Long-PPP Protection & Saving hybrid covers endowment and annuity with PPP no less than 10 years. The critical illness plus savings combination
sold over the past two years contains high protection elements, though its main products are classified as Long-PPP Protection & Saving hybrid due to conservative classification.
(3) Figures may not match the calculation due to rounding.
2017
67,027
330
67,357
171,547
39.3%
60,786
46,933
3,431
8,113
2,309
716
5,524
2018
71,874
420
72,294
165,446
43.7%
64,401
48,975
5,192
7,577
2,657
865
6,608
YoY change(%)
7.2
27.2
7.3
(3.6)
5.9
4.4
51.3
(6.6)
15.1
20.7
19.6
4.4 pps
(in RMB million)
22
Retail business
Agent channel
Long-term protection (1)
Protection & Saving hybrid (long-PPP) (2)
Protection & Saving hybrid (short-PPP)
Short-term insurance
Bancassurance
Telemarketing, internet and others
Group business
Total NBV
Total FYP
NBV margin

Operating ROEV was consistently high
Note: The averages of operating ROEV were calculated on a geometric average basis.
23
5-year average of
Group operating ROEV = 22.2%
5-year average of
L&H operating ROEV = 27.2%
2014 2015 2016 2017 2018 2014 2015 2016 2017 2018
20.0% 19.5%21.0%
26.7%
23.7%
21.7% 21.4%
27.0%
35.5%
30.8%

EV and NBV exhibited low sensitivity to future investment
return(in RMB million)
Group EV
1,002,456
10% increase
in mortality,
morbidity and
accident rates
Investment return
decreased by
50bps per annum
and risk discount
rate decreased by
50bps
-3.3% -2.0%
Notes: (1) In the above investment sensitivity scenarios, adjusted net asset value will not change with future investment returns.
(2) Figures may not match the calculation due to rounding.
NBV
72,294-4.6% -8.6%
24
10% increase
in mortality,
morbidity and
accident rates
Investment return
decreased by
50bps per annum
and risk discount
rate decreased by
50bps

4. Dividends and capital
25
Financial ReviewOverview Insurance Business Fintech & Healthtech BusinessBanking Business

2014 2015 2016 2017 2018
4.8X
6,549
9,688
13,710
27,420
14.7%
31,442
Rising dividends
RMB
1.72/
shareRMB
1.50/
share
RMB
0.75/
share
RMB
0.53/
share
RMB
0.375/
share
26
(in RMB million)
Total ordinary dividend per share
for FY18 was RMB1.72(2) , up
14.7% YoY comprising RMB0.62
interim dividend and RMB1.10
proposed final dividend.
The total ordinary cash dividend
of RMB31,442 million for FY18
equates to a 27.9% payout ratio
on the Group’s operating profit
attributable to shareholders of
the parent company.
Notes: (1) On August 4, 2015, the Company completed the conversion of the capital reserve into share capital in the proportion of 10 shares for every 10 shares held. The Company recalculated the dividend per share for 2014.
(2) In addition, the Company distributed the 30th Anniversary Special Dividend of RMB0.20 per share in the first quarter of 2018.
We increased dividends in light of the growing profitability and strong solvency position.

The Company plans to repurchase A shares
worth RMB5-10 billion.
The repurchase will be completed within 12
months following an approval at an annual
general meeting and a separate class
meeting of shareholders.
All the funds to be used for the
repurchase will come from the
Company’s free cash.
The repurchase will NOT have material
negative impacts on the Company's
operations, financial position, fulfillment of
repayment obligations and future
development.
Share repurchase
Details of the
repurchaseSource of funds Impact of the
repurchase
27

Free cash of the parent company
(in RMB million)
Dividends from
subsidiariesDividends paid
out by the Group
Capital injected
into subsidiaries
Other
impacts
End-2018
free cash
38,332
48,566
(33,270)
(8,584)
42,010
End-2017
free cash
(3,034)
28
Notes: (1) The free cash of the Company includes bonds, equity securities, bank deposits and cash equivalents held by the Company. The free cash can be invested in subsidiaries or used in daily operations or for
dividend distribution.
(2) Dividends from subsidiaries include RMB31,449 million from Ping An Life, RMB7,001 million from Ping An Property & Casualty, RMB6,492 million from Ping An Trust, RMB2,467 million from Ping An Asset
Management, and RMB1,157 million from Ping An Bank.

Strong capital adequacy position
Ping An Group(regulatory requirement ≥ 100%)
Ping An Life(regulatory requirement ≥ 100%)
Comprehensive solvency margin ratio
Dec 31, 2017
In January 2019, Ping An Bank issued
A-share convertible bonds worth
RMB26,000 million, of which RMB3,700
million was injected into Core Tier 1
upon issuance and the balance will be
additive to Core Tier 1 upon conversion.
8.54%8.36% 8.28%
Dec 31, 2017Dec 31, 2016 Dec 31, 2018
Dec 31, 2016 Dec 31, 2018
223.8%267.3%
217.5%
218.8%225.9% 234.1%
216.4%210.0% 214.9%
Core tier 1 capital adequacy ratio
29
Ping An P&C(regulatory requirement ≥ 100%)
Ping An Bank(regulatory requirement ≥ 7.5%)

Strong solvency ratio resilient to capital market volatility
Comprehensive
solvency adequacy
requirement ≥ 100%
Ping An Life Ping An P&CPing An Group
-10.5 pps -7.7 pps
216.4%
-14.4 pps -14.2 pps
218.8%
-3.9 pps
0.5 pps223.8%
Core solvency
adequacy
requirement ≥ 50%
30
Decline of 50bps in
interest rates
Decline of 30% in fair value
of equity assets
Benchmark
Note: Figures may not match the calculation due to rounding.

5. Investment portfolio of
insurance funds
Overview Financial Review Insurance Business Fintech & Healthtech BusinessBanking Business
31
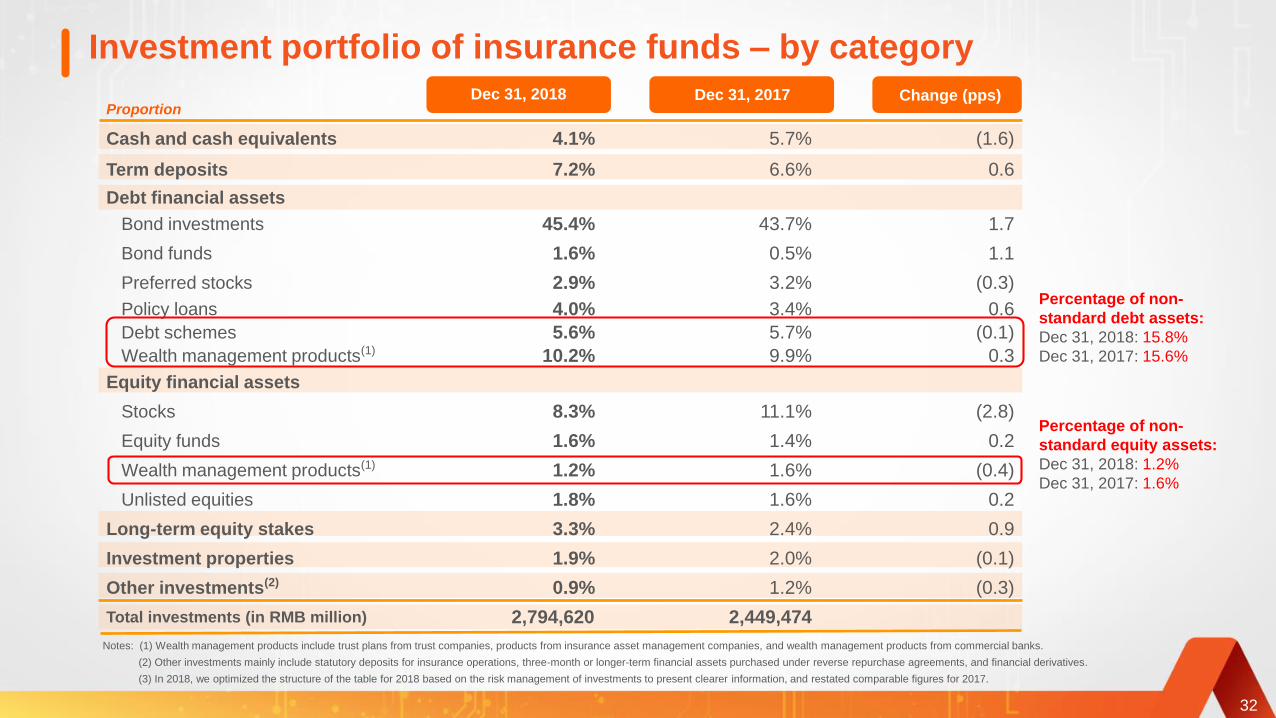
Notes: (1) Wealth management products include trust plans from trust companies, products from insurance asset management companies, and wealth management products from commercial banks.
(2) Other investments mainly include statutory deposits for insurance operations, three-month or longer-term financial assets purchased under reverse repurchase agreements, and financial derivatives.
(3) In 2018, we optimized the structure of the table for 2018 based on the risk management of investments to present clearer information, and restated comparable figures for 2017.
Proportion
Cash and cash equivalents 4.1% 5.7% (1.6)
Term deposits 7.2% 6.6% 0.6
Debt financial assets
Bond investments 45.4% 43.7% 1.7
Bond funds 1.6% 0.5% 1.1
Preferred stocks 2.9% 3.2% (0.3)
Policy loans 4.0% 3.4% 0.6
Debt schemes 5.6% 5.7% (0.1)
Wealth management products(1) 10.2% 9.9% 0.3
Equity financial assets
Stocks 8.3% 11.1% (2.8)
Equity funds 1.6% 1.4% 0.2
Wealth management products(1) 1.2% 1.6% (0.4)
Unlisted equities 1.8% 1.6% 0.2
Long-term equity stakes 3.3% 2.4% 0.9
Investment properties 1.9% 2.0% (0.1)
Other investments(2) 0.9% 1.2% (0.3)
Total investments (in RMB million) 2,794,620 2,449,474
Percentage of non-
standard debt assets:
Dec 31, 2018: 15.8%
Dec 31, 2017: 15.6%
Dec 31, 2018 Dec 31, 2017 Change (pps)
Percentage of non-
standard equity assets:
Dec 31, 2018: 1.2%
Dec 31, 2017: 1.6%
32
Investment portfolio of insurance funds – by category
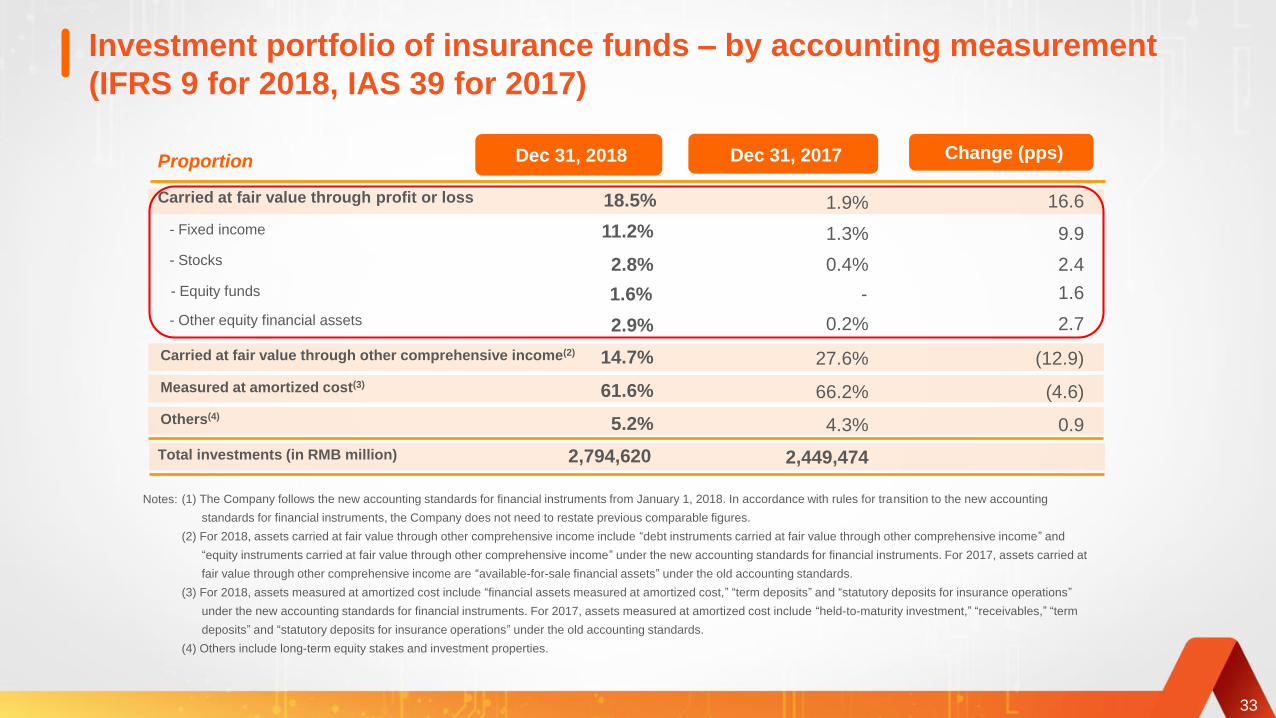
Investment portfolio of insurance funds – by accounting measurement
(IFRS 9 for 2018, IAS 39 for 2017)
Dec 31, 2018 Dec 31, 2017 Change (pps)
Carried at fair value through profit or loss 18.5% 1.9%
- Fixed income
- Stocks
- Equity funds
- Other equity financial assets
11.2%
2.8%
1.6%
2.9%
1.3%
0.4%
-
0.2%
Carried at fair value through other comprehensive income(2)
Measured at amortized cost(3)
Total investments (in RMB million)
14.7%
61.6%
2,794,620
27.6%
66.2%
2,449,474
Others(4)5.2% 4.3%
Proportion
16.6
9.9
2.4
1.6
2.7
(12.9)
(4.6)
0.9
(1) The Company follows the new accounting standards for financial instruments from January 1, 2018. In accordance with rules for transition to the new accounting
standards for financial instruments, the Company does not need to restate previous comparable figures.
(2) For 2018, assets carried at fair value through other comprehensive income include “debt instruments carried at fair value through other comprehensive income” and
“equity instruments carried at fair value through other comprehensive income” under the new accounting standards for financial instruments. For 2017, assets carried at
fair value through other comprehensive income are “available-for-sale financial assets” under the old accounting standards.
(3) For 2018, assets measured at amortized cost include “financial assets measured at amortized cost,” “term deposits” and “statutory deposits for insurance operations”
under the new accounting standards for financial instruments. For 2017, assets measured at amortized cost include “held-to-maturity investment,” “receivables,” “term
deposits” and “statutory deposits for insurance operations” under the old accounting standards.
(4) Others include long-term equity stakes and investment properties.
Notes:
33

Total investment income is more sensitive to capital market
volatility under IFRS 9
(1) Net investment income includes interest income from deposits and debt financial assets, dividend income from equity financial assets, operating lease income from investment properties, and the share of profits and
losses of associates and jointly controlled entities.
(2) Realized gains include realized capital gains from securities investments.
(3) Fair value changes and others include fair value changes in financial assets carried at fair value through profit or loss, and impairment losses on investment assets.
(4) Net exchange gains or losses on investment assets denominated in foreign currencies are excluded from computing of investment yields.
(5) The Group follows the new accounting standards for financial instruments from January 1, 2018. In accordance with rules for transition to the new accounting standards for financial instruments, the Company does
not need to restate comparable figures for the same period in 2017.
126,707 280
(37,486)
89,501
Net investment
income(1)
Realized gains(2) Total investment
income
Fair value
changes and
others(3)
Notes:
(in RMB million)
Total investment
income under old
accounting
standards
Investment
income
adjustments
125,97036,469
Total investment yield
Net investment yield
2018
3.7%
5.2%
2017
6.0%
5.8%
Total investment yield under
former IAS 39 accounting
standards
5.2% 6.0%
Investment yieldInvestment income
34

Corporate bonds: account for 5.8% of investment assets
Investment
assets
RMB2.79
trillion
Corporate bonds in capital
markets: 5.8%≈ 92% AA and higher ratings
≈ 80% AAA ratings
Three levels
of corporate
bond risk
management
Level 1
Asset
allocation
Level 2
Admission
management
Level 3
Dynamic
review
Effective, robust strategic asset allocation plan
based on sophisticated simulations and models
for each portfolio, considering risk appetite, return
and liquidity
94.2%
Including:
Subject to strict internal and external credit rating
and admission management, to ensure that credit
ratings reasonably reflected the credit profiles of
bond issuers
Conduct ex-ante monitoring of corporate bonds
with potential risks on the basis of a name list,
build a quick response mechanism to deal with
negative opinions, and effectively identify and
report high-risk corporate bonds
35

Non-standard debt assets: generate 5.84% nominal yield
16.5
6.3
34.9
5.5
6.6
30.8
22.2
2.7
9.4
100.0
Investment
proportion (%)
Expressway
Electric power
Infrastructure
Infrastructure and development zones
Others (water supply, environmental protection, railway...)
Non-banking financial services
Real estate
Coal mining
Others
Total
5.88
5.50
5.77
5.69
5.84
5.73
6.14
7.20
5.75
5.84
Nominal yield (%)
5.41
2.89
5.17
7.59
4.74
3.77
2.33
2.08
4.23
3.96
Remaining maturity
(year)
Note: Non-banking financial services refer to financial institutions other than banks, including insurers, asset management companies and financial leasing companies.
36

37
Lee Yuansiong
Co-CEO
Insurance Business
Overview Financial Review Insurance Business Fintech & Healthtech BusinessBanking Business

Quarterly NBV growth rate accelerated
20172018 YoY change (%)(in RMB million)
Total FYP 171,547165,446 (3.6)
Total NBV 67,35772,294 7.3
Quarterly YoY growth of NBV
NBV margin 39.3%43.7% 4.4 pps
NBV
-8%
10% 11%
24%
1Q 2018 2Q 2018 3Q 2018 4Q 2018
YoY growth of NBV
38

Sustained growth of NBV per agent
Note: Figures may not match the calculation due to rounding.
1.32
+5.9%
64,401
60,786
46,413
+31.0%
+4.8%
1.32
1.26
0.99+27.3%
+1.1%
+2.9%
39
2018
2017
2016
2018
2017
2016
2018
2017
2016
48,243
48,789
46,882
NBV of agent channel(RMBmn)
NBV per agent(RMB)
Average agent force(mn persons)
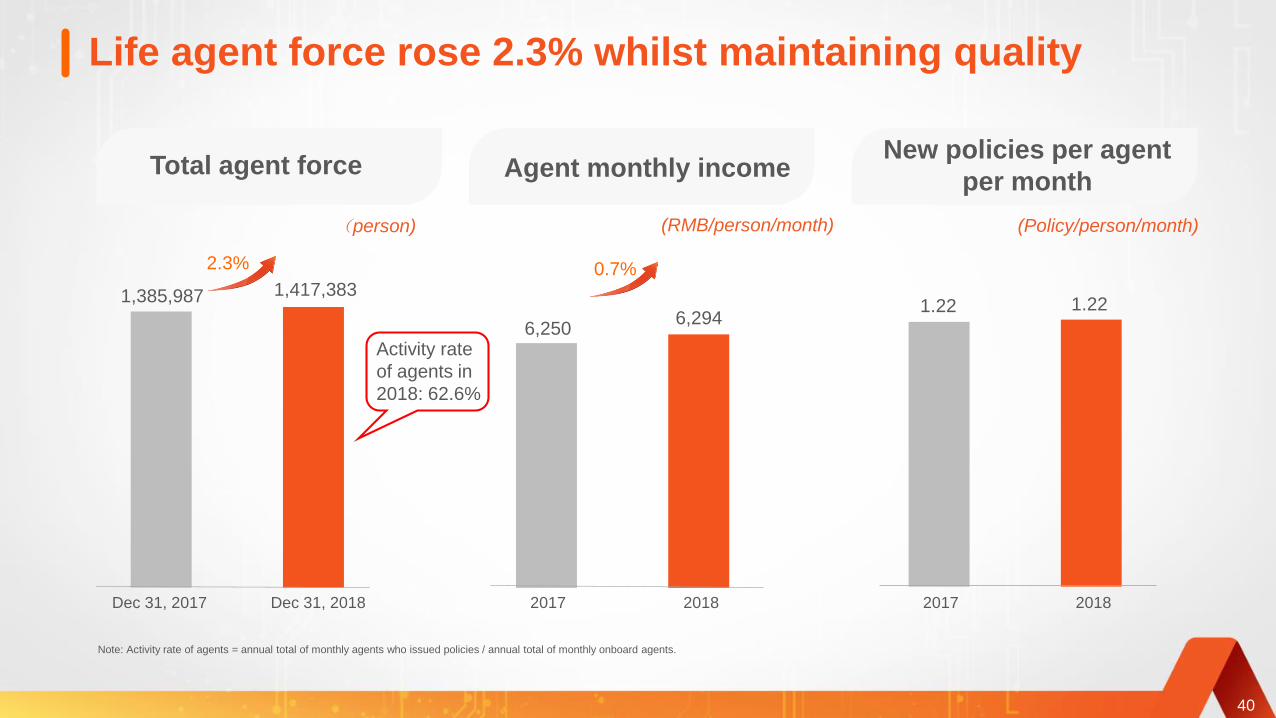
Life agent force rose 2.3% whilst maintaining quality
Total agent force Agent monthly income New policies per agent
per month
2.3%
Dec 31, 2018Dec 31, 2017 20182017 2017 2018
1,417,3831,385,987
6,2506,294
(Policy/person/month)(RMB/person/month)(person)
1.22 1.22
Activity rate
of agents in
2018: 62.6%
0.7%
40
Note: Activity rate of agents = annual total of monthly agents who issued policies / annual total of monthly onboard agents.

Empower Life Insurance with technologies
Automatic
Q&ASpeech
recognition
Speech
synthesis
Facial
recognition
Smart
guidance
Emotion
understanding
engine
Shape
recognitionKnowledge
inference engine
Deep neural
network
Intent
recognition
engine
Q&A
engine
Decision-
making
engine
Smart task
assignment
AI-based
recommendation
Voice
interaction
Deeplink LBS
Big data
Technical support
AI-based screening and interview functionalities
went live for the agent channel:
• Applied to over 11 million potential agents
• An accuracy rate of 95.4% in identifying
agents who would remain with Ping An for
13 months
• Of the nearly 20 million insurance applications
per year, 96% were underwritten by AI
automatically in real time.
• Of the 40 million policy administration cases,
90% were processed by AI automatically.
• Of the 3.81 million claims, 60% were settled
within 30 minutes, the shortest turnaround time
being 26 seconds.
• Designated family doctors were assigned to 60%
or 33 million of customers, handling 2.2 online
consultations per customer. All the customers
enrolled after 2016 have been assigned family
doctors.
Sales Management
Upgraded the “Jin Guan Jia” app
• Recommend products based on precise profiling
and develop customers by segment
• 184 million registered users
• Over 26 million monthly active users
Customer Development
Smart Customer Services
AI
41
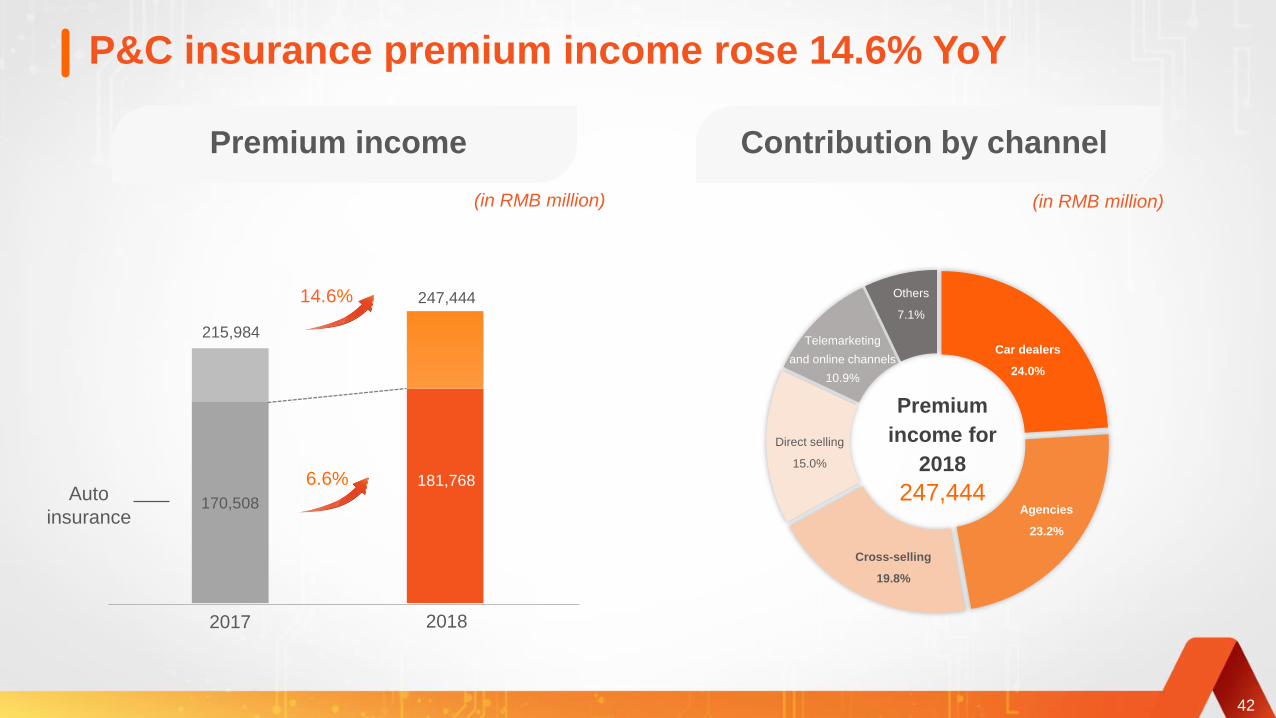
P&C insurance premium income rose 14.6% YoY
170,508
181,768
2017 2018
215,984
247,444
(in RMB million) (in RMB million)
Premium income Contribution by channel
14.6%
6.6%Auto
insurance
42
Others
7.1%
Cross-selling
19.8%
Car dealers
24.0%
Telemarketing
and online channels
10.9%
Premium
income for
2018
247,444Agencies
23.2%
Direct selling
15.0%

P&C combined ratio improved 0.20 pps to 96.0%
Breakdown of premium income
and combined ratio
(in RMB million)
Guarantee
insurance33,012
Accidental injury
insurance
Corporate property
insurance
Auto insurance 181,768
8,422
5,701
Liability insurance 8,463
Combined ratio
96.2%96.0%
Combined ratioPremium income
6.6
66.1
34.6
49.5
8.9
88.6%
97.4%
94.4%
82.3%
89.9%
-
(0.1)
11.6
4.1
(1.3)
AmountYoY change
(%)Ratio
YoY change
(pps)95.9%95.6%
95.3%
43
2014 2015 2016 2017 2018
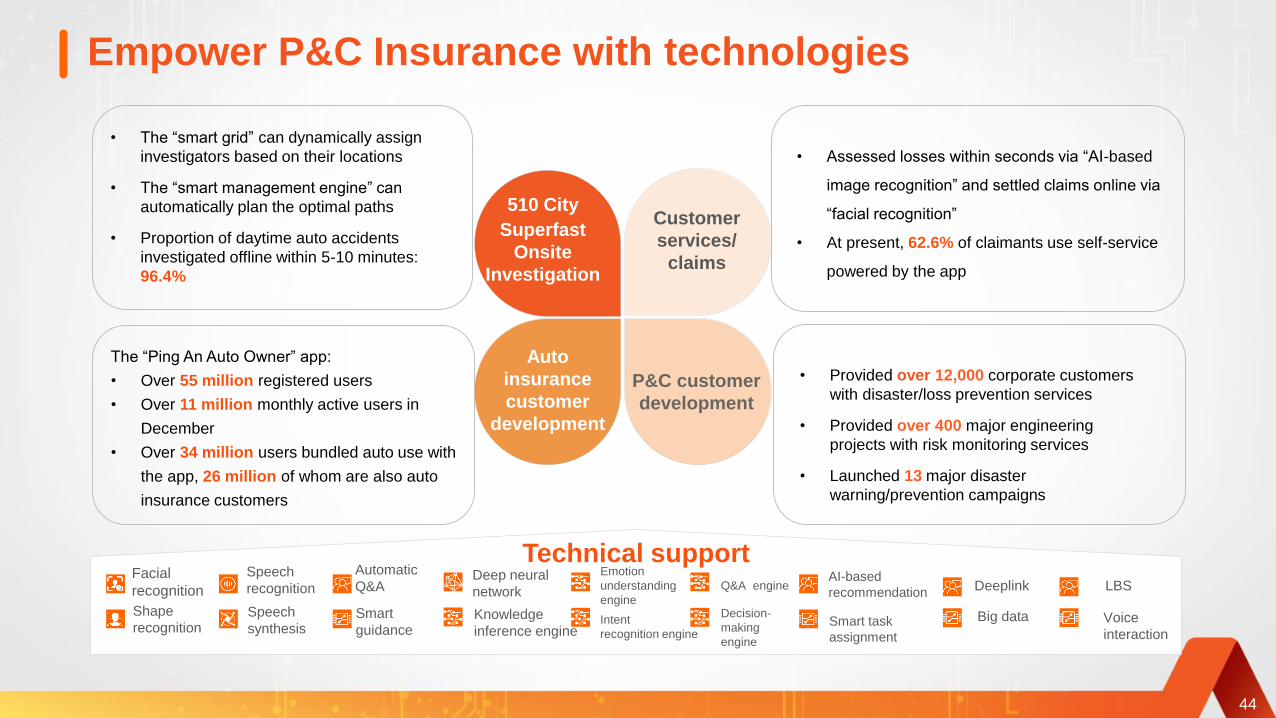
Empower P&C Insurance with technologies
AI customer
service/claims
510 City
Superfast
Onsite
Investigation
• The “smart grid” can dynamically assign
investigators based on their locations
• The “smart management engine” can
automatically plan the optimal paths
• Proportion of daytime auto accidents
investigated offline within 5-10 minutes:
96.4%
The “Ping An Auto Owner” app:
• Over 55 million registered users
• Over 11 million monthly active users in
December
• Over 34 million users bundled auto use with
the app, 26 million of whom are also auto
insurance customers
• Assessed losses within seconds via “AI-based
image recognition” and settled claims online via
“facial recognition”
• At present, 62.6% of claimants use self-service
powered by the app
44
Automatic
Q&ASpeech
recognition
Speech
synthesis
Facial
recognition
Smart
guidance
Emotion
understanding
engineShape
recognitionKnowledge
inference engine
Deep neural
network
Intent
recognition engine
Q&A engine
Decision-
making
engine
Smart task
assignment
AI-based
recommendation
Voice
interaction
Deeplink LBS
Big data
Technical support
Customer
services/
claims
Auto
insurance
customer
development
P&C customer
development
• Provided over 12,000 corporate customers
with disaster/loss prevention services
• Provided over 400 major engineering
projects with risk monitoring services
• Launched 13 major disaster
warning/prevention campaigns
45
Xie Yonglin
Co-CEO
Banking Business
Overview Financial Review Insurance Business Fintech & Healthtech BusinessBanking Business

Net profit of Ping An Bank rose 7% YoY
Net interest margin
(in RMB million)
Net profit
7.0%
23,189 24,818
10.3%
105,786
Revenue ROE
2017 2018 2017 20182017 2018 2017 2018
-0.02 pps -0.1 pps
46
2.37% 2.35%
116,716
11.6% 11.5%

Continued execution of retail transformation in FY18
Total loans
% of retail
banking:
57.8%
% of retail
banking:
53.0%
Revenue
2016 2017 2018
53.0%
44.1%
30.6%
57.8%
49.8%
36.7%
% of retail
banking:
69.0%
Net profit
69.0%67.6%
41.2%
47
Dec 31,
2016
2016 2017 2018Dec 31,
2017
Dec 31,
2018

De-risking: asset quality has improved significantly since 2016
Asset quality improved Dec 31, 2018 Dec 31, 2017 Dec 31, 2016
Percentage of special mention loans 2.73% 3.70% 4.11%
Percentage of loans more than 90
days overdue 1.70% 2.43% 2.75%
Non-performing loan ratio 1.75% 1.70% 1.74%
NPL recognition improved
Deviation ratio of non-performing
loans(1)97% 143% 158%
Stronger provisioning
Provision coverage ratio of loans
more than 90 days overdue 159.45% 105.67% 98.51%
Provision coverage ratio 155.24% 151.08% 155.37%
Note: (1) Deviation ratio of non-performing loans = Balance of loans more than 90 days overdue / balance of non-performing loans
48

Retail loans recorded strong growth and stable quality due to the
Group’s support
49
Retail loan growth YoY %
57.0%
22.6 %35.9%
Cross-selling channel’s contributions
to retail banking (2018)Retail loans grew strongly
Dec 31, 2016 Dec 31, 2017 Dec 31, 2018 Credit cards issued Xin Yi Dai loans
granted
Auto loans granted
0.27%
0.16%0.20% 0.18%
0.12%
0.12%0.18% 0.16%
0.48% 0.45%
0.35%0.29% Xin Yi Dai
Auto loans
Credit card receivables
2015 2016 2017 2018
M6 loans more than 30 days overdue
Note: The proportion of loans more than 30 days overdue as at the end of the 6-month vintage period = the balance of current-year new loans or credit card receivables more than 30 days overdue as at the
end of the 6-month vintage period / the balance of current-year new loans or credit card receivables that have been on books for 6 months.
Cross-selling Other channels
43.4%
76.9% 56.6% 61.0%
23.1%39.0%

797,600
1,086,688
1,416,796
Growing retail deposits
Growing retail deposits
Retail deposits % of retail deposits
(in RMB million)
Increased customer assets and
took deposits by adhering to the
strategy of customer
development and resources
allocation
Raised settlement deposits by
developing payroll and acquiring
services
Boosted retail deposits by
enhancing active liability products
Dec 31, 2017 Dec 31, 2018
Retail AUM
Dec 31, 2016
50
Dec 31, 2016 Dec 31, 2017 Dec 31, 2018
26.8%
35.4%
36.2%
30.4%
17.0%
14.0%
21.7%340,999
269,022
461,591

Empower banking business with technologies
“Ping An Pocket
Bank” app
New offline retail
outlets
Smart OMO service system
Online: The “Ping An Pocket Bank” app had 25.88 million
monthly active users, up 74.6% YoY
Offline: Built 136 new offline retail outlets
Increased investment in technology
Implemented agile transformation
Promoted technological innovations
IT capital expenditure grew by 82% YoY in 2018
IT staff members (including outsourcing personnel) grew to
nearly 6,000, up by over 44% from the beginning of 2018
Under the lean and agile R&D models, Ping An
Bank’s business requirement development
deliveries increased by over 100% YoY in 2018
Ping An Bank applied the robotic process automation
(RPA) technology to various use cases, including
background checking for corporate account opening;
business processing efficiency rose by over 60%
compared with manual operation
51

Financial Review Insurance Business Fintech & Healthtech BusinessBanking Business
52
Overview
Fintech & Healthtech Business
Jessica Tan
Co-CEO

Technological innovations: Ping An’s core technologies lead the Group’s innovations
53
• Technology: The facial and voiceprint recognition technologies have accuracy
rates of 99.8% and 99.7% respectively.
• AI + risk management: 1,500 million+ inquiries with smart risk management
products
• AI + operations: Through “510 City Superfast Onsite Investigation” services,
96.4% of the urban onsite auto claim investigations were processed within 5-10
minutes in daytime in 2018.
• World-leading technologies: 50,000+ transactions per second with
latency lower than 0.05 seconds
• Application: The world's largest commercial blockchain platform covering
over 200 banks, 200,000 enterprises and 500 government and other
commercial organizations.
• Technology: 12 authoritative certifications and over 400 cloud computing
patent applications
• Application: Users from financial services, health care and other industries
AI
Blockchain
Cloud
Contests
Technology patents• 12,051 technology patent applications
• 3,397 technology patent applications filed under the
Patent Cooperation Treaty (PCT) and abroad
Awards and certifications• Won the Wu Wenjun AI Science & Technology
Award
• FiMax won the IDC FinTech Ranking Real Result
Award
• Ranked No.1 in the 2018 SQuAD2.0 contest
• The AI-based medical decision support system
defeated doctors by a margin of 86.2-51.5
Staff
• 99,000 fintech and healthtech staff members
• 29,000 R&D staff members

Autohome
2018
Fintech & healthtech operating profit attributable to shareholders of the
parent company up 24.9% YoY
Ping An Good
Doctor
2018
OneConnect
2018
Ping An
HealthKonnect
2018
Stage 1
Platform
establishment
Stage 2
Traffic and data
accumulation
Stage 3
Explosive revenue
growth
Stage 4
Profit contribution
OneConnect
2017
Ping An
HealthKonnect
2017
Contribution to the Group’s
operating profitFour stages of incubation of tech companies
Note: The above stages are classified by the Company based on the operations.
(in RMB million)
Autohome
2017
Lufax
Holding
2018
Lufax
Holding
2017
54
Ping An Good
Doctor
2017
-4000
-2000
0
2000
4000
6000
8000
5.7% 6.0%
5,420
-3,309
6,770
-4.8%
2016
2017 2018
Operating profit attributable to shareholders
of the parent company
% of the Group's operating profit attributable
to shareholders of the parent company

Lufax Holding:the world-leading online wealth management platform
and retail lending tech platform
• Wealth management: Lufax Holding is the leading online wealth management platform in China, with a leading market share. AUM stabilized and began to
rise in Q4.
• Retail lending: Lufax Holding is the leading non-bank retail lending platform in China, with a steadily growing scale and stable credit quality.
• Government finance: Lufax Holding provides governments with customized smart fiscal management solutions. With first-mover advantages, the solutions
have been deployed in several provinces and cities.
(in RMB billion)
Lufax completed its Series C financing at a post-money valuation of USD39,400 million
55
11.17 million
+16.2% YoYActive investors
40.35 million
+19.3% YoYRegistered users
10.28 million
+37.2% YoYAccumulated
borrowers
Government financeSmart Fiscal Cloud launched in 3
cities and expanding into other
regions
Wealth managementExpanding market share in each
segment of investment products
Retail lendingProportion of loans more than 30
days overdue stable at 2.3% (about 1/3 of other P2P
platforms’)
Customer metrics Business metrics
Assets under
management
Post-cleanup
outstanding
products
Legacy
products
461.7
Dec 31, 2017
288.4
375.0
Dec 31, 2018 Dec 31, 2017 Dec 31, 2018
369.4
Business development
+40%
-20%
YoY
+30%
YoY
Post-cleanup
outstanding
products
Loans under
management

Building a fintech service platform covering the whole industry chain
• Focusing on the “technology + business” model, OneConnect provided
over 270 systems and 47 product categories, covering front, middle and
back offices of financial institutions.
• OneConnect established 5 research institutes and won global awards in
areas including AI and blockchain.
56
Domestic business
Expanding overseas and gaining recognition among foreign customers
• OneConnect established subsidiaries in Hong Kong, Singapore and
Indonesia to serve local financial institutions.
• eTradeConnect, a cross-border trade finance platform in Hong Kong
based on OneConnect’s blockchain, was successfully launched.
Overseas business
2,675
Dec 31, 2017 Dec 31, 2018
Financial institutions using
OneConnect’s platform
(institution)
416590
3,289
Other non-
bank financial
institutions
Banks
Insurers
OneConnect: Committed to building a world-leading fintech service cloud platform
covering the whole industry chain, serving 590 banks, 72 insurers and 2,627 non-bank
financial institution customers
23.0%
In early 2018, OneConnect completed its Series A financing at a post-money valuation of USD7,500 million.
1,223 mn timesup 527.2%YoY
Smart certification
products used
RMB20.32 trnup 76.4% YoY
Value of transactions
supported
2.3224.7%YoY
online products
per partner bank
2,6272,245

Ping An Good Doctor: the largest online health care platform in China; IPO
on the HKEX’s Main Board on May 4, 2018
57
Domestic business
Overseas business
RMB3,338 million
+78.7% YoY
265 million
+37.5% YoY
407 million
+92.2% YoY
RMB411 million
+69.8% YoY
2018 Results
Developed a closed loop of online-merge-
offline health care services
• Over 1,000 in-house medical staff members
• Over 5,000 contracted external doctors(1)
• The 1-hour drug delivery network covers 86
cities across China
• The offline network covers over 3,000 health
care institutions
• Acquired Wanjia Healthcare to develop an
offline network
Established a JV with Grab, the largest travel
service company in Southeast Asia, to quickly gain
a footprint in the mobile health care industry in
Southeast Asia via technology export and AI
empowerment
RevenueRevenue of family doctor
business
ConsultationsRegistered users
Note: (1) Contracted external doctors are associated chief physicians or above at 3A hospitals.

Ping An HealthKonnect: committed to becoming China’s leading tech-
powered managed care service platform
58
Technologies Users Services
SHI Cloud
AI
Blockchain
Health risk
profiling
200+
5,000+
69Cloud
Social health
insurance
Private
insurers
Medical
service
providers
Individual
users
Professional
Personalized
Dynamic
Integrated
USD8,800
millionPost-money valuationUSD1,150 million financing in early 2018
Cities servicedSHI and private insurance management
services
Hospitals connected
Cities coveredThe “City OneConnect” app

Autohome: We have accelerated transformation in smart era 3.0,
empowered merchants with AI and cloud, and formed a closed loop
User portal
DealersUsed car
dealers
Car manufa-cturers
Secondary dealers
Driving schools
Garages
Car selling
Car useBrowsingCar
purchaseLearn to
drive
Smart marketing
Smart customer services
Smart trading
Smart finance
Online
AI smart platform
Offline
59
Online trafficThe “Autohome” app had an average of 29 million
independent user visits per day, up 10% YoY.
Closed-loop tradingStrategic investment in ttpai.cn.
Facilitated RMB15,800 million worth of financial
lending and insurance transactions
Cloud platformCovering over 90% of service providers
nationwide: 90+ auto assembly plants, 20,000+
new car dealers, 30,000+ second-hand car dealers
and 70,000+ garages
In 2018, revenue excluding direct vehicle sales
grew 35.4% YoY to RMB7.23 billion, of which
online marketplace business accounted for 11.8%
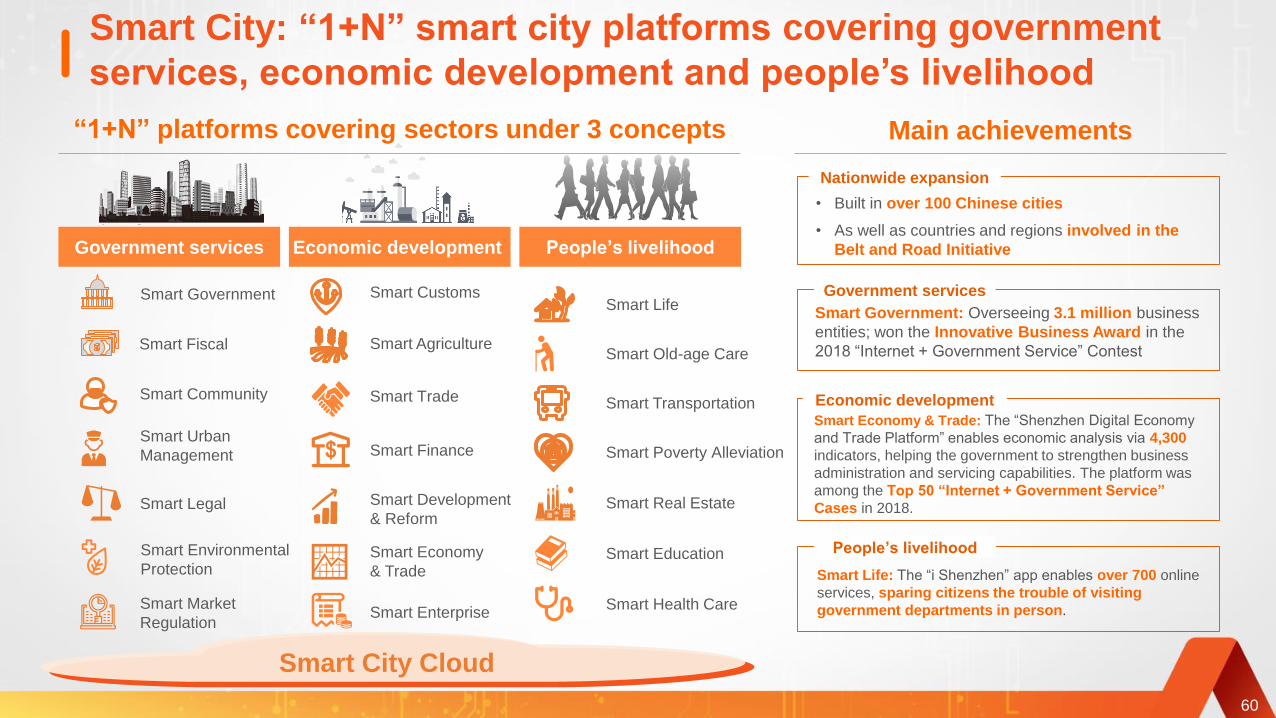
Smart City: “1+N” smart city platforms covering government
services, economic development and people’s livelihood
60
“1+N” platforms covering sectors under 3 concepts
Economic development People’s livelihoodGovernment services
Smart Fiscal
Smart Government
Smart Community
Smart Life
Smart Transportation
Smart Agriculture
Smart Customs
Smart City Cloud
Main achievements
• Built in over 100 Chinese cities
• As well as countries and regions involved in the
Belt and Road Initiative
Nationwide expansion
Smart Urban
Management
Smart Legal
Smart Environmental
Protection
Smart Market
Regulation
Smart Finance
Smart Trade
Smart Development
& Reform
Smart Economy
& Trade
Smart EnterpriseSmart Health Care
Smart Education
Smart Real Estate
Smart Poverty Alleviation
Smart Old-age Care
People’s livelihood
Smart Life: The “i Shenzhen” app enables over 700 online
services, sparing citizens the trouble of visiting
government departments in person.
Government services
Smart Government: Overseeing 3.1 million business
entities; won the Innovative Business Award in the
2018 “Internet + Government Service” Contest
Economic development
Smart Economy & Trade: The “Shenzhen Digital Economy
and Trade Platform” enables economic analysis via 4,300
indicators, helping the government to strengthen business
administration and servicing capabilities. The platform was
among the Top 50 “Internet + Government Service”
Cases in 2018.

Widely honoredRising on Fortune's list
No.383
No.328
No.242
No.181
No.128
No.41
2015
2014
2013
2012
2011
2010
2008
Founded in 1988
No.96
79
55
86
61
53
32
2018
55
• No.6 on Interbrand’s “Best China Brands 2018” list
• No.10 on the “Forbes Global 2000” list, No.1 among
insurance conglomerates across the world, and No.1
among Chinese insurers on the list
• No.1 on the “Brand Finance Insurance 100 2018” list
2016
No.39
2
• “Most Honored Company,” “Best CEO” and “Best CFO”
on the Institutional Investor magazine’s “2018 All-Asia
Executive Team Rankings” list
• No.43 on Millward Brown’s “BrandZ Top 100 Most
Valuable Global Brands 2018” list, again No.1 among
global insurance brands, and No.3 among global financial
brands on the list
• No.8 on the “BrandZ Top 100 Most Valuable Chinese
Brands 2018” list, No.1 among Chinese insurance brands,
and No.2 in China’s financial industry
2017
No.29
10
Honors and Awards
Rising on Fortune 500 list
No.462
61

Q&A

1
Appendices: 2018 Group operating profit (Table A-1)
Trust
See
Table C
(in RMB million)
See
Table B
See
Table DSee
Table E
See
Table F
Life & Health P&C Banking SecuritiesOther Asset
Management
Fintech &
Healthtech
Other
businesses and
elimination
Group
Net profit attributable to shareholders
of the parent company
Non-controlling interests
Net profit (A)
Excluding:
Short-term investment return variance (B)
Impact of discount rate change (C)
Impact of one-off material non-
operating items (D)
Operating profit (E = A – B – C – D)
Operating profit attributable to non-
controlling interests
Note: Figures may not match the calculation due to rounding.
(12,853) (12,853)
265 265
58,757 12,274 24,818 3,012 1,680 9,017 14,984 (4,090) 120,452
843 59 10,424 4 81 753 978 (94) 13,048
57,914 12,215 14,394 3,008 1,599 8,264 14,006 (3,996) 107,404
71,345 12,274 24,818 3,012 1,680 9,017 7,748 (4,090) 125,804
1,026 59 10,424 4 81 753 978 (94) 13,231
70,320 12,215 14,394 3,008 1,599 8,264 6,770 (3,996) 112,573
- -
-
-
-
-
-
-
-
-
-
-
-
-
-
-
7,236
-
-
-
-
-
7,236
Operating profit attributable to
shareholders of the parent company

2
寿险及健康险 财产保险业务 银行业务 信托业务 证券业务其他资产管理
业务
4,532 4,532
(21,213) (21,213)
36,143 13,372 23,189 3,957 2,123 7,503 16,338 (2,647) 99,978
485 65 9,740 4 80 395 68 53 10,890
35,658 13,307 13,449 3,953 2,043 7,108 16,270 (2,700) 89,088
52,824 13,372 23,189 3,957 2,123 7,503 5,488 (2,647) 105,809
696 65 9,740 4 80 395 68 53 11,101
52,128 13,307 13,449 3,953 2,043 7,108 5,420 (2,700) 94,708
- -
-
-
-
-
-
-
-
-
-
-
-
-
-
-
10,850
-
-
-
-
-
10,850
Appendices: 2017 Group operating profit (Table A-2)
(in RMB million)
See
Table B
See
Table CSee
Table DSee
Table E
See
Table F
Life & Health P&C Banking Trust SecuritiesOther Asset
Management
Fintech &
Healthtech
Other
businesses and
elimination
Group
Net profit attributable to shareholders
of the parent company
Non-controlling interests
Net profit (A)
Excluding:
Short-term investment return variance (B)
Impact of discount rate change (C)
Impact of one-off material non-
operating items (D)
Operating profit (E = A – B – C – D)
Operating profit attributable to
shareholders of the parent companyOperating profit attributable to non-
controlling interests
Note: Figures may not match the calculation due to rounding.

3
Appendices: Life & Health earnings (Table B)
Source of Profit Analysis Residual Margin
62,287
8,959
5,048
98,043 72,912
21,749
49,811
7,357
5,637
10,108
71,345 52,824
(26,698) (20,088)
58,757 36,143
616,319
177,485
28,498
786,633 616,319
(62,287)
454,705
168,426
22,642
(49,811)
26,617 20,357
A
2018 2017 Notes
A
(in RMB million) 2018 2017 Note
Release of residual margin
Return on net worth
Spread income
Operating variance and others
Operating profit before tax
Income tax
Operating profit after tax
Net profit
See Table A
See Table A
Note: Figures may not match the calculation due to rounding.
(in RMB million)
Opening residual margin
Contribution from new business
Expected interest growth
Release of residual margin
Lapse variances and others
Closing residual margin

4
2018 Notes2017
B
215,984
188,219
(106,474)
7,112
(38,973)
(41,886)
6,226
96.2%
11,667
219,006
5.3%
120
18,899
13,372
(5,527)
D = B x (1-C)
C
E = F x G
F
G
247,444
211,918
(116,305)
8,480
(49,337)
(44,760)
6,964
96.0%
11,016
249,576
4.4%
19
19,515
12,274
(7,241)
Appendices: P&C earnings (Table C)
(in RMB million)
Premium income
Net earned premiums
Claim expenses
Commission expenses
Administrative expenses
Reinsurance commission revenue
Underwriting profit
Combined ratio
Total investment income
Average P&C investment assets
P&C total investment yield
Other net revenue and expenses
Profit before tax
Income tax
Net profit
Note: Figures may not match the calculation due to rounding.
See Table A

5
2018 2017
I
Notes
K
J
H = I x J
L = - (K x M)
M
O
P
N = - (O x P)
23,189
(6,968)
74,745
3,186,151
2.35%
41,971
(35,391)
32,231
24,818
(7,413)
116,716
30.32%
(43,657)
1,858,353
2.35%
(5,437)
3,120,038
2.37%
31,777
(31,616)
30,157
105,786
29.89%
(40,803)
1,602,503
2.55%
(3,210)
74,009
Appendices: Banking earnings (Table D)
(in RMB million)
Net interest revenue
Average interest earning assets
Net interest margin
Net non-interest revenue
Revenue
General and administrative expenses
Cost-to-income ratio
Loan impairment loss
Average balance of loans (including bill discount)
Credit cost
Other expenses
Profit before tax
Income tax
Net profit
Note: Figures may not match the calculation due to rounding.
See Table A
6
2018 2017 Notes
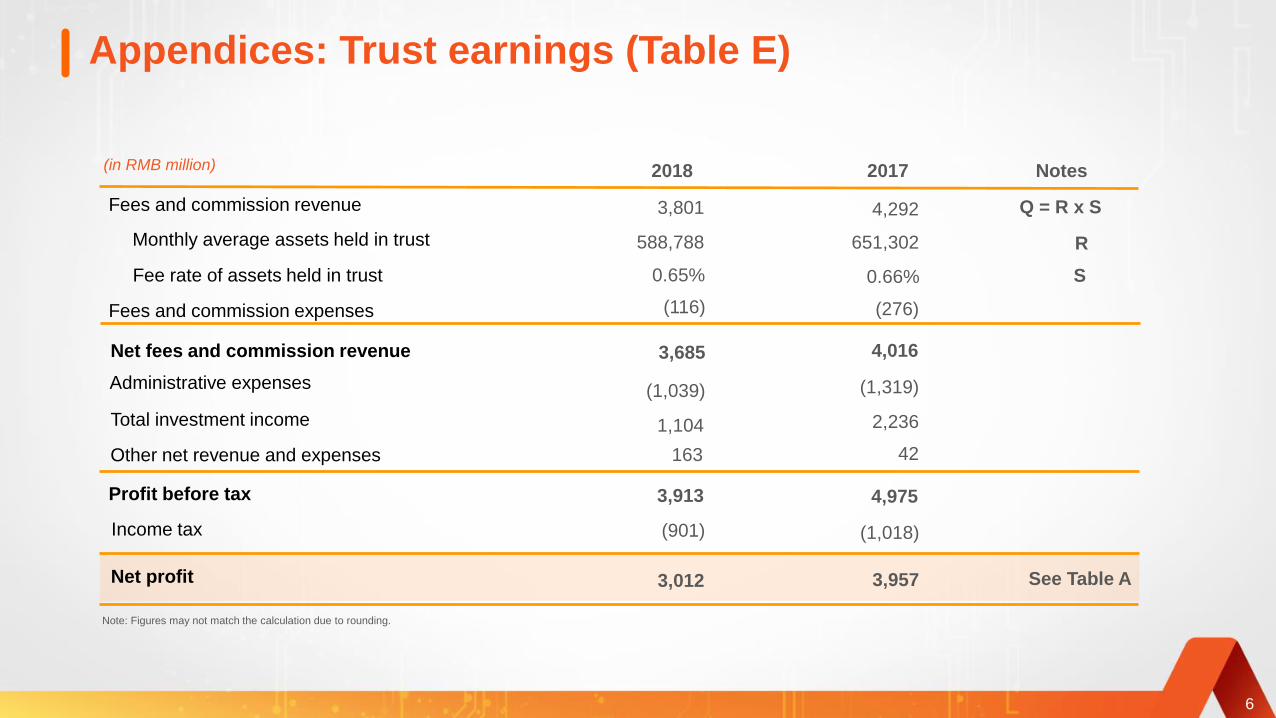
3,801
588,788
0.65%
(116)
(1,039)
3,913
3,012
(901)
3,685
1,104
163
651,302
0.66%
(276)
(1,319)
4,975
3,957
(1,018)
4,016
2,236
42
4,292
R
S
Q = R x S
Appendices: Trust earnings (Table E)
(in RMB million)
Fees and commission revenue
Monthly average assets held in trust
Fee rate of assets held in trust
Fees and commission expenses
Net fees and commission revenue
Administrative expenses
Total investment income
Other net revenue and expenses
Profit before tax
Income tax
Net profit
Note: Figures may not match the calculation due to rounding.
See Table A
7
Notes2018 2017
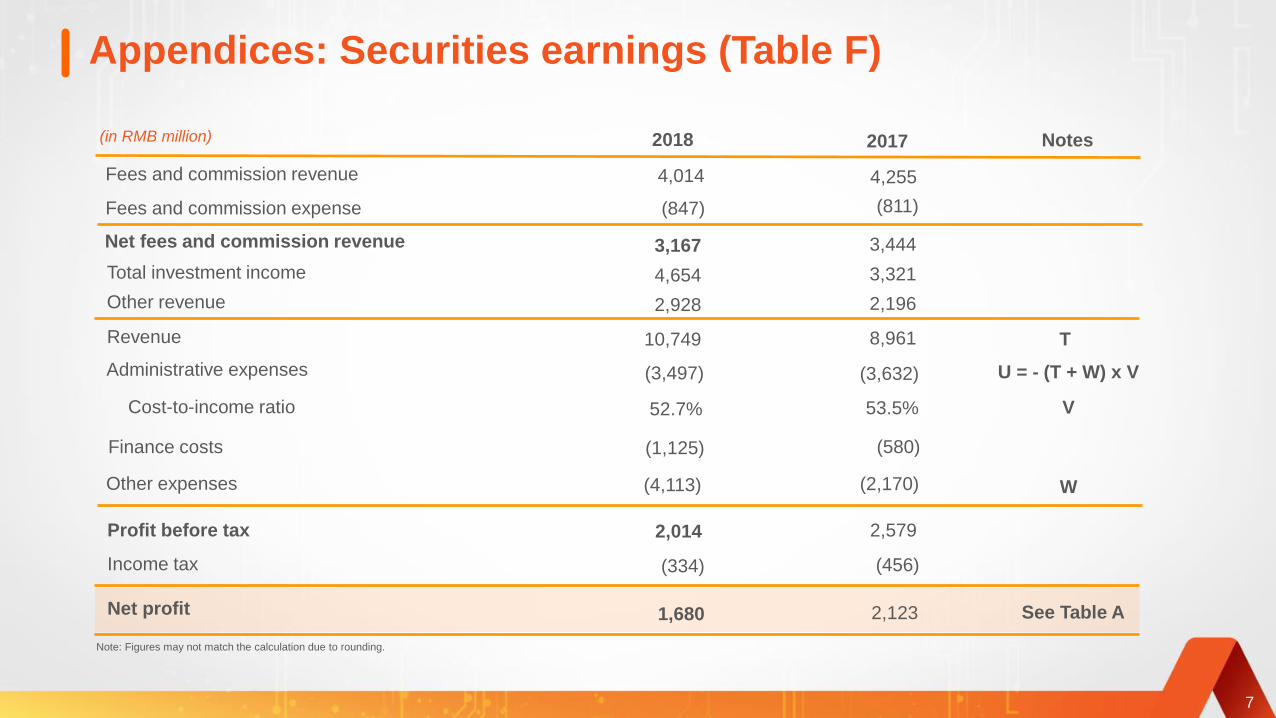
4,014
(847)
52.7%
3,167
4,654
(3,497)
(1,125)
(4,113)
2,014
(334)
1,680
4,255
(811)
53.5%
3,444
3,321
(3,632)
(580)
(2,170)
2,579
(456)
2,123
V
U = - (T + W) x V
2,928 2,196
10,749 8,961
W
T
Appendices: Securities earnings (Table F)
(in RMB million)
Fees and commission revenue
Fees and commission expense
Net fees and commission revenue
Total investment income
Other revenue
Revenue
Administrative expenses
Cost-to-income ratio
Finance costs
Other expenses
Profit before tax
Income tax
Net profit
Note: Figures may not match the calculation due to rounding.
See Table A