2018 aged care national antimicrobial prescribing survey ...€¦ · setting for monitoring...
TRANSCRIPT
1
September 2019
2018 Aged Care National Antimicrobial Prescribing Survey Report

1
Published by the Australian Commission on Safety and Quality in Health Care Level 5, 255 Elizabeth Street, Sydney NSW 2000
Phone: (02) 9126 3600 Fax: (02) 9126 3613
Email: [email protected] Website: www.safetyandquality.gov.au
ISBN: 978-1-925665-91-8 © Australian Commission on Safety and Quality in Health Care 2018
All material and work produced by the Australian Commission on Safety and Quality in Health Care is protected by copyright. The Commission reserves the right to set out the terms and conditions for the use of such material.
As far as practicable, material for which the copyright is owned by a third party will be clearly labelled. The Australian Commission on Safety and Quality in Health Care has made all reasonable efforts to ensure that this material has been reproduced in this publication with the full consent of the copyright owners.
With the exception of any material protected by a trademark, any content provided by third parties, and where otherwise noted, all material presented in this publication is licensed under a Creative Commons Attribution-NonCommercial-NoDerivatives 4.0 International licence.
Enquiries about the licence and any use of this publication are welcome and can be sent to [email protected].
The Commission’s preference is that you attribute this publication (and any material sourced from it) using the following citation:
National Centre for Antimicrobial Stewardship and Australian Commission on Safety and Quality in Health Care. Antimicrobial Prescribing and Infections in Australian Aged Care Homes: Results of the 2018 Aged Care National Antimicrobial Prescribing Survey. Sydney: ACSQHC; 2019
Disclaimer
The content of this document is published in good faith by the Australian Commission on Safety and Quality in Health Care for information purposes. The document is not intended to provide guidance on particular healthcare choices. You should contact your healthcare provider on particular healthcare choices.
The Commission does not accept any legal liability for any injury, loss or damage incurred by the use of, or reliance on, this document.

2
Table of contents
Overview ................................................................................................................... 3
Introduction .............................................................................................................. 5
Methods .................................................................................................................... 6
Survey results ........................................................................................................ 10
Discussion .............................................................................................................. 27
Appendix 1: Aged care facility form ..................................................................... 31
Appendix 2: Antimicrobials form .......................................................................... 33
Appendix 3: Infections form .................................................................................. 36
Appendix 4: Additional data on infections and antimicrobials .......................... 38
References .............................................................................................................. 41

3
Overview
Aged care homes are recognised nationally and internationally as an important community setting for monitoring infections, antimicrobial use and antimicrobial resistance. Residents colonised or infected by multidrug-resistant organisms and inappropriate antimicrobial use has been reported in these settings. This report presents analyses of data on infections and antimicrobial use in residents of 407 Australian aged care homes and multi-purpose services (aged care facilities) that contributed to the 2018 Aged Care National Antimicrobial Prescribing Survey (AC NAPS). To protect aged care facility residents from harm and improve the quality of service provision, the Australian Government Department of Health has developed the Aged Care Quality Standards, which apply to all aged care services from 1 July 2019. These include:
Standard 3: Personal care and clinical care includes requirements for minimisation of infection-related risks through implementing infection control and prevention precautions; and practices to promote appropriate antibiotic prescribing and use
Standard 8: Organisational governance notes where clinical care is provided, the organisation is required to demonstrate antimicrobial stewardship. Data from AC NAPS directly support these standards.
What does the 2018 AC NAPS data tell us?
Participation in AC NAPS by Australian aged care facilities increased in 2018 (n = 407), compared with 2017 (n = 292). There were contributors from all states and territories for the first time, and 20,030 residents were included. Important findings from the 2018 AC NAPS include:
Approximately 1 in 10 (9.9%) residents of contributor facilities were prescribed antimicrobials, compared with 8.8% in 2017
Approximately three-quarters (73%) of these prescriptions were for therapeutic indications
More than one-third (36.3%) of all prescriptions were for topical antimicrobials
Almost one-fifth (19.0%) of antimicrobials were prescribed for prn (as needed) administration; the majority (94.4%) of these were for topical antimicrobials, most commonly clotrimazole (65.4%)
Only 12.1% (54/445) of antimicrobials for which there was a prn prescription were administered on the survey day or in the six days prior
Only 39.2% of prescriptions were prescribed in the seven days prior to the survey day; almost one-third (28.3%) were prescribed more than six months prior
Antimicrobial review or stop dates were not documented for 58.9% of prescriptions and start dates were unknown for 1 in 20 prescriptions (4.9%)
35.4% of antimicrobial prescriptions prescribed for therapeutic purposes were for residents with documented signs and/or symptoms of a suspected infection
The most common clinical indications for prescriptions were skin, soft tissue and mucosal (18.3%), cystitis (16.0%) and pneumonia (9.4%); documentation of indication was missing for 25.1% of prescriptions
Cefalexin (20.3%), topical clotrimazole (19.0%) and topical chloramphenicol (7.0%) were the most commonly prescribed antimicrobials
One in ten (10.4%) therapeutic prescriptions were for clotrimazole and initially prescribed more than six months prior to the survey day.

4
Implications for improving the safety of care for residents
Since 2016, the AC NAPS has identified consistent patterns of antimicrobial use and identification of infections that may adversely affect the safety of care for residents of aged care facilities. These include:
Assessment and diagnosis of infections The AC NAPS identified a high rate of use of antimicrobials for residents who did not have signs and symptoms of infection that met the McGeer et al surveillance criteria used for AC NAPS. Reasons for this may include a lack of documentation of signs and symptoms of infection, limited use of microbiological testing to confirm infections or reporting signs and symptoms for diagnosis of infection that are not part of the McGeer et al diagnostic dataset; for example, cloudy urine to diagnose a urinary tract infection. Improving documentation of signs and symptoms, using evidence-based tools to assess infections, and using microbiological testing as clinically indicated, preferably before commencing antimicrobials, are likely to be beneficial for aged care facility residents.
Topical antimicrobial use
The high rate of rate of topical antimicrobial use, the duration of use and the large proportion of prn prescriptions are concerning. The use of prn prescriptions may limit capacity for clinical review of antimicrobials prescribed for aged care facility residents. The most commonly prescribed topical antimicrobial was clotrimazole, followed by chloramphenicol. Clotrimazole is a recommended treatment for a number of conditions, including mucocutaneous candidiasis; chloramphenicol is infrequently indicated for common infections. Use of clotrimazole is generally recommended only for two weeks.
Use of cefalexin prophylaxis Cefalexin prescriptions for prophylaxis comprised almost 9% of all prescriptions in the 2018 survey, often continuing for more than six months. The majority of prophylaxis was for urinary tract conditions including asymptomatic bacteriuria. The relative risks and benefits of prolonged antimicrobial prophylaxis in the elderly is not well studied. Prophylaxis is not indicated for asymptomatic bacteriuria. Risks of antimicrobial side effects are high, and include diarrhoea and mucocutaneous candidiasis. The utility of ongoing prophylaxis should be regularly reviewed.
Broad-spectrum antimicrobial use The patterns of prescribing of broad-spectrum antimicrobials identified by the AC NAPS suggest opportunities to promote improved concordance with evidence-based guidelines, particularly in relation to pneumonia in aged care home residents and urinary tract infections. Appropriate use of narrow-spectrum antimicrobials would likely reduce adverse effects such as mucocutaneous candidiasis and diarrhoea, and may have flow-on benefits of reducing antimicrobial use for those conditions.
Poor documentation There are opportunities to improve the quality of documentation for antimicrobial prescriptions, particularly in relation to indication, stop and review dates and allergy documentation. The promotion of medication charts that are consistent with the National Residential Medication Chart developed by the Australian Commission on Safety and Quality in Health Care (the Commission) may assist with improving documentation and reducing the duration of antimicrobial use.
The Commission will work with and support the Aged Care Quality and Safety Commission to promote ongoing surveillance of infections and antimicrobial use, the development and implementation of effective infection prevention and control and AMS programs and action to improve the safety of care provided to residents of aged care facilities.

5
Introduction
In Australia, aged care is primarily provided through the Commonwealth Home Support Program, home care packages and permanent or respite residential care in aged care homes. There are also five flexible service options that provide home support and/or residential care, including multi-purpose services.1 Multi-purpose services, located in all states and the Northern Territory, provide integrated health and aged care services for small regional and remote communities where a standalone hospital or aged care home would not be viable. Both aged care homes and multi-purpose services play an important role in the care of older members of the community in Australia, as well as some younger people who require residential care. At 30 June 2018, 886 providers operated 2,695 aged care homes in Australia; most of these were located in New South Wales (32.7%) or Victoria (28.2%) and in major cities (62.3%) or inner regional areas (24.9%). There were 207,142 operational residential aged care places, excluding flexible aged care places. Not-for-profit, private and government providers were responsible for 55.3%, 40.6% and 4.2% of these operational places respectively. Of the 8,667 government provided operational places, 59.8% were located in Victoria. Multi-purpose services (n =178) provided 3,152 operational places.2 All Australian aged care homes and multi-purpose services (aged care facilities) are eligible to participate in the Aged Care National Antimicrobial Prescribing Survey (AC NAPS). Since 2017, participation by Victorian state government aged care homes has been mandatory, as part of the Victorian Healthcare Associated Infection Surveillance System (VICNISS) Infection Control Indicator Program.3 AC NAPS is a collaborative project between the National Centre for Antimicrobial Stewardship (NCAS), the Guidance Group and VICNISS Co-ordinating Centre. The Australian Commission on Safety and Quality in Health Care (the Commission) provides funding for AC NAPS to contribute data to the Antimicrobial Use and Resistance in Australia (AURA) Surveillance System. AURA provides comprehensive and coordinated national surveillance of antimicrobial use and antimicrobial resistance. Antimicrobial use is a key factor in the development of antimicrobial resistance.4 AC NAPS is a standardised surveillance tool that aged care homes and multi-purpose services can use to monitor the prevalence of infections and antimicrobial use. The survey was modelled on the European Centre for Disease Prevention and Control Healthcare-Associated Infection in Long Term Care Facilities (HALT) study.5 AC NAPS was piloted in 2015 with the support of the Commission for the AURA Surveillance System,6 and has subsequently been conducted annually.7, 8 This report presents analyses of AC NAPS data collected and submitted in 2018, and includes comparisons with 2016 and 2017 AC NAPS data.

6
Methods
Time frame
The official data collection and submission period for the 2018 AC NAPS was 1 June to 31 August 2018.
Recruitment
A communication plan was developed to encourage participation by previous contributors and recruit new facilities from all states and territories. Numerous strategies were used including:
Newsletters issued by the Australian Government Department of Health, the Commission, NCAS, VICNISS Coordinating Centre, the Australasian College for Infection Prevention and Control, and the Australian Association of Consultant Pharmacists.
Correspondence from the Commission and NCAS to key stakeholders including the then Australian Aged Care Quality Agency, major aged care providers, the Royal Australian College of General Practitioners, Aged and Community Services Australia, Leading Aged Care Services and COTA Australia.
Tweets issued by NCAS to highlight the official commencement date and the availability of online training sessions.
Survey method
Participating facilities could choose one of two survey methods to collect data. Method 2 was recommended for smaller facilities that wished to expand their sample size to better assess their performance.
Method 1: A single-day point prevalence survey
On the survey day, all residents are screened to determine if they:
Have an antimicrobial prescription and/or
Have signs and symptoms of a suspected or confirmed infection.
Method 2: A single-day point prevalence survey plus an additional one month retrospective survey
On the survey day, all residents are screened to determine if they:
Have an antimicrobial prescription and/or
Have signs and symptoms of a suspected or confirmed infection.
In addition, all residents present on the survey day are screened to determine if they had an antimicrobial prescription on any day during the previous month that was ceased prior to the survey day.

7
Data collection forms
Aged Care Home form
Each participating facility completed the Aged Care Home form (Appendix 1). For the first time, questions were included in the facility-level data fields regarding the current status of infection prevention and control and antimicrobial stewardship programs. Resident-level data fields included listing the number of residents present on the survey day. All residents who were present on the survey day were eligible for inclusion.
Antimicrobials form
The Antimicrobials form (Appendix 2) was completed for residents who were prescribed an antimicrobial on the survey day (Methods 1 and 2), and within the previous month (Method 2 only). Antimicrobial prescriptions included all antibiotics, antiviral, antifungal and anti-parasitic agents in all formulations.
Data were collected about prescribing elements including the choice of antimicrobial agent, dose, frequency, route of administration, start date and documentation of a review or stop date. For the first time, data were also collected regarding whether an antimicrobial prescription was for prn (as needed) administration. If the prescription was for prn administration, the surveyor was also required to report if the antimicrobial had been administered on the survey day or in the six days prior.
The indication and body system for the prescription were reported according to a standardised list. If an indication was not included on the list, the surveyor was required to report ‘Other’ and the body system; for example, ‘Other – urinary tract’. The initial mode of prescription (for example, written directly by prescriber or communicated via telephone order) was also recorded.
If the antimicrobial start date was known, and the therapy had commenced less than six months before the survey day, data were collected about the resident’s microbiology results, urinary investigations and catheter devices and signs and/or symptoms of a suspected infection. These data were collected in relation to specimens collected, investigations undertaken, devices in situ and signs and/or symptoms present on the antimicrobial start date or in the six days prior to the antimicrobial start date. Data on signs and symptoms were required to be documented in official sources such as resident histories or hospital discharge summaries.
Microbiology data were collected from finalised microbiology reports only. If more than one specimen of the same type was collected within the specified timeframe, only the most recent result was reported.
A list was provided for recording signs and/or symptoms of suspected or confirmed infections documented on the antimicrobial start date or in the six days prior. The list was divided into seven body systems: urinary tract, respiratory tract, skin or soft tissue, gastrointestinal tract, oral, eye, and other. A list was also provided of constitutional criteria, or signs and symptoms common to many different infection types; these included: fever, leucocytosis, change in mental status from baseline, acute functional decline in activities of daily living, and results of full blood examination. The signs and symptoms were required to be recorded in official documents such as resident histories or hospital discharge summaries.
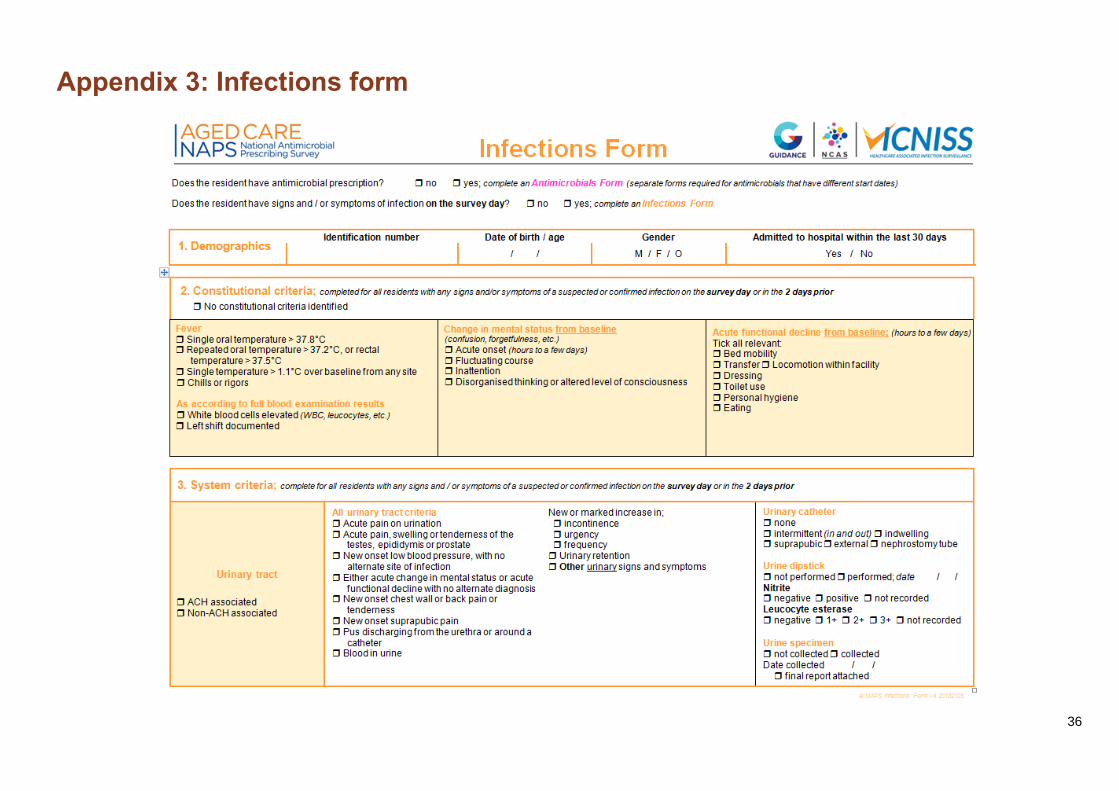
Infections form
An Infections form (Appendix 3) was completed for residents who had signs and/or symptoms of a suspected infection that were present on the survey day or in the two days prior to the survey.

8
Consistent with the methodology for the 2017 AC NAPS, and for reasons detailed in the 2016 AC NAPS report, the gastrointestinal tract infection signs and/or symptoms were excluded from the Infections form.
Each suspected infection was classified by the surveyor as facility- or non-facility associated. Facility-associated infections were those for which the resident’s signs and/or symptoms commenced at least two calendar days after (re)admission into the facility. Non-facility associated infections were those for which the resident’s signs and symptoms commenced within two calendar days of being admitted into the facility.
The methodology for collection of data for the Infections form allowed surveyors to use official and non-official data sources. For example, staff handover notes, incident reports, wound-care folders or verbal information provided by a senior aged care home clinician.
Electronic AC NAPS
On the survey day, data collection forms were manually completed by the surveyors and then used to assist with electronic data entry. Registered surveyors could access the e-versions via the NAPS web portal.
Once the data were entered, contributors could generate reports immediately and download them via the NAPS web portal. These reports enabled participating facilities to compare their performance against national aggregate data. Surveyors were encouraged to forward the reports to those who are able to influence resident care, including administrators and clinicians such as general practitioners, pharmacists and nurses.
Support
Optional online training sessions were offered for surveyors. For new surveyors, one-hour beginner sessions provided detailed information about the AC NAPS methodology. Brief refresher sessions were also held for more experienced surveyors. Throughout the year, the NAPS coordinating team provided email and telephone assistance as required.
Data Definitions and Data Analysis
A suspected infection was defined as at least one of the clinical signs or symptoms of infection listed on both the Antimicrobials and Infections forms. As already noted, for the Antimicrobials form signs and/or symptoms had to be present on the antimicrobial start date or in the six days prior to the antimicrobial start date. For the Infections form, the signs and/or symptoms had to be present on the survey day or in the two days prior to the survey day. More than one suspected infection could be reported for each resident.
An electronic decision algorithm was applied to each suspected infection to determine whether or not the McGeer et al infection surveillance definitions were met. These widely referenced definitions, which were specifically developed for use in long term care facilities, were last revised in 2012 to take into account the most recent evidence and the availability of improved diagnostics for surveillance.9

9
Limitations
The AC NAPS results should be interpreted in the context of the limitations described below. Sampling and selection bias The results may not be generalisable to all aged care homes and multi-purpose services. Most participating facilities that collected and submitted AC NAPS data were:
Located in Victoria
Classified as major city or inner regional
State government operated. For some state and territory, remoteness and provider type categories there was a relatively small number of participating facilities. Unlike aged care homes, multi-purpose services also provide a range of health services.
Infection definitions
Signs and symptoms of infection in older residents may be atypical, so failure to meet the McGeer et al definitions may not fully exclude the presence of a true infection. In addition, the McGeer et al definitions require microbiological confirmation for some infections (for example, urinary tract infections). This means that these infections will not be confirmed unless microbiological specimens are collected. Specimens for microbiological testing are less likely to be collected in aged care facilities, compared to acute care services. The McGeer et al definitions are generally useful to compare the proportion of defined infections between facilities over time in contrast to rule in or rule out the clinical need for a prescription.
Subjective assessment of infections and quality of documentation
The reliability of data sources used to determine a suspected infection and/or McGeer et al surveillance definitions is dependent on the completeness of resident records and other official documents for data from the Antimicrobial form. For completion of the Infections form, non-official documents and verbal reports were able to be additionally used. Therefore, the suspected infections and McGeer et al surveillance data represents infections that could be confirmed via these sources. A lack of documentation of signs and symptoms that occurred prior to a therapeutic prescription would underestimate this data point. There was no validation undertaken of these assessments.
Seasonal variation
The survey was conducted during winter. The results may have been different in another season. Certain respiratory infections, for example, are usually more frequent in winter.
Validation
The analysis relied on the validity of local assessments. There was no additional external validation undertaken.
Comparison of 2018 AC NAPS data with previously published 2016 and 2017 AC NAPS data
The 2016 and 2017 data included in the analyses for this report may differ from previous reports because some data were retrospectively entered, omitted due to anomalies or included that had previously been omitted. In addition, prescriptions for prn administration were captured for the first time in 2018.

10
Survey results
Participation
In 2018, 342 aged care homes and 65 multi-purpose services (n = 407 facilities) collected and submitted AC NAPS data to NCAS; this is a large increase compared with 2016 and 2017 (Table 1). Since 2016, 120 facilities have participated twice and 31 facilities have participated three times. In 2018, 83.1% (338/407) of facilities collected data according to Method 1 (single day only) and 17.0% (69/407) facilities collected data according to Method 2 (single day and one month retrospective). In 2018, compared with 2016 and 2017, there was an increase in the number of participating facilities located outside of Victoria (n = 205, 50.4%); facilities from the Australian Capital Territory and the Northern Territory participated for the first time. As for 2016 and 2017, all remoteness areas and provider types were represented. About two thirds were located in either major cities (n = 148, 36.4%) or inner regional areas (n = 136, 33.4%) and the majority were government- (n = 236, 58.0%) or not-for-profit (n = 148, 36.4%) operated.
Table 1: Facilities by state, remoteness area classification and provider type, AC NAPS contributors, 2016–2018
Category
Participating facilities
2016 2017 2018
No. %* No. %* No. %*
State and Territory
ACT - - - - 3 0.7
NSW 36 12.5 38 13.0 62 15.2
NT - - - - 2 0.5
QLD 28 9.8 19 6.5 50 12.3
SA 7 2.4 8 2.7 39 9.6
TAS 11 3.8 8 2.7 10 2.5
VIC 190 66.2 198 67.8 202 49.6
WA 15 5.2 21 7.2 39 9.6
Remoteness
Major Cities 82 28.6 87 29.8 148 36.4
Inner regional 120 41.8 128 43.8 136 33.4
Outer regional 73 25.4 68 23.3 96 23.6
Remote 9 3.1 8 2.7 24 5.9
Very remote 3 1.0 1 0.3 3 0.7
Provider type
Not for profit 83 28.9 81 27.7 148 36.4
Private 21 7.3 10 3.4 22 5.4
Government 183 63.8 201 68.9 236 58.0
Total 287 - 292 - 407 -
* Percentage of AC NAPS contributor cohort
Of the 20,030 residents audited, most resided in not-for-profit (n = 11,841, 59.1%) and government- (n = 6,115, 30.5%) operated facilities. Representation of aged care facilities across states and territories varied from 6.6% (NSW) to 26.2% (VIC) and across remoteness areas from 7% (very remote) to 32.0% (remote) (Table 2). Nationally, over half (56.7%) of the government-operated facilities participated, whilst very small proportions of private (2.4%) and not-for-profit facilities (9.5%) participated (Table 2).

11
Table 2: Facilities by state, remoteness area classification and provider type, AC NAPS contributors, 2018
Category
Residents audited
Facilities in reporting group*
Participating facilities from the reporting
group
No. No. %
State and Territory
ACT 356 26 11.5
NSW 1,976 946 6.6
NT 211 13 15.4
QLD 3,476 490 10.2
SA 3,303 272 14.3
TAS 840 76 13.2
VIC 7,758 771 26.2
WA 2,110 279 14.0
Remoteness
Major cities 11,386 1,680 8.8
Inner regional 6,076 671 20.3
Outer regional 2,235 404 23.8
Remote 270 75 32.0
Very remote 63 43 7.0
Provider type
Not for profit 11,841 1,551 9.5
Private 2,074 906
2.4
Government 6,115 416 56.7
Total 20,030 - -
*Source: Aged care service list: 30 June 2018 AIHW GEN Aged Care Data. Transition Care, Innovative Pool, National Aboriginal and Torres Strait Island and Short term restorative care services are excluded.
Most participating facilities reported that they employed a person who is responsible for coordinating an infection prevention and control program (92.4%); and that policies and procedures detailing the requirements for standard and transmission-based precautions were in place (97.1%). Less frequently, facilities reported that they employed a person with responsibility for coordinating an antimicrobial stewardship (AMS) program (78.1%), and policies and procedures detailing AMS requirements (75.4%) (Table 3).
Table 3: Infection Prevention and Control and Antimicrobial Stewardship Programs implemented, AC NAPS contributors, 2018
Infection Prevention and Control (IPC) Program Facilities
No. %
A multidisciplinary team or committee is established that oversees an IPC program 335 82.3
A person who is responsible for coordinating the IPC program is employed 376 92.4
An appointed ICP Coordinator has dedicated time for completing assigned tasks 336 82.6
The facility has IPC policies and procedures that detail requirements for standard and transmission based precautions
395 97.1
Antimicrobial Stewardship (AMS) Component No. %
A person who is responsible for leading and coordinating the AMS component of the IPC program is employed
318 78.1
The facility has IPC policies and procedures that detail requirements for AMS 307 75.4
Staff prescribers are easily able to access the Therapeutic Guidelines: Antibiotic 349 85.7
Staff prescribers are easily able to access the Australian Medicines Handbook: Aged Care Companion.
314 77.1

12
Resident characteristics
Similar to 2016 and 2017, over half (n = 11,914, 59.5%) of the residents were aged greater than 85 years and about one-third (n = 6563, 32.8%) were male. One in 25 residents (n = 852, 4.3%) had been admitted to a hospital in the previous 30 days and 3.7% (n = 744) had an indwelling urinary catheter on the survey day (Table 4).
Table 4: Number and characteristics of all residents on the survey day, AC NAPS contributors, 2016–2018
Measurement 2016 2017 2018
No. % No. % No. %
Present on survey day 13,398 - 12,307 - 20,030 -
Aged >85 years 7,355 54.9 7,072 57.5 11,914 59.5
Male 4,448 33.2 4,167 33.9 6,563 32.8
Admitted to hospital in previous 30 days 630 4.7 507 4.1 852 4.3
Indwelling urinary catheter present 513 3.8 432 3.5 744 3.7
Prevalence of infections and antimicrobial use
The prevalence of antimicrobial use was calculated based on the proportion of residents present on the survey day who were prescribed at least one antimicrobial. The prevalence of infection was calculated using the proportion of residents present on the survey day who had signs and/or symptoms of at least one suspected infection, as recorded on the Infections form.
The prevalence of residents prescribed at least one antimicrobial was 9.9% (n = 1,988) (Table 5). If all prescriptions for residents receiving topical antimicrobials were excluded, the prevalence was 6.7% (n = 1,347) in 2018, compared with 7.5% (n = 1,010) and 6.7% (n = 824) in 2016 and 2017 respectively.
The prevalence of residents who had signs and/or symptoms of at least one suspected infection was 2.9% (n = 581).
Table 5: Prevalence of infections and antimicrobial use in all participating facilities, AC NAPS contributors, 2016–2018*
On survey day 2016 2017 2018
p-value No. % 95% CI No. % 95% CI No. % 95% CI
Residents with signs and/or symptoms of at least one suspected infection
417 3.1 2.8–3.4 349 2.8 2.5–3.1 581 2.9 2.7–3.1 0.48
Residents prescribed at least one antimicrobial
1,321 9.9 9.4–10.4 1,087 8.8 8.3–9.3 1,988 9.9 9.5–10.4 0.97
Number of residents present
13,398 - - 12,307 - - 20,030 - - -
* Source: Residents with signs and symptoms of infection: Infections form; Residents prescribed at least one antimicrobial: Antimicrobial form; Number of residents present: Facility form
13
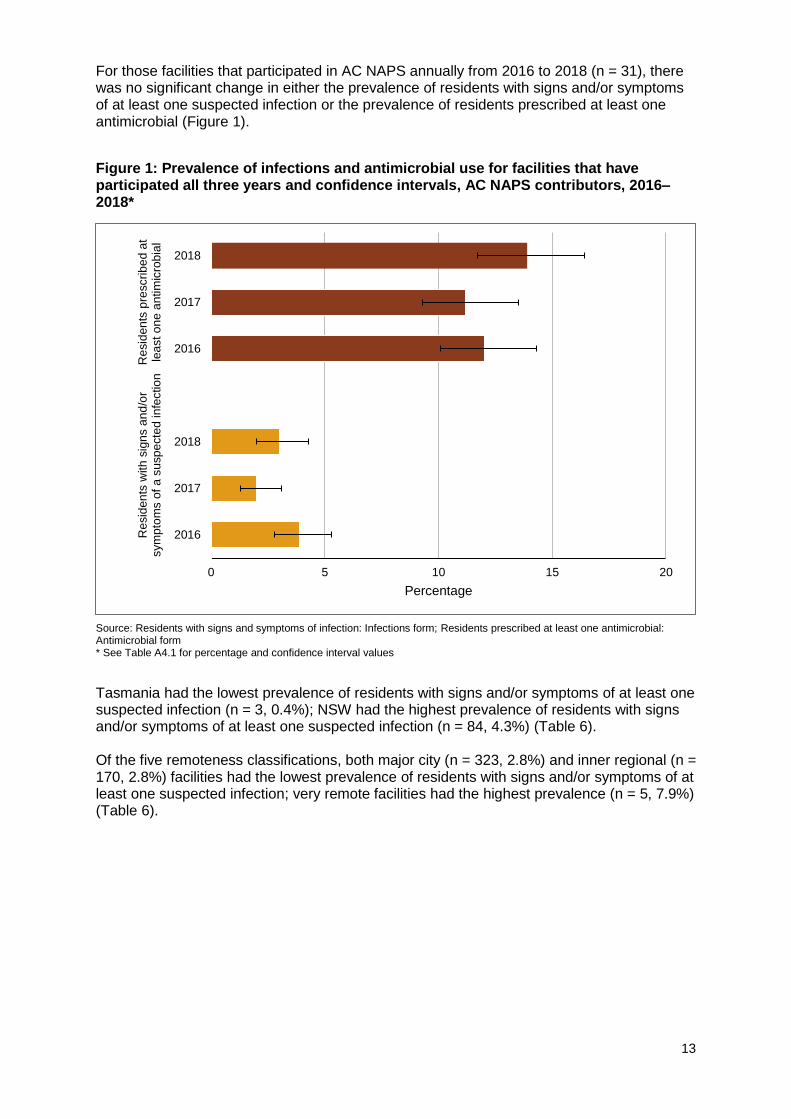
For those facilities that participated in AC NAPS annually from 2016 to 2018 (n = 31), there was no significant change in either the prevalence of residents with signs and/or symptoms of at least one suspected infection or the prevalence of residents prescribed at least one antimicrobial (Figure 1).
Figure 1: Prevalence of infections and antimicrobial use for facilities that have participated all three years and confidence intervals, AC NAPS contributors, 2016–2018*
Source: Residents with signs and symptoms of infection: Infections form; Residents prescribed at least one antimicrobial: Antimicrobial form * See Table A4.1 for percentage and confidence interval values
Tasmania had the lowest prevalence of residents with signs and/or symptoms of at least one suspected infection (n = 3, 0.4%); NSW had the highest prevalence of residents with signs and/or symptoms of at least one suspected infection (n = 84, 4.3%) (Table 6). Of the five remoteness classifications, both major city (n = 323, 2.8%) and inner regional (n = 170, 2.8%) facilities had the lowest prevalence of residents with signs and/or symptoms of at least one suspected infection; very remote facilities had the highest prevalence (n = 5, 7.9%) (Table 6).
0 5 10 15 20
2016
2017
2018
2016
2017
2018
Resid
en
ts w
ith
sig
ns a
nd
/or
sym
pto
ms o
f a
su
sp
ecte
d in
fectio
nR
esid
en
ts p
rescrib
ed a
tle
ast o
ne a
ntim
icro
bia
l
Percentage

14
Table 6: Prevalence of residents with signs and/or symptoms of a suspected infection on the survey day, by state and territory, remoteness and provider type, AC NAPS contributors, 2016–2018
Category
Residents with signs and/or symptoms of at least one suspected infection*
2016 2017 2018
No. Prevalence
(%) No.
Prevalence (%)
No. Prevalence
(%)
State and Territory
ACT - - - - 9 2.5
NSW 59 4.0 71 5.2 84 4.3
NT - - - - 6 2.8
QLD 48 2.4 23 1.7 73 2.1
SA 21 3.6 50 6.3 108 3.3
TAS 8 1.2 8 2.1 3 0.4
VIC 226 3 162 2.4 254 3.3
WA 55 4.5 35 2.1 44 2.1
Remoteness
Major Cities 184 3.1 135 2.3 323 2.8
Inner regional 148 2.8 156 3.2 170 2.8
Outer regional 65 3.2 50 3.5 71 3.2
Remote 17 12.4 8 7.1 12 4.4
Very remote 3 4.4 0 0.0 5 7.9
Provider type
Not for profit 166 2.7 131 2.3 278 2.3
Private 48 2.8 22 2.3 81 3.9
Government 203 3.7 196 3.5 222 3.6
Total 417 3.1 349 2.8 581 2.9
* Source: Infections form
Tasmania has consistently reported the lowest prevalence of residents prescribed at least one antimicrobial: 7.1% (n = 47), 3.9% (n = 15) and 1.9% (n = 16) in 2016, 2017 and 2018 respectively. Of the five remoteness classifications, remote facilities have consistently reported the highest prevalence of residents prescribed at least one antimicrobial: 19.0% (n = 26), 24.8% (n = 28) and 12.2% (n= 33) in 2016, 2017 and 2018 respectively (Table 7).

15
Table 7: Prevalence of antimicrobial use on the survey day, by state, remoteness and provider type, AC NAPS contributors, 2016–2018
Category
Residents prescribed at least one antimicrobial*
2016 2017 2018
No. Prevalence
(%) No.
Prevalence (%)
No. Prevalence
(%)
State and Territory
ACT - - - - 28 7.9
NSW 196 13.2 121 8.8 161 8.1
NT - - - - 31 14.7
QLD 235 11.9 130 9.5 440 12.7
SA 81 13.8 136 17.3 330 10.0
TAS 47 7.1 15 3.9 16 1.9
VIC 616 8.2 560 8.3 735 9.5
WA 146 12.1 125 7.7 247 11.7
Remoteness
Major Cities 661 11.1 474 8.1 1,191 10.5
Inner regional 439 8.4 431 8.7 500 8.2
Outer regional 189 9.2 154 10.9 259 11.6
Remote 26 19.0 28 24.8 33 12.2
Very remote 6 8.8 0 0.0 5 7.9
Provider type
Not-for-profit 698 11.3 486 8.5 1,188 10.0
Private 109 6.4 49 5.0 149 7.2
Government 514 9.3 552 9.9 651 10.5
Total 1,321 9.9 1,087 8.8 1,988 9.9
* Source: Antimicrobials form
Suspected infections on the survey day
In 2018, 674 suspected infections were reported for 581 residents on the survey day, suggesting 16% of residents were receiving therapies for more than one suspected infection. Suspected skin or soft tissue (35.3%), respiratory tract (28.5%) or urinary tract (19.0%) infections were most commonly reported. About four-fifths (n = 540, 80.1%) of these suspected infections were facility-associated and 32.8% (n = 221) met the McGeer et al infection surveillance definitions (Table 8).
Table 8: Number and percentage of suspected infections by body system and location of acquisition, AC NAPS contributors, 2018
Body system No. of
suspected infections†
Facility-associated suspected infections
Suspected infections that met McGeer et al definition
No. % No. %
Skin or soft tissue 238 192 80.7 112 47.1
Respiratory tract 192 165 85.9 49 25.5
Urinary tract 128 106 82.8 6 4.7
Eye 60 44 73.3 50 83.3
Oral 17 8 47.1 4 23.5
Other systems 39 25 47.1 0 -
Total 674 540 80.1 221 32.8
* Source: Infections form †Some residents had signs and/or symptoms of more than one suspected infection

16
Antimicrobial use
Antimicrobial use data collected by both Method 1 and Method 2 were combined for the analyses presented in this section. The unit of analysis is antimicrobial prescriptions.
A total of 2,341 antimicrobials were prescribed for 1,988 residents. Almost one third of these residents (n = 665, 28.4%) were reported to have allergies; allergy status was either not known (n = 1650, 70.5%) or not documented (n = 26, 1.1%) for the remainder.
Start date
The start date was unknown for 4.9% (n = 115) of the antimicrobial prescriptions and more than a quarter (n = 663, 28.3%) were commenced more than six months prior to the survey day. For those antimicrobial prescriptions with a known start date that were commenced less than six months prior to the survey day (n = 1,563, 66.7%), 41.2% (n = 644) had been commenced more than seven days prior to the survey day. Only 39.2% (n = 919) of all prescriptions with a known start date were prescribed in the seven days prior to survey.
Most commonly prescribed antimicrobials
Most antimicrobials were prescribed for oral (n = 1,459, 62.3%) or topical (n = 849, 36.3%) administration. In 2016 and 2017, 32.1% (n = 483) and 32.9% (n = 407) of antimicrobials respectively were for prescribed topical administration. The majority of prescriptions were for therapeutic use (n = 1,710, 73%), the remainder were for prophylaxis.
The most commonly prescribed antimicrobials were cefalexin (n = 475, 20.3%), clotrimazole (n = 444, 19.0%), chloramphenicol (n = 163, 7.0%), amoxicillin–clavulanic acid (n = 135, 5.8%), doxycycline (n = 125, 5.3%) and trimethoprim (n = 123, 5.3%) (Figure 2).The five most commonly prescribed topical antimicrobials were clotrimazole (n = 437, 51.5%), chloramphenicol (n = 161, 19.0%), miconazole (n = 79, 9.3%), gramicidin–neomycin–nystatin (Kenacomb®) (n = 56, 6.6%), and mupirocin (n = 38, 4.5%) (Figure 2).

17
Figure 2: Most commonly prescribed antimicrobials, percentage of all antimicrobials prescribed, AC NAPS contributors, 2016–2018*
T = topical; Kenacomb® contains triamcinolone, neomycin, nystatin and gramicidin * See Table A4.2 for percentage values
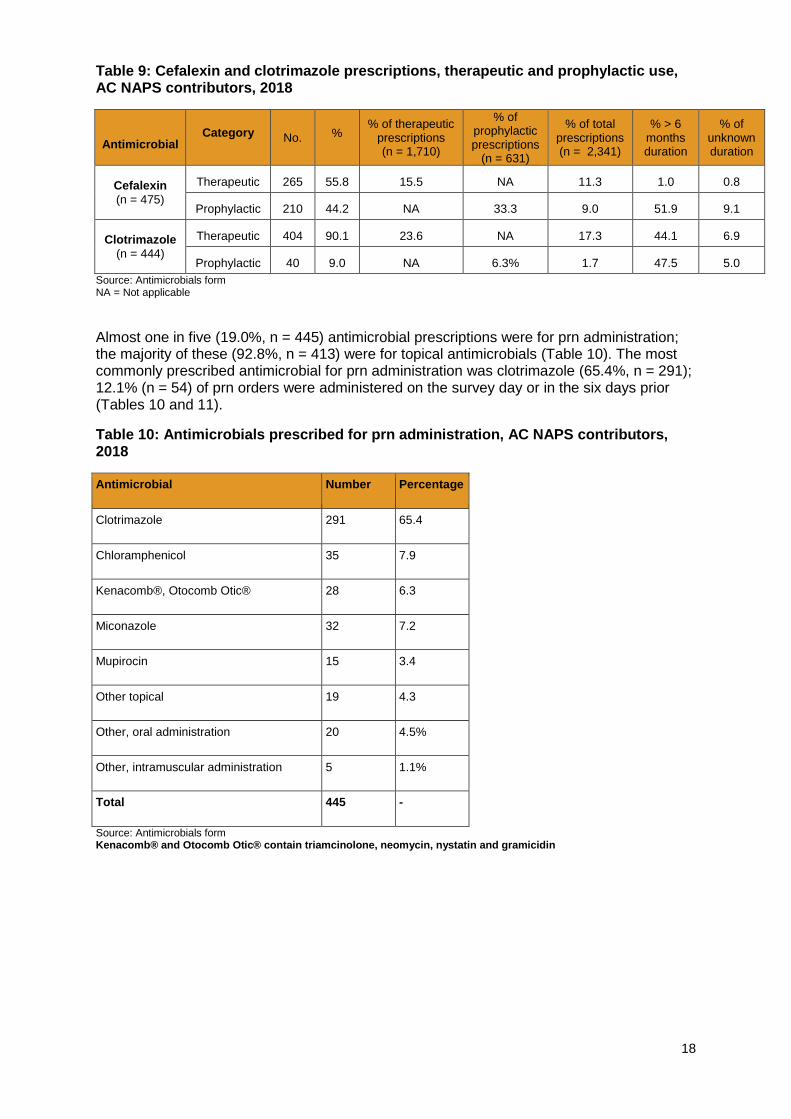
The majority (90.1%) of clotrimazole was prescribed for therapeutic use. Prolonged duration of prescriptions (greater than six months) was reported for prophylactic cefalexin prescriptions and both therapeutic (44.1%) and prophylactic (47.5%) prescriptions for clotrimazole (Table 9). Clotrimazole prescriptions of greater than six months’ duration accounted for 10.4% of all therapeutic prescriptions.
0.0% 5.0% 10.0% 15.0% 20.0% 25.0%
Cefazolin
Metronidazole
Nystatin (O or T)
Clindamycin
Trimethoprim-sulfamethoxazole
Roxithromycin
Nitrofurantoin
Mupirocin (T)
Flucloxacillin
Ciprofloxacin
Kenacomb® (T)
Miconazole (T)
Hexamine hippurate
Amoxicillin
Trimethoprim
Doxycycline
Amoxicillin-clavulanic acid
Chloramphenicol (T)
Clotrimazole (T)
Cefalexin
2018 2017 2016
18
Table 9: Cefalexin and clotrimazole prescriptions, therapeutic and prophylactic use, AC NAPS contributors, 2018
Antimicrobial
Category No. % % of therapeutic
prescriptions (n = 1,710)
% of prophylactic prescriptions
(n = 631)
% of total prescriptions (n = 2,341)
% > 6 months duration
% of unknown duration
Cefalexin
(n = 475)
Therapeutic 265 55.8 15.5 NA 11.3 1.0 0.8
Prophylactic 210 44.2 NA 33.3 9.0 51.9 9.1
Clotrimazole
(n = 444)
Therapeutic 404 90.1 23.6 NA 17.3 44.1 6.9
Prophylactic 40 9.0 NA 6.3% 1.7 47.5 5.0
Source: Antimicrobials form NA = Not applicable
Almost one in five (19.0%, n = 445) antimicrobial prescriptions were for prn administration; the majority of these (92.8%, n = 413) were for topical antimicrobials (Table 10). The most commonly prescribed antimicrobial for prn administration was clotrimazole (65.4%, n = 291); 12.1% (n = 54) of prn orders were administered on the survey day or in the six days prior (Tables 10 and 11).
Table 10: Antimicrobials prescribed for prn administration, AC NAPS contributors, 2018
Antimicrobial Number Percentage
Clotrimazole 291 65.4
Chloramphenicol 35 7.9
Kenacomb®, Otocomb Otic® 28 6.3
Miconazole 32 7.2
Mupirocin 15 3.4
Other topical 19 4.3
Other, oral administration 20 4.5%
Other, intramuscular administration 5 1.1%
Total 445 -
Source: Antimicrobials form Kenacomb® and Otocomb Otic® contain triamcinolone, neomycin, nystatin and gramicidin

19
Table 11: Antimicrobials prescribed for prn administration, duration of administration and administration on the survey day or in the six days prior, AC NAPS contributors, 2018
Antimicrobial start date compared with survey day
Number Administration on antimicrobial start date or six days prior
No. %
Less than 1 week 12 6 50.0
1 week–6 months 119 15 12.6
Greater than 6 months 275 33 12.0
Unknown 38 0 0
Total 445 54 12.1
Source: Antimicrobials form
Quality indicators
The two key quality indicators that are consistently monitored using AC NAPS are ‘indication documented for prescribing an antimicrobial’ and ‘review or stop date documented’. In 2018, 74.9% (n = 1,754) of antimicrobial prescriptions had the indication documented, and 41.1% (n = 961) of antimicrobial prescriptions had a review or stop date documented (Table 12). Of the 663 prescriptions commenced more than six months prior to the survey day, 93.2% (n = 618) did not have a review or stop date documented. Similarly, of the 115 prescriptions for which the start date was unknown, 89.6% (n = 103) did not have a review or stop date documented.
Prescriptions for prn administration generally do not have review dates documented. Table 12: Key quality indicators for all participating facilities, AC NAPS contributors, 2016–2018
Indicator 2016 2017 2018
No. % 95% CI No. % 95% CI No. % 95% CI
Indication for prescribing an antimicrobial
Documented 1,111 74.4 72.1–76.6 939 76.3 73.8–78.6 1,754 74.9 73.1–76.7
Not documented 382 25.6 23.4–27.9 292 23.7 21.4–26.2 587 25.1 23.3–26.9
Review or stop date
Documented 609 40.8 38.3–43.3 547 44.4 41.6–47.3 961 41.1 39.0–43.1
Not documented 884 59.2 56.7–61.7 784 55.6 60.9–66.4 1,380 58.9 56.9–61.0
Total 1,493 - 1,231 - 2,341 -

20
For those facilities that have participated annually from 2016 to 2018 (n = 31), there has been an improvement in documentation of the indication for prescribing an antimicrobial; documentation of the review or stop date has not changed significantly (Figure 3).
Figure 3: Key quality indicators for facilities that have participated for three years, percentage and confidence intervals, AC NAPS contributors, 2016–2018*
Source: Antimicrobials form * See Table A4.3 for percentage and confidence interval values
Documentation of the clinical indication for prescribing an antimicrobial and review or stop date was highest in Tasmanian facilities (Table 13).
0 10 20 30 40 50 60 70 80 90 100
2016
2017
2018
2016
2017
2018
Docu
men
ted ind
ica
tion
Do
cu
men
ted r
evie
w o
r sto
pd
ate
Percentage

21
Table 13: Key quality indicators, by state, remoteness and provider type, AC NAPS contributors, 2016–2018
No. of prescriptions Clinical indication documented (%)
Review or stop date documented (%)
2016 2017 2018 2016 2017 2018 2016 2017 2018
State and Territory
ACT - - 31 - - 67.7 - - 58.1
NSW 237 136 182 77.6 67.6 81.3 46.0 41.9 51.1
NT - - 31 - - 67.7 - - 45.2
QLD 276 147 532 77.9 87.8 75.2 35.1 44.9 27.4
SA 92 155 376 70.7 79.4 76.9 50.0 61.3 48.7
TAS 48 15 16 68.8 100.0 93.8 45.8 73.3 100.0
VIC 656 639 857 73.3 71.5 71.3 37.8 40.4 42.7
WA 184 139 316 72.3 88.5 78.8 47.3 43.2 39.6
Remoteness
Major cities 777 543 1417 75.4 81.2 75.5 42.2 51.0 41.2
Inner regional 475 482 571 70.5 77.2 76.5 39.6 43.8 46.2
Outer regional
208 171 313 76.9 63.7 70.3 37.5 29.8 31.6
Remote 27 35 35 92.6 48.6 65.7 33.3 22.9 28.6
Very remote 6 0 5 83.3 0 80.0 100.0 0 80.0
Provider type
Not for profit 816 548 1412 74.4 82.5 73.3 40.4 49.5 38.7
For profit 114 54 154 91.2 85.2 93.5 50.0 53.7 61.0
Government 563 629 775 71.0 70.1 74.2 39.4 39.3 41.5
Total 1,493 1,231 2,341 74.4 76.3 74.9% 40.8 44.4 41.1
Source: Antimicrobials form
In 2018, the majority (n = 1,455, 93.1%) of antimicrobial prescriptions were written by a prescriber (Table 14), which is a small improvement compared with 2016. A very small percentage of prescriptions (n = 64, 4.1%) were given by a telephone or facsimile order. Of those telephone and facsimile prescriptions, half (n = 32) were for residents who were examined by a prescriber within three days of the antimicrobial start date; 40.6% (n = 26) were for residents who were not examined by a prescriber during this time period.
Table 14: Mode of prescription, AC NAPS contributors, 2016–2018*
Mode of prescription 2016 2017 2018
No. % No. % No. %
Written by prescriber 893 90.5 739 86.9 1,455 93.1
Phone or fax order 73 7.4 71 8.4 64 4.1
Unknown 21 2.1 40 4.7 44 2.8
Total 987 100 850 100 1,563 100
*Only prescriptions with a known start date less than six months prior to the survey day were included.
Common indications for prescribing antimicrobials
The top five known indications for prescribing antimicrobials were other – skin, soft tissue or mucosal (n = 428, 18.3%), cystitis (n = 375, 16.0%), pneumonia (n = 221, 9.4%), cellulitis (n = 114, 4.9%) and other – urinary tract (n = 110, 4.7%) (Figure 4). Indication was reported as unknown for a small proportion of prescriptions (n = 150, 6.4%).

22
Figure 4: Most common indications for antimicrobial prescriptions, AC NAPS contributors, 2016–2018*†
Source: Antimicrobials form *Indications categorised by surveyors as ‘Unknown’ are not included † See Table A4.4 for percentage values COPD = Chronic obstructive pulmonary disease Ulcers include pressure, venous and arterial ulcers
0% 2% 4% 6% 8% 10% 12% 14% 16% 18% 20%
Pyelonephritis
Wound infection: surgical
Oral candidiasis
Paronychia
Genital candidiasis
Infective exacerbation of COPD
Ulcers
Other- Medical prophylaxis
Catheter-associated UTI
Other- Eye
Asymptomatic bacteriuria
Other- Respiratory tract
Tinea
Conjunctivitis
Wound infection: non-surgical
Other- Urinary tract
Cellulitis
Pneumonia
Cystitis
Other- Skin, soft tissue ormucosal
2018 2017 2016

23
For all antimicrobial prescriptions where the indication was known, 73.0% (n = 1,710) were for therapeutic use; the remainder were for prophylaxis. Chest and lower respiratory tract infections were consistently the most frequently reported known indications for prescriptions for therapeutic use: 14.1% (n = 158), 14.1% (n = 123) and 12.0% (n = 205) in 2016, 2017 and 2018 respectively. Cystitis was consistently the most frequently reported known indication for prescriptions for prophylaxis in 2016, 2017 and 2018 (31.9% [n = 120], 29.2% [n = 104] and 29.8% [n = 188] respectively) (Figure 5). Prescriptions for asymptomatic bacteriuria reduced by 46% from 2016 (3.9%) to 2018 (2.1%).
Figure 5: Most common prophylactic indications for antimicrobial prescriptions, AC NAPS contributors, 2016–2018*
Source: Antimicrobials form, AC NAPS Indications list * Indications categorised by surveyors as ‘Unknown’ are not included Note: LRTI = lower respiratory tract infection; COPD = chronic obstructive pulmonary disease
Therapeutic use of antimicrobials was more common in skin and soft tissue and respiratory tract infections, whilst prophylactic use was more commonly reported for urinary tract indications (Figure 6).
0% 5% 10% 15% 20% 25% 30% 35%
Immunocompromised
Wound infection: non-surgical
Manipulation of urinary catheter
Conjunctivitis
Cellulitis
Infective exacerbation of COPD
Catheter-associated UTI
Pneumonia (chest infection, LRTI)
Asymptomatic bacteriuria
Cystitis (bladder infection)
2018 2017 2016

24
Figure 6: Comparison of therapeutic and prophylactic antimicrobial prescriptions for common indications, AC NAPS contributors, 2018*†
Source: Antimicrobials form * Indications categorised by surveyors as ‘Unknown’ are not included † See Table A4.5 for percentage values
Most commonly prescribed antimicrobials for common indications
The most commonly prescribed antimicrobials for cystitis were cefalexin (44.3%), trimethoprim (20.8%) and hexamine hippurate (13.6%), which is an antibacterial antiseptic agent. Whilst there is insufficient evidence to support the use of hexamine hippurate for urinary prophylaxis, it does not appear to promote development of antimicrobial resistance (AMR), and it accounted for 8.8% of all prescriptions for prophylaxis. The most commonly prescribed antimicrobials for pneumonia were amoxicillin–clavulanic acid (25.8%), amoxicillin (19.9%) and doxycycline (16.7%) (Table15).
0 10 20 30 40 50 60 70 80 90 100
Asymptomatic bacteruria
Other- Respiratory tract
Tinea
Conjunctivitis
Wound infection: non-surgical
Other- Urinary Tract
Cellulitis
Pneumonia
Cystitis
Other- Skin, soft tissue or mucosal
Treatment Prophylaxis

25
Table 15: Commonly prescribed antimicrobials for cystitis, pneumonia and cellulitis, ACNAPS contributors, 2016–2018*
Cystitis (n = 375)
Pneumonia (n = 221)
Cellulitis† (n= 114)
Antibiotic No. % Antibiotic No. % Antibiotic No. %
Cefalexin 166 44.3 Amoxicillin–
clavulanic acid 57 25.8 Cefalexin 49 43.0
Trimethoprim 78 20.8 Amoxicillin 44 19.9 Flucloxacillin 22 19.3
Hexamine hippurate 51 13.6 Doxycycline 37 16.7 Dicloxacillin 7 6.1
Nitrofurantoin 20 5.3 Cefalexin 33 14.9 Clindamycin 6 5.3
Amoxicillin 14 3.7 Roxithromycin 20 9.0 Doxycycline 5 4.4
Source: Antimicrobials form * Only top ten antimicrobials listed. † Some residents were prescribed more than one antimicrobial for cellulitis. § Kenacomb® contains triamcinolone, neomycin, nystatin and gramicidin
Microbiology, urinary investigations and infection signs and/or symptoms
Additional information was collected about microbiology results, urinary investigations and catheter devices, and the presence of signs and/or symptoms of a suspected infection for 1,563 (66.8%) of the total 2,341 antimicrobial prescriptions. For these prescriptions, the start date was known and less than six months prior to the survey day. Approximately one in five were for prophylaxis (n = 278, 17.8%).
At least one microbiological sample was collected for 14.6% (n = 228) of the 1,563 prescriptions within the week prior to the antimicrobial start date. Of the total 234 samples, there were 149 urine (63.7%), 41 swab (17.5%), 15 respiratory virus test (6.4%), eight blood (3.4%), eight stool (3.4%), seven sputum (3.1%) and six other (2.6%) samples taken.
More than one-third (n = 554, 35.4%) of the antimicrobial prescriptions were for residents who had signs and/or symptoms of a suspected infection in the week prior to the antimicrobial start date. When prescriptions for prophylactic purposes were removed, this figure rose to 43.1%. Three quarters (n = 419, 75.6%) of the antimicrobial prescriptions for residents with signs and/or symptoms were for facility-associated infections, representing 26.8% of all prescriptions. This is lower than in previous years in 2016 (36.5%) and 2017 (40%). About 22% (n = 346) of the antimicrobial prescriptions were for residents who had signs and/or symptoms of a McGeer et al confirmed infection. Compliance with the McGeer et al infection criteria was highest for eye (n = 50, 39.7%) and gastrointestinal infections (n = 2, 25.0%) (Table16).

26
Table 16: Number and percentage of antimicrobial prescriptions where infection signs and/or symptoms were recorded and McGeer et al criteria were met, by body system, AC NAPS contributors, 2018*
Body system No. of
prescriptions
No. of suspected infections
Facility-associated suspected infections
Suspected infections that met McGeer et
al definition
No. % No. % No. %
Skin or soft tissue 527 198 37.6 152 28.8 97 18.4
Urinary tract 388 98 25.3 79 20.4 14 3.6
Respiratory tract 306 145 47.4 134 43.8 45 14.7
Eye 126 58 46.0 47 37.3 50 39.7
Oral 34 7 20.6 5 14.7 2 5.9
Gastrointestinal tract 8 4 50.0 2 25.0 2 25.0
Other systems 174 44 25.3 - - - -
Total 1,563 554 35.4 419 26.8 346 22.1
Source: Antimicrobials form * Some prescriptions may have had infection signs and/or symptoms recorded for more than one body system

27
Discussion
Aged care homes are recognised nationally and internationally as an important community setting for monitoring infections, antimicrobial use and antimicrobial resistance. Residents colonised or infected by multidrug-resistant organisms and high levels of inappropriate antimicrobial use has been reported in these settings.10-14 In 2018, there was a pleasing increase in the number of AC NAPS contributors from all states and territories, remoteness areas and provider types. This indicates that these aged care facilities recognise AC NAPS as a valuable tool for monitoring the safety of care they provide to residents in relation to antimicrobial use. The introduction of the new Aged Care Quality Standards, which apply to all aged care services from 1 July 2019, may also have been a factor that influenced participation in AC NAPS. The Standards of specific relevance to antimicrobial use and infections are:
Standard 3: Personal care and clinical care includes requirements for minimisation of infection-related risks through implementing infection control and prevention precautions; and practices to promote appropriate antibiotic prescribing and use
Standard 8: Organisational governance notes that where clinical care is provided, the organisation is required to demonstrate antimicrobial stewardship. Data from AC NAPS directly support these standards.15
It is pleasing to note most facilities that participated in the 2018 AC NAPS appear well positioned to address the issues identified by AC NAPS and the requirements of the Aged Care Quality Standards. These facilities have established teams and designated staff to lead infection prevention and control and AMS programs; have policies and procedures in place; and provide staff with access to antimicrobial prescribing guidelines. Longitudinal data spanning three years, and improved geographic representativeness of the cohort in 2018, also mean that the survey database can contribute to a greater extent to understanding of the prevalence of infections and antimicrobial use in Australian residential aged care. The very low participation by private aged care homes (2.4%) and not-for-profit aged care homes (9.5%) indicates that there is a need for targeted communication with these sectors to promote the value of the survey as a tool for identifying opportunities for improving the safety of care provided to residents. Higher rates of participation by private and not-for-profit facilities will also increase the representativeness of the AC NAPS cohort and the capacity to generalise AC NAPS findings. In 2018, the prevalence of residents in AC NAPS contributor facilities who had signs and/or symptoms of at least one suspected infection was 2.9%. One in five (19.9%) suspected infections were not facility-associated; this warrants further investigation as these infections may be attributable to hospital care or community-onset infections prior to admission to the aged care facility. This finding has potential implications for infection prevention and control practices in aged care facilities, and discharge and transfer communication practices.
Whilst not directly comparable to AC NAPS, the 2016 HALT study found that in European long term care facilities, including ‘nursing homes’, the prevalence of residents with at least one healthcare-associated infection was marginally higher (3.7%) and the prevalence of residents prescribed at least one antimicrobial was lower (4.9%).12, 13 As the AC NAPS database and representativeness of the cohort increases further, it may be possible to make meaningful international comparisons.
The collection, for the first time in 2018, of data on prescription of antimicrobials for prn administration, identified a range of opportunities for improvement action. Almost one-fifth (19.0%) of antimicrobials were prescribed for prn administration. A large proportion of these prn prescriptions (94.4%) were for topical antimicrobials – most commonly clotrimazole (65.4%), followed by chloramphenicol (7.9%), miconazole (7.2%) and

28
Kenacomb®/Otocomb® (6.3%) and mupirocin (3.4%); however, only 12.1% of the prn antimicrobials were administered on the survey day or in the six days prior.
Four of the five most commonly prescribed prn antimicrobials are classified as Schedule 3 medicines by the Therapeutic Goods Administration.16 This means they are available for purchase from a pharmacy, without a prescription; a pharmacist must personally hand these medicines to the patient. However, they may also be prescribed under the Pharmaceutical Benefits Schedule (PBS) by either a medical practitioner or a nurse practitioner; mupirocin may only be prescribed under the PBS by a medical practitioner.17 Whilst there are no data on direct purchase of these antimicrobials for use in AC NAPS contributor facilities, it is possible that AC NAPS data understates use of Schedule 3 antimicrobials purchased directly from a pharmacist, and not recorded on the resident medication chart.
In 2018, similar to previous AC NAPS surveys, one-third (36.3%) of antimicrobial prescriptions were for topical use. The adverse impact on antimicrobial resistance of antimicrobials administered via this route is increasing.18 Whilst topical clotrimazole is indicated for a number of conditions, including mucocutaneous candidiasis, chloramphenicol use in generally restricted to ophthalmic conditions. Prescribing guidelines for clotrimazole generally recommended a duration of two weeks, rather than the duration of use reported by AC NAPS contributors, including 10% of therapeutic prescriptions of clotrimazole continuing for longer than six months.19 Of note, 8% of all infections with an identifiable indication reported by AC NAPS contributor facilities in 2018 were for eye infections. The use of prn prescriptions may be limiting the capacity for clinical review of antimicrobial use, in addition to the potential risks of prolonged exposure of residents to topical antimicrobials and their use for unconfirmed infections. About two-thirds (64.6%) of antimicrobial prescriptions reported to AC NAPS in 2018 were for residents without signs and/or symptoms of a suspected infection in the week prior to the antimicrobial start date. Antimicrobial prescriptions were also reported for indications for which they are not recommended; for example, for prophylaxis and treatment of asymptomatic bacteriuria (6.5%).19 Almost half of cefalexin prescriptions were for prophylaxis (44.2%) comprising one third (33.3%) of all antimicrobial prescriptions for prophylactic indications. Half of these prophylactic cefalexin prescriptions had a duration of greater than six months (51.9%). A resident with a suspected infection should have samples taken for microbiology testing as clinically indicated, preferably before commencing antimicrobials.20 The 2018 AC NAPS found that only 14.6% of all prescriptions had microbiological samples taken in the week prior to prescription start date. Whilst in many cases microbiological sampling is difficult or not indicated, ensuring that therapy is consistent with microbiological results is becoming increasingly important, particularly in the setting of high rates of AMR in aged care homes. Evidence-based treatment guidelines have recently been expanded to include guidance on initial assessment of residents with suspected UTI and community-associated pneumonia.19,
21 Importantly, clinical criteria for suspected UTI are recommended as the basis for treatment, and urine dipstick testing is discouraged in other circumstances.19
Broad-spectrum agents are known to cause diarrhoea and candidiasis. The use of narrow spectrum antimicrobials in accordance with guidelines, where clinically appropriate, can be expected to reduce the risk of adverse effects for residents, and may have flow on benefits of reducing the need for other antimicrobial uses to treat antibiotic-related complications such as candidiasis and diarrhoea. The prescribing patterns reported to AC NAPS indicate that there are opportunities to improve the safety of care provided to residents by promoting concordance with national treatment guidelines, which will lead to reductions in use of broad-spectrum antimicrobials. For example, amoxicillin is recommended as the first-line treatment for pneumonia in aged care facility residents rather than amoxicillin–clavulanic acid; dicloxacillin is recommended in cellulitis where susceptible Staphylococcus aureus is suspected, rather than cefalexin.19

29
Trimethoprim is the recommended first line therapy for uncomplicated cystitis in Therapeutic Guidelines: Antibiotic rather than cefalexin. The Australian Medicines Handbook also recommends trimethoprim with amoxicillin–clavulanic acid or cefalexin as alternative choices, whilst noting the need to balance the adverse effects of antibiotic therapy and consideration of non-antibacterial therapies such as intravaginal oestrogen in post-menopausal women.21
Whilst there was a small improvement in documentation of the indication for prescribing an antimicrobial in facilities that participated in AC NAPS for three consecutive years (2016 to 2018), the indication was not recorded for 25.1% of prescriptions in 2018. The antimicrobial review or stop date was not documented for 58.9% of prescriptions in 2018. An allergy was documented for 28.3% of the antimicrobial prescriptions in the 2018 AC NAPS. Previous studies have suggested many antimicrobial allergy labels recorded for elderly medical inpatients are not clearly explained.22
When a resident is prescribed an antimicrobial, the minimum information that should be recorded includes: the indication, drug name, dose, route of administration, intended duration and review plan.20 Documentation of allergies should include a clear description of reaction(s). The use of medication charts that are consistent with the Commission’s National Residential Medication Chart will support documentation of these elements.23 The initial prescription of an antimicrobial should be for the shortest possible duration, consistent with the condition being treated and the expected clinical response. In general, a prescription should be reviewed as soon as possible, at least prior to seven days.19
This is particularly important for empirical therapy, which is prescription of antimicrobials for an unconfirmed pathogen and its antimicrobial susceptibilities. Promoting routine antimicrobial review processes may assist with reducing duration of use, particularly for topical clotrimazole and cefalexin prescribed for prophylaxis for urinary tract conditions, and switching from broad to narrow spectrum agents where appropriate. Therapeutic Guidelines: Antibiotic recommends trimethoprim as the first-line choice for urinary tract conditions, if indicated, for six months duration with subsequent review. In summary, there are several aspects of the management of antimicrobial prescribing and infections in aged care facilities that should be considered for action to improve the safety of care provided to residents. These include promoting:
Use of evidence-based infection assessment tools, such as those included in Therapeutic Guidelines: Antibiotic
Implementation of infection prevention and control practices consistent with the Australian Guidelines for the Prevention and Control of Infection in Health Care to reduce the risk of residents acquiring a preventable infection and support appropriate management of infections if they occur 24
Use of microbiological testing to confirm infections and inform antimicrobial treatment choices
Access to and use of evidence-based guidelines for prescribing antimicrobial treatment to improve appropriateness in relation to choice of agent, duration of use and the volume of topical antimicrobial use
Use of medication charts that are consistent with the Commission’s National Residential Medication Chart to improve documentation for antimicrobial prescriptions
Routine antimicrobial therapy review, including prescriptions for prophylaxis, prn administration and topical antimicrobial use.
The Commission will support the Aged Care Quality and Safety Commission to promote ongoing surveillance of infections and antimicrobial use, the development and

30
implementation of effective infection prevention and control and AMS programs and action to improve the safety of care provided to residents of aged care facilities.
Documentations of allergies was recorded for only 28.3% of the antimicrobial

31
Appendix 1: Aged care facility form

32

33
Appendix 2: Antimicrobials form

34

35
36
Appendix 3: Infections form

37

38
Appendix 4: Additional data on infections and antimicrobials
Table A4.1: Prevalence of infections and antimicrobial use for facilities that have participated all three years and confidence intervals, AC NAPS contributors, 2016–2018*
On survey day 2016 2017 2018 p-
value No. % 95% CI No. % 95% CI No. % 95% CI
Residents with signs and/or symptoms of least one suspected infection
43 3.9 2.8–5.3 21 2.0 1.3–3.1 31 3.0 2.0–4.3 0.68
Residents prescribed at least one antimicrobial
132 12.0 10.1–14.3 116 11.2 9.3–13.5 144 13.9 11.7–16.4 0.52
Number of residents present
1,097 - - 1,032 - - 1,034 - - -
* See also Figure 1
Table A4.2: Most commonly prescribed antimicrobials, AC NAPS contributors, 2016–2018*
Antimicrobial 2016 2017 2018
Cefalexin 21.4 19.4% 20.3%
Clotrimazole (T) 17.5 20.8% 19.0%
Chloramphenicol (T) 5.6 5.4% 7.0%
Amoxicillin-clavulanic acid 6.3 5.8% 5.8%
Doxycycline 5.4 5.7% 5.3%
Trimethoprim 6.2 5.8% 5.3%
Amoxicillin 4.6% 6.1% 5.0%
Hexamine hippurate 3.4% 3.2% 4.7%
Miconazole (T) 2.3% 2.0% 3.5%
Kenacomb® (T) 2.5% 2.1% 2.4%
Ciprofloxacin 1.9% 1.7% 2.2%
Flucloxacillin 1.8% 2.1% 2.1%
Mupirocin (T) 1.0% 0.8% 1.7%
Nitrofurantoin 3.0% 3.3% 1.5%
Roxithromycin 2.6% 1.6% 1.4%
Trimethoprim-sulfamethoxazole 2.0% 1.6% 1.2%
Clindamycin 1.4% 1.5% 1.1%
Nystatin (O or T) 1.1% 1.2% 0.9%
Metronidazole 1.7% 0.7% 0.8%
Cefazolin 0.3% 0.2% 0.6% * See also Figure 2

39
Table A4.3: Key quality indicators for facilities that have participated all three years, AC NAPS contributors, 2016–2018*
Indicator 2016 2017 2018
No. % 95% CI No. % 95% CI No. % 95% CI
Clinical indication
Documented 89 60.5 52.2–68.5 98 66.7 58.4–74.2 119 69.6 62.1–76.4
Not documented 58 39.5 31.5–47.9 49 33.3 25.8–41.6 52 30.4 23.6–37.9
Review or stop date
Documented 52 35.4 27.7–43.7 44 29.9 22.7–38.0 63 36.8 29.6–44.5
Not documented 95 64.6 56.3–72.3 103 70.1 62.0–77.3 108 63.2 55.5–70.4
* See also Figure 3
Table A4.4: Most common indications for antimicrobial prescriptions, AC NAPS contributors, 2016–2018* †
Indication
2016 (n = 1506)
2017 (n = 1236)
2018 (n = 2341)
No % No. % No. %
Other- Skin, soft tissue or mucosal 240 15.9 197 15.9 428 18.3
Cystitis 265 17.6 214 17.1 375 16.0
Pneumonia 164 11.0 134 10.9 221 9.4
Cellulitis 71 4.8 51 4.1 114 4.9
Other- Urinary tract 30 2.0 38 3.1 110 4.7
Wound infection: non-surgical 85 5.7 64 5.1 101 4.3
Conjunctivitis 52 3.5 50 4.1 96 4.1
Tinea 43 2.9 59 4.7 78 3.3
Other- Respiratory tract 24 1.6 14 1.1 57 2.4
Asymptomatic bacteriuria 58 3.9 39 3.2 50 2.1
Other- Eye 21 1.4 16 1.3 47 2.0
Catheter-associated UTI 28 1.8 23 1.9 44 1.9
Other- Medical prophylaxis 26 1.4 19 1.5 33 1.7
Genital candidiasis 19 1.3 24 1.2 29 1.2
Infective exacerbation of COPD 19 1.3 18 1.9 29 1.2
Ulcers 19 1.3 15 1.5 27 1.2
Paronychia 13 0.9 4 0.3 20 0.9
Oral candidiasis 9 0.6 14 1.1 19 0.8
Wound infection: surgical 8 0.5 10 0.8 18 0.8
Pyelonephritis 7 0.5 8 0.6 17 0.7 *Indications categorised by surveyors as ‘Unknown’ are not included. † See also Figure 5

40
Table A4.5: Therapeutic and prophylactic antimicrobial prescriptions for common indications, AC NAPS contributors, 2018* †
Indication Therapeutic Prophylactic
No. % No. %
Other- Skin, soft tissue or mucosal 378 88.3 50 11.7
Pneumonia 205 92.8 16 7.2
Cystitis 187 49.9 188 50.1
Cellulitis 103 90.4 11 9.6
Wound infection: non-surgical 93 92.1 8 7.9
Conjunctivitis 85 88.5 11 11.5
Tinea 76 97.4 2 2.6
Other- Respiratory tract 43 75.4 14 24.6
Asymptomatic bacteriuria 40 18.4 9 81.6
Other- Urinary Tract 27 24.5 83 75.5 *Indications categorised by surveyors as ‘Unknown’ are not included. † See also Figure 6

41
References
1. Australian Government Australian Institute of Health and Welfare. Services and places in aged care cited 2019 April ]. Available from: https://gen-agedcaredata.gov.au/Topics/Services-and-places-in-aged-care. 2. Australian Government Department of Health. Aged care data snapshot- 2018 2018 3. Victorian Healthcare Associated Infection Surveillance Coordinating Centre. E bulletin June 2017. Available from: www.vicniss.org.au/publications/e-bulletin/. 4. Commonwealth of Australia. National Antimicrobial Resistance Strategy 2015-2019. Canberra 2015. 5. European Centre for Disease Prevention and Control. Healthcare associated infections in long term care facilities in Europe: The HALT project Available from: https://ecdc.europa.eu/en/healthcare-associated-infections-long-term-care-facilities. 6. National Centre for Antimicrobial Stewardship and Australian Commission on Safety and Quality in Health Care. Antimicrobial prescribing and infections in Australian residential aged care facilities: Results of the 2015 Aged Care National Antimicrobial Prescribing Survey pilot,. Sydney,: ACSQHC,; 2016. https://www.safetyandquality.gov.au/publications-and-resources/resource-library/antimicrobial-prescribing-and-infections-australian-residential-aged-care-facilities-results-2015-aged-care-national-antimicrobial-prescribing-survey-pilot 7. National Centre for Antimicrobial Stewardship and Australian Commission on Safety and Quality in Health Care. 2016 Aged Care National Antimicrobial Prescribing Survey Report,. Sydney: ACSQHC; 2017. https://www.safetyandquality.gov.au/publications-and-resources/resource-library/2016-aged-care-national-antimicrobial-prescribing-survey-report 8. National Centre for Antimicrobial Stewardship and Australian Commission on Safety and Quality in Health Care. Antimicrobial Prescribing and Infections in Australian Aged Care Homes: Results of the 2017 Aged Care National Antimicrobial Prescribing Survey,. Sydney: ACSQHC; 2018. https://www.safetyandquality.gov.au/publications-and-resources/resource-library/2017-aged-care-national-antimicrobial-prescribing-survey-report 9. Stone ND, Ashraf MS, Calder J, Crnich CJ, Crossley K, Drinka PJ, et al. Surveillance definitions of infections in long-term care facilities: Revisiting the McGeer criteria. Infection control and hospital epidemiology : the official journal of the Society of Hospital Epidemiologists of America. 2012;33(10):965-77. 10. Smith M, Atkins S, Worth L, Richards M, Bennett N. Infections and antimicrobial use in Australian residential aged care facilities: a comparison between local and international prevalence and practices. Aust Health Rev. 2013;37(4):529-34. 11. Australian Commission on Safety and Quality in Health Care. Australian Passive Antimicrobial Resistance Surveillance. First report: multi-resistant organisms,. Sydney; 2018. https://www.safetyandquality.gov.au/publications-and-resources/resource-library/australian-passive-antimicrobial-resistance-surveillance-apas-first-report-multi-resistant-organisms 12. Suetens C, Latour K, Karki T, Ricchizzi E, Kinross P, Moro ML, et al. Prevalence of healthcare-associated infections, estimated incidence and composite antimicrobial resistance index in acute care hospitals and long-term care facilities: results from two European point prevalence surveys, 2016 to 2017. Euro Surveill. 2018;23(46). 13. Ricchizzi E, Latour K, Karki T, Buttazzi R, Jans B, Moro ML, et al. Antimicrobial use in European long-term care facilities: results from the third point prevalence survey of healthcare-associated infections and antimicrobial use, 2016 to 2017. Euro Surveill. 2018;23(46). 14. Coombs G BJ, Daley D, Collignon P, Cooley L, Gottlieb T, Iredell J, Kotsanas D, Nimmo G and Robson J on behalf of the Australian Group on Antimicrobial Resistance and Australian Commission on Safety and Quality in Health Care,. Australian group on Antimicrobial Resistance Sepsis Outcomes Programs: 2017 Report. . Sydney; 2019. https://www.safetyandquality.gov.au/publications-and-resources/resource-library/agar-sepsis-outcome-programs-2017-report

42
15. Aged Care Quality and Safety Commission. Quality Standards Sydney: ACQSC; 2019. Available from: https://www.agedcarequality.gov.au/providers/standards. 16. Therapeutic Goods Administration. Standard for the Uniform Scheduling of Medicines and Poisons (SUSMP) No. 24. Poisons Standard June 2019, : Australian Government Department of Health. Available from: https://www.legislation.gov.au/Details/F2019L00685. 17. Health AGDo. Pharmaceutical Benefits Schedule, Canberra. Available from: http://www.pbs.gov.au/browse/medicine-listing. 18. Williamson D, Ritchie SR, Best E, Upton A, Leversha A, Smith A, et al. A bug in the ointment: topical antimicrobial usage and resistance in New Zealand. The New Zealand medical journal. 2015;128(1426):103-9. 19. Antibiotic Expert Group. Therapeutic Guidelines: Antibiotic. Version 16. Melbourne Therapeutic Guidelines Limited 2019. 20. Australian Commission on Safety and Quality in Health Care. Antimicrobial Stewardship Clinical Care Standard Sydney ACSQHC; 2014. 21. Australia Medicines Handbook. Aged Care Companion Adelaide Australian Medicines Handbook Pty Ltd; 2018. Available from: https://agedcare.amh.net.au/auth. 22. Trubiano JA, Pai Mangalore R, Baey YW, Le D, Graudins LV, Charles PG, et al. Old but not forgotten: Antibiotic allergies in General Medicine (the AGM Study). The Medical journal of Australia. 2016;204(7):273. 23. Australian Commission on Safety and Quality in Healthcare. National Residential Medication Chart 2014. Available from: http://www.safetyandquality.gov.au/our-work/medication-safety/medication-chart/nrmc/. 24. National Health and Medical Research Council. Australian Guidelines for the Prevention and Control of Infection in Healthcare In: Australia Co, editor. Canberra NHMRC; 2010.

43
