2017 toxics and pollution prevention evaluation report
TRANSCRIPT

April 2018
2017 Toxics and Pollution Prevention Evaluation Report
Prevention
This document is made available electronically by the Minnesota Legislative Reference Library as part of an ongoing digital archiving project. http://www.leg.state.mn.us/lrl/lrl.asp

Minnesota Pollution Control Agency
520 Lafayette Road North | Saint Paul, MN 55155-4194 |
651-296-6300 | 800-657-3864 | Or use your preferred relay service. | [email protected]
This report is available in alternative formats upon request, and online at www.pca.state.mn.us.
Document number: lrp-p2s-1sy17
Legislative charge Minn. Statutes § 115A.121 Toxics and Pollution Prevention Evaluation Report
The commissioner shall prepare and adopt a report on pollution prevention activities required in chapters 115A, 115D, and 325E. The report must include activities required under section 115A.1320. The commissioner must submit the report to the Senate and House of Representatives committees having jurisdiction over environment and natural resources by December 31, 2013, and every four years thereafter.
Authors Mark Snyder Madalyn Cioci Amanda Cotton John Gilkeson Carol Hubbard Al Innes Matthew Webb
Contributors/acknowledgements David Benke Rick Patraw Tina Patton
Cover Photo
Paul Andre
Estimated cost of preparing this report (as required by Minn. Stat. § 3.197)
Total staff time: 400 hrs. $14,400
Total $14,400
The MPCA is reducing printing and mailing costs
by using the Internet to distribute reports and
information to wider audience. Visit our
website for more information.
MPCA reports are printed on 100% post-
consumer recycled content paper
manufactured without chlorine or chlorine
derivatives.

ii
Contents Executive summary ............................................................................................................................1
Introduction ......................................................................................................................................4
Report organization .......................................................................................................................................... 5
Sustainable materials management ....................................................................................................6
Statewide trends for Toxic Release Inventory reporting industries .................................................... 10
Manufacturing sector: TRI chemicals generation .......................................................................................... 10
All industrial sectors: TRI chemicals generation ............................................................................................. 13
All industrial sectors: TRI chemical releases ................................................................................................... 13
Electronics recycling ......................................................................................................................... 14
Overview ........................................................................................................................................................ 14
Obligation setting ........................................................................................................................................... 14
Collection ........................................................................................................................................................ 15
Recycling ......................................................................................................................................................... 15
Manufacturer registration and reporting ....................................................................................................... 16
Estimated composition of CED collected in Program Year Nine (FY16) ......................................................... 16
Challenges for the Minnesota Electronics Recycling Act ............................................................................... 16
E-waste program compliance and enforcement ............................................................................................ 17
Broader issues with electronics ...................................................................................................................... 18
Architectural paint product stewardship ........................................................................................... 23
Toxics in packaging .......................................................................................................................... 28
Background..................................................................................................................................................... 28
Joint action ..................................................................................................................................................... 29
Addressing toxic chemicals in products ............................................................................................. 32
Mercury found in cosmetic products in Minnesota ....................................................................................... 32
Mercury-catalyzed polyurethane floors in Minnesota schools ...................................................................... 34
Summary of flooring study ............................................................................................................................. 34
2013 TPPER Proposals for reducing lead and mercury in products, people and the environment ............... 36
Conclusion ....................................................................................................................................... 50
Appendices ..................................................................................................................................................... 51

iii
Figures Figure 1. Thermal paper receipt ................................................................................................................... 7 Figure 2. Product life cycle. Toxics waste and other pollutants can be emitted at any or every phase of a product’s life. A toxic pollutant could be used in production, manufactured into a product, release in use by a consumer, and leak into the environment at end-of-life. ..................................................................... 8 Figure 3. Minnesota year-round and supplemental drop-off sites and events .......................................... 27 Figure 4. Example of skin-lightening cream ................................................................................................ 32 Figure 5. School gymnasium ....................................................................................................................... 34 Figure 6. Grant funded station for boat owners to clean their boats to control invasive species ............. 45
Charts Chart 1: Statewide trends for TRI chemicals generated by manufacturers ................................................ 11 Chart 2: Pounds recycled vs. manufacturer obligation ............................................................................... 17 Chart 3: Summary of all known grid tied* solar capacity by year .............................................................. 21 Chart 4: Projected cumulative solar installations in Minnesota through 2021 .......................................... 22 Chart 5: Minnesota architectural paint collection ...................................................................................... 25
Tables Table 1. Management method of TRI chemicals generated by manufactures (in millions of pounds) ...... 11 Table 2. Total amount of TRI chemicals generated by all reporters (in millions of pounds) ...................... 13 Table 3. Total amount of TRI chemicals released by all reporters (in millions of pounds) ......................... 13 Table 4. Minnesota Electronics Recycling Act program data ...................................................................... 15 Table 5. Materials collected (pounds)......................................................................................................... 16 Table 6. Minnesota HHW program reimbursement for paint management .............................................. 25 Table 7. Architectural paint stewardship fee comparison .......................................................................... 26 Table 8. States with toxics in packaging legislation .................................................................................... 29

2017 Toxics and Pollution Prevention Evaluation Report • April 2018 Minnesota Pollution Control Agency
1
Executive summary Many of the products and packaging we use every day contain or were manufactured using hazardous
chemicals. Some of these chemicals are intentionally added to products by the manufacturer for various
reasons such as performance or cost. Other chemicals are found in the parts or ingredients a
manufacturer uses to create the final product.
In Minnesota and elsewhere, concern about harmful chemicals in consumer products has continued to
grow. These chemicals can cause concern to humans and the environment when we are exposed to
them.
Because of the prevalence of these chemicals in products, Minnesota’s policy is to eliminate or reduce at
the source the use, generation, or release of toxic pollutants and hazardous wastes.
The Minnesota Pollution Control Agency (MPCA) works to address the challenges our use of chemicals
creates by:
Working with manufacturers to find ways to reduce chemical waste or avoid the use of toxic chemicals in the production process.
Working with companies to find ways to reduce or avoid the use of toxic chemicals in the products they make and ensure those products that contain toxic chemicals are properly managed at the end of their useful lives.
In selecting priorities on which to focus its work, the MPCA consults with partner agencies and
customers and considers as much data as possible, including environmental and biomonitoring,
chemical production and release reporting, hazard levels and potential for exposure, who may be
exposed (e.g. children or disadvantaged communities) and availability of feasible alternatives.
Why is it important?
Our knowledge about the hazards posed to people and the environment from toxic chemicals, even at
low levels, is changing rapidly, which makes it sensible to take opportunities to reduce exposure to toxic
chemicals through pollution prevention.
Air, water, and soil samples show the unintended presence of toxic chemicals due to human activity and
investigations of children’s products and personal care products have found multiple examples where
levels of toxic chemicals have violated state statutes.
Key points
Sustainable materials management
MPCA has adopted a sustainable materials management (SMM) approach to minimize the
environmental and human health impacts and resource use of materials over their full life cycles. This
approach helps to assure that materials are used in the most productive way and that we have sufficient
resources to meet both today’s needs as well as those of the future.
Trends in generation and releases of toxic chemical waste by Minnesota industrial sectors
According to 2015 data from Minnesota’s 443 reporting facilities, generation of Toxic Release Inventory
(TRI) chemical waste has increased from 2011 levels, most notably waste from manufacturers and waste
incineration facilities. However, the majority of the increase in waste generation from manufacturers
was one chemical reported by one facility that is managed through recycling. Releases from TRI
reporting facilities have also increased slightly. (A "release" of a chemical means that it is emitted to the
air or water, or placed in some type of land disposal.) Two-thirds of these releases are wastes sent to
landfills with the remaining third being releases to air. The leading chemical released to air is n-hexane,
which is used primarily in oilseed processing.

2017 Toxics and Pollution Prevention Evaluation Report • April 2018 Minnesota Pollution Control Agency
2
Trends and emerging issues in product end-of-life management and toxics in products
The report identifies emerging issues in mercury and electronic waste, including solar panels and
improvements in paint collection around the state. Legislative changes to the Minnesota Electronics
Recycling Act were enacted in July 2016 to address the gap between the amount of electronics collected
for recycling and the manufacturer obligation to purchase recycled “covered electronic devices” (CEDs).
While there is only one-year’ worth of data to evaluate since these changes, the gap has narrowed.
E-waste: Products made using recycled plastics from e-wastes are showing detectable levels of
brominated flame-retardants (BFRs), which are linked to a myriad of health effects, including
reproductive system development and cancer. Some companies are voluntarily redesigning products to
reduce the need for BFRs in plastics, but additional research and stakeholder input is needed to answer
questions about when a product is too toxic to be recycled and how to drive better product design.
Solar Panels: An emerging issue with the rapid growth in solar panel installation is how will non-working panels be managed at end of life? The MPCA will work with the Public Utilities Commission and Department of Commerce to analyze issues related to identifying and planning for the optimal management options for solar panels after they are decommissioned in the future and present policy options.
Paint: The product stewardship program for architectural paint in Minnesota began in November 2014,
has significantly expanded the number of recycling locations for paint, and increased the amount of
paint collected and recycled, while also reimbursing local government organizations for their paint
management costs through the paint stewardship fee assessed to customers who purchase paint. A
temporary increase to the paint stewardship fee was implemented in September 2017 after collection
volumes outpaced projections and sales of new paint fell behind projections. The temporary fee
increase is in place until June 2019.
Cosmetic Products: Mercury is being found in cosmetic products in Minnesota, specifically skin-
lightening creams sold in ethnic markets in the Twin Cities area. These products are both illegal to sell in
Minnesota and pose a health threat to those who have used them. Mercury is a neurotoxin that can
damage both the brain and central nervous system and can cause kidney damage. A multi-agency
outreach and education effort has been undertaken, but more work needs to be done to curtail demand
for these products.
Policy recommendations
Lead and mercury in products
1. Enact manufacturer responsibility requirements for mercury displacement relays like those that were passed for mercury thermostats in 2014. Require wholesalers and retailers of mercury thermostats and displacement relays to advise purchasers of recycling requirements for these products.
2. Establish a flexible, product stewardship approach for mercury-containing lamps based on the successful program in Washington State and provide an option for including LED lamps in this program.
3. Work with angling, hunting, conservation, and other interested parties to establish a pathway to measurably reduce the use of lead fishing tackle and lead ammunition.
Green and safer product chemistry
A. Provide dedicated funding to expanding Commerce, Health and MPCA’s oversight of Minnesota’s product restriction statutes, with an emphasis on protecting the safety of children and other vulnerable subpopulations.
B. Clarify enforcement authorities under existing and new statutes.

2017 Toxics and Pollution Prevention Evaluation Report • April 2018 Minnesota Pollution Control Agency
3
C. The MPCA, DEED and other partners should, with the Legislature, explore grant and incentive tools, which support early stage companies developing safer product chemistries prior to those technologies producing sales and showing a profit.
D. Support the Angel Tax Credit for individual investors willing to support innovation. E. Expand prohibitions on deceptive marketing claims covered by Minn. Stat. 325E.41 and add
investigative authorities. F. Establish funding for a reporting system and staff support to assure vendors are complying with
state contract sustainability terms.

2017 Toxics and Pollution Prevention Evaluation Report • April 2018 Minnesota Pollution Control Agency
4
Introduction In the more than 25 years since the state Toxic Pollution Prevention Act (TPPA) was passed, there have
been significant reductions in toxic chemical releases in Minnesota and across the country, even as our
economy continues to grow. Among manufacturers, toxic chemical releases and off-site transfers for
treatment have declined from 83.3 million pounds in 1989, the year prior to the TPPA’s passage to
43.9 million pounds in 2015.
In recent years, there has been discussion centered on reducing “regulatory burden” in Minnesota, from
expediting permits to changing standards or repealing/delaying regulations. What is often overlooked in
these discussions is how pollution prevention, by definition, reduces regulatory burden. Preventing
waste and pollution from being created in the first place can help a facility qualify for a permit with
fewer regulatory requirements and ideally, avoid needing to obtain a permit at all. Companies that
engage in pollution prevention activities can often find significant cost savings as well. In 2016 alone, the
Minnesota Technical Assistance Program assisted 279 businesses across the state, helping them achieve
reductions totaling 1.4 million pounds of waste (including 65,700 pound of hazardous waste), 1.7 million
kWh and 42,000 thousand therms of energy and have conserved 45.3 million gallons of water.
Combined, these reductions add up to first year savings of $1.3 million annually.
While reducing regulatory burden or streamlining permitting approvals may be a laudable goal, it is
important to remember why many of our environmental regulations came about. These environmental
regulations are protections that were developed in response to incidents or problems that arose, with
the goal of preventing future occurrences. For example, the federal Emergency Planning and Community
Right-to-Know Act (EPCRA) that led to the establishment of the Toxic Release Inventory (TRI) was passed
partly in response to the 1984 disaster that took place in Bhopal, India where 40 tons of methyl
isocyanate was released, killing nearly 5,000 people and injuring 50,000 more. Closer to home, the Toxic
Free Kids Act (TFKA) was passed in part because a four-year old boy in Minneapolis died from lead
poisoning after swallowing a jewelry charm that was found to consist of 99% lead in 2006. MPCA staff
continue to identify products that contain dangerous and illegal amounts of toxic metals such as lead
and mercury that are being sold by retailers in Minnesota.
The programs and associated requirements discussed in this report are all regulations to which
manufacturers are subject because of the product design and formulation choices they made, that can
lead to negative human health or environmental consequences. In many cases, these decisions were
made years or even decades ago, when when there was less information available about the toxicity or
other hazard characteristics associated with some of the chemicals and materials used in the products
we manufacture in Minnesota. While there is still a lot to learn about many of the chemicals used in
commerce, we do know quite a bit more than we did 25 years ago or even 5 years ago.
There are tools and resources available now to help businesses focus greater attention on product life
cycle, assess alternatives to chemicals of concern and make choices for product design and formulation
that may help them avoid many of the reporting and other regulatory requirements they currently face.
Examples of leaders such as Valspar and Ecolab that have embraced safer chemistry and product design
are discussed later in this report. Similarly, retailers such as Target are demonstrating leadership
through the development of their Sustainable Product Index, which was updated in 2017 to include
commitments to increase transparency and phase out specific chemicals of concern in a variety of
personal care, household cleaning and textile products.
Furthermore, well-thought-out environmental regulation and policy can stimulate innovation, rather
than stifle it, as is often claimed. Minnesota’s renewable energy standard, passed in 2007, is an excellent

2017 Toxics and Pollution Prevention Evaluation Report • April 2018 Minnesota Pollution Control Agency
5
example of this. Since its passage, Minnesota has become a renewable energy leader, creating
thousands of homegrown jobs and additional sources of income for Minnesota’s agricultural industry1,
while reducing dependence on imported fossil fuels. One of the utilities subject to this standard, Xcel
Energy, was given a requirement of reaching 30% renewable by 2020. In October 2017, Xcel Energy
announced that they aim to generate 60% of their electricity from renewable sources by 2022 and be
85% carbon-free by 2030. Policy decisions like the renewable energy standard have helped to establish
renewable energy as an important part of Minnesota’s
economy. Similarly, policy decisions that support the transition
to safer chemistry and product design can help strengthen
Minnesota’s manufacturing sectors by encouraging innovation,
enhancing competitiveness and reducing liability.
Report organization
As directed by Minn. Stat. §115A.121, this report discusses pollution prevention activities required in
chapters §115A, §115D and §325E. It describes:
Trends in toxic chemicals waste generation by Minnesota industrial sectors as directed by Minn. Stat. § 115D.10
Architectural paint product stewardship program activities as directed by Minn. Stat. §115A.1415
Electronics recycling program activities as directed by Minn. Stat. §115A.1310-1330
Toxics in packaging program activities as directed by Minn. Stat. §115A.965
Activities related to Priority Chemicals as relates to Minn. Stat. §116.9403.
This report also offers recommendations to further reduce toxic chemical content in products sold and
used in Minnesota.
1 “Wind projects are blowing new life into many rural Minnesota communities” – Star Tribune, November 30, 2017
http://www.startribune.com/wind-projects-are-blowing-new-life-into-many-rural-minnesota-communities/461132793/
Well-thought-out environmental regulation and policy can stimulate innovation, rather than stifle it.

2017 Toxics and Pollution Prevention Evaluation Report • April 2018 Minnesota Pollution Control Agency
6
Sustainable materials management Minnesota is a leading state in both pollution prevention (P2) and in managing solid waste. Two distinct
statutes guide these activities, Minn. Stat. § 115D and §115A respectively.
The goal of the Toxic Pollution Prevention Act (TPPA), Minn. Stat. § 115D, is twofold:
1. To protect the public health, welfare and environment by preventing toxics from being made or
used and minimizing the transfer of toxic pollutants from one part of the environment to another,
and
2. To increase awareness of the need and benefits of P2 and coordinate all elements of government,
industry, and the public in carrying out P2 activities.
By this statute, Minnesota defined prevention as the preferred approach for minimizing toxics and their
harm.
This prevention principle is reiterated in Minnesota’s solid waste statute. Minn. Stat. § 115A states that
waste reduction is the preferred method for waste management (Minn. Stat. § 115A.02) and for
reducing the toxicity of that waste. It defines waste reduction (Minn. Stat. § 115A.03 subd. 36b) as “an
activity that prevents generation of waste or the inclusion of toxic materials in waste” and includes:
Reducing material or the toxicity of material used in production or packaging
Changing procurement, consumption, or waste generation habits to result in smaller quantities or lower toxicity of waste generated.
These are all pollution prevention activities. Though they are in the Waste Management statute, they
refer to steps one takes preventatively, before something becomes a waste. Like the TPPA, the Waste
Management Act includes toxicity reduction through product design, production process, and
purchasing choices.
There are many examples where pollution prevention and solid waste challenges intersect. But without
an integrating framework to connect these two areas of focus, we may miss opportunities to protect our
air, water, land, and health.
For example, when a discarded product can be recycled but contains a toxic component, should it be
recycled? A purely solid waste perspective would say yes, recycling is preferred to disposal. A purely
pollution prevention perspective would say no, better to remove the toxic to prevent the circulation
that would occur if the product were recycled.
Here are three current examples that MPCA staff face:
Common receipt paper is typically comprised of 1-2% bisphenol A (a Priority Chemical) or a similarly toxic chemical, bisphenol S. The paper can be recycled with other paper. However, there is evidence that when it is recycled, the BPA or BPS is transferred to the process water, transferring the pollutant from the solid waste to the water. Should we recycle them or throw them away?
Plastic casings for computers and other electronics often contain toxic flame-retardants. Recycling electronics is important, but should their flame-retardant laden plastics be recycled into items that have no need of such flame-retardants?
Food packaging manufactured with antimicrobials and nanoparticles reduces food waste, but those antimicrobials and nanoparticles could be transferred to another media such as land or water at end-of-life. Which is more important?
2017 Toxics and Pollution Prevention Evaluation Report • April 2018 Minnesota Pollution Control Agency
7
Even with answers to these questions, with limited staff time and
resources, how would the MPCA determine which to prioritize? In
order to better answer such questions, integrate the agency's P2 and
solid waste work and maximize environmental protection, the MPCA
is pursuing a new framework: Sustainable Materials Management
(SMM). The MPCA adopted a SMM approach in two recent solid
waste documents.2 With this Toxics and Pollution Prevention
Evaluation report, the MPCA explicitly adds the prevention of toxic
materials as a critical goal for Minnesota's SMM approach.
What is sustainable materials management?
What is SMM? SMM is a systemic approach to
minimizing the total environmental impacts and
resource use of materials over their entire life cycles –
product design to raw material extraction to production
processes to use (and reuse), and to best management
when ultimately discarded. SMM includes traditional
solid waste management, but is concerned with the
larger scope of materials and products and the toxic
chemicals and materials used to manufacture those products.
The MPCA agrees with the U.S. Environmental Protection Agency3 (EPA) that the SMM4 approach seeks
to:
Use materials in the most productive way with an emphasis on using less.
Reduce toxic chemicals and environmental impacts throughout the material life cycle.
Assure we have sufficient resources to meet today’s needs and those of the future.
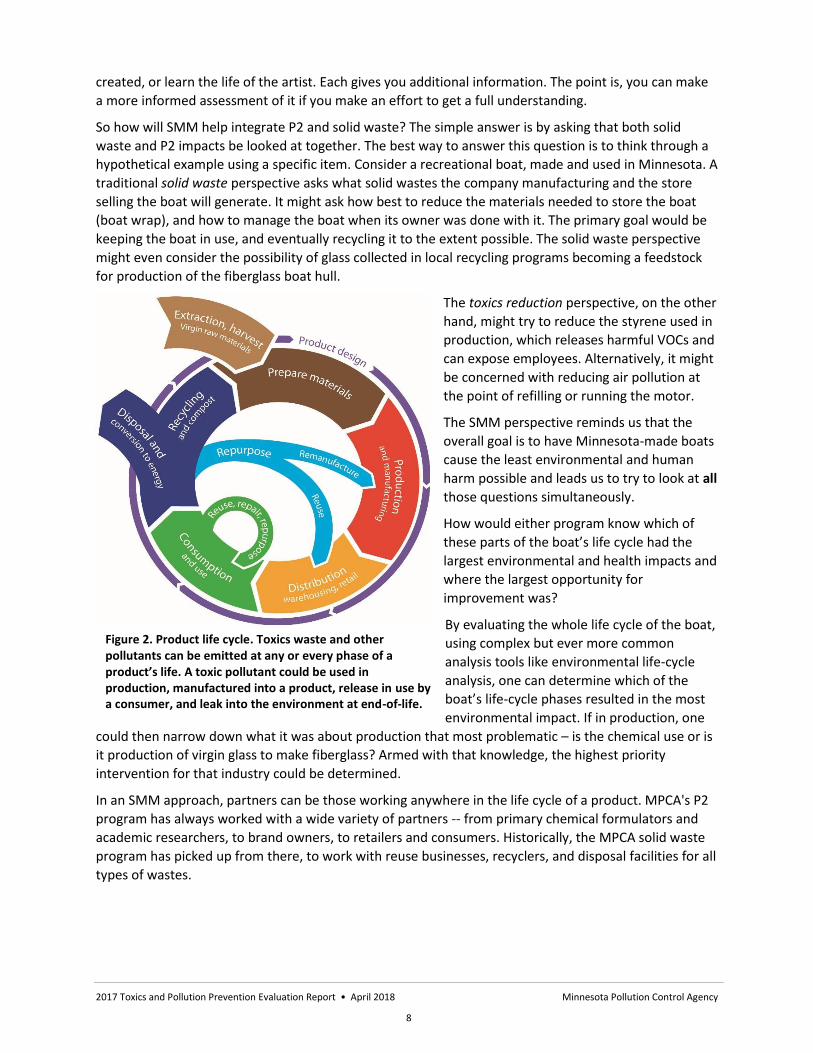
SMM starts from the recognition that products and materials vary in the environmental impacts they
cause throughout their life cycles, and that the largest portion of those impacts is typically caused in the
extraction of raw materials, manufacturing, and sometimes from the use of the products (see Figure 2).
How does a sustainable materials management perspective help integrate P2 with solid waste?
SMM is about intentionally looking at materials and products from a systemic perspective instead of
through the narrow lens of a single discipline’s vantage point. While there are tools available to assist in
getting that systemic understanding, SMM is not about deploying a specific, defined set of analysis steps
or methods that results in a definitive answer. It is akin to understanding a great statue in a museum.
You get a more complete understanding by walking around it than from standing in one position. You
can also test the materials it is made from, research the history of the time and place in which it was
2 The 2015 Solid Waste Policy Report and the Metropolitan Solid Waste Policy Plan 2016-2036 both include discussion of Sustainable Materials
Management. 3 Sustainable Materials Management: The Road Ahead (https://www.epa.gov/sites/production/files/2015-
08/documents/sustainable_materials_management_the_road_ahead.pdf) 4 U.S. EPA Sustainable Materials Management Basics https://www.epa.gov/smm/sustainable-materials-management-basics
Figure 1. Thermal paper receipt
SMM is a systemic approach to minimizing the total environmental impacts and resource use of materials over their entire life cycles
2017 Toxics and Pollution Prevention Evaluation Report • April 2018 Minnesota Pollution Control Agency
8
created, or learn the life of the artist. Each gives you additional information. The point is, you can make
a more informed assessment of it if you make an effort to get a full understanding.
So how will SMM help integrate P2 and solid waste? The simple answer is by asking that both solid
waste and P2 impacts be looked at together. The best way to answer this question is to think through a
hypothetical example using a specific item. Consider a recreational boat, made and used in Minnesota. A
traditional solid waste perspective asks what solid wastes the company manufacturing and the store
selling the boat will generate. It might ask how best to reduce the materials needed to store the boat
(boat wrap), and how to manage the boat when its owner was done with it. The primary goal would be
keeping the boat in use, and eventually recycling it to the extent possible. The solid waste perspective
might even consider the possibility of glass collected in local recycling programs becoming a feedstock
for production of the fiberglass boat hull.
The toxics reduction perspective, on the other
hand, might try to reduce the styrene used in
production, which releases harmful VOCs and
can expose employees. Alternatively, it might
be concerned with reducing air pollution at
the point of refilling or running the motor.
The SMM perspective reminds us that the
overall goal is to have Minnesota-made boats
cause the least environmental and human
harm possible and leads us to try to look at all
those questions simultaneously.
How would either program know which of
these parts of the boat’s life cycle had the
largest environmental and health impacts and
where the largest opportunity for
improvement was?
By evaluating the whole life cycle of the boat,
using complex but ever more common
analysis tools like environmental life-cycle
analysis, one can determine which of the
boat’s life-cycle phases resulted in the most
environmental impact. If in production, one
could then narrow down what it was about production that most problematic – is the chemical use or is
it production of virgin glass to make fiberglass? Armed with that knowledge, the highest priority
intervention for that industry could be determined.
In an SMM approach, partners can be those working anywhere in the life cycle of a product. MPCA's P2
program has always worked with a wide variety of partners -- from primary chemical formulators and
academic researchers, to brand owners, to retailers and consumers. Historically, the MPCA solid waste
program has picked up from there, to work with reuse businesses, recyclers, and disposal facilities for all
types of wastes.
Figure 2. Product life cycle. Toxics waste and other pollutants can be emitted at any or every phase of a product’s life. A toxic pollutant could be used in production, manufactured into a product, release in use by a consumer, and leak into the environment at end-of-life.

2017 Toxics and Pollution Prevention Evaluation Report • April 2018 Minnesota Pollution Control Agency
9
What are the challenges or limits of an SMM perspective?
Taking a systemic view of environmental problems can point out where environmental impacts are
occurring and life cycle analysis can inform which impacts are most significant. These tools, however,
cannot tell us which impacts to prioritize. That is ultimately a question of judgement and values, not
analysis.
Additionally, while use of life cycle analysis and taking an SMM perspective yields information on
environmental impacts and helps policy makers focus efforts on high leverage opportunities, neither
SMM nor pollution prevention principals provides information on other important factors such as
environmental justice or economic considerations. Though the focus of the MPCA is primarily on the
environment and human health, the MPCA has and will continue to consider implications for all of these
factors when making decisions on policy, planning, and implementation.
How will SMM change environmental outcomes?
SMM is already yielding a more sophisticated understanding of what is a "best" practice or decision. For
example, the state sustainable purchasing program historically prioritized recycled-content products,
and as a result, included recycled-content vinyl flooring in its flooring contract. By taking a life cycle
systems approach that incorporates toxic reduction goals, a different decision emerged. Recycled-
content vinyl flooring can contain toxic heavy metals, so a decision was made to restrict such flooring
unless shown to be free of toxics.
Similarly, because of the waste hierarchy, the MPCA has historically promoted reuse of products with
some exceptions (e.g. mercury thermometers). Under SMM, solid waste and toxics reduction staff are
jointly developing more specific guidelines for MPCA programs about what types of products should be
reused and which are better discarded for proper end-of-life management.

2017 Toxics and Pollution Prevention Evaluation Report • April 2018 Minnesota Pollution Control Agency
10
Statewide trends for Toxic Release Inventory reporting industries The MPCA evaluates data supplied by facilities reporting to the Minnesota Emergency Planning and
Community Right-to-Know Act (EPCRA) program and the EPA to determine trends in quantities of
chemicals generated and released. Facilities that report to TRI are typically larger facilities involved in
manufacturing; metal mining, electric power generation, chemical manufacturing and hazardous waste
treatment. In general, chemicals covered by the TRI Program are those that cause:
Cancer or other chronic human health effects
Significant adverse acute human health effects
Significant adverse environmental effects
There are currently over 650 chemicals covered by the TRI Program. Facilities that manufacture, process
or otherwise use these chemicals in amounts above established levels must submit annual TRI reports
on each chemical. The 2015 data from Minnesota’s 443 reporting facilities suggest that progress in
pollution prevention among manufacturers has stalled as TRI chemical waste generation has increased
in the past four years to exceed 2011 levels.
Manufacturing sector: TRI chemicals generation
For the purposes of TRI reporting, toxic chemical generation is defined as the sum or aggregate of the
quantities for each waste management method employed, which includes releases (direct release to air,
water, or land); on-and-offsite recycling; treatment; and burning for energy recovery. In general,
Minnesota’s pollution prevention efforts focus on working with manufacturers to reduce waste through
improving the efficiency of production processes or finding ways to use less or non-toxic chemicals in
those processes.

2017 Toxics and Pollution Prevention Evaluation Report • April 2018 Minnesota Pollution Control Agency
11
Table 1. Management method of TRI chemicals generated by manufactures (in millions of pounds)
Year 2011 2012 2013 2014 2015
Releases 13.3 13.5 13.3 14.4 14.3 Energy Recovery 1.9 2.4 1.4 1.9 1.6 Recycling 33.2 51.7 52.0 51.6 51.3
Treatment 118.7 115.0 111.2 113.4 117.7
Total Generation 167.0 182.6 177.9 181.3 184.9
(note: reported by manufacturers)
As Chart 1 shows, waste generated by manufacturers continues to increase, with 2015 showing a nearly
11% increase over 2011. However, much of this increase is due to a significant change at one facility that
now generates 16 to 17 million pounds of hydrogen sulfide annually that is managed through on-site
recycling. Aside from that change, waste generated by manufacturers has been essentially flat for five
years.
0
20
40
60
80
100
120
140
160
180
200
2011 2012 2013 2014 2015
Releases Energy Recovery Recycling Treatment Total Generation
Chart 1: Statewide trends for TRI chemicals generated by manufacturers

2017 Toxics and Pollution Prevention Evaluation Report • April 2018 Minnesota Pollution Control Agency
12
In the 2013 edition of this report, there was discussion of
the relatively rapid rise in waste that was managed
through treatment compared to other forms of
management, which rose 28 % between 2007 and 2011.
This has now leveled off; however, waste treatment is a
non-value added cost for manufacturers and well over
half of the TRI waste reported by manufacturers each
year is being managed through treatment. The processes that generate these chemical wastes that are
managed through treatment should be viewed as a high priority for pollution prevention.
Staff analysis has determined that just ten facilities are responsible for 75% of the 118 million pounds of
toxic chemical wastes generated by manufacturers in 2015 that were managed through treatment, such
as neutralizing acids or caustics or destroying solvents through thermal oxidation. They represent
industry sectors such as petroleum refining laminated plate and sheet manufacturing, pulp and paper
mills, water purification equipment manufacturing, coated and laminated paper manufacturing,
rendering and meat byproducts and beet sugar
manufacturing. The chemicals being reported by these
facilities include: ammonia, methanol, N,N-
dimethylformamide, toluene, propylene, nitrate compounds
and hydrogen sulfide. MPCA research to date has not yet
identified whether there are chemical substitutes or process
changes available that would reduce or prevent these wastes
from being generated, but these efforts will continue.
In The Air We Breathe: The State of Minnesota’s Air Quality in 2017, MCPA staff discussed how
permitted industrial facilities are making up a lesser share of our state’s air pollution and most of it now
comes from smaller, more widespread sources, which requires a different set of approaches than
through traditional permitting. The opposite is true for TRI waste generated by manufacturers, which is
much more concentrated among a small number of facilities. Seventy-five percent of the nearly 185
million pounds of waste reported to TRI by manufacturers comes from just fifteen of the 443 facilities
that report to the TRI. Nearly 30% comes from just one facility, Flint Hills Resources, with the remainder
representing industry sectors such as: petroleum refining, laminated plate and sheet manufacturing,
pulp and paper mills, water purification equipment manufacturing, coated and laminated paper
manufacturing, rendering and meat byproducts, beet sugar manufacturing, small arms manufacturing,
rolled steel manufacturing, non-ferrous die casting, ethanol manufacturing and truck trailer
manufacturing.
What is similar, however, is that like those smaller, widespread sources of air pollution, TRI wastes are
also not regulated through traditional permitting. TRI facilities are only required to report on the
amount of waste they generate and manage. TRI does not cap those amounts the way a facility’s air
quality permit limits air emissions. Instead, the MPCA helps manufacturers achieve pollution prevention
through voluntary efforts by offering financial assistance in the form of grants and loans and working
with the Minnesota Technical Assistance Program (MnTAP) and other partners. From 2011-2016,
MnTAP has assisted 800 companies with 1,300 different projects, resulting in 3.6 million pounds of
waste prevented, 172 million gallons of water conserved, 11.9 million kWh of electric energy conserved
and 1 million therms of natural gas energy conserved, for a combined savings of $3.9 million.
Through a grant from EPA, facilities employing painting and coating processes achieved 57,000 pounds in hazardous materials reduction, preventing 60,000 pounds of solid waste, conserving 9,000,000 gallons of water and saving $262,000 annually.
In 2016, MnTAP interns identified P2 recommendations with the potential to prevent over 2 million pounds of waste, conserve nearly 174 million gallons of water and over 3.5 million kWh of electricity and save over $2 million annually.

2017 Toxics and Pollution Prevention Evaluation Report • April 2018 Minnesota Pollution Control Agency
13
All industrial sectors: TRI chemicals generation
The manufacturing sectors that report generating the most TRI wastes in Minnesota include: petroleum
refining, laminated plate and sheet manufacturing, pulp and paper mills, small arms manufacturing and
coated and laminated paper manufacturing. The chemicals for which the most waste was reported to be
generated are ammonia, methanol, lead compounds, hydrogen sulfide and n,n-dimethylformamide.
Table 2. Total amount of TRI chemicals generated by all reporters (in millions of pounds)
Year 2011 2012 2013 2014 2015
non-manufacturers (electric utilities, chemical distributors) 13.7 15.7 14.6 16.7 13.5 recyclers (metals and solvents) 32.6 32.4 33.1 32.3 32.7 waste treatment (incineration) 13.2 15.3 16.4 20.4 21.2
manufacturers 167.0 182.5 178.0 181.3 184.8
total TRI chemical generation 226.6 245.9 242.1 250.7 252.2
As Table 2 shows, waste generation from non-manufacturers (primarily electric utilities) rose from 2011
to 2014, but then returned to roughly 2011 levels in 2015, while waste treatment facilities show a 60%
percent increase since 2011, primarily from more waste being managed at 3M’s waste incineration
facility in Cottage Grove.
All industrial sectors: TRI chemical releases
Similar to the waste generation trends seen in Table 2, we can see in Table 3 that releases from non-
manufacturers (primarily electric utilities) rose from 2011 to 2014, but then returned to roughly 2011
levels in 2015. Releases from waste treatment increased by 50%, following the same trend seen for
waste generation from these facilities. Releases from recyclers more than doubled from 2011 to 2015,
but totals remain quite small compared to manufacturers and non-manufacturers. Total TRI chemical
releases from all industrial sectors continued to rise from 2011 through 2014 and the upturn was largely
due to increased releases from non-manufacturers. With two electricity generating facilities ending their
use of coal in 2015 and more coal facility retirements scheduled to take place in the coming years, it is
anticipated that releases from non-manufacturers will trend downward from 2015.
Table 3. Total amount of TRI chemicals released by all reporters (in millions of pounds)
Year 2011 2012 2013 2014 2015
non-manufacturers (electric utilities, chemical distributors) 11.0 12.9 12.8 14.1 11.5 recyclers (metals and solvents) 0.3 0.4 0.4 0.5 0.8 waste treatment (incineration) 0.6 0.6 0.8 0.8 0.9
manufacturers 13.3 13.5 13.3 14.4 14.3
total TRI chemical releases 25.2 27.4 27.3 29.8 27.5
Looking more closely at how releases break down, about two-thirds of releases from all industrial sectors are wastes sent to landfill. The remaining third is releases to air, which add up to just over nine million pounds for all industrial sectors. However, for manufacturers, releases to air make up about 60% of total releases from those facilities and nearly 95% of the total releases to air from all TRI reporters come from manufacturers. The leading chemical released to air is n-hexane, which, at 3.3 million pounds, represents over one-third of chemicals released to air. The primary sources of n-hexane
2017 Toxics and Pollution Prevention Evaluation Report • April 2018 Minnesota Pollution Control Agency
14
releases to air are oilseed processors, where it is used as an extraction solvent. There are concerns about the use of n-hexane because it is a volatile organic compound (VOC), and shows characteristics for reproductive toxicity and chronic toxicity to aquatic life. Staff investigation has identified academic research into alternative solvents and an enzyme-based process that may have potential for replacing n-hexane. More investigation is needed into what role could be played in piloting or otherwise facilitating the adoption of these alternatives.
Electronics recycling
Overview
The Minnesota Electronics Recycling Act was enacted in May 2007 to address the increase in the
amount of waste electronics generated in Minnesota and the rising costs associated with properly
managing waste electronics from Minnesota’s households. The law takes a producer responsibility
approach that engages the manufacturers of certain electronic products in the collection and recycling
of waste electronics. By internalizing the costs of end-of-life management, this more economically
efficient approach to providing collection and recycling offers incentives for manufacturers to
implement green design practices such as design for recyclability and other techniques to reduce cost.
While the program has been successful in collecting and recycling millions of pounds, concerns have
been raised from collectors over the increased cost to manage the electronics and recyclers have
pointed out the decreased value in recovering materials, along with limited outlets for properly recycling
cathode ray tubes (CRTs). At the same time, the amount of e-waste being recycled has only slightly
decreased through Program Year 9 (FY16). The Minnesota Electronics Recycling Act table summarizes
the last 5 years of program activity.
These observations have led to a wide range of program changes that were proposed and discussed.
Meetings held with stakeholders in 2015 resulted in July 1, 2016, legislative changes. The statute
restructured financial relationships between various entities and increases obligation. The “Video
display device” (VDD) definition was amended to address only “television” and “computer monitors” of
any screen size. Laptops and tablets are no longer defined as video display devices and “covered
electronic device” (CED) was amended to specifically include tablets and laptop computers.
Obligation setting
July 1, 2016, legislative changes led to recycling obligation based upon the collection of “televisions” and
“computer monitors.” For program years 10-12 (FY17-19), total obligation is fixed at 25 million pounds,
23 million pounds, and 21 million pounds, respectively. For program year 13 (FY20) and beyond the total
obligation is set by the actual pounds of “televisions” and “computer monitors” collected, based on a
two-year average.
The statewide recycling obligation is apportioned to television manufacturers (80%) and computer
monitor manufacturers (20%). Each manufacturer’s share of the television and computer monitor
obligations is determined by their sales from the previous sales period, applied to their respective
product category obligation. Manufacturers can meet their assigned obligation by purchasing pounds of
CEDs collected for recycling.
N-hexane releases to air are a concern because it is a VOC that also shows characteristics for reproductive toxicity and chronic toxicity to aquatic life.

2017 Toxics and Pollution Prevention Evaluation Report • April 2018 Minnesota Pollution Control Agency
15
Collection
Registered collectors are public or private entities that receive CEDs from households and arrange for
delivery to a registered recycler. Collectors report annually on the total pounds of CEDs collected during
the program year and where they were sent. While permanent collection sites account for 81% of the
actual pounds collected, residents may also drop off devices at events, or use pick-up or mail-back
services. About 56% of the collection opportunities available in Greater Minnesota are offered by local
governments.
Program year 9 (FY16) saw 36.1 million pounds collected. Minnesota’s per-capita collection rate of
6.59 pounds compares favorably with other leading states such as Oregon (6.41 pounds) and Wisconsin
(5.60 pounds). Statewide, local governments collected 44% of CEDs in program year 9 (FY16), offering a
mix of permanent collection sites, special events for residents and curbside recycling.
Recycling
Registered recyclers are public or private entities who accept CEDs from registered collectors for the
purpose of recycling. Some entities serve as both collectors and recyclers. The recyclers report annually
on the total pounds received and recycled during the program year. Recyclers must now provide a
report annually to each registered collector regarding the video display devices received from that
entity. In addition, recyclers must not charge collectors for the transportation and recycling of covered
electronic devices that meet a manufacturer’s recycling obligation unless they mutually agree otherwise.
The number of registered recyclers has remained steady for each of the program years, and reporting
continues to indicate that a few firms handle the majority of the recycling, with the top five processing
79.4% of the total weight recycled.
Table 4. Minnesota Electronics Recycling Act program data
PY6/FY13 PY7/FY14 PY8/FY15 PY9/FY16 PY10/FY17
Su
pp
ly
Recycled per capita, statewide (pounds)
6.1 6.6 7.3 6.6 5.2
CED recycled (pounds) 32.6 million 35.6 million 39.7 million 36.2 million 28.7 million
Conversion: program pounds*
37.9 million 41.7 million 45.6 million 41.6 million n/a ||
VDD sales (pounds) 23.1 million 19.9 million 22.7 million 20.4 million 19.0 million
D
em
and
Manufacturer recycling obligation (pounds)
18.5 million (60%) 15.9 million (80%)
18.1 million (80%) 17.8 million† 25 million‡
Purchased: program pounds (and actual pounds)
25.7 million (23.1 million)
25.9 million (23.0 million)
31.6 million (27.6 million)
27.4 million (25.4 million)
21.6 million
New recycling credits: net change
7.9 million 10.0 million 15.6 million 12.5 million 0§
C
red
its
Recycling credits available at program-year-end
54.6 million 64.6 million 80.2 million 90.8 million 77.1 million
* For Program Years 6-9, program pounds reflect 1.5x multiplier applied to pounds collected outside of the 11-county Metropolitan Area † A 2015 amendment established a minimum recycling obligation of 16 million pounds for PY9 ‡ A 2016 legislative change established a minimum recycling obligation of 25 million pounds for PY10 § A 2016 legislative change established that no new credits would be created from for Program Years 10-12 || A 2016 legislative change eliminated the rural multiplier.

2017 Toxics and Pollution Prevention Evaluation Report • April 2018 Minnesota Pollution Control Agency
16
Manufacturer registration and reporting
Manufacturers now report annually to the MPCA on how they met their recycling obligation. Previously
the statute encouraged collection in Greater Minnesota with a credit of an additional 0.5 pound for
every pound of CED collected outside the 11-county metropolitan area. This incentive for collection in
Greater Minnesota is not applicable for program year 10-12 but is reinstated for program 13 and
beyond. No new recycling credits can be created during program years 10-12. Starting program year
13, recycling credits can be created for those pounds that are collected from outside the 11-county
metropolitan area.
Manufacturers have a substantial update in their responsibilities as the 2016 statute changes now
require manufacturers to cover all the recycling and transportation related costs associated with the
products they collect to meet their obligation. For those pounds that count towards a manufacturer’s
obligation, manufacturers are to use recyclers with third-party environmental certification.
Each manufacturer that registers and sells 100 or more
video display devices annually must pay a registration fee of
$2,500 to the Minnesota Department of Revenue (MDOR),
due August 15 of each year. Manufacturers with fewer than
100 sales are no longer subjected to a registration fee.
These base registration fees are dedicated to funding the state agency responsibilities under the Act.
With the removal of laptops and tablets in the VDD definition, we are starting to see a decrease in
registration fees coming in.
Estimated composition of CED collected in Program Year Nine (FY16)
CRT TVs and monitors continue to make up the majority of e-waste collected at collection sites with
recent data showing that VDDs (TVs and monitors) comprise 80% of collected e-waste by weight.
Table 5. Materials collected (pounds)
Video display devices (VDDs) 28.9 million (80%)
Covered electronic devices (CEDs) 7.2 million (20%)
Total collection 36.1 million
Based on device collection data from 2015 for public collection sites in Washington County.
Challenges for the Minnesota Electronics Recycling Act
In the past the obligation was lower than the pounds recycled, creating a gap of pounds that
manufacturers were not paying to recycle. Manufacturers consistently purchased above and beyond
their obligation, but the gap remained and this created an excess of credits for some manufacturers.
With devices getting lighter, even if more were being sold, the gap continued to increase. The 2016
legislative changes were intended to close the gap and get more pounds collected and recycled covered
by manufacturers.
2016 Statute changes require manufacturers to cover all recycling and transportation related costs associated with the products they collect to meet their obligation.

2017 Toxics and Pollution Prevention Evaluation Report • April 2018 Minnesota Pollution Control Agency
17
Some counties charge various fees such as solid waste tip fees or end-of-life fees to residents using the
service to help recover costs. In neither the metropolitan area nor in Greater Minnesota are costs fully
recovered through recyclers or consumer recycling fees alone.
The most recent program year 10 (FY17) data shows a large drop in pounds recycled from 36.2 million to
28.6, which brings it closer to the fixed obligation of 25 million and decreases the gap shown above.
While a survey has not been conducted, the possible reasons for the drop may be due to an increase in
drop off fees, such as Best Buy charging $25 per device, which was previously free; residents keeping
them in their homes or the amount of CRTs may have reached their peak and are now decreasing.
E-waste program compliance and enforcement
The MPCA has continued to monitor compliance of collectors, recyclers and manufacturers. Of the 207
collectors and 67 recyclers registered in program year 10 (FY17), 98% of the collectors and 94% of the
recyclers have submitted their required annual reports and registrations for the upcoming program year
as of October 2017. With a greater understanding of reporting and quicker action by enforcement staff,
the amount of time to get collectors and recyclers registered has decreased significantly. For program
year 8 (FY15), the MPCA issued seven Alleged Violation Letters (AVL) and one Notice of Violation (NOV)
for late reporting. For program year 9 (FY16), the MPCA issued five AVLs, two NOVs, and one forgivable
Administrative Penalty Order (APO) for late reporting.
To enhance compliance with electronic waste management the MPCA hosted workshops for
approximately 52 collectors, recyclers and local government staff from Minnesota and Wisconsin. The
10,000,000
15,000,000
20,000,000
25,000,000
30,000,000
35,000,000
40,000,000
Po
un
ds
Program Year (fiscal)
PoundsObligated
PoundsRecycled
PoundsPurchased
The shaded gap represents the weight of electronics recycled annually that manufacturers were not obligated to support financially.
Chart 2: Pounds recycled vs. manufacturer obligation

2017 Toxics and Pollution Prevention Evaluation Report • April 2018 Minnesota Pollution Control Agency
18
purpose of the workshops were to educate the recyclers on a new database called ReTRAC for reporting,
provide information on legislative updates, emerging topics, reuse programs, hazardous and solid waste
compliance, OSHA compliance and to answer any questions.
Furthermore, MPCA staff has educated potential electronic waste recyclers and collectors about
regulatory requirements and best management practices on a one-to-one basis. These efforts included
onsite visits, in-person meetings, and information emails and phone calls.
Over the past two years, the MPCA has conducted over 20 inspections of unregistered and registered
facilities. The inspections ranged from technical assistance to compliance determinations. The
inspections resulted in seven official enforcement actions, which included compliance schedules and
corrective actions. In addition, MPCA staff has devoted significant time on resolving historical electronic
waste abandonment sites and enforcement cases. These efforts include attempts in resolving the
abandonment of over 60 semi-trailers of processed and unprocessed CRTs at multiple entities, and
technical assistance and monitoring of a clean-up site containing an excess of 28 semi-trailers of
abandoned processed CRT glass in addition to other solid waste. The amount of effort expended is due
to the regulated parties dissolving their business and abandoning their sites, the lack of financial
assurance associated with the sites (not being legally required), and the lack of dedicated funds for
electronic waste abandonment.
In July 2016, a revised Minnesota Electronic Waste Act was promulgated. This revision was the result of
a multiyear effort. As part of the revision, the statute now requires the manufactures to assume all
financial responsibilities for recycling and transportation cost to meet their electronic waste recycling
obligation. MPCA staff is now dedicating time to reviewing the implementation of the revised statute.
Broader issues with electronics
Tech Dump: Cell Phone Summer
Minnesota is home to a nonprofit e-waste collector and recycler called Tech Dump that provides job
training and practical experience for adults facing barriers to employment. While the Minnesota
Electronics Recycling Act does not include cell phones, EPA reports that only 11% of mobile devices get
recycled nationally.5 In order to get some of those out of junk drawers at home, Tech Dump created a
2017 Cell Phone Summer campaign to collect one ton of unwanted phones, PDAs, chargers and cables
which would fund 1,000 hours of work for individuals in their program.
Tech Dump’s Cell Phone Summer yielded 1,908 pounds of unused mobile devices, cords and cables
which included 210 pounds of phones and cords collected at the Eco Experience at the Minnesota State
Fair. While not the full ton they were aiming for, the campaign came very close to funding 1,000 hours
of work for people facing barriers to employment.
The summer-long campaign had the additional benefit of increasing seasonal donations at Tech Dump of
other e-waste across the board by 10%, which was more than anticipated. Plus, because of the
campaign, Tech Dump learned that in addition to security concerns, a significant and previously
unknown barrier to cell phone recycling is that consumers value the photos stored on their phones and
5 https://ifixit.org/blog/4662/snapshot-of-worldwide-electronics-recycling-2013/

2017 Toxics and Pollution Prevention Evaluation Report • April 2018 Minnesota Pollution Control Agency
19
often do not know how to retrieve them from older devices. Therefore, Tech Dump plans to roll out a
data recovery service for cell phones, which may help to increase cell phone recycling rates.6
E-waste plastic recycling
E-waste plastic contains flame-retardants (FRs). FR’s are
primarily used in TV, monitor and computer enclosures, and
their power supply transformers and cords. FRs are linked to
a myriad of health effects including mental and physical
development, reproductive development, and cancer (of particular concern for children and
firefighters). The Minnesota Legislature was concerned enough about these impacts to restrict four
types of FRs in kid’s products and furniture cushion foams to no more than 1000 parts per million, or
ppm, in 2015 (effective 2018).
At the same time, Minnesota has been working to increase electronics recycling. This raises questions on
how to balance recycling and toxic reduction goals.
Currently, e-waste makes up the majority of types of FR plastics.7 The percentage of FRs in plastic is
widely-variable, but virgin or first-use electronic equipment plastic can typically range from 0.1% by
weight (1000 ppm) to 30% (300,000 ppm).8 For some uses and types of FRs, levels can be even higher.9
In 2009, electronic and electrical equipment was the product sector consuming the largest share of total
FR production, at 39%. By comparison, 34% went into building/construction, 15% into textiles, adhesives
and coatings, and 12% into transportation.10 Types of FRs, which have been used in electronics, include:
Brominated (BFRs) – PBDEs such as decabrominated diphenyl ether (decaBDE) are in this group and have been widely studied; hexabromocyclododecane (HBCD); tetrabromobisphenol A (TBBPA) – several have been regulated, including in Minnesota.
Chlorinated – including chlorinated phosphate esters; two of these have been regulated in Minnesota
Phosphorus, nitrogen, inorganic, and combinations of these have been explored as replacements for brominated and chlorinated FRs.
While e-waste plastic is technically recyclable, the embedded flame-retardants in it can end up in products that do not require and should not contain flame-retardants. For example, FRs have been found in black plastic kitchen utensils and children’s toys. The black plastic kitchen utensil study specifically found BFRs, especially in those produced before 2011. 11
Only 3 out of 27 utensils purchased after 2011 contained detectable concentrations of Br (≥ 3 ppm). In
contrast, 31 out of the 69 utensils purchased before 2011 contained BFRs. Eighteen of the 31 utensils
with BFR tested higher than 100 ppm.
6 http://www.techdump.org/cell-phone-summer 7 Peeters, J. (2013). Closed loop recycling of plastics containing Flame Retardants. 8 Department of Ecology, State of Washington, 2015. Flame Retardants: A Report to the Legislature. https://fortress.wa.gov/ecy/publications/documents/1404047.pdf 9 U.S. Environmental Protection Agency, 2014. An Alternatives Assessment for the Flame Retardant Decabromodiphenyl Ether (DecaBDE), https://www.epa.gov/sites/production/files/2014-05/documents/decabde_final.pdf 10 Reilly, T., Beard, A. Flame Retardant Polymer Formulations, Clariant Corporation https://www.nist.gov/sites/default/files/documents/el/fire_research/2-Reilly.pdf
11 Kuang, J., M. Abou-Elwafa Abdallah, S. Harrad (2017). Brominated flame-retardants in black plastic kitchen utensils: Concentrations and human exposure implications. Science of The Total Environment. Volumes 610–611, 1 January 2018, Pages 1138-1146, accessed 12/12/17 https://www.sciencedirect.com/science/article/pii/S0048969717321708?via%3Dihub
Currently, e-waste makes up the majority of flame retardant plastics.
2017 Toxics and Pollution Prevention Evaluation Report • April 2018 Minnesota Pollution Control Agency
20
Because there were detectable levels of BFRs in the utensils, the researchers concluded the BFRs are a
residual from recycling plastics that contained BFRs. That utensils purchased after 2011 were less likely
to contain BFRs is attributed to a move away from polybrominated diphenyl ethers (PBDEs) and recent
introduction of restrictions on the recycling of BFR-treated plastics. The same study included tests of
transfer of the BFRs to cooking oil during cooking and found an average of 20% transfer from the utensil
to the cooking oil, leading to possible dietary exposure. Such exposure potential from products that
should not contain FRs is of concern.
Another study tested children’s toys and food contact articles and found that “61% of all samples were
Br positive: of these samples, 45% had decaBDE concentrations exceeding the concentration limits for
PBDEs and their main constituent polymer was…Acrylonitrile Butadiene Styrene (ABS), uses of which
include copying equipment, laptops and computers.” 12
Knowing that recycling of e-waste FR plastics is resulting in unintended and unnecessary contamination
in products that should not contain FRs brings up unanswered questions about how to approach
recycling of e-waste plastic:
Should e-waste plastics be recycled if their FR content is unknown?
If content is known, could they be sorted by specific FR?
If accurate sorting were possible, would it be possible to steer e-waste FR plastic to certain low-exposure uses or to develop a closed loop manufacturing system?
Should older plastics that contain now discontinued or restricted FRs be taken out of recirculation and disposed of?
If they were disposed, what would be the most environmentally protective disposal method?
The questions above relate to end of life waste management policy. However, the most powerful
approach to eliminate end of life toxicity issues is to reduce the need for FR at the product design stage.
For example, Best Buy redesigned their store brand VDDs and dramatically reduced the need for and use
of FRs by moving the heat-generating transformer component of the power supply from inside the VDD
enclosure to outside.13
Best Buy did this voluntarily, but State purchasing and product restriction policies can further drive
reduced use of FRs in electronic plastics.
Answering the questions about when a product is too toxic to be recycled and about how to drive better
product design will require additional research and stakeholder input.
Groups in Europe, including the European Union, are calling to break the cycle of toxics in recycling. The
EU wants to ensure “high quality recycling where the use of recycled material does not lead to overall
adverse environmental or human health impacts, while also supporting the development of non-toxic
material cycles.”14
Non-governmental organizations (NGOs) are also speaking up with a specific concern over materials
containing DecaBDE. The Center for International Environmental Law has stated that,
12 Guzzonato, A., F. Puype, S. J. Harrad (2017). Evidence of bad recycling practices: BFRs in children's toys and food-contact articles. Environmental Science: Processes & Impacts. Issue 7 accessed 12/12/17
13 Best Buy https://corporate.bestbuy.com/fewer-chemicals-same-fire-safety-for-insignia-tvs/ 14 http://eur-lex.europa.eu/legal-content/EN/TXT/?uri=celex%3A32013D1386

2017 Toxics and Pollution Prevention Evaluation Report • April 2018 Minnesota Pollution Control Agency
21
“Recycling DecaBDE products would offer a second-life to toxic substance exposure in new goods and
create an endless hazardous legacy loop.” 15
While there should be support for a circular economy so companies can use previous materials to make
new materials, an assessment needs to be done on the flow of FRs and other toxins in that system. This
would include quickly identifying chemicals of high concern in products and whether they should be
recirculated. The public can lose confidence in recycled products if they are found to contain residual toxics
and may revert to purchasing products made with virgin materials.16
Solar panels
Since 2015, solar panel installation in Minnesota has grown
rapidly and is expected to continue its dramatic increase
through 2019; at least based on Department of Commerce
projections (see Charts 3 and 4). There is a statewide goal of
10% solar-generated electricity by 2030, which would result in approximately 6,000 Megawatts (MW) or
about 21 million modules installed. While solar panels are meant to last for decades, solar installers,
operators and local media are already asking how to recycle non-working panels and anticipating
recycling issues when current solar gardens are decommissioned in the future. In addition, damage from
severe weather events, such as hail or tornadoes can occasionally require the mass replacement of even
recently installed solar panels. This is a case where Minnesota can anticipate with great certainty a
future waste stream that will need special management. It is important to begin planning for this now.
*Grid tied solar is connected to the utility grid, as opposed to a standalone off-grid system, and covers 99+% of solar in the state. Source: MN Department of Commerce
15 http://www.foodpackagingforum.org/news/toxic-chemicals-in-recycled-materials 16 http://chemtrust.org/wp-content/uploads/chemtrust-circulareconomy-aug2015.pdf
Heavy metals in solar panels can include arsenic, cadmium, lead and selenium.
0.1 0.3 0.3 0.9 2.3 1.9 5.7 5.1 6.3 14
209
550
0
100
200
300
400
500
600
2006 2007 2008 2009 2010 2011 2012 2013 2014 2015 2016 2017
Chart 3: Summary of all known grid tied* solar capacity by year

2017 Toxics and Pollution Prevention Evaluation Report • April 2018 Minnesota Pollution Control Agency
22
In Minnesota, solar panels discarded by commercial entities must be assumed to be hazardous waste
due to the probable presence of heavy metals, unless they are specifically evaluated as non-hazardous.
Heavy metals in solar panels can include arsenic, cadmium, lead and selenium. If hazardous waste, they
must be properly disposed of in a special facility or recycled if recyclers are available. To facilitate
recycling, Minnesota is allowing solar panels to be managed in a manner similar to E-waste. Under
current rules, however, the same make or model of solar panels if generated from households may be
disposed of in municipal solid waste without any evaluation. Regardless of classification, solar panels are
resource rich (metals, glass) and it is the policy of Minnesota to encourage recovery of materials
whenever possible.
With the current inconsistent flow of panels in the waste stream, there is not yet a robust market of
available solar panel recyclers. Many manufacturers take back their own panels for recycling, but there
is no consistency in manufacturer policy. Solar Energy Industries Association (SEIA) is creating a list of
potential solar panels recyclers, which may include some in the Midwest. 17
Chart 4: Projected cumulative solar installations in Minnesota through 2021
Source: MN Department of Commerce
17 See Minn. Stat. §216b.1691
0
200
400
600
800
1000
1200
1400
2012 2013 2014 2015 2016 2017 2018 2019 2020 2021
Cu
mu
lati
ve (M
WD
C)

2017 Toxics and Pollution Prevention Evaluation Report • April 2018 Minnesota Pollution Control Agency
23
Recycling solar panels comes with a price tag. The management of solar panels involves both waste and
financial considerations. Some solar gardens may have set aside money for future recycling, but the
commodity market in 10-20 years is unknown and local government does not want the burden to fall on
taxpayers.
So far, only Washington State has passed a product stewardship bill where manufacturers finance and
manage the recycling of used solar units. SEIA is looking at this statute and considering whether a
potential national program could meet this need for fiscal certainty and to avoid a patchwork of state
programs. SEIA also believes that a closed loop system for recycling solar panels is possible. The
crystalline silicon products have aluminum wiring that can be recycled and the solar glass and laminate
can be recycled and sold as flux.
To prepare Minnesota for the stream of 21 million solar panels in the coming years, the MPCA will work
with the Public Utilities Commission and Commerce to analyze the issue and present policy options.
Such an analysis could look at the flow of solar panel installations and retirements in increments of 5-10
years in the future, what type of solar panels are being used and the cost of recycling in that time span.
Evaluation of policy options could include product stewardship policy like the current one in Washington
State, a program similar to PaintCare, or including solar panels in an existing state product stewardship
statute. Other options could include supporting a national approach, setting requirements that solar
contracts must account for end-of-life management up front, or establishing incentives for closed loop
recycling, such as subsidies for recycled-content solar panels.
Architectural paint product stewardship During the 2013 legislative session, the Legislature enacted a product stewardship program for
managing architectural paint in Minnesota. The law required paint manufacturers, individually or
through a stewardship organization, to implement and finance a statewide product stewardship
program that manages architectural paint by reducing paint waste generation, promoting reuse and
recycling, and providing for negotiation and execution of agreements to collect, transport, and process
the architectural paint for end-of-life recycling and reuse. The program is funded by a stewardship
assessment paid by consumers on the sale of architectural paint.
The program, through a partnership with PaintCare Inc., was implemented on November 1, 2014 and
Minnesota is now one of eight states plus the District of Columbia that has an architectural paint
product stewardship partnership with PaintCare. PaintCare is a 501 (c)(3) non-profit organization whose
Board of Directors consists of eleven representatives of architectural paint manufacturing companies.
PaintCare employs a program manager that is located in Minnesota who works full time on the state’s
architectural paint product stewardship program.
Based on the experience of other state programs, the MPCA anticipated a number of benefits from a
product stewardship approach to the management of architectural paint in Minnesota:
Expand the number of recycling locations for paint with an expected overall increase in the amount of paint recycled
Create an incentive for retailers to collect paint, particularly smaller entities
Transition from government funded collection and recycling programs to one funded by consumers and manufacturers
The paint industry, through the stewardship organization PaintCare, will design and manage the program
Support economic development opportunities for paint recyclers

2017 Toxics and Pollution Prevention Evaluation Report • April 2018 Minnesota Pollution Control Agency
24
Program analysis
Expand the number of recycling locations for paint. Since the inception of the paint stewardship
program, the number of collection sites has risen rapidly. Prior to the implementation of the paint
product stewardship program there were fewer than 40 paint collection sites in Minnesota, nearly all of
which were county or municipal Household Hazardous Waste (HHW) sites. By the end of Fiscal Year
2015, there were 218 collection sites in Minnesota and that number grew to 246 by the end of Fiscal
Year 2016. At the close of Fiscal Year 2017, there were 245 permanent collection sites in Minnesota,
which included 189 paint retail locations, 51 HHW collection facilities, three Habitat for Humanity
ReStore locations, one environmental services company, and one paint recycler.
Additional avenues for paint collection included 14 seasonal HHW
sites, 273 collection events held at HHW sites, and 48 direct large
volume pick-ups that serviced 41 different locations in Fiscal Year
2017.
Between permanent collection facilities, seasonal collection facilities, collection events, or partnerships
with other counties, all 87 Minnesota counties offer some form of paint collection. The increase in
number of sites as well as their wide distribution has resulted in 93.4% of Minnesota residents living
within 15 miles of a year-round collection site, while 98.6% of residents live within 15 miles of a site
when supplemental sites and events are included.
Create an incentive for retailers to collect paint. The number of retail sites offering paint collection
through the paint product stewardship program has increased each year since the program’s inception,
with 189 retail sites now offering collection services. While no formal studies have looked at the sales
impact of program participation, the significant number of retail locations voluntarily participating pairs
with the largely positive feedback MPCA and PaintCare have received from retailers in Minnesota –
especially pertaining to the belief that offering collection services creates an added incentive for
potential customers to visit the store.
Partly due to the widespread availability of collection sites, the total amount of paint collected and
recycled since the program’s inception has increased as expected. An estimated 691,000 gallons of paint
were collected in Minnesota in 2013, whereas 1,022,346 gallons were collected in Fiscal Year 2016 and
1,010,140 gallons in Fiscal Year 2017. Of those collection totals, approximately 12% re-used, 38% was
recycled, and 50% was used for landfill cover. A total of 750,505 gallons of paint have been recycled
while 246,050 gallons have been reused in Minnesota since the stewardship program was implemented.
98.6% of residents live within 15 miles of a paint collection site.

2017 Toxics and Pollution Prevention Evaluation Report • April 2018 Minnesota Pollution Control Agency
25
Chart 5: Minnesota architectural paint collection
Transition to a program funded by consumers and manufacturers. The paint stewardship fee has
enabled PaintCare to cover the paint management costs for every HHW program and participating retail
location in Minnesota. The fee is paid by consumers when they purchase paint. Since late 2014, the
counties and regional groups participating in the program have been reimbursed more than $7 million
for their paint management costs. Without the fee, stewardship plan and resulting partnership with
PaintCare, these costs would have been covered by funding from governmental revenue streams.
Table 6. Minnesota HHW program reimbursement for paint management
Reimbursement period 11/1/2014 - 6/30/2015 $1,377,023.54
7/1/2015 - 12/31/2015 $1,686,679.91
1/1/2016 - 6/30/2016 $1,241,589.50
7/1/2016 - 12/31/2016 $1,722,761.41
1/1/2017 - 6/30/2017 $1,284,044.25
Total: $7,312,098.61
400,000
500,000
600,000
700,000
800,000
900,000
1,000,000
1,100,000
CY10 CY11 CY12 CY13 CY14 CY15 FY16 FY17
GA
LLO
NS
Paint Collected

2017 Toxics and Pollution Prevention Evaluation Report • April 2018 Minnesota Pollution Control Agency
26
PaintCare will design and manage the program. The program continues to function as designed by
PaintCare in accordance with its original Minnesota Architectural Paint Stewardship Program Plan. While
MPCA does provide oversight, specifically through its compliance role and managing reimbursements to
Minnesota county HHW programs from PaintCare, the operational aspects of the program for counties
and retailers are governed by the Program Plan, which was designed by PaintCare on behalf of the
industry.
Support economic development opportunities. The State and PaintCare continue to review paint-
recycling opportunities, while working with Amazon Environmental, a paint recycling operation located
in Fridley, to increase the amount of recycled content paint available to retailers in Minnesota and
elsewhere.
Temporary increase in paint stewardship fee
On November 14, 2016, PaintCare formally requested the approval of MPCA to increase the Minnesota
paint stewardship fee. The driving force behind the request was PaintCare’s budget deficit in Minnesota
as collection volumes were higher than projected while sales were lower than projected, which
consequently led to higher than expected costs and lower than expected revenues.
After a public comment period, and with recognition of the inaccuracy of projections, MPCA approved
the fee increase on March 6, 2017 for a period extending through June 30, 2019. Included in the
approval was a requirement that, by April 1, 2019, PaintCare will submit to the MPCA a review of the
financial impact of the fee increase and, if necessary, submit a proposal to MPCA requesting
continuance of the increased fee. MPCA anticipates that two years of operation with the fee increase
should enable PaintCare to erase its current budget deficit and build a small reserve. MPCA’s approval
also underscored the need for regular review of the fee levels to ensure the needs of the program are
being met but that the program is not inadvertently over- or under-collecting the amount required to
fund it.
Retailers and PaintCare implemented the increase on September 1, 2017.
Table 7. Architectural paint stewardship fee comparison
Container size Fee before increase Fee after increase
Half pint or smaller $0.00 $0.00
Larger than half pint and smaller than one gallon $0.35 $0.49
One gallon up to two gallons $0.75 $0.99
Larger than two gallons up to five gallons $1.60 $1.99
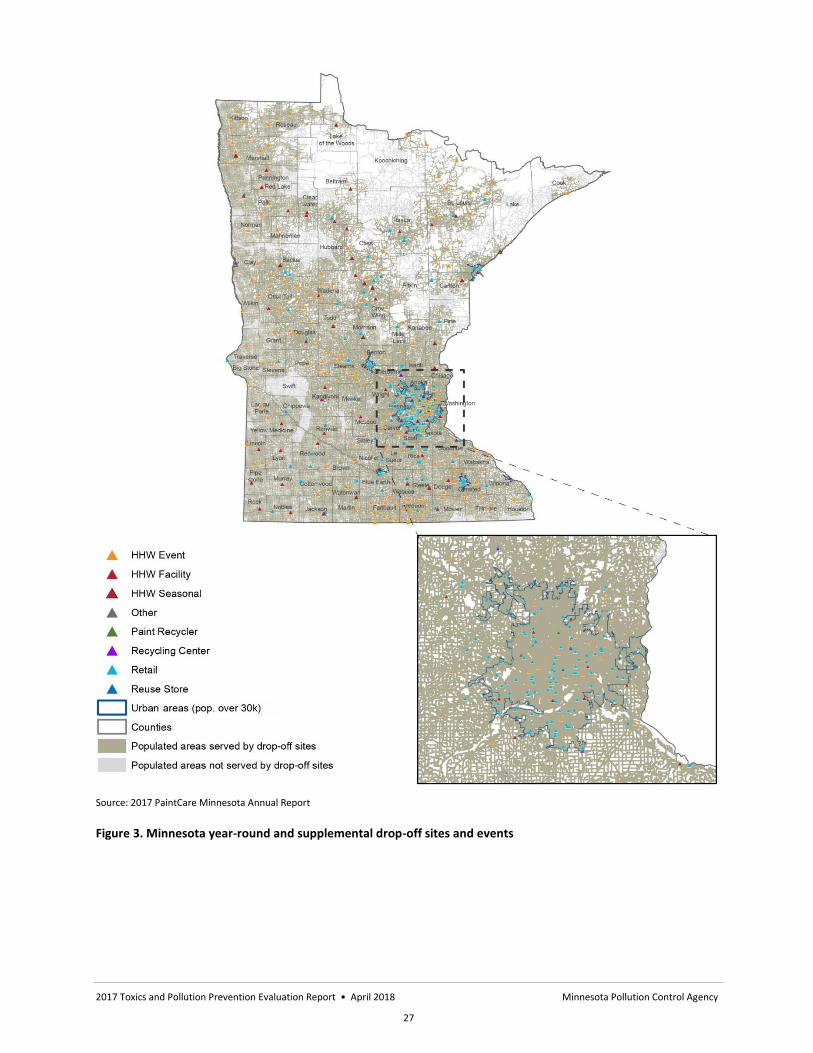
2017 Toxics and Pollution Prevention Evaluation Report • April 2018 Minnesota Pollution Control Agency
27
Source: 2017 PaintCare Minnesota Annual Report
Figure 3. Minnesota year-round and supplemental drop-off sites and events

2017 Toxics and Pollution Prevention Evaluation Report • April 2018 Minnesota Pollution Control Agency
28
Emerging issues: aerosols and end markets
Aerosols. The HHW Programs that currently collect waste aerosol paints spend a considerable amount
of time and money each year to manage them. Aerosols are the highest cost waste stream to manage in
HHW programs next to the architectural paints currently covered by PaintCare. The MPCA has been
engaged in discussions with PaintCare since 2013 to investigate the possibility of expanding the list of
covered products to include aerosol paints. Prior to that, national discussions with the paint industry
touched on the possibility of adding aerosols to paint stewardship programs, but it was determined that
any addition of aerosols should be addressed after architectural paint programs were established.
Because aerosol cans need to be managed differently from cans of paint, more information is needed to
understand costs, baseline volumes and any additional infrastructure or policy needs. The paint program
fee is not currently assessed on aerosols.
End Markets. Approximately 50% of the latex paint collected in Minnesota is used for landfill cover.
Although landfill cover may be considered a beneficial use of the material, reuse and recycling provide
considerably more environmental benefits and should be maximized. In addition, because of current
market conditions, the latex paint is shipped to Oklahoma before being manufactured into a landfill
cover material that is used in that state. MPCA, PaintCare and counties have discussed ways to maximize
recycling and improve local end markets for the lower quality latex paint that cannot be made into new
paint, and MPCA and PaintCare have committed to undertaking pilot projects within Minnesota to
determine the best management practices of managing latex paint. Together with the counties that
currently collect waste paint, the MPCA expects these pilot projects to examine several options that may
reduce the life cycle impacts of managing waste paint.
Toxics in packaging
Background
This section covers MPCA activities related to Toxics in Packaging for fiscal years 2014 through 2017,
(July 1, 2013, through June 30, 2017).
In 1992, the Minnesota Legislature passed the “Prohibitions on Selected Toxics in Packaging” law
(Minn. Stat. §115A.965, 1992 Session Laws Ch. 337, Sec. 50). The enacted law was based on model
legislation drafted two years earlier by a working group created by the Coalition of Northeastern
Governors (CONEG), with active cooperation of a wide range of stakeholders from environmental
groups, industry, and governmental agencies.
The law prohibits the intentional introduction of lead, cadmium, mercury, or hexavalent chromium into
packaging or the components of packaging offered for sale or distributed for promotional purposes. It
also prohibits the incidental presence of these metals at concentrations exceeding 100 parts per million
(ppm) total by weight for the four metals. For the purposes of this law, “packaging” is defined as “a
container providing a means of marketing, protection or handling of a product and shall include a unit
package, an intermediate package and a shipping container as defined in American Society for Testing
and Materials (ASTM) D 996. "Package" shall also mean and include such unsealed receptacles as
carrying cases, crates, cups, pails, rigid foil and other trays, wrappers and wrapping films, bags and
tubs.”
Minnesota is one of 19 states that have adopted toxics in packaging legislation based on the model.
Because most packagers and package manufacturers selling into the U.S. market distribute to at least

2017 Toxics and Pollution Prevention Evaluation Report • April 2018 Minnesota Pollution Control Agency
29
one of the 19 states, the packaging laws are viewed as a national standard in the absence of federal
legislation, at least for major domestic packaging manufacturers and distributors. The law was one of
the first to pursue a “source reduction” strategy, which strives to keep unwanted materials (e.g., the
four metals), out of the recycling and waste streams entirely by eliminating the use of those unwanted
materials. The law applies to manufacturers, distributors, and suppliers of packaging, and manufacturers
of packaged products. The law requires these parties to maintain on file current certificates of
compliance that show they are following the packaging laws.
Joint action
In 1992, a number of states with enacted laws formed the Toxics in Packaging Clearinghouse (TPCH)
under the auspices of CONEG to provide coordinated and streamlined implementation of each state’s
Toxics in Packaging law. Administration of TPCH was transferred to the Council of State Governments,
and then to the Northeast Recycling Coalition in 2005. Currently there are nine state members of the
Clearinghouse and ten states that have toxics in packaging laws but who are not members of the
Clearinghouse. State membership status has not changed since the 2013 Toxics and Pollution Prevention
Evaluation Report.
Table 8. States with toxics in packaging legislation
TPCH Member States States with Legislation/Not TPCH Members
1. California
2. Connecticut
3. Iowa
4. Minnesota
5. New Hampshire
6. New Jersey
7. New York
8. Rhode Island
9. Washington
1. Florida
2. Georgia
3. Illinois
4. Maine
5. Maryland
6. Missouri
7. Pennsylvania
8. Vermont
9. Virginia
10. Wisconsin
The legislation in some non-member states does not include enforcement authority. Some states cite
this as a barrier to implementation of the law and TPCH membership. Responsibility for enforcement
also varies among the states; in some states, the authority clearly rests with the environmental agency,
in other states it clearly rests with the agency responsible for trade/consumer protection, and in some
states it is not clear which agency has primary authority.
TPCH member states consider exemption requests jointly to ensure that all parties receive the same
information and to minimize the administrative costs borne by individual states. The TPCH receives and
answers requests for information and clarification from businesses, governments, and stakeholder
groups. Current information may be found at the clearinghouse website,
http://www.toxicsinpackaging.org.
In the interest of obtaining information needed for good decision-making, the TPCH offers advisory
membership to industry and association representatives. The Steel Recycling Institute, the American
Plastics Council, and the Glass Packaging Institute have been Advisory Members during the past four
years. In 2015, TPCH has created an additional membership category, ‘Individual Subject Matter Expert.’
TPCH currently has one member in this category, an individual who served in government developing

2017 Toxics and Pollution Prevention Evaluation Report • April 2018 Minnesota Pollution Control Agency
30
the model legislation and coordinating passage and implementation with state representatives, as a
government representative, and then as an advisory member representing an industry association.
Enforcement actions
The MPCA has enforcement authority for Minn. Stat. §115A.965. As a member of TPCH, Minnesota
participated in discussions of and supported enforcement actions by other state members for packaging
that was used and sold by national retailers. Between 2012 and 2017, TPCH evaluated several types of
packaging through x-ray fluorescent (XRF) screening projects for coordinated state enforcement of state
toxics in packaging laws. TPCH and one of its member states with state liquor stores worked directly
with product manufacturers and distributors, plus one trade association, to address high levels of lead in
green wine bottles produced overseas and imported to the US.
Between 2014 and 2017, TPCH also screened flexible poly vinyl chloride (PVC) packaging with XRF
technology and found that cadmium continues to be present in this type of packaging above levels
allowed by state laws. However, in comparison to previous screening projects, the prevalence of
cadmium use seemed to be lower, and lead was not found at elevated levels in the screened packaging.
Flexible PVC is a thick clear flexible plastic packaging that often has a sewn in zipper and heat sealed
seams, and is commonly used for home furnishings, pet supplies, and sporting goods.
Between 2015 and 2017, TPCH member states used the results of this XRF screening project for
coordinated state enforcement. On behalf of member states, TPCH contacted fifteen product
manufacturers, distributors, and retailers that had non-compliant packaging. Through negotiations with
TPCH, the companies took actions to comply with the law, which included recalling and withdrawing
noncompliant packaging from the distribution chain in TPCH member states, and working with
packaging suppliers to ensure that packaging components are in compliance going forward. Over
100,000 non-compliant packaging units were withdrawn and properly managed by the fifteen
companies.
No enforcement actions were undertaken individually by the MPCA during this reporting period.
Exemptions requested and granted
No exemption requests were received or granted by TPCH or Minnesota during this reporting period.
Current activities
Minnesota joined the TPCH in 1993 and has remained an active member continuously since that time.
Minnesota served a two-year term as chair of TPCH for fiscal years 2016 and 2017 (July 1, 2015 through
June 30, 2017).
During the 2014-2017 reporting period, the TPCH:
Continued to communicate with states that have legislation but are not TPCH members regarding toxics in packaging issues and possible membership in TPCH, in order to raise awareness, improve national coordination, and increase state involvement in research, outreach, and compliance activities.
Coordinated and communicated on toxics in packaging issues and concerns with the EPA and trade groups that are not advisory members of TPCH, such as the Institute of Packaging Professionals, as well as testing laboratories and packaging manufacturers and distributors.
Launched a redesigned website and new logo in January 2015. The website is on a new platform and is easier for TPCH to maintain and update. The website content has been expanded to make more information available, such as guidance documents, publications, and links to member state toxics in packaging laws.
2017 Toxics and Pollution Prevention Evaluation Report • April 2018 Minnesota Pollution Control Agency
31
TPCH publications and screening projects
TPCH released the following publications during the 2014-2017 Reporting Period, summarizing research
and testing activities carried out by TPCH and member states:
Glass Matrix Test Methods Evaluation for Toxics in Packaging (February 2014). This research report and an accompanying guidance document ‘Guidance on Analysis of Glass Samples,’ funded by the California Department of Toxic Substances Control, evaluated test methods for determining total concentration of lead and cadmium in glass packaging and includes recommendations for testing glass containers for compliance with state toxics in packaging laws.
Notice on Glass Packaging Screening Results. This notice summarizes TPCH findings that about 19% of tested wine bottles exceeded state toxics in packaging limits for lead content. All noncompliant samples were green bottles manufactured in South America or Europe.
During the reporting period, TPCH and member states worked on several screening projects, including:
Continued evaluating the potential for imported glass wine bottles to exceed the threshold for metals regulated by state laws, and worked with the Glass Packaging Institute to address this issue. One member state that has state-owned liquor stores worked directly with its supply chain to communicate its concerns and the need to distribute packaging compliant with state laws.
Initiated a research project on metal packaging components (for example, zippers, grommets) to assess compliance with state toxics in packaging laws, and pursue coordinated state enforcement, if appropriate.
As described above under ‘Enforcement Actions,’ TPCH initiated and completed a screening project for flexible PVC packaging and associated components. Cadmium was found in packaging, but at lower levels than in previous screening projects. Lead was not found in the flexible PVC packaging screened in this project. The final report for this project was released in November 2017, after the end of the 2014 through 2017 reporting period.
Nineteen percent of tested wine bottles exceeded state toxics in packaging limits for lead content. All noncompliant bottles were green and made in South America or Europe.
.
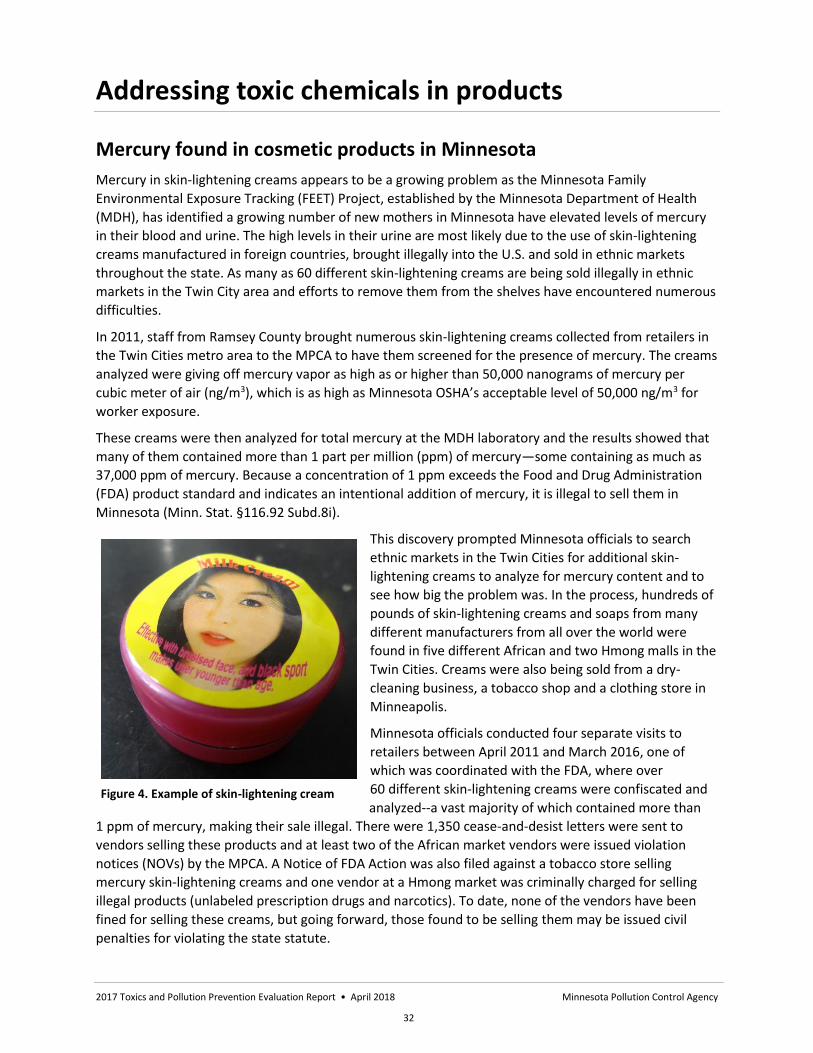
2017 Toxics and Pollution Prevention Evaluation Report • April 2018 Minnesota Pollution Control Agency
32
Addressing toxic chemicals in products
Mercury found in cosmetic products in Minnesota
Mercury in skin-lightening creams appears to be a growing problem as the Minnesota Family
Environmental Exposure Tracking (FEET) Project, established by the Minnesota Department of Health
(MDH), has identified a growing number of new mothers in Minnesota have elevated levels of mercury
in their blood and urine. The high levels in their urine are most likely due to the use of skin-lightening
creams manufactured in foreign countries, brought illegally into the U.S. and sold in ethnic markets
throughout the state. As many as 60 different skin-lightening creams are being sold illegally in ethnic
markets in the Twin City area and efforts to remove them from the shelves have encountered numerous
difficulties.
In 2011, staff from Ramsey County brought numerous skin-lightening creams collected from retailers in
the Twin Cities metro area to the MPCA to have them screened for the presence of mercury. The creams
analyzed were giving off mercury vapor as high as or higher than 50,000 nanograms of mercury per
cubic meter of air (ng/m3), which is as high as Minnesota OSHA’s acceptable level of 50,000 ng/m3 for
worker exposure.
These creams were then analyzed for total mercury at the MDH laboratory and the results showed that
many of them contained more than 1 part per million (ppm) of mercury—some containing as much as
37,000 ppm of mercury. Because a concentration of 1 ppm exceeds the Food and Drug Administration
(FDA) product standard and indicates an intentional addition of mercury, it is illegal to sell them in
Minnesota (Minn. Stat. §116.92 Subd.8i).
This discovery prompted Minnesota officials to search
ethnic markets in the Twin Cities for additional skin-
lightening creams to analyze for mercury content and to
see how big the problem was. In the process, hundreds of
pounds of skin-lightening creams and soaps from many
different manufacturers from all over the world were
found in five different African and two Hmong malls in the
Twin Cities. Creams were also being sold from a dry-
cleaning business, a tobacco shop and a clothing store in
Minneapolis.
Minnesota officials conducted four separate visits to
retailers between April 2011 and March 2016, one of
which was coordinated with the FDA, where over
60 different skin-lightening creams were confiscated and
analyzed--a vast majority of which contained more than
1 ppm of mercury, making their sale illegal. There were 1,350 cease-and-desist letters were sent to
vendors selling these products and at least two of the African market vendors were issued violation
notices (NOVs) by the MPCA. A Notice of FDA Action was also filed against a tobacco store selling
mercury skin-lightening creams and one vendor at a Hmong market was criminally charged for selling
illegal products (unlabeled prescription drugs and narcotics). To date, none of the vendors have been
fined for selling these creams, but going forward, those found to be selling them may be issued civil
penalties for violating the state statute.
Figure 4. Example of skin-lightening cream

2017 Toxics and Pollution Prevention Evaluation Report • April 2018 Minnesota Pollution Control Agency
33
These creams and other products with added mercury are
illegal to sell because mercury is a neurotoxin that can cause
damage to the brain, central nervous system and kidneys. It
has the potential to cause health problems for those who
use them and their children. For this reason, the MDH
started the MN FEET Project in the summer of 2015, a coordinated effort between the HealthPartners
Institute, the SoLaHmo/West Side Community Health Services and MDH staff. The charge of this
voluntary program is to contact new mothers of Asian, East African, Latina and white descent and
measure the blood of these women and their newborns for mercury, lead and cadmium.
Just this past year alone, MN FEET Project officials found three new mothers with elevated levels of
mercury in their urine. After searching their homes, it was concluded that skin-lightening creams applied
to the face and other parts of their bodies and absorbed through the skin, and inevitably inhaled by the
mother, was the cause.
Preliminary results of the study show that Asian women are most likely to have elevated levels of
mercury in their urine-- six out of nine cases, with the other three being Latina women. It is believed
that in each case, exposure to mercury skin-lightening creams is the reason for the elevated levels of
mercury. Mercury exposure can also occur, through fish consumption, which is determined by testing
blood rather than urine. As a result, fish consumption can be ruled out as the cause in these cases.
Staff of the MDH, MPCA, and the FDA made efforts to educate shop vendors and skin-lightening cream
users of the dangers of the mercury in these creams, with training events held in November 2015 and
also September 2016. Their warning was conveyed through fact sheets written in four languages and
translated presentations at meetings with market vendors. Other people were made aware of the
dangers at skin-cream collection events and open houses where products could be screened for mercury
content. A press release and a fact sheet targeting health providers were sent out in 2011 and again in
2015 and both the MPCA and MDH websites contain information about skin creams and the dangers of
using them. MDH issued a health alert written in Hmong, Somali, Spanish and English and the MPCA has
a feature story regarding the skin cream issue on their website. MPCA and MDH also partnered with the
Hamline University Public Health Sciences program on a semester-long senior seminar course for the fall
of 2017 where students researched and developed social media and other outreach tools to educate the
public on mercury in skin creams.
Even though many officials have tried to remove creams and educate people as to their dangers, the
problem persists. The amount and types of mercury-containing, skin-lightening creams sold in
Minnesota seems to be increasing and despite our best efforts, women, and to a lesser extent men, are
still demanding these products. Authorities confiscate vendor inventory, but the demand for these
creams remains so high that product shows up again in the targeted markets or other markets that are
not under scrutiny.
Mercury in skin creams has the potential to cause health problems for people who use them and their children.

2017 Toxics and Pollution Prevention Evaluation Report • April 2018 Minnesota Pollution Control Agency
34
Mercury-catalyzed polyurethane floors in Minnesota schools
The MPCA estimates that there are
between 64 and 219 K-12 schools in
Minnesota that have mercury-catalyzed
polyurethane floors (MCPF) in their
gyms and/or fieldhouses. In addition,
that these floors are releasing more
than three pounds of mercury vapor to
the air each year.
In the early 1960s, and continuing until
approximately 2005, polyurethane
flooring catalyzed with phenyl mercuric
acetate at the rate of 0.1% to 0.2%
mercury was a popular flooring in
gymnasiums, field houses, cafeterias,
and running tracks in schools across the
country. This material was developed by
3M in the late 1950s and for decades, 3M
and many other companies manufactured
and sold this flooring to school districts in Minnesota. Fortunately, because of advancements in
technology, flooring companies are no longer manufacturing this type of product.
MCPF were popular with schools because they were resilient, cushioned, and easily maintained.
However, the mercury in this polyurethane material slowly releases into the air.
Mercury is a powerful neurotoxin that affects the brain and central nervous system. It is especially
dangerous for children to be exposed to mercury vapor, which is readily absorbed by the lungs. During
periods of strenuous activity, because a child’s breathing rate increases, the danger is enhanced.
Due to concerns about vapor inhalation, toxicologists at the MDH developed exposure and ventilation
guidance for rooms with MCPF. It has been shown that actively ventilating a room that has MCPF has
reduced the health risk of people occupying that room.
Summary of flooring study
The MPCA conducted two different surveys of MCPF in Minnesota schools: one random and one of self-
selected schools. Since the self-selecting schools chose to participate primarily because of the promise
of a visit by a specially trained, mercury-detecting dog, and not out of concerns that they had mercury,
we can justify combining results from that survey with the results of the random survey.
The random survey, which took place in 2016, was of 140
Minnesota public, private, and charter schools to determine
how many of them had MCPF and to determine how much
mercury was escaping into the air above these floors. In
addition, the samples were tiered by school type, i.e.
42 of the state’s 220 charter schools
50 of the state’s 1858 public schools
48 of the state’s 651 non-public schools
MPCA estimates there are between 64 and 219 schools (K-12) in Minnesota that have mercury-catalyzed floors in their gyms or fieldhouses.
Figure 5. School gymnasium

2017 Toxics and Pollution Prevention Evaluation Report • April 2018 Minnesota Pollution Control Agency
35
By combining the two surveys, the sample has enough of each school type and in proportion to the
number in the total population. From this information, we estimate that there are between 64 and
219 K-12 schools in Minnesota that have MCPF in their gyms and/or fieldhouses.
The average mercury concentration of three MCPF floor samples (450 mg/kg) was used to calculate the
emissions; the estimate for the entire potential population of MCPF in K-12 Minnesota schools is
approximately three pounds of mercury vapor per year. There is uncertainty with this estimate because
we do not know if these estimates are reflective of all MCPF, given the variability of material, the age
and size of each floor, and facility conditions.
Further study is needed to get a more actuate idea of the scope of the problem in schools and to
determine how many of these MCPFs exist in other types of facilities, including the following:
Colleges and universities
Health clubs and public gymnasiums
Correctional facilities
In addition, more study is necessary to determine the actual emissions from these floors throughout the
state.
Floor removal
Removing MCPF from a facility can be very expensive because toxicity characteristic leaching procedure
(TCLP) tests show that approximately half of these floors contain more than 0.2 parts per million of
mercury and, therefore, are hazardous waste. Special precautions need to be taken to ensure worker
safety while removing these floors. Additionally, once removed from the floor substrate, the material
must be handled as hazardous waste. This means that it must be disposed of in a hazardous waste
landfill, usually outside the state. This adds expense to the removal and for some schools makes
replacement cost-prohibitive.
The Minnesota Department of Education, however, has money for schools that do decide to remove
MCPF from their facilities, but not for its replacement. Fortunately, schools have options when dealing
with these floors—they can do the following:
Leave the MCPF in place and ventilate the room properly so as to effectively reduce the emissions to an acceptable level when people are present in the room.
Leave the floor in place and instead cover the floor with either wood, tile, laminate or other safe, resilient floor material.
Remove and replace the floor.
MPCA and MDH staff have been offering and giving technical assistance to schools seeking to address
the indoor air quality concerns raised regarding these floors because it is important to alleviate or
significantly reduce the mercury emissions to the indoor air of schools and other facilities with these
floors, making gyms and fieldhouses safer places to play.
Lead and mercury in products
The 2013 TPPER described several issues related to lead and mercury use in products and made six
recommendations for addressing these problems. The six recommendations, the actions taken since
release of the report, current status and updated legislative recommendations are summarized below.

2017 Toxics and Pollution Prevention Evaluation Report • April 2018 Minnesota Pollution Control Agency
36
2013 TPPER Proposals for reducing lead and mercury in products, people and the environment
1. Lead wheel weights. The 2013 report recommended prohibiting the sale and installation of wheel weights and other balancing products containing lead or mercury; new motor vehicles may not be sold with wheel weights or other balancing products containing lead or mercury.
Actions taken and 2017 status: In 2014, legislation was introduced and enacted to prohibit the sale and installation of wheel weights and other balancing products containing lead or mercury, and the sale of new motor vehicles with such products. The law’s effective date was January 1, 2016. The MPCA worked with wheel weight manufacturers and the Minnesota Automobile Dealers Association to develop informational materials and an MPCA webpage describing the law and providing information on products that could be sold and installed on motor vehicles after the law’s effective date. The law is codified in Minn. Stat. §116.931.
At this time, there are no further legislative recommendations.
2. Mercury thermometers. The 2013 report recommended updating the law to eliminate the obsolete allowances for use and the references to primary standard thermometers. The legislation should allow mercury thermometer sales only where an Interstate Mercury Education and Reduction Clearinghouse (IMERC) member state has approved a limited use exemption and that exemption is provided to the MPCA. This is parallel to current statutory language [Minn. Stat. §116.92, subd. 8e(c)] prohibiting sales of mercury switches and relays except where an IMERC state has approved a limited use exemption and that exemption is provided to the MPCA.
Actions taken and 2017 status: In 2014, legislation was introduced and enacted in response to this recommendation. The law is codified in Minn. Stat. §116.92, subd. 6.
At this time, there are no further legislative recommendations.
3. Mercury thermostats and displacement relays. The 2013 report recommended harmonizing and strengthening the existing statutory requirements for manufacturers of thermostats and displacement relays to be responsible for end of life management of their products by broadening the education and incentive requirements, expanding the collection network, and requiring at minimum: annual reporting on program components and performance, listing of participants, recovery numbers and rates, and proposals to expand participation and increase recovery rates from all sectors that use the products.
Actions taken and 2017 status: In 2014, legislation was introduced in response to this recommendation. The final language of the enacted law strengthened the statutory manufacturer responsibility requirements for mercury thermostats but did not address mercury displacement relays. The final thermostat language did not fully address requirements for wholesalers and retailers to advise purchasers of new thermostats of the state’s mercury thermostat recycling requirements and to provide a no cost mail-in or drop-off option for their purchasers of new thermostats to recycle mercury thermostats.
4. Mercury-containing lamps. The 2013 report recommended establishing a flexible, product
stewardship approach for mercury-containing lamps. Based on the experience with product
stewardship for waste electronics and rechargeable batteries in Minnesota and with other products
in other states, product stewardship offers significant opportunities to improve the collection rate of
Recommendations: Address thermostat wholesaler/retailer disclosure and mercury collection program requirements. Enact parallel manufacturer and wholesaler/retailer requirements for mercury displacement relays.
2017 Toxics and Pollution Prevention Evaluation Report • April 2018 Minnesota Pollution Control Agency
37
mercury-containing lamps. Product stewardship for mercury-containing lamps would result in an
increased number of private sector entities providing collection opportunities and reducing
obligation to local governments to manage these products.
Actions taken and 2017 status: Minnesota continues to have a patchwork of lamp collection
programs that may be publicly or privately operated, may charge for lamps or accept them without
charge, may be supported by local revenues, or may be supported by electric utilities pursuant to
Minn. Stat. §216B.244. In addition, there is no mandated minimum level of service by county or
cities of a certain size. Large areas of the state have no lamp collection programs, particularly in the
south and west.
The state of Washington adopted product stewardship legislation for mercury-containing lamps in
2014 that has resulted in a very successful statewide program for collection and management of
mercury-containing lamps from households, non-profits, and small businesses.
The Washington State legislation and program include an ‘environmental handling charge’ added to
the purchase price of lamps sold at retail in the state, which was critical to passage of the legislation
and the success of the mandated stewardship program. The law states, “The environmental
handling charge must cover all administrative and operational costs associated with the product
stewardship program, including the fee for the department's administration and enforcement.” The
level of the charge is proposed by the stewardship organization and approved by the state
environmental department. The environmental handling charge must be either added by the
producer to the purchase price of lamps paid by retailers for lamps to be sold at retail, or the retailer
must add the environmental handling charge to all lamps sold at retail and remit the fee to the
stewardship organization on behalf of the producer.
Another critical feature of the legislation and the program’s success is the requirement for the
stewardship organization to provide no cost year round collection programs in every county and
every city with a population over 10,000. In contrast, more than half of the counties in Minnesota
have no lamp collection program or only event or seasonal collection sites that may not be free.
The stewardship organization is authorized to establish its own collection sites and mailback
programs or contract with household hazardous waste facilities, charities, retailers, government
recycling sites, or other suitable private locations, as well as curbside and mailback programs. No
entity is required to participate as a collection site or program.
In 2015, the first full year of operation, LightRecycle Washington collected nearly 990,000 lamps at
287 public sites and 12 events. In 2016, LightRecycle Washington collected almost 1.2 million lamps
at 301 public sites and 13 events. It is difficult to make a direct comparison between Washington
and Minnesota for 2015 since there are private collection programs in Minnesota that are not
required to report household lamp collection and recycling data separately from other operations.
5. Lead fishing tackle. The 2013 report recommended working with angling, conservation and other interested parties to establish a pathway to a phased in prohibition of the sale and use of lead fishing tackle. In the process review and learn from the experience of other jurisdictions that have done so successfully.
Recommendations: Establish a product stewardship approach for mercury-containing lamps based on the successful legislation and program in Washington State. Provide an option in the legislation to include LED lamps in the law. Ensure that funding mechanisms provide a smooth transition from the current system in Minnesota where some collection and recycling programs are funded by electric utilities pursuant to Minn. Stat. §216B.244.

2017 Toxics and Pollution Prevention Evaluation Report • April 2018 Minnesota Pollution Control Agency
38
Actions taken and 2017 status: No legislation has been proposed since 2014. MPCA staff focused their efforts on Proposal 6 below. Starting around 2000, the MPCA and Department of Natural Resources (DNR) conducted the Get the Lead Out! educational campaign to educate anglers and the general public regarding the environmental issues associated with lead tackle and the availability of nonlead products. This program was expanded after enactment of 2004 Minnesota Sessions Laws chapter 215, sections 33-34, which required the two agencies to “provide public education regarding concerns about lead fishing tackle and promote the availability of nonlead fishing tackle.”
6. Lead ammunition. The 2013 report recommended creating an education campaign with hunting, conservation, food safety and other interested parties for reducing the use of lead ammunition similar to the Get the Lead Out! program that was developed for lead fishing tackle. Also, monitor California’s approach and experience with phasing out the sale and use of lead-containing ammunition for hunting.
Actions taken and 2017 status: The MPCA partnered with the Minnesota Department of Natural
Resources (DNR) and applicant The University of Minnesota Raptor Center to develop and submit an
LCCMR proposal for a copper ammunition outreach and education program. This proposal directly
supported the findings and recommendations contained in the 2006 Report of the Nontoxic Shot
Advisory Council to the DNR, described in more detail below. The proposal was originally submitted
in response to the 2015 Environment and Natural Resources Trust Fund (ENRTF) Grant Request. It
was included in the LCCMR funding bill for three sessions and was not funded by the Legislature. The
Raptor Center, as the project applicant, chose to not resubmit the proposal for consideration in the
2018 LCCMR ENRTF Grant Program.
The DNR and The Raptor Center brought together a range of national and regional experts for two
Copper Ammunition Roundtable events, held in August 2015 and August 2016. Approximately 35
people attended each event. Well-known hunter and lead-free ammunition advocate Ron Spomer
produced a short video detailing the advantages of lead-free ammunition and practical information
for hunters making the switch. At the 2016 event, Russell Kuhlmann of the Institute for Wildlife
Studies gave a presentation on education and outreach efforts associated with implementation of
California AB 711, which phases out the sale and use of lead ammunition statewide by 2019.
The nonprofit Institute for Wildlife Studies in Arcata, California has been conducting nonlead
ammunition outreach and education since 2007 with their Hunting With Nonlead program and has
been closely involved in the CDFW outreach and education efforts associated with implementing AB
711. The Institute for Wildlife Studies has found that nonlead ammunition appears to be popular
with hunters who actually try it out and become familiar with its performance characteristics.
CDFW maintains a webpage listing all manufacturers of certified nonlead ammunition, with a pdf
listing of each manufacturer’s nonlead products. As of October 31, 2017, this webpage includes fifty
manufacturers.
In 2016, Minnesota ammunition manufacturer Vista Outdoor/Federal Cartridge first published a list
of their Federal Premium nonlead ammunition products. They now sell 45 products covering nearly
every common caliber and powder load. The list is available on the CDFW site listed immediately
above.
Recommendations: Continue to work with angling, conservation and other interested parties to provide public education regarding concerns about lead fishing tackle and promote the availability of nonlead alternatives.

2017 Toxics and Pollution Prevention Evaluation Report • April 2018 Minnesota Pollution Control Agency
39
Other policy and regulatory initiatives:
Federal:
The US Fish and Wildlife Service (USFWS) has been evaluating lead ammunition and tackle issues for
several years. As described in the 2013 TPPER, many USFWS refuges and programs have established
nonlead ammunition requirements or guidelines. In January 2017, USFWS issued a Director’s Policy
Order on nonlead ammunition, directing all units of USFWS to implement nonlead ammunition and
tackle directives over the next four years. The order is included as Appendix B. Incoming Interior
Secretary Ryan Zinke repealed this USFWS Director’s Order on March 8, 2017.
State:
Report of the Nontoxic Shot Advisory Committee, Submitted to the Division of Fish and Wildlife,
Minnesota Department of Natural Resources, Dec. 12, 2006. At the 2006 Wildlife Roundtable, DNR
Division of Fish and Wildlife was asked to study nontoxic shot and report back to the 2007 Wildlife
Roundtable. DNR formed the Nontoxic Shot Advisory Committee (NSAC) composed of ten external
stakeholders and one DNR member. The NSAC was supported by a technical advisory group of ten
DNR staff. The charge to the NSAC and its conclusions and recommendations are described in the
Report.18
In 2014, DNR proposed a regulation requiring the use of nonlead ammunition on state wildlife
management areas in the farmland zone, almost identical to Option 2 identified by the NSAC in
2006. This regulation has not been finalized. Legislation introduced in 2016 and 2017 (HF256/SF263)
would prohibit DNR from enacting regulations that limit or prohibit the use of lead ammunition on
state lands.
Legislation was introduced in 2017 (HF1356) that would prohibit possession or use of lead
ammunition during deer season, but was not enacted. Legislation was enacted in 2017 directing
DNR to conduct a study of lead shot deposition on state lands (2017 Session Laws ch. 93, Art 1 Sec 3
subd 6), and prohibiting the DNR from adopting rules prior to July 1, 2019 that restrict the use of
lead shot (2017 Session Laws ch. 93 Art 2 Sec 164). At the time this report is being written,
information is not available regarding the status or potential findings of the DNR lead shot
deposition study.
Updated legislative recommendations:
The MPCA recommends that the Legislature actively support outreach and education efforts (based
on consensus findings and recommendations from the Nontoxic Shot Advisory Council) to inform
hunters of the availability, performance, and environmental attributes of nonlead ammunition and
encourage its use.
18 Report of the Nontoxic Shot Advisory Committee, December 2006
http://files.dnr.state.mn.us/recreation/hunting/fawweb/nts/nontoxic_shot_report.pdf
Recommendations: Support outreach and education efforts to inform hunters of the availability, performance, and environmental attributes of nonlead ammunition; encourage its use.

2017 Toxics and Pollution Prevention Evaluation Report • April 2018 Minnesota Pollution Control Agency
40
Green and safer product chemistry Summary
To improve product chemistry safety and its impact on environment and health, MPCA and partners
have been working on goals first established in the 2010 MPCA/Minnesota Department of Health (MDH)
Report to the Legislature, “Options to Reduce and Phase-out Priority Chemicals in Children’s Products
and Promote Green Chemistry.” MPCA’s 2013 Toxics and Pollution Prevention Evaluation Report to the
Legislature built further on these goals. The goals are summarized here. We also outline policy
recommendations associated with some of the goals.
The MPCA, Department of Commerce, and MDH established a Chemicals in Products Interagency Team (CPIT) in 2015-2016. CPIT’s coordinated effort found violations of two Minnesota laws restricting toxic chemicals in children’s products, involving Priority Chemicals under the Minnesota Toxic Free Kids Act: three pendants small enough to swallow, made mostly of cadmium (a highly-toxic metal), and a shampoo made with formaldehyde.
The Chemicals in Products Interagency Team’s formation
and work has helped MDH focus efforts to educate
Minnesotans on toxic chemicals through its Toxic Free Kids
Program. MDH is now actively using e-mail bulletins to
communicate on State and nation-wide research and action
on priority toxic chemicals in children’s products. When
CPIT found high levels of toxic cadmium in children’s
jewelry, MDH released a fact sheet for consumers in
November 2017 to promote public health. Associated
publicity resulted in 1.5 million views through news and
social media. In addition to CPIT-related outreach, MDH
plans to review the current Toxic Free Kids Act Priority
Chemicals, and to produce and distribute new information
on those chemicals, linking to reputable sources on toxic-free alternatives.
The MPCA has awarded several grants aimed
at improving product chemistry: To companies, for summer green
chemistry and engineering interns
To college faculty, to integrate green chemistry into curricula
To help develop new, safer preservatives for personal care product.
Enhance coordination across state agencies involved in reducing toxics in products
Goal 1
Begin to educate Minnesotans about toxic chemicals of concern and ways they can limit their exposure
Goal 2
Add program components, incentives, and resources to the State’s product chemistry improvement efforts
Goal 3
Recommendations: A. Provide funding dedicated to expanding Commerce, Health
and MPCA’s oversight of Minnesota’s product restriction statues, with a focus on the safety of children and other vulnerable subpopulations.
B. Clarify enforcement authorities under existing and new statues.
Recommendations: C. The MPCA, DEED, and other partners, should with the
Legislature, explore grant and incentive tools, which support early stage companies developing safer product chemistries prior to those technologies producing sales and showing a profit.
D. Support the Angel Tax Credit for individual investors who are willing to support innovation.

2017 Toxics and Pollution Prevention Evaluation Report • April 2018 Minnesota Pollution Control Agency
41
However, chemical innovations may struggle for years to gain a
foothold with customers, threatening the survival of promising
technologies and of young, job-growing companies. Timely,
consequential grant making for product design has proven
difficult.
Misleading environmental marketing claims have confused
consumers. Such “greenwashing” must be monitored and
discouraged by the state. Continued growth of Minnesota’s
sustainable products and bio-based chemistry industry requires
that consumers receive accurate information.
In recent years, MPCA has worked with the Department of
Administration on an ad hoc basis to limit toxics or prevent
other pollutants from products or services in 15 contracts. In
2017, MPCA and the Department of Administration jointly signed a new Sustainable Procurement
Charter to make this process more systematic. However, agencies have few tools and resources to check
if sustainable purchasing policies are working.
Brief on the impact of the revisions to the U. S. Toxic Substances Control Act (TSCA)
After years of work, Congress and the President revised TSCA in June 2016. As a result, states have a
new opportunity to gain access to TSCA data submitted to EPA by companies and designated as
confidential business information (CBI). TSCA CBI would be of great use to Minnesota agencies in
understanding health effects, modeling exposure potential, targeting local environmental or health
monitoring, and setting program priorities.
EPA is expected to release guidance on EPA-State agreements to share and protect TSCA CBI. On behalf
of MDH and other State agencies that might benefit, MPCA will explore entering into a CBI-sharing
agreement with the TSCA program. Initial MPCA analysis suggests that the Minnesota Government Data
Practices Act offers sufficient authority to shield CBI received from and designated by another (federal)
agency. If EPA does not concur, however, Minnesota agencies may seek additional authority from the
Legislature in the future.
As to the effects of the revised TSCA on State policy initiatives:
New state requirements for companies to report on or disclose chemicals in products are not preempted
States are not preempted from acting on chemicals EPA has designated as “Low Priority”; they are also free to act on uses of chemicals EPA has not included in Risk Evaluations of “High Priority” chemicals
Improve the quality of data on toxic chemicals in products and the public’s access to such data
Goal 4
Amend State purchasing to reward products with fewer health and environmental impacts
Goal 5 Recommendation: E. Expand prohibitions on deceptive environmental marketing
claims covered by Minn. Stat. §325E.41, to include claims that a product is free-of a particular chemical, non-toxic, or that it has earned certifications or seals of approval. Add investigative authorities.
Recommendation: F. Establish funding for a reporting system and staff support to assure vendors are
complying with state contract sustainability terms.
2017 Toxics and Pollution Prevention Evaluation Report • April 2018 Minnesota Pollution Control Agency
42
When considering new State regulation of specific chemicals, policymakers should review the up-to-date federal status of those chemicals to be able to assess the likelihood of preemption challenges by EPA or companies
Even so, EPA will give preference to company requests to evaluate risks of a chemical and its use(s) regulated by one or more states after 2016, providing a fast lane for EPA to eventually preempt the state regulation.
Discussion: This section provides brief descriptions of investments and progress made on our five main
goals along with further discussion of related policy recommendation.
Establish a Chemicals in Products Interagency Team - In 2015 and 2016, MPCA joined with the State
Department of Commerce and Department of Health to form the Chemicals in Products Interagency
Team (CPIT). The CPIT was formed to leverage related experience, programs, resources, authorities, and
audiences across the three agencies to monitor, raise awareness of and ultimately reduce the migration
of toxics out of products and into Minnesota's environment, and into the bodies of Minnesota citizens.
Among the team’s initial priorities was to encourage companies selling products in Minnesota to be
aware of and comply with the State’s statutes restricting toxic chemicals in children’s products. The
outcome of this effort was an August 2017 Notice to Manufacturers/Retailers and Businesses. A full list of
statutes regulating products and packaging is included as Appendix A.
A second priority for CPIT was to begin assessing company compliance with Minnesota product
restriction statutes. The team decided to focus on the carcinogen and skin/respiratory sensitizer
formaldehyde in children’s products (Minn. Stat. § 325F.177), and on children’s jewelry, for the
development-impairing and sometimes-lethal metals lead (Minn. Stat. § 325E.389) and cadmium (Minn.
Stat. § 325E.3891). All products tested and intended for children under 14 are also assessed for hazard due
to toxic properties (Minn. Stat. § 325F.08).
Monitoring formaldehyde in children’s products
In 2015, the three agencies worked together to assess compliance with Minn. Stat. § 325F.177
Formaldehyde in Children’s Products Ban. The MPCA purchased 20 children’s personal care, cosmetic,
and play products, which could contain formaldehyde as a preservative, and delivered them to the MDH
Public Health Laboratory for analysis. Based on results using methods developed by MDH staff, MPCA
then worked with Commerce to follow up with a retailer and its suppliers on two products potentially
violating Minn. Stat. § 325F.177.
Led by Commerce, this action eventually resulted in a 2017 Stipulation and Settlement Agreement.
MPCA has also coordinated with the State of Washington Consumer Product Testing Program to compare
formaldehyde results and crosscheck compliance of particular products in two different regions.
Monitoring lead and cadmium in children’s jewelry
In 2015, Washington found sometimes-egregious
levels of the toxic metals lead and cadmium in
children’s jewelry, including cadmium as high as 98%
of the weight of a charm or pendant. This, plus
Minnesota’s sad history of a four-year-old’s death in
2006 after swallowing a charm containing lead,
spurred CPIT in 2016 to initiate a jewelry-testing
Success
CPIT’S INVESTIGATION SPURRED THE SUPPLIER TO REFORMULATE
THE PRODUCT ON A NATIONAL BASIS IN 2016, REDUCING
FORMALDEHYDE EXPOSURE TO CHILDREN ACROSS MINNESOTA
AND THE UNITED STATES.
Enhance coordination across state agencies involved in reducing toxics in products Goal 1

2017 Toxics and Pollution Prevention Evaluation Report • April 2018 Minnesota Pollution Control Agency
43
project in Minnesota. In early 2017, MPCA staff purchased 89 jewelry products, subjected them to X-ray
fluorescence screening and forwarded 16 products to a private lab for confirmation testing.
The lab found cadmium in three of the necklace pendants at 70 to 89% of the total weight of each
pendant. To promote public health as provided under Minn. Stat. § 13.39 Subdivision 2(a), the three
agencies agreed to release information on the three high-cadmium products to the public.
The information on high-toxicity jewelry was released in November 2017 via a News Release and two
fact sheets: one on the enforcement action; and another providing education for consumers, including
guidance that parents be cautious about purchasing inexpensive metallic jewelry, particularly online
and/or sourced from outside the U.S., and especially for children under 6. This distribution was viewed
1.5 million times.
In the course of the lab testing of children’s jewelry, MPCA and MDH staff became concerned that the
ASTM standard methods specified in Minn. Stat. § 325E.3891 (cadmium in jewelry) may not be
protective enough and should possibly be revised. The ASTM standard is meant to simulate toxic metals
dissolving from jewelry or toy components in the stomach for 2 to 24 hours. In some cases, however,
objects swallowed by children have remained in the stomach for days and caused harm, even when
coated with a protective layer. Another possibility is that Minn. Stat. § 325E.3891 could be revised to set
a limit for total cadmium versus the current limit based on simulated dissolving. Staff will continue
researching this issue and if a change is indicated, prepare a proposal.
In other interagency coordination efforts,
agencies working on state purchasing
have made progress. In early 2017, the
MPCA and the Department of
Administration’s Office of State
Procurement (OSP) jointly signed a new
Sustainable Procurement Charter. This
document brought order, commitment of
resources, and systemic focus to what previously had been an ad hoc process for reducing
environmental impacts of state purchasing. See Goal 5 for more.
Related policy recommendations:
As was described earlier, the Chemicals in Products Interagency Team has discovered violations of
Minnesota’s formaldehyde in children’s products and the lead and cadmium in children’s jewelry
statutes, using a limited-budget.
The State of Washington has invested resources since 2009 to cover many product types, and greater
numbers of samples. They also have discovered violations or exceedances. CPIT coordinates with
Washington to avoid duplication of testing.
The two states and others active in product testing have only sampled the tip of the iceberg. Ideally,
more states would become involved in this coordinated effort. Until then, Minnesota should bolster its
investment to better protect its citizens.
Recommendation: A. Increase funding for Commerce, Health and MPCA (acting
as the Chemicals in Product Interagency Team) to expand oversight of Minnesota product restriction statutes, with a focus on protecting the health of children and other vulnerable subpopulations.

2017 Toxics and Pollution Prevention Evaluation Report • April 2018 Minnesota Pollution Control Agency
44
The consequences of noncompliance may vary depending on statute. A child’s formaldehyde exposures
due to violations may not lead clearly to disease, but could contribute in unseen ways nonetheless.
Violations of the jewelry laws can result in a number of chronic or acute effects on a child, including
death, as happened in Minneapolis in 2006.
Federal programs do not provide significant oversight of toxics in products: TSCA does not, since it is not
focused on specific products, neither do CPSC or FDA, because they have few testing and enforcement
resources to cover the huge landscape of commerce.
Most of Minnesota’s product chemical restriction statutes (see Appendix A) do not provide specific
enforcement authority within their text. This should be corrected, and any new restriction statutes
should specifically provide for enforcement.
This longstanding goal has always been a challenge to address due to the complex and growing supply
chains of consumer products. However, momentum has been building since MDH hired a Toxic Free Kids
communications specialist in April 2017. This new capacity enabled MDH to produce the Educational
Fact Sheet for Consumers on children’s jewelry in November 2017, communicating to promote public
health by warning against children’s products containing Priority Chemicals named pursuant to the Toxic
Free Kids Act (lead and cadmium), plus a Lead Awareness infographic shared with state, local and
partner public health staff, and NGOs.
MDH and MPCA have presented to various stakeholders and audiences about CPIT’s efforts to monitor
Priority Chemicals. These presentations have opened up promising avenues to collaborate with others in
Minnesota working on toxic chemicals in products. For instance, MDH and MPCA are currently assisting
a Hamline professor to incorporate lessons about toxic chemical communication into curriculum. Also,
MPCA is now collaborating with a University of Minnesota instructor who has new technology for
screening products for organic chemicals of concern.
In the future, MDH plans to upgrade all Toxic Free Kids program web pages and fact sheets to meet plain
language standards and to better engage the public in toxic chemical awareness. Issuing consumer
notices will be considered whenever product testing suggests a need to protect public health by
informing citizens. In addition, MDH and MPCA will collaborate to screen product rating and certification
services provided by nongovernmental organizations, with the purpose of guiding consumers to those
services that are most accurate, well maintained, and useful.
At this time, no policy recommendations are specifically associated with this goal.
SUCCESS
BPA & BPS IN THERMAL RECEIPTS:
11 SMALL BUSINESSES IN MINNESOTA ELIMINATED 100 POUNDS BY GOING PAPERLESS
BEST BUY ELIMINATED SEVERAL TONS OF BPS BY SWITCHING
TO PHENOL-FREE PAPER
Educate Minnesotans about chemical hazards in products and ways they can limit their exposure Goal 2

2017 Toxics and Pollution Prevention Evaluation Report • April 2018 Minnesota Pollution Control Agency
45
Over the past four years, MPCA has provided funds for the following projects:
Summer green chemistry and engineering internship grants – started up in 2015-2016
In 2016, to ConnectEcology, for an intern to help design and compare life-cycle impacts of material and chemistry choices for two clients: E-Ride Industries of Princeton, for an electric vehicle used by the U.S. military, and; CD3, for a free-standing station for boat owners to use at landings to clean their boats to control invasive species.
In 2017, to Ecolab for an intern to assess, validate, and integrate data on the greener chemistry and sustainability attributes of 400 products into an internal database to give their North American sales force tools to better sell sustainable products. The student hired for this position completed a green chemistry experiment in Organic Chemistry lab developed through a 2011 curriculum grant from MPCA to the University of Minnesota-Twin Cities.
Curriculum grants – used state Environmental Assistance funds to provide grants up to $15,000 to
support the development of green chemistry and engineering curricula at post-secondary institutions in
Minnesota.
St. Catherine University (completed 2016) – This project focused on ensuring that green chemistry and toxicology are a key part of every student’s chemistry education. The project resulted in six new lab experiments and a new chemical toxicology seminar series. Faculty considered a new green chemistry certificate program, but decided that green chemistry should be an integrated topic rather than a separate area of instruction.
Starting in 2016, Macalester College began developing new lab experiments for introductory and advanced chemistry courses that incorporate four of the twelve principles of Green Chemistry.
Sponsorship of the collaborative, international Safer Preservatives Project, led by the Green Chemistry and Commerce Council – Along with Target and over a dozen other companies, MPCA is sponsoring this initiative to identify new preservatives for personal care and household products that do not share toxicity concerns with those previously in wide use (e.g. formaldehyde and parabens).
Add program components, incentives, and resources in support of product chemistry improvement Goal 3
CPIT “PUSHES” THE MARKET THROUGH
FORMALDEHYDE ENFORCEMENT, WHILE MPCA
HELPS “PULL” IT BY SUPPORTING THE SAFER
PRESERVATIVES PROJECT.
Figure 6. Grant funded station for boat owners to clean their boats to control invasive species

2017 Toxics and Pollution Prevention Evaluation Report • April 2018 Minnesota Pollution Control Agency
46
Support for early stage safer chemistry innovators: As this legislative report has discussed, it is a worthy public purpose to support Minnesota innovators who, through inventive product design, reduce the burden on public health and environmental systems of toxic chemicals when they migrate from products during use. As should also be evident in this report, Minnesota has an active green chemistry sector and is in a position to lead in new technology development and the promise of economic growth that follows.
Recent research suggests that innovation and the growth of high-quality new jobs have frequently been happening at start-ups and early stage businesses, and the development of new, improved product chemistry frequently follows the same pattern. Job creation is also, of course, an ongoing public policy purpose.
MPCA is therefore studying grant or other incentive policies, which can support Minnesota innovators who pursue these public purposes. The MPCA encourages the Legislature to also consider such policies in support of the wellbeing of human and natural systems, and the industries and jobs, which rely on them.
In addition, MPCA has in past years offered grants of up to $50,000 to companies to encourage voluntary redesign of products to reduce or eliminate high-priority toxic chemicals. This effort had difficulty
Finding and intersecting with individuals or companies which were in that early stage of product design
In offering grant amounts substantial enough to influence product decisions
In making, the states grant making process agile enough and timely enough to work well for innovators.
Because of these experiences, MPCA is seeking policies, which product innovators can trigger at timely stages in their technology development process. This may suggest a need for brand new tools, or for the adaptation of existing tools.
For instance, instead of “bricks and mortar” grants which build new facilities or production capacity for existing companies and technologies, a new grant program could support early stage innovators through the lean years of getting a new technology developed, established with customers, ramped up to full-scale production, and in position to compete with established but less sustainable chemistries and products.
Reports from early stage firms with a single product or technology reveal that significant time and expense is required to:
Complete safety testing and regulatory approvals for new chemistries
Work with prospective customers to get a new chemical technology to work well with their product(s)
Develop the supply chains and production processes necessary to begin deliveries.
These types of early development expenses could also be supported by grants or other incentive policies.
Focusing a grant program more explicitly on early-stage companies with the stated purposes of job
creation and technology leadership would help address critiques that substantial percentages of such
incentives are claimed by the largest corporations at an elevated cost per job created.
Recommendation: C. The MPCA, DEED and other partners
should, with the Legislature, explore grant and incentive tools, which support early stage companies developing safer product chemistries and other innovations, prior to those technologies producing sales and showing a profit.

2017 Toxics and Pollution Prevention Evaluation Report • April 2018 Minnesota Pollution Control Agency
47
New incentive tools focused on smaller, early-stage innovators could be monitored to determine if the
associated rate of job creation and fiscal benefit to the State is satisfactory. The lack of robust outcome
tracking is another common complaint about incentive programs.
These policies should help innovators in other industries that Minnesota seeks to grow, such as bio-
based products, which sometimes overlap with green and safer chemistry, or early stage medical
devices and technology, additive manufacturing, and other sectors.
Another means of supporting early stage chemistry innovators is to establish and appropriate the funds
necessary to provide support independent individual investors who support product chemistry
innovations.
In recent years, the Angel Tax Credit program served this
purpose, with considerable success across a number of key
Minnesota industries. According to DEED’s webpage, the
program was able to steadily increase its number of certified
investors, and its number of investors making investments.
Recent average total investment was some $63 million,
while credits to investors averaged $14.7 million. After Medical Devices and Software, Biotechnology
and Clean Technology were top-attracting business types. Biotechnology averaged $11.8 million in
annual investments and $2.8 million in credits; Clean Technology averaged $5.2 million in investments
and $1.2 million in credits.
In 2016, businesses participating in the program and receiving investments in the past five years
reported receiving a total of $65,751,783 in investments outside the program, while $58,894,095 was
invested within the program for that year DEED 2016 report). This suggests the program attracted
investment, which might otherwise not happen.
INGREDIENT DISCLOSURE Identifying the ingredients used in consumer products is difficult
without laws that require ingredient disclosure. MPCA and MDH’s 2010 joint Report to the Legislature
and MPCA’s 2013 Toxics and Pollution Prevention Evaluation Report to the Legislature recommended
that the State’s Toxic Free Kids Act be amended to require manufacturer reporting on Priority Chemicals
in children’s products. Bills to revise TFKA to include reporting requirements were introduced in 2014
and 2015 but did not pass.
To continue making progress towards
improved information for consumers,
MPCA and MDH have been supporting
the Interstate Chemicals
Clearinghouse (IC2) initiative to form
an Interstate High Priority Chemical
data system to integrate the product
chemical reporting requirements of
various states with such laws. Formed by 11 states in 2008, the IC2 is now an association of 15 state and
local government agencies plus company members such as Walmart.
With contributions from MPCA and MDH staff, IC2 applied for and won an EPA grant to develop the
Interstate High Priority Chemical data system, beginning with the Washington, Oregon, and Vermont
Recommendation: E. Expand prohibitions on the types of deceptive environmental
marketing claims from the federal “Guides for the Use of Environmental Marketing Claims” (16 CFR Part 260) covered by Minn. Stat. 325E.41, to include claims that a product is free-of a particular chemical, non-toxic, or that it has earned certifications or seals of approval.
Recommendation: D. Support the Angel Tax Credit for
individual investors who are willing to support innovation.
Improve the quality of data on toxic chemicals in products, and the public’s access to such data Goal 4

2017 Toxics and Pollution Prevention Evaluation Report • April 2018 Minnesota Pollution Control Agency
48
reporting programs, and possibly including Maine and New York by the end of the project in 2019. The
planned system will benefit reporters by reducing burden and improving accuracy with a “one-stop”
system for inputting data, and ultimately will benefit consumers by providing a web-based interface to
search for any available reported data on high priority chemicals in products.
The current plan is to have the front (data input) end of the system available for use in 2018, with
development of the back (data retrieval) end of the system by 2019. MPCA and MDH will continue to
participate.
MARKETING CLAIMS Unfortunately, the current landscape of environmental marketing claims have
led to confusion among consumers, as many products claim to be free of one hazard, while remaining
silent on what it was replaced with. Similarly, with “non-toxic”, where the claim can be made for one
ingredient without fully revealing the rest of the ingredients, and the presence of one or more different
chemical hazards.
In addition, the continued growth of Minnesota’s sustainable products and bio-based chemistry industry
requires that clear signals be sent to consumers. “Greenwashing,” which sends misleading signals,
should be discouraged in policy and monitored by state government.
Related policy recommendation:
At present, Minn. Stat. § 325E.41 prohibits for both
products and packaging some of the deceptive
environmental marketing claims covered by the U.S.
Federal Trade Commission’s “Green Guides”:
General environmental benefits claims
Claims that a product or package is degradable, compostable, recyclable, or contains recycled content
Claims relating to source reduction, refillability, or ozone safety, while specifically excluding the others listed in the FTC’s Green Guides.
This proposal would add to Minn. Stat. § 325E.41 those claims listed in the Green Guides relating to
product toxicity or composition:
Deceptive claims that products or services have no, are free of, or do not contain certain substances
Claims that misrepresent that a product, package, or service is “non-toxic”; a general “non-toxic” claim may misrepresent an item or service as non-toxic for humans and for the environment
Claims that misrepresent that an item or service has been endorsed or certified by an independent third party.
To improve the State’s capacity to determine compliance with these requirements, the Legislature
should add within Minn. Stat. § 325E.41 authorities for MPCA and/or Commerce to conduct monitoring,
investigations, and complaint-based oversight of deceptive environmental marketing claims. These
agencies can then work with the Attorney General’s Office as needed on enforcement.
SUCCESS
SINCE 2010, COMMERCIAL LAUNDRIES ACROSS
MINNESOTA HAVE ELIMINATED ABOUT 400 TONS PER YEAR OF
TOXIC CHEMICALS IN DETERGENTS. REDUCTIONS IN THE TWIN
CITIES LED TO 70% LESS OF THESE CHEMICALS ENTERING THE
MAIN METRO TREATMENT PLANT.

2017 Toxics and Pollution Prevention Evaluation Report • April 2018 Minnesota Pollution Control Agency
49
Minnesota has made significant and well-coordinated progress in
sustainable purchasing since December 2013 when the last Toxics
and Pollution Prevention Evaluation Report included this goal. 2013 - Using EPA pollution prevention grant funds, MPCA
analyzed Minnesota’s state spending on goods and services across 1,600 contracts to identify which areas of spending likely had the largest negative impacts on water consumption, resource depletion, greenhouse gas pollution, ecosystem quality, and human health.
2016 - Sustainable purchasing is included as one of the six primary areas of focus in the launch of Minnesota’s new Office of Enterprise Sustainability – to reduce environmental impacts of State operations.
2015 – 2017: MPCA and Department of Administration’s Office of State Procurement (OSP) developed, finalized, and jointly signed Minnesota’s Sustainable Procurement Charter. The Charter, for the first time,
Set data-driven priorities for which product and service contracts to improve
Committed staff resources from both agencies
Clarified agency roles and the process for contract improvement.
Related policy recommendation:
How do we assure vendors comply with environmental specifications? There is no proactive ongoing
program of compliance enforcement. This area needs additional resources to ensure that Minnesotans
are getting the toxics reduction and pollution prevention promised in the contracts.
With current resource commitments, OSP is reactive on compliance. When a user of a contract identifies
and reports violations, OSP takes action, and maintains the option to cancel the vendor’s contract with
the State. A related challenge is the lack of an efficient vendor-reporting system. Without such a system,
MPCA is only able to do limited monitoring of what is purchased from a few select contracts.
Adopt State purchasing and leasing contracts for products with fewer health and environmental impacts Goal 5
State government sustainable
purchasing outcomes
Prohibited perfluorinated chemicals from compostable products (water and human health protection)
Prioritized diesel emission reductions from deliveries of office supplies in the office supplies contract. (prevention of criteria air pollutants, including PM 2.5 and ground-level ozone)
Required use of “Smart Salting” practices by winter maintenance vendors at state owned properties (protects water quality and fish populations)
Prohibited dish and laundry cleaners from containing known carcinogens and reproductive toxins (water and human health protection).
Required cleaners to meet rigorous Green Seal standards (water and human health protection).
Recommendation: F. Establish funding for a reporting system and
staff support to assure vendors are complying with state contract sustainability terms.

2017 Toxics and Pollution Prevention Evaluation Report • April 2018 Minnesota Pollution Control Agency
50
Conclusion Over the past 25 years, there has been major progress made in reducing releases and off-site transfers
of toxic chemicals by Minnesota manufacturers and other industrial facilities. Those businesses that
implement pollution prevention approaches are seeing the benefits, with millions of dollars saved over
the years.
More recently, there are a number of examples of this continuing progress. The establishment of
Minnesota’s PaintCare program has provided nearly every Minnesotan with greater access to reusing
and recycling unused paints and has reduced costs previously borne by property tax payers. Improved
coordination among state agencies, along with financial and technical assistance efforts have led to
many examples of businesses finding creative ways to reduce their reliance on toxic chemicals. Similarly,
the formalization of the state’s sustainable purchasing program and launch of the Office of Enterprise
Sustainability in 2016 has helped state agencies to make great strides in reducing the toxics and
pollution in the products and services they purchase, which will help to drive the market toward offering
more sustainable products and services.
However, as seen throughout this report, there are challenges that remain. While there are many
businesses making progress in pollution prevention, progress statewide has stalled and the amount of
toxic chemicals generated and released by Minnesota facilities has become increasingly concentrated
among a few. Minnesota’s citizens and its environment are too often unknowingly exposed to toxic
chemicals through the products they purchase, sometimes in highly dangerous amounts.
By following the recommendations made in this report and continued collaborative efforts and pollution
prevention programs, the MPCA will strive to further reduce the use of toxic chemicals in products and
manufacturing processes to protect and improve the health of all Minnesotans and our environment.

2017 Toxics and Pollution Prevention Evaluation Report • April 2018 Minnesota Pollution Control Agency
51
Appendices
Appendix A. Hazardous and toxic chemical restriction statutes in Minnesota
Product / Product Category Minn. Stat. § First
enacted Oversight Authority
1. Hazardous toys and articles intended for children under 14: Toxic properties which present a hazard; able to produce personal injury or illness to a person through ingestion, inhalation, or absorption through anybody surface and can apply to any substance
325F.08-17 1973 Commerce – can use this authority to investigate issues subject to other laws in this list
2. Polychlorinated biphenyls (PCBs): Use, sale, purchase or manufacture prohibited unless exempted by MPCA
116.37 1976 Pollution Control
3. Chlorofluorocarbons (CFCs): Requirement to remove CFCs for recycling prior to disposal
116.731 1990 Pollution Control
4. Toxics in packaging: The total of lead, cadmium, mercury, and hexavalent chrome must be less than 100 ppm
115A.965 1991 Pollution Control
5. Listed metals: Lead, cadmium, mercury, and hexavalent chromium prohibited in inks, dyes, pigments, paints, or fungicides
115A.9651 1991 Pollution Control
6. Mercury: Product sales, use, labeling, disposal, recycling requirements; ban on mercury in toys, games, apparel, some medical devices, switches and relays, balancing and dampening products, OTC pharmaceuticals, cosmetics, toiletries, fragrances
116.92 1992 Pollution Control
7. Mercury: Requirement to remove mercury from products for recycling prior to disposal
115A.932 1992 Pollution Control
8. Children’s jewelry: Lead content must be less than 200 ppm or 600 ppm, depending on material
325E.389 2007 Attorney General
9. Penta- and octabromodiphenyl ethers (two PBDEs): Products containing more than 1000 ppm are prohibited Products without PBDEs shall be available for State procurement
325E.386
325E.387
2007 Pollution Control (defined in 325E.385)
10. Elemental Mercury: Banned in schools (except HVAC thermostats) 121A.33 2007 Education
11. Bisphenol A (BPA) in reusable food and drink containers: Prohibited 325F.173 2009 Commerce
12. Children's jewelry: Cadmium content cannot exceed 75 ppm 325E.3891 2010 Attorney General
13. Formaldehyde in products applied to or introduced into a child’s body: Formaldehyde cannot be intentionally added, or if released from other chemicals, cannot exceed 500 ppm at a given time Requirements for replacement chemicals
325F.177
325F.178
2013 Commerce
14. Bisphenol A (BPA) in containers for infant formula, baby food, or toddler food: Prohibited Requirements for replacement chemicals
325F.174
325F.175
2013 Commerce
15. Coal Tar in pavement sealants: Sales and use prohibited 116.202 2013 Cities; Pollution Control
16. Methyl methacrylate (MMA) liquid monomers & fumigants (formalin) in cosmetology: Prohibited
155A.355 2013 Board of Cosmetology Examiners
17. Lead & Mercury in wheel weights and other balancing products: sales and use ban; proper recycling required
116.931 2014 Pollution Control
18. Triclosan in consumer products for sanitizing or hand and body cleansing: sales prohibited
145.945 2014 Health
19. Four flame retardants (HBCD, deca-BDE, TDCPP, TCEP) in kids products & furniture foam: content cannot exceed 1000 ppm; effective dates July 2018 manufacturers; July 2019 retail Requirements for replacement chemicals
325F.071
Subd. 3
2015 Uncertain
2017 Toxics and Pollution Prevention Evaluation Report • April 2018 Minnesota Pollution Control Agency
52
Appendix B. U.S. Fish and Wildlife Service Director’s Policy Order
United States Department of the Interior
FISH AND WILDLIFE SERVICE
Washington D.C. 20240
DIRECTOR'S ORDER NO. 219
Subject: USE OF NONTOXIC AMMUNITION AND FISHING TACKLE
Sec. 1 What is the purpose of this Order? The purpose of this Order is to establish procedures and a
timeline for expanding the use of nontoxic ammunition and fishing tackle on Service lands, waters, and
facilities and for certain types of hunting and fishing regulated by the Service outside of Service lands,
waters, and facilities.
Sec. 2 What is the legal authority for this Order?
a. Bald and Golden Eagle Protection Act (16 U.S.C. 668a-d).
b. Migratory Bird Treaty Act (16 U.S.C. 703-712).
c. National Wildlife Refuge System Administration Act of 1966, as amended by the National Wildlife Refuge System Improvement Act of 1997 (16 U.S.C. 668dd-668ee).
d. National Wildlife Refuge Recreation Act (16 U.S.C. 460k-460k-4).
e. Endangered Species Act (ESA) (16 U.S.C. 1531-1543).
f. Fish and Wildlife Act 1956 (16 U.S.C. 742a-742j).
g. Migratory Bird Conservation Act (16 U.S.C. 715-715r).
h. Emergency Wetlands Resources Act of 1986 (16 U.S.C. § 3901b, 100 Stat. 3583).
Sec. 3 What is the Service’s overall policy? It is the Service’s policy to:
a. Require the use of nontoxic ammunition and fishing tackle to the fullest extent practicable for all activities on Service lands, waters, and facilities by January 2022, except as needed for law enforcement or health and safety uses, as provided for in policy.
b. Collaborate with state fish and wildlife agencies in implementing this policy.
Sec. 4 What are the effects of lead on fish or wildlife health?
a. Exposure to lead ammunition and fishing tackle has resulted in harmful effects to fish and wildlife species. According to the U.S. Geological Survey, lead poisoning is a toxicosis caused by the absorption of hazardous levels of lead in body tissues. Ingested lead pellets from shotgun shells have been a common source of lead poisoning in birds. The Service recognized the problem of avian exposure to lead shot used for waterfowl hunting and enacted restrictions in 1991 and hunting and waterfowl populations have thrived since.
b. The use of lead ammunition continues for other forms of hunting, presenting an ongoing risk to upland or terrestrial migratory birds and other species that ingest spent shot directly from the

2017 Toxics and Pollution Prevention Evaluation Report • April 2018 Minnesota Pollution Control Agency
53
ground or as a result of predating or scavenging carcasses that have been killed with lead ammunition and left in the field. Many states have enacted nontoxic shot and ammunition requirements to address this concern.
c. Ingestion of lead fishing sinkers and other fishing tackle have been documented in waterbirds. Six states currently restrict the use of lead fishing tackle under certain circumstances to protect wildlife health.
Sec. 5 What steps will the Service take to phase in the use of nontoxic ammunition and fishing tackle?
a. The Service will continue to support targeted research to understand the human, fish, and wildlife health benefits of using nontoxic ammunition and fishing tackle.
b. The Service will continue to work with states and other partners on education efforts regarding the benefits and effectiveness of nontoxic ammunition and fishing tackle.
c. To ensure the public experiences a consistent approach to nontoxic ammunition and fishing tackle requirements, over the next 24 months, each Regional Director, in coordination with relevant Assistant Directors, should work with individual states, regional state fish and wildlife associations, and tribes to identify opportunities to expand existing state, Federal, or tribal requirements for use of nontoxic ammunition and fishing tackle on Service lands, waters and facilities.
i. Where states have enacted nontoxic ammunition or fishing tackle requirements for certain forms of hunting and fishing on state lands such requirements should be expanded to national wildlife refuges in those states through amendments to state or Service regulations, as appropriate.
ii. Where states have enacted nontoxic ammunition or fishing tackle requirements for certain forms of hunting and fishing that apply to state, private, and Federal lands throughout their states, Regions should ensure these requirements are enacted and enforced on Service lands, waters, and facilities in those states.
iii. Where individual Federal land units administered by other Federal agencies including the National Park Service, the National Forest Service, the Bureau of Land Management, the Department of Defense, or other agencies, have enacted requirements for the use of nontoxic ammunition or fishing tackle, Regions should adopt such requirements on Service lands, waters and facilities in the same states as those units through amendments to Service hunting and fishing regulations, as appropriate.
iv. Where individual tribes have enacted requirements for the use of nontoxic ammunition or fishing tackle, the Regions should adopt such requirements on Service lands, waters and facilities in the same states as those tribal lands through amendments to Service hunting and fishing regulations, in consultation with the appropriate tribe and state.
d. When available information indicates negative impacts of lead ammunition or fish tackle on sensitive, vulnerable or Service trust resources, the appropriate Regional Director, in coordination with the appropriate Assistant Director(s), will take steps to expeditiously require the use of nontoxic ammunition or fishing tackle to the fullest extent practical under Service jurisdiction to benefit such species or resources.
e. The Assistant Director, Migratory Birds, in consultation with National Flyway Councils and individual states, will establish a process to phase in a requirement for the use of nontoxic ammunition for recreational hunting of mourning doves and other upland game birds.

2017 Toxics and Pollution Prevention Evaluation Report • April 2018 Minnesota Pollution Control Agency
54
Sec. 6 When is this Order effective? This Order is effective immediately. It remains in effect until we
incorporate it into the Fish and Wildlife Service Manual, or until we amend, supersede, or revoke it,
whichever comes first. If we do not amend, supersede, or revoke it, the provisions of this Order will
terminate on July 31, 2018.
/sgd/ Daniel M. Ashe DIRECTOR Date: January 19, 2017
For more information about this policy, contact the Office of Migratory Birds. For more information about this website, contact Krista Bibb in the Division of Policy, Performance, and Management Programs.
Directives Home
PPM websites: Centralized Library of Servicewide Policies | FWS Forms | PPM Services
Privacy, Disclaimer and Copyright Information | Information Quality Act
U.S. Fish and Wildlife Service Home Page | Department of the Interior | USA.gov | About the U.S. Fish and Wildlife Service | Accessibility | Privacy | Notices | Disclaimer | FOIA
https://www.fws.gov/policy/do219.html