2017 - tcd.ie wormald, aoife mcdermott, catherine nealon, claire o’dwyer, darren mccausland,...
TRANSCRIPT
A
2017
Health, Wellbeing and Social Inclusion: Ageing with an Intellectual Disability in IrelandEvidence from the First Ten Years of The Intellectual Disability Supplement to The Irish Longitudinal Studyon Ageing (IDS-TILDA)


Editors
Mary McCarron, Margaret Haigh and Philip McCallion.
Contributors
Mary McCarron, Philip McCallion, Rachael Carroll, Eilish Burke, Eimear McGlinchey,
Mary-Ann O’Donovan, Darren McCausland, Fintan Sheerin, Maire O’Dwyer, Sinead Foran,
Caoimhin MacGiolla Phadraig, Niamh Mulryan, Juliette O’Connell and Judy Ryan.
December 2017
Health, Wellbeing and Social Inclusion: Ageing with an
Intellectual Disability in IrelandEvidence from the First Ten Years of The Intellectual Disability
Supplement to The Irish Longitudinal Study on Ageing(IDS-TILDA)
Wave 3 IDS-TILDA

D
Evidence from the first Ten Years of The Intellectual Disability Supplement to The Irish Longitudinal Study on Ageing (IDS-TILDA)
The Intellectual Disability Supplement to TILDA
School of Nursing and MidwiferyThe University of Dublin, Trinity College2 Clare StreetDublin 2Ireland
Tel: + 353 1 8963187 / + 353 1 8963186
Email: [email protected]
Website: www.idstilda.tcd.ie
Copyright © The Intellectual Disability Supplement to The Irish Longitudinal Study on Ageing 2017

E
Acknowledgements
Acknowledgements
The Wave 3 IDS-TILDA study would not be possible without the support and commitment of a large number of people, groups, bodies and organisations across Ireland, all of whom have played critical roles in making this study a success. Most importantly, we would like to thank our participants, people with an intellectual disability who participated in the third wave of this study.
Their willingness to participate exceeded all expectations. Special thanks also to their family members, staff and service providers, who gave their time so willingly to support the study.
The ongoing support of Professor Rose Anne Kenny and the TILDA team, and the staff at the National Intellectual Disability Database (NIDD) at the Health Research Board is gratefully acknowledged.
We also express our thanks to the National Steering Committee, and International Scientific Advisory Board, who have and continue to play a key role in the study.
We would like to thank the researchers and field researchers: Amy Corbett, Amanda Deaton, Andrew Wormald, Aoife McDermott, Catherine Nealon, Claire O’Dwyer, Darren McCausland, Eilish King, Judy Ryan, Juliette O’Connell, Liza Kelly, Maire O’Dwyer, Maria Costigan, Mark Cecchetti, Martin McLaughlin, Mary Tobin, Maureen D’Eathe, Michelle Harrington, Patricia Armstrong, Pauline Smyth, Rosemary Monaghan, Sharon McKenna (Ellis), Sheila Byrne, Sinead Foran and Stephen Burke.
We would like to acknowledge the contribution of Behaviour & Attitudes for their IT support and expertise. We would like to thank the National Federation of Voluntary Bodies and Inclusion Ireland for their ongoing support, and the Intellectual Disability nursing team at the School of Nursing & Midwifery, Trinity College Dublin.
Finally, we would like to thank the funders, the Health Research Board and the Departmentof Health.

F
Evidence from the first Ten Years of The Intellectual Disability Supplement to The Irish Longitudinal Study on Ageing (IDS-TILDA)

G
Contents
Contents
List of Tables . . . . . . . . . . . . . . . . . . . . . . . . . . . . . . . . . . . . . . . . . . . . . . . . . . . . . . . . . . . . . . . . . . . . . . . . . . iList of Figures . . . . . . . . . . . . . . . . . . . . . . . . . . . . . . . . . . . . . . . . . . . . . . . . . . . . . . . . . . . . . . . . . . . . . . . . . iiiExecutive Summary . . . . . . . . . . . . . . . . . . . . . . . . . . . . . . . . . . . . . . . . . . . . . . . . . . . . . . . . . . . . . . . . . . . . 1Introduction . . . . . . . . . . . . . . . . . . . . . . . . . . . . . . . . . . . . . . . . . . . . . . . . . . . . . . . . . . . . . . . . . . . . . . . . . . . 9 Mary McCarron and Philip McCallion
1. Changing Demographics and Housing Mobility . . . . . . . . . . . . . . . . . . . . . . . . . . . . . . . . . . . . . . . 11 Mary-Ann O’Donovan, Eimear McGlinchey, Rachael Carroll, Philip McCallion and Mary McCarron
2. Social Participation . . . . . . . . . . . . . . . . . . . . . . . . . . . . . . . . . . . . . . . . . . . . . . . . . . . . . . . . . . . . . . . . 23 Darren McCausland, Rachael Carroll, Philip McCallion and Mary McCarron
3. Physical Health . . . . . . . . . . . . . . . . . . . . . . . . . . . . . . . . . . . . . . . . . . . . . . . . . . . . . . . . . . . . . . . . . . . 57 Eilish Burke, Eimear McGlinchey, Rachael Carroll, Maire O’Dwyer, Caoimhin MacGiolla Phadraig, Sinead Foran, Juliette O’Connell, Judy Ryan, Philip McCallion and Mary McCarron
4. Mental Health, Well-Being, Vitality and Life Events . . . . . . . . . . . . . . . . . . . . . . . . . . . . . . . . . . . . 87 Fintan Sheerin, Rachael Carroll, Niamh Mulryan, Philip McCallion and Mary McCarron
5. Health Care Utilisation . . . . . . . . . . . . . . . . . . . . . . . . . . . . . . . . . . . . . . . . . . . . . . . . . . . . . . . . . . . . 101 Mary-Ann O’Donovan, Rachael Carroll, Philip McCallion and Mary McCarron
6. Methodology. . . . . . . . . . . . . . . . . . . . . . . . . . . . . . . . . . . . . . . . . . . . . . . . . . . . . . . . . . . . . . . . . . . . . 111 Rachael Carroll, Mary-Ann O’Donovan, Eilish Burke, Madeline Smyth, Margaret Haigh, Philip McCallion and Mary McCarron

H
Evidence from the first Ten Years of The Intellectual Disability Supplement to The Irish Longitudinal Study on Ageing (IDS-TILDA)
ii
List of Tables
List of Tables
1. Changing Demographics, Sample Profile and Housing Mobility
Table 1.1 Demographic profile of IDS-TILDA participants across three waves of data collection . . . . . . . . . . . . . . . . . . . . . . . . . . . . . . . . . . . . . . . . . . . . . . . . . . . . . . . . . 14 Table 1.2 Profile of participants who moved between Waves 1 & 2 and Waves 2 & 3 . . . . . . . 15Table 1.3 Type of residence recorded for participants at Wave 2 and Wave 3 . . . . . . . . . . . . . 16Table 1.4 Type of move made between Waves 1 & 2 and Waves 2 & 3 . . . . . . . . . . . . . . . . . . . . 16Table 1.5 Reasons for moving by the type of move made by participants . . . . . . . . . . . . . . . . 18Table 1.6 Tenancy status for people who moved . . . . . . . . . . . . . . . . . . . . . . . . . . . . . . . . . . . . . . 20
2. Social Participation
Table 2.1 Proximity of family members (Waves 2 & 3) . . . . . . . . . . . . . . . . . . . . . . . . . . . . . . . . . . 27Table 2.2 Identity and location of best friend by age, gender, level of ID and type of residence . . . . . . . . . . . . . . . . . . . . . . . . . . . . . . . . . . . . . . . . . . . . . . . . . . . . . . . . . 33Table 2.3 Mean friendship quality scores by gender, age, level of ID and residence (Wave 3) . . . . . . . . . . . . . . . . . . . . . . . . . . . . . . . . . . . . . . . . . . . . . . . . . . . . . . . . 42Table 2.4 Reported use and difficulty using computers in Wave 2 and Wave 3 . . . . . . . . . . . . 47
3. Physical Health
Table 3.1 Objective measured weight versus self-perception of weight . . . . . . . . . . . . . . . . . . 61Table 3.2 World Health Organisation indicators and cut-off points . . . . . . . . . . . . . . . . . . . . . . 62 Table 3.3 Chronic health conditions stratified by gender, age and level of intellectual disability. . . . . . . . . . . . . . . . . . . . . . . . . . . . . . . . . . . . . . . . . . . . . . . . . . . . . . 67Table 3.4 Prevalence of recurrent falls and injurious falls at Waves 1 and 3 . . . . . . . . . . . . . . 70Table 3.5 Changes in medication use between Wave 2 and Wave 3 . . . . . . . . . . . . . . . . . . . . . . 79

Evidence from the first Ten Years of The Intellectual Disability Supplement to The Irish Longitudinal Study on Ageing (IDS-TILDA)
iiii
5. Health Care Utilisation
Table 5.1 Medical cover status for participants aged 54 years and over . . . . . . . . . . . . . . . . . 103Table 5.2 Health service use by age and medical cover status . . . . . . . . . . . . . . . . . . . . . . . . . 105
6. Methodology
Table 6.1 Objective health measures included in mini home health assessment . . . . . . . . . 114Table 6.2 Reasons for sample attrition . . . . . . . . . . . . . . . . . . . . . . . . . . . . . . . . . . . . . . . . . . . . . . 115Table 6.3 Summary table of additional scales for Wave 3 . . . . . . . . . . . . . . . . . . . . . . . . . . . . . 117

iiiiii
List of Figures
List of Figures
1. Changing Demographics, Sample Profile and Housing MobilityFigure 1.1 Type of move made by the 46 participants who moved at both waves . . . . . . . . . . 17Figure 1.2 Stakeholders involved in decision to move . . . . . . . . . . . . . . . . . . . . . . . . . . . . . . . . . . 19
2. Social Participation Figure 2.1 Family networks (Waves 2 & 3) . . . . . . . . . . . . . . . . . . . . . . . . . . . . . . . . . . . . . . . . . . . . . 26Figure 2.2 Contact with non-resident family by gender, age, level of ID and residence (Wave 3) . . . . . . . . . . . . . . . . . . . . . . . . . . . . . . . . . . . . . . . . . . . . . . . . . . . . 28Figure 2.3 Do you have friends? By age, gender, level of ID and type of residence (Wave 3) . 29Figure 2.4 Types of friends by gender, age, level of ID and residence (Wave 3) . . . . . . . . . . . . . 31Figure 2.5 Have a best friend by age, gender, level of ID and type of residence . . . . . . . . . . . . 32Figure 2.6 Contact with non-resident friends (Waves 2 & 3) . . . . . . . . . . . . . . . . . . . . . . . . . . . . . 34Figure 2.7 Contact with non-resident friends by gender, age, level of ID and residence (Wave 3) . . . . . . . . . . . . . . . . . . . . . . . . . . . . . . . . . . . . . . . . . . . . . . . . . . . . 35Figure 2.8 Identity of respondents’ confidants (Waves 1 & 3) . . . . . . . . . . . . . . . . . . . . . . . . . . . . 37Figure 2.9 Most common confidants by age gender, age, level of ID and residence . . . . . . . . 38Figure 2.10 Family members to whom respondents provide support . . . . . . . . . . . . . . . . . . . . . . 39Figure 2.11 Type of support provided to family (Waves 2 & 3). . . . . . . . . . . . . . . . . . . . . . . . . . . . . 40Figure 2.12 Help to/from friends and neighbours by gender, age, level of ID and residence (Wave 3) . . . . . . . . . . . . . . . . . . . . . . . . . . . . . . . . . . . . . . . . . . . . . . . . . . . . 41Figure 2.13 Social & leisure activities (Waves 1 & 3) . . . . . . . . . . . . . . . . . . . . . . . . . . . . . . . . . . . . . 43Figure 2.14 Social & leisure activities done solely in the local community (Waves 1 & 3) . . . . . 44Figure 2.15 Community belonging by gender, age, level of ID and type of residence . . . . . . . . 45Figure 2.16 Most common difficulties participating in social activities (Waves 1 & 3) . . . . . . . . 48Figure 2.17 Difficulty travelling around one’s community (Waves 1 & 3) . . . . . . . . . . . . . . . . . . . 49Figure 2.18 Reasons for not leaving the house . . . . . . . . . . . . . . . . . . . . . . . . . . . . . . . . . . . . . . . . . . 51
Evidence from the first Ten Years of The Intellectual Disability Supplement to The Irish Longitudinal Study on Ageing (IDS-TILDA)
iviv
3. Physical HealthFigure 3.1 BMI stratified by gender and age . . . . . . . . . . . . . . . . . . . . . . . . . . . . . . . . . . . . . . . . . . . 60Figure 3.2 Comparison of waist circumference risk of metabolic conditions Wave 2 to Wave 3 . . . . . . . . . . . . . . . . . . . . . . . . . . . . . . . . . . . . . . . . . . . . . . . . . . . . . . . . . . . . . . . . 62Figure 3.3 Comparison of waist-circumference risk of metabolic conditions between TILDA and IDS-TILDA Wave 3 . . . . . . . . . . . . . . . . . . . . . . . . . . . . . . . . . . . . . . 63Figure 3.4 High Cholesterol between Wave 1 and Wave 3 by age and gender . . . . . . . . . . . . . . 63Figure 3.5 Doctor’s diagnosis of hypertension stratified by gender and age . . . . . . . . . . . . . . . 64Figure 3.6 Changes in chronic health conditions between Wave 1 and Wave 3 . . . . . . . . . . . . 66Figure 3.7 Proportion of adults with osteoporosis stratified by age and gender at Wave 1 and Wave 3 . . . . . . . . . . . . . . . . . . . . . . . . . . . . . . . . . . . . . . . . . . . . . . . . . . . . . 68Figure 3.8 Prevalence of osteoporosis stratified by gender and level of intellectual disability. . . . . . . . . . . . . . . . . . . . . . . . . . . . . . . . . . . . . . . . . . . . . . . . . . . . . . 69Figure 3.9 Prevalence of recurrent falls and injurious falls at Wave 3 by age, gender and level of intellectual disability . . . . . . . . . . . . . . . . . . . . . . . . . . . . . . . . . . . . . . . . . . 70Figure 3.10 Fear of falling in Wave 3 . . . . . . . . . . . . . . . . . . . . . . . . . . . . . . . . . . . . . . . . . . . . . . . . . . . 71Figure 3.11 Levels of constipation in Wave 3 by gender and age . . . . . . . . . . . . . . . . . . . . . . . . . . 72Figure 3.12 Self-reported eye health . . . . . . . . . . . . . . . . . . . . . . . . . . . . . . . . . . . . . . . . . . . . . . . . . . . 73Figure 3.13 Prevalence of eye disease from Wave 1 to Wave 3 . . . . . . . . . . . . . . . . . . . . . . . . . . . . 74Figure 3.14 Eye Disease by age and gender from Wave 1 to Wave 3 . . . . . . . . . . . . . . . . . . . . . . . 75Figure 3.15 Prevalence of cataracts in people with Down syndrome and with ID from other aetiologies by age . . . . . . . . . . . . . . . . . . . . . . . . . . . . . . . . . . . . . . . . . . . . . . . . . . . . . . . . 76Figure 3.16 Self-reported hearing people with Down syndrome and people with ID from other aetiologies . . . . . . . . . . . . . . . . . . . . . . . . . . . . . . . . . . . . . . . . . . . . . . . . . . . . . . . . . 76Figure 3.17 Comparing the proportion reporting oral status in IDS-TILDA and TILDA . . . . . . . . . . . . . . . . . . . . . . . . . . . . . . . . . . . . . . . . . . . . . . . . . . . . . . . . . . . . . . . . 77Figure 3.18 Distribution of self-rated oral health Wave 3 TILDA V IDS-TILDA . . . . . . . . . . . . . . . . 78Figure 3.19 Most frequently reported therapeutic classes at Wave 2 and Wave 3 . . . . . . . . . . . 80 Figure 3.20 Percentage of people with Diagnosis of dementia in Wave 3 who reported ‘Cannot do at all’ for ADLs over the three Waves . . . . . . . . . . . . . . . . . . . . . 81Figure 3.21 Difference in TSI scores in those with and without dementia . . . . . . . . . . . . . . . . . . 82Figure 3.22 Dementia prevalence across three waves . . . . . . . . . . . . . . . . . . . . . . . . . . . . . . . . . . . 83

vv
List of Figures
4. Mental Health, Well-Being, Vitality and Life Events Figure 4.1 Prevalence of emotional and psychiatric conditions Wave 1 & Wave 3 . . . . . . . . . . 89Figure 4.2 Prevalence of emotional and psychiatric conditions by age . . . . . . . . . . . . . . . . . . . 90Figure 4.3 Self-rated mental health Waves 1 - 3 . . . . . . . . . . . . . . . . . . . . . . . . . . . . . . . . . . . . . . . . 91Figure 4.4 Glasgow Depression Scale and living situation . . . . . . . . . . . . . . . . . . . . . . . . . . . . . . . 92Figure 4.5 Glasgow Anxiety Scale by age groups . . . . . . . . . . . . . . . . . . . . . . . . . . . . . . . . . . . . . . . 94Figure 4.6 Mean Energy and Vitality Index by living situation . . . . . . . . . . . . . . . . . . . . . . . . . . . . 95Figure 4.7 Number of life events . . . . . . . . . . . . . . . . . . . . . . . . . . . . . . . . . . . . . . . . . . . . . . . . . . . . . 96Figure 4.8 Most prevalent life events . . . . . . . . . . . . . . . . . . . . . . . . . . . . . . . . . . . . . . . . . . . . . . . . . 96
5. Health Care UtilisationFigure 5.1 Medical cover across three waves . . . . . . . . . . . . . . . . . . . . . . . . . . . . . . . . . . . . . . . . . 103Figure 5.2 Health service use across three waves . . . . . . . . . . . . . . . . . . . . . . . . . . . . . . . . . . . . . 104Figure 5.3 Health screening across three waves . . . . . . . . . . . . . . . . . . . . . . . . . . . . . . . . . . . . . . 106Figure 5.4 Use of specialist health and social care services across three waves . . . . . . . . . . . 107
6. MethodologyFigure 6.1 IDS-TILDA Conceptual Framework . . . . . . . . . . . . . . . . . . . . . . . . . . . . . . . . . . . . . . . . . 114

Evidence from the first Ten Years of The Intellectual Disability Supplement to The Irish Longitudinal Study on Ageing (IDS-TILDA)
vivi

IntroductionWave 3 of The Intellectual Disability Supplement to the Irish Longitudinal Study on Ageing (IDS-TILDA) marks ten years since its inception as the first longitudinal study of adults with an intellectual disability to run in tandem with a national longitudinal study on ageing. Over those ten years, IDS-TILDA has provided essential data on the changes in the lives of people with an intellectual disability in terms of physical, mental and cognitive health, social participation and connectedness, health care utilisation and family caregiving. Where possible, questions were based on those asked to members of the general population by The Irish Longitudinal Study on Ageing (TILDA). This allowed for direct comparisons between changes that have occurred in the lives of those ageing with an intellectual disability and those ageing in the general population.
The rich data collected has highlighted areas where the ageing experience has been similar for both, and also areas where there are stark differences in the ageing profile. This understanding of similarities and differences has highlighted areas for policy and service provision consideration. Data generated from IDS-TILDA also continues to identify progress in the changes in people’s lives promised in key policy documents, including Healthy Ireland - A Framework for Improved Health and Wellbeing 2013-2025, the National Dementia Strategy, 2014, and Time to Move on from Congregated Settings, 2011.
Retention rates over the 10 years of IDS-TILDA have remained extremely high, with the majority of attrition due to the death of participants. These deaths have produced new research questions and an end of life (EoL) interview was initiated with carers of those who had passed away since the beginning of the study.
This third summary report focusses on the main challenges facing an ageing population in Ireland and, where possible, compares the findings of the intellectual disability population to the general population.
11
Executive Summary

Evidence from the first Ten Years of The Intellectual Disability Supplement to The Irish Longitudinal Study on Ageing (IDS-TILDA)
22
Changing Demographics and Housing MobilityFor people with an intellectual disability, the concept of ‘home’ is quite different than for the general population, with many people with an intellectual disability having historically been placed within segregated institutionalised living spaces (Bigby, 2006). In addition, many people with ID, who do not live in institutions, tend to live and remain living in the family home throughout their life. However, with the increased longevity of people with ID, future housing beyond the family home is providing an increasing challenge as people with ID are outliving their family carers. National policies also continue (HSE, 2011) that emphasise the movement of people with an intellectual disability from institutional settings into the community or more independent settings. The IDS-TILDA study is ideally positioned to track the implementation of de-congregation policy in Ireland.
Key Findings• Over the 10-year period between Wave 1 and Wave 3, 32.0% (241/753) of participants
confirmed a change in where they were living, with 167 people moving in the last three years.
• Of the 167 people who moved between 2014 and 2017, 46 (27.5%) had also reported a change in where they were living between 2011 and 2014.
• Movement within or to similar settings (lateral moves) were the most frequent moves made (64.7%).
• At Wave 3, 11.4% (19/167) of participants reported making a more community based move. This was a decrease from 26.7% (32/120) from Wave I to Wave 2.
• There was an increase in more supported moves at Wave 3, 24.0% (40/167), up from 13.3% (16/120) at Wave 2. Physical health changes were more likely to be reported as the main reason for these moves.
• A third of participants reported having a key to their own home. Of those who moved to a new residence, only 27.5% (46/167) reported having their own key.
• The majority of the participants who moved reported being happy following the move.
Social ParticipationThe context for assessing the social participation for older adults with ID in Ireland continues to be provided by policy developments on deinstitutionalisation and community living (HSE, 2011), the individualisation of services (Department of Health, 2011, 2012), and the mainstreaming and personalisation of day activity (HSE, 2012). Within this chapter we provide an overview of the makeup of social networks, types and frequencies of social contacts, engagement in social activities, and the different facilitators and barriers to participation for this
Executive Summary
33
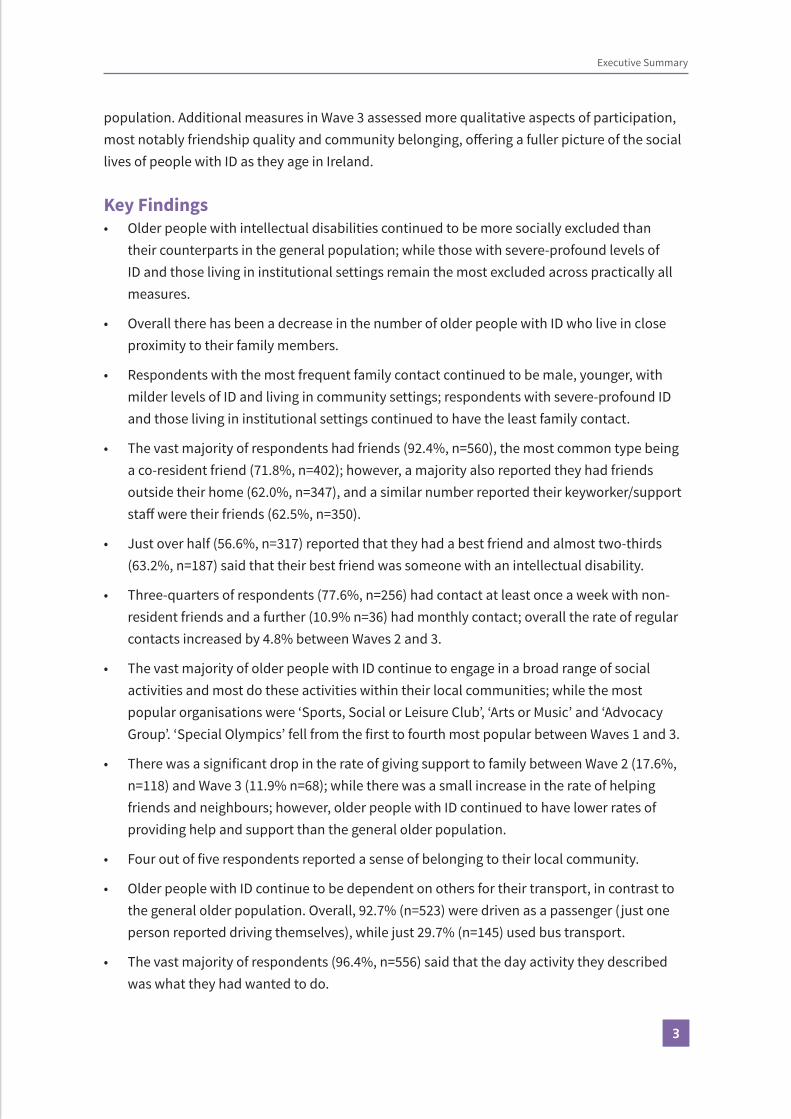
population. Additional measures in Wave 3 assessed more qualitative aspects of participation, most notably friendship quality and community belonging, offering a fuller picture of the social lives of people with ID as they age in Ireland.
Key Findings• Older people with intellectual disabilities continued to be more socially excluded than
their counterparts in the general population; while those with severe-profound levels of ID and those living in institutional settings remain the most excluded across practically all measures.
• Overall there has been a decrease in the number of older people with ID who live in close proximity to their family members.
• Respondents with the most frequent family contact continued to be male, younger, with milder levels of ID and living in community settings; respondents with severe-profound ID and those living in institutional settings continued to have the least family contact.
• The vast majority of respondents had friends (92.4%, n=560), the most common type being a co-resident friend (71.8%, n=402); however, a majority also reported they had friends outside their home (62.0%, n=347), and a similar number reported their keyworker/support staff were their friends (62.5%, n=350).
• Just over half (56.6%, n=317) reported that they had a best friend and almost two-thirds (63.2%, n=187) said that their best friend was someone with an intellectual disability.
• Three-quarters of respondents (77.6%, n=256) had contact at least once a week with non-resident friends and a further (10.9% n=36) had monthly contact; overall the rate of regular contacts increased by 4.8% between Waves 2 and 3.
• The vast majority of older people with ID continue to engage in a broad range of social activities and most do these activities within their local communities; while the most popular organisations were ‘Sports, Social or Leisure Club’, ‘Arts or Music’ and ‘Advocacy Group’. ‘Special Olympics’ fell from the first to fourth most popular between Waves 1 and 3.
• There was a significant drop in the rate of giving support to family between Wave 2 (17.6%, n=118) and Wave 3 (11.9% n=68); while there was a small increase in the rate of helping friends and neighbours; however, older people with ID continued to have lower rates of providing help and support than the general older population.
• Four out of five respondents reported a sense of belonging to their local community.
• Older people with ID continue to be dependent on others for their transport, in contrast to the general older population. Overall, 92.7% (n=523) were driven as a passenger (just one person reported driving themselves), while just 29.7% (n=145) used bus transport.
• The vast majority of respondents (96.4%, n=556) said that the day activity they described was what they had wanted to do.

Evidence from the first Ten Years of The Intellectual Disability Supplement to The Irish Longitudinal Study on Ageing (IDS-TILDA)
44
• Just over a quarter of respondents felt that a lack of transport facilities in their area affected their lifestyle (25.2%, n=111), and that they would like to use more public transport (26.7%, n=106).
• Half of respondents (50.0%, n=294) reported they had not spent any full days at home in the previous week, and a further 17% (n=100) spent just one full day at home; however, 6.1% (n=36) had not left the house at all in the previous week; while most who did not leave the house for at least one day had to stay at home for reasons other than their choice.
Physical HealthPeople with intellectual disability have complex health conditions, higher levels of multi-morbidity (McCarron et al., 2013) and continue to experience earlier mortality than their non-disabled peers (McCarron, Carroll, Kelly, & McCallion, 2015). This chapter explores the prevalence and incidence of chronic health conditions across the last 10 years among those participating in the IDS-TILDA study.
Key Findings• Participants continued to positively appraise their own overall health.
• There was a noted increase in chronic health conditions between Wave 1 and Wave 3.
• Doctor’s diagnosis of osteoporosis at 21% increased three fold since Wave 1; however remained lower than that objectively measured at 42% in Wave 2 of IDS-TILDA.
• There was a large increase in reported diagnosis of constipation from 17.3% in Wave 1 to 43.5% in Wave 3, with women presenting with higher prevalence (48.8%) compared to men (36.8%).
• Objectively measured overweight and obesity increased from 66% in Wave 2 to 79.7% in Wave 3 and is now similar to rates reported by TILDA for the general population.
• Despite these increases, 63.7% considered themselves just the right weight.
• Using waist circumference as an indicator of risk for metabolic conditions, 74.9% of participants in IDS-TILDA were at increased risk compared to 54% in the general ageing population.
• Cholesterol levels remained lower than TILDA findings for the general ageing population at 36.5% versus 41%. However, the results IDS-TILDA report are from participants’ files and not objectively measured as in TILDA.
• Despite this, prevalence of hypertension continued to be relatively stable with prevalence at Wave 3 of 18.7% compared to 16% in Wave 1 and also continued to be lower than the 40% level reported by TILDA.

Executive Summary
55
• Falls remained high at 27%, with 28.5% reporting ≥2 fall and 12.5% reporting injurious falls.
• Polypharmacy remained high in Wave 3 at 39.5% and excessive polypharmacy at 32.7% with 47.4% of those taking 3-4 medications at Wave 2 having progressed to taking 5-9 medications (polypharmacy) at Wave 3.
• In Wave 3, 28.3% (n=171/603) of participants reported that they had no teeth at all. This represented an increase of 3% since Wave 1. More concerning was that 67.8% of IDS-TILDA Wave 3 participants with tooth loss did not receive prosthetic dentures compared with 5.3% of participants without teeth found in TILDA’s Wave 3.
• Prevalence of eye disease rose to 19.5%, with cataracts the most prevalent eye disease at 15.9%, with a higher prevalence in people with Down syndrome including at younger ages.
• Overall, there was an incidence of 4.7% of dementia (n=27) between Waves 2 and 3 in IDS-TILDA.
• In Wave 3, 35.5% of people with Down syndrome had a doctor’s diagnosis of dementia, which rose from 15.6% in Wave 1, and there was further incidence of 22.5% between Waves 2 and 3.
• Dementia screening within the last two years rose from 14.5% in Wave 1 to 30.5% in Wave 3 overall and from 13.9% in Wave 1 to 61.4% in people with Down syndrome.
Mental Health, Well-Being, Vitality and Life Events This chapter reports on the findings on mental health, well-being, vitality and life events in Wave 3. A number of measures used in previous waves were repeated but this chapter also includes data from new measures that provide a more detailed and directed insight into depression and anxiety. Data is presented in a descriptive manner drawing comparisons with findings from other studies both for people with ID and for the general older adult population.
Key Findings• Emotional, nervous and psychiatric conditions remained at a high prevalence, with almost
52% of participants reporting having received a doctor’s diagnosis.
• Depression, anxiety and mood disorders were the main contributors to poor mental health.
• Rates of depression and mood swings decreased from Wave 1 to Wave 3.
• The incidence of newly-diagnosed mental health conditions, from Wave 2 to Wave 3, was low at 2.0%.
• Participants with Down syndrome reported fewer mental health conditions (26.2%) than those without Down syndrome.

Evidence from the first Ten Years of The Intellectual Disability Supplement to The Irish Longitudinal Study on Ageing (IDS-TILDA)
66
• Participants who self-reported were more likely to rate their mental and emotional health as excellent/very good/good (92.9%) than those with joint self/proxy (78.2%) or proxy only (70.8%) responses. This represented the highest self-rating of positive mental health to date across the three waves.
• Prevalence of depression, as measured using the Glasgow Depression Scale for people with a Learning Disability (GDS-LD), was significantly higher than that in the general population with 10% of participants reporting symptoms.
• There was no significant difference in prevalence of depression between those in institutions (11.1%) and community group homes (11.3%).
• Prevalence of anxiety, as measured using the Glasgow Anxiety Scale for people with a Learning Disability (GAS-LD), was similar to that in the mainstream population with 15.1% reporting symptoms. Anxiety was more frequently reported in those living in community settings than in institutions.
• The mean score for the Energy and Vitality Index (EVI) was 68.3, similar to that reported for the general older population in Ireland.
Health Care Utilisation As people with intellectual disability age, health needs change with a greater need for health services likely. Access to and utilisation of health care is identified as a key health indicator for people with intellectual disability (Ouellette-Kuntz, 2005). Yet access to adequate health services at the appropriate time can be complex (Northway, 2013) and challenging for people with ID. The pathways into healthcare are also reported to be different to that of the general population (McNally et al, 2004).
Key Findings• The majority of IDS-TILDA participants continued to access health services using a medical
or GP card.
• Private health insurance was low for people with an intellectual disability at 0.5% compared with 35.0% reported for the TILDA population.
• There was a trend for increased health service use demonstrated by increases in emergency department admissions, GP use, outpatient appointments and hospital admissions.
• There were increases in the percentage of participants reporting accessing health screening services including prostate cancer checks and breast checks.
• There was a much higher rate of flu vaccinations for the ID population (90.9% compared with 47.5% for the older general population).
Executive Summary
77
MethodologyAt Wave 3, interviews were sought from all respondents who took part in any previous wave and who agreed to be contacted again. To reduce respondent burden, prior answers in the physical health section in Waves 1 and 2 were ‘fed forward’ and confirmed, or updated, in Wave 3.
Key Points• The retention rate for Wave 3 was 86% (609 / 708); calculated as the percentage of
respondents who completed at least one element of Wave 3. Seventy percent of the attrition was due to deaths.
• Among the Wave 2 respondents who were alive at Wave 3, the response rate was 95.5%.
• Interviews continued to be a mix of self-report and proxy interviews. Proxy interviews were completed by family or staff.

Evidence from the first Ten Years of The Intellectual Disability Supplement to The Irish Longitudinal Study on Ageing (IDS-TILDA)
88

This report marks Wave 3 and the 10-year anniversary of IDS-TILDA. So much has changed in Ireland over those 10 years and there has been an important opportunity through IDS-TILDA to identify how the lives of people ageing with an intellectual disability have also changed. There is much that gives hope. That IDS-TILDA continues after 10 years is part of that hope. The active engagement of people with ID in launching each wave of the study, and in developing and testing protocol questions for IDS-TILDA, is another aspect and speaks to a new approach to studies, one that celebrates an important principle in advocacy “nothing about us, without us.” Our participants with an intellectual disability are our partners.
As well as presenting findings, this report celebrates a genuine partnership between researchers and those who provide the data. Over time too we have seen greater linkage of study questions to important social and policy questions, particularly as Ireland seeks to reduce reliance on congregated settings and advance new models for community living. The reports here are helping to track changes in services systems and their actual impact on individual lives. This also represents new ground as a longitudinal study and is a critical reason why future waves for the study are planned – there is so much more to know about the lives of people ageing with an intellectual disability when their daily lives, places of residence and opportunities for social engagement are rapidly changing.
There are also challenges highlighted in this report. There are many people with an intellectual disability who are not leading the active lives they desire, struggling to have relationships with others and experiencing high levels of chronic conditions that are not always well managed. We highlight these challenges but are interested in knowing in future waves how well they are addressed.
Finally, we feel strongly that after 10 years more is known today about the lives of people with an intellectual disability as they age. As researchers, we have been particularly fortunate to be linked with the Irish Longitudinal Study on Ageing. This has added to the richness of the data by offering opportunities for comparisons which have brought into sharper focus many of the challenges we have encountered in the lives of people with intellectual disabilities. Some
99
Introduction

Evidence from the first Ten Years of The Intellectual Disability Supplement to The Irish Longitudinal Study on Ageing (IDS-TILDA)
1010
challenges are shared, and some are unique to people with an intellectual disability. The ability to compare directly to TILDA has helped highlight what is unique in the lives of people with an intellectual disability as they age and to celebrate what is shared in common with others.
As we prepare for Wave 4, we are thoughtful about the participants we have lost over the ten years, often to the chronic conditions we identified in this study and are appreciative of their contributions. Many participants are continuing, but enough have been lost over the 10 years and three waves that in Wave 4 we will refresh the sample. We are pleased to dedicate this Wave 3 report to the original cohort of IDS-TILDA. We shared in their excitement on the day we launched IDS-TILDA and are humbled and appreciative of the contribution of every single participant and those who support them.
Professor Mary McCarronProfessor Philip McCallion

1 Changing Demographics and Housing MobilityMary-Ann O’Donovan, Eimear McGlinchey,Rachael Carroll, Philip McCallion andMary McCarron
Contents1.1 Key findings . . . . . . . . . . . . . . . . . . . . . . . . . . . . . . . . . . . . . . . . . . . . . . . . . . . . . . . . . . . . . . . . . . . 12
1.2 Introduction . . . . . . . . . . . . . . . . . . . . . . . . . . . . . . . . . . . . . . . . . . . . . . . . . . . . . . . . . . . . . . . . . . . 13
1.3 Sample demographic profile at Wave 3 . . . . . . . . . . . . . . . . . . . . . . . . . . . . . . . . . . . . . . . . . . . 14
1.4 Movement within and between settings . . . . . . . . . . . . . . . . . . . . . . . . . . . . . . . . . . . . . . . . . . 14
1.5 Motivation for and Involvement in decision about moving . . . . . . . . . . . . . . . . . . . . . . . . . . 17
1.6 Desire to move, home ownership and happiness post move . . . . . . . . . . . . . . . . . . . . . . . . 19
1.7 Conclusion . . . . . . . . . . . . . . . . . . . . . . . . . . . . . . . . . . . . . . . . . . . . . . . . . . . . . . . . . . . . . . . . . . . . 21
References . . . . . . . . . . . . . . . . . . . . . . . . . . . . . . . . . . . . . . . . . . . . . . . . . . . . . . . . . . . . . . . . . . . . . . . . . . . 21
1212
Evidence from the first Ten Years of The Intellectual Disability Supplement to The Irish Longitudinal Study on Ageing (IDS-TILDA)
11.1 Key findings• Over the 10-year period between Wave 1 and Wave 3, 32.0% (241/753) of participants
confirmed a change in where they were living, with 167 people moving in the last three years.
• Of the 167 people who moved between 2014 and 2017, 46 (27.5%) had also reported a change in where they were living between 2011 and 2014.
• Movement within or to similar settings (lateral moves) were the most frequent moves made (64.7%).
• At Wave 3, 11.4% (19/167) of participants reported making a more community based move. This was a decrease from 26.7% (32/120) from Wave I to Wave 2.
• There was an increase in more supported moves at Wave 3, 24.0% (40/167), up from 13.3% (16/120) at Wave 2. Physical health changes were more likely to be reported as the main reason for these moves.
• A third of participants reported having a key to their own home. Of those who moved to a new residence, only 27.5% (46/167) reported having their own key.
• The majority of the participants who moved reported being happy following the move.
Changing Demographicsand Housing Mobility

1313
Changing Demographics and Housing Mobility
1.2 Introduction A change in where a person lives is a common key life event that most people will experience at some stage during their life. For the general population this is typically an event that happens as part of the transition from adolescence to young adulthood, and serves as an indicator of independence and maturity. Moving at later life occurs too and may involve a move from the person’s own home to nursing home or to the home of adult children. This can be a consequence of decreasing physical health and increased need for support and dependence. However, ageing in place is a dominant policy perspective for the general older population with evidence supporting better quality of life for older people who remain living in their own home as they age (Sixsmith and Sixsmith, 2008).
For people with an intellectual disability, the concept of ‘home’ is quite different, with many people with an intellectual disability having historically been placed within segregated institutionalized living spaces (Bigby, 2006) and others living in the family home throughout their life. However, with the increased longevity of people with ID, and a policy emphasis on community based living for all people with disabilities (HSE, 2011), there is a need to understand success in movement of people to the community.
The IDS-TILDA study is ideally positioned to track the implementation of most recent de-congregation policies in Ireland, with Wave 1 data collected prior to policy publication and subsequent waves thereafter. This chapter profiles the movement of the IDS-TILDA sample across the 10-year period since the study began.
As with Wave 2, each move was examined and categorized into:
• Lateral move (movement to another living unit within a campus setting or institution; movement to another community group home; or movement to a different family or independent home).
• More supported move (movement from a community group home or from family/independent to a campus setting or institution or to a nursing home or a closed mental health unit; or movement from family/independent to a community group home).
• More community based move (movement from a campus setting or institution to a group home or to family/independent; movement from a community group home to family or independent home).
Evidence from the first Ten Years of The Intellectual Disability Supplement to The Irish Longitudinal Study on Ageing (IDS-TILDA)
1414
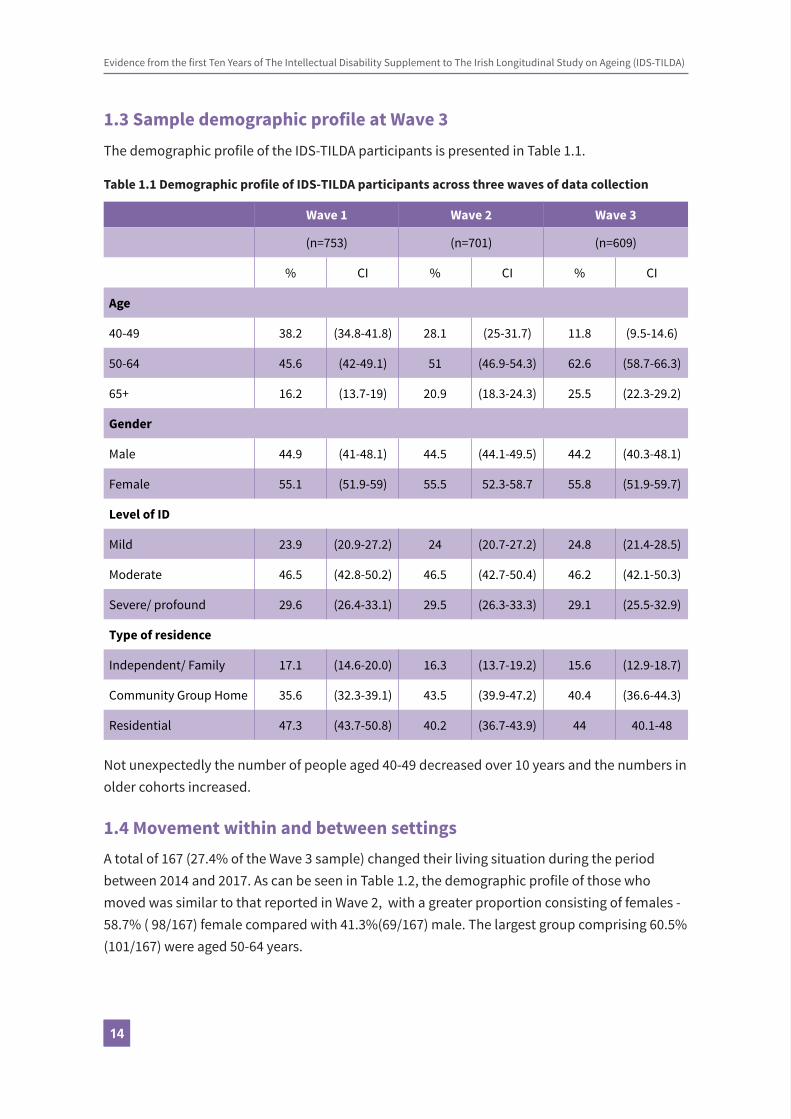
1.3 Sample demographic profile at Wave 3The demographic profile of the IDS-TILDA participants is presented in Table 1.1.
Table 1.1 Demographic profile of IDS-TILDA participants across three waves of data collection
Wave 1 Wave 2 Wave 3
(n=753) (n=701) (n=609)
% CI % CI % CI
Age
40-49 38.2 (34.8-41.8) 28.1 (25-31.7) 11.8 (9.5-14.6)
50-64 45.6 (42-49.1) 51 (46.9-54.3) 62.6 (58.7-66.3)
65+ 16.2 (13.7-19) 20.9 (18.3-24.3) 25.5 (22.3-29.2)
Gender
Male 44.9 (41-48.1) 44.5 (44.1-49.5) 44.2 (40.3-48.1)
Female 55.1 (51.9-59) 55.5 52.3-58.7 55.8 (51.9-59.7)
Level of ID
Mild 23.9 (20.9-27.2) 24 (20.7-27.2) 24.8 (21.4-28.5)
Moderate 46.5 (42.8-50.2) 46.5 (42.7-50.4) 46.2 (42.1-50.3)
Severe/ profound 29.6 (26.4-33.1) 29.5 (26.3-33.3) 29.1 (25.5-32.9)
Type of residence
Independent/ Family 17.1 (14.6-20.0) 16.3 (13.7-19.2) 15.6 (12.9-18.7)
Community Group Home 35.6 (32.3-39.1) 43.5 (39.9-47.2) 40.4 (36.6-44.3)
Residential 47.3 (43.7-50.8) 40.2 (36.7-43.9) 44 40.1-48
Not unexpectedly the number of people aged 40-49 decreased over 10 years and the numbers in older cohorts increased.
1.4 Movement within and between settingsA total of 167 (27.4% of the Wave 3 sample) changed their living situation during the period between 2014 and 2017. As can be seen in Table 1.2, the demographic profile of those who moved was similar to that reported in Wave 2, with a greater proportion consisting of females - 58.7% ( 98/167) female compared with 41.3%(69/167) male. The largest group comprising 60.5% (101/167) were aged 50-64 years.

1515
Table 1.2 Profile of participants who moved between Waves 1 & 2 and Waves 2 & 3
Wave 1 - Wave 2 Wave 2 - Wave 3
n=120 % CI 95% n=167 % CI 95%
Gender
Male 54 45 (36.4-53.9) 69 41.3 (34.1-48.9)
Female 66 55 (46.1-63.6) 98 58.7 (51.1-65.9)
Age
<50 years 30 25 (18.1-33.4) 20 12 (7.9-17.8)
50-64 54 45 (36.4-53.9) 101 60.5 (52.9-67.6)
65+ 36 30 (22.5-38.7) 46 27.5 (21.3-34.8)
Level of ID
Mild 17 14.8 (9-21.5) 36 22.8 (16.9-29.9)
Moderate 64 55.7 (44.4-62) 76 48.1 (40.4-55.8)
Severe/profound 32 26.7 (19.6-35.2) 46 29.1 (22.6-36.6)
Changing Demographics and Housing Mobility

Evidence from the first Ten Years of The Intellectual Disability Supplement to The Irish Longitudinal Study on Ageing (IDS-TILDA)
1616
Table 1.3 illustrates that for the majority of participants there was no change in type of residence at Wave 3 when compared with Wave 2. For instance, 88.6% (218/246) who were living in a community group home in 2017 were previously living in a community group home in 2017. However, five people who had been living with family/independently in 2014 were living in a community group home in 2017 and a further eight people who were previously living with family/independent were in a residential type by 2017.
Table 1.3 Type of residence recorded for participants at Wave 2 and Wave 3 (n = 609)
Type of residence at Wave 3
Wave 2 Residence Family/ Independent Community Group Home Residential
n % 95% CI n %95%
CIn %
95% CI
Family/Independent
90 94.70%(88.3-97.7)
5 2.00%(0.9-4.7)
8 3.00%(1.5-5.8)
Community Group Home
5 5.30%(2.3-11.7)
218 88.60%(84-92)
43 16.00%(12.1-20.9)
Residential 0 0.00% (0-3.9) 23 9.30%(6.3-13.6)
217 81.00%(75.8-85.2)
Total 95 100.00% 246 100.00% 268 100.00%
Similarly to Wave 2, each move was examined and categorised according to three types of moves – lateral, more supported and more community based. Table 1.4 shows that there was a decrease in the number and percentage of more community based moves made between Wave 2 and Wave 3 (19/167, 11.4%), compared to similar moves made between Wave 1 and Wave 2 (32/120, 26.7%). In contrast, there was an increase in both lateral and more supported moves made during the same period.
Table 1.4 Type of move made between Waves 1 & 2 and Waves 2 & 3
Wave 1 - Wave 2 Wave 2 - Wave 3
n=120 % 95% CI n=167 % 95% CI
Lateral 72 60.0 (51.1-68.3) 108 64.7 (57.2-71.5)
More supported 16 13.3 (8.38-20.6) 40 24 (18.1-31)
More community based 32 26.7 (19.6-35.2) 19 11.4 (7.4-17.1)

1717
Of the 120 participants who had moved residence between Wave 1 and Wave 2, 38.3% (46/120) reported that they moved again between 2014 and 2017. The type of move made by these 46 participants is illustrated in Figure 1.1 below. In line with the total group of movers, the majority of these 46 participants made lateral moves both times, with a noted decrease in the percentage who made community based moves between Wave 2 and Wave 3. Just over a quarter of the 46 participants had made a more community based move between Wave 1 and Wave 2 but only 4.3% (2/46) reported the second move to be a more community based move.
Figure 1.1 Type of move made by the 46 participants who moved at both waves
0102030405060708090
100
Lateral Supported Community
Wave 2 Wave 3
Note: n = 46; Error bars correspond to 95% confidence intervals
1.5 Motivation for and involvement in decisions about moving Participants could indicate multiple reasons for moving (note – as not all participants answered this question, the total numbers reported in this section may vary). The most frequently reported reasons given by the 161 participants who moved between Wave 2 and Wave 3 and answered this question were changes in health status (23.6%, 38/161), to accommodate the service provider (18.0%, 29/161) and unhappiness in previous residence (13.0%, 21/161). The single most important reason identified for moving was a change in the individual’s health status (21%, 33/157).
Table 1.5 shows the reasons for moving (by the type of move made) as given by the 156 participants who answered this question. Physical health changes were more likely to be reported as the main reason for moving by 38 participants who made more supported moves (39.5%, 15/38) (Table 1.5). Overall 25 participants who made lateral moves reported other reasons such as compatibility with housemates, health and safety and other structural housing issues, sale of property by landlord and closure of particular residential units. In addition, just under a quarter of this lateral move group (21%, 21/100), selected the reason that they moved
Changing Demographics and Housing Mobility

Evidence from the first Ten Years of The Intellectual Disability Supplement to The Irish Longitudinal Study on Ageing (IDS-TILDA)
1818
to accommodate the service provider. A third of 18 participants who made more community based moves (33.3%, 6/18) reported being unhappy in the previous residence as the reason for moving.
Table 1.5 Reasons for moving by the type of move made by participants (n = 156)
Lateral (n=100) Supported (n=38) Community (n=18)
n % 95% CI n % 95% CI n % 95% CI
Physical health changes
16 16(10.1-24.4)
15 39.5(25.6-55.3)
2 11.1 3.1-32.8
Loss of primary carer 2 2 (0.6-7) 1 2.6(0.5-13.5)
0 0 (0-17.6)
Change in service policy
4 4 (1.6-9.8) 1 2.6(0.5-13.5)
2 11.1 3.1-32.8
To accommodate the service
21 21 (14.2-30) 1 2.6(0.5-13.5)
2 11.1 3.1-32.8
Not happy where I was living
8 8 (4.1-15) 4 10.5(4.2-24.1)
6 33.3(15.3-56.3)
Lack of accessibility where I was living
4 4 (1.6-9.8) 0 0 (0-9.2) 0 0 (0-17.6)
Lack of nursing support
2 2 (0.6-7) 4 10.5(4.2-24.1)
1 5.6 (1-25.8)
Lack of 24 hour care 0 0 (0-3.7) 1 2.6(0.5-13.5)
0 0 (0-17.6)
Personal choice 6 6(2.8-12.5)
4 10.5(4.2-24.1)
1 5.6 (1-25.8)
Don’t know the reason 5 5(2.2-11.2)
0 0 (0-9.2) 2 11.1 3.1-32.8
Staff/skill mix not in place to meet needs
7 7 (3.-13.7) 1 2.6(0.5-13.5)
1 5.6 (1-25.8)
Other 25 25(17.5-34.3)
6 15.8 7.4-30.4 1 5.6 (1-25.8)
As noted above, 46 participants moved at Wave 2 and again at Wave 3. The most frequently reported reason for moving for these 46 participants was to accommodate the service provider (21.7%, 10/46) which was an increase from 17.4% (8/46) at Wave 2. The percentage of these participants reporting personal choice as the main reason for moving also increased from 4.3% 2/46) to 8.7% (4/46).

1919
In terms of the individual’s involvement in the decision to move, a higher proportion of 18 participants who made community based moves (44.4%, 8/18) were involved in the decision. This compares with a third of 103 participants who made lateral moves (33%, 34/103) and 26.3% (10/38) of 38 participants who made more supported moves.
Figure 1.2 illustrates the multiple stakeholders who may be involved in the decision that an older person with intellectual disabilities changes where they live, and is an indication of the complexity of the moving process for this population.
Figure 1.2 Stakeholders involved in decision to move
0
10
20
30
40
50
60
70
80
90
Individual Family Key worker Sta� The service Other
Note: n = 160; Missing Obvs = 7; Error bars correspond to 95% confidence intervals
1.6 Desire to move, home ownership and happiness post move
Participants were asked if they had wanted to move and, of the 167 participants who reported to have moved between 2014 and 2017, 156 answered the question. Of this group, 54.5% 85/156) said that they had wanted to move. However, 32.7% (51/156) participants stated that they did not know if they wanted to move or not. A total of eighteen (18/143; 12.5%) participants reported viewing alternative options for living prior to their move.
Changing Demographics and Housing Mobility

Evidence from the first Ten Years of The Intellectual Disability Supplement to The Irish Longitudinal Study on Ageing (IDS-TILDA)
2020
Overall however, the majority of the 160 participants who answered the relevant question stated that they were happy following the move (89.4%, 143/160) with just 1.3% (2/160) saying they were unhappy and a further 5% (8/160) were neither, happy or unhappy but said they were still adapting to the change.
In response to the question ‘do you have a key to your own home’ a total of 201 of the 607 participants (33.1%) reported that they had. Interestingly, of the 167 who had moved residence in the last three years, a lower percentage, 27.5%, reported having a key (46/167). A lower percentage of the 40 participants who had made more supported moves reported having their own key (12.5%, 5/40) compared with the 19 participants who made more community based moves (57.9%, 11/19).
Participants were asked if they were a home owner or tenant and, if a tenant, whether the property was rented from a service provider, private landlord or housing authority/social housing. Of the 167 people who moved, 150 people responded to this question. Table 1.6 illustrates that the majority of participants who moved were renting their home, with 76.0% (114/150) renting from a service provider. Only one participant who had moved reported owning their own home and six people were now living in a nursing home.
Table 1.6: Tenancy status for people who moved
n % 95% CI
Own home/have mortgage 1 0.7 (0.1-3.7)
Family owns home 1 0.7 (0.1-3.7)
Rent from service provider 114 76 (68.6-82.1)
Rent from private landlord 7 4.2 (2.3-9.3)
Rent from local authority/ social housing 4 2.4 (1-6.7)
Nursing home/fair deal 6 4 (1.8-8.5)
Does not pay rent/ not applicable 17 10.2 (7.2-17.4)
Total 150 100
Just over half of those who moved (95/162, 58.6%) had a tenancy agreement with the person they rented from. However, 16.0% of the total (n = 26) did not know and 25.3% (n = 41) did not have a tenancy agreement.
2121
1.7 Conclusion As a percentage of the overall changes in living arrangements, the rate with which older people with ID have moved to the community has decreased in the last three years. Lateral moves continue to dominate the housing mobility landscape for this population with the main reason for these lateral moves tending to be provider driven. However, to the extent that lateral moves were from one community setting to another or from one family or independent home to another, such moves were also supportive of not adding to the population in congregate settings. Participants who had moved to more supported settings reported a change in physical health status as the main driver for those moves.
Similarly to the moves examined in 2014, many people with ID are not involved in the decision to move. In addition, while one third of the total IDS-TILDA sample had a key to their own home with fewer (27.5%) of the participants who moved reporting the same. There remains much work to be done to achieve community living and associated markers of independence for most people with an ID. However, it was particularly noteworthy that most participants wanted to move into the community and, regardless of the level of their involvement in the decision to move and where they moved, among participants there was a high level of happiness recorded post move.
References
Bigby, C. (2006). Shifting Models of Welfare: Issues in Relocation from an Institution and the Organization of Community Living. Journal of Policy and Practice in Intellectual Disabilities. 3 (3), 147-54.
Health Service Executive. (2011). Time to Move on from Congregated Settings. A Strategy for Community Inclusion. Report of the working group on congregated settings. Dublin: Health Service.
Sixsmith, A., & Sixsmith, J. (2008). Ageing in Place in the United Kingdom. Ageing International,32, 219-35.
Changing Demographics and Housing Mobility

Evidence from the first Ten Years of The Intellectual Disability Supplement to The Irish Longitudinal Study on Ageing (IDS-TILDA)
2222

Contents2.1 Key findings . . . . . . . . . . . . . . . . . . . . . . . . . . . . . . . . . . . . . . . . . . . . . . . . . . . . . . . . . . . . . . . . . . . . . . 24
2.2 Introduction . . . . . . . . . . . . . . . . . . . . . . . . . . . . . . . . . . . . . . . . . . . . . . . . . . . . . . . . . . . . . . . . . . . . . 25
2.3 Social connections. . . . . . . . . . . . . . . . . . . . . . . . . . . . . . . . . . . . . . . . . . . . . . . . . . . . . . . . . . . . . . . . 26
2.3.1 Connections with family . . . . . . . . . . . . . . . . . . . . . . . . . . . . . . . . . . . . . . . . . . . . . . . . . . . . . . 26
2.3.1.1 Family networks . . . . . . . . . . . . . . . . . . . . . . . . . . . . . . . . . . . . . . . . . . . . . . . . . . . . . . 26
2.3.1.2 Proximity of family . . . . . . . . . . . . . . . . . . . . . . . . . . . . . . . . . . . . . . . . . . . . . . . . . . . . 27
2.3.1.3 Contacts with family . . . . . . . . . . . . . . . . . . . . . . . . . . . . . . . . . . . . . . . . . . . . . . . . . . 28
2.3.2 Connections with friends . . . . . . . . . . . . . . . . . . . . . . . . . . . . . . . . . . . . . . . . . . . . . . . . . . . . . 29
2.3.2.1 Friends networks . . . . . . . . . . . . . . . . . . . . . . . . . . . . . . . . . . . . . . . . . . . . . . . . . . . . . 29
2.3.2.2 Contacts with friends . . . . . . . . . . . . . . . . . . . . . . . . . . . . . . . . . . . . . . . . . . . . . . . . . . 34
2.4 Type and quality of relationships . . . . . . . . . . . . . . . . . . . . . . . . . . . . . . . . . . . . . . . . . . . . . . . . . . . 36
2.4.1 Confidants . . . . . . . . . . . . . . . . . . . . . . . . . . . . . . . . . . . . . . . . . . . . . . . . . . . . . . . . . . . . . . . . . . 36
2.4.2 Support to family . . . . . . . . . . . . . . . . . . . . . . . . . . . . . . . . . . . . . . . . . . . . . . . . . . . . . . . . . . . . 38
2.4.3 Help to friends and neighbours. . . . . . . . . . . . . . . . . . . . . . . . . . . . . . . . . . . . . . . . . . . . . . . . 40
2.4.4 Friendship quality . . . . . . . . . . . . . . . . . . . . . . . . . . . . . . . . . . . . . . . . . . . . . . . . . . . . . . 41
2.5 Engagement in social and community activity . . . . . . . . . . . . . . . . . . . . . . . . . . . . . . . . . . . . . . . 42
2.5.1 Social and leisure activities . . . . . . . . . . . . . . . . . . . . . . . . . . . . . . . . . . . . . . . . . . . . . . . . . . . 42
2.5.2 Membership of organisations . . . . . . . . . . . . . . . . . . . . . . . . . . . . . . . . . . . . . . . . . . . . . . . . . 44
2.5.3 Community belonging . . . . . . . . . . . . . . . . . . . . . . . . . . . . . . . . . . . . . . . . . . . . . . . . . . . . . . . 44
2.5.4 Technology and social media . . . . . . . . . . . . . . . . . . . . . . . . . . . . . . . . . . . . . . . . . . . . . . . . . 46
2.5.5 Difficulties engaging in social and community activity . . . . . . . . . . . . . . . . . . . . . . . . . . . 48
2.5.6 Transport . . . . . . . . . . . . . . . . . . . . . . . . . . . . . . . . . . . . . . . . . . . . . . . . . . . . . . . . . . . . . . . . . . . 49
2.5.7 Daily occupation . . . . . . . . . . . . . . . . . . . . . . . . . . . . . . . . . . . . . . . . . . . . . . . . . . . . . . . . . . . . . 50
2.6 Discussion and conclusion . . . . . . . . . . . . . . . . . . . . . . . . . . . . . . . . . . . . . . . . . . . . . . . . . . . . . . . . . 51
References . . . . . . . . . . . . . . . . . . . . . . . . . . . . . . . . . . . . . . . . . . . . . . . . . . . . . . . . . . . . . . . . . . . . . . . . . . . 53
Social ParticipationDarren McCausland, Rachael Carroll,Philip McCallion and Mary McCarron2

2424
Evidence from the first Ten Years of The Intellectual Disability Supplement to The Irish Longitudinal Study on Ageing (IDS-TILDA)
2.1 Key findings• Older people with intellectual disabilities continued to be more socially excluded than
their counterparts in the general population; while those with severe-profound levels of ID and those living in institutional settings remain the most excluded across practically all measures.
• Overall there has been a decrease in the number of older people with ID who live in close proximity to their family members.
• Respondents with the most frequent family contact continued to be male, younger, with milder levels of ID and living in community settings; respondents with severe-profound ID and those living in institutional settings continued to have the least family contact.
• The vast majority of respondents had friends (92.4%, n=560), the most common type being a co-resident friend (71.8%, n=402); however, a majority also reported they had friends outside their home (62.0%, n=347), and a similar number reported their keyworker/support staff were their friends (62.5%, n=350).
• Just over half (56.6%, n=317) reported that they had a best friend and almost two-thirds (63.2%, n=187) said that their best friend was someone with an intellectual disability.
• Three-quarters of respondents (77.6%, n=256) had contact at least once a week with non-resident friends and a further 10.9% (n=36) had monthly contact; overall the rate of regular contacts increased by 4.8% between waves 2 and 3.
• The vast majority of older people with ID continued to engage in a broad range of social activities and most do these activities within their local communities; while the most popular organisations were ‘Sports, Social or Leisure Club’, ‘Arts or Music’ and ‘Advocacy Group’. ‘Special Olympics’ fell from the first to fourth most popular between Waves 1 and 3.
• There was a significant drop in the rate of giving support to family between Wave 2 (17.6%, n=118) and Wave 3 11.9% (n=68); while there was a small increase in the rate of helping friends and neighbours; however, older people with ID continued to have lower rates of providing help and support than the general older population.
• Four out of five respondents reported a sense of belonging to their local community.
2 Social Participation

2525
Social Participation
• Older people with ID continue to be dependent on others for their transport, in contrast to the general older population. Overall, 92.7% (n=523) were driven as a passenger (just one person reported driving themselves), while just 29.7% (n=145) used bus transport.
• The vast majority of respondents (96.4%, n=556) said that the day activity they described was what they had wanted to do.
• Just over a quarter of respondents felt that a lack of transport facilities in their area affected their lifestyle (25.2%, n=111), and that they would like to use more public transport (26.7%, n=106).
• Half of respondents (50.0%, n=294) reported they had not spent any full days at home in the previous week, and a further 17% (n=100) spent just one full day at home; however, 6.1% (n=36) had not left the house at all in the previous week; while most who didn’t leave the house for at least one day had to stay at home for reasons other than their choice.
2.2 IntroductionPrevious waves of IDS-TILDA have identified that many people with ID live active social lives within both their local communities and other settings. However, comparison with the general older population (largely through TILDA data) has also highlighted the existence of disparities between the social and community participation of older people with ID and the general population. Furthermore, previous waves of IDS-TILDA have shown that these disadvantages are most keenly felt amongst people with more severe levels of intellectual disability and complex needs, those who continue to live in institutional residences, and the oldest of those ageing with ID.
The context for assessing the social participation for older adults with ID in Ireland continues to be provided by policy developments on deinstitutionalisation and community living (Health Service Executive, 2011), the individualisation of services (Department of Health, 2011, 2012), and the mainstreaming and personalisation of day activity (Health Service Executive, 2012); while generic policies on ageing provide a comparative context even though older people with ID tend to be overlooked (Department of Health, 2013).
Within this chapter we provide an overview of key measures such as the makeup of social networks, types and frequencies of social contacts, engagement in social activities, and the different facilitators and barriers to participation for this population. Additional measures in Wave 3 assessed more qualitative aspects of participation, most notably friendship quality and community belonging, offering a fuller picture of the social lives of people with ID as they age in Ireland.

Evidence from the first Ten Years of The Intellectual Disability Supplement to The Irish Longitudinal Study on Ageing (IDS-TILDA)
2626
2.3 Social connectionsThis section begins by looking at the connections that respondents had with family and with friends in Wave 3. As in previous waves, we asked people about what family they have, the proximity of their family members, and the type and frequency of contact that they had with those family members. With regard to friends, new questions were added to Wave 3 to further explore the friendship networks of participants, while type and frequency of contacts were also examined.
2.3.1 Connections with family2.3.1.1 Family networks
The proportion of respondents who reported having no family at all remained very low at just 3.1% (n=19), which was a slight decline in absolute terms since Wave 2 (3.7%, n=26). However, while the vast majority have family, very few reported having either a spouse/partner (0.5%, n=3) or a child (0.2%, n=1). By contrast, TILDA recently reported that 88% of the community-dwelling general older population in Ireland were either married (65.7%) or had previously been married (22.3%), and many also have children (85% of those aged 54-64 years) and grandchildren (Donoghue, Orr, Leahy, & Kenny, 2017). As might be expected with an ageing population, the proportion of respondents who had parents and aunts/uncles has continued to decline; while siblings and nieces/nephews were the most commonly reported family in respondents’ networks (Figure 2.1 below). Respondents who reported having siblings had an average of two sisters (mean=2.26) and two brothers (mean=2.27).
Figure 2.1 Family networks (Waves 2 & 3)
0102030405060708090
Wave 2 Wave 3
Note: Wave 2 n = 699; Missing Obvs = 9; Wave 3 n = 607; Missing Obvs = 2; Error bars correspond to95% confidence intervals

2727
2.3.1.2 Proximity of family
Respondents were asked where their family members lived. Table 2.1 below shows how close to respondents selected family members lived, with comparison to Wave 2.
Table 2.1 Proximity of family members (Waves 2 & 3)
Lives With Same Neighbourhood OutsideNeighbourhood
Wave 2 Wave 3 Wave 2 Wave 3 Wave 2 Wave 3
Sister (nw1=531; nw2=449)5.1
(3.5-7.3)3.6
(2.2 -5.7)8.9
(6.7-11.6)5.5
(3.8 – 8.1)86.1
(82.9-88.8)
90.8(87.9 – 93.2)
Brother (nw1=488; nw2=422)4.5
(3.0-6.7)4.7
(3.1-7.2)11.1
(8.6-14.2)7.3
(5.2-10.2)84.4
(80.9-87.4)87.9
(84.5-90.7)
Niece/nephew (nw1=367; nw2=294)
2.5(1.3-4.6)
1(0.3-.3.0)
9.5(6.9-13.0)
8.2(5.5-11.9)
88(84.3-90.9)
90.8(87.0-93.6)
Cousin (nw1=173; nw2=133)0
(0.0-2.2)0
(0.0-2.8)6.9
(4.0-11.7)3.8
(1.6-8.5)93.1
(88.3-96.0)96.2
(91.5-98.4)
Mother (nw1=172; nw2=114)19.8
(14.5-26.4)19.3
(13.1-27.5)8.1
(4.9-13.2)8.8
(4.8-15.4)72.1
(65.0-78.3)71.9
(63.1-79.4)
Aunt/uncle (nw1=109; nw2=73)0.9
(0.2-5.0)0
(0.0-5.00)11
(6.4-18.3)9.6
(4.7-18.5)88.1
(80.7-92.9)90.4
(81.5-95.3)
Father (nw1=65;nw2=47)21.5
(13.3-33.0)21.3
(12.0-34.9)10.8
(5.3-20.6)4.3
(1.2-14.2)67.7
(55.6-77.8)74.5
(60.5-84.7)
Overall there has been an increase in the number of older people with ID who do not live in close proximity to their family members. Further analysis of the remaining Wave 3 sample is needed to determine whether these patterns are due to changes in living arrangements by respondents. Reported rates for the general population by TILDA suggest that fewer older people with ID live in close proximity to members of their family, with two-thirds of the general older population living in close proximity to their children alone (i.e. either living with or in the same county as each other) (McCausland, McCallion, Brennan, & McCarron, 2017; Ward & McGarrigle, 2017). Given that Wave 2 data identified proximity to family as the strongest influence of family contact (McCausland et al., 2017), any decrease in proximity is a cause for concern for the impact it may have on wider participation.
Social Participation
Evidence from the first Ten Years of The Intellectual Disability Supplement to The Irish Longitudinal Study on Ageing (IDS-TILDA)
2828
2.3.1.3 Contacts with family
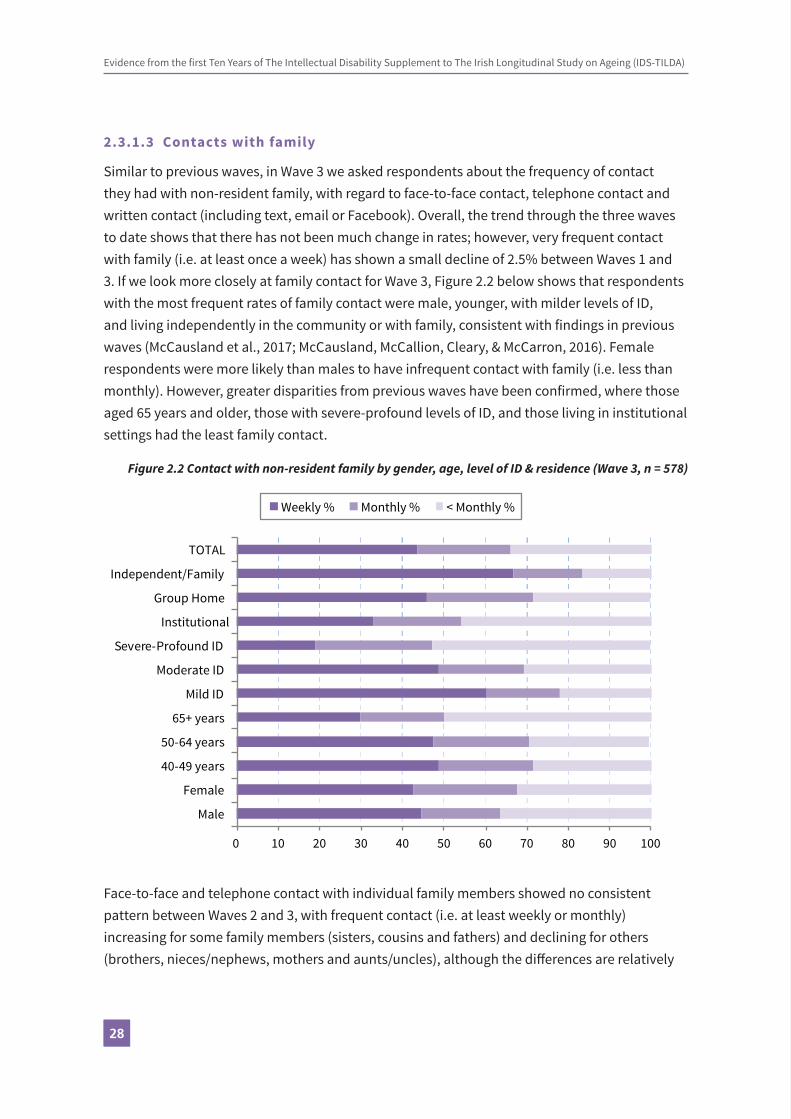
Similar to previous waves, in Wave 3 we asked respondents about the frequency of contact they had with non-resident family, with regard to face-to-face contact, telephone contact and written contact (including text, email or Facebook). Overall, the trend through the three waves to date shows that there has not been much change in rates; however, very frequent contact with family (i.e. at least once a week) has shown a small decline of 2.5% between Waves 1 and 3. If we look more closely at family contact for Wave 3, Figure 2.2 below shows that respondents with the most frequent rates of family contact were male, younger, with milder levels of ID, and living independently in the community or with family, consistent with findings in previous waves (McCausland et al., 2017; McCausland, McCallion, Cleary, & McCarron, 2016). Female respondents were more likely than males to have infrequent contact with family (i.e. less than monthly). However, greater disparities from previous waves have been confirmed, where those aged 65 years and older, those with severe-profound levels of ID, and those living in institutional settings had the least family contact.
Figure 2.2 Contact with non-resident family by gender, age, level of ID & residence (Wave 3, n = 578)
0 10 20 30 40 50 60 70 80 90 100
Male
Female
40-49 years
50-64 years
65+ years
Mild ID
Moderate ID
Severe-Profound ID
Institutional
Group Home
Independent/Family
TOTAL
Weekly % Monthly % < Monthly %
Face-to-face and telephone contact with individual family members showed no consistent pattern between Waves 2 and 3, with frequent contact (i.e. at least weekly or monthly) increasing for some family members (sisters, cousins and fathers) and declining for others (brothers, nieces/nephews, mothers and aunts/uncles), although the differences are relatively

2929
small in most cases. What is notable is that people continue to have the highest rates of frequent contact with their mothers and fathers. Fewer amongst this ageing population still have living parents, therefore a concern for the future is that many older people with ID lose the people with whom they have their most frequent social contacts. There has been little overall change in the level of phone contact since Wave 2, with the majority of respondents (between 58.1% and 92.7%) continuing to have infrequent phone contact with all types of family.
2.3.2 Connections with friends2.3.2.1 Friends networks
Previously we had asked about non-resident friends, and found in Wave 2 that a substantial number (43.4%, n=301) reported having no friends outside their home. However, this overlooked co-resident friends. Wave 3 included new questions about whether people had friends, whether they had a ‘best friend’ and the identities of their best friends. When asked if they had any friends, the vast majority of respondents (92.4%, n=560) indicated that they did. When looking within the sample (Figure 2.3 below), we can see differences with regard to level of ID and type of residence. Respondents with mild ID (97.1%) were more likely to have friends than those with moderate (93.4%) and severe-profound ID (85.3%); and respondents living in independent/family residences (96.8%) were more likely to have friends than people living in community group homes (95.1%) and those living in institutions (88.3%).
Figure 2.3 Do you have friends? By age, gender, level of ID and type of residence (Wave 3, n = 606)
0 10 20 30 40 50 60 70 80 90 100
Male
Female
40-49 years
50-64 years
65+ years
Mild ID
Moderate ID
Severe -Profound ID
Institutional
CGH
Independent/Family
TOTAL
Have friends % Do not have friends %
Social Participation
Evidence from the first Ten Years of The Intellectual Disability Supplement to The Irish Longitudinal Study on Ageing (IDS-TILDA)
3030
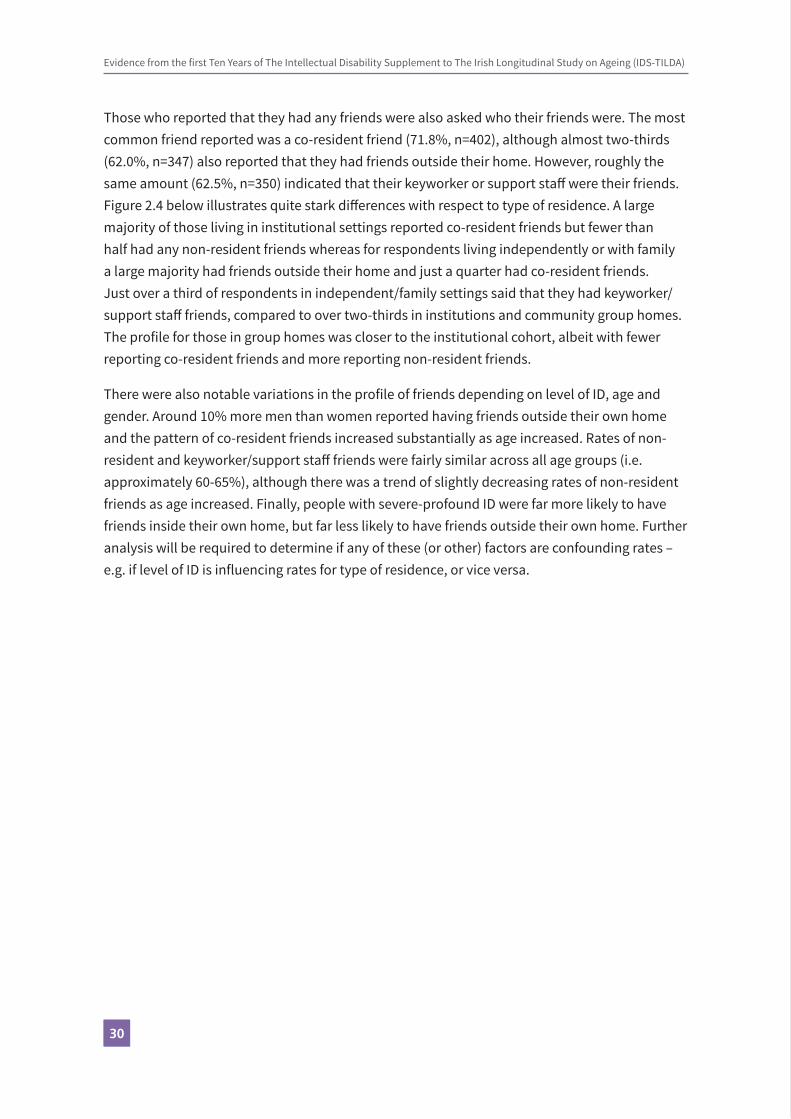
Those who reported that they had any friends were also asked who their friends were. The most common friend reported was a co-resident friend (71.8%, n=402), although almost two-thirds (62.0%, n=347) also reported that they had friends outside their home. However, roughly the same amount (62.5%, n=350) indicated that their keyworker or support staff were their friends. Figure 2.4 below illustrates quite stark differences with respect to type of residence. A large majority of those living in institutional settings reported co-resident friends but fewer than half had any non-resident friends whereas for respondents living independently or with family a large majority had friends outside their home and just a quarter had co-resident friends. Just over a third of respondents in independent/family settings said that they had keyworker/support staff friends, compared to over two-thirds in institutions and community group homes. The profile for those in group homes was closer to the institutional cohort, albeit with fewer reporting co-resident friends and more reporting non-resident friends.
There were also notable variations in the profile of friends depending on level of ID, age and gender. Around 10% more men than women reported having friends outside their own home and the pattern of co-resident friends increased substantially as age increased. Rates of non-resident and keyworker/support staff friends were fairly similar across all age groups (i.e. approximately 60-65%), although there was a trend of slightly decreasing rates of non-resident friends as age increased. Finally, people with severe-profound ID were far more likely to have friends inside their own home, but far less likely to have friends outside their own home. Further analysis will be required to determine if any of these (or other) factors are confounding rates – e.g. if level of ID is influencing rates for type of residence, or vice versa.

3131
Figure 2.4 Types of friends by gender, age, level of ID and residence (Wave 3)
0 10 20 30 40 50 60 70 80 90 100
Independent / Family
CGH
Institutional
Severe - Profound ID
Moderate ID
Mild ID
65+ years
50 - 64 years
< 50 years
Female
Male
Total
Co-resident friends % Non-resident friends %
KW / Support sta� friends % Other type of friends %
Note: n = 560; Error bars correspond to 95% confidence intervals
Respondents who reported that they had any friends were also asked if they had a ‘best friend’ (self-defined or self-identified by respondents). Just over half (56.6%, n=317) reported that they did have a best friend. Figure 2.4 earlier showed that 3.8% fewer men than women reported having any friends; however, as may be seen in Figure 2.5, this gap almost doubles with regard to having a best friend, where 6.9% fewer men said they had a best friend. We also previously saw little difference with regard to age and having any friends; but this changes dramatically
Social Participation

Evidence from the first Ten Years of The Intellectual Disability Supplement to The Irish Longitudinal Study on Ageing (IDS-TILDA)
3232
when we consider best friends, with a sharp fall in rates between the youngest age group (40-49 years) (73.4%) to the 50-64 years group (54.9%), and overall a difference of 20% between the youngest group and those aged 65 years or older (53.4%). There was also a sharp drop in rates of having a best friend between respondents with mild (61.9%) or moderate (60.0%) levels of intellectual disability and those with severe-profound ID (43.9%). There was also a substantial gap (20.4%) in rates of having a best friend between people living in independent/family residences (68.5%) and those in institutions (48.1%), while respondents living in community group homes (60.5%) were more comparable to the former.
Figure 2.5 Have a best friend by age, gender, level of ID and type of residence (n = 560)
0 10 20 30 40 50 60 70 80 90 100
Male
Female
40-49 years
50-64 years
65+ years
Mild ID
Moderate ID
Severe-Profound ID
Institutional
CGH
Independent/Family
TOTAL
Have a best friend % Do not have a best friend %
Respondents who said they had a best friend were asked about the identity of their best friend, and whether or not it was someone they lived with. Of these, almost two-thirds (63.2%, n=187) said that their best friend was someone with an intellectual disability, which was by far the most common response (Table 2.2 below). After this, other types of best friend were: carer/service provider (15.9%, n=47); family (8.4%, n=25); other friend (7.1%, n=21); and work colleague (5.4%, n=16). In addition, three out of five respondents (60.5%, n=179) said that their best friend was someone they did not live with; while two out of five (39.5%, n=117) reported that their best friend was someone they lived with.

3333
Table 2.2 Identity and location of best friend by age, gender, level of ID and type of residence
Identity of Best FriendLocation of Best Friend
n Person with ID %
Service Provider Family
Work Colleague
%
Other Friend
Co-Resident
% % % % %
Male 119 68.9 9.2 7.6 5.9 8.4 37(60.1-76.5) (5.2-15.8) (4.0-13.8) (2.9-11.6) (4.6-14.8) (28.8-45.9)
Female 117 59.3 20.3 9 5.1 6.2 41.2(52.0-66.3) (15.1-26.9) (5.6-14.2) (2.7-9.4) (3.5-10.8) (34.3-48.6)
40-49 years 45 64.4 20 6.7 6.7 2.2 31.1(49.8-76.8) (10.9-33.8) (2.3-17.9) (2.3-17.9) (0.4-11.6) (19.5-45.7)
50-64 years 184 64.1 13 9.2 6 7.6 39.7(57.0-70.7) (8.9-18.7) (5.8-14.3) (3.4-10.4) (4.6-12.4) (32.9-46.9)
65+ years 67 59.7 20.9 7.5 3 9 44.8(47.7-70.6) (12.9-32.1) (3.2-16.3) (0.8-10.2) (4.2-18.2) (33.5-56.6)
Mild ID 82 63.4 9.8 9.8 8.5 8.5 40.2(52.6-73.0) (5.0-18.1) (5.0-18.1) (4.2-16.6) (4.2-16.6) (30.3-51.1)
Moderate ID 134 58.2 23.1 8.2 5.2 5.2 33.6(49.7-66.2) (16.8-31.0) (4.6-14.1) (2.6-10.4) (2.6-10.4) (26.1-41.9)
Severe-Profound 52 71.2 13.5 7.7 3.8 3.8 55.8(57.7-81.7) (6.7-25.3) (3.0-18.2) (1.1-13.0) (1.1-13.0) (42.3-68.4)
Institutional 98 66.3 23.5 6.1 3.1 1 56.1(56.5-74.9) (16.2-32.8) (2.8-12.7) (1.0-8.6) (0.2-5.6) (46.3-65.5)
CGH 135 67.4 16.3 6.7 2.2 7.4 37(59.1-74.7) (11.0-23.4) (3.5-12.2) (0.8-6.3) (4.1-13.1) (29.4-45.4)
Independent/ 63 49.2 3.2 15.9 15.9 15.9 19(37.3-61.2) (0.9-10.9) (8.9-26.8) (8.9-26.8) (8.9-26.8) (11.2-30.4)
TOTAL 296 63.2 15.9 8.4 5.4 7.1 39.5(57.5-68.5) (12.2-20.5) (5.8-12.2) (3.4-8.6) (4.7-10.6) (34.1-45.2)
Male respondents were more likely (+9.6%) than females to have a best friend with an ID and less likely (-11.1%) to consider a service provider their best friend. There was no discernible pattern regarding age and identity of best friends; however, there was a noticeable decline in having best friends from outside one’s home as age increased, falling by 13.7% between the youngest and oldest cohorts. With regard to level of ID, again there was no overall pattern, yet it was striking that respondents with severe-profound ID had the highest rates of any cohort of having best friends with ID, and a majority of their best friends were co-resident – with just 44.2% of best friends from outside their own homes. This was second lowest only to people living in institutional settings, of whom just 43.9% had non-resident best friends.
Social Participation

Evidence from the first Ten Years of The Intellectual Disability Supplement to The Irish Longitudinal Study on Ageing (IDS-TILDA)
3434
This group also had the highest rate of service provider best friends (23.5%). On the other hand, people living in independent/family residences were the only cohort not to have a majority of best friends with ID (49.2%), and to have what appears to be a more diverse range of best friends; while in addition this group also had by far the highest rates of non-resident best friends (81.0%).
2.3.2.2 Contacts with friends
Respondents were again asked in Wave 3 about the frequency of contacts (face-to-face, telephone and written) that they had with their non-resident friends. Figure 2.6 below illustrates the changes between Waves 2 and 3 in the frequency of contacts (of any type) that people had with these friends. We can see overall that respondents tended to have fairly regular contact with their non-resident friends, with over three-quarters (77.6%, n=256) having contact at least once a week and a further 10.9% (n=36) having contact at least once a month. We can also see that the rate of regular contacts has increased by 4.8% between Waves 2 and 3.
Figure 2.6 Contact with non-resident friends (Waves 2 & 3)
0
20
40
60
80
100
Weekly Monthly < Monthly
Wave 2 Wave 3
Note: Wave 2 n = 390; Wave 3 n =330; Error bars correspond to 95% confidence intervals

3535
Figure 2.7 below examines the differences in rates of contact with non-resident friends based on gender, age, level of ID and type of resident.
Figure 2.7 Contact with non-resident friends by gender, age, level of ID and residence (Wave 3, n = 330)
0 10 20 30 40 50 60 70 80 90 100
MaleFemale
40-49 years50-64 years
65+ yearsMild ID
Moderate IDSevere-Profound ID
InstitutionalGroup Home
Independent/FamilyTOTAL
Weekly % Monthly % < Monthly %
From this we can see that there is little variation in frequency of contact between different types of residence. With respect to gender, male respondents reported higher rates of very frequent contact (i.e. at least weekly), yet there was little difference in rates of infrequent contact (i.e. less than monthly). Similarly, in relation to age, respondents aged 65 years and above reported substantially lower rates of weekly contact than younger respondents, but rates of infrequent contact showed little difference between all age groups. The most notable differences in frequency of contact related to level of ID. There was a steady decline in very frequent contact as ID became more severe, with a difference of 14.9% between respondents with mild ID and those with severe-profound ID. Likewise, people with severe-profound ID had much higher rates of infrequent contact (20.4%) compared to those with mild ID (7.3%). It should be borne in mind when interpreting these results however, that they only represent contacts that respondents had with non-resident friends. As we have reported above (Figure 2.4), co-resident friends were actually the most common type of friend reported amongst the sample overall (although other types were more common amongst some sub-groups). As such, the contact data for friends reported here do not represent the full range of contacts with all friends.
Social Participation
Evidence from the first Ten Years of The Intellectual Disability Supplement to The Irish Longitudinal Study on Ageing (IDS-TILDA)
3636
2.4 Type and quality of relationships
2.4.1 Confidants
As in previous waves, respondents were asked if they had a confidant (i.e. someone they could talk to about private matters) and, if so, who that person was. This question was asked only to participants who could self-report (n=324), the vast majority of whom (95.7%, n=310) said that they had a confidant, which was almost identical to Wave 2 (95.1%, n=327). This equated to 50.9% of the full sample having a confidant, an increase of 7.5% since wave 2 (43.4%). If we look at the identities of the confidants that respondents had (Figure 2.8 below) we can see that between Wave 1 and Wave 3 keyworker/staff have been by far the most frequent confidant for respondents, and has increased to a point where four out of five respondents report confiding in their keyworker/staff member. Siblings and friends were the next most frequently cited confidants, and both again have increased in importance since Wave 1 – with friends in particular more than doubling. At just 5.8%, the rate of respondents confiding in parents has continued to decline, perhaps reflective of an ageing population.

3737
Figure 2.8 Identity of respondents’ confidants (Waves 1-3)
0 10 20 30 40 50 60 70 80 90
Other
Neighbour
Aunt/Uncle
Cousin
Advocate
Spouse/Partner
Parent
Friend
Sibling
Keyworker/Sta�
Wave 1 % Wave 2 % Wave 3 %
Note: Wave 1 n = 506; Wave 2 n = 327; Wave 3 n = 310; Error bars correspond to 95% confidence intervals
Examining the variations between cohorts within the sample for the top three reported confidants (i.e. keyworker/staff, sibling and friend), we can see some differences between groups (Figure 2.9 below). Female respondents were slightly more likely to confide in keyworker/staff and friends, while males were more likely to confide in their siblings. Respondents aged 65 years and above reported higher rates of confiding in keyworker/staff and friends, and lower rates of confiding in siblings, than the two younger groups. People with mild ID had substantially higher rates of confiding in siblings and friends than those with moderate or severe/profound ID, while rates of confiding in keyworker/staff increased steadily as level of ID became more severe. Finally, some of the more pronounced differences were seen between
Social Participation

Evidence from the first Ten Years of The Intellectual Disability Supplement to The Irish Longitudinal Study on Ageing (IDS-TILDA)
3838
people living in different types of residence. Respondents living in independent/family settings were far less likely to confide in keyworker/staff than those living in formal care settings (group homes or institutional); yet keyworker/staff remained their most frequently identified confidant. They were also far more likely to confide in a sibling and marginally more likely to confide in a friend.
Figure 2.9 Most common confidants by age gender, age, level of ID and residence
0 10 20 30 40 50 60 70 80 90 100
Instirutional
CGH
Independent/Family
Severe - Profound ID
Moderate ID
Mild ID
65+ years
50 - 64 years
< 50 years
Female
Male
Total
Friend Sibling Keyworker/Sta�
Note: Wave 3 n = 310; Error bars correspond to 95% confidence intervals
2.4.2 Support to family
In Wave 3 a total of 11.9% (n=68) said that they provide support to a member of their family, which was a significant drop from rates reported in Wave 2 (17.6%, n=118). Figure 2.10 shows the family members to whom these respondents provided support, with changes since Wave 2.

3939
Figure 2.10.Family members to whom respondents provide support
0
10
20
30
40
50
60
70
80
Sibling Mother Father Aunt/Uncle Cousin Other
Wave 2 Wave 3
Note: Wave 2 n = 118; Wave 3 n =68; Error bars correspond to 95% confidence intervals
It seems that overall there has been a drop in rates of providing support to family amongst this sample, perhaps as a consequence of ageing and a reduced ability to continue providing support, as well as the loss of parents and other family members through age. This is reflected in a drop in the proportion helping parents and a parallel increase in the proportion who provide help to siblings. The factors behind this require further examination in future waves.
Participants who said they supported family were also asked what type of support they provide. Figure 2.11 below illustrates these responses in comparison with Wave 2 findings. This shows a marked decline in the rates of providing specific types of support to family since Wave 2, reflecting the general fall in rates of supporting family. The most common types of support to family remained emotional support, help with shopping and day to day support. Finally, the general decline in providing support to family may also be reflected in the levels of satisfaction with providing support. While all respondents who provided support said they were satisfied with doing so, the rate of those who said they were ‘very satisfied’ fell from 73.9% in Wave 2 to 59.0% in Wave 3.
While there are no directly comparable rates to these for the general older population, we can see from data reported by TILDA that older people within the general population provide a much broader and more intensive level of support to family members. For example, half (51%) of the general older population with living parents provided financial help; almost a quarter (23%) provided support with basic personal care (average of 23 hours per week), and 43% helped them with other activities (average of 13 hours per week); almost half (48%) provided financial support to children; and 41% who had grandchildren provided care for them (Ward & McGarrigle, 2017).
Social Participation

Evidence from the first Ten Years of The Intellectual Disability Supplement to The Irish Longitudinal Study on Ageing (IDS-TILDA)
4040
Figure 2.11 Type of support provided to family (Waves 2 & 3)
0 10 20 30 40 50 60 70 80
Other type of support
Full support (do everything)
Support with mobility
Financial support
Help with remembering things
Day to day support
Help with shopping
Emotional Support
Wave 2 Wave 3
Note: Wave 2 n = 116; Wave 3 n = 68; Error bars correspond to 95% confidence intervals
2.4.3 Help to friends & neighbours
Participants were also asked about help that they regularly gave to and received from friends and neighbours. Overall rates of both giving (16%, n=94) and receiving help (16.4%, n=96) from friends and neighbours has increased in the six years since Wave 1. While this small increase is to be welcomed, rates of both giving and receiving help from friends and neighbours still lag behind rates for the older general population, previously reported by TILDA as 23% and 17% respectively for giving and receiving help (Barrett, Savva, Timonen, & Kenny, 2011). Looking at differences between cohorts within the IDS-TILDA Wave 3 sample, we can see from Figure 2.12 below that male respondents were more connected with friends and neighbours in this way than female respondents.

4141
Figure 2.12 Help to/from friends and neighbours by gender, age, level of ID and residence (Wave 3)
0 5 10 15 20 25 30 35 40 45 50
Instutional
Group Home
Independent / Family
Severe - Profound ID
Moderate ID
Mild ID
65+ yrs
50 - 64 yrs
< 50 yrs
Female
Male
Total
Help Received % Help given %
Note: n = 588; Error bars correspond to 95% confidence intervals
The most significant differences related to type of residence and level of ID, where people living in independent/family settings and those with mild ID were most involved in giving and receiving help, with substantially higher rates than those living in group homes or institutions and those with moderate to profound levels of ID. With regard to age, there was little difference in rates of either giving or receiving help.
2.4.4 Friendship quality
Wave 3 saw the addition of new questions designed to assess the quality of friendships that older people with ID have. This included two scales on the closeness (Bukowski, Hoza, & Boivin, 1994) and intimacy (Mendelson & Aboud, 1999) of relationships that respondents reported with their best friend (see section 2.3.2.1 above). Both scales were adapted to simplify the available response options following piloting of questions new to Wave 3. The adapted scales each had three response options to five separate statements about respondents’ relationship with their best friend. Each statement resulted in a score of 1 (not at all), 2 (a little) or 3 (a lot). Table 2.3 below shows analysis of the mean scores of respondents. Because the scales have been adapted we are unable to compare the absolute scores here to the general population. However, the mean scores overall suggest that the relationship respondents had with their best friends was both close and intimate (between ‘a little’ and ‘a lot’). When comparing mean scores of different cohorts within the sample, female respondents scored higher on both scales, indicating better quality relationships than male respondents. Differences with respect to age
Social Participation

Evidence from the first Ten Years of The Intellectual Disability Supplement to The Irish Longitudinal Study on Ageing (IDS-TILDA)
4242
appeared small, yet it was interesting that the group aged 65 years and above scored highest on both scales. There appeared to be a pattern in relation to level of ID and friendship quality, where respondents with severe/profound ID had significantly lower scores than those with mild and moderate levels of ID. With respect to residence, people living in institutional settings scored lowest on both scales (although matched the score of people living in group homes on the closeness scale). Clearly, findings about friendship quality require more in-depth analysis and future papers will address this.
Table 2.3 Mean friendship quality scores by gender, age, level of ID and residence (Wave 3)
Friendship Closeness(n=198)
Mean [95% CI]
Friendship Intimacy (n=177)Mean [95% CI]
Male 2.65 [2.53-2.75] 2.25 [2.08-2.43]
Female 2.68 [2.60-2.74] 2.50 [2.40-2.63]
40-49 years 2.61 [2.34-2.80] 2.47 [2.25-2.89]
50-64 years 2.67 [2.60-2.74] 2.33 [2.22-2.46]
65+ years 2.69 [2.64-2.85] 2.58 [2.42-2.75]
Mild ID 2.68 [2.61-2.79] 2.40 [2.24-2.57]
Moderate ID 2.65 [2.56-2.73] 2.42 [2.31-2.57]
Severe-Profound ID 2.54 [2.23-2.85] 2.15 [1.90-2.78]
Independent/Family 2.73 [2.59-2.81] 2.41 [2.16-2.59]
Group Home 2.65 [2.55-2.72] 2.43 [2.32-2.58]
Institutional 2.65 [2.54-2.78] 2.32 [2.20-2.63]
TOTAL 2.67 [2.62-2.73] 2.40 [2.33-2.52]
2.5 Engagement in social and community activity
2.5.1 Social and leisure activities
The number of respondents who reported that they engage in some kind of social or leisure activity remained very high. Rates of participation in all but one specific social or leisure activity increased quite substantially between Waves 1 and 3. Figure 2.13 below shows changes in rates over the course of the study, and illustrates the large and varied range of activities that respondents engaged in. A majority of respondents identified twelve activities in which they engaged; while the most common activities were again going out for coffee, eating out, and going shopping.

4343
Figure 2.13 Social and leisure activities (Waves 1 & 3)
0 10 20 30 40 50 60 70 80 90 100
Wave 1% Wave 3%
Go out for co�eeEat out
Go shoppingGo to the hairdresser
Go to church/place of worshipEngage in hobbies/creative activitiesVisit family and friends in their home
Go to the cinemaGo to a theatre, concert or opera
Go to the pub for a drinkTalk to family or friends on the phoneParticipate in sports activities/events
Go to social clubs (e.g. bingo, cards)Go to a sports event
Go to the libraryGo to an art gallery or museum
Perform in local arts groups or choirsDo voluntary work
Note: Wave 1 n = 753; Wave 3 n = 577; Error bars correspond to 95% confidence intervals
In Wave 3 we found that while the rate of doing social and leisure activities increased from Wave 1, the proportion of respondents who did these activities in their local community actually decreased. When we examined the setting for the social activities that respondents engaged in (i.e. local community, ID service, or both), we found that respondents did all but three activities mostly within their local communities. Up to a third of respondents did activities in both their local community and ID service settings; and when both settings are included a majority of respondents did all activities within their local community setting. Looking at changes since Wave 1 (Figure 2.14 below) we can see that across all comparable activities there has been a drop in the proportion of respondents who reported doing these activities solely in their local community. In the majority of cases the fall in rates is fairly substantial. This may be a worrying trend, and one which goes against the policy push towards greater community integration. Quite possibly this trend is specific to this particular cohort and related to the ageing sample; however, it also comes within a context of increased social activities in general amongst respondents. Further analysis in future papers is required to better understand the significance of these changes between Waves 1 and 3.
Social Participation

Evidence from the first Ten Years of The Intellectual Disability Supplement to The Irish Longitudinal Study on Ageing (IDS-TILDA)
4444
Figure 2.14 Social and leisure activities done solely in the local community (Waves 1 & 3)
0 10 20 30 40 50 60 70 80 90 100
Perform in local arts groups or choirs
Go to an art gallery or museum
Go to the library
Go to a sports event
Go to social clubs (e.g. bingo, cards)
Participate in sports activities/events
Talk to family or friends on the phone
Go to the pub for a drink
Go to a theatre, concert or opera
Go to the cinema
Visit family and friends in their home
Engage in hobbies/creative activities
Go to church/place of worship
Go to the hairdresser
Go shopping
Eat out
Go out for co�ee
Wave 1 % Wave 3 %
Note: Wave 1 n = 753; Wave 3 n = 577; Error bars correspond to 95% confidence intervals
2.5.2 Membership of organisations
While the rate of membership of organisations, clubs and societies has increased slightly from 43.6% (n=304) in Wave 2 to 44.3% (n=269) in Wave 3, this remains down overall on the 47.0% (n=354) rate of membership reported at Wave 1. There have been a number of changes with regard to the most popular organisations amongst respondents. Whereas in previous waves Special Olympics was the most popular organisation, with 19.3% (n=145) membership in Wave 1, this has fallen to just 11.0% (n=67) and was only the fourth most popular organisation in Wave 3. The most popular organisations to be members of in Wave 3 were: ‘Sports, Social or Leisure Club’, ‘Arts or Music’ and ‘Advocacy Group’.
2.5.3 Community belonging
As reported above, we continued in Wave 3 to examine rates of participation in social activities and group membership, to give an indication of the degree of community participation amongst respondents. However, in Wave 3 we also sought to determine the degree to which respondents felt they were a part of their local communities. As such, to assess community belonging,

4545
participants were asked to name their local community and if they felt they were part of that community. In response, 42.4% (n=247) said they feel part of their community ‘a lot’ and a further 36.4% (n=212) said ‘a little’. This means that almost four out of five respondents felt part of their local community to some degree, while around one in five (21.1%, n=123) did not have this feeling of belonging. When we look at sub-groups within the sample (Figure 2.15) we can see that the biggest differences related to type of residence and to level of ID. Respondents with severe-profound levels of ID and those living in institutional settings were less likely to feel that they belong to their local community. While there was no clear pattern regarding age and overall feelings of belonging, we can see that a distinct decrease in strong feelings of belonging as age increases (i.e. those who said ‘a lot’).
Figure 2.15 Community belonging by gender, age, level of ID and type of residence (n = 582)
0% 10% 20% 30% 40% 50% 60% 70% 80% 90% 100%
Male
Female
40-49 years
50-64 years
65+ years
Mild ID
Moderate ID
Severe-Profound ID
Independent/Family
Group Home
Institutional
TOTAL
A lot % A little % Not at all %
Social Participation

Evidence from the first Ten Years of The Intellectual Disability Supplement to The Irish Longitudinal Study on Ageing (IDS-TILDA)
4646
2.5.4 Technology and social media
The potential for using technology and social media to enhance the social and community participation of older people with ID has been an untapped resource, as reported in previous waves. Wave 3 shows little change in the rate of engagement with these technologies, with the majority remaining excluded. Around a quarter (26.2%, n=158) reported owning a mobile phone, which has increased only marginally since Wave 1 (22.8%, n=172); while around one in six of these (16.7%, n=26) said that they don’t actually use their phone. Just over one third (34.9%, n=210) reported that they had access to a computer, tablet or smartphone, which was largely unchanged since Wave 2 (35.6%, n=246). However, it appeared that most of these used their device infrequently – with just one in five (19.5%, n=41) reporting that they used it ‘most of the time’, 41.4% (n=87) using it ‘sometimes’, and almost two in five using it either ‘rarely’ (17.1%, n=36) or ‘never’ (21.9%, n=46). This is reflected in the small number who reported using the internet and/or email (12.3%, n=75), even though this has risen marginally through Wave 1 (7.3%, n=55) and Wave 2 (10.5%, n=75). A key reason for this lack of engagement with technology is apparent when we consider the degree of difficulty using technology reported by participants. Three-quarters of respondents (75.3%, n=447) said that they had difficulty with computers in general; although encouragingly this has dropped from 87.4% (n=589) in Wave 2. However, when asked about performing more specific tasks with a computer, higher rates of difficulty emerged.
Table 2.4 shows that, while there have been some improvements in the rates of ability to perform specific tasks, a large majority of respondents are still unable to perform each task, and the greatest difficulty is in using social media, such as Facebook and Twitter, that may be used
to maintain or develop social networks.

4747
Tabl
e 2.
4 Re
port
ed u
se a
nd d
iffic
ulty
usi
ng co
mpu
ters
in W
ave
2 (n
=607
) and
Wav
e 3
(n=4
57)
Task
Can
do, w
ithou
t ass
ista
nce
Can
do, w
ith a
ssis
tanc
eCa
nnot
do
W2
%95
% C
IW
3 %95
% C
IW
2 %95
% C
IW
3 %
95%
CI
W2
%95
% C
IW
3 %
95%
CI
Turn
on
aco
mpu
ter
6.8
5.0-
9.0
7.4
5.4-
10.2
7.9
6.0-
10.3
17.1
13.9
-20.
885
.382
.3-8
7.9
75.5
71.3
-79.
2
Type
nam
e on
a
keyb
oard
10.5
8.3-
13.2
8.1
5.9-
11.0
9.2
7.2-
11.8
16.2
13.1
-19.
880
.276
.9-8
3.2
75.7
71.6
-79.
4
Type
a le
tter
4.8
3.3-
6.8
3.1
1.8-
5.1
6.8
5.0-
9.0
13.3
10.5
-16.
888
.585
.7-9
0.8
83.6
79.9
-86.
7
Look
up
topi
cs
of in
tere
st o
n Go
ogle
1.2
0.6-
2.4
1.8
0.9-
3.4
5.9
4.3-
8.1
96.
7-11
.992
.990
.6-9
4.7
89.3
86.1
-91.
8
Send
an
emai
l0.
50.
2-1.
40.
70.
2-1.
95.
43.
9-7.
56.
84.
8-9.
594
.191
.9-9
5.7
92.6
89.8
-94.
6
Use
soci
al m
edia
0.3
0.1-
1.2
0.9
0.3-
2.2
2.5
1.5-
4.0
2.4
1.3-
4.3
97.2
95.6
-98.
296
.794
.7-9
8.0
Social Participation

Evidence from the first Ten Years of The Intellectual Disability Supplement to The Irish Longitudinal Study on Ageing (IDS-TILDA)
4848
2.5.5 Difficulties engaging in social and community activity
Following on from previous waves, participants were again asked about difficulties they had with social and community participation. Respondents identified difficulties they experienced, firstly, in participating in social activities outside their home and, secondly, in getting around their community. Overall, the rate of difficulty participating in social activities outside the home has continued to increase as the sample ages. At Wave 1, slightly over half reported such difficulties (51.6%, n=382); this has increased to 55.5% (n=331) at Wave 3. If we examine rates for different groups within the sample we can see the most significant differences relate to level of ID and type of residence. Respondents also identified specific difficulties that they have in doing social activities outside their home. Figure 2.16 below illustrates the most common difficulties reported at Wave 3 and how these have changed since Wave 1.
Figure 2.16 Most common difficulties participating in social activities (Waves 1 & 3)
0 10 20 30 40 50 60 70 80
Need someone’s assistance
Health considerations/physical ability
Communication/language problems
Not able to read signs and timetables
Mental health or challenging behaviour
Transport services inadequate/not accessible
Don’t like social activities
Wave 1 Wave 3
Note: Error bars correspond to 95% confidence intervals; Wave 1 n = 382; Wave 3 n = 331
Needing assistance remained the most common difficulty, cited by seven out of ten respondents; while physical ability and health remained the second most common difficulty, with an increased rate up to almost half of all respondents. Increases in both of these may reflect the ageing of the sample between Waves 1 and 3. There has been a drop in that period in the proportion who cite transport services as a difficulty, and an increase in those citing a dislike of social activities. A new category added to Wave 3 [recoded from ‘other’ responses] was mental health (e.g. anxiety in social spaces) and/or challenging behaviours, cited as a difficulty for more than one in ten respondents.

4949
When participants were asked if they experienced any difficulty getting around their communities, they had three possible response options: yes; no; not applicable, don’t travel around my community. Figure 2.17 below shows that the rate of respondents who reported no difficulty has increased slightly overall since Wave 1. In the same period, the rate of respondents who said they do experience such difficulty has dropped by 10%. However, at the same time, the corresponding proportion of respondents who said that they don’t travel around their community has increased by 7.5%, which is very concerning and requires further investigation to examine the profile of these individuals. On the whole, however, it is to be welcomed that more of this ageing sample can travel around their community without difficulty.
Figure 2.17 Difficulty travelling around one’s community (Waves 1 & 3)
05
101520253035404550
No di�iculty Yes (have di�iculty) N/A (don’t travel around community)
Wave 1 Wave 3
Note: Error bars correspond to 95% confidence intervals; Wave 1 n = 744; Wave 3 n = 596
2.5.6 Transport
The most common mode of transport used by respondents in Wave 3 was ‘Driven as a passenger by service staff’ (88.9%, n=498), followed by ‘Taxi/hackney’ (41.1%, n=202) and ‘Driven as a passenger by family’ (37.6%, n=184). While a slight change in the question means that the figures are not directly comparable between waves, we do know that these most commonly used modes of transport have not changed since Wave 1. As such, when it comes to transport, respondents remain largely dependent on other people to travel around, most notably service staff and family members. This contrasts with the pattern of transport use amongst the general older population as reported by TILDA, in which 74% of those aged 50 years and above reported driving regularly, and 39% reported travelling as a passenger in a car (Donoghue et al., 2017).
Social Participation
Evidence from the first Ten Years of The Intellectual Disability Supplement to The Irish Longitudinal Study on Ageing (IDS-TILDA)
5050
Comparing all forms of bus transport used with being driven as a passenger by anyone (staff, family or friends), we can see the dependence older people with ID have on others. In Wave 3, 92.7% (n=523) were driven as a passenger (just one person reported driving themselves), while just 29.7% (n=145) used any form of bus transport. And this has changed only marginally from Wave 1, with just 2% more using buses now and just 2.1% fewer being driven as a passenger. In addition, when using public forms of transport, substantially more reported using taxis/hackneys (41.1%, n=202) than using relatively less expensive bus transport. Just over a quarter of respondents felt that there was a shortage of transport facilities in their area (26.5%, n=118), a decrease of 11.2% since Wave 1 (37.7%, n=244). A similar proportion felt that a lack of transport facilities in their area affected their lifestyle (25.2%, n=111), and that they would like to use more public transport (26.7%, n=106).
2.5.7 Daily occupation
A new series of questions explored what respondents did during the day and at weekends. Participants were asked about the previous day’s activities, and if what they had done was actually what they wanted to do. The vast majority (96.4%, n=556) said that the activity they described was what they wanted to do. So, regardless of the activity, it appears that the vast majority of people were able to engage in daily activity that they wanted to engage in. We also asked participants how many days in the last week they had stayed at home all day – i.e. had not left the house. Half of respondents (50.0%, n=294) reported that they had not spent any full days at home in the previous week (i.e. had been outside every day), and a further 17% (n=100) had spent just one full day at home. This means that over two-thirds of respondents (67.0%, n=394) spent at most one entire day at home. At the other end of the scale, 15.8% (n=93) reported that they had spent most of the week (i.e. 4 days or more) at home all day; while 6.1% (n=36) had not left the house at all in the previous week. Respondents who had spent at least one day at home were probed as to why they had not left the house on those particular days. The most common reason for staying at home all day was personal choice (43.0%, n=125). This was followed by 28.9% (n=84) who cited staff/resource issues, while around one in ten (11.7%, n=34) had not left the house due to ill health (Figure 2.18).
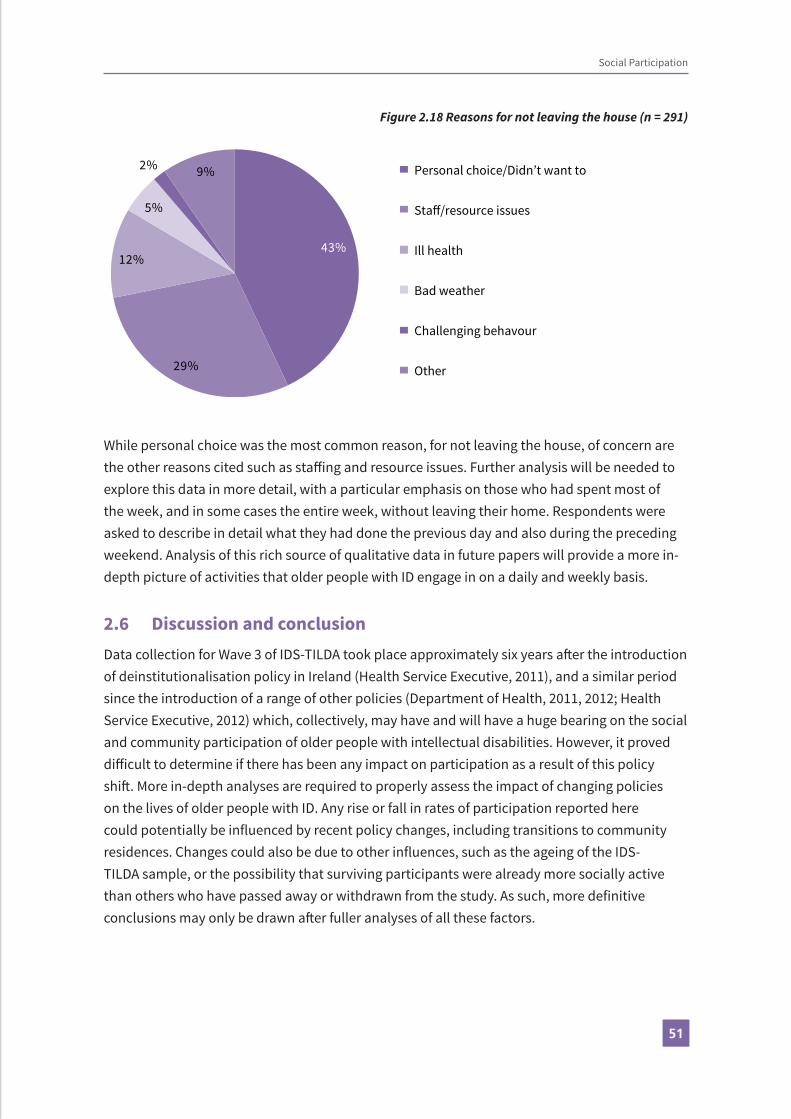
5151
Social Participation
Figure 2.18 Reasons for not leaving the house (n = 291)
43%
29%
12%
5%
2% 9% Personal choice/Didn’t want to
Sta�/resource issues
Ill health
Bad weather
Challenging behavour
Other
While personal choice was the most common reason, for not leaving the house, of concern are the other reasons cited such as staffing and resource issues. Further analysis will be needed to explore this data in more detail, with a particular emphasis on those who had spent most of the week, and in some cases the entire week, without leaving their home. Respondents were asked to describe in detail what they had done the previous day and also during the preceding weekend. Analysis of this rich source of qualitative data in future papers will provide a more in-depth picture of activities that older people with ID engage in on a daily and weekly basis.
2.6 Discussion and conclusionData collection for Wave 3 of IDS-TILDA took place approximately six years after the introduction of deinstitutionalisation policy in Ireland (Health Service Executive, 2011), and a similar period since the introduction of a range of other policies (Department of Health, 2011, 2012; Health Service Executive, 2012) which, collectively, may have and will have a huge bearing on the social and community participation of older people with intellectual disabilities. However, it proved difficult to determine if there has been any impact on participation as a result of this policy shift. More in-depth analyses are required to properly assess the impact of changing policies on the lives of older people with ID. Any rise or fall in rates of participation reported here could potentially be influenced by recent policy changes, including transitions to community residences. Changes could also be due to other influences, such as the ageing of the IDS-TILDA sample, or the possibility that surviving participants were already more socially active than others who have passed away or withdrawn from the study. As such, more definitive conclusions may only be drawn after fuller analyses of all these factors.

Evidence from the first Ten Years of The Intellectual Disability Supplement to The Irish Longitudinal Study on Ageing (IDS-TILDA)
5252
Differences compared to the general older population in the structure of family networks of older people with ID were previously identified (reference Wave 2 report). In particular, a reliance of older people with ID on siblings and their families, as well as on paid support staff, was noted with regard to family contact, social activities and social support. This reliance persisted in Wave 3, in particular as the sample aged and more participants lost parents and other close family. Additional analyses of Wave 2 data further identified associations between proximity of family and frequency of family contact (McCausland et al., 2017), and between family contact and participation in social activities (McCausland, Brennan, McCallion, & McCarron, 2016a). As such, the decrease in rates of people living in close proximity to their family found at Wave 3 may further negatively impact future family contacts and social activity. However, respondents continued to have the highest rates of frequent contacts with their mothers and fathers; but fewer amongst this ageing population still had living parents, and this trend will inevitably continue as they age. A concern for the future is that many older people with ID lose the people with whom they have their most frequent social contacts, and this may have a knock-on effect on their social participation more broadly and overall quality of life.
Friendships and relationships, and specifically relationships which entail an element of reciprocity and interdependence, are the fundamental basis of community (D. McCausland, Brennan, McCallion, & McCarron, 2016b). It is not surprising, therefore, to find that respondents with the greatest restrictions with regard to friendships also had the lowest rates of community belonging. This may be further evidenced when we consider the findings with regard to measures of giving support and help to family, friends and neighbours. Given the consistency with which people with ID were found to have the lowest rates of participation, it seems clear that interventions are required to address their pervasive exclusion.
There were findings of continuing family relationships and friendships with other people with an intellectual disability, with staff and with people outside the home. There were also findings of continued difficulty engaging socially and travelling around local community, of continued dependence on others particularly staff for transport, and of many participants not leaving their house for significant periods. Taken together the findings offer hope for improved social engagement but also paint a picture of continued struggle for people with ID to participate socially and in community, particularly when compared to the general older population. Implementation of policies of deinstitutionalisation and community living must be continued and expanded if there are to be additional improvements in the community integration and overall quality of life for older people with ID. This is something that IDS-TILDA will continue to monitor as policy evolves and is further implemented.

5353
References
Ahnquist, J., Wamala, S. P., & Lindstrom, M. (2012). Social determinants of health–a question ofsocial or economic capital? Interaction effects of socioeconomic factors on health outcomes. Social science & medicine, 74(6), 930-939.
Barrett, A., Savva, G., Timonen, V., & Kenny, R. A. (2011). Fifty-Plus in Ireland 2011: First results from the Irish Lonitudinal Study on Ageing (TILDA). Dublin: The Irish Longitudinal Study on Ageing.
Bigby, C., Beadle-Brown, J., & Bould, E. (2015). ‘Not as connected with people as they want to be’-Optimising outcomes in supported living for people with intellectual disability. Melbourne: Living with Disability Research Centre, La Trobe University.
Brown, I., Hatton, C., & Emerson, E. (2013). Quality of life indicators for individuals with intellectual disabilities: Extending current practice. Intellectual and Developmental Disabilities, 51(5), 316-332.
Bukowski, W. M., Hoza, B., & Boivin, M. (1994). Measuring friendship quality during pre-and early adolescence: The development and psychometric properties of the Friendship Qualities Scale. Journal of Social and Personal Relationships, 11(3), 471-484.
Craig, D., & Bigby, C. (2015). “She’s been involved in everything as far as I can see”: Supporting the active participation of people with intellectual disability in community groups. Journal of Intellectual and Developmental Disability, 40(1), 12-25.
Cummins, R. A., & Lau, A. L. D. (2003). Community integration or community exposure? A review and discussion in relation to people with an intellectual disability. Journal of Applied Research in Intellectual Disabilities, 16(2), 145-157.
Department of Health. (2011). Report of Disability Policy Review. Dublin: The Stationery Office.
Department of Health. (2012). Value for Money and Policy Review of Disability Services in Ireland. Dublin: The Stationery Office.
Department of Health. (2013). National Positive Ageing Strategy. Dublin: The Stationery Office.
Donoghue, O., Orr, J., Leahy, S., & Kenny, R. A. (2017). Transport patterns in community-dwelling adults aged 50 years and over in Ireland. Dublin: The Irish Longitudinal Study on Ageing.
Emerson, E. (2004). Cluster housing for adults with intellectual disabilities. Journal of Intellectual and Developmental Disability, 29(3), 187-197.
Health Service Executive. (2011). Time to move on from congregated settings - a strategy for community inclusion: Report of the Working Group on Congregated Settings. Dublin: The Stationery Office.
Social Participation

Evidence from the first Ten Years of The Intellectual Disability Supplement to The Irish Longitudinal Study on Ageing (IDS-TILDA)
5454
Health Service Executive. (2012). New Directions: Review of HSE day services and implementation plan 2012 - 2016. Dublin: The Stationery Office.
McCausland, D., Brennan, D., McCallion, P., & McCarron, M. (2016a). Using the WHO’s ICF as a theoretical framework for the study of social participation for older people with intellectual disabilities. Journal of Intellectual Disability Research, 60(7-8), 628-767. doi:10.1111/jir.12305
McCausland, D., Brennan, D., McCallion, P., & McCarron, M. (2016b). What is community? A theoretical model of community for people with intellectual disabilities. Journal of Intellectual Disability Research, 60(7-8), 768-822. doi:10.1111/jir.12306
McCausland, D., McCallion, P., Brennan, D., & McCarron, M. (2017). Interpersonal relationships of older adults with an intellectual disability in Ireland. Journal of Applied Research in Intellectual Disabilities. doi:10.1111/jar.12352
McCausland, D., McCallion, P., Carroll, R., O’Donovan, M. A., McGlinchey, E., Shivers, C., McCarron, M. (2014). Social participation for older people with intellectual disability. In E. Burke, P. McCallion, & M. McCarron (Eds.), Advancing years, different challenges: Wave 2 IDS-TILDA. Dublin: Trinity College Dublin.
McCausland, D., McCallion, P., Cleary, E., & McCarron, M. (2016). Social Connections for Older People with Intellectual Disability in Ireland: Results from Wave One of IDS‐TILDA. Journal of Applied Research in Intellectual Disabilities, 29(1), 71-82.
McCrory, C., Leahy, S., & McGarrigle, C. (2014). What factors are associated with change in older people’s quality of life? In A. Nolan, C. O’Regan, C. Dooley, D. Wallace, A. Hever, H. Cronin, E.
Hudson, & R. A. Kenny (Eds.), The over 50s in a changing Ireland: Economic circumstances, health and well-being. Dublin: The Irish Longitudinal Study on Ageing.
Mendelson, M. J., & Aboud, F. E. (1999). Measuring friendship quality in late adolescents and young adults: McGill Friendship Questionnaires. Canadian Journal of Behavioural Science/Revue canadienne des sciences du comportement, 31(2), 130.
Schalock, R. L., Brown, I., Brown, R., Cummins, R. A., Felce, D., Matikka, L., . . . Parmenter, T. (2002).Conceptualization, measurement, and application of quality of life for persons with intellectual disabilities: Report of an international panel of experts. Mental Retardation, 40(6), 457-470.
Schalock, R. L., Luckasson, R. A., & Shogren, K. A. (2007). The renaming of mental retardation: Understanding the change to the term intellectual disability. Intellectual and Developmental Disabilities, 45(2), 116-124.

5555
Tay, L., Tan, K., Diener, E., & Gonzalez, E. (2013). Social relations, health behaviors, and health outcomes: A survey and synthesis. Applied Psychology: Health and Well Being, 5(1), 28-78. United Nations. (2006). Convention on the Rights of Persons with Disabilities. New York: United Nations.
Ward, M., & McGarrigle, C. (2017). The Contribution of Older Adults to their Families and Communities. In Christine McGarrigle, Orna Donoghue, Siobhan Scarlett, & R. A. Kenny (Eds.), Health and Wellbeing: Active Ageing for Older Adults in Ireland - Evidence from The Irish Longitudinal Study on Ageing (pp. 15-46). Dublin: The Irish Longitudinal Study on Ageing.
Social Participation

Evidence from the first Ten Years of The Intellectual Disability Supplement to The Irish Longitudinal Study on Ageing (IDS-TILDA)
5656

Physical Health
Eilish Burke, Eimear McGlinchey, Maire O’Dwyer, Sinead Foran, Caoimhin MacGiolla Phadraig, Juliette O’Connell, Judy Ryan, Rachael Carroll and Mary McCarron
Contents3.1 Key findings . . . . . . . . . . . . . . . . . . . . . . . . . . . . . . . . . . . . . . . . . . . . . . . . . . . . . . . . . . . . . . . . . . . . . . 583.2 Introduction . . . . . . . . . . . . . . . . . . . . . . . . . . . . . . . . . . . . . . . . . . . . . . . . . . . . . . . . . . . . . . . . . . . . . 593.3 Self-reported health . . . . . . . . . . . . . . . . . . . . . . . . . . . . . . . . . . . . . . . . . . . . . . . . . . . . . . . . . . . . . . 593.4 Chronic health conditions . . . . . . . . . . . . . . . . . . . . . . . . . . . . . . . . . . . . . . . . . . . . . . . . . . . . . . . . . 59 3.4.1 Obesity, metabolic risk factors and cardiovascular health . . . . . . . . . . . . . . . . . . . . . . . 59 3.4.2 Objectively measured weight . . . . . . . . . . . . . . . . . . . . . . . . . . . . . . . . . . . . . . . . . . . . . . . . 59 3.4.3 Self-perception of weight . . . . . . . . . . . . . . . . . . . . . . . . . . . . . . . . . . . . . . . . . . . . . . . . . . . 60 3.4.4 Examining waist circumference . . . . . . . . . . . . . . . . . . . . . . . . . . . . . . . . . . . . . . . . . . . . . . . 62 3.4.5 Cholesterol . . . . . . . . . . . . . . . . . . . . . . . . . . . . . . . . . . . . . . . . . . . . . . . . . . . . . . . . . . . . . . . . 63 3.4.6 Hypertension . . . . . . . . . . . . . . . . . . . . . . . . . . . . . . . . . . . . . . . . . . . . . . . . . . . . . . . . . . . . . . 64 3.4.7 Diabetes . . . . . . . . . . . . . . . . . . . . . . . . . . . . . . . . . . . . . . . . . . . . . . . . . . . . . . . . . . . . . . . . . . . 653.5 Changes in other chronic health conditions . . . . . . . . . . . . . . . . . . . . . . . . . . . . . . . . . . . . . . . . . 65 3.5.1 Osteoporosis . . . . . . . . . . . . . . . . . . . . . . . . . . . . . . . . . . . . . . . . . . . . . . . . . . . . . . . . . . . . . . . 68 3.5.2 Falls and fear of falling . . . . . . . . . . . . . . . . . . . . . . . . . . . . . . . . . . . . . . . . . . . . . . . . . . . . . . 69 3.5.3 Fear of falling . . . . . . . . . . . . . . . . . . . . . . . . . . . . . . . . . . . . . . . . . . . . . . . . . . . . . . . . . . . . . . 71 3.5.4 Constipation . . . . . . . . . . . . . . . . . . . . . . . . . . . . . . . . . . . . . . . . . . . . . . . . . . . . . . . . . . . . . . . 723.6 Sensory impairment . . . . . . . . . . . . . . . . . . . . . . . . . . . . . . . . . . . . . . . . . . . . . . . . . . . . . . . . . . . . . . 72 3.6.1 Visual impairment . . . . . . . . . . . . . . . . . . . . . . . . . . . . . . . . . . . . . . . . . . . . . . . . . . . . . . . . . . 73 3.6.2 Hearing impairment . . . . . . . . . . . . . . . . . . . . . . . . . . . . . . . . . . . . . . . . . . . . . . . . . . . . . . . . 763.7 Oral health . . . . . . . . . . . . . . . . . . . . . . . . . . . . . . . . . . . . . . . . . . . . . . . . . . . . . . . . . . . . . . . . . . . . . . . 763.8 Medications . . . . . . . . . . . . . . . . . . . . . . . . . . . . . . . . . . . . . . . . . . . . . . . . . . . . . . . . . . . . . . . . . . . . . . 78 3.8.1 Frequently reported therapeutic classes . . . . . . . . . . . . . . . . . . . . . . . . . . . . . . . . . . . . . . . 803.9 Cognitive health . . . . . . . . . . . . . . . . . . . . . . . . . . . . . . . . . . . . . . . . . . . . . . . . . . . . . . . . . . . . . . . . . . 80 3.9.1 Dementia . . . . . . . . . . . . . . . . . . . . . . . . . . . . . . . . . . . . . . . . . . . . . . . . . . . . . . . . . . . . . . . . . . . 80 3.9.1.1 Prevalence and incidence of dementia . . . . . . . . . . . . . . . . . . . . . . . . . . . . . . . . . . 80 3.9.1.2 ADLs and dementia . . . . . . . . . . . . . . . . . . . . . . . . . . . . . . . . . . . . . . . . . . . . . . . . . . . 81 3.9.1.3 Test for severe impairment . . . . . . . . . . . . . . . . . . . . . . . . . . . . . . . . . . . . . . . . . . . . 81 3.9.1.4 Dementia screening . . . . . . . . . . . . . . . . . . . . . . . . . . . . . . . . . . . . . . . . . . . . . . . . . . 82 3.9.1.5 Dementia and Down syndrome . . . . . . . . . . . . . . . . . . . . . . . . . . . . . . . . . . . . . . . . 82 3.9.1.6 Epilepsy, dementia and Down syndrome . . . . . . . . . . . . . . . . . . . . . . . . . . . . . . . . 833.10 Conclusion . . . . . . . . . . . . . . . . . . . . . . . . . . . . . . . . . . . . . . . . . . . . . . . . . . . . . . . . . . . . . . . . . . . . . . . 83References . . . . . . . . . . . . . . . . . . . . . . . . . . . . . . . . . . . . . . . . . . . . . . . . . . . . . . . . . . . . . . . . . . . . . . . . . . . 85
3 Prevalence and incidence of chronic health conditions across 10 years

5858
Evidence from the first Ten Years of The Intellectual Disability Supplement to The Irish Longitudinal Study on Ageing (IDS-TILDA)
3.1 Key findings
• Participants continued to positively appraise their own overall health.
• There is a noted increase in chronic health conditions between Wave 1 and Wave 3.
• Doctor’s diagnosis of osteoporosis at 21%, had increased three-fold since Wave 1; but remained lower than objectively measured osteoporosis at 42% reported in Wave 2.
• Reported diagnosis of constipation increased from 17.3% in Wave 1 to 43.5% in Wave 3, with women presenting with higher prevalence (48.8%) than men (36.8%).
• Objectively measured overweight and obesity increased from 66% in Wave 2 to 79.7% in Wave 3 meaning it was now similar to rates reported by TILDA for the general older population.
• Despite these increases in obesity 63.7% considered themselves just the right weight.
• Falls remained high at 27%, with 15.9% reporting ≥2 falls and 12.5% reporting injurious falls, slightly higher than reported in TILDA.
• Polypharmacy remained high in Wave 3 at 39.5% and excessive polypharmacy (5-9 medications) at 32.7%. In addition 47.4% of those taking 3-4 medications at Wave 2 had progressed to polypharmacy at Wave 3.
• In Wave 3, 28.3% (n=171/603) of participants reported that they had no teeth at all, with 50% of those aged 65+ reporting no teeth at all.
• When total tooth loss occurred, 67.8% did not receive prosthetic dentures to restore function. In comparison, only 5.3% of the TILDA Wave 3 sample without teeth was without dentures.
• Prevalence of eye disease rose from 15.7% to 19.5%, with cataracts presenting as the most prevalent eye disease at 15.9%. It was found that prevalence of cataracts was higher in people with Down syndrome and at a younger age than those with ID from other aetiologies.
• In Wave 3, 35.5% of people with Down syndrome had a doctor’s diagnosis of dementia, which rose from 15.6% in Wave 1.
• Dementia screening within the last two years rose from 14.5% in Wave 1 to 30.5% in Wave 3 for all and for people with Down syndrome from 13.9% in Wave 1 to 61.4% in Wave 3.
Physical Health3 Prevalence and incidence of chronic health conditions across 10 years

5959
Physical Health
3.2 IntroductionThis chapter explores the prevalence and incidence of chronic health conditions over the last 10 years among those participating in the IDS-TILDA study. It includes the reported diagnoses from doctors and results from the mini-home health assessment, that is the objective measures carried out in the home (See Chapter 6 Methodology), and compares these, where available, with results from the general population study TILDA (McGarrigle et al., 2016).
3.3 Self-reported healthSimilar to previous waves, people were asked to rate their health from excellent to poor. Similar to Wave 1, across the age groups the majority of people continued to rate their health in the ‘good health’ categories. Those in the older age categories (50-64 and 65+ years) reported their health as ‘very good’ to ‘excellent’, slightly higher than those aged under 50 at 45.9% and 45.8% versus 41.7% respectively. At Wave 1 there was a stronger affirmation of excellent health among those below 50 years.
3.4 Chronic health conditionsWave 3 continued to examine chronic health conditions including the rates of obesity, metabolic risk factors, constipation, osteoporosis, falls, eye disease, sensory impairment, gastrointestinal disease, dementia, epilepsy, oral health and polypharmacy.
3.4.1 Obesity, metabolic risk factors and cardiovascular health
Obesity is more prevalent among the intellectual disability population (Bradley, 2005), and a major determinant of chronic ill health as one ages (Patterson, Moore, Probst, & Shinogle, 2004).
3.4.2 Objectively measured weight
Levels of measured overweight and obesity increased from 61 % in Wave 2 to 79.7 % in Wave 3, and now equals rates reported by TILDA for the general population at 79% (Leahy, Nolan, O’Connell, & Kenny, 2014). Higher levels of overweight and obesity were identified in those aged 50-64 years at 80.6% compared to 77.6% in those 65 years and over. Those with a mild/moderate level of intellectual disability presented with greater levels of obesity at 87.5% versus 64.3% for those in the severe/profound disability. Females had higher prevalence of overweight and obesity compared to males at 83.1% versus 75.9% respectively. And consistent with Wave 1, females with a mild level of intellectual disability showed the highest levels of overweight and obesity at 89.1% (n=49). Figure 3.1 for weight status stratified by gender and age.

Evidence from the first Ten Years of The Intellectual Disability Supplement to The Irish Longitudinal Study on Ageing (IDS-TILDA)
6060
Figure 3.1 BMI stratified by gender and age
0
20
40
60
80
100
Underweight Normal Overweight
Male Female
Underweight Normal Overweight
<50 50-64 65+
Note: n= 389; Missing Obvs = 220; Error bars correspond to 95% confidence intervals
3.4.3 Self-perception of weight
Approximately a third of those who were overweight or obese perceived themselves as being in this category with the majority, 63.7% perceiving themselves as just about the right weight (Table 3.1). For those who self-reported their weight and had their weight objectively measured n=272.

6161
Tabl
e 3.
1 O
bjec
tive
mea
sure
d w
eigh
t ver
sus s
elf-p
erce
ptio
n of
wei
ght (
n=27
2)
Obj
ectiv
e m
easu
rem
ents
(OM
)Se
lf-pe
rcep
tion
of w
eigh
t
Und
erw
eigh
tAb
out r
ight
wei
ght
Ove
rwei
ght
n
%95
% C
I%
95%
CI
%95
% C
I
OM
Und
erw
eigh
t33
.36.
1 - 7
9.2
66.7
20.8
-93.
90
0.0
- 56.
13
OM
righ
t wei
ght
9.3
4.0-
19.9
8775
.6-9
3.6
3.7
1.0-
12.5
54
OM
Ove
rwei
ght
1.9
0.7-
4.7
63.7
57.1
-69.
934
.428
.4-4
1.0
215
Physical Health

Evidence from the first Ten Years of The Intellectual Disability Supplement to The Irish Longitudinal Study on Ageing (IDS-TILDA)
6262
3.4.4 Examining waist circumference
Waist circumference is an indicator of overall body fat and is commonly utilised as an indicator of risk for cardiovascular events (Lee et al., 2016). For the purposes of this study the WHO indicators and cut-off points for increased and substantially increased risk of metabolic complications were used (Table 3.2). IDS-TILDA included waist measurement in the full suite of health assessments in Wave 2 and as part of the mini-home health assessment in Wave 3.
Table 3.2 World Health Organisation indicators and cut-off points (WHO, 2011)
Indicator Cut-off points Risk of metabolic complications
Male Female
Waist circumference >94 cm >80 cm Increased
Waist circumference >102 cm >88 cm Substantially increased
The majority of participants fell within the substantially increased risk of metabolic complications with females continuing to be at greater risk than males (Figure 3.2).
Figure 3.2 Comparison of waist circumference risk of metabolic conditions Wave 2 to Wave 3
0102030405060708090
100
Male Female
Wave 2
Male Female
Wave3
Normal Increased Substantially increased
Note: Wave 2 n = 514; Missing Obvs = 239; Wave 3 n = 346; Missing Obvs = 263;Error bars correspond to 95% confidence intervals
The waist measurements were then compared with those from the general population with data yielded from TILDA (Nolan, Newman & Donoghue, 2016) (Figure 3.3). People with an intellectual disability were at substantially increased risk of metabolic conditions compared to the general population at 74.9% versus 54% respectively.

6363
Figure 3.3 Comparison of waist circumference risk of metabolic conditions between TILDAand IDS-TILDA Wave 3
0102030405060708090
100
TILDA W3 IDS-TILDA W3
Normal Increased Substantially increased
Note: n=346 IDS-TILDA error bars correspond to 95% confidence intervals
3.4.5 Cholesterol
Unlike the TILDA study, which drew blood samples and measured cholesterol levels, IDS-TILDA asked participants to report from their medical files their doctor’s diagnosis of high cholesterol. Overall, 36.5% (n=220) reported high cholesterol which was lower than that reported by TILDA for the general population at 41% (Nolan et al 2016). In Wave 3, 93% (n=506) reported having had a blood test for cholesterol within the previous two years. Women presented with higher levels than men; 41.5% versus 30.2% respectively (figure 3.4). Of those who had high cholesterol, 68.7% (n=189) were taking medication to control their cholesterol, and 57.8% (n=159) reported that they had made lifestyle changes to address their high levels.
Figure 3.4 High cholesterol between Wave 1 and Wave 3 by age and gender
Female
0
10
20
30
40
50
60
<50 50-64 65+ <50 50-64 65+
MaleWave 1 Wave 2
Note: Wave 1 n =747; Missing Obvs = 6; Missing Obvs = 5; Error bars correspond to95% confidence intervals
Physical Health

Evidence from the first Ten Years of The Intellectual Disability Supplement to The Irish Longitudinal Study on Ageing (IDS-TILDA)
6464
3.4.6 Hypertension
In Wave 3 participants were asked if they had a doctor’s diagnosis of hypertension. Hypertension was defined as a mean systolic blood pressure of above 140 mmHg. Similar to Wave 1, the prevalence of hypertension was 18.7% with an incidence rate of 3.3% since the second wave. The prevalence of hypertension continued to be lower than objectively measured hypertension reported by TILDA at Wave 3, 18.7% versus 40% respectively (Murphy et al, 2015). In Wave 2 of IDS-TILDA there was very little difference between doctor’s diagnosis and objectively measured hypertension at 17.5% versus 18.1% (McCarron et al., 2014). In total, 19.9% of females and 17.2% of males reported hypertension. Of note is that prevalence increased with age, with 6.9% (n=5) reporting hypertension under the age of 50 years, 16.2% (n=61) between 50 and 64 years, and 30.1% (n=47) with hypertension over the age of 65. What is notable is that females in the younger and middle age groups presented with slightly lower prevalence of hypertension than males. However, as can be seen in Figure. 3.5 below, by the age of 65 years and over the prevalence of hypertension among females far exceeds that of older men, 34.8% versus 23.4% respectively.
Figure 3.5 Doctor’s diagnosis of hypertension stratified by gender and age
0
5
10
15
20
25
30
35
40
45
50
<50 yrs 50-64 yrs 65+ yrs
Male Female
Note: n = 604; Missing Obvs = 5; Error bars correspond to 95% confidence intervals

6565
3.4.7 Diabetes
Overall, the prevalence of diabetes was 9.3%, a slight increase from the 8.2% reported at Wave 1 of IDS-TILDA. An overall incidence of 1.8% was found between Wave 2 and Wave 3. The prevalence of diabetes was higher in females at 11.3% compared to males at 6.7% which was a similar trend to that observed at Wave 1 of the study. This contrasts to general population findings where the prevalence of diabetes was higher in males than females at 12% versus 7% respectively (Leahy et al., 2015). Similar to the general population, there was a strong relationship with increasing age, with a prevalence of 12.2% in those aged 65 years and over versus 1.4% in those under 50 years.
Considering levels of intellectual disability, for those with a mild level of intellectual disability, 12.5% were diagnosed with diabetes compared to 10.9% of those with a moderate level and 4.9% of those with a severe/profound level of intellectual disability.
3.5 Changes in other chronic health conditions Earlier reports have suggested that, compared to the general population, people with intellectual disability tend to have higher prevalence of chronic health conditions and the patterns of disease differ from that observed in the general population (Carey et al., 2016; McCarron et al., 2013). There was evidence of these patterns continuing with an increase in the prevalence of disease between Waves 1 and 3, Figure 3.6. Prevalence of epilepsy rose from 30.5% in Wave 1 to 35.7% in Wave 3. Of particular concern was the high prevalence of gastric reflux which doubled between Wave 1 and Wave 3 from 7.8% to 16.3%, and osteoporosis increasing three-fold from 8.1% to 21.6%. Nevertheless, doctor’s diagnosis of osteoporosis appears low given that in Wave 2, on objective measurement of bone health, 41% met criteria for osteoporosis (Burke, McCallion, Walsh & McCarron, 2016a). Of particular concern is the increase observed in doctor’s reported diagnosis of chronic constipation. This increased from Wave 1 to Wave 3 substantially, 17.3% to 43.5% respectively. These will be explored further below.
Physical Health

Evidence from the first Ten Years of The Intellectual Disability Supplement to The Irish Longitudinal Study on Ageing (IDS-TILDA)
6666
Figure 3.6 Changes in chronic health conditions between Wave 1 and Wave 3
05
101520253035404550
StomachUlcer
ThyroidDisease
GastroReflux
Osteoporosis Cancer Epilepsy Constipation
Wave 1 Wave 2
Note: Wave 1 n= 752; Missing Obvs = 1; Wave 3 n = 603; Missing Obvs = 6;Error bars correspond to 95% confidence intervals
As outlined in Table 3.3, women presented with higher rates of chronic health conditions than men, with osteoporosis and thyroid disease showing the greatest differences. Those in the older age category presented with higher levels of gastro reflux, stomach ulcers and osteoporosis.

6767
Tabl
e 3.
3 Ch
roni
c he
alth
cond
ition
s str
atifi
ed b
y ge
nder
, age
and
leve
l of I
ntel
lect
ual D
isab
ility
Stom
ach
Ulc
erTh
yroi
d Di
seas
eGa
stro
Ref
lux
Ost
eopo
rosi
sCa
ncer
Epile
psy
%95
% C
I%
95%
CI
%95
% C
I%
95%
CI
%95
% C
I%
95%
CI
Gend
er
Mal
e6.
34-
9.9
17.9
13.8
-22.
915
.711
.8-2
0.5
14.6
10.8
-19.
31.
90.
8-4.
334
.729
.3-4
0.6
Fem
ale
4.8
3.0-
7.6
25.7
21.3
-30.
616
.713
.1-2
1.1
27.2
22.7
-32.
21.
80.
8-3.
936
.431
.4-4
1.7
Age
<50
5.6
2.2-
13.6
19.7
12.1
-30.
49.
94.
9-19
.08.
53.
9-17
.22.
80.
8-9.
731
21.4
-42.
5
50-6
43.
72.
2-62
23.4
19.4
-27.
915
.412
.1-1
9.4
19.1
15.5
-23.
41.
30.
6-3.
137
.532
.8-4
2.5
65+
9.6
5.9-
15.3
20.5
14.9
-27.
521
.215
.5-2
8.2
33.3
26.4
-41.
12.
61.
0-6.
433
.326
.4-4
1.1
Leve
l of I
D
Mild
31.
2-7.
415
.610
.4-2
2.6
11.9
7.4-
18.4
15.6
10.4
-22.
61.
50.
4-5.
227
.420
.6-3
5.5
Mod
erat
e6.
23.
9-9.
926
.821
.8-3
2.6
1410
.3-1
8.8
24.9
20.0
-30.
51.
90.
8-4.
534
.228
.7-4
0.2
Seve
re/P
rofo
und
5.5
2.9-
10.2
22.7
16.9
-29.
725
.819
.7-3
3.0
21.5
15.9
-28.
41.
80.
6-5.
349
.742
.1-5
7.3
Physical Health

Evidence from the first Ten Years of The Intellectual Disability Supplement to The Irish Longitudinal Study on Ageing (IDS-TILDA)
6868
3.5.1 Osteoporosis
Across all waves of data collection people were asked to report their doctor’s diagnosis of osteoporosis. An incidence of 7.8% from prevalence of 21.6% at Wave 3.
Typically, older aged females presented with higher levels of the condition. Those with intellectual disability are no different than those in the general population with an observable age gradient noted. Of concern is that for women in the older age category (65+) the rates of osteoporosis nearly doubled between Waves 1 and 3, from 25.4% to 44.6% (Figure 3.7). These rates are similar to TILDA’s objectively measured rate of 45% for women over 65 years (Nolan, Newman, & Donoghue, 2016); however, they are much less than those objectively measured at Wave 2 for women over 65 years of 54.2%, using the same measuring device and technique as TILDA (Burke, McCallion, Walsh, & McCarron 2016a) .
Figure 3.7 Proportion of adults with osteoporosis stratified by age and gender at Wave 1 and Wave 3
0102030405060
<50 50-64 65+
Male
<50 50-64 65+
FemaleWave 1 Wave 2
Note: Wave 1 n =752; Missing Obvs = 1; Wave 3 n = 603; Missing Obvs = 6Error bars correspond to 95% confidence intervals
There was a notable increase in the prevalence of doctor’s reported diagnosis of osteoporosis stratified by level of intellectual disability, especially for men across all levels of intellectual disability, and particularly men with severe/profound where the prevalence increased over six fold from 2.1% at Wave 1 to 13.9% at Wave 3. Figure 3.8 below.

6969
Figure 3.8 Prevalence of osteoporosis stratified by gender and level of intellectual disability
05
1015202530354045
Mild Moderate Severe/Profound
Male
Mild Moderate Severe/Profound
FemaleWave 1 Wave 2
Note: Wave 1 n = 695; Missing Obvs = 58; Wave 3 n = 555; Missing Obvs = 54;Error bars correspond to 95% confidence intervals
This may have been influenced by the feedback about osteoporosis given to participants and their carers after the Health Fair in Wave 2 with more people with intellectual disability attending for DXA screening; with an almost four-fold increase of screening from 11.1% to 42.1% between Waves 1 and 3, respectively. Overall, the number of those who have never had DXA screening has decreased by 36.3%, from 83.3% at Wave 1 to 47.1% at Wave 3.
3.5.2 Falls and fear of falling
Wave 3 participants were asked if they had fallen in the previous 12 months and how often they had fallen. All those reporting any fall in the previous 12 months were then categorised as non-recurrent fallers (1 fall in previous year) or recurrent fallers (≥2 falls).
There was a slight increase in falls prevalence in older adults with intellectual disability between Wave 1 (26.7%) and Wave 3 (27.2%) (Table 3.4 below) with a slight increase in injurious falls by participants with 12.5% sustaining an injury from a fall in Wave 3.
Physical Health

Evidence from the first Ten Years of The Intellectual Disability Supplement to The Irish Longitudinal Study on Ageing (IDS-TILDA)
7070
Table 3.4 Prevalence of recurrent falls and injurious falls at Wave 1 and Wave 3
IDS-TILDA Wave 1 TILDA Wave 1 IDS-TILDA Wave 3 TILDA Wave 3
n 753 4788 608 4398
Any fall (%) 26.7 21.1 27.2 25.8
Recurrent fall (%) 14.6 7.7 15.9 11.1
Injurious fall (%) 13.2 7.7 12.5 12.1
Recurrent falls were more likely to be reported by participants aged 50 years and older, with 17.3% of 50-64 year olds and 14.7% of those aged 65 years and older experiencing two or more falls in Wave 3 (Figure 3.9). There was a slight difference in the prevalence of recurrent falls across gender with 17.1% of men with an intellectual disability experiencing recurrent falls, compared with 15% of women with an intellectual disability. Those with a severe/profound level of intellectual disability also reported higher rates of recurrent falls (20.9%) when compared with those with mild and moderate levels (10.8% and 15.8% respectively).
Figure 3.9 Prevalence of recurrent falls and injurious falls at Wave 3 by age,gender and level of intellectual disability
0
5
10
15
20
25
30
Recurrent Injurious
Note: n = 609; Missing Obvs = 0; Error bars correspond to 95% confidence intervals
There were only slight differences across gender for injurious falls, with 11.9% of males and 12.9% of females reporting an injury as a result of a fall. Those aged 65 years and older were more likely to experience an injurious fall (17.9%) than those in the younger age categories

7171
and 14.7% of those with a moderate level of intellectual disability reported an injurious fall, compared with 7.2% of those with a mild level and 12.9% of those with severe/profound level of intellectual disability.
3.5.3 Fear of falling
A shortened version for the Falls Efficacy Scale – International (FES-I) (Yardley et al., 2005), was used to measure fear of falling (FOF). Participants were asked whether they were not at all concerned, somewhat concerned, fairly concerned or very concerned about falling when undertaking seven activities; getting dressed/undressed, taking a bath/shower, going up or down a slope, getting in/out of a chair, reaching for something above head height or on the ground, going up/down stairs and going out to a social event such as a religious event, family gathering, club meeting. Considerable levels of fear of falling (FOF) were reported across all activities, with 65.1% (n=168) of participants reporting being somewhat, fairly or very concerned about going up or down a slope (Figure 3.10). Almost 60% of participants reported that they were concerned about falling when going up or down stairs. A further 50% of participants were concerned about falling when taking a shower or bath, with over 50% reporting concerns about falling when attending social events.
Figure 3.10 Fear of falling in Wave 3
0
10
20
30
40
50
60
70
80
Social Event Up/Downstairs
In/Outchair
Bath/Shower Dressed Up or Downslope
Reaching
Not at all Somewhat/Fairly Very
Note: n = 258; Error bars correspond to 95% confidence intervals
Physical Health

Evidence from the first Ten Years of The Intellectual Disability Supplement to The Irish Longitudinal Study on Ageing (IDS-TILDA)
7272
3.5.4 Constipation
In the first wave of the IDS-TILDA study 17.3% (n=130) reported a doctor’s diagnosis of chronic constipation. By Wave 3 reported diagnosis had increased almost two and half times to 43.5% (n=262). Overall, women reported higher levels of constipation than men at 48.8% versus 36.8% respectively. Generally, men presented with lower levels of constipation across the age groups compared to women. Those women in the older age group (65 years+) presented with the highest levels at 54.3% (figure 3.11).
Figure 3.11 Levels of constipation in Wave 3 by gender and age
0
10
20
30
40
50
60
<50 <50 50-64 65+50-64 65+
Male Female
Wave 1 Wave 2
Note: Wave 1 n = 752; Missing Obvs = 1; Wave 3 n = 602; Missing Obvs = 7; Error bars correspond to 95% confidence intervals
Levels of constipation were also found to increase with severity of level of intellectual disability from 30.9% (n=42) for those with mild intellectual disability, 43.8% (n=112) for those with moderate to 58.3% (n=98) for those with severe/profound level of intellectual disability. For those who reported constipation at Wave 3, 74.5% (n=240) were taking medication to manage the condition and 56.8% (n=183) reported they had made lifestyle changes to address the condition. Of those with constipation, 37.6% (n=204) reported never having a normal stool without the use of laxatives.
3.6 Sensory impairmentThe prevalence of sensory impairment is observed at a greater extent among those with intellectual disability compared to those in the general population.

7373
3.6.1 Visual impairment
Overall 21.2% rated their eyesight as poor compared to 15.9% in Wave 1, Figure 3.12.
Figure 3.12 Self-reported eye health
0
10
20
30
40
50
Excellent/Very good Good Fair/Poor
Wave 1 Wave 2
Note: Wave 1 = 716; Missing Obvs = 36; Wave 3 n = 586; Missing Obvs = 23; Error bars correspond to 95% confidence intervals
Physical Health

Evidence from the first Ten Years of The Intellectual Disability Supplement to The Irish Longitudinal Study on Ageing (IDS-TILDA)
7474
Prevalence of eye disease also increased between Wave 1 and Wave 3, with cataracts the most common eye disease reported, Figure 3.13.
Figure 3.13 Prevalence of eye disease from Wave 1 to Wave 3
0
5
10
15
20
25
Age Related Disease Glaucoma Cataracts Total Eye Disease
Wave 1 Wave 3
Note: Wave 1 = 749; Missing Obvs = 4; Wave 3 n = 604; Missing Obvs = 5;Error bars correspond to 95% confidence intervals

7575
Prevalence of eye disease was reduced from Wave 1 to Wave 3 for men in the 65+ year’s age group from 27.3% to 21.9%. Prevalence increased across all age groups for women, Figure 3.14. It is also evident from Wave 3 that eye disease is presenting at higher rates for women than for men.
Figure 3.14 Eye Disease by age and gender from Wave 1 to Wave 3
05
1015202530354045
<50 yrs 50-64 yrs 65+ yrs <50 yrs 50-64 yrs 65+ yrs
Male Female
Wave 1 Wave 3
Note: Wave 1 = 747; Missing Obvs = 6; Wave 3 n = 604; Missing Obvs = 5;Error bars correspond to 95% confidence intervals
Individuals with Down syndrome were found to be at higher risk of eye disease, particularly cataracts and at a younger age than people with an intellectual disability from other aetiologies (Figure 3.15 below).
Figure 3.15 Prevalence of cataracts in people with Down syndrome and with IDfrom other aetiologies by age
0
10
20
30
40
50
60
70
80
<50 yrs 50-64 yrs 65+ yrs
Down Syndrome Other ID
Note: n = 604; Missing Obvs = 5; Error bars correspond to 95% confidence intervals
Physical Health

Evidence from the first Ten Years of The Intellectual Disability Supplement to The Irish Longitudinal Study on Ageing (IDS-TILDA)
7676
The majority of participants reported having an eye exam, with 61.7%, (n=373) having had an eye exam within the previous year, with a further 23.6% (n=143) having been examined between one to three years. Of those who did not have an eye exam in more than three years 7.4% (n=45), when asked for reasons, 62.2% (n=28) reported that there was no need; 4.4% (n=2) said they did not attend due to fear.
3.6.2 Hearing impairment
Overall, there was little change in self-reported hearing since Wave 1, with 59.3% (n=358) of participants reporting excellent or very good hearing. When asked about their ability to follow a conversation with four people, 45.5% reported no difficulty, while 14.1% (n=81) said that they could not do so at all. Overall, 4.8% (n=29) reported wearing a hearing aid. Uptake of hearing assessments was low; 38.9% (n=231) had not been for a hearing test in more than three years. Of those who did not have a hearing test, 82.3% (n=190) reported that there was no need for one.
Individuals with Down syndrome reported higher rates of self-reported poor hearing at 22.4 % versus 4.8% than those with an intellectual disability from other aetiologies (figure 3.16).
Figure 3.16 Self-reported hearing people with Down syndrome and people with IDfrom other aetiologies
0
10
20
30
40
50
60
70
80
<50 yrs 50-64 yrs 65+ yrs
Down Syndrome Other ID
Note: n = 599; Missing Obvs = 10; Error bars correspond to 95% confidence intervals
3.7 Oral healthIn Wave 3 of IDS-TILDA, 28.3% (n=171/603) of participants reported that they had no teeth at all (Figure 3.17). This represented an increase of 3% since Wave 1, when the corresponding figure

7777
was 25.4% (n=191/751). In contrast, only 16.9% (n=1,115) of Wave 3 TILDA participants reported total tooth loss, down from 17.7% in Wave 1(n=1,502), despite the TILDA sample being older. When total tooth loss occurred, a large proportion of people with intellectual disability (67.8% of IDS-TILDA Wave 3 sample without any teeth, n=116) did not receive prosthetic dentures to restore function. Conversely, this did not occur among the TILDA Wave 3 sample where only 5.3% of those without teeth were without dentures (n=58).
Figure 3.17 Comparing the proportion reporting oral status in IDS-TILDA and TILDA
0
10
20
30
40
50
60
All ownnone missing
Own teeth, somemissing and no
dentures
Own teethand dentures
Full dentures No teethor dentures
IDS-TILDA TILDA
Note: n = 603; Missing Obvs = 6; Error bars correspond to 95% confidence intervals
As with the general population, tooth loss increased with age among participants with an intellectual disability (MacGiolla Phadraig et al., 2015). Wave 3 further confirmed that the frequency of total tooth loss increased with age; only 7.0% of people under 50 years were edentulous, compared to 23.1% of those aged 50-64 years and 50.6% of those aged 65+ years. The frequency of total tooth loss also increased across residential settings; 19.6% of those living independently / with family were edentulous compared to 23.0% in community group homes and 36.3% in residential care.
Self-reported oral health was almost identical in the TILDA and IDS-TILDA samples. IDS-TILDA Wave 3 (the first point at which self-rated oral health was measured) saw 39.4% (n=237/601) of participants reporting excellent or very good oral health (Figure 3.18). This compared to 39.5% (n=2,607) in TILDA. Despite poorer oral conditions, people with ID were just as likely to be happy with their oral health.
Physical Health

Evidence from the first Ten Years of The Intellectual Disability Supplement to The Irish Longitudinal Study on Ageing (IDS-TILDA)
7878
Figure 3.18 Distribution of self-rated oral health Wave 3 TILDA v IDS-TILDA
0
5
10
15
20
25
30!
35
40
45
50
Excellent Very good Good Fair Poor
IDSTILDA TILDA
Note: n = 601; Missing Obvs = 8; Error bars correspond to 95% confidence intervals
3.8 MedicationsThe IDS-TILDA study recorded the medications that participants take on a regular basis, such as every day or every week. This included prescribed and non-prescribed medicines, vitamins and supplements. The vast majority (97%) of IDS-TILDA study participants were taking medicines at Wave 3. Polypharmacy is the concomitant use of between five and nine medicines or vitamins/supplement and was reported by 39.5% of older adults with an intellectual disability at Wave 3. Excessive polypharmacy is the concomitant use of ten or more medicines or vitamins/supplements (O’Dwyer et al.,2016), and was reported by almost one-third (32.7%) of participants at Wave 3, a small increase from 31.2% at Wave 2.
Changing patterns in the number of medications taken (for participants who participated in both Wave 2 and 3, n=532) are shown in Table 3.5. Overall, medication use continued to increase over time with most older adults with intellectual disability either staying in the same group, or moving up one medication use category. For example, 47.4% of those taking between three and four medications at Wave 2 had progressed to taking between five and nine medications (polypharmacy) at Wave 3. Three in ten (30.7%) of those taking between five and nine medications at Wave 2 were taking ten or more medicines (excessive polypharmacy) at Wave 3. However, 30.7% of those taking ten or more medicines at Wave 2 had transitioned back to between five and nine medications at Wave 3.

7979
Tabl
e 3.
5 Ch
ange
s in
med
icat
ion
use
betw
een
Wav
e 2
and
Wav
e 3
Tota
l pr
opor
tion
in
Wav
e 2
0 M
edic
atio
ns
Wav
e 3
1-2
Med
icat
ions
W
ave
3
3-4
Med
icat
ions
W
ave
3
5-9
Med
icat
ions
W
ave
3
10+
med
icat
ions
Wav
e 3
Num
ber i
n Sa
mpl
e (%
)
%%
%%
%%
%
0 m
edic
atio
ns (W
ave
2)4.
545
.829
.212
.512
.50.
024
1-2
med
icat
ions
(Wav
e 2)
13.5
1.4
48.6
26.4
19.4
4.2
72
3-4
med
icat
ions
(Wav
e 2)
14.7
0.0
7.7
30.7
47.4
14.1
78
5-9
med
icat
ions
(Wav
e 2)
35.9
0.5
3.1
10.9
54.7
30.7
191
10+
med
icat
ion
(Wav
e 2)
31.2
1.8
1.2
5.4
30.7
60.8
166
Tota
l pro
port
ion
in W
ave
3 (%
)10
03.
010
.514
.339
.432
.753
2
Base
d on
532
indi
vidu
als w
ho p
artic
ipat
ed in
bot
h w
aves
and
had
ava
ilabl
e m
edic
atio
n da
ta.
The
data
in th
is ta
ble
are
inte
rpre
ted
as fo
llow
s: 4
5.8%
of t
hose
with
“0 m
edic
atio
ns” i
n W
ave
2 ha
d “0
med
icat
ions
” in
Wav
e 3;
29.
2% m
oved
to a
“1-2
m
edic
atio
ns”;
12.
5% m
oved
to “3
-4 m
edic
atio
ns”;
12.
5% m
oved
to 5
-9 M
edic
atio
ns a
nd 0
% h
ad m
oved
to 1
0+ m
edic
ines
.
Physical Health

Evidence from the first Ten Years of The Intellectual Disability Supplement to The Irish Longitudinal Study on Ageing (IDS-TILDA)
8080
3.8.1 Frequently reported therapeutic classes
The change in most frequently reported medicines classes by IDS-TILDA participants between Waves 2 and 3 were examined for participants who completed both Wave 2 and 3, and had available medicines data (n=532). As may be seen in Figure 3.19, antipsychotics remained the most frequently reported therapeutic class in the population, with 45.9% of participants reporting use at Wave 3, a slight decrease from 48.7% at Wave 2. By Wave 3; 45.3% of participants were taking anti-epileptics and 44.4% were taking laxatives.
Figure 3.19 Most frequently reported therapeutic classes at Wave 2 and Wave 3 (n=532)
0
10
20
30
40
50
60
Antipsychotics Antiepileptics Laxatives Drugs for PUD/GORD
NON-OpioidAnalgesics
Wave 1 Wave 3
PUD-Peptic Ulcer Disease
GORD- Gastroesophageal Reflux Disease; Missing Obvs = 77; Error bars correspond to 95% confidence intervals.Based on 532 individuals who participated in both waves and had available medication data.
3.9 Cognitive health3.9.1 Dementia
3.9.1.1 Prevalence and incidence of dementia
In all three Waves of IDS-TILDA, participants were asked if they had received a doctor’s diagnosis of dementia or Alzheimer’s disease. Prevalence increased from 5.8% in Wave 1 to 9% in Wave 2. Prevalence rates have remained stable between Wave 2 and Wave 3, with Wave 3 prevalence rates at 9.1% (n=55). Overall, there was an incidence of 4.7% (n=27) between Waves 2 and 3 in the total population. Of these 27 people who received a new diagnosis of dementia between Waves 2 and 3, 74% (n=20) had Down syndrome.

8181
3.9.1.2 ADLs and dementia
Of those who had a diagnosis of dementia in Wave 3 (n=55), difficulty with ADLs was examined across the three Waves. As may be seen in Figure 3.20, ADL functions declined over the three Waves, for activities such as dressing, bathing, eating, getting in and out of bed, and toileting.
Figure 3.20 Percentage of people with diagnosis of dementia in Wave 3 who reported ‘Cannot do at all’ for ADLs over the three Waves
Note: n=55; Error bars correspond to 95% confidence intervals
3.9.1.3 Test for severe impairment
Judging deterioration over repeated administrations of the same measure is recommended to understand decline (Hassiotis & Strydom, 2003). The Test for Severe Impairment (TSI) has been found to be valid and reliable for use with people with an intellectual disability to measure cognitive function and to measure decline over time (Tyrrell et al., 2001, McCarron et al., 2014, McCarron et al., 2017). A decrease in score indicates a decrease in cognitive function.
Physical Health
0
10
20
30
40
50
60
70
80
Dressing Bathing Eating Getting in andout of bed
Toileting
Wave 1 Wave 2 Wave 3

Evidence from the first Ten Years of The Intellectual Disability Supplement to The Irish Longitudinal Study on Ageing (IDS-TILDA)
8282
Scores on the TSI were also examined for those with and without dementia, where it was found that, for those with a reported diagnosis of dementia in Wave 3, scores declined more from Wave 1 than those without a diagnosis of dementia (Figure 3.21 below).
Figure 3.21 Difference in TSI scores in those with and without dementia
0
5
10
15
20
25
Wave 1 Wave 2 Wave 3
With dementia W3 Without dementia W3
Note: Wave 1 n = 484; Missing Obvs = 269; Wave 2 n= 425; Missing Obvs = 328; Wave 3 n = 418; Missing Obvs = 191; Error bars correspond to 95% confidence intervals
3.9.1.4 Dementia screening
Dementia screening overall rose from 14.5% in Wave 1 (n=58) to 30.5% (n=138) in Wave 3 and for those with Down syndrome, from 13.9% (n=28) in Wave 1 to 61.4% (n=54) in Wave 3.
3.9.1.5 Dementia and Down syndrome
Of the 147 people with Down syndrome who began the study in Wave 1, 44.2% (n=65) received a diagnosis of dementia. In Wave 3, 35.5% (n=38) of people with Down syndrome had a doctor’s diagnosis of dementia, which rose from 15.6% in Wave 1. (Figure 3.22 below). This compared to 3.4% (n=17) of those with intellectual disability from other aetiologies. The average age of diagnosis of dementia for those with Down syndrome was 52.3 years compared to 65.5 for those with intellectual disability from other aetiologies. Of those with Down syndrome who did not have dementia (n=69), 29% (n=20) were <50, 68.1% (n=47) were between 50 and 64 and 2.9%, (n=2) were 65+ years.

8383
An incidence rate of 22.5% (n=20) was found for this population between Waves 2 and 3, which would equate to an incidence rate of approximately 7.5% per year. In the general population, it is estimated that incidence of dementia is 2% for those 60 years and older (Satizabal, 2016).
Figure 3.22 Dementia prevalence across three waves
05
101520253035404550
Dementia W1 Dementia W2 Dementia W3
Down syndrome ID other aetiolgy
Note: Wave 1 n = 752; Missing Obvs = 1; Wave 2 n = 705; Missing Obvs = 3; Wave 3 n = 604; Missing obvs = 5; Error bars correspond to 95% confidence intervals
Twenty nine individuals with Down syndrome died between Wave 2 and Wave 3. Of these, 75.9% (n=22) had a doctor’s diagnosis of dementia.
3.9.1.6 Epilepsy, dementia and Down syndrome
For those with Down syndrome, prevalence of epilepsy without dementia was low at 14.5%; (n=10) however, among people with Down syndrome with dementia, the prevalence of epilepsy rose to 54.8% (n=20).
3.10 Conclusion
This chapter has presented the changes in physical and cognitive health among the IDS-TILDA population from Wave 1 to Wave 3, including prevalence and incidence, and comparisons with the general population where possible. The most concerning issues were that obesity levels were now equal those reported by the general population and constipation levels far exceeded those reported in Wave 1. These are examples of health conditions in people with an ID that are relatively modifiable with behaviour lifestyle changes and supportive health management. The findings support that people with intellectual disability need and are not all receiving such support to succeed in making needed changes especially as they age.
Physical Health

Evidence from the first Ten Years of The Intellectual Disability Supplement to The Irish Longitudinal Study on Ageing (IDS-TILDA)
8484
Polypharmacy continued to be of concern and there was evidence that the rates have risen across waves. Oral health also continued to be of concern with a key finding that fewer people with intellectual disability receive restorative treatment than in the general population. Falls were also higher than in the general population as was fear of falling with over 65% reporting some level of fear especially regarding going up or down stairs. This has an impact on the person’s independence. Service providers must consider potential for falls in planning for movement to the community and falls are an area for further educational and other interventions.
That IDS-TILDA has tracked the same individuals across 10 years has yielded rich data on health conditions in this population. Despite the acknowledged limitation of reliance on self-reported health conditions IDS-TILDA continues to add to the literature on the ageing process and health experience of people with an intellectual disability, offering concrete evidence for increased prevalence of chronic health conditions when compared to the general population and pointing out both differences in prevalence for different health conditions and differential incidence of key conditions such as dementia and cardiovascular disease. As community placement brings more and more people with intellectual disabilities in contact with GPs, hospitals and other health providers not trained in the unique concerns of people with intellectual disabilities this data and the challenges it highlights is encouraging the redesign of health service provision and health policy.
8585
References
Bradley, S. (2005). Tackling obesity in people with learning disability: Weight gain, and the associated health risks. Learning Disability Practice, 8(7), 10-14.
Burke, E., McCallion, P., Carroll, R., Walsh, J., & McCarron, M. (2016a). An exploration of the bone health of older adults with an intellectual disability in Ireland. Journal of Intellectual Disability Research, 61(2), 99-114.
Burke, E., McCallion, P., Walsh, J., & McCarron , M. (2016b). The Bone Health of Adults with Intellectual Disability. (Doctor of Philosophy), Trinity College Dublin, Dublin.
Carey, I. M., Shah, S. M., Hosking, F. J., DeWilde, S., Harris, T., Beighton, C., & Cook, D. G. (2016). Health characteristics and consultation patterns of people with intellectual disability: a cross-sectional database study in English general practice. Br J Gen Pract, 66(645), e264-e270.
Leahy, O’Halloran, A., O’Leary, N., Healy, M., McCormack, M., Kenny, R., & O’Connell, J. (2015). Prevalence and correlates of diagnosed and undiagnosed type 2 diabetes mellitus and pre-diabetes in older adults: Findings from the Irish Longitudinal Study on Ageing (TILDA). Diabetes research and clinical practice, 110(3), 241-249.
Leahy, S., Nolan, A., O’Connell, J., & Kenny, R. A. (2014). Obesity in an ageing society: implications for health, physical function and health service utilisation.
Lee, Y., Jin, C., Gao, J., Wu, Y., Wu, S., Kris-Etherton, P. M., & Gao, X. (2016). Prospective Study Of Waist Circumference Trajectories And Incident Cardiovascular Disease: Am Heart Assoc.
Mac Giolla Phadraig C, McCallion P, Cleary E, et al. (2015). Total tooth loss and complete denture use in older adults with intellectual disabilities in Ireland. J Public Health Dent, 75(2):101-108. doi: 10.1111/jphd.12077.
McCarron, M., Burke, E., Cleary, E., Carroll, R., McGlinchey, E., & McCallion, P. (2014). Changes in physical and behavioural health of older adults with intellectual disability. Advancing Years, Different Challenges: Wave 2.
McCarron, M., Carroll, R., Kelly, C., & McCallion, P. (2015). Mortality rates in the general Irish population compared to those with an intellectual disability from 2003 to 2012. Journal of Applied Research in Intellectual Disabilities, 28(5), 406-413.
McCarron, M., Swinburne, J., Burke, E., McGlinchey, E., Andrews, V., Mulryan, N., . . . McCallion, P. (2011). Growing older with an intellectual disability in Ireland 2011: First results from the Intellectual Disability Supplement to the Irish Longitudinal Study on Ageing (IDS-TILDA): School of Nursing and Midwifery, Trinity College Dublin.
Physical Health

Evidence from the first Ten Years of The Intellectual Disability Supplement to The Irish Longitudinal Study on Ageing (IDS-TILDA)
8686
McCarron, M., Swinburne, J., Burke, E., McGlinchey, E., Carroll, R., & McCallion, P. (2013). Patterns of multimorbidity in an older population of persons with an intellectual disability: results from the intellectual disability supplement to the Irish longitudinal study on aging (IDS-TILDA). Research in developmental disabilities, 34(1), 521-527.
Murphy, C., Kearney, P., Shelley, E., Fahey, T., Dooley, C., & Kenny, R. A. (2017). Hypertension prevalence and awareness in older Irish adults: Evidence from the Irish longitudinal study of ageing (Tilda). Paper presented at the AUDGPI Annual Scientific Meeting.
Nolan, H., Newman, L., & Donoghue, O. (2016). Objective Indicators of Health and Function. In C. McGArrigle, O. Donoghue, S. Scarlett, & R. A. Kenny (Eds.), Health and Wellbeing: Active Ageing for Older Adults in Ireland, Evidence from The Irish Longitudinal Study on Ageing. Trinity College Dublin.
O’Dwyer, M., Peklar, J., McCallion, P., McCarron, M., & Henman, M. C. (2016). Factors associated with polypharmacy and excessive polypharmacy in older people with intellectual disability differ from the general population: a cross-sectional observational nationwide study. BMJ open, 6(4)
Patterson, P. D., Moore, C. G., Probst, J. C., & Shinogle, J. A. (2004). Obesity and physical inactivity in rural America. The Journal of Rural Health, 20(2), 151-159.
Yardley, L., Beyer, N., Hauer, K., Kempen, G., Piot-Ziegler, C. and Todd, C. (2005) ‘Development and initial validation of the Falls Efficacy Scale-International (FES-I)’, Age and Ageing, 34(6), pp. 614-619.
Contents4.1 Key findings . . . . . . . . . . . . . . . . . . . . . . . . . . . . . . . . . . . . . . . . . . . . . . . . . . . . . . . . . . . . . . . . . . . . . . 88
4.2 Introduction . . . . . . . . . . . . . . . . . . . . . . . . . . . . . . . . . . . . . . . . . . . . . . . . . . . . . . . . . . . . . . . . . . . . . 89
4.3 Mental health . . . . . . . . . . . . . . . . . . . . . . . . . . . . . . . . . . . . . . . . . . . . . . . . . . . . . . . . . . . . . . . . . . . . 89
4.3.1 Reported diagnosis . . . . . . . . . . . . . . . . . . . . . . . . . . . . . . . . . . . . . . . . . . . . . . . . . . . . . . . . . . 89
4.3.2 Persons with Down syndrome . . . . . . . . . . . . . . . . . . . . . . . . . . . . . . . . . . . . . . . . . . . . . . . . 90
4.3.3 Self/proxy rated emotional and mental health . . . . . . . . . . . . . . . . . . . . . . . . . . . . . . . . 91
4.4 Depression . . . . . . . . . . . . . . . . . . . . . . . . . . . . . . . . . . . . . . . . . . . . . . . . . . . . . . . . . . . . . . . . . . . . . . . 91
4.4.1 The Glasgow Depression Scale (GDS-ID) . . . . . . . . . . . . . . . . . . . . . . . . . . . . . . . . . . . . . . . 92
4.4.1.1 Results . . . . . . . . . . . . . . . . . . . . . . . . . . . . . . . . . . . . . . . . . . . . . . . . . . . . . . . . . . . . . . 92
4.5 Anxiety . . . . . . . . . . . . . . . . . . . . . . . . . . . . . . . . . . . . . . . . . . . . . . . . . . . . . . . . . . . . . . . . . . . . . . . . . . 93
4.5.1 The Glasgow Anxiety Scale (GAS-ID) . . . . . . . . . . . . . . . . . . . . . . . . . . . . . . . . . . . . . . . . . . . 93
4.5.1.1 Results . . . . . . . . . . . . . . . . . . . . . . . . . . . . . . . . . . . . . . . . . . . . . . . . . . . . . . . . . . . . . . 93
4.6 Energy and Vitality Index . . . . . . . . . . . . . . . . . . . . . . . . . . . . . . . . . . . . . . . . . . . . . . . . . . . . . . . . . . 94
4.7 Life events . . . . . . . . . . . . . . . . . . . . . . . . . . . . . . . . . . . . . . . . . . . . . . . . . . . . . . . . . . . . . . . . . . . . . . . 95
4.8 Conclusion . . . . . . . . . . . . . . . . . . . . . . . . . . . . . . . . . . . . . . . . . . . . . . . . . . . . . . . . . . . . . . . . . . . . . . . 97
References . . . . . . . . . . . . . . . . . . . . . . . . . . . . . . . . . . . . . . . . . . . . . . . . . . . . . . . . . . . . . . . . . . . . . . . . . . . 98
4 Mental Health, Well-Being, Vitality and Life EventsFintan Sheerin, Rachael Carroll, Niamh Mulryan, Philip McCallion and Mary McCarron
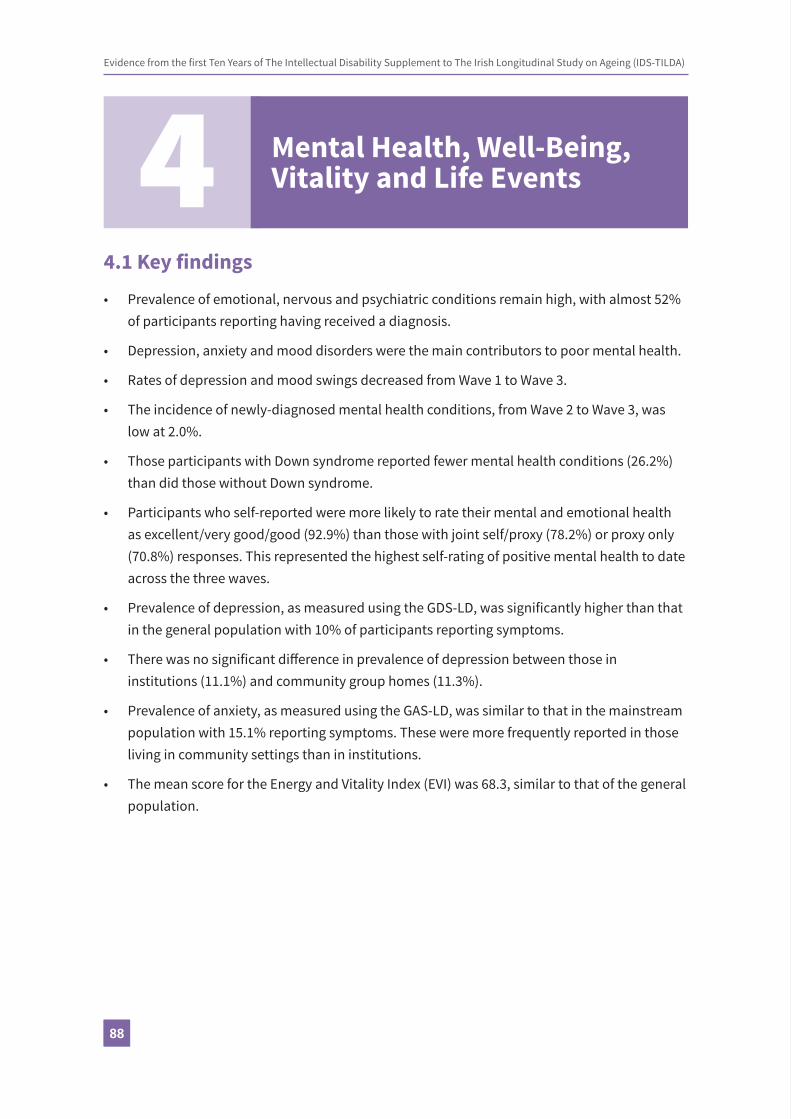
8888
Evidence from the first Ten Years of The Intellectual Disability Supplement to The Irish Longitudinal Study on Ageing (IDS-TILDA)
4.1 Key findings
• Prevalence of emotional, nervous and psychiatric conditions remain high, with almost 52% of participants reporting having received a diagnosis.
• Depression, anxiety and mood disorders were the main contributors to poor mental health.
• Rates of depression and mood swings decreased from Wave 1 to Wave 3.
• The incidence of newly-diagnosed mental health conditions, from Wave 2 to Wave 3, was low at 2.0%.
• Those participants with Down syndrome reported fewer mental health conditions (26.2%) than did those without Down syndrome.
• Participants who self-reported were more likely to rate their mental and emotional health as excellent/very good/good (92.9%) than those with joint self/proxy (78.2%) or proxy only (70.8%) responses. This represented the highest self-rating of positive mental health to date across the three waves.
• Prevalence of depression, as measured using the GDS-LD, was significantly higher than that in the general population with 10% of participants reporting symptoms.
• There was no significant difference in prevalence of depression between those in institutions (11.1%) and community group homes (11.3%).
• Prevalence of anxiety, as measured using the GAS-LD, was similar to that in the mainstream population with 15.1% reporting symptoms. These were more frequently reported in those living in community settings than in institutions.
• The mean score for the Energy and Vitality Index (EVI) was 68.3, similar to that of the general population.
Mental Health, Well-Being, Vitality and Life Events4

8989
Mental Health, Well-Being, Vitality and Life Events
4.2 IntroductionThis chapter reports on the findings on mental health, well-being, vitality and life events in Wave 3. A number of measures used in previous waves were repeated but this chapter also includes data from new measures that provide more detailed and directed insight into depression and anxiety. Data is presented in a descriptive manner drawing comparisons with findings from other studies both for people with ID and for the general older adult population.
4.3 Mental healthRespondents who reported in Wave 2 that they had received a diagnosis from a doctor of an emotional, nervous or mental health condition were asked in Wave 3 if they still had this condition. Participants were also asked if they had received a new diagnosis since the previous interview.
4.3.1 Reported diagnosis
The overall prevalence of mental health diagnoses in IDS-TILDA Wave 3 (51.9%) indicates little overall change from Wave 1 (49.9%). Anxiety remained the most prevalent condition and rates increased from Wave 1 to Wave 3 (Wave 1: 26.8%; Wave 3: 32.4%), followed by depression (Wave 1: 19.3%; Wave 3: 15.8%) and mood swings (Wave 1: 19.9%; Wave 3: 15.1%). This compares with the TILDA finding that 13% of people experienced ‘case-level’ symptoms for anxiety (O’Regan et
al., 2011). Manic depression was the next most prevalent (Wave 1: 3.9%; Wave 3: 1.8%) (Figure 4.1).
Figure 4.1 Prevalence of emotional and psychiatric conditions Wave 1 & Wave 3
0
10
20
30
40
50
60
Emotional Psychiatric Cond
Anxiety Depression Mood swings Manic Depression
Wave 1 Wave 3
Note: Wave 1 n = 747; Wave 3 n = 601; Error bars correspond to 95% confidence intervals

Evidence from the first Ten Years of The Intellectual Disability Supplement to The Irish Longitudinal Study on Ageing (IDS-TILDA)
9090
All of these diagnoses, with the exception of anxiety, were found to have a higher prevalence in women and, whereas the findings in Wave 2 showed increasing prevalence with advancing age, Wave 3 findings showed greater variance (Figure 4.2). Those in the 65+ years category reported a greater overall prevalence for mental health diagnoses (58.4%) but participants aged 50-64 years showed a slightly lower prevalence (49.2%) than those in the <50 years category (52.1%). Overall, prevalence remained highest among those with severe or profound intellectual disability (65.6%).
Figure 4.2 Prevalence of emotional and psychiatric conditions by age
0%
10%
20%
30%
40%
50%
60%
70%
EmotionalPsychiatric Cond
Anxiety Depression MoodSwings
ManicDepression
<50 yrs 50-64 yrs 65+
Note: n = 601; Missing Obvs = 8; Error bars correspond to 95% confidence intervals
4.3.2 Persons with Down syndrome
The overall prevalence of mental health conditions reported amongst those with Down syndrome was 26.2%, almost half of that reported for IDS-TILDA participants without Down syndrome. This was also found in prior waves. Furthermore, 14.95% (n=16) of participants with Down syndrome, who had a mental health condition, also had a diagnosis of dementia.
Overall prevalence of reported mental health conditions was greatest among those participants with Down syndrome who lived in institutions (64.4%), followed by community group homes (49.6%) and independently/with family (22.3%). Of these 40.9% (n=9) lived in institutions, 50.0% (n=6) lived in community group homes and 25% (n=1) lived independently/with family. Findings were similar when looking more specifically at the prevalence of reported anxiety, depression
and mood swings.

9191
4.3.3 Self/proxy rated emotional and mental health
Respondents and/or their proxies were asked to rate their perception of the participant’s mental and emotional health on a five-point Likert scale with options ranging from poor to excellent. A total of 592 valid responses were obtained, of which 113 were self-reports. Although participants reported high prevalence of mental health conditions, more than three-quarters rated their overall emotional and mental health as either excellent/very good (33.3%), or good (44.3%). Rates have remained the same across all three waves with some increase in fair/poor ratings in Wave 2 (Figure 4.3). However, the combined positive Wave 3 rating of 77.5% was lower than the rate for the general population (90%) reported by TILDA (O’Regan et al., 2011).
Figure 4.3 Self-rated mental health Waves 1, 2 and 3
0.0
10.0
20.0
30.0
40.0
50.0
60.0
Excellent/V Good Good Fair/Poor
Wave 1 Wave 2 Wave 3
Note: Wave 1 n = 733; Wave 2 n = 679; Wave 3 n = 592; Error bars correspond to 95% confidence intervals
As was noted in Waves 1 and 2, participants who self-reported were more likely to rate their mental and emotional health as excellent/very good/good (92.9%) than those with joint self/proxy (78.2%) or proxy only (70.8%) responses. This is the highest self-rating of positive mental health to date across the three waves (Wave 1: 89.2%; Wave 2: 85.6%).
This favourable mental health rating was also reflected across the three age categories at 77.1% (<50 years), 76.5% (50-64 years) and 80.3% (65+ years). This represented a small increase on the findings in Wave 2. Differences were also noted based on living situation. Participants living independently or with family were more likely to report positive mental health (91.3%) than those living in community group homes (78.5%) and those in institutions (71.9%).
4.4 DepressionDepression was an important aspect of mental health in Wave 3 with 15.8% (n=95) indicating that they had a diagnosis of depression, a figure significantly higher than the 5% reported by TILDA for the general population (Canney et al., 2017).
Mental Health, Well-Being, Vitality and Life Events

Evidence from the first Ten Years of The Intellectual Disability Supplement to The Irish Longitudinal Study on Ageing (IDS-TILDA)
9292
4.4.1 The Glasgow Depression Scale (GDS-LD)
The Glasgow Depression Scale for people with a Learning Disability (GDS-LD) was devised by Cuthill et al. (2003) to support the assessment of depressive symptomatology in individuals with an intellectual disability (ID). The assisted self-completion version is for use by individuals with a mild to moderate ID. The GDS-LD is also available as a carer supplement (GDS-CS) version to allow for reporting of direct observations (Hermans & Evenhuis, 2010).
4.4.2 Results
Total scores on the GDS-LD were obtained for 291 participants who either self-responded, or responded assisted by a proxy. Of these, 10.0% (n=29) scored at or above the cut-off of 13, indicating the presence of depressive symptomology. This was considerably higher than found by TILDA in the general population (Canney et al., 2017). It should be noted that, whereas the previously reported prevalence of doctor’s diagnosis of depression was 15.8% and the GDS-LD showed only 10%, the former was based on clinical diagnosis and the latter on symptoms. Of participants with GDS-LD identified symptoms, 18.5% also had a reported diagnosis of depression from a doctor.
Slightly more women demonstrated depressive symptoms (10.6%) than men (9.1%) which is lower than the 15.8% found in the study by Cooper et al. (2015) but similar to the findings of Sheehan et al. (2015) of 11%. More participants with mild intellectual disability had identified depressive symptoms (10.8%) than those with moderate (9.4%) or severe/profound (9.1%) intellectual disability.
Whereas only 6.4% of participants living independently/with family had depressive symptoms, it is interesting to note that there was no significant difference between those in either institu-tions (11.1%) or community group homes (11.3%) (Figure 4.4).
Figure 4.4 Glasgow Depression Scale and living situation
0.00%
5.00%
10.00%
15.00%
20.00%
25.00%
Glasgow Depression
Independent / Family Community group home Residential Care
Note: n = 291; Error bars correspond to 95% confidence intervals

9393
4.5 Anxiety
4.5.1 The Glasgow Anxiety Scale (GAS-LD)
The Glasgow Anxiety Scale for people with a Learning Disability (GAS-LD) was developed by Mindham and Espie (2003) to support the assessment of anxiety in individuals with an intellectual disability (ID). The 27 item self-rated scale covers domains of worries, specific fears and physiological symptoms. Each item is scored as (0) -‘never’, (1) -‘sometimes’ and (2) -‘always’. An easy-read version using symbols to assist interpretation was available to respondents to support self-completion.
4.5.1.1 Results
Total scores on the GAS-LD were obtained for 291 participants who, as with the GDS-LD, either self-responded, or responded with the assistance of a proxy. 15.1% of participants scored above the cut-off of 15, indicating presence of anxiety symptoms. This is considerably lower than the prevalence of anxiety as a reported diagnosis (32.4%), but it must be noted that the GAS-LD, like the GDS-LD, focuses on symptoms, not clinical diagnosis. Of those with identified symptoms 41.9% also had a reported diagnosis of anxiety from a doctor.
Within the 50-64 year age group, 16.0% had anxiety related symptoms as did 15.3% of those in the older 65+ year group and 9.4% of those under the age of 50 years (Figure 4.5). 16.5% of women and 13.2% of men displayed symptoms as did 18.8% of people with mild intellectual disability and 13.0% of those with moderate intellectual disability. No symptoms of anxiety were recorded amongst participants with severe/profound intellectual disability. It is of interest that participants living in community group homes were also more likely to experience anxiety-related symptoms (17.7% n=25) than those living independently or in institutional settings, 15.4% (n=12) and 9.7% (n=7) respectively.
Mental Health, Well-Being, Vitality and Life Events

Evidence from the first Ten Years of The Intellectual Disability Supplement to The Irish Longitudinal Study on Ageing (IDS-TILDA)
9494
Figure 4.5 Glasgow Anxiety Scale by age groups
0.00%
5.00%
10.00%
15.00%
20.00%
25.00%
30.00%
Glasgow Anxiety
<50 yrs 50-64 yrs 65+ yrs
Note: n = 291; Error bars correspond to 95% confidence intervals
4.6 Energy and Vitality IndexAs in Wave 2, a subset of questions was drawn from the 36-item Short Form Health Survey (SF-36) (Burke et al., 2014, Ware et al., 1994). The four questions utilised comprise the Energy and Vitality Index (EVI) subscale of the survey and explore respondent/proxy rated wellbeing over the preceding four weeks. Responses were recorded using a 6-point Likert scale from ‘All of the time’ to ‘None of the time’.
The EVI was completed by 598 participants. The mean score for all participants was 68.3 with a slightly higher score for males (69.7) than females (67.7). Scores were also higher for younger respondents (<50 years: 69.0; 50-65 years: 69.4; 65+ years: 65.3), for those with less severe levels of intellectual disability (moderate: 69.9; mild: 69.7; severe/profound: 65.6) and in those living independently or with family (independent/with family: 72.9; community group home: 70.8; institutions: 64.6) (Figure 4.6).

9595
Figure 4.6 Mean Energy and Vitality Index by living situation
0
10
20
30
40
50
60
70
80
90
Independent/Family CGH Institutional
Wave 3 Mean Vitality Wave 2 Mean Vitality
Note: Wave 2 n = 682; Wave 3 n = 598; Error bars correspond to 95% confidence intervals
The mean EVI score mirrors closely that of Wave 2 (67.2) and of the wider Irish population (68.0), as reported in the 2007 Survey of Lifestyle, Attributes and Nutrition (SLAN) (Morgan et al. 2008). In Wave 2, it was noted (citing Ball et al. 2011) that vitality reports by proxies, tend to be lower. This pattern was repeated in Wave 3, with a self-report vitality mean of 71.8, a self-report assisted by proxy mean of 70.6 and a proxy-report mean of 65.7.
4.7 Life Events
It is noteworthy that people with intellectual disability are reported to experience more negative and multiple life events than those without intellectual disability (Hermans & Evenhuis, 2012). Life events were assessed through the use of a 20-item checklist, based on Herman and Evenhuis’s (2012) Life Events Scale. It looks back over the previous 12 months, and includes items on relationships, living arrangements and bereavements, with the respondent asked to provide her/his perception as to whether the event was positive, negative of neutral.
The results closely reflected those of Wave 2, with nearly two thirds of respondents (63.0%) reporting more than one life event over the previous year, and 19.2% having experienced four or more such life events (Figure 4.7).
Mental Health, Well-Being, Vitality and Life Events

Evidence from the first Ten Years of The Intellectual Disability Supplement to The Irish Longitudinal Study on Ageing (IDS-TILDA)
9696
Figure 4.7: Number of life events (n=598)
0 life events12.7%
1 life event 24.2%
2 life events 24.9%
3 life events 18.9%
4 or more life events 19.2%
The most frequently reported events involved change of staff (65.9%), and particularly changes in key-workers (31.1%). Other life events of note were bereavements of a friend (23.9%) and having a new resident move into the living situation (18.7%). The significance of changes in the social environment of participants is evident in both Wave 2 and Wave 3 results (Figure 4.8
Figure 4.8 Most prevalent life events
01020304050607080
Change of sta� in
his/her home where he/she
lives or day service he/she
attends
Change of his/her key
worker
Death of a friend
New resident moved into
his/her home
Change at or from work or
day service
Major illness of a relative, caregiver or
friend
Major illness or injury
Change in frequency of visits from or
to family / friend
Wave 3 Wave 2
Note: Wave 2 n = 692; Wave 3 n = 598; Error bars correspond to 95% confidence intervals
The number of life events in the preceding 12 months may be associated with clinical diagnosis of mental ill health (Cooper et al., 2007).

9797
4.8 Conclusion
This chapter has provided an overview of the mental health of older adults with intellectual disability in Ireland. It has presented findings on the prevalence and incidence of reported mental health diagnoses and has examined these in the light of previous data from Waves 1 and 2 of the IDS-TILDA study. Furthermore, it has explored the social and living contexts within which people experience mental wellness/illness. In doing so, it also provides a dynamic picture of how these older people’s mental health compares with that of other older Irish adults who do not have intellectual disability.
Whilst there is limited data available on the overall prevalence of mental health diagnoses across the older Irish population, it is known that anxiety and depression are significant in the lives of older people generally. It appears, though, that older adults with intellectual disability are experiencing poorer mental health than their counterparts without identified disabilities. Anxiety and depression are major contributors, with depression, in particular, significantly more prevalent. Of particular note here was the finding that the prevalence of depression amongst those living independently and with family was less than that found amongst participants living in other types of accommodation.
In this wave, two new measures, the Glasgow Depression Scale and the Glasgow Anxiety Scale were introduced. They proved both feasible for use and reliable in administration and will be useful in tracking changes in these conditions in subsequent waves
Mental health is often a result of the ability to balance stressors with coping abilities. The role of the social environment in the lives of older adults with intellectual disabilities is becoming significant across the study waves. Many participants identified a high number of stressful life events over the course of the past year, including loss of relationships due to staff changes, death, and the arrival of new residents. The environments in which people with ID live may be quite unlike those of other older Irish people and the social connections may also be different. The contribution of these factors to the mental health of older adults with intellectual disability warrants ongoing consideration.
Mental Health, Well-Being, Vitality and Life Events

Evidence from the first Ten Years of The Intellectual Disability Supplement to The Irish Longitudinal Study on Ageing (IDS-TILDA)
9898
References
Burke, E., McCallion, P., & McCarron, M. (2014). Advancing Years, Different Challenges: Wave 2 IDS-TILDA. Dublin: Trinity College Dublin.
Canney, M., McNicholas, T., Scarlett, S., & Briggs, R. (2017). Prevalence and Impact of Chronic Debilitating Disorders. In: C. McGarrigle, O. Donoghue, S. Scarlett & R.A. Kenny. Health and Wellbeing: Active Ageing for Older Adults in Ireland. Evidence from The Irish Longitudinal Study on Ageing. Dublin: Trinity College Dublin.
Cooper, S.A., Smiley, E., Morrison, J., Williamson, A., & Allan, L. (2007). Mental ill-health in adults with intellectual disabilities: prevalence and associated factors. British Journal of Psychiatry.190, 27-35.
Cooper, S.A., McLean, G., Guthrie, B., McConnachie, A., Mercer, S., Sullivan, F., & Morrison, J. (2015). Multiple physical and mental health comorbidity in adults with intellectual disabilities: population-based cross-sectional analysis. BMC Family Practice, 16(110), 2-11.
Cuthill, F.M., Espie, C.A., & Cooper, S.A. (2003). Development and psychometric properties of the Glasgow Depression Scale for people with a Learning Disability: Individual and carer supplement versions. British Journal of Psychiatry, 182(4), 347-353.
Hermans, H., & Evenhuis, H.M. (2010). Characteristics of instruments screening for depression in adults with intellectual disabilities: systematic review. Research in Developmental Disabilities, 31(6), 1109-1120.
Hermans, H., & Evenhuis, H.M. (2012). Life events and their associations with depression and anxiety in older people with intellectual disabilities: Results of the HA-ID study. Journal of Affective Disorders, 138(1-2), 79-85.
Mindham, J., & Espie, C.A. (2003). Glasgow Anxiety Scale for people with an Intellectual Disability (GAS-ID): development and psychometric properties of a new measure for use with people with mild intellectual disability. Journal of Intellectual Disability Research, 47(1), 22-30.
Morgan, K., McGee, H., Watson, D., Perry, I., Barry, M., Shelley, E., Brugha, R. (2008). SLÁN 2007: Survey of Lifestyle, Attitudes & Nutrition in Ireland. Main Report. Dublin: Department of Health and Children.
O’Regan, C., Cronin, H. & Kenny, R.A. (2011) ‘Mental Health and Cognitive Function’. In: A. Barrett, G. Savva, V. Timonen & R.A. Kenny. Fifty Plus in Ireland 2011. Dublin: TILDA.

9999
Sheehan, R., Hassiotis, A., Walters, K., Osborn, D., Strydom, A., & Horsfall, L. (2015). Mental illness, challenging behaviour, and psychotropic drug prescribing in people with intellectual disability: UK population based cohort study. British Medical Journal. http://dx.doi.org/10.1136/bmj.h4326.
Ware, J.E., Kosinski, M., & Keller, S.D. (1994). SF-36 Physical and Mental Health Summary Scales: A User’s Manual. Boston: The Health Institute, New England Medical Center.
Mental Health, Well-Being, Vitality and Life Events

Evidence from the first Ten Years of The Intellectual Disability Supplement to The Irish Longitudinal Study on Ageing (IDS-TILDA)
100100
Contents5.1 Key findings . . . . . . . . . . . . . . . . . . . . . . . . . . . . . . . . . . . . . . . . . . . . . . . . . . . . . . . . . . . . . . . . . . . . 102
5.2 Introduction . . . . . . . . . . . . . . . . . . . . . . . . . . . . . . . . . . . . . . . . . . . . . . . . . . . . . . . . . . . . . . . . . . . . 102
5.3 Changes in service use . . . . . . . . . . . . . . . . . . . . . . . . . . . . . . . . . . . . . . . . . . . . . . . . . . . . . . . . . . . 103
5.3.1 Medical cover . . . . . . . . . . . . . . . . . . . . . . . . . . . . . . . . . . . . . . . . . . . . . . . . . . . . . . . . . . . . . . 103
5.3.2 Use of health services . . . . . . . . . . . . . . . . . . . . . . . . . . . . . . . . . . . . . . . . . . . . . . . . . . . . . . . 103
5.3.3 Health screening . . . . . . . . . . . . . . . . . . . . . . . . . . . . . . . . . . . . . . . . . . . . . . . . . . . . . . . . . . . 106
5.3.4 Use of specialist health and social care services . . . . . . . . . . . . . . . . . . . . . . . . . . . . . . . . 107
5.4 Conclusion . . . . . . . . . . . . . . . . . . . . . . . . . . . . . . . . . . . . . . . . . . . . . . . . . . . . . . . . . . . . . . . . . . . . . . 108
References . . . . . . . . . . . . . . . . . . . . . . . . . . . . . . . . . . . . . . . . . . . . . . . . . . . . . . . . . . . . . . . . . . . . . . . . . . 109
5 Health Care UtilisationMary-Ann O’Donovan, Rachael Carroll, Philip McCallion and Mary McCarron

102102
Evidence from the first Ten Years of The Intellectual Disability Supplement to The Irish Longitudinal Study on Ageing (IDS-TILDA)
5.1 Key findings
• The majority of IDS-TILDA participants continue to access health services using a medical or GP card.
• Private health insurance was low for people with an intellectual disability at 0.5% compared with 35.0% reported for the TILDA population.
• There was a trend for increased health service use demonstrated by increases in emergency department admissions, GP use, outpatient appointments and hospital admissions.
• There were increases in the percentage of participants reporting accessing health screening services including prostate cancer checks and breast checks.
• There was a much higher rate of flu vaccinations for the ID population (90.9% compared with 47.5%) compared with the older general population.
5.2 Introduction
As people with intellectual disability age, health needs change with a greater need for health services likely. Access and utilisation of health care is identified as a key health indicator for people with intellectual disability (Ouellette-Kuntz, 2005).
This chapter reports on health care utilisation by IDS-TILDA participants. It examines the medical cover status in terms of using a medical or GP card, and the extent to which private health insurance is utilised. It examines patterns in use in the various health services that are available and trends that have emerged over the 10-year period since IDS-TILDA began.
5 Health Care Utilisation
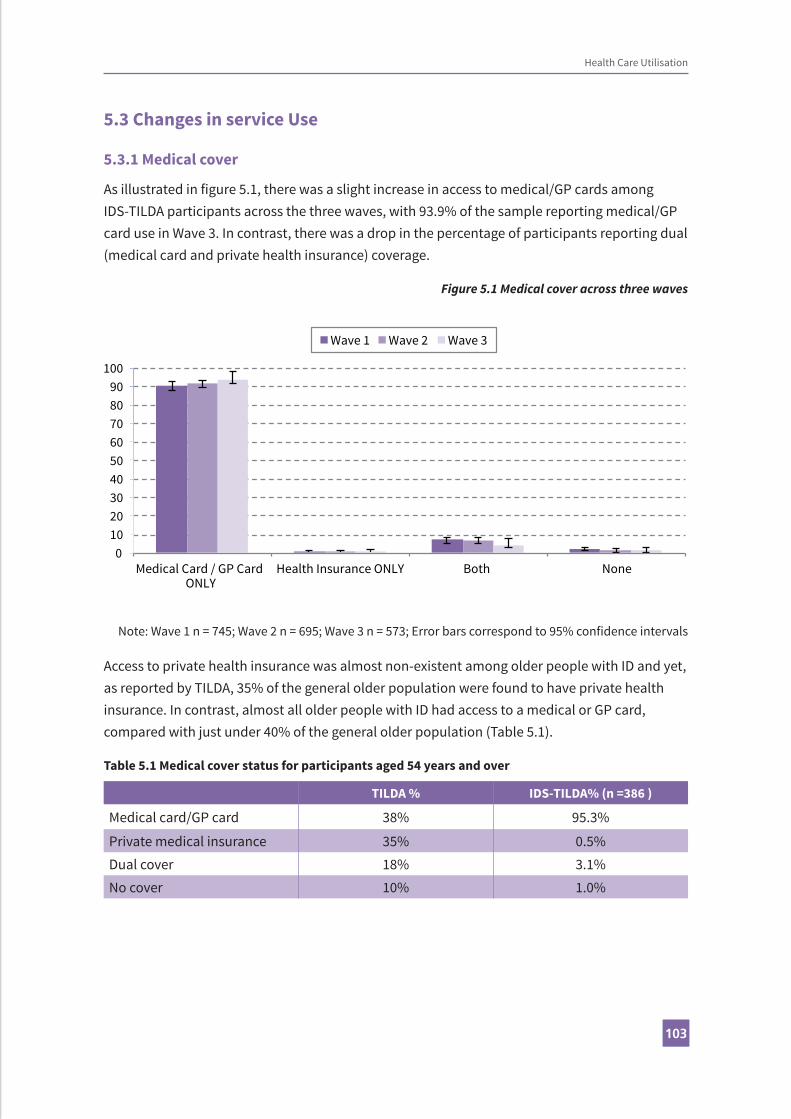
103103
5.3 Changes in service Use
5.3.1 Medical cover
As illustrated in figure 5.1, there was a slight increase in access to medical/GP cards among IDS-TILDA participants across the three waves, with 93.9% of the sample reporting medical/GP card use in Wave 3. In contrast, there was a drop in the percentage of participants reporting dual (medical card and private health insurance) coverage.
Figure 5.1 Medical cover across three waves
0102030405060708090
100
Medical Card / GP Card ONLY
Health Insurance ONLY Both None
Wave 1 Wave 2 Wave 3
Note: Wave 1 n = 745; Wave 2 n = 695; Wave 3 n = 573; Error bars correspond to 95% confidence intervals
Access to private health insurance was almost non-existent among older people with ID and yet, as reported by TILDA, 35% of the general older population were found to have private health insurance. In contrast, almost all older people with ID had access to a medical or GP card, compared with just under 40% of the general older population (Table 5.1).
Table 5.1 Medical cover status for participants aged 54 years and over
TILDA % IDS-TILDA% (n =386 )
Medical card/GP card 38% 95.3%
Private medical insurance 35% 0.5%Dual cover 18% 3.1%No cover 10% 1.0%
Health Care Utilisation

Evidence from the first Ten Years of The Intellectual Disability Supplement to The Irish Longitudinal Study on Ageing (IDS-TILDA)
104104
5.3.2 Use of health services
Use of GP and outpatient services remained consistent from Wave 1 (Figure 5.2) and GP use was similar to that reported for the general population – 95.8% compared with 91%. There was a slight increase in emergency department visits from 20.1% in Wave 1 to 29.1% at Wave 3 and this was higher than that reported by TILDA for the general population at 18%.
Similarly, hospital admissions rose from 11.1% in Wave 1 to 14.9% at Wave 3. However, rates of hospital admissions at Wave 2 and Wave 3 were stable.
Figure 5.2 Health service use across three waves
0
10
20
30
40
50
60
70
80
90
100
GP Visit Outpatient Visit Emergency DepartmentVisit
Hospital Admission
Wave 1 Wave 2 Wave 3
Note: Wave 1 n = 658; Wave 2 n = 601; Wave 3 n = 589; Error bars correspond to 95% confidence intervals
GP use was consistently high across all ages of the ID population in both Wave 1 and Wave 3 (Table 5.2). Though there was a decrease in GP utilisation among the 65-69 years age group between waves, there was an increase in both emergency department and hospital admissions between 2014 and 2017 for this age group. The only age group among the ID population not experiencing increased utilisation of emergency department services was the 60-64 years age group.

105105
Tabl
e 5.
2 H
ealt
h se
rvic
e us
e by
age
and
med
ical
cove
r sta
tus (
n =
589)
Ge
nera
l Pra
ctiti
oner
Out
patie
nts
Emer
genc
y De
part
men
tH
ospi
tal A
dmis
sion
W
ave
1W
ave
3W
ave
1W
ave
3W
ave
1W
ave
3W
ave
1W
ave
3<5
4 yr
s94
.495
.948
.455
.118
.826
.111
.213
( 9
1.5-
96.3
)(9
2.1-
97.9
)(4
3.5-
53.4
)(4
7.0-
62.9
)(1
5.3-
22.9
)(2
0.2-
33.1
)(8
.4-1
4.8)
(8.8
-18.
9)
54-5
994
.496
.743
.349
.616
.430
5.4
18
(8
8.9-
97.3
)(9
2.5-
98.6
)(3
5-52
)(4
1.0-
58.2
)(1
1.3-
23.3
)(2
2.8-
38.4
)(2
.6-1
0.7)
(12.
3-25
.5)
60-6
498
.496
.765
.270
.630
.823
.513
.312
.5
(9
1.7-
99.7
)(9
0.8-
98.9
)(5
3.4-
75.4
)(5
8.9-
80.1
)(2
1.6-
41.7
)(1
5.6-
33.8
)(7
.4-2
2.8)
(6.7
-22.
1)
65-6
995
.290
5054
.316
.729
.811
.318
(8
6.7-
98.3
)(7
9.9-
95.3
)(3
7.9-
62.1
)(4
0.2-
67.8
)(9
.6-2
7.4)
(19.
5-42
.7)
(5.6
-21.
5)(9
.8-3
0.8)
70-7
993
9659
.552
.429
.839
.722
.712
.5
(8
1.4-
97.6
)(8
8.9-
98.6
)(4
4.5-
73.0
)(4
0.3-
64.2
)(1
8.7-
44.0
)(2
8.5-
52.0
)(1
2.8-
37.0
)(6
.5-2
2.8)
80+
100
100
44.4
35.7
22.2
37.5
12.5
20
(6
4.6-
100.
0)(8
0.6-
100)
(18.
9-73
.3)
(16.
3-61
.2)
(6.3
-54.
7)(1
8.5-
61.4
)(2
.2-4
7.1)
(7.0
-45.
2)
Med
ical
Car
d O
nly
94.9
96.7
49.4
54.2
19.4
28.6
10.7
14.3
(9
2.8-
96.4
)(9
4.8-
97.9
)(4
5.5-
53.3
)(4
9.5-
58.8
)(1
6.6-
22.6
)(2
4.8-
32.8
)(8
.6-1
3.4)
(11.
4-17
.8)
Hea
lth In
sura
nce
Onl
y10
010
050
5050
050
0
(3
4.2-
100)
(43.
9-10
0.0)
(9.5
-90.
5)(9
.5-9
0.5)
(9.5
-90.
50(0
-79.
3)(9
.5-9
0.5)
(0-7
9.3)
Dual
Cov
er93
.692
53.1
7026
.430
.414
20
(8
2.8-
97.8
)(7
5.0-
97.8
)(3
9.4-
66.3
)(4
8.1-
85.5
)(1
6.4-
39.6
)(1
5.6-
50.9
)(7
.0-2
6.2)
(8.1
-41.
6)
Non
e92
.985
.766
.775
2066
.77.
133
.3
(6
8.5-
98.7
)(4
8.7-
97.4
)(3
9.1-
86.2
)(3
0.1-
95.4
)(7
.0-4
5.2)
(30.
0-90
.3)
(1.3
-31.
5)(9
.7-7
0.0)
Tota
l94
.895
.849
.954
.920
.129
.111
.114
.9
n65
658
969
146
375
052
370
249
8
Health Care Utilisation
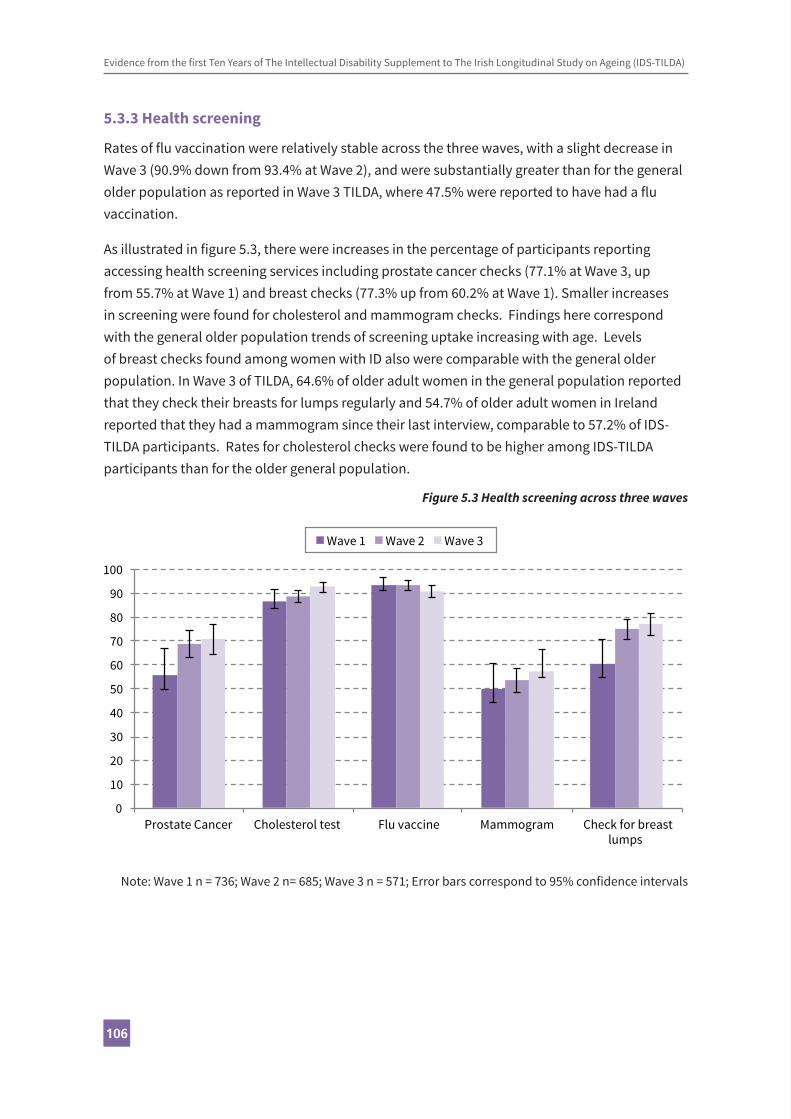
Evidence from the first Ten Years of The Intellectual Disability Supplement to The Irish Longitudinal Study on Ageing (IDS-TILDA)
106106
5.3.3 Health screening
Rates of flu vaccination were relatively stable across the three waves, with a slight decrease in Wave 3 (90.9% down from 93.4% at Wave 2), and were substantially greater than for the general older population as reported in Wave 3 TILDA, where 47.5% were reported to have had a flu vaccination.
As illustrated in figure 5.3, there were increases in the percentage of participants reporting accessing health screening services including prostate cancer checks (77.1% at Wave 3, up from 55.7% at Wave 1) and breast checks (77.3% up from 60.2% at Wave 1). Smaller increases in screening were found for cholesterol and mammogram checks. Findings here correspond with the general older population trends of screening uptake increasing with age. Levels of breast checks found among women with ID also were comparable with the general older population. In Wave 3 of TILDA, 64.6% of older adult women in the general population reported that they check their breasts for lumps regularly and 54.7% of older adult women in Ireland reported that they had a mammogram since their last interview, comparable to 57.2% of IDS-TILDA participants. Rates for cholesterol checks were found to be higher among IDS-TILDA participants than for the older general population.
Figure 5.3 Health screening across three waves
0
10
20
30
40
50
60
70
80
90
100
Prostate Cancer Cholesterol test Flu vaccine Mammogram Check for breast lumps
Wave 1 Wave 2 Wave 3
Note: Wave 1 n = 736; Wave 2 n= 685; Wave 3 n = 571; Error bars correspond to 95% confidence intervals

107107
5.3.4 Use of specialist health and social care services
GP services were used by 95.8% of Wave 3 participants. The next most frequently used health and social care services were dental (65.6%), pharmacy (57.6%), optician (55.4%) and day services (42.9%). As may be seen in figure 5.4, the rates were consistent across all three waves.
Figure 5.4 Use of specialist health and social care services across three waves
0 10 20 30 40 50 60 70 80 90 100
Wave 1 Wave 2 Wave 3
GP
Psychological
Psychological Counselling
Day centre services
Pallative Day Care Services
Pallative Home Care
Pallative care services
Dermatological services
Endocrinology services
Geriatrician services
Neurological services
Psychiatric services
Respite
Residential
Speech and Language therapy
Dietician service
Pharmacy
Hearing services
Dental services
Optician
Meals on wheels
Personal Care
Home Help services
Psychological services/counselling
Socail Work
Physiotherapy
Chiropody service
Occupational Therapy
Public Health Nurse
Note: Wave 1 n = 751; Wave 2 n = 69; Wave 3 n = 587; Error bars correspond to 95% confidence intervals
Health Care Utilisation

Evidence from the first Ten Years of The Intellectual Disability Supplement to The Irish Longitudinal Study on Ageing (IDS-TILDA)
108108
Also to be seen in figure 5.4, are increases in the use between Wave 1 and Wave 3 for optician services (55.4% up from 41.4% in Wave 1), public health nurse (15.7% up from 10.7%), occupational therapy services (31.0% up from 22.1%), chiropody services (76.0% up from 62.5%) and physiotherapy (35.4% up from 26.2%). Use of dental services at Wave 3 was 65.6%, up from 59.4% at Wave 2 which had been a drop from 63.2% at Wave 1.
5.4 ConclusionThis chapter provided an overview of the health care utilisation of older adults with an intellectual disability in Ireland. Findings included that the majority of IDS-TILDA participants continued to access health services using a medical or GP card and that private health insurance use was low for people with an intellectual disability compared with the wider population. As expected with an ageing cohort, there was increased health service use since previous waves with increases in particular in emergency department admissions, GP use, outpatient appointments and hospital admissions. As is true for the general ageing population planning for health services for people with ID as they age means that health care providers must question prior practices, face challenges of polypharmacy, deal with the consequences of prior decisions regarding oral health and engage in proactive not just responsive health care delivery, Increases in the percentage of participants reporting accessing health screening services, including prostate cancer checks and breast checks and a greater uptake of flu vaccinations for the ID population compared with the older general population offer hope for a prevention, not just a treatment approach. The ongoing evolution of healthcare delivery will be a focus for future waves for people with ID.

109109
References
Leeder, S.R., Dominello, A. (2005). Health, Equity and Intellectual Disability. Journal of Applied Research in Intellectual Disabilities, 18, 97-100.
Ouellette-Kuntz, H. (2005). Understanding Health Disparities and Inequities faced by Individuals with Intellectual Disabilities. Journal of Applied Research in Intellectual Disabilities, 18, 113-21.
Straetmans, J.M., Van Schrojenstein Lantman-de Valk, H.M., Schellevis, F. G., & Dinant G-J. (2007). Health problems of people with intellectual disabilities: the impact for general practice. British Journal of General Practice, 57, 64-6.
Webber, R., Bowers, B., & Bigby, C. (2010). Hospital experiences of older people with intellectual disability: responses of group home staff and family members. Journal of Intellectual and Developmental Disability, 35(3), 155-64.
Health Care Utilisation

Evidence from the first Ten Years of The Intellectual Disability Supplement to The Irish Longitudinal Study on Ageing (IDS-TILDA)
110110
Contents6.1 Key findings . . . . . . . . . . . . . . . . . . . . . . . . . . . . . . . . . . . . . . . . . . . . . . . . . . . . . . . . . . . . . . . . . . . . . 112
6.2 Wave 3 survey methodology . . . . . . . . . . . . . . . . . . . . . . . . . . . . . . . . . . . . . . . . . . . . . . . . . . . . . . 113
6.3 Objective health measures . . . . . . . . . . . . . . . . . . . . . . . . . . . . . . . . . . . . . . . . . . . . . . . . . . . . . . . 114
6.4 CAPI response rates . . . . . . . . . . . . . . . . . . . . . . . . . . . . . . . . . . . . . . . . . . . . . . . . . . . . . . . . . . . . . . 115
6.4.1 Reasons for attrition at Wave 3 . . . . . . . . . . . . . . . . . . . . . . . . . . . . . . . . . . . . . . . . . . . . . . . 115
6.4.2 PIQ completion rates . . . . . . . . . . . . . . . . . . . . . . . . . . . . . . . . . . . . . . . . . . . . . . . . . . . . . . . . 115
6.4.3 New items in Wave 3 . . . . . . . . . . . . . . . . . . . . . . . . . . . . . . . . . . . . . . . . . . . . . . . . . . . . . . . . 115
6.5 Dataset and analysis . . . . . . . . . . . . . . . . . . . . . . . . . . . . . . . . . . . . . . . . . . . . . . . . . . . . . . . . . . . . . 118
6.5.1 Analytical methods employed in this report . . . . . . . . . . . . . . . . . . . . . . . . . . . . . . . . . . . 118
6.5.2 Confidence intervals and statistical significance . . . . . . . . . . . . . . . . . . . . . . . . . . . . . . . 118
6.5.3 Software . . . . . . . . . . . . . . . . . . . . . . . . . . . . . . . . . . . . . . . . . . . . . . . . . . . . . . . . . . . . . . . . . . . 118
References . . . . . . . . . . . . . . . . . . . . . . . . . . . . . . . . . . . . . . . . . . . . . . . . . . . . . . . . . . . . . . . . . . . . . . . . . . 119
6 MethodologyRachael Carroll, Mary-Ann O’Donovan, Eilish Burke Madeline Smyth, Margaret Haigh, Philip McCallionand Mary McCarron

112112
Evidence from the first Ten Years of The Intellectual Disability Supplement to The Irish Longitudinal Study on Ageing (IDS-TILDA)
6.1 Key findings
• At Wave 1 (2010-2011), IDS-TILDA recruited a random sample of 753 adults from the National Intellectual Disability Database (NIDD) aged 40 years and over with an intellectual disability living in Ireland.
• At Wave 3 (2016-2017), 609 of these respondents completed the Computer Assisted Personal Interview (CAPI), while 594 (97.5%) of the Wave 3 respondents completed a pre-interview questionnaire (PIQ).
• The retention rate for Wave 3 was 86% (609 / 708); calculated as the percentage of respondents who completed at least one element of Wave 3. Seventy percent of the attrition was due to deaths.
• Among the Wave 2 respondents who were alive at Wave 3, the response rate was 95.5%
• Interviews continued to be a mix of self-report and proxy interviews. Proxy interviews were completed by family or staff.
6 Methodology

113113
Methodology
6.2 Wave 3 survey methodology
Details of sampling methods used in Waves 1 and 2 of IDS-TILDA have been reported previously (McCarron et al., 2011; Burke et al., 2014). At Wave 3, interviews were sought from all respondents who took part in any previous wave and who agreed to be contacted again. To reduce respondent burden, prior answers in the physical health section in Waves 1 and 2 were “fed forward” and confirmed, or updated, in Wave 3.
Data collection consisted of two components: a pre-interview questionnaire (PIQ) and a computer-assisted personal interview (CAPI) which included three objective measures of weight, waist circumference and upper mid arm circumference. The PIQ was sent a minimum of seven days prior to the face-to-face interview. Topics covered in the PIQ included medications, health service use and frequency, dietary information, and reported challenging behaviour. The CAPI, completed in person, included questions (Figure 6.1) on health, social and family circumstances, quality of life, and inter-personal relationships, and was administered by a trained interviewer in the location of the respondent’s choice. This was usually a day service or home setting.
Similar to Waves 1 and 2 a three-day comprehensive training programme was employed for all field researchers as well as a follow up review day to solidify training. Consistent with previous waves, field researchers had experience in the field of intellectual disability, were selected from across the country and attended in full all training. In total, 24 field researchers undertook training, with six return field researchers from previous waves. In addition to the training, an extra dimension was included which consisted of independent advocacy review of techniques. This consisted of an independent advocate (a person with an intellectual disability) reviewing and assessing elements of the training programme and assessing the field researchers administering these elements, which included gaining consent, administering the protocol and engaging the person in the mini health assessment.
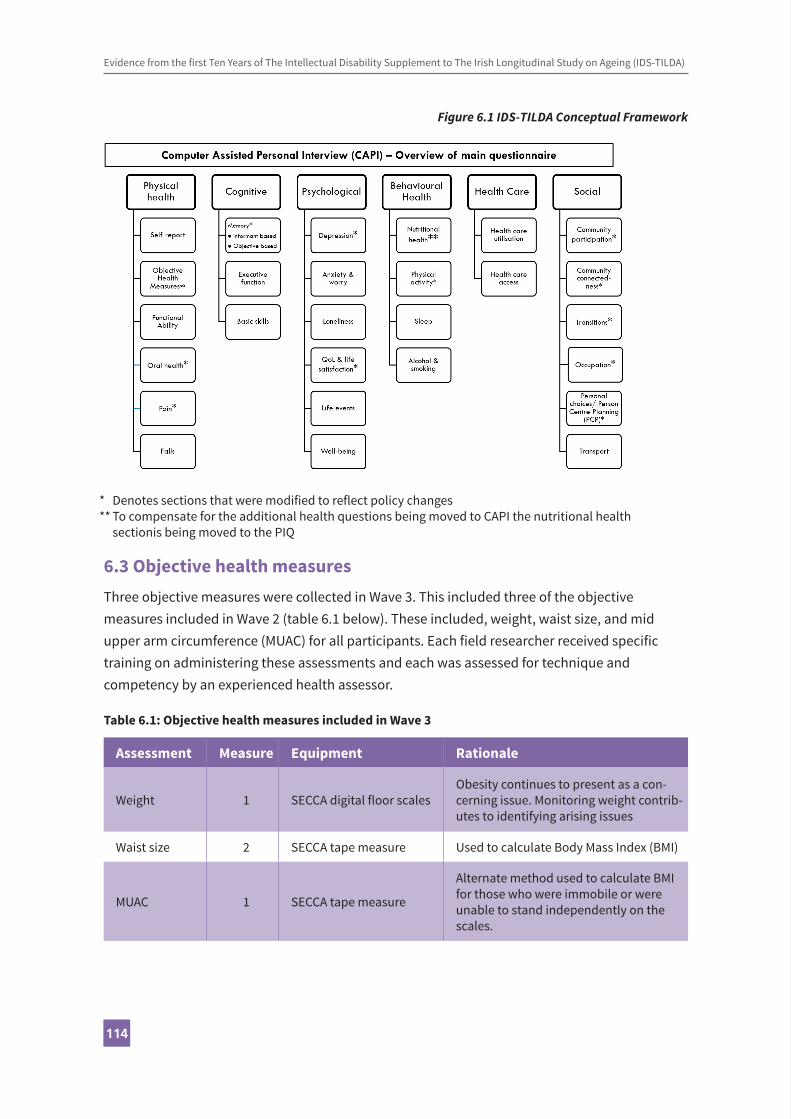
Evidence from the first Ten Years of The Intellectual Disability Supplement to The Irish Longitudinal Study on Ageing (IDS-TILDA)
114114
Figure 6.1 IDS-TILDA Conceptual Framework
6.3 Objective health measuresThree objective measures were collected in Wave 3. This included three of the objective measures included in Wave 2 (table 6.1 below). These included, weight, waist size, and mid upper arm circumference (MUAC) for all participants. Each field researcher received specific training on administering these assessments and each was assessed for technique and competency by an experienced health assessor.
Table 6.1: Objective health measures included in Wave 3
Assessment Measure Equipment Rationale
Weight 1 SECCA digital floor scalesObesity continues to present as a con-cerning issue. Monitoring weight contrib-utes to identifying arising issues
Waist size 2 SECCA tape measure Used to calculate Body Mass Index (BMI)
MUAC 1 SECCA tape measure
Alternate method used to calculate BMI for those who were immobile or were unable to stand independently on the scales.
* Denotes sections that were modified to reflect policy changes** To compensate for the additional health questions being moved to CAPI the nutritional health sectionis being moved to the PIQ
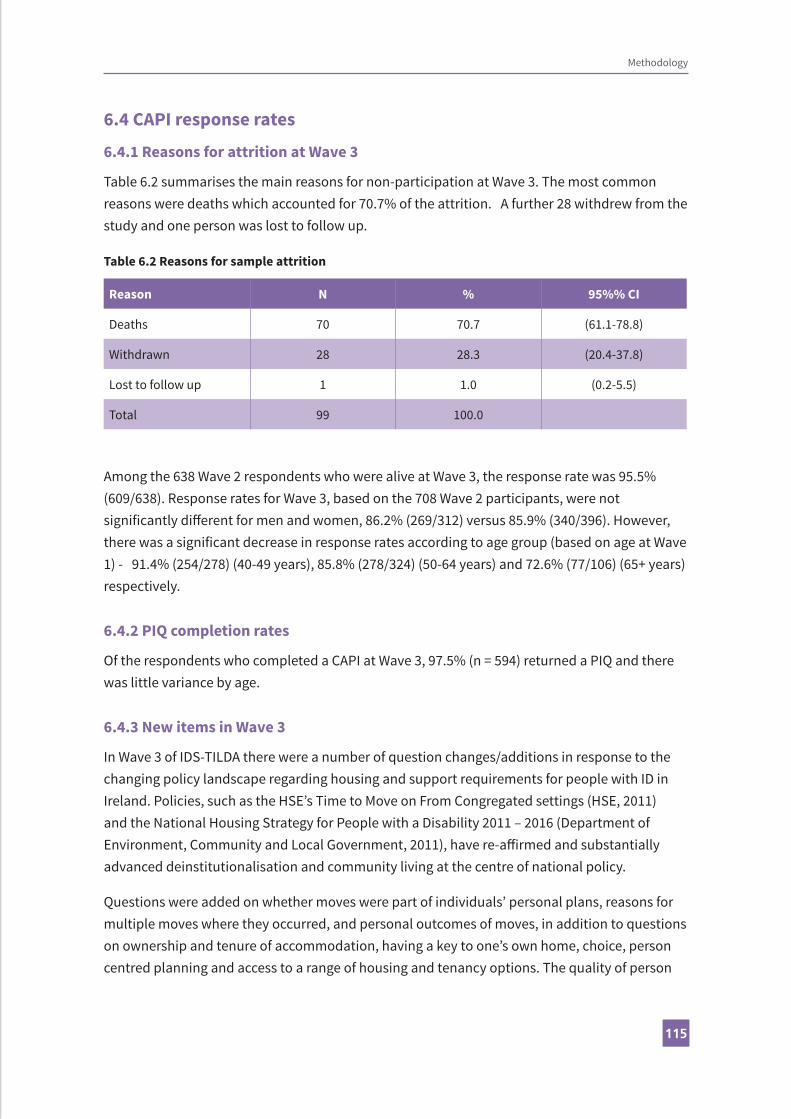
115115
6.4 CAPI response rates
6.4.1 Reasons for attrition at Wave 3
Table 6.2 summarises the main reasons for non-participation at Wave 3. The most common reasons were deaths which accounted for 70.7% of the attrition. A further 28 withdrew from the study and one person was lost to follow up.
Table 6.2 Reasons for sample attrition
Reason N % 95%% CI
Deaths 70 70.7 (61.1-78.8)
Withdrawn 28 28.3 (20.4-37.8)
Lost to follow up 1 1.0 (0.2-5.5)
Total 99 100.0
Among the 638 Wave 2 respondents who were alive at Wave 3, the response rate was 95.5% (609/638). Response rates for Wave 3, based on the 708 Wave 2 participants, were not significantly different for men and women, 86.2% (269/312) versus 85.9% (340/396). However, there was a significant decrease in response rates according to age group (based on age at Wave 1) - 91.4% (254/278) (40-49 years), 85.8% (278/324) (50-64 years) and 72.6% (77/106) (65+ years) respectively.
6.4.2 PIQ completion rates
Of the respondents who completed a CAPI at Wave 3, 97.5% (n = 594) returned a PIQ and there was little variance by age.
6.4.3 New items in Wave 3
In Wave 3 of IDS-TILDA there were a number of question changes/additions in response to the changing policy landscape regarding housing and support requirements for people with ID in Ireland. Policies, such as the HSE’s Time to Move on From Congregated settings (HSE, 2011) and the National Housing Strategy for People with a Disability 2011 – 2016 (Department of Environment, Community and Local Government, 2011), have re-affirmed and substantially advanced deinstitutionalisation and community living at the centre of national policy.
Questions were added on whether moves were part of individuals’ personal plans, reasons for multiple moves where they occurred, and personal outcomes of moves, in addition to questions on ownership and tenure of accommodation, having a key to one’s own home, choice, person centred planning and access to a range of housing and tenancy options. The quality of person
Methodology

Evidence from the first Ten Years of The Intellectual Disability Supplement to The Irish Longitudinal Study on Ageing (IDS-TILDA)
116116
centred planning examined how actively personal plans addressed the important priorities in people’s lives.
As may be seen in Table 6.3, a number of additional scales were also added in Wave 3 to gather more intensive data on issues emerging from Waves 1 and 2. Specifically, the Rapid Assessment of Physical Activity (RAPA; Topolski, LoGerfo, Patrick, Williams, Walwick & Patrick, 2006), validated measures of life satisfaction (Satisfaction with Life Scale - SWLS), purpose in life (Ryff Psychological Wellbeing Scale), and quality of life (ID version of the Personal Wellbeing Index) were included. The five-item SWLS measures global cognitive judgements of satisfaction with one’s life independent of interrelated constructs, such as positive affect or loneliness. This has high internal consistency and high temporal reliability and allows comparison with TILDA and international comparisons with Health and Retirement Study (HRS) and English Longitudinal Study of Ageing (ELSA). Similarly, the seven-item Purpose in Life Questionnaire, a subscale in the Ryff Psychological Wellbeing Scale, offers the potential for comparisons with HRS findings and with future waves of TILDA.
It is well recognised that mental health problems are common in people with intellectual disability, and occur at a significantly higher prevalence than in the general population (Cooper, Smiley, Morrison, Williamson, & Allan, 2007). Findings from the first two waves revealed that those reporting a doctor’s diagnosis of an emotional, nervous or psychiatric condition increased from almost 50% in Wave 1 to almost 60% in Wave 2. Prevalence of mental health conditions were higher in females and increased with age and increasing severity of intellectual disability. However, it has proved challenging to measure symptoms among participants when many participants do not have verbal skills. Therefore, to increase the number of participants for whom there will be more information available on symptoms and potential for diagnosis of depression and of anxiety, the 20-item Glasgow Depression Scale- Learning Disability (GDS-LD; Cuthill, Espie, & Cooper, 2003) and the 27-item Glasgow Anxiety Scale-Learning Disability (GAS-LD; Mindham & Espie, 2003) were added.
Preliminary findings from Wave 2 also identified a high prevalence of behaviours that challenge. The Behaviour Problem Inventory-Short Form (BPI-S; Rojahn et al., 2012), an informant based questionnaire, was added to Wave 3 to gather more detailed information on these behaviours. Carers were asked to rate the frequency and severity of thirty different behaviours which included items of aggression, self-injury and stereotyped behaviours.
Finally, the Dementia Screening Questionnaire for Individuals with Intellectual Disabilities (DSQID) was added to increase sensitivity in dementia assessment. The recently launched Dementia Strategy in Ireland (Department of Health, 2014) has recognised and recommended baseline screening and longitudinal follow up in people with ID, with persons with Down syndrome identified as being particularly at risk. Inclusion of the Dementia Screening Questionnaire for Individuals with Intellectual Disabilities (DSQID), for cognitive and memory

117117
decline in Wave 3, will enable IDS-TILDA to better track over time patterns of decline and identify key determinants of inter-individual variability.
Table 6.3 Summary table of additional scales for Wave 3
Scale Rationale
Physical Activity
The Rapid Assessment of Physical Activity (RAPA; Topolski, LoGerfo, Patrick, Williams, Walwick & Patrick, 2006). 9-item self-report questionnaire.
Measures level and intensity of physical activity for aerobic exercise, strength and flexibility in line with recommendations made by the National Guidelines on Physical Activity in Ireland (DOH, 2009).
Life Satisfaction
The Satisfaction with Life Scale (SWLS) is a 5-item self-report scale rated on a 6-point scale.
Purpose in Life Questionnaire is a 7-item subscale from The Ryff Psychological Wellbeing Scale (Ryff, 1989), rated on a 6-point scale.
Two subscales added to Wave 3, that measure global life satisfaction and purpose in life, support further comparisons with TILDA, Health and Retirement Study (HRS) and English Longitudinal Study of Ageing (ELSA).
Personal Well-Being and Social Connectedness
Closeness sub-scale of the Friendship Qualities Scale (Bukowski et al., 1994). Five-item scale with responses on a 5-point rating scale.
Intimacy sub-scale of the McGill Friendship Questionnaire (Mendelson & Aboud, 1999) Five-item scale with responses on an 8-point rating scale.
Quality of life sub-scale from the Personal Wellbeing Index-Intellectual Disability Version (Cummins, 1997). Eight-item scale with responses on an 11-point rating scale.
Scales regarding social connectedness, friendship and personal well-being were added to Wave 3 to build a better picture of quality of life and relationships for older adults with ID.
Mental Health
The 20-item Glasgow Depression Scale- Learning Disability (GDS-LD; Cuthill, Espie, & Cooper, 2003) and the 27-item Glasgow Anxiety Scale-Learning Disability (GAS-LD; Mindham & Espie, 2003).
Given the high prevalence of mental health problems in Wave 1, and significant increases by Wave 2 (from 41% to 60% point prevalence), further investigation in Waves 3 and 4, and determination of most appropriate instruments, was required. The GDS-LD and the GAS-LD were added, given their cut-off scores and strong validity and reliability psychometric findings.
Methodology

Evidence from the first Ten Years of The Intellectual Disability Supplement to The Irish Longitudinal Study on Ageing (IDS-TILDA)
118118
Behaviour that Challenges
The Behaviour Problem Inventory-Short Form (BPI-S; Rojahn et al., 2012). A 30 item questionnaire used to measure the frequency and severity of a range of aggressive, self-injurious and stereotyped behaviours.
Preliminary questions included in Wave 2 indicated a high prevalence of behaviour that challenges in this population. A validated measure of challenging behaviour was included in Wave 3 to gain a better understanding of prevalence and associated risk factors.
Dementia
Dementia Screening Questionnaire for Individuals with Intellectual Disability (DSQID; Deb, Hare & Prior, 2007). 43-item questionnaire rated on a 4-point scale.
Given the increased risk of developing dementia in people with Down syndrome confirmed in Wave 2, the DQSID was added for Waves 3 and 4 as a screening measure for cognitive and memory decline.
6.5 Dataset and analyses
6.5.1 Analytical methods employed in this report
Statistical methods used to calculate the estimates presented in this report are described below.
6.5.2 Confidence intervals and statistical significance
Throughout this report, the majority of estimates reflect the percentage of adults within specific age groups, cohorts, or other analysis criteria. Means or medians of specific measured quantities are reported where appropriate. Each respondent in the IDS-TILDA study corresponds with a given number of individuals in the NIDD and, to account for inherent uncertainty in the derived estimates, they are presented with 95% confidence intervals (CI).
6.5.3 Software
All analyses in this report were conducted using SPSS V 24.0.

119119
References
Burke, E., McCarron, M. & McCallion, P. (2014). Advancing years, different challenges: Wave 2 IDS-TILDA, Findings on the ageing of people with an intellectual disability. Dublin: Trinity College Dublin.
Bukowski, W. M., Hoza, B. & Boivin, M. (1994). Measuring friendship quality during pre-and early adolescence: The development and psychometric properties of the Friendship Qualities Scale. Journal of Social and Personal Relationships, 11(3), 471-84.
Cooper, S.-A., Smiley, E., Morrison, J., Williamson, A., & Allan, L. (2007). Mental ill-health in adults with intellectual disabilities: prevalence and associated factors. The British Journal of Psychiatry, 190(1), 27-35.
Cummins, R. A. (1997). The Comprehensive Quality of Life Scale: Intellectual disability (5th ed.). Melbourne, Deakin University.
Cuthill, F. M., Espie, C. A., & Cooper, S. (2003). Development and psychometric properties of the Glasgow Depression Scale for people with a learning disability: Individual and carer supplement versions. The British Journal of Psychiatry, 182(4), 347-353.
Deb S., Hare M. & Prior L. (2007). Symptoms of dementia among adults with Down’s syndrome: a qualitative study. Journal of Intellectual Disability Research, 51 (9), 726- 739.
Department of Environment, Community and Local Government. (2011). National Housing Strategy for People with a Disability 2011-2016. Dublin: The Stationery Office.
Department of Health. (2009).The National Guidelines on Physical Activity for Ireland. Dublin: The Stationery Office.
Department of Health. (2014).The Irish National Dementia Strategy. Dublin: The Stationery Office.
Health Service Executive. (2011). Time to Move on from Congregated Settings. A Strategy for Community Inclusion. Report of the working group on congregated settings. Dublin: Health Service Executive.
Matson, J. L., & Shoemaker, M. E. (2011). Psychopathology and intellectual disability. Current Opinion in Psychiatry, 24(5), 367-371.
McCarron, M., Swinburne, J., Burke, E., McGlinchey, E., Mulryan, N., Andrews, V., Foran, S. & McCallion, P. (2011). Growing older with an intellectual disability in Ireland in 2011: First results from the Intellectual Disability Supplement of the Irish Longitudinal Study on Ageing. Dublin: Trinity College Dublin.
Methodology

Evidence from the first Ten Years of The Intellectual Disability Supplement to The Irish Longitudinal Study on Ageing (IDS-TILDA)
120120
Mendelson, M. J. & Aboud, F. E. (1999). Measuring friendship quality in late adolescents and young adults: McGill Friendship Questionnaires. Canadian Journal of Behavioural Science/Revue canadienne des sciences du comportement, 31(2), 130.
Mindham, J., & Espie, C. A. (2003). Glasgow Anxiety Scale for people with an Intellectual Disability (GAS-ID): Development and psychometric properties of a new measure for use with people with mild intellectual disability. Journal of Intellectual Disability Research, 47(1), 22-30.
Rojahn, J., Rowe, E. W., Sharber, A. C., Hastings, R., Matson, J. L., Didden, R., & ... Dumont, E. M. (2012). The behavior problems inventory short form for individuals with intellectual disabilities: Part I: Development and provisional clinical reference data. Journal of Intellectual Disability Research, 56(5), 527-545.
Ryff, C. D. (1989). Happiness is everything, or is it? Explorations on the meaning of psychological well-being. Journal of Personality and Social Psychology, 57, 1069–1081.
Topolski, T.D., LoGerfo, J., Patrick, D.L., Williams, B., Walwick, J., & Patrick, M.B. (2006). The Rapid Assessment of Physical Activity (RAPA) among older adults. Preventing Chronic Disease, 3(4), 1-8.

121

122