2017 pre-thanksgiving pulse survey november 20, 2017 · 2017 pre-thanksgiving pulse survey. ......
TRANSCRIPT

November 20, 20172017 pre-Thanksgiving pulse survey

2017 pre-Thanksgiving pulse surveyCopyright © 2017 Deloitte LLP. All rights reserved. 2
Executive Summary
• Approximately three quarters of shoppers plan to shop during the period that runs from Thanksgiving Day through Cyber Monday. Across US regions, shoppers are expected to spend more than last year –$427 (+7% YoY) – with the Midwest region ($517) spending the most.
• Similar to last year, online (91%) is expected to attract slightly more customer spend than in-store (85%) during the Thanksgiving period. Spending will likely differ across income and age groups.
• Approximately 90% of shoppers expect to spend the same as or more than they had planned earlier in the season, with incremental budget being allocated to buying gifts over experiences.
• 51% cited traditional department stores as their most preferred retail venue for Thanksgiving shopping.
• GenXers are likely to outspend ($626 versus $427) other generations in terms of average Thanksgiving spend—especially among high-income level households (annual income of $100,000 and more).
• 39% of digitally savvy shoppers expect retailers to be more responsive in store by providing reliable Wi-Fi connectivity—38% expect to buy online while in store if better pricing and/or price matching is offered.
• Black Friday will have the most in-store shoppers during Thanksgiving period, with early morning shoppers (those starting before 5am) likely to outspend other shopper groups.
• Thanksgiving Day is expected to be one of the lightest shopping days of the period with three fourths of in-store purchases anticipated to be driven by promotions.

2017 pre-Thanksgiving pulse surveyCopyright © 2017 Deloitte LLP. All rights reserved. 3
Contents
Thanksgiving period dashboard 3
2017 holiday season to date 5
Shopping during the Thanksgiving period 8
Thanksgiving Day and Black Friday 19
Research to prepare for the weekend 27

2017 pre-Thanksgiving pulse surveyCopyright © 2017 Deloitte LLP. All rights reserved. 4
Thanksgiving period dashboard
75%
Will shop during Thanksgiving
88%
Expect spend more/same
63%
Started shopping
20%
% of budget spent
Will shop online Will shop in-store Webrooming Showrooming
N=1,224
91% 85% 69% 46%
n=921
Shoppers will spend an average of $427 during 2017 Thanksgiving period, up from $400 in 2016
2017 holiday season to date

2017 pre-Thanksgiving pulse surveyCopyright © 2017 Deloitte LLP. All rights reserved. 6
Spending plans: Almost nine in 10 shoppers expected to spend the same or more than earlier planned – with the bulk of the incremental budget going toward gifts
On what will shoppers spend more?(Among 37% who plan to spend more)
82%
45%
44%
38%
30%
23%
Gifts
Gift cards/giftcertificates
Entertainingat home
Socializingaway from
home
Non-giftclothing for
yourself or family
Home / holidayfurnishings
Expect to spend more,
37%
Expect to spend less,
12%
Expect to
spend the
same,51%
How do your holiday spending plans compare to just a month or two ago?
“How do your overall holiday spending plans compare to just a month or two ago?” (N=1224)“What are the reasons why you plan to spend more?” (n=455)

2017 pre-Thanksgiving pulse surveyCopyright © 2017 Deloitte LLP. All rights reserved. 7
Spending plans: Nearly four in 10 shoppers have not yet started their holiday shopping
40%
21%
8% 8%11%
12%
37%
24%
10% 10% 9%11%
0% 1%-10% 11%-20% 21%-30% 31%-50% >50%
2016 2017
% of holiday shopping completed
20% of holiday shopping budget spent (on average)
“How much of your holiday gift spending have you completed to date?” (N=1224)
Yet to start

Shopping during the Thanksgiving period

2017 pre-Thanksgiving pulse surveyCopyright © 2017 Deloitte LLP. All rights reserved. 9
Thanksgiving shoppers: Three quarters plan to shop during the peak Holiday weekend, revealing a close mix of online and offline channels
“Do you expect to do any shopping either online or in-store over the Thanksgiving period – including Thanksgiving Thursday through the following Monday?” (N=1,224)
Plan to shop during Thanksgiving period (Thanksgiving Day through Cyber Monday)
76%YesNo
85% plan to shopin-store
91% plan to shoponline
Among shoppers who plan to shop…(Thanksgiving Day through Cyber Monday)
25%
2017 pre-Thanksgiving pulse surveyCopyright © 2017 Deloitte LLP. All rights reserved. 10
Average spend
Share of spend
Share ofspend
Average spend
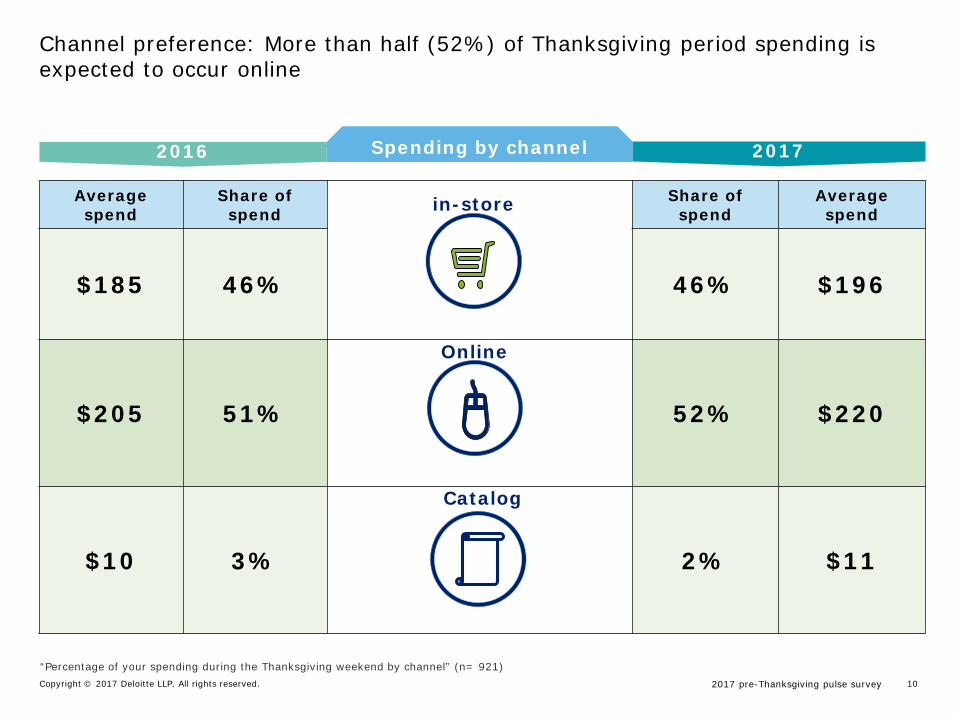
$185 46% 46% $196
$205 51% 52% $220
$10 3% 2% $11
Channel preference: More than half (52%) of Thanksgiving period spending is expected to occur online
Spending by channel2016 2017Spending by channel
in-store
Online
Catalog
“Percentage of your spending during the Thanksgiving weekend by channel” (n= 921)

2017 pre-Thanksgiving pulse surveyCopyright © 2017 Deloitte LLP. All rights reserved. 11
37%
31%
52%
70%
25%
72%
25%
24%
47%
28%
91% plan to shop
“On what days do you expect to shop in-stores?” n= 781; “On what days do you expect to shop online?” n= 839
Channel preference: Black Friday is expected to draw the biggest in-store crowds while Cyber Monday wins online
(% for 2016 survey)
(vs 30%)
(vs 36%)
(vs 55%)
(vs 42%)
Thanksgiving Day
Black Friday
Saturday
Sunday
Cyber Monday
In-store Online
85% plan to shop
Channel preference(by day)

2017 pre-Thanksgiving pulse surveyCopyright © 2017 Deloitte LLP. All rights reserved. 12
“On what days do you expect to shop in-store?” (n= 781)“Out of your plan to spend in-store during Thanksgiving period, how much do you plan to spend shopping in physical stores on following days (on non-grocery items)”?
In-store shopping: Shopper traffic and spend at physical stores will peak on Black Friday
25%
70%
52%
31%37%
Thanksgiving Black Friday Saturday Sunday Cyber Monday
Preferred shopping days (Among in-store shoppers throughout Thanksgiving period)
$107Avg.
in-store spend ($)
$156 $82 $57 $86

2017 pre-Thanksgiving pulse surveyCopyright © 2017 Deloitte LLP. All rights reserved. 13
Traditional department stores dominate as the in-store shopping venue of choice during this peak weekend
51%
39%
38%
29%
26%
22%
22%
17%
15%
14%
11%
10%
9%
7%
Traditional department stores
Mass merchants
Electronics/Office supply/Computer stores
Outlet stores/centers
Supermarkets or grocery stores
Warehouse membership clubs
Specialty clothing stores
Home improvement stores
Fast fashion apparel retailers
Discount dollar stores
Off-price stores
Jewelry stores
Drug stores
Furniture or home furnishings stores
Most preferred retail venues for Thanksgiving shopping
“At which of the following types of retailers will you likely shop during this Thanksgiving period?“ (n=779)

2017 pre-Thanksgiving pulse surveyCopyright © 2017 Deloitte LLP. All rights reserved. 14
Shopping items: Clothing and electronics dominate Thanksgiving weekend shopping lists
“Which of the following do you plan to buy during this Thanksgiving period (Thanksgiving Thursday through the following Monday)?” (n=921)
Popular Thanksgiving items(By number of shoppers who plan to buy)
65% Clothing & Accessories
(e.g. clothing, shoes, jewelry)
55% Electronics & Accessories
(e.g. computers, smartphone, gaming consoles, wearables)
47%Toys & Hobbies
(e.g. books, board games, dolls, movies, handcraft items)
38% Food & Beverage
(e.g. confectionary, meal kits, liquor)
` 31% Home & Kitchen
(e.g. home improvement, home appliances and electronics, furniture)
29% Health & Beauty
(e.g. cosmetics, personal care products, sporting goods)

2017 pre-Thanksgiving pulse surveyCopyright © 2017 Deloitte LLP. All rights reserved. 15
Channel preference: Online and in-store channel spend vary across age and household income groups
47%
52%
57%
51%
39%
52%
45%
41%
47%
59%
1% 2% 2% 3% 2%
GenZ Millennials GenXers BabyBoomers
Seniors
44%47%
50% 52%
61%
54%51%
48% 46%
37%
2% 3% 2% 2% 3%
Less than$25,000
$25,000 -$49,999
$50,000 -$74,999
$75,000 -$99,999
$100,000 +
Online In-store Other
Percentage of Thanksgiving period spend byage group
Percentage of Thanksgiving period spend byhousehold income

2017 pre-Thanksgiving pulse surveyCopyright © 2017 Deloitte LLP. All rights reserved. 16
Spend by generation: GenXers expected to outspend other generation shoppers
$292
$404
$626
$378
$363
$427
GenZ
Millennials
GenXers
Baby Boomers
Seniors
Overall
Average Thanksgiving spend(by generation)
GenXers’ spending by HHI*
Household income Avg. Spend
Less than $25,000 $216
$25,000 - $49,999 $458
$50,000 - $74,999 $466
$75,000 - $99,999 $631
$100,000 + $915
Spend within the age group correlates to income
*Household income

2017 pre-Thanksgiving pulse surveyCopyright © 2017 Deloitte LLP. All rights reserved. 17
Spend by region: Shoppers from Midwest likely to spend more than other regions
National average spend:
$427 Northeast
West
South
Midwest
$369
$396 $517
$424
Average spend by region
Legend:

2017 pre-Thanksgiving pulse surveyCopyright © 2017 Deloitte LLP. All rights reserved. 18
Shoppers expect retailers to be responsive in terms of online engagement and commerce
46%
39%
38%
36%
19%
17%
If online sites have technical issues will use another retailerrather than wait
Connect to a retailer’s Wi-Fi network while shopping in-store
Buy something online while in-store due to better pricingand/or price matching
Influenced by deals from mobile device while in store duringThanksgiving weekend
Check-out using mobile device in store to avoid long lines atthe register
Connect to a retailer’s Wi-FI network in store to take advantage of augmented reality apps
Shopper digital preferences during Thanksgiving period(Among all shoppers)
“Using a scale of 1 through 5, where 1 means “Strongly disagree” and 5 means “Strongly agree”, please state how much you agree with the following:” (n=921)

Thanksgiving Day and Black Friday

2017 pre-Thanksgiving pulse surveyCopyright © 2017 Deloitte LLP. All rights reserved. 20
Thanksgiving Day: Shoppers will spend $107 (Avg.) on Thanksgiving day and the 45% of shoppers who spend the most plan to start before 5pm
15%
30%
15%
29%
3%
8%
Before 3 pm
3 to 5 pm
6 pm
7 to 10 pm
11 pm orlater
Unsure
Thanksgiving Day shopping start time and spend(By number of shoppers on Thanksgiving Day)
$108
Average spend
$160
$86
$48
$55
$81
“What time do you expect to go to the store on Thanksgiving Day?” (n= 198)
2017 pre-Thanksgiving pulse surveyCopyright © 2017 Deloitte LLP. All rights reserved. 21
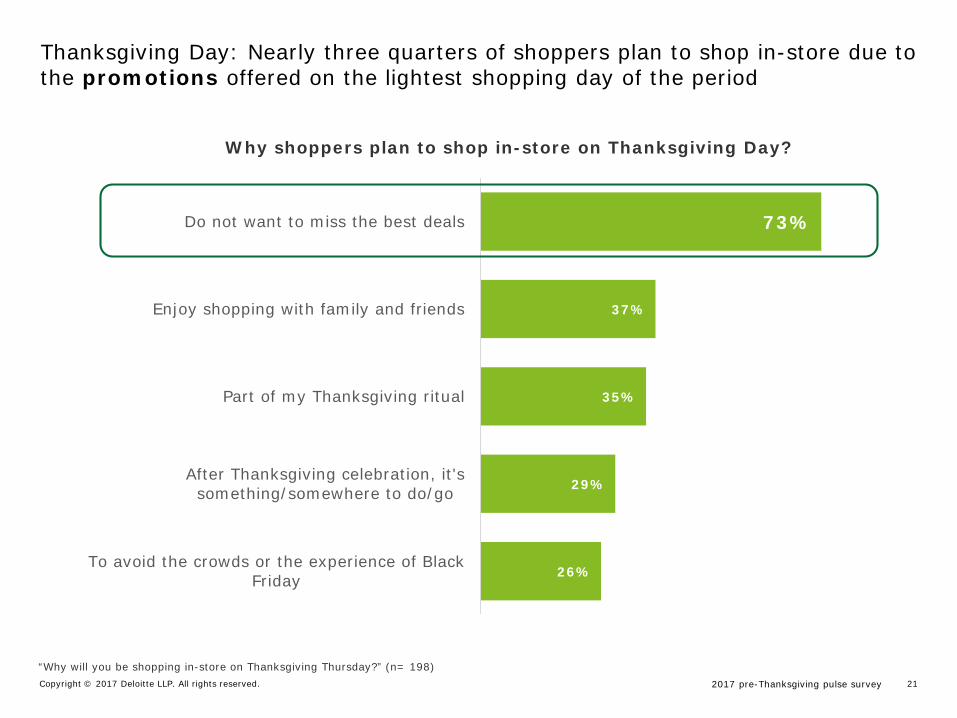
73%
37%
35%
29%
26%
Do not want to miss the best deals
Enjoy shopping with family and friends
Part of my Thanksgiving ritual
After Thanksgiving celebration, it'ssomething/somewhere to do/go
To avoid the crowds or the experience of BlackFriday
Why shoppers plan to shop in-store on Thanksgiving Day?
“Why will you be shopping in-store on Thanksgiving Thursday?” (n= 198)
Thanksgiving Day: Nearly three quarters of shoppers plan to shop in-store due to the promotions offered on the lightest shopping day of the period

2017 pre-Thanksgiving pulse surveyCopyright © 2017 Deloitte LLP. All rights reserved. 22
“Using a scale of 1 through 5, where 1 means “Strongly disagree” and 5 means “Strongly agree”, please state how much you agree with the following:” (n=921)
Thanksgiving Day: Six in 10 shoppers prefer to spend Thanksgiving Day with their family and believe stores should not be open
Attitudes toward shopping on Thanksgiving Day
56%
56%
46%
45%
15%
I won’t be motivated to shop on Thanksgiving Day this year because it’s an important holiday to spend with family and
friends
I disagree with stores being open on Thanksgiving
I feel more loyal to retailers who close on Thanksgiving
I will hold out to shop at my favorite retailer(s) if they aren’t open
I feel loyal to retailers that are open on Thursday and allow themto shop
2017 pre-Thanksgiving pulse surveyCopyright © 2017 Deloitte LLP. All rights reserved. 23
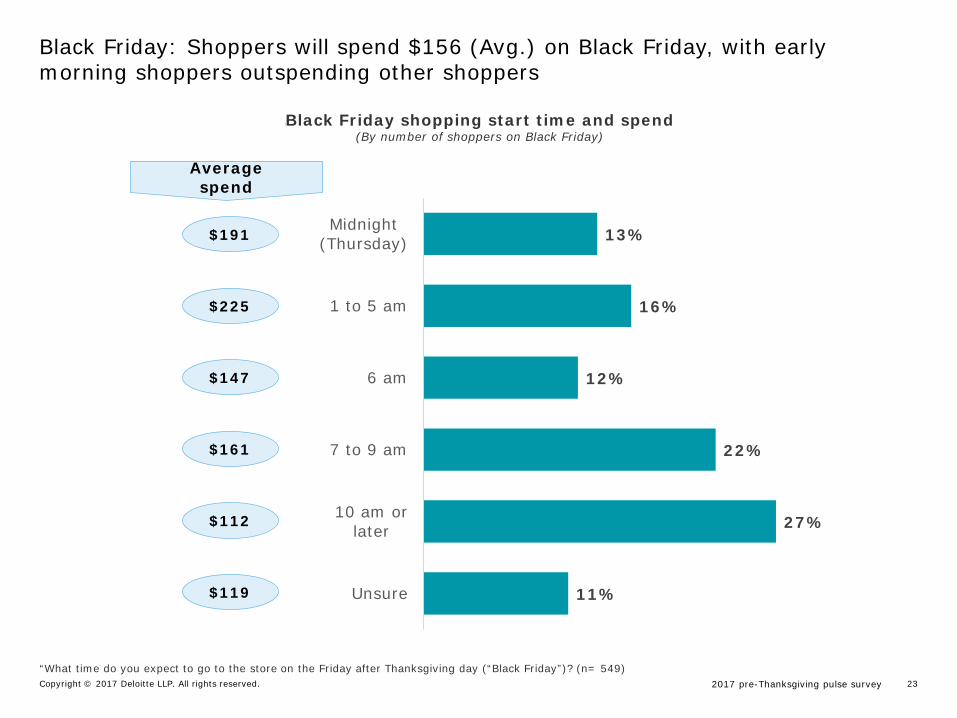
Black Friday: Shoppers will spend $156 (Avg.) on Black Friday, with early morning shoppers outspending other shoppers
13%
16%
12%
22%
27%
11%
Midnight(Thursday)
1 to 5 am
6 am
7 to 9 am
10 am orlater
Unsure
Black Friday shopping start time and spend(By number of shoppers on Black Friday)
$191
Average spend
$225
$147
$112
$119
$161
“What time do you expect to go to the store on the Friday after Thanksgiving day (“Black Friday”)? (n= 549)

2017 pre-Thanksgiving pulse surveyCopyright © 2017 Deloitte LLP. All rights reserved. 24
83%
33%
32%
28%
24%
23%
To take advantage of sales or best deals of the season
Overall excitement of the day
I enjoy shopping with family and friends on this day
Shopping on Black Friday is part of my annual holidayritual
I prefer shopping in the store rather than online
I want to complete my shopping before December
Why shoppers plan to shop in-store on Black Friday
“Using a scale of 1 through 5, where 1 means “Strongly disagree” and 5 means “Strongly agree”, please state how much you agree with the following:” (n=921)
Black Friday: Shoppers expect the best promotions of the season
63%Often find retailers offer comparable deals online and in-store during the Thanksgiving weekend
2017 pre-Thanksgiving pulse surveyCopyright © 2017 Deloitte LLP. All rights reserved. 25
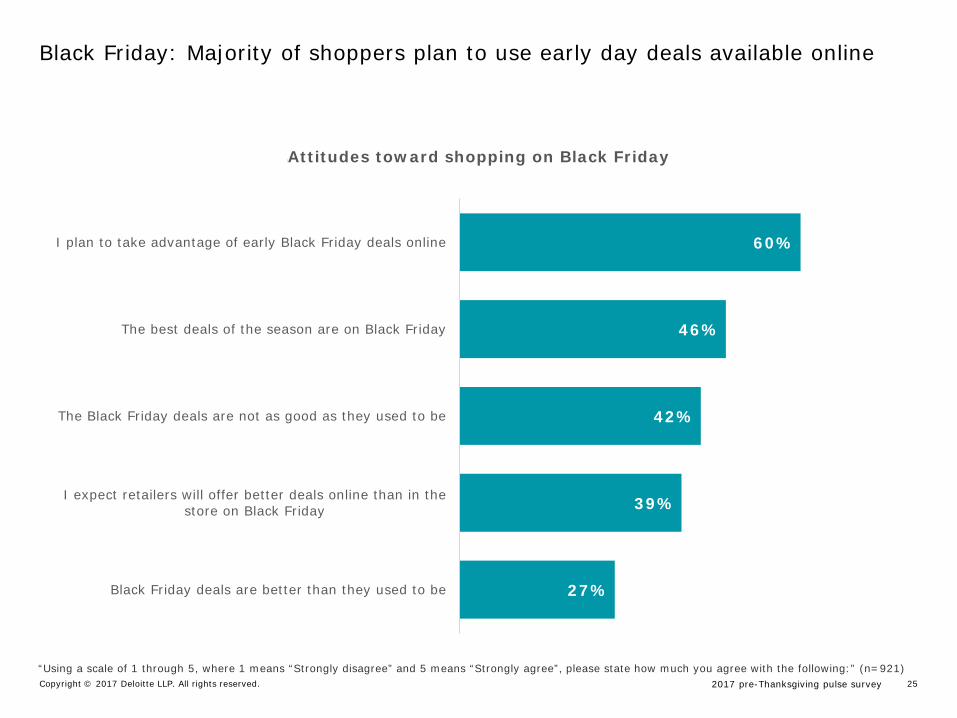
Black Friday: Majority of shoppers plan to use early day deals available online
Attitudes toward shopping on Black Friday
60%
46%
42%
39%
27%
I plan to take advantage of early Black Friday deals online
The best deals of the season are on Black Friday
The Black Friday deals are not as good as they used to be
I expect retailers will offer better deals online than in thestore on Black Friday
Black Friday deals are better than they used to be
“Using a scale of 1 through 5, where 1 means “Strongly disagree” and 5 means “Strongly agree”, please state how much you agree with the following:” (n=921)
2017 pre-Thanksgiving pulse surveyCopyright © 2017 Deloitte LLP. All rights reserved. 26
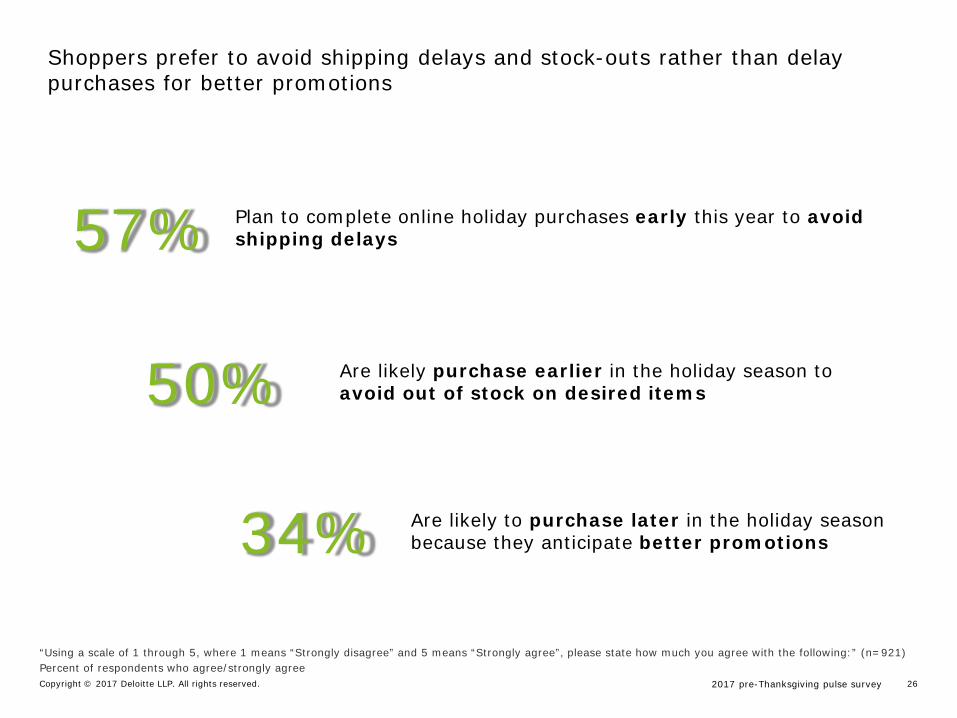
57% Plan to complete online holiday purchases early this year to avoid shipping delays
34% Are likely to purchase later in the holiday season because they anticipate better promotions
50% Are likely purchase earlier in the holiday season to avoid out of stock on desired items
“Using a scale of 1 through 5, where 1 means “Strongly disagree” and 5 means “Strongly agree”, please state how much you agree with the following:” (n=921)Percent of respondents who agree/strongly agree
Shoppers prefer to avoid shipping delays and stock-outs rather than delay purchases for better promotions

Research to prepare for shopping

2017 pre-Thanksgiving pulse surveyCopyright © 2017 Deloitte LLP. All rights reserved. 28
Where shoppers expect to obtain information about Thanksgiving period
55%
51%
30%
30%
29%
24%
21%
20%
18%
11%
Retailer Websites
Websites dedicated to featuring Thanksgiving deals
Newspapers
Mailers/ flyers
Social media sites (blogs, discussion groups, or socialnetworks)
TV or radio commercials
Mobile device (via app or text message)
In-retailers’ stores
Other websites
Digital medium
Traditional medium
“Where do you expect to obtain information about Thanksgiving weekend?” (n= 921)
Research avenues: Digital remains the primary information source for shoppers
(% for 2016 survey)
(vs 57%)
(vs 58%)
(vs 36%)
(vs 34%)
(vs 20%)
(vs 26%)
(vs 17%)
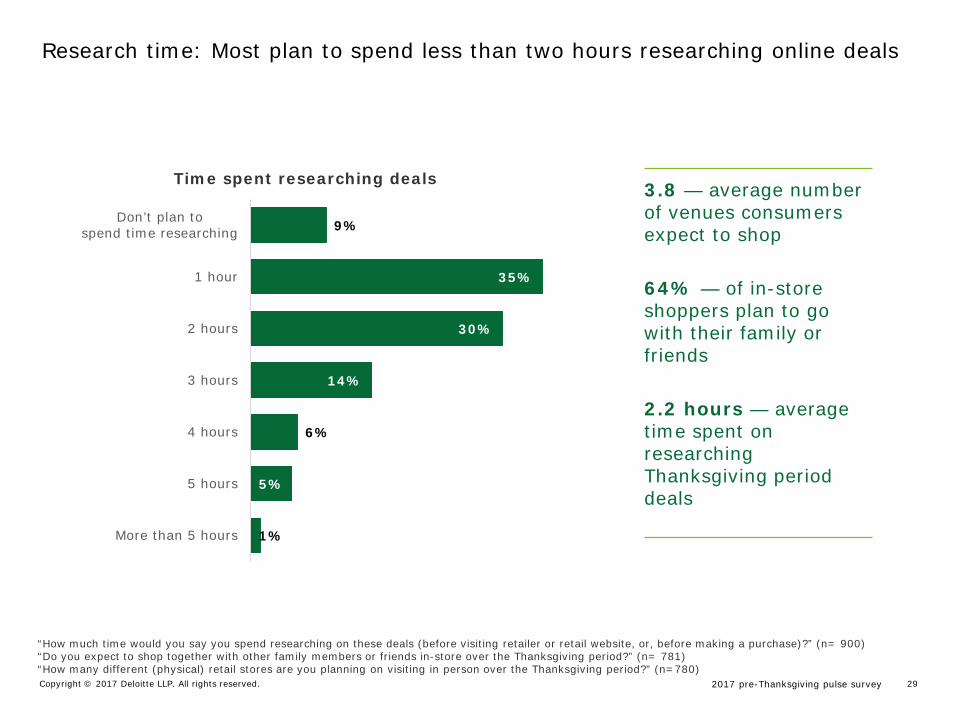
2017 pre-Thanksgiving pulse surveyCopyright © 2017 Deloitte LLP. All rights reserved. 29
Time spent researching deals
9%
35%
30%
14%
6%
5%
1%
Don’t plan to spend time researching
1 hour
2 hours
3 hours
4 hours
5 hours
More than 5 hours
“How much time would you say you spend researching on these deals (before visiting retailer or retail website, or, before making a purchase)?” (n= 900)“Do you expect to shop together with other family members or friends in-store over the Thanksgiving period?” (n= 781)“How many different (physical) retail stores are you planning on visiting in person over the Thanksgiving period?” (n=780)
3.8 — average number of venues consumers expect to shop
64% — of in-store shoppers plan to go with their family or friends
2.2 hours — average time spent on researching Thanksgiving period deals
Research time: Most plan to spend less than two hours researching online deals
2017 pre-Thanksgiving pulse surveyCopyright © 2017 Deloitte LLP. All rights reserved. 30
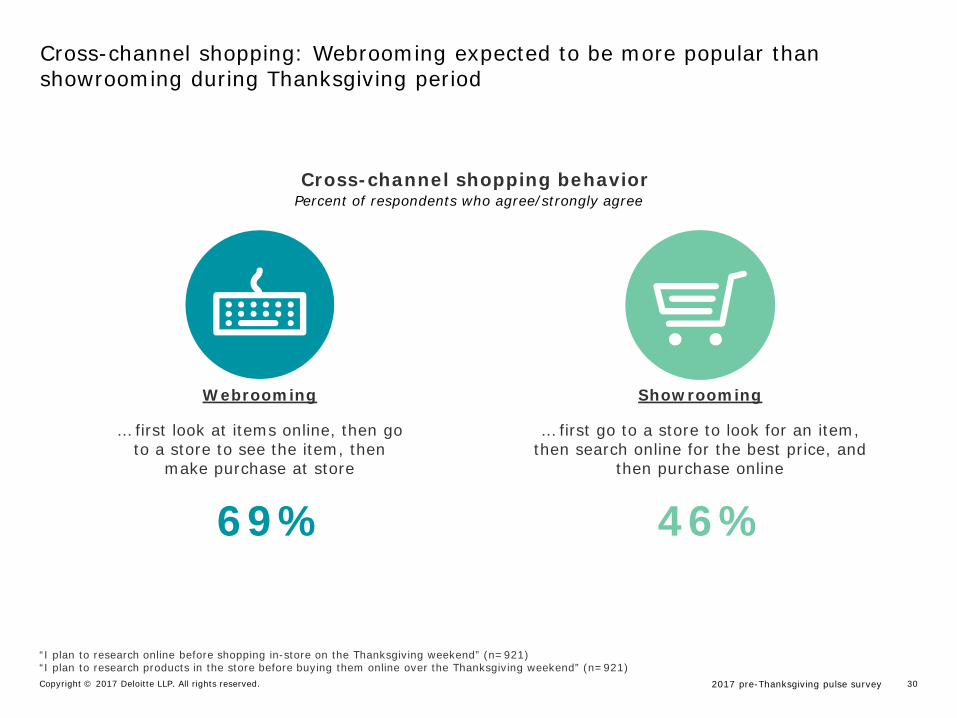
Cross-channel shopping: Webrooming expected to be more popular than showrooming during Thanksgiving period
Showrooming
… first go to a store to look for an item, then search online for the best price, and
then purchase online
46%
Webrooming
… first look at items online, then go to a store to see the item, then
make purchase at store
69%
Cross-channel shopping behavior
“I plan to research online before shopping in-store on the Thanksgiving weekend” (n=921)“I plan to research products in the store before buying them online over the Thanksgiving weekend” (n=921)
Percent of respondents who agree/strongly agree
2017 pre-Thanksgiving pulse surveyCopyright © 2017 Deloitte LLP. All rights reserved. 31
About the surveyThis survey was developed by Deloitte and conducted online by an independent research company between November 8 – 10, 2017.
It polled a national sample of 1,224 adults (age 18+) aligned with the US Census for age and income who plan to shop during the holiday season and has a margin of error for the entire sample of plus or minus three percentage points.
About the Deloitte Center for Industry Insights
The Deloitte Center for Industry Insights goal is to share research-based insights regarding critical business issues, including emerging trends, challenges, and opportunities. Using primary research and rigorous analysis, the Center provides unique perspectives and seeks to be a trusted source for relevant, timely, and reliable insights.
About Deloitte
Deloitte refers to one or more of Deloitte Touche Tohmatsu Limited, a UK private company limited by guarantee (“DTTL”), its network of member firms, and their related entities. DTTL and each of its member firms are legally separate and independent entities. DTTL (also referred to as “Deloitte Global”) does not provide services to clients. In the United States, Deloitte refers to one or more of the US member firms of DTTL, their related entities that operate using the “Deloitte” name in the United States and their respective affiliates. Certain services may not be available to attest clients under the rules and regulations of public accounting. Please see www.deloitte.com/about to learn more about our global network of member firms.