2017 phonics - king’s cross academy · d year 2 (2017) phonics marks compared with year 1...
TRANSCRIPT

Date of Issue: V1 (2nd August 2017)
Page
1)
A % Year 1 pupils meeting the expected standard of phonics decoding (all pupils) 1
Trend, with LA and national comparators
B % Year 1 pupils meeting the expected standard of phonics decoding (by gender) 1
Trend, with LA and national comparators
C Year 1 (2017) - Outcome marks (banded) for all pupils and by gender and disadvantage 2
With LA and national comparators
D % working at expected standard by pupil attributes 3
Trend, with LA and national comparators
E % working at expected standard by ethnicity 4
Trend, with LA and national comparators
F School rank within Camden for Year 1 phonics 5
2) By the end of Year 2
A% by end of Year 2 - pupils meeting the expected standard of phonics decoding (all
pupils)6
Trend, with LA and national comparators
B% by end of Year 2 - pupils meeting the expected standard of phonics decoding (by
gender)6
Trend, with LA and national comparators
C Year 2 (2017) - Outcome marks (banded) for all pupils and by gender and disadvantage 7
With LA and national comparators
D Year 2 (2017) phonics marks compared with Year 1 (resits) 7
With national comparators
E By the end of Year 2 - % working at expected standard by pupil attributes 8
Trend, with LA and national comparators
F By the end of Year 2 - % working at expected standard by ethnicity 9
Trend, with LA and national comparators
G School rank within Camden for by the end of Year 2 phonics 10
3) Conversion from EYFS
A Conversion from EYFS reading to Phonics by end of Year 2 11
Notes
Eligible pupils includes those disapplied or absent from the assessment.
Camden results include special schools.
National data - 2017 data is not yet available, so 2016 data is shown (and highlighted in red font). This will be updated when 2017 national data
becomes available.
Meeting the expected standard - Each year the DfE publish a threshold mark that pupils need to achieve in order to have met the expected
standard. This has been 32 for the last few years.
'By the end of Year 2' phonics results are a cumulative measure and include both pupils screened in year 1 who were still on roll at the end of Key
Stage 1 along with those re-checked or taking for the first time in year 2. This has been matched manually, and there are slight differences from
the DfE calculations.
2017 Phonics
Kings Cross
CONTENTS
Year 1
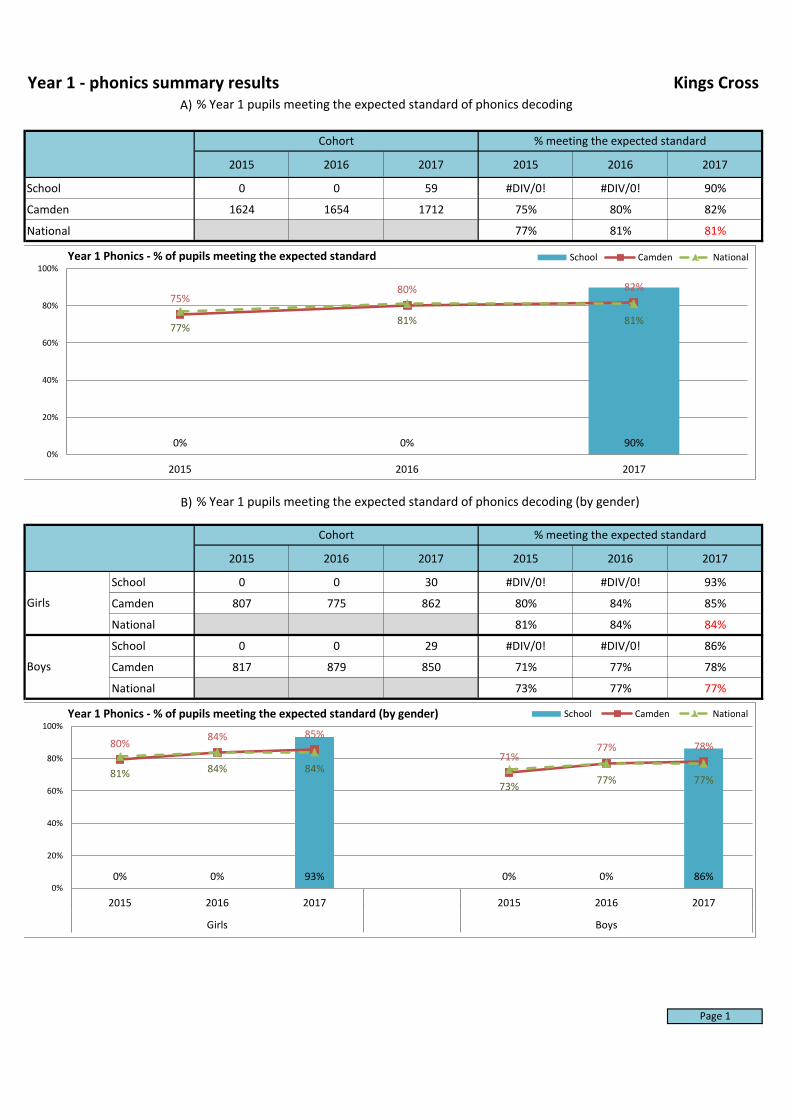
Year 1 - phonics summary results Kings CrossA)
2015 2016 2017 2015 2016 2017
School 0 0 59 #DIV/0! #DIV/0! 90%
Camden 1624 1654 1712 75% 80% 82%
National 77% 81% 81%
B)
2015 2016 2017 2015 2016 2017
School 0 0 30 #DIV/0! #DIV/0! 93%
Camden 807 775 862 80% 84% 85%
National 81% 84% 84%
School 0 0 29 #DIV/0! #DIV/0! 86%
Camden 817 879 850 71% 77% 78%
National 73% 77% 77%
Page 1
Cohort % meeting the expected standard
Girls
Boys
% meeting the expected standardCohort
% Year 1 pupils meeting the expected standard of phonics decoding
% Year 1 pupils meeting the expected standard of phonics decoding (by gender)
0% 0% 90%
75%80% 82%
77%81% 81%
0%
20%
40%
60%
80%
100%
2015 2016 2017
Year 1 Phonics - % of pupils meeting the expected standard School Camden National
0% 0% 93% 0% 0% 86%
80%84% 85%
71%77% 78%
81% 84% 84%
73%77% 77%
0%
20%
40%
60%
80%
100%
2015 2016 2017 2015 2016 2017
Girls Boys
Year 1 Phonics - % of pupils meeting the expected standard (by gender) School Camden National
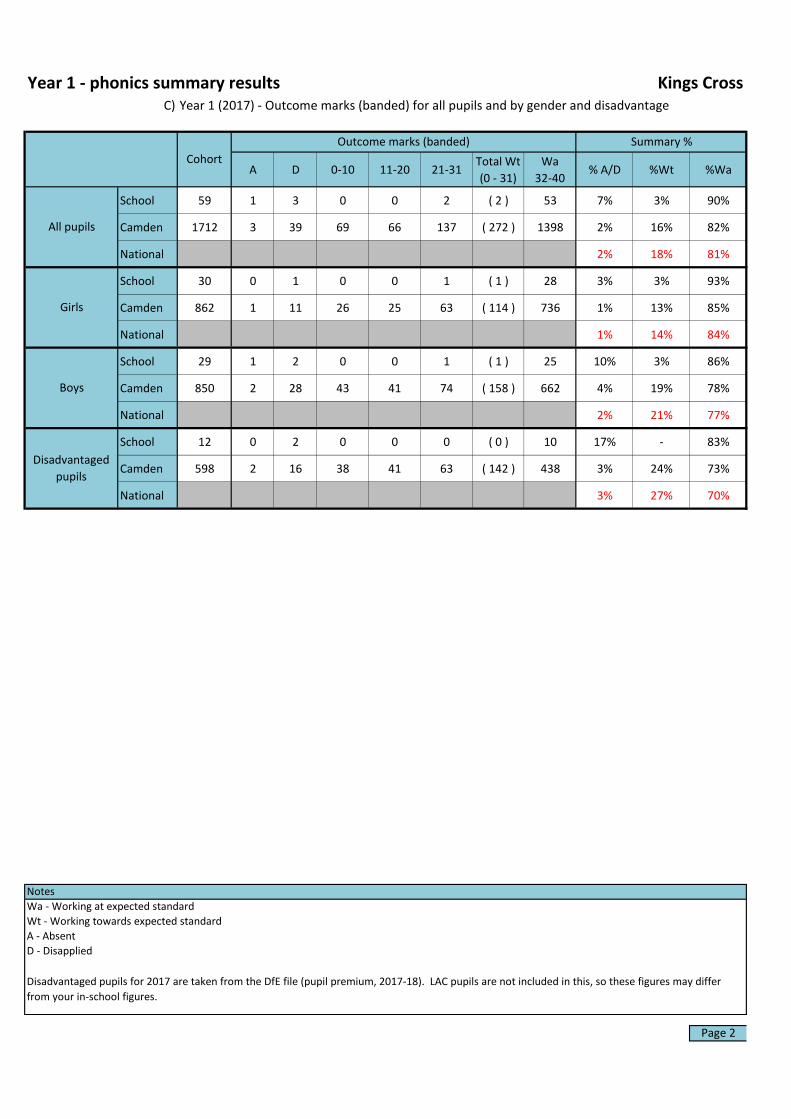
Year 1 - phonics summary results Kings CrossC) Year 1 (2017) - Outcome marks (banded) for all pupils and by gender and disadvantage
A D 0-10 11-20 21-31Total Wt
(0 - 31)
Wa
32-40% A/D %Wt %Wa
School 59 1 3 0 0 2 ( 2 ) 53 7% 3% 90%
Camden 1712 3 39 69 66 137 ( 272 ) 1398 2% 16% 82%
National 2% 18% 81%
School 30 0 1 0 0 1 ( 1 ) 28 3% 3% 93%
Camden 862 1 11 26 25 63 ( 114 ) 736 1% 13% 85%
National 1% 14% 84%
School 29 1 2 0 0 1 ( 1 ) 25 10% 3% 86%
Camden 850 2 28 43 41 74 ( 158 ) 662 4% 19% 78%
National 2% 21% 77%
School 12 0 2 0 0 0 ( 0 ) 10 17% - 83%
Camden 598 2 16 38 41 63 ( 142 ) 438 3% 24% 73%
National 3% 27% 70%
Notes
Wa - Working at expected standard
Wt - Working towards expected standard
A - Absent
D - Disapplied
Page 2
Disadvantaged pupils for 2017 are taken from the DfE file (pupil premium, 2017-18). LAC pupils are not included in this, so these figures may differ
from your in-school figures.
Disadvantaged
pupils
Outcome marks (banded) Summary %
Cohort
Girls
Boys
All pupils

Year 1 - phonics summary results Kings CrossD) % working at expected standard by pupil attributes
Camden National Camden National Camden National
Cohort Cohort Cohort
0 #DIV/0! 75% 77% 0 #DIV/0! 80% 81% 59 90% 82% 81%
Girls 0 #DIV/0! 80% 81% 0 #DIV/0! 84% 84% 30 93% 85% 84%
Boys 0 #DIV/0! 71% 73% 0 #DIV/0! 77% 77% 29 86% 78% 77%
FSM pupils 0 #DIV/0! 65% 65% 0 #DIV/0! 73% 69% 9 78% 71% 69%
All other pupils 0 #DIV/0! 79% 79% 0 #DIV/0! 83% 83% 50 92% 85% 83%
Disadvantaged 0 - 67% 66% 0 - 76% 70% 12 83% 73% 70%
All other pupils 0 - 81% 80% 0 - 83% 83% 47 91% 86% 83%
All SEN pupils 0 - 42% 39% 0 - 46% 42% 14 64% 50% 42%
No identifed SEN 0 - 82% 83% 0 - 87% 86% 45 98% 88% 86%
SEN Support (K) 0 - 48% 42% 0 - 52% 46% 12 75% 57% 46%
Statement/EHCP (S&E) 0 - 22% 18% 0 - 25% 18% 2 0% 20% 18%
Autumn 0 - 80% 83% 0 - 85% 86% 17 94% 88% 86%
Spring 0 - 76% 77% 0 - 80% 81% 19 95% 79% 81%
Summer 0 - 71% 71% 0 - 77% 75% 23 83% 78% 75%
3 terms or less 0 - 62% 0 - 69% 1 100% 68%
4 to 6 terms 0 - 78% 0 - 81% 58 90% 83%
more than 6 terms 0 - 76% 0 - 83% 0 - 83%
None 0 - 65% 0 - 66% 0 - 66%
Yes 0 - 77% 0 - 82% 59 90% 83%
Unknown 0 - 65% 0 - 74% 0 - 73%
Other than English 0 - 76% 76% 0 - 81% 80% 26 96% 82% 80%
English 0 - 74% 77% 0 - 80% 81% 33 85% 81% 81%
Notes
Disadvantaged pupils for 2017 are taken from the DfE file (pupil premium, 2017-18). LAC pupils are not included in this, so these figures may differ from your in-school figures.
Page 3
All year 1 pupils
SEN
SEN category
Terms on roll
Term of birth
Gender
Nursery
experience
First Language
2015
School
% expected% expected% expected
2016 2017
School School
Disadvantaged
FSM
93
%
86
%
78
%
92
%
83
%
91
%
64
%
98
%
75
%
0%
94
%
95
%
83
%
10
0%
90
%
0%
0%
90
%
96
%
85
%
0%
20%
40%
60%
80%
100%
120%
Gir
ls (
0)
Bo
ys (
0)
FSM
pu
pils
(0
)
All
oth
er p
up
ils (
0)
Dis
adva
nta
ged
(0
)
All
oth
er p
up
ils (
0)
All
SEN
pu
pils
(0
)
No
iden
tife
d S
EN (
0)
SEN
Su
pp
ort
(K
) (0
)
Stat
em
en
t/EH
CP
(S&
E) (
0)
Au
tum
n (
0)
Spri
ng
(0)
Sum
me
r (0
)
3 t
erm
s o
r le
ss (
0)
4 t
o 6
ter
ms
(0)
mo
re t
han
6 t
erm
s (0
)
No
ne
(0)
Yes
(0)
Oth
er t
han
En
glis
h (
0)
Engl
ish
(0
)
Gender FSM Disadvantaged SEN SEN category Term of birth Term on roll Nursery? First Language
2017 Year 1 phonics - broken down by characteristics, compared to national School result National result School overall
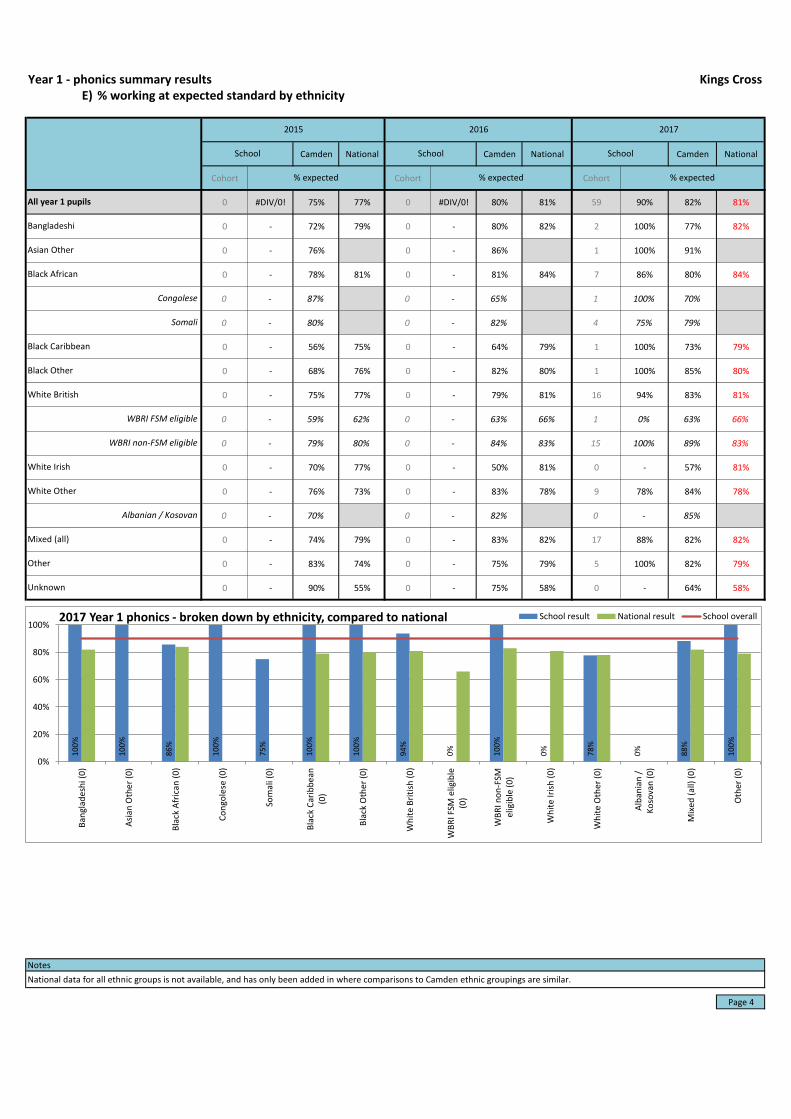
Year 1 - phonics summary results Kings CrossE) % working at expected standard by ethnicity
Camden National Camden National Camden National
Cohort Cohort Cohort
0 #DIV/0! 75% 77% 0 #DIV/0! 80% 81% 59 90% 82% 81%
0 - 72% 79% 0 - 80% 82% 2 100% 77% 82%
0 - 76% 0 - 86% 1 100% 91%
0 - 78% 81% 0 - 81% 84% 7 86% 80% 84%
0 - 87% 0 - 65% 1 100% 70%
0 - 80% 0 - 82% 4 75% 79%
0 - 56% 75% 0 - 64% 79% 1 100% 73% 79%
0 - 68% 76% 0 - 82% 80% 1 100% 85% 80%
0 - 75% 77% 0 - 79% 81% 16 94% 83% 81%
0 - 59% 62% 0 - 63% 66% 1 0% 63% 66%
0 - 79% 80% 0 - 84% 83% 15 100% 89% 83%
0 - 70% 77% 0 - 50% 81% 0 - 57% 81%
0 - 76% 73% 0 - 83% 78% 9 78% 84% 78%
0 - 70% 0 - 82% 0 - 85%
0 - 74% 79% 0 - 83% 82% 17 88% 82% 82%
0 - 83% 74% 0 - 75% 79% 5 100% 82% 79%
0 - 90% 55% 0 - 75% 58% 0 - 64% 58%
Notes
National data for all ethnic groups is not available, and has only been added in where comparisons to Camden ethnic groupings are similar.
Page 4
% expected
2015 2016
All year 1 pupils
School School
2017
Asian Other
Black African
% expected
School
% expected
Mixed (all)
Other
Unknown
WBRI FSM eligible
WBRI non-FSM eligible
White Irish
White Other
Albanian / Kosovan
Congolese
Somali
Black Caribbean
Black Other
White British
Bangladeshi
10
0%
10
0%
86
%
10
0%
75
%
10
0%
10
0%
94
%
0%
10
0%
0%
78
%
0%
88
%
10
0%
0%
20%
40%
60%
80%
100%
Ban
glad
esh
i (0
)
Asi
an O
the
r (0
)
Bla
ck A
fric
an (
0)
Co
ngo
lese
(0
)
Som
ali (
0)
Bla
ck C
arib
be
an(0
)
Bla
ck O
the
r (0
)
Wh
ite
Bri
tish
(0
)
WB
RI F
SM e
ligib
le(0
)
WB
RI n
on
-FSM
elig
ible
(0
)
Wh
ite
Iris
h (
0)
Wh
ite
Oth
er
(0)
Alb
ania
n /
Ko
sova
n (
0)
Mix
ed
(al
l) (
0)
Oth
er (
0)
2017 Year 1 phonics - broken down by ethnicity, compared to national School result National result School overall

Year 1 - phonics summary results Kings CrossF)
2015 2016 2017 2015 2016 2017
School 0 0 59 #DIV/0! #DIV/0! 90%
Camden 1624 1654 1712 75% 80% 82%
National 77% 81% 81%
Camden rank2015 na2016 na2017 11
Notes
The result has been compared to other primary schools in Camden.
Explanation of ranking:
In 2015 and 2016, 1 = highest result in Camden and 41 = lowest result in Camden
In 2017, 1 = highest result in Camden and 42 = lowest result in Camden
Page 5
School rank within Camden for Year 1 phonics
Cohort % meeting the expected standard
0
20
40
60
80
100
Kings Cross
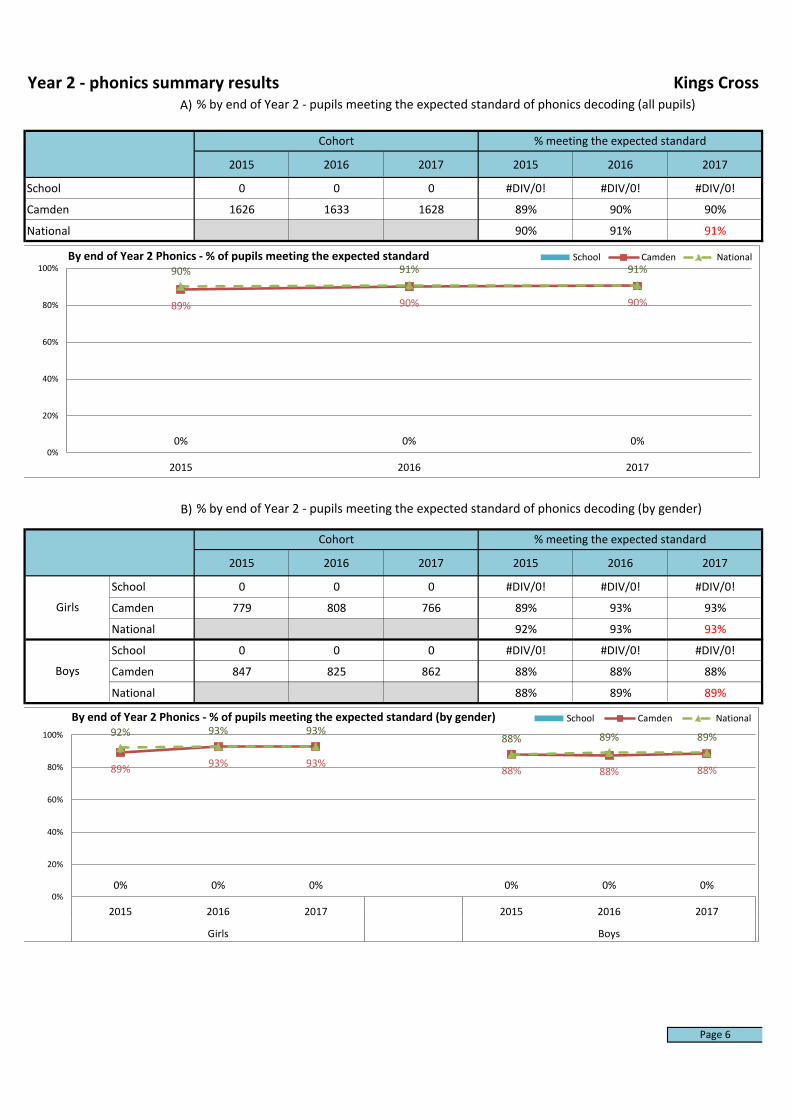
Year 2 - phonics summary results Kings CrossA)
2015 2016 2017 2015 2016 2017
School 0 0 0 #DIV/0! #DIV/0! #DIV/0!
Camden 1626 1633 1628 89% 90% 90%
National 90% 91% 91%
B)
2015 2016 2017 2015 2016 2017
School 0 0 0 #DIV/0! #DIV/0! #DIV/0!
Camden 779 808 766 89% 93% 93%
National 92% 93% 93%
School 0 0 0 #DIV/0! #DIV/0! #DIV/0!
Camden 847 825 862 88% 88% 88%
National 88% 89% 89%
Page 6
% by end of Year 2 - pupils meeting the expected standard of phonics decoding (all pupils)
Cohort % meeting the expected standard
Cohort % meeting the expected standard
% by end of Year 2 - pupils meeting the expected standard of phonics decoding (by gender)
Girls
Boys
0% 0% 0%
89% 90% 90%
90% 91% 91%
0%
20%
40%
60%
80%
100%
2015 2016 2017
By end of Year 2 Phonics - % of pupils meeting the expected standard School Camden National
0% 0% 0% 0% 0% 0%
89%93% 93%
88% 88% 88%
92% 93% 93%88% 89% 89%
0%
20%
40%
60%
80%
100%
2015 2016 2017 2015 2016 2017
Girls Boys
By end of Year 2 Phonics - % of pupils meeting the expected standard (by gender) School Camden National

Year 2 - phonics summary results Kings CrossC) Year 2 (2017) - Outcome marks (banded) for all pupils and by gender and disadvantage
A D 0-10 11-20 21-31Total Wt
(0 - 31)
Wa
32-40% A/D %Wt %Wa
School 0 0 0 0 0 0 ( 0 ) 0 - - #DIV/0!
Camden 346 0 22 34 38 54 ( 126 ) 197 6% 36% 57%
National 2% 18% 81%
School 0 0 0 0 0 0 ( 0 ) 0 - - #DIV/0!
Camden 137 0 9 10 14 19 ( 43 ) 85 7% 31% 62%
National 1% 14% 84%
School 0 0 0 0 0 0 ( 0 ) 0 - - #DIV/0!
Camden 209 0 13 24 24 35 ( 83 ) 112 6% 40% 54%
National 2% 21% 77%
School 0 0 0 0 0 0 ( 0 ) 0 - - #DIV/0!
Camden 146 0 12 21 17 25 ( 63 ) 71 8% 43% 49%
National 3% 27% 70%
D) Year 2 (2017) phonics marked compared with Year 1 (resits)
None 0-9 10-19 20-24 25-29 30-31 32+
Total
number
of pupils
Number
achieved
expected
standard
School %
achieved
expected
standard
National %
achieved
expected
standard *
0 0 0 0 0 0 0 0 0 -
A 0 0 0 0 0 0 0 0 0 -
D 0 0 0 0 0 0 0 0 0 -
0-9 0 0 0 0 0 0 0 0 0 - 23%
10-19 0 0 0 0 0 0 0 0 0 - 59%
20-24 0 0 0 0 0 0 0 0 0 - 78%
25-29 0 0 0 0 0 0 0 0 0 - 88%
30-31 0 0 0 0 0 0 0 0 0 - 92%
Summary 0 0 - 64%
Notes
Wa - Working at expected standard A - Absent
Wt - Working towards expected standard D - Disapplied
* national % taken from 2016 RAISEOnline report
Page 7
Year 1 marks
38%
Girls
Cohort
Outcome marks (banded) Summary %
All pupils
Boys
Disadvantaged
pupils
No Year 1 outcome
Year 2 marks

Year 2 - phonics summary results Kings CrossE) By end of Year 2 - % working at expected standard by pupil attributes
Camden National Camden National Camden National
Cohort Cohort Cohort
0 #DIV/0! 89% 90% 0 #DIV/0! 90% 91% 0 #DIV/0! 90% 91%
Girls 0 #DIV/0! 89% 92% 0 #DIV/0! 93% 93% 0 #DIV/0! 93% 93%
Boys 0 #DIV/0! 88% 88% 0 #DIV/0! 88% 89% 0 #DIV/0! 88% 89%
FSM pupils 0 - 81% 92% 0 #DIV/0! 83% 84% 0 #DIV/0! 85% 84%
All other pupils 0 #DIV/0! 91% 82% 0 #DIV/0! 93% 93% 0 #DIV/0! 92% 93%
Disadvantaged 0 #DIV/0! 84% 84% 0 #DIV/0! 85% 86% 0 #DIV/0! 87% 86%
All other pupils 0 #DIV/0! 92% 92% 0 #DIV/0! 94% 93% 0 #DIV/0! 92% 93%
All SEN pupils 0 #DIV/0! 63% 62% 0 - 64% 64% 0 - 68% 64%
No identifed SEN 0 #DIV/0! 94% 96% 0 - 96% 96% 0 - 96% 96%
SEN Support (K) 0 #DIV/0! 72% 67% 0 - 73% 69% 0 - 75% 69%
Statement/EHCP (S&E) 0 - 31% 29% 0 - 34% 29% 0 - 44% 29%
Autumn 0 #DIV/0! 89% 93% 0 - 91% 94% 0 - 93% 94%
Spring 0 #DIV/0! 90% 90% 0 - 91% 91% 0 - 89% 91%
Summer 0 #DIV/0! 87% 88% 0 - 89% 89% 0 - 89% 89%
3 terms or less 0 #DIV/0! 70% 0 - 72% 0 - 77%
4 to 6 terms 0 #DIV/0! 90% 0 - 89% 0 - 79%
more than 6 terms 0 #DIV/0! 90% 0 - 92% 0 - 92%
None 0 #DIV/0! 80% 0 - 76% 0 - 80%
Yes 0 #DIV/0! 91% 0 - 92% 0 - 91%
Unknown 0 - 83% 0 - 79% 0 - 86%
Other than English 0 #DIV/0! 89% 89% 0 - 91% 90% 0 - 91% 90%
English 0 #DIV/0! 88% 91% 0 - 89% 92% 0 - 90% 92%
Notes
Disadvantaged pupils for 2017 are taken from the DfE file (pupil premium, 2017-18). LAC pupils are not included in this, so these figures may differ from your in-school figures.
Page 8
All year 2 pupils
FSM
2015 2016 2017
School School School
% expected % expected % expected
Gender
SEN
SEN category
Disadvantaged
Term of birth
Term on roll
Nursery
experience
First Language
0%
0%
0%
0%
0%
0%
0%
0%
0%
0%
0%
0%
0%
0%
0%
0%
0%
0%
0%
0%
0%
20%
40%
60%
80%
100%
Gir
ls (
0)
Bo
ys (
0)
FSM
pu
pils
(0
)
All
oth
er p
up
ils (
0)
Dis
adva
nta
ged
(0
)
All
oth
er p
up
ils (
0)
All
SEN
pu
pils
(0
)
No
iden
tife
d S
EN (
0)
SEN
Su
pp
ort
(K
) (0
)
Stat
em
en
t/EH
CP
(S&
E) (
0)
Au
tum
n (
0)
Spri
ng
(0)
Sum
me
r (0
)
3 t
erm
s o
r le
ss (
0)
4 t
o 6
ter
ms
(0)
mo
re t
han
6 t
erm
s (0
)
No
ne
(0)
Yes
(0)
Un
kno
wn
(0
)
Oth
er t
han
En
glis
h (
0)
Gender FSM Disadvantaged SEN SEN category Term of birth Term on roll Nursery? First Language
2017 End of Year 2 phonics - by characteristics, compared to national School result National result School overall
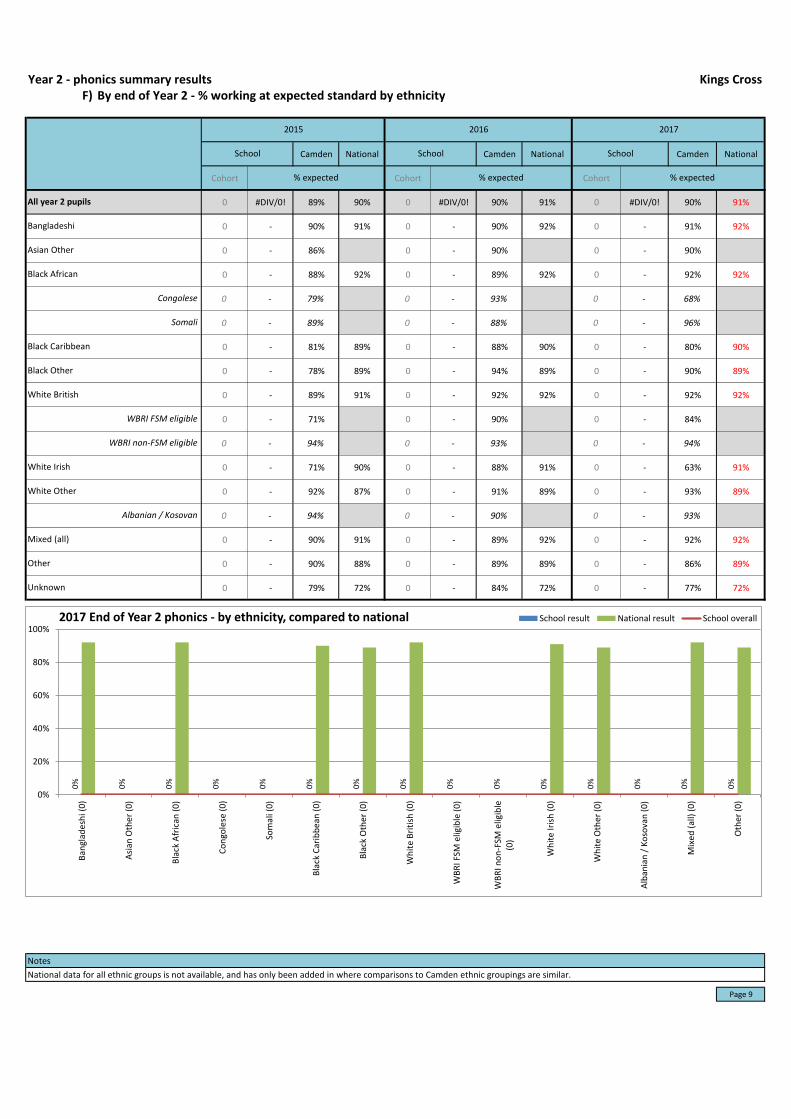
Year 2 - phonics summary results Kings CrossF) By end of Year 2 - % working at expected standard by ethnicity
Camden National Camden National Camden National
Cohort Cohort Cohort
0 #DIV/0! 89% 90% 0 #DIV/0! 90% 91% 0 #DIV/0! 90% 91%
0 - 90% 91% 0 - 90% 92% 0 - 91% 92%
0 - 86% 0 - 90% 0 - 90%
0 - 88% 92% 0 - 89% 92% 0 - 92% 92%
0 - 79% 0 - 93% 0 - 68%
0 - 89% 0 - 88% 0 - 96%
0 - 81% 89% 0 - 88% 90% 0 - 80% 90%
0 - 78% 89% 0 - 94% 89% 0 - 90% 89%
0 - 89% 91% 0 - 92% 92% 0 - 92% 92%
0 - 71% 0 - 90% 0 - 84%
0 - 94% 0 - 93% 0 - 94%
0 - 71% 90% 0 - 88% 91% 0 - 63% 91%
0 - 92% 87% 0 - 91% 89% 0 - 93% 89%
0 - 94% 0 - 90% 0 - 93%
0 - 90% 91% 0 - 89% 92% 0 - 92% 92%
0 - 90% 88% 0 - 89% 89% 0 - 86% 89%
0 - 79% 72% 0 - 84% 72% 0 - 77% 72%
Notes
National data for all ethnic groups is not available, and has only been added in where comparisons to Camden ethnic groupings are similar.
Page 9
All year 2 pupils
Bangladeshi
Asian Other
Mixed (all)
Other
Unknown
Somali
2015 2016 2017
School School School
% expected % expected % expected
WBRI FSM eligible
WBRI non-FSM eligible
White Irish
White Other
Albanian / Kosovan
Black African
Congolese
Black Caribbean
Black Other
White British
0%
0%
0%
0%
0%
0%
0%
0%
0%
0%
0%
0%
0%
0%
0%
0%
20%
40%
60%
80%
100%
Ban
glad
esh
i (0
)
Asi
an O
the
r (0
)
Bla
ck A
fric
an (
0)
Co
ngo
lese
(0
)
Som
ali (
0)
Bla
ck C
arib
be
an (
0)
Bla
ck O
the
r (0
)
Wh
ite
Bri
tish
(0
)
WB
RI F
SM e
ligib
le (
0)
WB
RI n
on
-FSM
elig
ible
(0)
Wh
ite
Iris
h (
0)
Wh
ite
Oth
er
(0)
Alb
ania
n /
Ko
sova
n (
0)
Mix
ed
(al
l) (
0)
Oth
er (
0)
2017 End of Year 2 phonics - by ethnicity, compared to national School result National result School overall
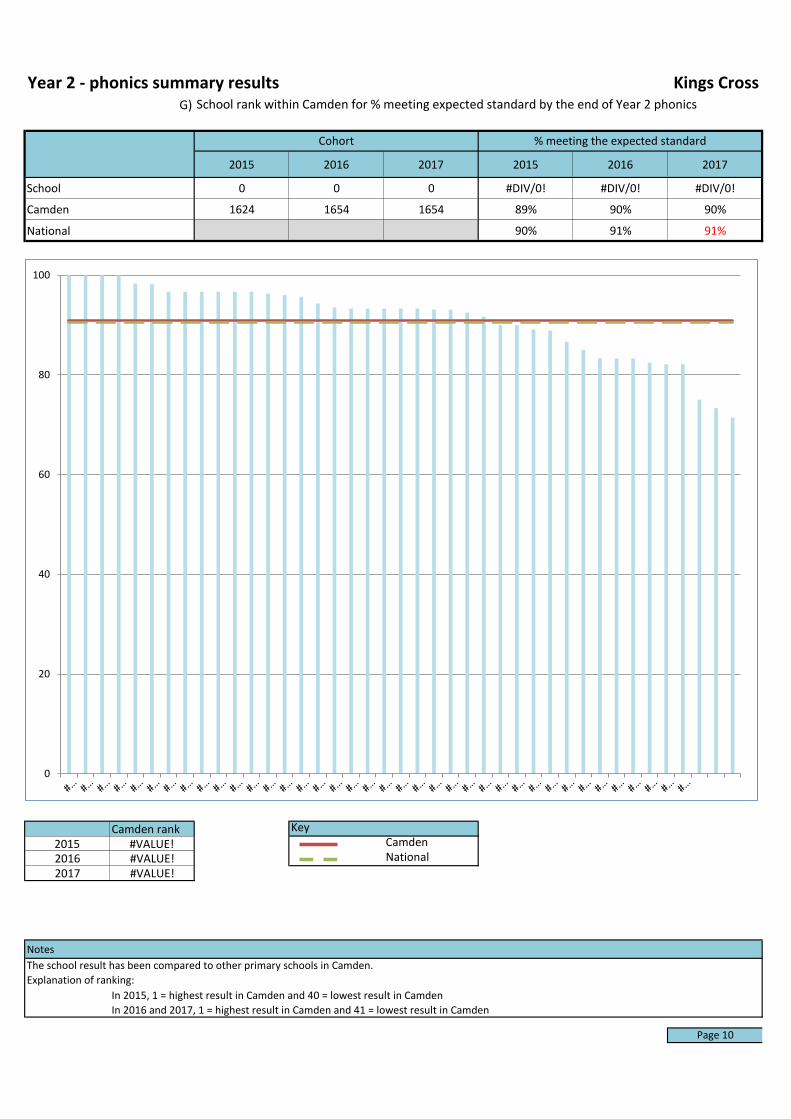
Year 2 - phonics summary results Kings CrossG)
2015 2016 2017 2015 2016 2017
School 0 0 0 #DIV/0! #DIV/0! #DIV/0!
Camden 1624 1654 1654 89% 90% 90%
National 90% 91% 91%
Camden rank Key
2015 #VALUE! Camden
2016 #VALUE! National
2017 #VALUE!
Notes
The school result has been compared to other primary schools in Camden.
Explanation of ranking:
In 2015, 1 = highest result in Camden and 40 = lowest result in Camden
In 2016 and 2017, 1 = highest result in Camden and 41 = lowest result in Camden
Page 10
School rank within Camden for % meeting expected standard by the end of Year 2 phonics
Cohort % meeting the expected standard
0
20
40
60
80
100
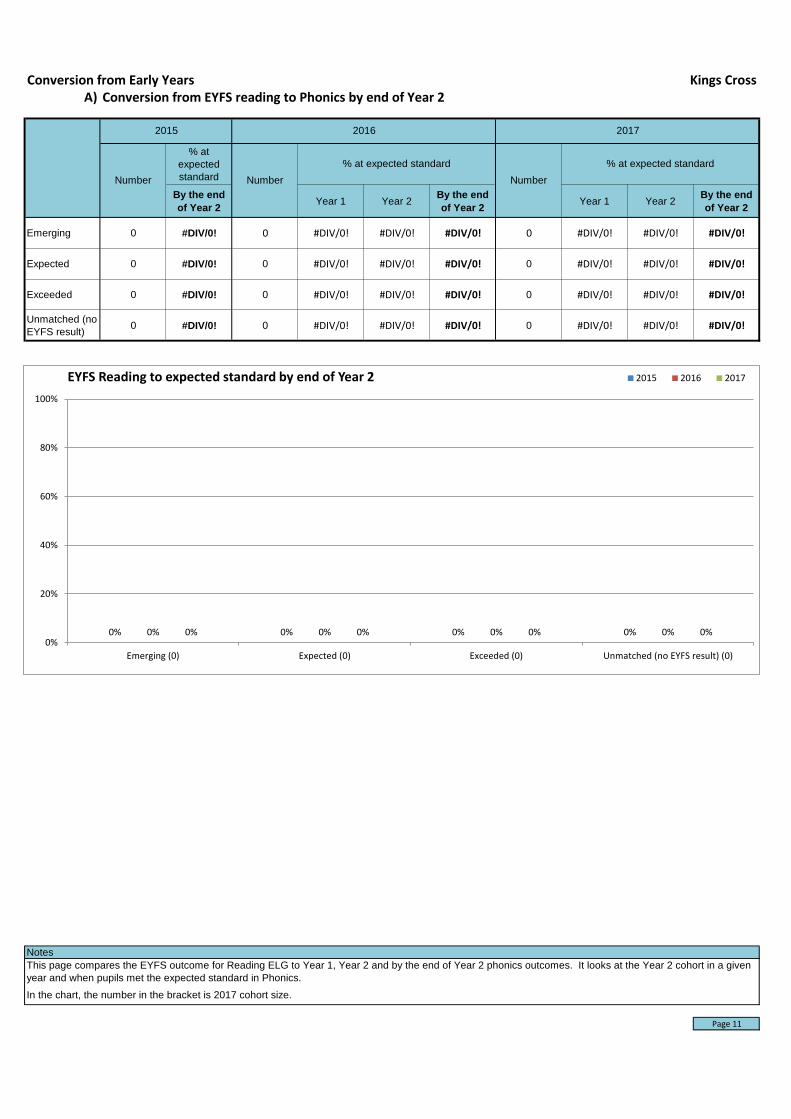
Conversion from Early Years Kings CrossA) Conversion from EYFS reading to Phonics by end of Year 2
% at
expected
standard
By the end
of Year 2Year 1 Year 2
By the end
of Year 2Year 1 Year 2
By the end
of Year 2
Emerging 0 #DIV/0! 0 #DIV/0! #DIV/0! #DIV/0! 0 #DIV/0! #DIV/0! #DIV/0!
Expected 0 #DIV/0! 0 #DIV/0! #DIV/0! #DIV/0! 0 #DIV/0! #DIV/0! #DIV/0!
Exceeded 0 #DIV/0! 0 #DIV/0! #DIV/0! #DIV/0! 0 #DIV/0! #DIV/0! #DIV/0!
Unmatched (no
EYFS result)0 #DIV/0! 0 #DIV/0! #DIV/0! #DIV/0! 0 #DIV/0! #DIV/0! #DIV/0!
Notes
In the chart, the number in the bracket is 2017 cohort size.
Page 11
This page compares the EYFS outcome for Reading ELG to Year 1, Year 2 and by the end of Year 2 phonics outcomes. It looks at the Year 2 cohort in a given
year and when pupils met the expected standard in Phonics.
% at expected standard
Number Number
% at expected standard
2016 2017
Number
2015
0% 0% 0% 0%0% 0% 0% 0%0% 0% 0% 0%0%
20%
40%
60%
80%
100%
Emerging (0) Expected (0) Exceeded (0) Unmatched (no EYFS result) (0)
EYFS Reading to expected standard by end of Year 2 2015 2016 2017