2017 levelized costs aeo 2012 early release
TRANSCRIPT

U.S. Energy Information Administration | AEO2017 Levelized Costs 1
April 2017
Levelized Cost and Levelized Avoided Cost of New Generation
Resources in the Annual Energy Outlook 2017
This paper presents average values of levelized costs and levelized avoided costs for generating
technologies entering service in 2019, 2022,1 and 2040 as represented in the National Energy Modeling
System (NEMS) for the Annual Energy Outlook 2017 (AEO2017) Reference case.2 The costs for
generating technologies entering service in 2022 are presented in the body of the report, with those for
20193 and 2040 included in Appendices A and B, respectively. Both a capacity-weighted average based
on projected capacity additions across the 22 U.S. regions of the NEMS electricity market module (EMM)
and a simple average of the regional values are provided, together with the range of regional values.
Levelized Cost of Electricity (LCOE) and its limitations Levelized cost of electricity (LCOE) is often cited as a convenient summary measure of the overall
competiveness of different generating technologies. It represents the per-kilowatthour cost (in
discounted real dollars) of building and operating a generating plant over an assumed financial life and
duty cycle4. Key inputs to calculating LCOE include capital costs, fuel costs, fixed and variable operations
and maintenance (O&M) costs, financing costs, and an assumed utilization rate for each plant type.5 The
importance of the factors varies among the technologies. For technologies such as solar and wind
generation that have no fuel costs and relatively small variable O&M costs, LCOE changes in rough
proportion to the estimated capital cost of generation capacity. For technologies with significant fuel
cost, both fuel cost and overnight cost estimates significantly affect LCOE. The availability of various
incentives, including state or federal tax credits (see text box), can also impact the calculation of LCOE.
As with any projection, there is uncertainty about all of these factors and their values can vary regionally
and across time as technologies evolve and fuel prices change.
It is important to note that actual plant investment decisions are affected by the specific technological
and regional characteristics of a project, which involve numerous other factors not reflected in LCOE
values. The projected utilization rate, which depends on the load shape and the existing resource mix in
1 The first year that all technologies are available is 2022, given the long lead time and licensing requirements for some
technologies. 2 AEO2017 reports are available at http://www.eia.gov/outlooks/aeo/index.cfm. 3 Appendix A shows levelized cost of electricity values for plants coming online in 2019 for the subset of technologies available
to be built in that year. 4 Duty cycle refers to the typical utilization or dispatch of a plant to serve base, intermediate, or peak load. Plants using wind,
solar, or other intermittently available resources are not dispatched and do not necessarily follow a duty cycle based on load
conditions. 5 The specific assumptions for each of these factors are given in the Assumptions to the Annual Energy Outlook, available at
http://www.eia.gov/outlooks/aeo/assumptions/.

U.S. Energy Information Administration | AEO2017 Levelized Costs 2
an area where additional capacity is needed, is one such factor. The existing resource mix in a region
can directly impact the economic viability of a new investment through its effect on the economics
surrounding the displacement of existing resources. For example, a wind resource that would primarily
displace existing natural gas generation will usually have a different economic value than one that would
displace existing coal generation.
A related factor is the capacity value, which depends on both the existing capacity mix and load
characteristics in a region. Since load must be balanced on a continuous basis, units whose output can
be varied to follow demand (dispatchable technologies) generally have more value to a system than less
flexible units (non-dispatchable technologies), or those whose operation is tied to the availability of an
intermittent resource. The LCOE values for dispatchable and non-dispatchable technologies are listed
separately in the tables, because caution should be used when comparing them to one another.
AEO2017 representation of tax incentives for renewable generation
Federal tax credits for certain renewable generation facilities have the potential to substantially reduce the realized cost of these facilities. Where applicable, the LCOE tables show both the cost without these tax credits, as well as the cost as adjusted for the tax credits assumed to be available in the year in which the plant enters service, as follows.
Production Tax Credit (PTC): New wind, geothermal, and biomass plants receive a $23/MWh ($12/MWh for technologies other than wind, geothermal and closed-loop biomass) inflation-adjusted production tax credit over the plant’s first ten years of service if the plants are under construction before the end of 2016. After 2016, wind continues to be eligible for the production tax credit, but at a dollar per kilowatthour rate that declines by 20% in 2017, 40% in 2018, 60% in 2019, and expires completely in 2020. Based on documentation released by the Internal Revenue Service (IRS) (see https://www.irs.gov/irb/2016-23_IRB/ar07.html), EIA assumes that wind plants will be able to claim the credit up to four years after beginning construction. As a result, wind plants entering service in 2019 will receive the full credit, and those entering service in 2022 will receive $14/MWh (inflation-adjusted).
Investment Tax Credit (ITC): New solar PV and thermal plants are eligible to receive a 30% investment tax credit on capital expenditures if the plants are under construction before the end of 2019, after which the ITC tapers off for new starts to 26% in 2020, and 22% in 2021. In 2022, the ITC expires for residential systems and declines to 10% for business and utility-scale systems in that year and each year thereafter. All utility-scale plants not placed in service prior to January 1, 2024 receive a 10% ITC regardless of the date construction was commenced. Results in this levelized cost report only include utility-scale solar facilities and do not include distributed solar facilities. In NEMS, EIA assumes that new utility-scale solar PV plants will have a 2-year construction lead time and solar thermal plants a 3-year construction lead time. EIA assumes that all utility-scale solar plants entering service in 2019 receive the full 30% tax credit. PV plants entering service in 2022 receive 26%, whereas solar thermal plants entering service in 2022, having begun construction a year earlier receive 30%.

U.S. Energy Information Administration | AEO2017 Levelized Costs 3
Levelized Avoided Cost of Electricity (LACE) as an additional indicator Since projected utilization rates, the existing resource mix, and capacity values can all vary dramatically
across regions where new generation capacity may be needed, the direct comparison of LCOE across
technologies is often problematic and can be misleading as a method to assess the economic
competitiveness of various generation alternatives. Conceptually, a better assessment of economic
competitiveness can be gained through consideration of avoided cost, a measure of what it would cost
the grid to generate the electricity that is otherwise displaced by a new generation project, as well as its
levelized cost. Avoided cost, which provides a proxy measure for the annual economic value of a
candidate project, may be summed over its financial life and converted to a level annualized value that
is divided by average annual output of the project to develop its “levelized” avoided cost of electricity
(LACE).6 The LACE value may then be compared with the LCOE value for the candidate project to provide
an indication of whether or not the project’s value exceeds its cost. If multiple technologies are available
to meet load, comparisons of each project’s LACE to its LCOE may be used to determine which project
provides the best net economic value. Estimating avoided costs is more complex than estimating
levelized costs because it requires information about how the system would have operated without the
option under evaluation. In this discussion, the calculation of avoided costs is based on the marginal
value of energy and capacity that would result from adding a unit of a given technology to the system as
it exists or is projected to exist at a specified future date and represents the potential value available to
the project owner from the project’s contribution to satisfying both energy and capacity requirements.
While the economic decisions for capacity additions in EIA’s long-term projections use neither LACE nor
LCOE concepts, the LACE and net economic values presented in this report are generally more
representative of the factors contributing to the projections than looking at LCOE alone. However, both
the LACE and LCOE estimates are simplifications of modeled decisions, and may not fully capture all
decision factors or match modeled results.
Policy-related factors, such as environmental regulations and investment or production tax credits for
specified generation sources, can also impact investment decisions. The LCOE and LACE values
presented here are derived from the AEO2017 Reference case, which includes the impacts of the Clean
Power Plan (CPP), state-level renewable electricity requirements as of November 2016, and an
extension and phase-out of federal tax credits for renewable generation.
Finally, although levelized cost calculations are generally made using an assumed set of capital and
operating costs, the inherent uncertainty about future fuel prices and future policies may cause plant
owners or investors who finance plants to place a value on portfolio diversification. While EIA considers
many of the factors discussed in the previous paragraphs in its analysis of technology choice in the
electricity sector in NEMS, not all of these concepts are included in LCOE or LACE calculations.
6 Further discussion of the levelized avoided cost concept and its use in assessing economic competitiveness can be found in
this article: http://www.eia.gov/renewable/workshop/gencosts/.

U.S. Energy Information Administration | AEO2017 Levelized Costs 4
LCOE and LACE calculations The LCOE values shown for each utility-scale generation technology in Table1a (regional values weighted
based on projected capacity additions), Table 1b (unweighted average of regional values), and Table 2
(minimum and maximum range across regions) are calculated based on a 30-year cost recovery period,
using a real after-tax weighted average cost of capital (WACC) of 5.5%.7 In reality, the cost recovery
period and cost of capital can vary by technology and project type. Because regulators and the
investment community have continued to push energy companies to invest in technologies that are less
greenhouse gas-intensive, there is considerable financial risk associated with major investments in long-
lived power plants with a relatively higher rate of carbon dioxide emissions. The trend is captured in the
AEO2017 Reference case through a 3-percentage-point adder to the cost of capital when evaluating
investments in new coal-fired power plants, new coal-to-liquids (CTL) plants without carbon capture and
storage (CCS), and pollution control retrofits. For AEO2017, two new coal-fired technologies are
available that are compliant with the new source performance standard for carbon emissions under
Section 111(b) of the Clean Air Act. One design only captures 30% of CO2 emissions and would still be
considered a high emitter relative to other new sources and thus may continue to face potential
financial risk if carbon emission controls are further strengthened. Another design captures 90% of CO2
emissions and would not face the same financial risk, and therefore does not receive the 3-percentage-
point increase in cost of capital. As a result, the LCOE values for the coal-fired plant with 30% CCS are
higher than they would be if the same cost of capital was used for all technologies.
The levelized capital component reflects costs calculated using tax depreciation schedules consistent
with permanent tax law, which vary by technology. Since the literature and common usage of LCOE
supports the reporting of LCOE both with and without tax credits, Tables 1a and 1b report both
calculations for technologies where an investment or production tax credit is available for plants
entering service in 2022. Tax credits are assumed to phase-out and expire based on current laws and
regulations.
Some technologies, notably solar photovoltaic (PV), are used in both utility-scale generating plants and
distributed end-use residential and commercial applications. The LCOE and LACE calculations presented
in this paper apply only to the utility-scale use of those technologies. Costs are expressed in terms of net
alternating current (AC) power available to the grid for the installed capacity.
Tables 1a and 1b show the LCOE for each technology as evaluated based on the capacity factor
indicated, which generally corresponds to the high end of its likely utilization range. This convention is
consistent with the use of LCOE to evaluate competing technologies in baseload operation. Some
technologies, such as combined cycle plants, while sometimes used in baseload operation, are also built
to serve load-following or other intermediate dispatch duty cycles.
7The real WACC of 5.5% corresponds to a nominal after-tax rate of 7.8% for plants entering service in 2022. The WACC used to
calculate LCOE for plants coming online in 2040, which is presented in Appendix B, is 7.8% nominal or 5.8% real. An overview of
the WACC assumptions and methodology can be found in the Electricity Market Module of the National Energy Modeling
System: Model Documentation. This report can be found at
http://www.eia.gov/outlooks/aeo/nems/documentation/electricity/pdf/m068(2014).pdf.

U.S. Energy Information Administration | AEO2017 Levelized Costs 5
Simple combustion turbines (conventional or advanced technology) that are typically used for peak load
duty cycles are evaluated at a 30% capacity factor, reflecting the upper-end of their potential utilization
range. The duty cycle for intermittent renewable resources, wind and solar, is not operator controlled,
but dependent on the weather or solar cycle (that is, sunrise/sunset) and so will not necessarily
correspond to operator dispatched duty cycles. As a result, their LCOE values are not directly
comparable to those for other technologies (even where the average annual capacity factor may be
similar) and therefore are shown in a separate section (Non-Dispatchable Technologies) on each of the
tables. The capacity factors shown for solar, wind, and hydroelectric resources in Tables 1a and 1b are
averages of the capacity factor for the marginal site in each region, weighted by the projected capacity
builds in each region for Table 1a and unweighted for Table 1b. These capacity factors can vary
significantly by region. Projected capacity factors for these resources in the AEO2017 or other EIA
analyses represent cumulative capacity additions (including existing units) and will not necessarily
correspond to these levels.
The LCOE values shown in Table 1a are a weighted average of region-specific LCOE values using weights
reflecting the regional shares of projected capacity builds; Table 1b reports an unweighted average
across all 22 EMM regions. Table 2 shows the significant regional variation in LCOE values based on local
labor markets and the cost and availability of fuel or energy resources such as windy sites. For example,
without consideration of production tax credits, the LCOE for incremental onshore wind capacity coming
online in 2022 ranges from $43.4/MWh in the region with the best available resources to $75.6/MWh in
the region with lowest quality wind resources and/or higher capital costs for the best sites. In general,
onshore wind plants will get built in regions that offer low costs and/or high value, so the weighted
average cost across regions is closer to the low-end of the range, at $55.8/MWh. Costs shown for wind
generators may include additional costs associated with transmission upgrades needed to access remote
resources, as well as other factors that markets may or may not internalize into the market price for
wind power.
As previously indicated, LACE provides an estimate of the cost of generation and capacity resources
displaced by a marginal unit of new capacity of a particular type, thus providing an estimate of the value
of building such new capacity. This is especially important to consider for intermittent resources, such as
wind or solar, that have substantially different duty cycles than the baseload, intermediate, and peaking
duty cycles of conventional generators. Table 3 provides the range of LACE estimates for different
capacity types. The LACE estimates in this table have been calculated assuming the same maximum
capacity factor as in the LCOE. Values are not shown for combustion turbines, because combustion
turbines are generally built for their capacity value to meet a reserve margin rather than to meet
generation requirements and avoided energy costs.
When the LACE of a particular technology exceeds its LCOE at a given time and place, that technology
would generally be economically attractive to build. While the build decisions in the real world, and as
modeled in the AEO, are somewhat more complex than a simple LACE to LCOE comparison, including
such factors as policy and non-economic drivers, the net economic value, or net difference between
LACE and LCOE, provides a reasonable point of comparison of first-order economic competitiveness
among a wider variety of technologies than is possible using either LCOE or LACE tables individually. In
Table 4a and Table 4b, a negative difference indicates that the cost of the marginal new unit of capacity

U.S. Energy Information Administration | AEO2017 Levelized Costs 6
exceeds its value to the system, as measured by LACE; a positive difference indicates that the marginal
new unit brings in value in excess of its cost by displacing more expensive generation and capacity
options. The “Average Net Difference” represents the average of the “LACE minus LCOE” calculation,
where the difference is calculated for each of the 22 regions. This range of differences is not based on
the difference between the minimum and maximum values shown in Table 2 and Table 3, but
represents the lower and upper bound resulting from the LACE minus the LCOE calculations for each of
the 22 regions. The net difference from 2022 to 2040 tends to approach zero as the most economically
attractive resources are built.8
The average net differences shown in Table 4a and Table 4b are for plants coming online in 2022,
consistent with Tables 1-3. The weighted average net difference is above zero in 2022 for advanced
combined cycle units, geothermal, solar PV, and onshore wind, suggesting that these technologies are
being built in regions where they are economically viable. Additional tables showing the LCOE cost
components, regional variation in LCOE and LACE and net differences for 2040 are provided in Appendix
B.
Changes in cost from 2022 to 2040 reflect a number of different factors, sometimes working in different
directions. Technology improvement tends to reduce LCOE through lower capital costs or improved
performance (as measured by heat rate for fossil-fired plants or capacity factor for renewable plants).
For fossil-fired plants, changing fuel prices also factor into the change in LCOE. For renewable resources
such as wind, hydroelectric, or geothermal, the availability of high quality resources may also be a
factor. As the best, least-cost resources are exploited, development will be forced into less favorable
areas, potentially resulting in higher development costs, higher costs to access transmission lines, or
access to lower-performing resources. Changes in the value of generation are a function of load growth.
However, renewables such as wind and solar may show strong daily or seasonal generation patterns. As
a result, the value of such renewable generation may see significant reductions as these periods become
more saturated with generation and generation from new sources must compete with lower-cost
options in the dispatch merit order.
8 For a more detailed discussion of the LACE versus LCOE measures, see Assessing the Economic Value of New Utility-Scale
Electricity Generation Projects, which can be found at http://www.eia.gov/renewable/workshop/gencosts/pdf/lace-
lcoe_070213.pdf

U.S. Energy Information Administration | AEO2017 Levelized Costs 7
Table 1a. Estimated LCOE (weighted average of regional values based on projected capacity additions) for new generation resources, plants entering service in 2022
Plant Type
Capacity Factor
(%)
U.S. Capacity-Weighted1 Average LCOE (2016 $/MWh) for Plants Entering Service in 2022
Levelized Capital
Cost Fixed O&M
Variable O&M
(including fuel)
Transmission Investment
Total System
LCOE
Levelized Tax
Credit2
Total LCOE including
Tax Credit
Dispatchable Technologies
Coal 30% with carbon sequestration3 ---------------------------------------NB---------------------------------------
Coal 90% with carbon sequestration3 ---------------------------------------NB---------------------------------------
Natural Gas-fired
Conventional Combined Cycle 87 14.0 1.4 42.0 1.1 58.6 NA 58.6
Advanced Combined Cycle 87 14.0 1.3 37.5 1.0 53.8 NA 53.8
Advanced CC with CCS ---------------------------------------NB---------------------------------------
Conventional Combustion Turbine 30 36.8 6.6 54.3 3.0 100.7 NA 100.7
Advanced Combustion Turbine 30 22.8 2.6 58.8 3.0 87.1 NA 87.1
Advanced Nuclear 90 70.8 12.6 11.7 1.0 96.2 NA 96.2
Geothermal 90 29.2 13.3 0.0 1.5 44.0 -2.9 41.1
Biomass 83 47.2 15.2 34.2 1.2 97.7 NA 97.7
Non-Dispatchable Technologies
Wind – Onshore 41 39.8 13.1 0.0 2.9 55.8 -11.6 44.3
Wind – Offshore ---------------------------------------NB---------------------------------------
Solar PV4 25 59.8 10.1 0.0 3.8 73.7 -15.6 58.1
Solar Thermal ---------------------------------------NB---------------------------------------
Hydroelectric5 60 54.1 3.1 5.2 1.5 63.9 NA 63.9 1The capacity-weighted average is the average levelized cost per technology, weighted by the new capacity coming online in each region.
The capacity additions for each region were based on additions in 2018-2022. Technologies for which capacity additions are not expected
do not have a capacity-weighted average, and are marked as “NB” or not built. 2The tax credit component is based on targeted federal tax credits such as the production or investment tax credit available for some
technologies. It only reflects tax credits available for plants entering service in 2022. Not all technologies have tax credits, and are
indicated as “NA” or not available. The results are based on a regional model and state or local incentives are not included in LCOE
calculations. See text box on page 2 for details on how the tax credits are represented in the model. 3Due to new regulations (CAA 111b), conventional coal plants cannot be built without CCS because they are required to meet specific CO2
emission standards. Two levels of CCS removal are modeled, 30% and 90%. The coal plant with 30% removal is assumed to incur a 3
percentage-point adder to its cost-of-capital to represent the risk associated with higher emissions from a plant of that design. 4Costs are expressed in terms of net AC power available to the grid for the installed capacity. 5As modeled, hydroelectric is assumed to have seasonal storage so that it can be dispatched within a season, but overall operation is
limited by resources available by site and season.
Source: U.S. Energy Information Administration, Annual Energy Outlook 2017, January 2017, DOE/EIA-0383(2017).

U.S. Energy Information Administration | AEO2017 Levelized Costs 8
Table 1b. Estimated LCOE (simple average of regional values) for new generation resources, for plants entering service in 2022
Plant Type
Capacity Factor
(%)
U.S. Average LCOE (2016 $/MWh) for Plants Entering Service in 2022
Levelized Capital
Cost Fixed O&M
Variable O&M
(including fuel)
Transmission Investment
Total System
LCOE
Levelized Tax
Credit1
Total LCOE including
Tax Credit
Dispatchable Technologies
Coal 30% with carbon sequestration2 85 94.9 9.3 34.6 1.2 140.0 NA 140.0
Coal 90% with carbon sequestration2 85 78.0 10.8 33.1 1.2 123.2 NA 123.2
Natural Gas-fired
Conventional Combined Cycle 87 13.9 1.4 40.8 1.2 57.3 NA 57.3
Advanced Combined Cycle 87 15.8 1.3 38.1 1.2 56.5 NA 56.5
Advanced CC with CCS 87 29.5 4.4 47.4 1.2 82.4 NA 82.4
Conventional Combustion Turbine 30 40.7 6.6 58.6 3.5 109.4 NA 109.4
Advanced Combustion Turbine 30 25.9 2.6 62.7 3.5 94.7 NA 94.7
Advanced Nuclear 90 73.6 12.6 11.7 1.1 99.1 NA 99.1
Geothermal 91 32.2 12.8 0.0 1.5 46.5 -3.2 43.3
Biomass 83 44.7 15.2 41.2 1.3 102.4 NA 102.4
Non-Dispatchable Technologies
Wind – Onshore 39 47.2 13.7 0.0 2.8 63.7 -11.6 52.2
Wind – Offshore 45 133.0 19.6 0.0 4.8 157.4 -11.6 145.9
Solar PV3 24 70.2 10.5 0.0 4.4 85.0 -18.2 66.8
Solar Thermal 20 191.9 44.0 0.0 6.1 242.0 -57.6 184.4
Hydroelectric4 59 56.2 3.4 4.8 1.8 66.2 NA 66.2 1The tax credit component is based on targeted federal tax credits such as the production or investment tax credit available for some
technologies. It only reflects tax credits available for plants entering service in 2022. Not all technologies have tax credits, and are
indicated as “NA” or not available. The results are based on a regional model and state or local incentives are not included in LCOE
calculations. See text box on page 2 for details on how the tax credits are represented in the model. 2Due to new regulations (CAA 111b), conventional coal plants cannot be built without CCS because they are required to meet specific CO2
emission standards. Two levels of CCS removal are modeled, 30% and 90%. The coal plant with 30% removal is assumed to incur a 3
percentage-point adder to its cost-of-capital to represent the risk associated with higher emissions from a plant of that design. 3Costs are expressed in terms of net AC power available to the grid for the installed capacity. 4As modeled, hydroelectric is assumed to have seasonal storage so that it can be dispatched within a season, but overall operation is
limited by resources available by site and season.
Source: U.S. Energy Information Administration, Annual Energy Outlook 2017, January 2017, DOE/EIA-0383(2017).

U.S. Energy Information Administration | AEO2017 Levelized Costs 9
Table 2. Regional variation in levelized cost of electricity (LCOE) for new generation resources, 2022
Plant Type
Range for Total System Levelized Costs (2016 $/MWh)
Range for Total System Levelized Costs with Tax Credits1
(2016 $/MWh)
Minimum
Non-weighted
average
Capacity-weighted2
average Maximum Minimum
Non-weighted
average
Capacity-weighted
average Maximum
Dispatchable Technologies
Coal with 30% carbon sequestration3 128.9 140.0 NB 196.3 128.9 140.0 NB 196.3
Coal with 90% carbon sequestration3 102.7 123.2 NB 142.5 102.7 123.2 NB 142.5
Natural Gas-fired
Conventional Combined Cycle 52.4 57.3 58.6 83.2 52.4 57.3 58.6 83.2
Advanced Combined Cycle 51.6 56.5 53.8 81.7 51.6 56.5 53.8 81.7
Advanced CC with CCS 63.1 82.4 NB 90.4 63.1 82.4 NB 90.4
Conventional Combustion Turbine 98.8 109.4 100.7 148.3 98.8 109.4 100.7 148.3
Advanced Combustion Turbine 85.9 94.7 87.1 129.8 85.9 94.7 87.1 129.8
Advanced Nuclear 95.9 99.1 96.2 104.3 95.9 99.1 96.2 104.3
Geothermal 42.8 46.5 44.0 53.4 40.0 43.3 41.1 49.3
Biomass 84.8 102.4 97.7 125.3 84.8 102.4 97.7 125.3
Non-Dispatchable Technologies
Wind – Onshore 43.4 63.7 55.8 75.6 31.9 52.2 44.3 64.0
Wind – Offshore 136.6 157.4 NB 212.9 125.1 145.9 NB 201.4
Solar PV4 58.3 85.0 73.7 143.0 46.5 66.8 58.1 110.5
Solar Thermal 176.7 242.0 NB 372.8 134.6 184.4 NB 284.3
Hydroelectric5 57.4 66.2 63.9 69.8 57.4 66.2 63.9 69.8 1Levelized cost with tax credits reflects tax credits available for plants entering service in 2022, See note in Tables 1a and 1b. 2The capacity-weighted average is the average levelized cost per technology, weighted by the new capacity coming online in each region.
The capacity additions for each region were based on additions in 2018-2022. Technologies for which capacity additions are not expected
do not have a capacity-weighted average, and are marked as “NB” or not built. 3Due to new regulations (CAA 111b), conventional coal plants cannot be built without CCS because they are required to meet specific CO2
emission standards. The coal plant with 30% removal is assumed to incur a 3 percentage-point adder to its cost-of-capital to represent
the risk associated with higher emissions from a plant of that design. 4Costs are expressed in terms of net AC power available to the grid for the installed capacity. 5As modeled, hydroelectric is assumed to have seasonal storage so that it can be dispatched within a season, but overall operation is
limited by resources available by site and season.
Note: The levelized costs for non-dispatchable technologies are calculated based on the capacity factor for the marginal site modeled in
each region, which can vary significantly by region. The capacity factor ranges for these technologies are as follows: Wind Onshore – 36%
to 45%, Wind Offshore – 41% to 50%, Solar PV – 21% to 32%, Solar Thermal – 11% to 26%, and Hydroelectric – 30% to 65%. The levelized
costs are also affected by regional variations in construction labor rates and capital costs as well as resource availability.
Source: U.S. Energy Information Administration, Annual Energy Outlook 2017, January 2017, DOE/EIA-0383(2017).

U.S. Energy Information Administration | AEO2017 Levelized Costs 10
Table 3. Regional variation in levelized avoided costs of electricity (LACE) for new generation resources, 2022
Plant Type
Range for Levelized Avoided Costs (2016 $/MWh)
Minimum Non-weighted
Average
Capacity weighted1
average Maximum
Dispatchable Technologies
Coal 30% with carbon sequestration2 47.4 58.7 NB 80.2
Coal 90% with carbon sequestration2 47.4 58.7 NB 80.2
Natural Gas-fired Combined Cycle
Conventional Combined Cycle 47.3 58.1 58.4 80.0
Advanced Combined Cycle 47.3 58.1 59.3 80.0
Advanced CC with CCS 47.3 58.1 NB 80.0
Advanced Nuclear 47.6 57.3 59.3 64.5
Geothermal 51.5 65.3 70.4 79.8
Biomass 47.5 58.3 54.6 80.3
Non-Dispatchable Technologies
Wind – Onshore 44.1 53.2 54.0 76.3
Wind – Offshore 47.1 57.8 NB 79.0
Solar PV3 42.5 64.7 66.8 82.9
Solar Thermal 39.7 69.9 NB 92.3
Hydroelectric4 46.1 57.4 58.2 79.5 1The capacity-weighted average is the average levelized avoided cost per technology, weighted by the new capacity coming online in
each region. The capacity additions for each region were based on additions in 2018-2022. Technologies for which capacity additions are
not expected do not have a capacity-weighted average, and are marked as “NB” or not built. 2Due to new regulations (CAA 111b), conventional coal plants cannot be built without CCS because they are required to meet specific CO2
emission standards. The coal plant with 30% removal is assumed to incur a 3 percentage-point adder to its cost-of-capital to represent
the risk associated with higher emissions from a plant of that design. 3Costs are expressed in terms of net AC power available to the grid for the installed capacity. 4As modeled, hydroelectric is assumed to have seasonal storage so that it can be dispatched within a season, but overall operation is
limited by resources available by site and season.
Source: U.S. Energy Information Administration, Annual Energy Outlook 2017, January 2017, DOE/EIA-0383(2017).

U.S. Energy Information Administration | AEO2017 Levelized Costs 11
Table 4a. Difference between capacity-weighted levelized avoided costs of electricity (LACE) and capacity-weighted levelized costs of electricity (LCOE) for plants entering service in 2022
Comparison of capacity-weighted1 LCOE with tax credits and capacity-
weighted LACE (2016 $/MWh)
Average Average Average Net
Plant Type LCOE LACE Difference2
Dispatchable Technologies
Coal 30% with carbon sequestration 3 -----------------NB-----------------
Coal 90% with carbon sequestration3 -----------------NB-----------------
Natural Gas-fired
Conventional Combined Cycle 58.6 58.4 -0.2
Advanced Combined Cycle 53.8 59.3 5.4
Advanced CC with CCS -----------------NB-----------------
Advanced Nuclear 96.2 59.3 -36.9
Geothermal 41.1 70.4 29.4
Biomass 97.7 54.6 -43.0
Non-Dispatchable Technologies
Wind – Onshore 44.3 54.0 9.7
Wind – Offshore -----------------NB-----------------
Solar PV4 58.1 66.8 8.6
Solar Thermal -----------------NB-----------------
Hydroelectric5 63.9 58.2 -5.7 1The capacity-weighted average is the average levelized cost per technology, weighted by the new capacity coming online in each region.
The capacity additions for each region were based on additions in 2018-2022. Technologies for which capacity additions are not expected
do not have a capacity-weighted average, and are marked as “NB” or not built. 2The “Average Net Difference” represents the net economic value or the average of the (LACE minus LCOE) calculation, where the
difference is calculated for each of the 22 regions based on the cost with tax credits for each technology, where tax credits are applicable. 3Due to new regulations (CAA 111b), conventional coal plants cannot be built without CCS because they are required to meet specific CO2
emission standards. The coal plant with 30% removal is assumed to incur a 3 percentage-point adder to its cost-of-capital to represent
the risk associated with higher emissions from a plant of that design. 4Costs are expressed in terms of net AC power available to the grid for the installed capacity. 5As modeled, hydroelectric is assumed to have seasonal storage so that it can be dispatched within a season, but overall operation is
limited by resources available by site and season.
Source: U.S. Energy Information Administration, Annual Energy Outlook 2017, January 2017, DOE/EIA-0383(2017).

U.S. Energy Information Administration | AEO2017 Levelized Costs 12
Table 4b: Difference between levelized avoided costs of electricity (LACE) and levelized costs of electricity (LCOE) for plants entering service in 2022
Comparison of non-weighted average LCOE with tax credits and non-weighted average LACE
(2016 $/MWh)
Average Average Average Net Range of Non-
Weighted Differences2 Plant Type LCOE LACE Difference1 Minimum Maximum
Dispatchable Technologies
Coal 30% with carbon sequestration3 140.0 58.7 -81.3 -116.2 -70.7
Coal 90% with carbon sequestration3 123.2 58.7 -64.5 -77.4 -50.2
Natural Gas-fired
Conventional Combined Cycle 57.3 58.1 0.9 -5.1 9.3
Advanced Combined Cycle 56.5 58.1 1.7 -4.2 9.0
Advanced CC with CCS 82.4 58.1 -24.2 -35.2 -9.5
Advanced Nuclear 99.1 57.3 -41.7 -56.3 -34.6
Geothermal 43.3 65.3 21.9 10.9 39.8
Biomass 102.4 58.3 -44.1 -70.6 -27.6
Non-Dispatchable Technologies
Wind – Onshore 52.2 53.2 1.0 -17.4 20.9
Wind – Offshore 145.9 57.8 -88.1 -141.9 -52.1
Solar PV4 66.8 64.7 -2.0 -42.5 21.4
Solar Thermal 184.4 69.9 -114.5 -215.3 -57.7
Hydroelectric5 66.2 57.4 -8.8 -20.6 9.8 1The “Average Net Difference” represents the average of the (LACE minus LCOE) calculation, where the difference is calculated for each of
the 22 regions based on the cost with tax credits for each technology, where tax credits are applicable. 2This “range of differences” is not based on the difference between the minimum values shown in Table 2 and Table 3, but represents the
lower and upper bound resulting from the LACE minus LCOE calculations for each of the 22 regions. 3Due to new regulations (CAA 111b), conventional coal plants cannot be built without CCS because they are required to meet specific CO2 emission standards. The coal plant with 30% removal is assumed to incur a 3 percentage-point adder to its cost-of-capital to represent the risk associated with higher emissions from a plant of that design. 4Costs are expressed in terms of net AC power available to the grid for the installed capacity. 5As modeled, hydroelectric is assumed to have seasonal storage so that it can be dispatched within a season, but overall operation is
limited by resources available by site and season. Source: U.S. Energy Information Administration, Annual Energy Outlook 2017, January 2017, DOE/EIA-0383(2017).

U.S. Energy Information Administration | AEO2017 Levelized Costs 13
Appendix A: LCOE tables for plants entering service in 2019
Table A1a. Estimated LCOE (weighted average of regional values based on projected capacity additions) for new generation resources, for plants entering service in 2019
Plant Type
Capacity Factor
(%)
U.S. Capacity-Weighted1 Average LCOE (2016 $/MWh) for Plants Entering Service in 2019
Levelized Capital
Cost Fixed O&M
Variable O&M
(including fuel)
Transmission Investment
Total System
LCOE Levelized
Tax Credit
Total LCOE with Tax
Credit2
Dispatchable Technologies
Natural Gas-fired
Conventional Combined Cycle 87 11.6 1.4 35.2 1.1 49.3 NA 49.3
Advanced Combined Cycle 87 11.9 1.3 30.9 1.0 45.2 NA 45.2
Conventional Combustion Turbine 30 34.2 6.6 48.6 3.3 92.7 NA 92.7
Advanced Combustion Turbine 30 19.8 2.6 53.1 2.9 78.3 NA 78.3
Non-Dispatchable Technologies
Wind – Onshore 39 36.0 13.7 0.0 2.7 52.4 -17.8 34.5
Solar PV3 26 56.4 9.6 0.0 4.0 70.1 -16.9 53.1
Solar Thermal 26 122.7 31.1 0.0 5.1 158.9 -36.8 122.1 1The capacity-weighted average is the average levelized cost per technology, weighted by the new capacity coming online in each region.
The capacity additions for each region are based on additions in 2017-2019. Technologies for which no new capacity builds are expected
do not have a capacity-weighted average, and are marked as “NB” or not built. 2Levelized cost with tax credits reflects tax credits available for plants entering service in 2019, see note 2 in Tables 1a. Not all
technologies have tax credits, and are marked as “NA” or not available. 3Costs are expressed in terms of net AC power available to the grid for the installed capacity.
Source: U.S. Energy Information Administration, Annual Energy Outlook 2017, January 2017, DOE/EIA-0383(2017).

U.S. Energy Information Administration | AEO2017 Levelized Costs 14
Table A1b. Estimated LCOE (simple average of regional values) for new generation resources, for plants entering service in 2019
Plant Type
Capacity
Factor (%)
U.S. Average LCOE (2016 $/MWh) for Plants Entering Service in 2019
Levelized Capital
Cost Fixed O&M
Variable O&M
(including fuel)
Transmission Investment
Total System
LCOE
Levelized Tax
Credit1
Total LCOE with Tax
Credit
Dispatchable Technologies
Natural Gas-fired
Conventional Combined Cycle 87 11.9 1.4 35.6 1.2 50.1 NA 50.1
Advanced Combined Cycle 87 13.6 1.3 32.7 1.2 48.8 NA 48.8
Conventional Combustion Turbine 30 35.2 6.6 50.5 3.5 95.8 NA 95.8
Advanced Combustion Turbine 30 22.5 2.6 56.7 3.5 85.3 NA 85.3
Non-Dispatchable Technologies
Wind – Onshore 40 40.8 13.6 0.0 2.8 57.1 -17.8 39.3
Solar PV2 24 62.8 10.5 0.0 4.4 77.7 -18.9 58.8
Solar Thermal 20 167.6 44.0 0.0 6.1 217.6 -50.3 167.3 1Levelized cost with tax credits reflects tax credits available for plants entering service in 2019, see note in Tables 1a and 1b. Not all
technologies have tax credits, and are marked as “NA” or not available. 2 Costs are expressed in terms of net AC power available to the grid for the installed capacity.
Source: U.S. Energy Information Administration, Annual Energy Outlook 2017, January 2017, DOE/EIA-0383(2017).

U.S. Energy Information Administration | AEO2017 Levelized Costs 15
Table A2. Regional variation in levelized cost of electricity (LCOE) for new generation resources, plants entering service in 2019
Plant Type
Range for Total System LCOE (2016 $/MWh)
Range for Total LCOE with Tax Credits1 (2016 $/MWh)
Minimum
Non-weighted
average
Capacity-weighted2
average Maximum Minimum
Non-weighted
average
Capacity-weighted
average Maximum
Dispatchable Technologies
Natural Gas-fired
Conventional Combined Cycle 45.8 50.1 49.3 58.9 45.8 50.1 49.3 58.9
Advanced Combined Cycle 45.1 48.8 45.2 56.2 45.1 48.8 45.2 56.2
Conventional Combustion Turbine 87.2 95.8 92.7 107.6 87.2 95.8 92.7 107.6
Advanced Combustion Turbine 77.6 85.3 78.3 96.7 77.6 85.3 78.3 96.7
Non-Dispatchable Technologies
Wind – Onshore 40.4 57.1 52.4 69.4 22.6 39.3 34.5 51.6
Solar PV3 53.5 77.7 70.1 129.9 41.3 58.8 53.1 96.4
Solar Thermal 158.9 217.6 158.9 335.3 122.1 167.3 122.1 258.0 1Levelized cost with tax credits reflects tax credits available in 2019, see note 2 in Tables 1a. 2The capacity-weighted average is the average levelized cost per technology, weighted by the new capacity coming online in each region.
The capacity additions for each region were based on additions in 2017-2019.Technologies for which new capacity builds are not
expected do not have a capacity-weighted average, and are marked as “NB” or not built. 3Costs are expressed in terms of net AC power available to the grid for the installed capacity.
Note: The levelized costs for non-dispatchable technologies are calculated based on the capacity factor for the marginal site modeled in
each region, which can vary significantly by region. The capacity factor ranges for these technologies are as follows: Wind Onshore – 36%
to 45%, Solar PV – 21% to 32%, and Solar Thermal – 11% to 26%. The levelized costs are also affected by regional variations in
construction labor rates and capital costs as well as resource availability.
Source: U.S. Energy Information Administration, Annual Energy Outlook 2017, January 2017, DOE/EIA-0383(2017).

U.S. Energy Information Administration | AEO2017 Levelized Costs 16
Appendix B: LCOE and LACE tables for plants entering service in 2040
Table B1a. Estimated LCOE (weighted average of regional values based on projected capacity additions) for new generation resources, for plants entering service in 2040
Plant Type
Capacity Factor
(%)
U.S. Capacity-Weighted1 Average LCOE (2016 $/MWh) for Plants Entering Service in 2040
Levelized Capital
Cost Fixed O&M
Variable O&M
(including fuel)
Transmission Investment
Total System
LCOE Levelized
Tax Credit2
Total LCOE with Tax
Credit
Dispatchable Technologies
Coal 30% with carbon sequestration3 ---------------------------------------NB---------------------------------------
Coal 90% with carbon sequestration3 ---------------------------------------NB---------------------------------------
Natural Gas-fired
Conventional Combined Cycle ---------------------------------------NB---------------------------------------
Advanced Combined Cycle 87 11.7 1.3 41.8 1.0 55.8 NA 55.8
Advanced CC with CCS ---------------------------------------NB---------------------------------------
Conventional Combustion Turbine ---------------------------------------NB---------------------------------------
Advanced Combustion Turbine 30 18.4 2.6 66.3 3.4 90.7 NA 90.7
Advanced Nuclear ---------------------------------------NB---------------------------------------
Geothermal 91 24.7 16.5 0.0 1.5 42.6 -2.5 40.2
Biomass 83 34.9 15.2 24.5 1.1 75.7 NA 75.7
Non-Dispatchable Technologies
Wind – Onshore 42 44.4 13.0 0.0 2.9 60.3 NA 60.3
Wind – Offshore ---------------------------------------NB---------------------------------------
Solar PV4 24 45.3 10.4 0.0 3.8 59.5 -4.5 54.9
Solar Thermal ---------------------------------------NB---------------------------------------
Hydroelectric5 37 43.4 2.9 3.3 1.3 50.9 NA 50.9 1The capacity-weighted average is the average levelized cost per technology, weighted by the new capacity coming online in each region.
The capacity additions for each region were based on additions in 2036-2040. Technologies for which no new capacity builds are
expected do not have a capacity-weighted average, and are marked as “NB” or not built. 2Levelized cost with tax credits reflects tax credits available in 2040, which includes a permanent 10% investment tax credit for
geothermal and solar technologies, based on the Energy Policy Act of 1992. Not all technologies have tax credits, and are marked as “NA”
or not available. 3Due to new regulations (CAA 111b), coal plants cannot be built without CCS because they are required to meet specific CO2 emission
standards. Two levels of CCS removal are modeled, 30% and 90%. The coal with 30% removal is assumed to incur a 3 percentage-point
adder to their cost-of-capital to represent risk associated with higher emissions. 4 Costs are expressed in terms of net AC power available to the grid for the installed capacity. 5As modeled, hydroelectric is assumed to have seasonal storage so that it can be dispatched within a season, but overall operation is
limited by resources available by site and season.
Source: U.S. Energy Information Administration, Annual Energy Outlook 2017, January 2017, DOE/EIA-0383(2017).

U.S. Energy Information Administration | AEO2017 Levelized Costs 17
Table B1b. Estimated LCOE (simple average of regional values) for new generation resources, for plants entering service in 2040
Plant Type Capacity
Factor (%)
U.S. Average LCOE (2016 $/MWh) for Plants Entering Service in 2040
Levelized Capital
Cost Fixed O&M
Variable O&M
(including fuel)
Transmission Investment
Total System
LCOE Levelized
Tax Credit1
Total LCOE with Tax
Credit
Dispatchable Technologies
Coal 30% with carbon sequestration2 85 77.7 9.3 34.6 1.2 122.8 NA 122.8
Coal 90% with carbon sequestration2 85 63.9 10.8 34.4 1.2 110.3 110.3
Natural Gas-fired
Conventional Combined Cycle 87 11.8 1.4 45.6 1.2 60.0 NA 60.0
Advanced Combined Cycle 87 12.6 1.3 43.2 1.2 58.3 NA 58.3
Advanced CC with CCS 87 22.4 4.4 53.9 1.2 81.9 NA 81.9
Conventional Combustion Turbine 30 34.5 6.6 66.8 3.5 111.4 NA 111.4
Advanced Combustion Turbine 30 19.6 2.6 67.7 3.5 93.4 NA 93.4
Advanced Nuclear 90 59.4 12.6 16.5 1.1 89.6 NA 89.6
Geothermal 92 35.6 20.3 0.0 1.5 57.4 -3.6 53.8
Biomass 83 37.1 15.2 37.5 1.3 91.0 NA 91.0
Non-Dispatchable Technologies
Wind – Onshore 41 41.7 13.1 0.0 2.7 57.6 NA 57.6
Wind – Offshore 45 104.4 19.6 0.0 4.9 128.8 NA 128.8
Solar PV3 24 54.5 10.5 0.0 4.4 69.4 -5.4 63.9
Solar Thermal 20 154.2 44.0 0.0 6.1 204.3 -15.4 188.9
Hydroelectric4 57 52.5 3.5 4.6 1.8 62.4 NA 62.4 1Levelized cost with tax credits reflects tax credits available in 2040, which includes a permanent 10% investment tax credit for
geothermal and solar technologies, based on the Energy Policy Act of 1992. Not all technologies have tax credits, and are marked as “NA”
or not available. 2Due to new regulations (CAA 111b), coal plants cannot be built without CCS because they are required to meet specific CO2 emission
standards. Two levels of CCS removal are modeled, 30% and 90%. The coal with 30% removal is assumed to incur a 3 percentage-point
adder to their cost-of-capital to represent risk associated with higher emissions. 3Costs are expressed in terms of net AC power available to the grid for the installed capacity. 4As modeled, hydroelectric is assumed to have seasonal storage so that it can be dispatched within a season, but overall operation is
limited by resources available by site and season.
Source: U.S. Energy Information Administration, Annual Energy Outlook 2017, January 2017, DOE/EIA-0383(2017).

U.S. Energy Information Administration | AEO2017 Levelized Costs 18
Table B2. Regional variation in levelized cost of electricity (LCOE) for new generation resources, plants entering service in 2040
Plant Type
Range for Total System LCOE (2016 $/MWh)
Range for Total LCOE with Tax Credits1 (2016 $/MWh)
Minimum
Non-weighted
average
Capacity-weighted2
average Maximum Minimum
Non-weighted
average
Capacity-weighted2
average Maximum
Dispatchable Technologies
Coal 30% with carbon sequestration3 112.2 122.8 NB 180.4 112.2 122.8 NB 180.4
Coal 90% with carbon sequestration3 102.6 110.3 NB 124.6 102.6 110.3 NB 124.6
Natural Gas-fired
Conventional Combined Cycle 54.8 60.0 NB 86.8 54.8 60.0 NB 86.8
Advanced Combined Cycle 53.2 58.3 55.8 84.2 53.2 58.3 55.8 84.2
Advanced CC with CCS 65.9 81.9 NB 90.2 65.9 81.9 NB 90.2
Conventional Combustion Turbine 102.0 111.4 NB 152.1 102.0 111.4 NB 152.1
Advanced Combustion Turbine 86.0 93.4 90.7 129.1 86.0 93.4 90.7 129.1
Advanced Nuclear 87.1 89.6 NB 93.8 87.1 89.6 NB 93.8
Geothermal 35.3 57.4 42.6 78.1 33.3 53.8 40.2 72.9
Biomass 73.2 91.0 75.7 114.5 73.2 91.0 75.7 114.5
Non-Dispatchable Technologies
Wind – Onshore 37.7 57.6 60.3 69.4 37.7 57.6 60.3 69.4
Wind – Offshore 111.8 128.8 NB 172.7 111.8 128.8 NB 172.7
Solar PV4 48.1 69.4 59.5 115.1 44.6 63.9 54.9 105.4
Solar Thermal 149.1 204.3 NB 314.8 137.8 188.9 NB 291.1
Hydroelectric5 55.3 62.4 50.9 69.7 55.3 62.4 50.9 69.7 1Levelized cost with tax credits reflects tax credits available in 2040, which includes a permanent 10% investment tax credit for
geothermal and solar technologies, based on the Energy Policy Act of 1992. 2The capacity-weighted average is the average levelized cost per technology, weighted by the new capacity coming online in each region.
The capacity additions for each region were based on additions in 2036-2040. Technologies for which new capacity builds are not
expected do not have a capacity-weighted average, and are marked as “NB” or not built. 3Due to new regulations (CAA 111b), coal plants cannot be built without CCS because they are required to meet specific CO2 emission
standards. Two levels of CCS removal are modeled, 30% and 90%. The coal with 30% removal is assumed to incur a 3 percentage-point
adder to their cost-of-capital to represent risk associated with higher emissions. 4Costs are expressed in terms of net AC power available to the grid for the installed capacity. 5As modeled, hydroelectric is assumed to have seasonal storage so that it can be dispatched within a season, but overall operation is
limited by resources available by site and season.
Note: The levelized costs for non-dispatchable technologies are calculated based on the capacity factor for the marginal site modeled in
each region, which can vary significantly by region. The capacity factor ranges for these technologies are as follows: Wind Onshore – 38%
to 52%, Wind Offshore – 41% to 50%, Solar PV – 21% to 32%, Solar Thermal – 11% to 26%, and Hydroelectric – 46% to 65%. The levelized
costs are also affected by regional variations in construction labor rates and capital costs as well as resource availability.
Source: U.S. Energy Information Administration, Annual Energy Outlook 2017, January 2017, DOE/EIA-0383(2017).
U.S. Energy Information Administration | AEO2017 Levelized Costs 19
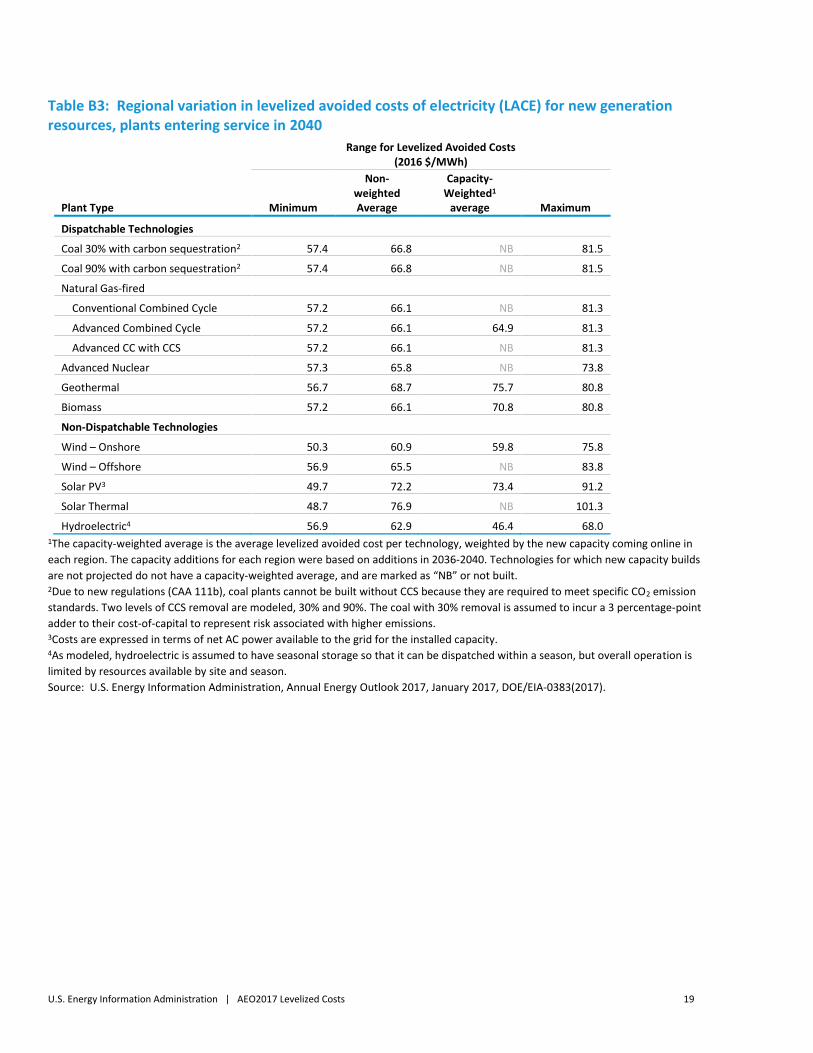
Table B3: Regional variation in levelized avoided costs of electricity (LACE) for new generation resources, plants entering service in 2040
Plant Type
Range for Levelized Avoided Costs (2016 $/MWh)
Minimum
Non-weighted Average
Capacity-Weighted1
average Maximum
Dispatchable Technologies
Coal 30% with carbon sequestration2 57.4 66.8 NB 81.5
Coal 90% with carbon sequestration2 57.4 66.8 NB 81.5
Natural Gas-fired
Conventional Combined Cycle 57.2 66.1 NB 81.3
Advanced Combined Cycle 57.2 66.1 64.9 81.3
Advanced CC with CCS 57.2 66.1 NB 81.3
Advanced Nuclear 57.3 65.8 NB 73.8
Geothermal 56.7 68.7 75.7 80.8
Biomass 57.2 66.1 70.8 80.8
Non-Dispatchable Technologies
Wind – Onshore 50.3 60.9 59.8 75.8
Wind – Offshore 56.9 65.5 NB 83.8
Solar PV3 49.7 72.2 73.4 91.2
Solar Thermal 48.7 76.9 NB 101.3
Hydroelectric4 56.9 62.9 46.4 68.0 1The capacity-weighted average is the average levelized avoided cost per technology, weighted by the new capacity coming online in
each region. The capacity additions for each region were based on additions in 2036-2040. Technologies for which new capacity builds
are not projected do not have a capacity-weighted average, and are marked as “NB” or not built. 2Due to new regulations (CAA 111b), coal plants cannot be built without CCS because they are required to meet specific CO2 emission
standards. Two levels of CCS removal are modeled, 30% and 90%. The coal with 30% removal is assumed to incur a 3 percentage-point
adder to their cost-of-capital to represent risk associated with higher emissions. 3Costs are expressed in terms of net AC power available to the grid for the installed capacity. 4As modeled, hydroelectric is assumed to have seasonal storage so that it can be dispatched within a season, but overall operation is
limited by resources available by site and season.
Source: U.S. Energy Information Administration, Annual Energy Outlook 2017, January 2017, DOE/EIA-0383(2017).

U.S. Energy Information Administration | AEO2017 Levelized Costs 20
Table B4a: Difference between capacity-weighted levelized avoided costs of electricity (LACE) and capacity-weighted levelized costs of electricity (LCOE), plants entering service in 2040
Plant Type
Comparison of capacity-weighted1 LCOE with tax credits and capacity-
weighted LACE (2016 $/MWh)
Average Average Average Net LCOE LACE Difference2
Dispatchable Technologies
Coal 30% with carbon sequestration3 -----------------NB-----------------
Coal 90% with carbon sequestration3 -----------------NB-----------------
Natural Gas-fired
Conventional Combined Cycle -----------------NB-----------------
Advanced Combined Cycle 55.8 64.9 9.1
Advanced CC with CCS -----------------NB-----------------
Advanced Nuclear -----------------NB-----------------
Geothermal 40.2 75.7 35.5
Biomass 75.7 70.8 -4.9
Non-Dispatchable Technologies
Wind – Onshore 60.3 59.8 -0.4
Wind – Offshore -----------------NB-----------------
Solar PV4 54.9 73.4 18.5
Solar Thermal -----------------NB-----------------
Hydroelectric5 50.9 46.4 -4.5 1The capacity-weighted average is the average levelized cost per technology, weighted by the new capacity coming online in each region.
The capacity additions for each region were based on additions in 2036-2040. Technologies for which capacity additions are not expected
do not have a capacity-weighted average, and are marked as “NB” or not built. 2The “Average Net Difference” represents the average of the LACE minus LCOE calculation, where the difference is calculated for each of
the 22 regions based on the cost with tax credits for each technology, where tax credits are applicable. This “range of difference” is not
based on the difference between the minimum values shown in Table B2 and Table B3, but represents the lower and upper bound
resulting from the LACE minus LCOE calculations for each of the 22 regions. 3 Due to new regulations (CAA 111b), conventional coal plants cannot be built without CCS because they are required to meet specific CO2
emission standards. The coal plant with 30% removal is assumed to incur a 3 percentage-point adder to its cost-of-capital to represent
the risk associated with higher emissions from a plant of that design. 4Costs are expressed in terms of net AC power available to the grid for the installed capacity. 5As modeled, hydroelectric is assumed to have seasonal storage so that it can be dispatched within a season, but overall operation is
limited by resources available by site and season.
Source: U.S. Energy Information Administration, Annual Energy Outlook 2017, January 2017, DOE/EIA-0383(2017).

U.S. Energy Information Administration | AEO2017 Levelized Costs 21
Table B4b: Difference between levelized avoided costs of electricity (LACE) and levelized costs of electricity (LCOE), plants entering service in 2040
Comparison of LCOE with tax credits and LACE (2016 $/MWh)
Average Average Average Net Range of Non-
Weighted Differences2 Plant Type LCOE LACE Difference1 Minimum Maximum
Dispatchable Technologies
Coal 30% with carbon sequestration3 122.8 66.8 -56.1 -98.9 -42.0
Coal 90% with carbon sequestration3 110.3 66.8 -43.6 -61.6 -33.1
Natural Gas-fired
Conventional Combined Cycle 60.0 66.1 6.1 -5.5 12.7
Advanced Combined Cycle 58.3 66.1 7.8 -2.8 13.7
Advanced CC with CCS 81.9 66.1 -15.7 -23.7 -7.2
Advanced Nuclear 89.6 65.8 -23.8 -36.3 -16.3
Geothermal 53.8 68.7 14.9 -4.2 47.4
Biomass 91.0 66.1 -24.9 -53.0 -1.7
Non-Dispatchable Technologies
Wind – Onshore 57.6 60.9 3.3 -11.1 22.6
Wind – Offshore 128.8 65.5 -63.3 -103.1 -33.1
Solar PV4 63.9 72.2 8.2 -32.3 32.4
Solar Thermal 188.9 76.9 -112.0 -214.3 -57.2
Hydroelectric5 62.4 62.9 0.5 -8.5 12.4 1The “Average Net Difference” represents the average of the LACE minus LCOE calculation, where the difference is calculated for each of
the 22 regions based on the cost with tax credits for each technology, where tax credits are applicable. 2This “range of differences” is not based on the difference between the minimum values shown in Table B2 and Table B3 but represents
the lower and upper bound resulting from the LACE minus LCOE calculations for each of the 22 regions. 3Due to new regulations (CAA 111b), conventional coal plants cannot be built without CCS because they are required to meet specific CO2 emission standards. The coal plant with 30% removal is assumed to incur a 3 percentage-point adder to its cost-of-capital to represent the risk associated with higher emissions from a plant of that design. 4Costs are expressed in terms of net AC power available to the grid for the installed capacity. 5As modeled, hydroelectric is assumed to have seasonal storage so that it can be dispatched within a season, but overall operation is
limited by resources available by site and season.
Source: U.S. Energy Information Administration, Annual Energy Outlook 2017, January 2017, DOE/EIA-0383(2017).