2017 jetro survey on business conditions of japanese ... · future business plan (1) ... most...
TRANSCRIPT

December 21, 2017
Asia and Oceania Division
China and North Asia Division
Overseas Research Department
2017 JETRO Survey on Business Conditions of
Japanese Companies in Asia and Oceania
Copyright © 2017 JETRO. All rights reserved. Reproduction without permission is prohibited.

3
6
8
9
10
11
12
13
14
15
16
18
19
20
21
22
23
24
25
26
27
28
30
31
33
36
37
38
Summary of Surveys in Current Fiscal Year
Key Points
1. Operating Profit Forecast
(1) Operating profit forecast for 2017 (by country/region and company size)
(2) Proportion of profitable firms - 2008 to 2017 (by country/region)
(3) Operating profit forecast for 2017 (by industry)
(4) Operating profit forecast for 2017 (by country/region,
domestic sales-oriented/export-oriented)
(5) Operating profit forecast for 2017 (by year of establishment)
(6) Operating profit forecast for 2017 and 2018
(comparison with the previous year, by country/region)
(7) 2017 and 2018 DI (by country/region)
(8) Operating profit forecast for 2017 and 2018
(comparison with the previous year, by industry)
(9)-(10) Reasons for increased/decreased operating profit forecast for 2017 and 2018
2. Future Business Plan
(1) Approach to future business challenges in the next 1 to 2 years
(by country/region)
(2) Proportions of firms expecting to expand in the next 1 to 2 years
(2008 to 2017, by country/region)
(3) Proportions of firms expecting to expand in the next 1 to 2 years
(2008 to 2017, China and other major countries in Asia)
(4) Approach to future business challenges in the next 1 to 2 years
(by industry and company size)
(5) Approach to future business challenges in the next 1 to 2 years
(by major industry and country/region)
(6) Reasons for expected business expansion in the next 1 to 2 years
(7) Functions to expand
(8) Functions to be expanded (by country) (2013 to 2017)
(9) Reasons for the future reduction, transfer or withdrawal
(10) Approach to future business challenges of Japanese-affiliated firms in
China in the next 1 to 2 years
(11)-(12) Changes in the number of employees (changes in a year-on-year
comparison and future plans)
3. Management Matters
(1) Problems common to all regions (top 10)
(2)-(3) Problems common to all regions (top 10, response rate for each country/region)
(4)-(6) Problems by country/region (top 5)
(7) Comparison between China and other major countries in Asia
(top 5 for each country)
4. Rising Costs of Production and Services
(1) Negative impact of soaring costs of production and services on business activities
(by country/region)
(2) Negative impact of soaring costs of production and services on business
activities (by industry)
39
40
42
43
44
45
46
47
48
49
50
51
52
54
56
58
61
63
65
66
67
68
69
71
72
73
74
75
(3) Countermeasures against rising costs currently being taken or under consideration
(4)-(5) Countermeasures against rising costs currently being taken or under consideration
(by country/region)
5. Procurement of Raw Materials and Parts
(1) Ratio of labor/material costs to production costs
(2) Local production cost in comparison with production cost in Japan, which is
taken as 100
(3) Procurement sources for raw materials and parts (by country/region)
(4) Procurement sources of major countries (comparison with the 2012 survey
and 2017 survey)
(5) Procurement sources for raw materials and parts (by industry)
(6) Local procurement sources for raw materials and parts
(by country/region/company size)
(7) Future raw materials/parts procurement policy; country(ies)/region(s)
considered an important future source of procurement
(8) Reasons for raising future procurement rate for raw materials/parts
6. Exports/Imports
(1) Proportion of export sales to the total sales (by country/region)
(2) Breakdown of export destinations (by country/region)
(3)-(4) Most promising export market for business/products over the next 1 to 3 years
(by country/region)
(5)-(6) Utilization of FTAs/EPAs (total, by industry, by company size, and by
country/region), proportions of firms utilizing FTAs/EPAs in 2016 and 2017
(by export/import), and trends in FTA/EPA utilization by Japanese-affiliated
firms in ASEAN (by country/region)
(7)-(8) The average days required from the arrival of freight at the seaport or airport to
the completion of import clearance (by country/region and industry)
7. Challenges in local market development
(1)-(3) Target segments in local market development (for corporate customers)
(by size of corporate, country/region and industry)
(4)-(5) Target segments in local market development (for individual customers)
(by size of corporate and country/region)
(6)-(7) Current competitors (total and by country/region)
(8) Competitive edge in products/services (top 10)
(9) Products/services preferred by local consumers
(by country/region and industry)
(10) Balance between price and quality for local consumers (by country/region)
(11) Effective advertising methods (Total, by media)
(12)-(13) Troubles experienced in expanding business in the local market (top 10, by
country/region)
8. Wages
(1) Year-on-year wage increase rate (by country/region)
(2) Year-on-year wage increase rate (China and major countries)
(3) Base salary (monthly) (by job type and country/region)
(4) Annual salary (by job type and country/region)
(5) Bonuses (by job type and country/region)
Contents
Copyright © 2017 JETRO. All rights reserved. Reproduction without permission is prohibited.
Survey Summary (1)
3
To understand the current business activities of
Japanese-affiliated companies operating in Asia and
Oceania and to disseminate those findings widely.
Purpose of Survey
Japanese-affiliated companies (with direct and indirect
Japanese investment of 10% or greater) operating in a
total of 20 countries/regions in northeast Asia (5),
ASEAN countries (9), southwest Asia (4), and Oceania
(2).
Surveyed Countries/Regions
October 10 to November 10, 2017
Survey Period
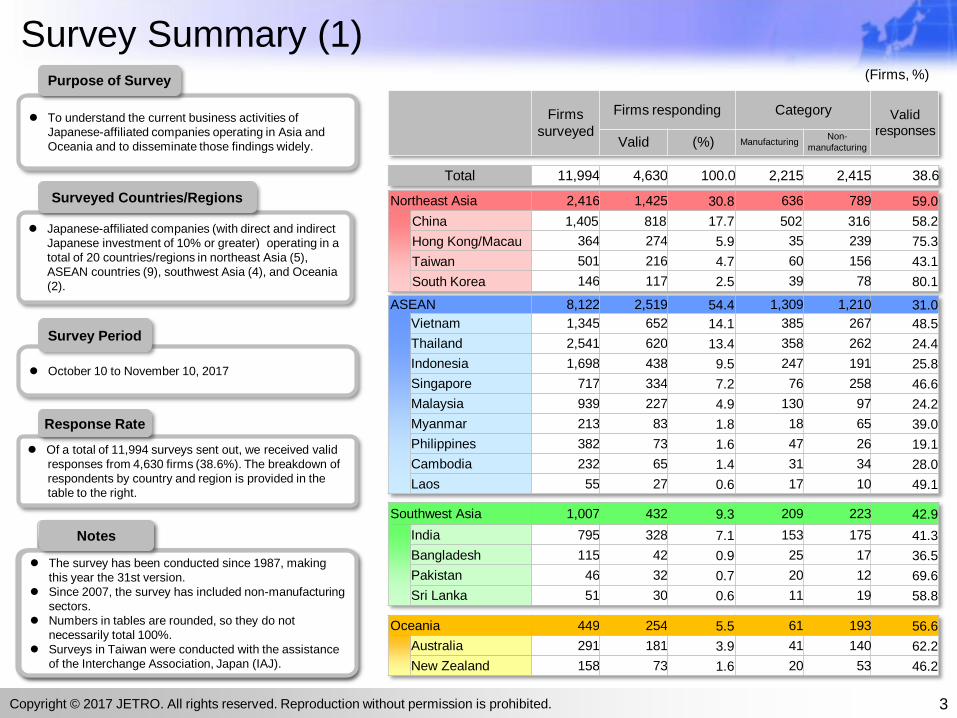
Of a total of 11,994 surveys sent out, we received valid
responses from 4,630 firms (38.6%). The breakdown of
respondents by country and region is provided in the
table to the right.
Response Rate
調査は1987年より実施し, 本年度は第26回目。2007年度調査よりNon-manufacturingも調査対象に追加。図表の数値は四捨五入しているため, 合計が必ずしも100%
とはならない。Taiwanの調査については, 公益財団法人交流協会の協力を得て実施した。
備考
The survey has been conducted since 1987, making
this year the 31st version.
Since 2007, the survey has included non-manufacturing
sectors.
Numbers in tables are rounded, so they do not
necessarily total 100%.
Surveys in Taiwan were conducted with the assistance
of the Interchange Association, Japan (IAJ).
Notes
Firms
surveyed
Firms responding Category Valid
responsesValid (%) Manufacturing
Non-
manufacturing
(Firms, %)
Total 11,994 4,630 100.0 2,215 2,415 38.6
Northeast Asia 2,416 1,425 30.8 636 789 59.0
China 1,405 818 17.7 502 316 58.2
Hong Kong/Macau 364 274 5.9 35 239 75.3
Taiwan 501 216 4.7 60 156 43.1
South Korea 146 117 2.5 39 78 80.1
ASEAN 8,122 2,519 54.4 1,309 1,210 31.0
Vietnam 1,345 652 14.1 385 267 48.5
Thailand 2,541 620 13.4 358 262 24.4
Indonesia 1,698 438 9.5 247 191 25.8
Singapore 717 334 7.2 76 258 46.6
Malaysia 939 227 4.9 130 97 24.2
Myanmar 213 83 1.8 18 65 39.0
Philippines 382 73 1.6 47 26 19.1
Cambodia 232 65 1.4 31 34 28.0
Laos 55 27 0.6 17 10 49.1
Oceania 449 254 5.5 61 193 56.6
Australia 291 181 3.9 41 140 62.2
New Zealand 158 73 1.6 20 53 46.2
Southwest Asia 1,007 432 9.3 209 223 42.9
India 795 328 7.1 153 175 41.3
Bangladesh 115 42 0.9 25 17 36.5
Pakistan 46 32 0.7 20 12 69.6
Sri Lanka 51 30 0.6 11 19 58.8
Copyright © 2017 JETRO. All rights reserved. Reproduction without permission is prohibited.

Survey Summary (2)
Note: Industry category details are as follows:1. Food: Food/Processed food, agricultural or fishery
products2. Textiles: Textiles (Spinning/Woven fabrics/Chemical
fibers), Textile apparel/Textile products3. Wood/Pulp: Lumber/Wood products, Paper/Pulp4. Chemical/Pharmaceutical: Chemicals and allied
products/Petroleum products, Medicines, Plastic products5. Rubber/Leather: Rubber products, Leather
tanning/Leather products/Fur skins6. Iron/Nonferrous metals/Metals: Iron and steel (including
cast and wrought products), Nonferrous metals, Fabricated metal products (including plated products)
7. General machinery: General-purpose machinery/Production machinery (including molds and machine tools), Office machines
8. Electric machinery: Electrical machinery/Electronic devices, Information and communication electronics equipment
9. Motor vehicles/Motorcycles: Motor vehicles and motorcycles, Motor vehicle and motorcycle parts and accessories, Transportation equipment (Railroad vehicles/Ship/Aircraft/ Industrial trucks), Transportation equipment parts (Railroad vehicles/Ship/Aircraft/Industrial trucks)
10. Precision machinery: Precision instruments (Analytical instruments/Optical instruments and apparatus, etc.), Medical equipment
11. Wholesale/Retail: Wholesale and retail trade, Trading, and sales companies
12. Finance/Insurance: Banks, Non-banks (Insurance/Securities brokerage/Credit card/Leasing, etc.)
13. Communications/Software: Communications/Software14. Transport activities/Warehouse: Transport
activities/Warehouse15. Travel/Amusement: Accommodations/Travel, Amusement16. Restaurant: Restaurant
62.837.2
LargeSME
(%)
4
By industry category (Firms, %)
Valid (%)
Non-manufacturing Total 2,415 52.2
Wholesale/Retail 1,066 23.0
Transport 259 5.6
Construction 175 3.8
Finance/Insurance 174 3.8
Communications/Software 126 2.7
Business services 117 2.5
Travel/Amusement 66 1.4
Restaurant 34 0.7
Other non-manufacturing
industries 398 8.6
Manufacturing Total 2,215 47.8
Motor vehicles/Motorcycles 427 9.2
Iron/Nonferrous metals/
Metals357 7.7
Electric machinery 343 7.4
Chemical/Pharmaceutical 287 6.2
Food 154 3.3
Textiles 113 2.4
General machinery 95 2.1
Precision machinery 67 1.4
Rubber/Leather 53 1.1
Wood/Pulp 37 0.8
Other manufacturing
industries 282 6.1
Note: Wholesale/Retail includes the sales bases of manufacturing firms.
Large vs. Small and Medium-
sized Enterprises (SME)
Note: The definition of “small and medium-sized enterprises” here is based
on the definition provided in Japan’s Small and Medium-sized
Enterprise Basic Act.
Firms by Country/Region (Firms)
Large SME
Total 2,907 1,723
Northeast Asia 980 445
China 528 290
Hong Kong/Macau 184 90
Taiwan 175 41
South Korea 93 24
ASEAN 1,386 1,133
Vietnam 304 348
Thailand 262 358
Indonesia 279 159
Singapore 243 91
Malaysia 152 75
Myanmar 60 23
Philippines 43 30
Cambodia 32 33
Laos 11 16
Southwest Asia 331 101
India 268 60
Bangladesh 20 22
Pakistan 27 5
Sri Lanka 16 4
Oceania 210 44
Australia 158 23
New Zealand 52 21
Copyright © 2017 JETRO. All rights reserved. Reproduction without permission is prohibited.

55
Year of establishment of responding firms (by country/region)
161 125 111 139 343
498 494
673
756
1,200 121
-19701971-1975
1976-1980
1981-1985
1986-1990
1991-1995
1996-2000
2001-2005
2006-2010
2011-2015
2016-
1 1 7 4 15
124 90 267
158 145
6
-19701971-1975
1976-1980
1981-1985
1986-1990
1991-1995
1996-2000
2001-2005
2006-2010
2011-2015
2016-
Total (n = 4,630 including 9 firms
uncertain about establishment year) China (n = 818)
30
25
14 21
43 44
24 21 16
34
2
-19701971-1975
1976-1980
1981-1985
1986-1990
1991-1995
1996-2000
2001-2005
2006-2010
2011-2015
2016-
Hong Kong/Macau (n = 274)
3 7
4 2
10
13 18 18
13
25 4
-19701971-1975
1976-1980
1981-1985
1986-1990
1991-1995
1996-2000
2001-2005
2006-2010
2011-2015
2016-
South Korea (n = 117)
20
11 10 14
36
26
24 28
17
26 4
-19701971-1975
1976-1980
1981-1985
1986-1990
1991-1995
1996-2000
2001-2005
2006-2010
2011-2015
2016-
Taiwan (n = 216)
0 0 0 0 0 26
57 87
194 252
36
-19701971-1975
1976-1980
1981-1985
1986-1990
1991-1995
1996-2000
2001-2005
2006-2010
2011-2015
2016-
Vietnam (n = 652)
29 12 3
18
81
56 79
101 100 132
2
-19701971-1975
1976-1980
1981-1985
1986-1990
1991-1995
1996-2000
2001-2005
2006-2010
2011-2015
2016-
Thailand (n = 620 including 7 firms uncertain
about establishment year)
10 24
6 9 25
60 56 49 33 157
9
-19701971-1975
1976-1980
1981-1985
1986-1990
1991-1995
1996-2000
2001-2005
2006-2010
2011-2015
2016-
Indonesia (n = 438)
10 16
34 26
37
32 29 27 38
77 8
-19701971-1975
1976-1980
1981-1985
1986-1990
1991-1995
1996-2000
2001-2005
2006-2010
2011-2015
2016-
Singapore (n = 334)
10 10 5
14 43 49
24
13 15 36 7
-19701971-1975
1976-1980
1981-1985
1986-1990
1991-1995
1996-2000
2001-2005
2006-2010
2011-2015
2016-
Malaysia (n = 227 including 1 firm uncertain
about establishment year)
0 0 0 0 0 3 8
0 1
56 14
-19701971-1975
1976-1980
1981-1985
1986-1990
1991-1995
1996-2000
2001-2005
2006-2010
2011-2015
2016-
3 2 2 1
9
18 18 6 7 6
1
-19701971-1975
1976-1980
1981-1985
1986-1990
1991-1995
1996-2000
2001-2005
2006-2010
2011-2015
2016-
Philippines (n = 73)
0 0 0 0 0 2 1 1 9
46 6
-19701971-1975
1976-1980
1981-1985
1986-1990
1991-1995
1996-2000
2001-2005
2006-2010
2011-2015
2016-
Cambodia (n = 65)
0 0 0 0 1 0 1 1 4
19
1
-19701971-1975
1976-1980
1981-1985
1986-1990
1991-1995
1996-2000
2001-2005
2006-2010
2011-2015
2016-
Laos (n =27)
4 0 1 6 1 8
33 31 108 125
11
-19701971-1975
1976-1980
1981-1985
1986-1990
1991-1995
1996-2000
2001-2005
2006-2010
2011-2015
2016-
1 1 1 0 1 1 2 0 11
22
2
-19701971-1975
1976-1980
1981-1985
1986-1990
1991-1995
1996-2000
2001-2005
2006-2010
2011-2015
2016-
India (n = 328) Bangladesh (n = 42)
0 1 1 1 1
4
4 1
4 9
4
-19701971-1975
1976-1980
1981-1985
1986-1990
1991-1995
1996-2000
2001-2005
2006-2010
2011-2015
2016-
27
12 19 18
25 19 19
11
15 16 0
-19701971-1975
1976-1980
1981-1985
1986-1990
1991-1995
1996-2000
2001-2005
2006-2010
2011-2015
2016-
8 3 3 3 11
9
5 11
9
9
2
-19701971-1975
1976-1980
1981-1985
1986-1990
1991-1995
1996-2000
2001-2005
2006-2010
2011-2015
2016-
New Zealand (n = 73) Sri Lanka (n = 30) Australia (n = 181)
5 0
1 2
4 4
2
0
4
8 2
-19701971-1975
1976-1980
1981-1985
1986-1990
1991-1995
1996-2000
2001-2005
2006-2010
2011-2015
2016-
Pakistan (n = 32)
Myanmar (n = 83 including 1 firm uncertain
about establishment year)
Copyright © 2017 JETRO. All rights reserved. Reproduction without permission is prohibited.
Survey Summary (3)

Key Points (1)
Results of JETRO’s 2017 Survey on Business Conditions of
Japanese Companies in Asia and Oceania
Business confidence improving, intention to expand business recovering in China
1. Companies expecting surplus increased, while those expecting deficit decreased (Refer to page 8.) Companies expecting operating profits for 2017 to be a surplus accounted for 67.4%, a 4.6-percentage-point increase from the 2016 survey
(62.8%). Those expecting a deficit came to 18.3%, a 3.5-percentage-point decrease from the 2016 survey (21.8%).
Looking at the rate of companies expecting a surplus by country and region, South Korea (82.1%) and Taiwan (81.7%) marked the highest,
followed by the Philippines, Australia, and Malaysia. Meanwhile, the rate was below 40% in Sri Lanka (31.0%), Myanmar (33.8%), and
Cambodia (35.4%). In these countries, many companies have a short business history.
2. Improved business confidence in almost all countries, mainly in Southwest Asia (Refer to pages 13, 14, and 17.)
Over 40% of the companies expect their operating profits to improve (from the previous year) for 2018, as they did for 2017. Companies
predicting a downturn for 2018 came to 9.9%, a decrease of 9.6 percentage points from the outlook for 2017 (19.5%).
The diffusion index (DI) in 2018, which is the proportion of businesses reporting increased operating profits minus those reporting
decreased operating profits compared to the previous year, marked 38.2 points, an 11.5-point increase compared with 2017. Among
reasons for improvement, “Sales increase in local markets" was the most-frequently cited, followed by “Improvement of production
efficiency” and “Sales increase due to export expansion.”
Looking at the DIs for 2017 and 2018 by country and region, business confidence improved in all countries, except Laos and Cambodia, of
which the DI was the same. In particular, the DI significantly improved in four countries in Southwest Asia (Bangladesh, India, Sri Lanka,
and Pakistan), as well as in Vietnam and Laos, where the DI exceeded 50 points.
3. Intention to expand business being strong in Southeast/Southwest Asia, recovered in China (Refer to pages 18 and 20.) Among respondents, 53.7% expect to expand business in the next one or two years, which is a 1.5-percentage-point increase from 2016
(52.2%). Looking at the results by country and region, companies answering with “Expansion" significantly increased to 48.3% (up 8.2
percentage points) in China, while the proportion slightly increased to 55.7% in Southeast Asia (up 0.3 percentage points).
Comparing the rate of “Expansion” between Southeast Asia and China, Southeast Asia has consistently come out on top since 2012, when
China showed a sudden decline. The gap increased to 16.2 percentage points in 2015, but decreased to 7.4 percentage points in 2017.
Companies in Pakistan (81.3%), Myanmar (70.7%), India (69.6%), and Vietnam (69.5%) are more willing to expand their businesses.
6Copyright © 2017 JETRO. All rights reserved. Reproduction without permission is prohibited.

Key Points (2) 4. Wage increase being the biggest operational issue, but with the wage increase rate basically decreasing from the
previous year (Refer to pages 30, 31, 71, and 72.)
Among operational issues, “Wage increases” was the most commonly cited at 66.7%, up 1.4 percentage points from the 2016 survey.
By country and region, Cambodia (82.8%) ranked the first, overtaking Indonesia (80.8%), and China (75.3%), etc., followed by Vietnam
(75.2%) and India (72.1%).
Regarding the average rate of increase in wages for all industries on a year-on-year basis for 2018, the rate was higher in Pakistan (9.9%),
India (9.5%), Bangladesh (9.1%), and Myanmar (8.6%). These are the same four countries that marked the highest in the 2016 survey,
although Bangladesh overtook Myanmar this year.
The wage increase rate generally decreased from the 2016 survey. In China, the rate has been slowing down by single digits since 2013
and is predicted to decline to 5.9% in 2018.
5. Manufacturing: Local procurement rate increased in Southeast Asia, but still much lower than that in China (Refer to
pages 42, 44, 45, 46, and 48.)
Material costs accounted for approximately 60% of local production.
When asked about how they planned to reduced material cost, 72.8% of the companies answered with “Raising the local procurement.”
Looking at the results by country and region, the local procurement rate was higher in New Zealand (67.9%) and China (67.3%). In
particular, the rate reached 71.3% in China’s Motor vehicles/Motorcycles industry.
Looking at major countries, the local procurement rate increased from 2012 in Thailand, India, Indonesia, Vietnam, and the Ph ilippines.
However, the rate needs to be further increased in these countries because the rate is still lower than that of China, with an over-10-
percentage-point gap.
6. Non-manufacturing: Shifting of the target of future market development to “Local companies" (Refer to pages 58, 66,
and 68.)
Regarding initiatives for local market development by non-manufacturing companies, it is expected that a higher proportion of companies
will target “Local companies” (74.9%) for sales to corporate customers than “Local Japanese-affiliated companies” (49.4%).
The proportion of companies that selected “Products/services which are customized for local market (design, packaging or taste)” as
products/services preferred by local customers was 8.8 percentage points higher than that of companies that selected “Products/services for
Japanese market (which you also sell in Japan).” By country and region, “Customized for local market” was more frequently selected in
Australia and India, while “Products/services for Japanese market” was selected by a larger proportion of respondents in Taiwan and Hong
Kong & Macau.
A largest proportion of companies selected “SNS” as an effective advertising medium for market development. In particular, the proportion
exceeded 60% in Cambodia, Myanmar, Vietnam, and New Zealand. Among SNS, Facebook accounted for 94.3%, followed by Instagram
(37.3%) and Twitter (17.9%).
7Copyright © 2017 JETRO. All rights reserved. Reproduction without permission is prohibited.

1. Operating Profit Forecast (1)
8
A total of 67.4% of the firms expect operating “Profit” for 2017, up 4.6 percentage points (pp) from 62.8% in 2016; in contrast, 18.3% of the firms
expect operating “Loss,” down 3.5 pp from 21.8% in 2016.
By country/region, the proportion of firms expecting operating profit was the highest in South Korea at 82.1%, followed by Taiwan at 80%. The
proportion exceeded 70% in the Philippines, Australia, Malaysia, Hong Kong & Macau, Pakistan, New Zealand, and China.
A total of 74.3% of the large enterprises expect operating profit, which was higher than 55.8% of the SMEs by 18.5 pp. The proportion of positive
forecasts was higher among large enterprises than SMEs in all the 11 countries/regions with valid responses from more than 30 companies. In
particular, the proportion of profitable firms was higher among large enterprises than SMEs by over 20 pp in Indonesia, Singapore, and India.
67.4
64.6
82.1
81.7
79.5
78.9
73.8
72.0
71.9
71.2
70.3
66.4
66.0
65.1
64.6
61.4
46.3
40.7
35.4
33.8
31.0
14.3
15.5
14.5
9.9
11.0
10.6
10.7
11.1
3.1
17.8
12.4
15.9
18.8
15.5
12.6
14.8
22.0
14.8
16.9
20.0
44.8
18.3
20.0
3.4
8.5
9.6
10.6
15.6
17.0
25.0
11.0
17.3
17.7
15.2
19.4
22.8
23.8
31.7
44.4
47.7
46.3
24.1
Total (n=4,594)
ASEAN (n=2,500)
South Korea (n=117)
Taiwan (n=213)
Philippines (n=73)
Australia (n=180)
Malaysia (n=225)
HK & Macau (n=271)
Pakistan (n=32)
New Zealand (n=73)
China (n=814)
Singapore (n=333)
Thailand (n=612)
Vietnam (n=650)
Indonesia (n=435)
India (n=324)
Bangladesh (n=41)
Laos (n=27)
Cambodia (n=65)
Myanmar (n=80)
Sri Lanka (n=29)
Profit Breakeven Loss
Operating profit forecast for 2017 (by country/region)
0 20 40 60 80 100 (%)
Operating profit forecast for 2017 (by country/region and company size)
74.3
55.8
10.7
20.5
15.1
23.7
Large (n=2,883)
SME (n=1,711)
84.9
68.3
83.7
73.3
78.0
65.3
76.5
58.2
75.2
61.3
75.2
45.9
74.9
56.5
74.0
67.8
71.9
51.7
66.0
40.7
43.8
27.3
8.1
17.1
2.3
23.3
8.7
14.7
13.1
23.0
9.0
18.7
7.6
21.7
11.2
19.3
8.8
15.6
13.6
22.0
14.0
18.6
15.6
18.2
7.0
14.6
14.0
3.3
13.3
20.0
10.4
18.8
15.8
20.1
17.3
32.5
13.9
24.2
17.1
16.7
14.5
26.4
20.0
40.7
40.6
54.6
Large (n=172)
SME (n=41)
Large (n=43)
SME (n=30)
Large (n=150)
SME (n=75)
Large (n=260)
SME (n=352)
Large (n=525)
SME (n=289)
Large (n=278)
SME (n=157)
Large (n=303)
SME (n=347)
Large (n=181)
SME (n=90)
Large (n=242)
SME (n=91)
Large (n=265)
SME (n=59)
Large (n=32)
SME (n=33)
Profit Beakeven Loss
Taiwan
Philippines
Malaysia
Thailand
China
Indonesia
Vietnam
HK & Macau
Singapore
India
Cambodia
Note: Countries/regions for which n for Large/SME 30
Copyright © 2017 JETRO. All rights reserved. Reproduction without permission is prohibited.

1. Operating Profit Forecast (2)
9
In Northeast Asia (excluding China), the proportion of profitable
firms increased from the previous year in all countries/regions.
Among ASEAN 5, the proportion of profitable firms increased in
all countries, except Singapore. The Philippines (79.5%)
marked the highest of the five countries in the proportion of
profitable firms. In Malaysia, the proportion increased to 73.8%,
up 11.0 pp.
The proportion of profitable firms increased from 2016 in China
(70.3%, up 5.9 pp), India (61.4%, up 7.8 pp), and Vietnam
(65.1%, up 2.3 pp).
(%) (%)
(%)
50
60
70
80
90
2008 2009 2010 2011 2012 2013 2014 2015 2016 2017
HK & Macau Taiwan South Korea
50
60
70
80
90
2008 2009 2010 2011 2012 2013 2014 2015 2016 2017
Indonesia Singapore Thailand
Philippines Malaysia
40
50
60
70
80
2008 2009 2010 2011 2012 2013 2014 2015 2016 2017
China India Vietnam
Proportion of profitable firms - 2009 to 2017 (by country/region)
Northeast Asia (Excl. China) ASEAN 5
China, India, Vietnam
Copyright © 2017 JETRO. All rights reserved. Reproduction without permission is prohibited.
67.270.471.373.874.276.078.079.079.279.5
85.488.2
14.19.9
16.414.916.111.29.910.56.49.0
14.68.6
18.819.8
12.311.49.7
12.812.110.5
14.411.5
3.2
Vietnam (n=64)
Indonesia (n=81)
Thailand (n=122)
Singapore (n=141)
New Zealand (n=31)
China (n=125)
India (n=91)
Malaysia (n=38)
HK & Macau (n=125)
Australia (n=78)
South Korea (n=48)
Taiwan (n=93)
51.256.558.662.5
75.0
4.926.1
14.912.5
6.3
43.917.4
26.425.0
18.8
Indonesia (n=41)
Thailand (n=69)Vietnam (n=87)
China (n=56)
Malaysia (n=32)
59.062.3
68.078.983.0
16.414.5
12.07.7
7.1
24.623.220.0
13.59.8
India (n=61)
Indonesia (n=69)
Thailand (n=75)
Vietnam (n=52)
China (n=112)68.0
75.3
73.1
72.1
70.0
68.7
66.7
63.2
62.3
60.4
57.7
67.7
66.8
75.9
71.8
71.2
65.6
65.5
62.0
44.1
41.1
57.1
13.4
10.8
11.5
10.8
14.4
13.4
13.9
20.0
13.9
16.2
17.1
12.8
15.3
11.7
13.5
16.7
16.8
24.1
16.5
20.6
21.1
18.5
18.7
13.9
15.4
17.1
15.6
17.9
19.4
16.8
23.8
23.4
25.2
19.5
17.9
12.5
14.7
12.1
17.6
10.3
21.6
35.3
37.7
24.4
Manufacturing total (n=2,203)
Chemical/Pharmaceutical (n=287)
Rubber/Leather (n=52)
Motor vehicles/Motorcycles (n=426)
Electric machinery (n=340)
Precision machinery (n=67)
Wood/Pulp (n=36)
General machinery (n=95)
Iron/Nonferrous metals/Metals (n=353)
Food (n=154)
Textiles (n=111)
Miscellaneous manufacturing (n=282)
Non-manufacturing total (n=2,391)
Wholesale/Retail (n=1,056)
Finance/Insurance (n=170)
Travel/Amusement (n=66)
Communications/Software (n=125)
Business services (n=116)
Transport (n=255)
Restaurant (n=34)
Construction (n=175)
Miscellaneous non-manufacturing (n=394)
Profit Breakeven Loss
1. Operating Profit Forecast (3)
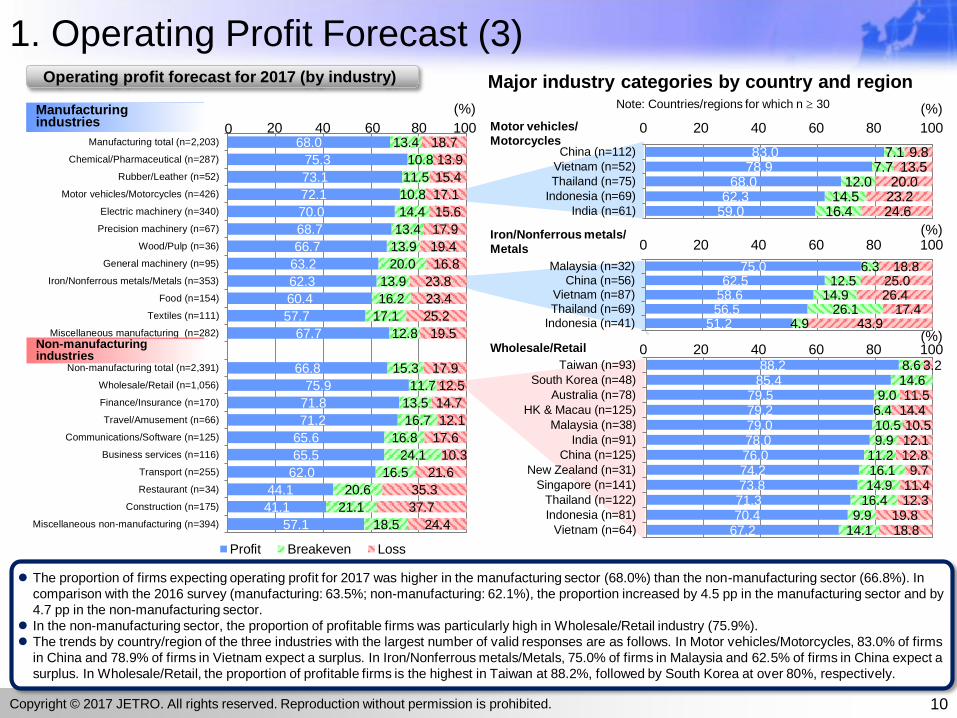
The proportion of firms expecting operating profit for 2017 was higher in the manufacturing sector (68.0%) than the non-manufacturing sector (66.8%). In
comparison with the 2016 survey (manufacturing: 63.5%; non-manufacturing: 62.1%), the proportion increased by 4.5 pp in the manufacturing sector and by
4.7 pp in the non-manufacturing sector.
In the non-manufacturing sector, the proportion of profitable firms was particularly high in Wholesale/Retail industry (75.9%).
The trends by country/region of the three industries with the largest number of valid responses are as follows. In Motor vehicles/Motorcycles, 83.0% of firms
in China and 78.9% of firms in Vietnam expect a surplus. In Iron/Nonferrous metals/Metals, 75.0% of firms in Malaysia and 62.5% of firms in China expect a
surplus. In Wholesale/Retail, the proportion of profitable firms is the highest in Taiwan at 88.2%, followed by South Korea at over 80%, respectively.
0 20 40 60 80 100
(%)
0 20 40 60 80 100
(%)
0 20 40 60 80 100(%)
0 20 40 60 80 100(%)
10
Operating profit forecast for 2017 (by industry)
Non-manufacturing industries
Manufacturing industries
Major industry categories by country and regionNote: Countries/regions for which n 30
Motor vehicles/
Motorcycles
Iron/Nonferrous metals/
Metals
Wholesale/Retail
Copyright © 2017 JETRO. All rights reserved. Reproduction without permission is prohibited.

1. Operating Profit Forecast (4)
11
The proportion of positive operating profit (forecast) was 67.6% among domestic sales-oriented firms (less than a 50% export ratio in the operating
country/region), while the proportion was 68.4% among export-oriented firms (50% or larger export ratio in the operating country/region). The proportion
increased in both domestic sales-oriented firms and export-oriented firms from the previous year (domestic sales-oriented firms: 62.4%; export-oriented
firms: 65.1%).
In Bangladesh, India and Singapore, the proportion was higher among export-oriented firms than domestic sales-oriented firms by over 10 pp. On the other
hand, of ASEAN countries, Malaysia, Vietnam and the Philippines were the countries in which the proportion was higher among domestic sales-oriented
firms than export-oriented firms.
In South Korea, Taiwan, the Philippines and Australia, the proportion was high among both domestic sales-oriented firms and export-oriented firms.
67.6
64.8
83.3
81.8
80.0
77.6
76.0
72.7
71.9
70.1
69.8
68.5
67.0
64.9
60.0
58.8
37.5
33.3
30.3
12.9
13.7
11.9
10.1
12.0
10.4
4.2
10.2
11.0
14.0
15.6
12.6
12.5
14.9
16.9
20.8
26.7
15.2
19.5
21.6
4.8
8.2
8.0
12.0
19.8
27.3
18.0
18.9
16.3
15.9
20.4
22.7
25.1
24.3
41.7
40.0
54.6
Total (n=2,651)
ASEAN (n=1,308)
South Korea (n=84)
Taiwan (n=159)
Philippines (n=25)
Australia (n=125)
Malaysia (n=96)
Pakistan (n=22)
HK & Macau (n=128)
China (n=498)
New Zealand (n=43)
Thailand (n=378)
Vietnam (n=270)
Indonesia (n=313)
India (n=255)
Singapore (n=136)
Myanmar (n=48)
Bangladesh (n=15)
Cambodia (n=33)
Profit Breakeven LossNote: Countries/regions for which n 15
20 40 60 80 1000
(%)
68.4
66.2
87.0
82.6
79.0
79.0
74.3
73.0
72.0
71.8
71.6
71.0
68.1
64.8
64.5
50.0
43.8
39.3
15.0
15.7
13.0
10.9
10.5
7.9
11.4
13.5
24.0
14.7
17.9
13.4
15.6
12.5
16.7
20.8
12.5
21.4
16.6
18.2
6.5
10.5
13.2
14.3
13.5
4.0
13.5
10.5
15.6
16.3
22.7
18.9
29.2
43.8
39.3
Total (n=1,466)
ASEAN (n=920)
South Korea (n=23)
Australia (n=46)
Taiwan (n=38)
Philippines (n=38)
HK & Macau (n=105)
India (n=37)
New Zealand (n=25)
Singapore (n=163)
Malaysia (n=95)
China (n=231)
Thailand (n=160)
Indonesia (n=88)
Vietnam (n=318)
Bangladesh (n=24)
Laos (n=16)
Cambodia (n=28)
Profit Breakeven Loss
20 40 60 80 1000
(%)
Operating profit forecast (domestic sales-oriented
firms with export ratio < 50%) (2017, by country/region) Operating profit forecast (export-oriented firms
with export ratio ≥ 50%) (2017, by country/region)
Note: Countries/regions for which n 15
Copyright © 2017 JETRO. All rights reserved. Reproduction without permission is prohibited.

1. Operating Profit Forecast (5)
12
77.4 85.5 83.5 77.5 78.8 74.9 75.6 76.7 69.2 47.8
15.7 8.1 7.3 10.9 12.7 12.8 14.3 11.8 16.9
16.1
6.9 6.5 9.2 11.6 8.5 12.4 10.2 11.5 13.9 36.1
In or before 1970(n=159)
1971-75(n=124)
1976-80(n=109)
1981-85(n=138)
1986-90(n=340)
1990-95(n=494)
1996-2000(n=491)
2001-05(n=670)
2006-10(n=750)
In or after 2011(n=1,310)
Profit Breakeven Loss
0
20
40
60
80
100
(%)
76.8 70.4 73.1 75.0 65.046.3
13.4 16.7 18.0 18.022.7
19.4
9.9 13.0 9.0 7.0 12.434.3
In or before1990
(n=142)
1990-95(n=54)
1996-2000(n=78)
2001-05(n=100)
2006-10(n=97)
In or after2011
(n=134)
89.3 75.0 70.8 77.0 66.2 55.0
7.1 8.9 13.5 10.9 15.3
15.2
3.6 16.1 15.7 12.1 18.5 29.8
In or before1990
(n=28)
1990-95(n=124)
1996-2000(n=89)
2001-05(n=265)
2006-10(n=157)
In or after2011
(n=151)
China (n=813)
Thailand (n=620)
80.7 71.3 77.750.2
13.311.5
16.6
16.7
6.0 17.2 5.733.1
In or before2000
(n=83)
2001-05(n=87)
2006-10(n=193)
In or after 2011(n=287)
Vietnam (n=650)
0
20
40
60
80
100
(%)
0
20
40
60
80
100
(%)
0
20
40
60
80
100
(%)
74.5 77.4 66.748.5
15.7 12.915.7
14.2
9.8 9.7 17.637.3
In or before2000
(n=51)
2001-05(n=31)
2006-10(n=108)
In or after 2011(n=134)
India (n=328)
Looking at the operating
profit forecast for 2017
by year of
establishment, over
70% of firms that were
established before 2005
expected a surplus.
On the other hand,
among firms that were
established in or after
2011, less than half
(47.8%) expected a
surplus.
0
20
40
60
80
100
(%)
Total (n=4,630)
Operating profit forecast for 2017 (by year of establishment)
Copyright © 2017 JETRO. All rights reserved. Reproduction without permission is prohibited.

46.2
46.1
62.5
59.3
55.4
53.9
53.9
50.0
48.8
47.4
46.6
45.0
43.7
43.2
42.7
42.0
38.5
37.8
37.0
36.8
25.9
34.3
33.6
25.0
33.3
32.8
31.0
33.9
31.1
39.0
32.3
32.9
34.0
34.0
39.5
33.3
32.3
41.9
36.9
48.0
44.4
51.9
19.5
20.3
12.5
7.4
11.8
15.2
12.3
18.9
12.2
20.3
20.6
21.0
22.3
17.3
23.9
25.7
19.6
25.2
15.1
18.8
22.2
Total (n=4,592)
ASEAN (n=2,502)
Pakistan (n=32)
Laos (n=27)
India (n=323)
Vietnam (n=646)
Cambodia (n=65)
Australia (n=180)
Bangladesh (n=41)
China (n=814)
Philippines (n=73)
Indonesia (n=433)
Thailand (n=618)
Myanmar (n=81)
Taiwan (n=213)
Malaysia (n=226)
HK & Macau (n=270)
Singapore (n=333)
New Zealand (n=73)
South Korea (n=117)
Sri Lanka (n=27)
Increase Remain the same Decrease
1. Operating Profit Forecast (6)
13
For 2017, a total of 46.2% of the firms expect an operating profit “Increase” over 2016, up 3.3 pp from 42.9% in the 2016 survey; the proportion of
firms expecting an operating profit “Decrease” was 19.5%, down 4.6 pp from the 2016 survey (24.1%).
A total of 48.1% of the firms expect an “Increase” for 2018, up 1.0 pp from the 2017 forecast (47.1%) in the 2016 survey. Meanwhile, the
proportion of firms expecting an operating profit “Decrease” was 9.9%, down 1.2 pp from the 2017 forecast (11.1%) in the 2016 survey.
In ASEAN, the proportion of firms expecting an “Increase" for 2017 forecast was 46.1%, which is the same level as the total, and that for 2018
forecast was 49.4%, both exceeding the overall average.
48.1
49.4
68.8
68.3
64.7
59.3
58.6
56.7
53.9
52.0
51.3
48.0
45.1
44.7
44.4
44.0
43.0
41.9
38.3
36.4
33.3
42.0
41.0
15.6
29.3
29.1
33.3
35.3
40.0
33.9
39.3
40.0
42.5
43.5
42.5
50.0
42.2
46.8
44.9
50.0
52.2
54.7
9.9
9.6
15.6
2.4
6.2
7.4
6.0
3.3
12.3
8.8
8.8
9.6
11.3
12.9
5.6
13.8
10.2
13.3
11.7
11.4
12.0
Total (n=4,584)
ASEAN (n=2,493)
Pakistan (n=32)
Bangladesh (n=41)
India (n=323)
Laos (n=27)
Vietnam (n=648)
Sri Lanka (n=30)
Cambodia (n=65)
Indonesia (n=433)
Myanmar (n=80)
Philippines (n=73)
China (n=811)
Australia (n=179)
New Zealand (n=72)
Malaysia (n=218)
Thailand (n=617)
Singapore (n=332)
Taiwan (n=214)
HK & Macau (n=272)
South Korea (n=117)
Increase Remain the same Decrease
0 20 40 60 80 100(%)
0 20 40 60 80 100(%)
Operating profit forecast for 2017
(by county/region, comparison with 2016)
Operating profit forecast for 2018
(by county/region, comparison with 2017)
Copyright © 2017 JETRO. All rights reserved. Reproduction without permission is prohibited.
1. Operating Profit Forecast (7)
14
26.7
25.8
51.9
50.0
43.7
41.5
38.7
36.6
31.1
27.2
26.0
25.9
24.0
21.9
21.4
18.9
18.8
18.0
16.4
12.6
3.7
0 20 40 60
Total (n=4,592)
ASEAN (n=2,502)
Laos (n=27)
Pakistan (n=32)
India (n=323)
Cambodia (n=65)
Vietnam (n=646)
Bangladesh (n=41)
Australia (n=180)
China (n=814)
Philippines (n=73)
Myanmar (n=81)
Indonesia (n=433)
New Zealand (n=73)
Thailand (n=618)
HK & Macau (n=270)
Taiwan (n=213)
South Korea (n=117)
Malaysia (n=226)
Singapore (n=333)
Sri Lanka (n=27)
38.2
39.9
65.9
58.5
53.3
53.1
52.6
51.9
43.2
42.5
41.5
38.9
38.4
33.8
32.7
31.8
30.3
28.6
26.6
25.0
21.4
0 20 40 60 80
Total (n=4,584)
ASEAN (n=2,493)
Bangladesh (n=41)
India (n=323)
Sri Lanka (n=30)
Pakistan (n=32)
Vietnam (n=648)
Laos (n=27)
Indonesia (n=433)
Myanmar (n=80)
Cambodia (n=65)
New Zealand (n=72)
Philippines (n=73)
China (n=811)
Thailand (n=617)
Australia (n=179)
Malaysia (n=218)
Singapore (n=332)
Taiwan (n=214)
HK & Macau (n=272)
South Korea (n=117)
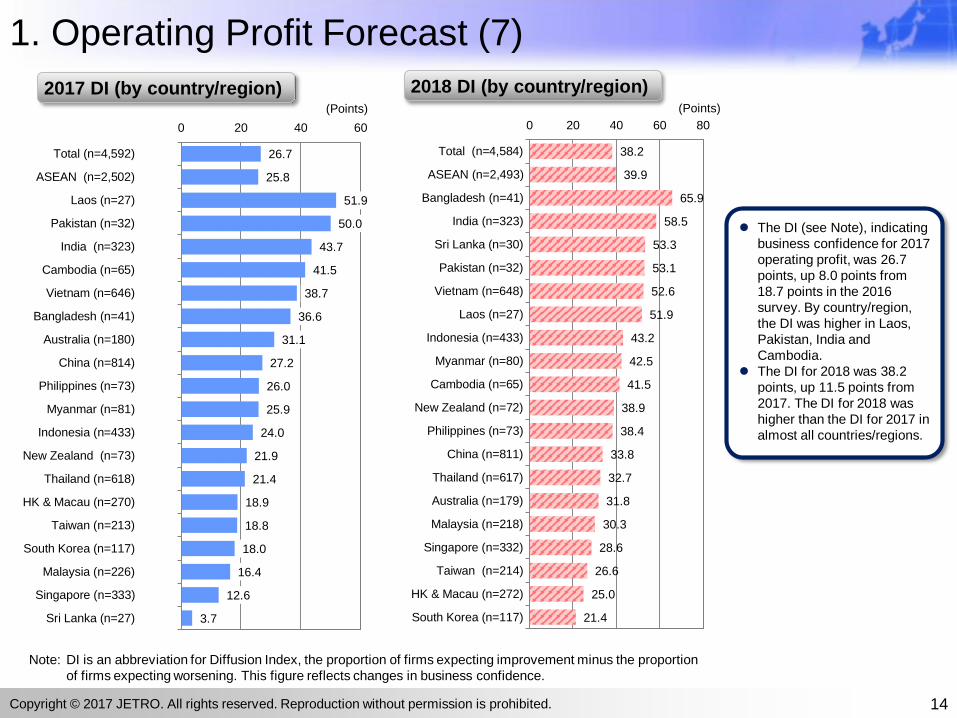
The DI (see Note), indicating
business confidence for 2017
operating profit, was 26.7
points, up 8.0 points from
18.7 points in the 2016
survey. By country/region,
the DI was higher in Laos,
Pakistan, India and
Cambodia.
The DI for 2018 was 38.2
points, up 11.5 points from
2017. The DI for 2018 was
higher than the DI for 2017 in
almost all countries/regions.
2017 DI (by country/region) 2018 DI (by country/region) (Points) (Points)
Note: DI is an abbreviation for Diffusion Index, the proportion of firms expecting improvement minus the proportion
of firms expecting worsening. This figure reflects changes in business confidence.
Copyright © 2017 JETRO. All rights reserved. Reproduction without permission is prohibited.

49.6
56.9
53.8
53.6
52.8
52.3
50.9
46.6
46.3
46.1
40.5
46.8
55.9
54.0
53.9
50.0
48.6
45.7
44.4
40.0
40.0
39.2
35.5
35.3
37.6
36.0
37.9
45.5
49.3
39.0
51.4
43.8
41.2
42.7
41.9
43.8
42.0
44.5
45.0
42.9
10.5
3.9
10.8
11.1
9.6
11.7
11.2
7.9
4.5
14.9
8.1
9.4
2.9
3.2
4.3
6.3
9.4
9.8
10.5
17.1
Manufacturing total (n=2,195)
Rubber/Leather (n=51)
General machinery (n=93)
Food (n=153)
Iron/Nonferrous metals (n=354)
Textiles (n=111)
Chemical/Pharmaceutical (n=285)
Electric machinery (n=341)
Precision machinery (n=67)
Motor vehicles/Motorcycles (n=423)
Wood/Pulp (n=37)
Non-manufacturing total (n=2,389)
Restaurant (n=34)
Communications/Software (n=124)
Business services (n=117)
Travel/Amusement (n=64)
Transport (n=255)
Wholesale/Retail (n=1,056)
Finance/Insurance (n=171)
Construction (n=175)
Increase Remain the same Decrease
1. Operating Profit Forecast (8)
15
Compared with the 2016 survey, the proportion of firms expecting an operating profit “Increase” for 2017 increased in both the
manufacturing sector (46.6% ⇒ 47.5%) and the non-manufacturing sector (39.1% ⇒ 45.0%).
The proportion of firms expecting an operating profit “Increase” for 2018 increased in both the manufacturing sector (49.6%) and the
non-manufacturing sector (46. 8%).
47.5
55.8
55.3
51.3
51.1
48.7
44.8
43.3
43.0
38.9
38.2
45.0
60.0
48.1
45.5
44.3
43.9
40.6
40.5
31.0
31.7
28.9
26.6
28.7
29.1
27.3
30.1
41.8
39.5
27.8
38.2
36.7
33.0
35.5
37.9
29.8
39.2
43.8
41.3
40.2
20.9
15.4
18.1
20.0
19.8
24.0
25.2
14.9
17.5
33.3
23.6
18.3
7.0
16.4
16.7
25.9
17.0
15.6
18.3
28.7
Manufacturing total (n=2,201)
Rubber/Leather (n=52)
General machinery (n=94)
Motor vehicles/Motorcycles (n=425)
Iron/Nonferrous metals/Metals (n=354)
Food (n=154)
Chemical/Pharmaceutical (n=286)
Precision machinery (n=67)
Electric machinery (n=342)
Wood/Pulp (n=36)
Textiles (n=110)
Non-manufacturing total (n=2,391)
Business services (n=115)
Wholesale/Retail (n=1,060)
Travel/Amusement (n=66)
Transport (n=255)
Finance/Insurance (n=171)
Restaurant (n=32)
Communications/Software (n=126)
Construction (n=174)
Increase Remian the same Decrease
0 20 40 60 80 100
(%) 0 20 40 60 80 100
(%)
Operating profit forecast for 2017
(comparison with 2016, by industry)
Operating profit forecast for 2018
(comparison with 2017, by industry)
Manufacturing industries Manufacturing industries
Non-manufacturing industriesNon-manufacturing industries
Copyright © 2017 JETRO. All rights reserved. Reproduction without permission is prohibited.

68.8
38.2
28.8
14.7
11.7
63.6
38.6
27.9
17.8
17.0
Sales increase in local markets
Improvement of production efficiency(the manufacturing industry only)
Sales increase due to export expansion
Reduction of other expenditures(e.g., administrative/utility/fuel costs)
Reduction of procurement costs
45.8
38.1
24.9
21.4
19.5
51.3
31.3
15.5
27.6
15.9
Sales decrease in local markets
Increase of labor costs
Increase of procurement costs
Sales decrease due to export slowdown
Production costs insufficiently shifted toselling price of goods
1. Operating Profit Forecast (9)
16
South Korea (77.3%)
HK & Macau (62.3%)
Taiwan (60.8%)
Thailand (57.4%)
Australia (52.9%)
Philippines (53.3%)
Indonesia (52.8%)
Malaysia (50.9%)
China (49.7%)
Vietnam (42.3%)
Wholesale/Retail (65.5%)
Communications/Software (63.6%)
Construction (61.2%)
Travel/Amusement (54.6%)
Motor vehicles/Motorcycles (48.2%)
Travel/Amusement (63.6%)
Textiles (61.5%)
Communications/Software (59.1%)
Wood/Pulp (50.0%)
Iron/Nonferrous metals/Metals (48.6%)
■2017 (n=893) 2016 (n=1,105)
India (84.9%)
China (79.1%)
Taiwan (76.9%)
Indonesia (76.4%)
South Korea (74.4%)
Business services (79.7%)
General machinery (76.9%)
Wholesale/Retail (76.5%)
Travel/Amusement (73.3%)
Motor vehicles/Motorcycles (73.2%)
Myanmar (75.0%)
Cambodia (53.3%)
India (47.4%)
China (43.3%)
Philippines (41.7%)
Textiles (57.1%)
Motor vehicles/Motorcycles (44.9%)
Iron/Nonferrous metals/Metals (40.9%)
Food (38.7%)
Electric machinery (35.4%)
■2017 (n=2,110) 2016 (n=1,970) 0 20 40 60 80
(%)
0 20 40 60 80(%)
Reasons for increased operating profits forecast for 2017
(comparison with the reasons for the increase forecast for 2016 cited
in the 2016 survey) (top 5, multiple answers) Response rate by country/region and
industry (top 5)
Country/region Industry category
Note: Countries/regions and industry categories for which n30
Reasons for decreased operating profits forecast for 2017
(comparison with the reasons for the decrease forecast for 2016 cited
in the 2016 survey) (top 5, multiple answers)
Country/region Industry category
Note: Countries/regions and industry categories for which n 10
Copyright © 2017 JETRO. All rights reserved. Reproduction without permission is prohibited.
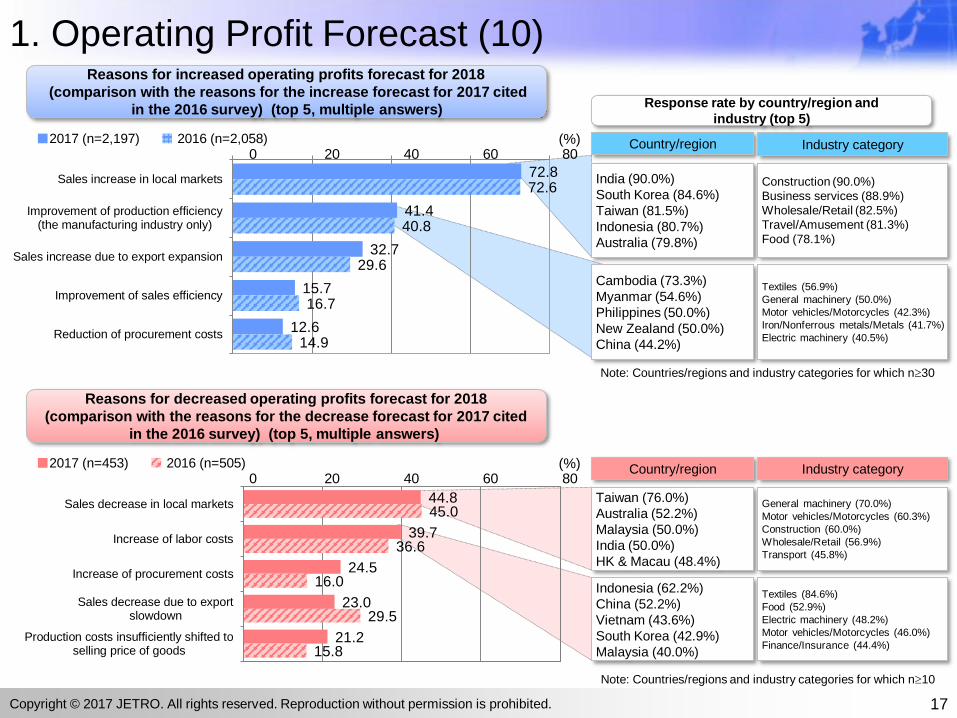
44.8
39.7
24.5
23.0
21.2
45.0
36.6
16.0
29.5
15.8
Sales decrease in local markets
Increase of labor costs
Increase of procurement costs
Sales decrease due to exportslowdown
Production costs insufficiently shifted toselling price of goods
72.8
41.4
32.7
15.7
12.6
72.6
40.8
29.6
16.7
14.9
Sales increase in local markets
Improvement of production efficiency(the manufacturing industry only)
Sales increase due to export expansion
Improvement of sales efficiency
Reduction of procurement costs
1. Operating Profit Forecast (10)
17
Taiwan (76.0%)
Australia (52.2%)
Malaysia (50.0%)
India (50.0%)
HK & Macau (48.4%)
Indonesia (62.2%)
China (52.2%)
Vietnam (43.6%)
South Korea (42.9%)
Malaysia (40.0%)
General machinery (70.0%)
Motor vehicles/Motorcycles (60.3%)
Construction (60.0%)
Wholesale/Retail (56.9%)
Transport (45.8%)
Textiles (84.6%)
Food (52.9%)
Electric machinery (48.2%)
Motor vehicles/Motorcycles (46.0%)
Finance/Insurance (44.4%)
■2017 (n=453) 2016 (n=505)
India (90.0%)
South Korea (84.6%)
Taiwan (81.5%)
Indonesia (80.7%)
Australia (79.8%)
Construction (90.0%)
Business services (88.9%)
Wholesale/Retail (82.5%)
Travel/Amusement (81.3%)
Food (78.1%)
Cambodia (73.3%)
Myanmar (54.6%)
Philippines (50.0%)
New Zealand (50.0%)
China (44.2%)
Textiles (56.9%)
General machinery (50.0%)
Motor vehicles/Motorcycles (42.3%)
Iron/Nonferrous metals/Metals (41.7%)
Electric machinery (40.5%)
■2017 (n=2,197) 2016 (n=2,058) 0 20 40 60 80
(%)
0 20 40 60 80(%)
Reasons for increased operating profits forecast for 2018
(comparison with the reasons for the increase forecast for 2017 cited
in the 2016 survey) (top 5, multiple answers)
Country/region
Response rate by country/region and
industry (top 5)
Industry category
Note: Countries/regions and industry categories for which n30
Reasons for decreased operating profits forecast for 2018
(comparison with the reasons for the decrease forecast for 2017 cited
in the 2016 survey) (top 5, multiple answers)
Country/region Industry category
Note: Countries/regions and industry categories for which n10
Copyright © 2017 JETRO. All rights reserved. Reproduction without permission is prohibited.

2. Future Business Plan (1)
A total of 53.7% of the firms selected “Expansion” as their approach to future business challenges in the next one or two years, up 1.5 pp from 52.2%
in the 2016 survey. In contrast, 4.2% of firms selected “Reduction” or “Transferring to a third country/region or withdrawal from current local markets,”
which is the same level as the 2016 survey (4.2%).
By country/region, Pakistan marked the highest proportion of “Expansion” at 81.3%. In Myanmar, 70.7% of firms selected “Expansion.” In China, 48.3% of the firms selected “Expansion,” up 8.2 pp from the 2016 survey (40.1%).
53.7
81.3
70.7
69.6
69.5
69.1
66.7
63.4
63.3
58.5
51.9
51.4
51.3
48.3
47.5
47.2
46.4
45.3
38.5
38.0
42.2
18.8
26.8
27.9
28.8
28.6
29.6
35.2
33.3
38.5
44.4
45.2
45.6
44.3
44.7
50.1
47.9
53.0
53.5
62.0
3.3
1.2
2.2
0.9
3.7
1.4
3.3
3.1
3.2
3.2
2.7
5.9
5.6
2.3
3.9
1.7
7.0
0.9
1.2
0.3
0.8
2.4
0.5
0.2
0.4
1.5
2.2
0.5
1.8
1.1
Total (n=4,605)
Pakistan (n=32)
Myanmar (n=82)
India (n=326)
Vietnam (n=650)
Bangladesh (n=42)
Laos (n=27)
Philippines (n=71)
Sri Lanka (n=30)
Cambodia (n=65)
Taiwan (n=216)
Indonesia (n=434)
Malaysia (n=226)
China (n=811)
Australia (n=179)
Thailand (n=619)
Singapore (n=334)
South Korea (n=117)
HK & Macau (n=273)
New Zealand (n=71)
Expansion Remaining the same Reduction Transferring to a third country/region or withdrawal from current local markets
0 20 40 60 80 100
(%)
18
Approach to future business challenges in the next 1 to 2 years
(by country/region)
Copyright © 2017 JETRO. All rights reserved. Reproduction without permission is prohibited.

48.3
51.9
45.3
38.5
20
30
40
50
60
70
80
90
100
China Taiwan
South Korea Hong Kong
69.1
69.6
81.3
63.3
47.5
20
30
40
50
60
70
80
90
100
2008 09 10 11 12 13 14 15 16 17
Bangladesh India
Pakistan Sri Lanka
Australia
2. Future Business Plan (2)
Reviewing the survey results by country/region from 2008, the proportion of firms that selected “Expansion” as their approach to future business
challenges in the next one or two years increased significantly in 2010 when the global economy recovered from the downturn following the financial
crisis. The proportion of “Expansion” remained generally the same from 2011 to 2013, excluding several countries/regions, decreased in 2014 and 2015,
and increased in ASEAN and Northeast Asia in 2016. In 2017, the proportion increased in major countries in Southwest Asia and Oceania, as well as in
Northeast Asia.
In the 2017 survey, the proportion of firms that selected “Expansion” increased from 2016 by over 5.0 pp in Sri Lanka (17.1 pp), Pakistan (10.3 pp),
Philippines (9.0 pp), China (8.2 pp) and Malaysia (7.2 pp). On the other hand, the proportion decreased from 2016 by over 5.0 pp in Cambodia (−14.0
pp), and Myanmar (−9.0 pp).
(%) (%) (%)
51.4
51.3
70.7
63.4
47.2
58.5
69.5
20
30
40
50
60
70
80
90
100
2008 09 10 11 12 13 14 15 16 17
Indonesia Malaysia Myanmar
Philippines Thailand Cambodia
Vietnam
19
Proportions of firms expecting to expand in the next 1 to 2 years
(2008 to 2017)
ASEAN Southwest Asia/Oceania Northeast Asia
Note: The survey of Cambodia started in 2010. Note: Hong Kong includes Macao from 2011.
Copyright © 2017 JETRO. All rights reserved. Reproduction without permission is prohibited.

60.2
61.9
65.2
66.8
52.3 54.2
46.5
38.1 40.1
China48.3
57.0
46.6
60.8
65.0
61.4 63.1
60.3 54.2 55.4
ASEAN55.7
30
40
50
60
70
80
90
2008 2009 2010 2011 2012 2013 2014 2015 2016 2017
China
ASEAN
Indonesia
Thailand
Vietnam
India
Note 1: ASEAN shows a
weighted average of
nine countries,
excluding Brunei.
Note 2: Figures for Cambodia
and Laos have been
included in the
ASEAN average
since 2010 and 2011,
respectively.
2. Future Business Plan (3)
Comparing China with ASEAN, the proportion of firms that selected “Expansion” as their approach to future business challenges in the
next one or two years was higher in China from 2008 to 2011. In 2012, however, ASEAN (61.4%) overtook China (52.3%). ASEAN has
been higher than China by around 10 pp since 2012. After peaking at 16.1 pp in the 2015 survey, the gap decreased to 7.4 pp in 2017.
(%)
20
Proportions of firms expecting to expand in the next 1 to 2 years
(2008 to 2017, China and other major countries in Asia)
Copyright © 2017 JETRO. All rights reserved. Reproduction without permission is prohibited.

54.1
66.7
64.7
64.3
56.2
52.9
48.9
44.6
36.8
52.5
42.2
31.6
20.6
33.3
40.0
44.0
48.3
52.3
54.6
44.7
3.0
1.7
11.8
2.4
2.9
3.1
1.7
3.1
6.3
1.8
0.8
2.9
0.9
1.2
2.3
1.0
Non-manufacturing total (n=2,405)
Business services (n=117)
Restaurant (n=34)
Communications/Software (n=126)
Wholesale/Retail (n=1,062)
Transport (n=257)
Finance/Insurance (n=174)
Travel/Amusement (n=65)
Construction (n=174)
Other non-manufacturing industries(n=396)
2. Future Business Plan (4)
By industry, the proportion of firms that selected “Expansion” as their approach to future business challenges in the next one or two years was higher
in the non-manufacturing (54.1%) than the manufacturing sector (53.3%).
In the manufacturing sector, the proportion of “Expansion” is high in Food (59.9%). In the non-manufacturing sector, the proportion is high in
Business services (66.7%). On the other hand, the proportion of “Expansion” is lower in Textiles and Construction.
By company size, large enterprises are more likely to expand their businesses than SMEs in both manufacturing and non-manufacturing sectors.
The proportion of manufacturing firms that selected “Expansion” has been increasing since the 2015 survey.
53.3
59.9
57.3
56.9
54.5
54.1
53.7
53.1
50.5
49.7
45.1
53.0
42.2
38.2
40.9
41.2
41.0
37.8
41.8
40.5
43.0
45.4
46.9
43.1
3.7
2.0
1.1
2.0
3.9
8.1
3.0
4.4
4.3
4.5
7.2
3.2
0.9
0.7
0.6
1.5
2.1
2.2
0.5
0.9
0.7
Manufacturing total (n=2,200)
Food (n=152)
Chemical/Pharmaceutical (n=286)
Rubber/Leather (n=51)
Iron/Nonferrous metals/Metals (n=356)
Wood/Pulp (n=37)
Precision machinery (n=67)
Electric machinery (n=341)
General machinery (n=93)
Motor vehicles/Motorcycles (n=425)
Textiles (n=111)
Other manufacturing industries (n=281)
(%)
54.6
54.4
55.6
61.7
52.9
52.9
52.4
54.9
41.6
41.7
41.1
35.1
43.5
43.2
43.4
40.3
3.0
3.0
2.8
2.7
2.8
3.1 3.2
4.0
0.9
1.0
0.6
0.5 0.8
0.8 1.0
0.8
2017 (n=1,655)
2016 (n=1,559)
2015 (n=1,557)
2014 (n=1,625)
2017 (n=750)
2016 (n=734)
2015 (n=597)
2014 (n=605)
Larg
eS
ME
0 20 40 60 80 100
(%)
0 20 40 60 80 100
(%)
0 20 40 60 80 100
(%) 0 20 40 60 80 100
54.7
53.4
50.9
56.4
51.4
47.1
44.4
48.7
41.1
42.9
43.6
39.6
43.5
47.6
48.7
44.7
3.2
2.8
4.6
3.4
4.2
3.6 5.7
5.4
0.9
0.9
0.9
0.7 0.8
1.7 1.2 1.3
2017 (n=1,233)
2016 (n=1,282)
2015 (n=1,388)
2014 (n=1,463)
2017 (n=967)
2016 (n=1,038)
2015 (n=1,035)
2014 (n=1,038)
Larg
eS
ME
Expansion Remaining the same Reduction Transferring to a third country/region or withdrawal from current local markets
21
Approach to future business challenges in the next 1 to 2 years
(by industry and company size)
Manufacturing Non-manufacturing
Copyright © 2017 JETRO. All rights reserved. Reproduction without permission is prohibited.

63.3
58.8
55.1
40.4
36.7
41.2
44.9
51.9 5.8 1.9
Vietnam (n=49)
Indonesia (n=34)
Thailand (n=49)
China (n=52)
71.3
52.6
46.3
45.1
34.4
28.7
42.1
43.9
52.1
59.4
3.5
7.3
2.8
6.3
1.8
2.4
Vietnam (n=87)
China (n=57)
Indonesia (n=41)
Thailand (n=71)
Malaysia (n=32)
2. Future Business Plan (5)
The proportion of “Expansion” in Wholesale/Retail was high in Vietnam (83.1%) and India (67.4%). Meanwhile, “Remaining the same” accounted for
over 50% in New Zealand and South Korea.
In the Motor vehicles/Motorcycles industry, the proportion of “Expansion” was high in India (62.3%). In China, the proportion of “Expansion”
increased by 8.4 pp to 51.4% from the 2016 survey (43.0%), marking the largest increase by country/region.
In Vietnam, the proportion of "Expansion" exceeded 80% in Wholesale/Retail. The proportion also exceeded 70% in Iron/Nonferrous metals/Metals
and in Electric machinery.
83.1
67.4
60.5
58.2
57.9
57.3
55.9
50.0
49.7
42.9
41.9
41.7
15.4
28.3
34.2
41.8
37.3
40.3
40.9
42.3
47.5
49.2
58.1
56.3
1.5
3.3
5.3
4.0
2.4
3.2
5.1
0.7
6.4
2.1
1.1
0.8
2.6
2.1
1.6
Vietnam (n=65)
India (n=92)
Malaysia (n=38)
Indonesia (n=79)
China (n=126)
Thailand (n=124)
Taiwan (n=93)
Australia (n=78)
Singapore (n=141)
HK & Macau (n=126)
New Zealand (n=31)
South Korea (n=48)
0 20 40 60 80 100
(%)
0 20 40 60 80 100
(%)
(%) (%)
75.5
46.8
45.7
43.7
20.4
44.7
52.2
44.8
6.4
2.2
8.1
4.1
2.1
3.5
Vietnam (n=49)
Thailand (n=47)
Malaysia (n=46)
China (n=87)
0 20 40 60 80 1000 20 40 60 80 100
(%)
0 20 40 60 80 100
62.3
55.8
51.4
42.7
40.6
36.1
44.2
38.7
56.0
55.1
1.6
9.0
1.3
4.4
0.9
India (n=61)
Vietnam (n=52)
China (n=111)
Thailand (n=75)
Indonesia (n=69)
Expansion Remaining the same Reduction Transfering to a third country/region or withdrawal from current local markets
22
Approach to future business challenges in the next 1 to 2 years
(by major industry and country/region)
Wholesale/Retail Iron/Nonferrous metals/Metals
Motor vehicles/Motorcycles
Chemical/Pharmaceutical
Electric machinery
Note: Country/region by industry categories for which n 30
Copyright © 2017 JETRO. All rights reserved. Reproduction without permission is prohibited.

2. Future Business Plan (6)
86.8
91.0
89.3
88.9
87.8
87.6
87.5
86.7
86.0
85.7
83.9
83.3
83.0
77.2
75.7
0 25 50 75 100
Total (n=2461)
Indonesia (n=223)
Taiwan (n=112)
India (n=226)
Vietnam (n=450)
Thailand (n=290)
China (n=391)
Philippines (n=45)
Malaysia (n=114)
HK & Macau (n=105)
Singapore (n=155)
Australia (n=84)
South Korea (n=53)
Myanmar (n=57)
Cambodia (n=37)
(%)
45.7
64.2
50.9
50.9
49.1
48.4
46.2
44.4
43.2
43.2
42.9
40.0
39.6
33.3
27.2
0 25 50 75
Total
India
China
Myanmar
Taiwan
Indonesia
Vietnam
Philippines
Cambodia
Singapore
Australia
HK & Macau
South Korea
Malaysia
Thailand
24.2
31.6
30.2
27.3
26.8
25.0
24.5
24.3
23.2
22.4
22.3
21.9
20.0
18.9
13.2
0 25 50 75
Total
Myanmar
South Korea
Vietnam
Taiwan
Australia
Thailand
India
Singapore
Indonesia
China
HK & Macau
Philippines
Cambodia
Malaysia
8.3
13.3
12.0
10.3
9.7
9.7
8.3
8.1
7.6
7.3
6.7
4.5
3.5
2.6
0.0
0 25 50
Total
Philippines
India
Thailand
China
Malaysia
Australia
Indonesia
South Korea
Vietnam
HK & Macau
Taiwan
Myanmar
Singapore
Cambodia
15.2
23.2
22.9
19.1
17.8
17.2
17.0
14.6
13.8
13.8
13.0
10.5
7.6
7.0
2.7
0 25 50
Total
Singapore
HK & Macau
Australia
Philippines
Thailand
Taiwan
India
China
Vietnam
Indonesia
Malaysia
South Korea
Myanmar
Cambodia
2.1
10.5
5.8
2.9
2.7
2.7
2.6
2.1
1.0
0.9
0.7
0.5
0.0
0.0
0.0
0 25 50
Total
Myanmar
India
HK & Macau
Cambodia
Vietnam
Malaysia
Thailand
China
Taiwan
Singapore
Indonesia
Philippines
Australia
South Korea
2.1
11.1
8.1
4.2
2.7
1.9
1.8
1.3
1.3
1.2
0.9
0.0
0.0
0.0
0.0
0 25 50
Total
Philippines
Cambodia
Vietnam
Indonesia
HK & Macau
Myanmar
India
Singapore
Australia
Malaysia
Thailand
China
South Korea
Taiwan
20.6
33.3
29.0
26.8
26.4
25.1
23.7
22.4
20.2
17.8
14.8
13.7
11.1
10.8
10.5
0 25 50
Total
HK & Macau
Singapore
Taiwan
South Korea
China
Malaysia
Thailand
Australia
Vietnam
Indonesia
India
Philippines
Cambodia
Myanmar
23
Reasons for expected business expansion
in the next 1 to 2 years (multiple answers) Note: Countries/regions for which n 30
Relationship with clients
High receptivity for high-value added products
Reviewing production and distribution networks
Reduction of costs (e.g., procurement/labor costs)
Easy to secure labor force
DeregulationsSales increaseHigh growth potential
Copyright © 2017 JETRO. All rights reserved. Reproduction without permission is prohibited.

62.3
85.6
79.4
79.3
78.4
71.3
66.5
63.2
59.6
59.0
58.7
56.9
51.8
48.9
43.9
0 25 50 75 100
Total (n=2413)
HK & Macau (n=104)
Taiwan (n=107)
South Korea (n=53)
Singapore (n=153)
Australia (n=80)
India (n=221)
Cambodia (n=38)
China (n=384)
Thailand (n=285)
Indonesia (n=213)
Malaysia (n=109)
Vietnam (n=446)
Philippines (n=45)
Myanmar (n=57)
2. Future Business Plan (7)
(%)
32.3
41.7
39.4
39.3
35.9
35.9
29.4
28.9
25.3
24.0
22.4
21.1
16.3
16.3
13.2
0 25 50
Total
China
Indonesia
Thailand
Vietnam
South Korea
Malaysia
Philippines
India
HK & Macau
Taiwan
Myanmar
Singapore
Australia
Cambodia
9.3
20.8
15.4
11.2
10.1
9.5
9.2
8.0
7.5
6.3
5.9
5.8
2.6
2.2
1.8
0 25 50
Total
South Korea
China
Taiwan
Malaysia
India
Vietnam
Indonesia
Australia
Thailand
Singapore
HK & Macau
Cambodia
Philippines
Myanmar
11.3
19.3
18.4
15.6
15.1
14.6
14.0
13.8
13.1
13.1
11.9
10.6
10.2
8.3
6.7
0 25 50
Total
Myanmar
Cambodia
Philippines
South Korea
Indonesia
India
Australia
Taiwan
Singapore
Malaysia
HK & Macau
Thailand
China
Vietnam
6.2
11.3
10.0
9.4
8.8
8.7
7.6
6.7
6.5
6.4
5.6
5.6
4.7
3.2
0.0
0 25 50
Total
India
Australia
Taiwan
Myanmar
HK & Macau
South Korea
Philippines
Singapore
Malaysia
Indonesia
Vietnam
China
Thailand
Cambodia
6.9
22.2
14.4
8.8
7.8
7.5
6.8
6.7
6.4
6.0
5.7
5.3
3.8
2.6
2.0
0 25 50
Total
Singapore
HK & Macau
Australia
China
Taiwan
India
Philippines
Malaysia
Thailand
South Korea
Myanmar
Indonesia
Cambodia
Vietnam
26.1
44.4
36.3
34.2
29.9
29.6
29.4
29.1
26.0
13.1
10.5
8.7
7.8
5.7
2.5
0 25 50 75
Total
Philippines
Vietnam
Cambodia
India
Indonesia
Malaysia
Thailand
China
Taiwan
Myanmar
HK & Macau
Singapore
South Korea
Australia
24
Sales function
Note: Countries/regions for which n 30Functions to be expanded (multiple answers)
Production
(high-value
added products)
Production
(ubiquitous
products)
Logistics function R&DFunction of regional
headquarters
Administrative
functions in providing
services (e.g., shared
services center, call center)
Copyright © 2017 JETRO. All rights reserved. Reproduction without permission is prohibited.
26.0
36.3
29.129.9
15
25
35
45
55
65
75
2013 2014 2015 2016 2017
China Vietnam Indonesia Thailand India
59.6
51.8
58.7
59.0
66.5
15
25
35
45
55
65
75
2013 2014 2015 2016 2017
2. Future Business Plan (8)
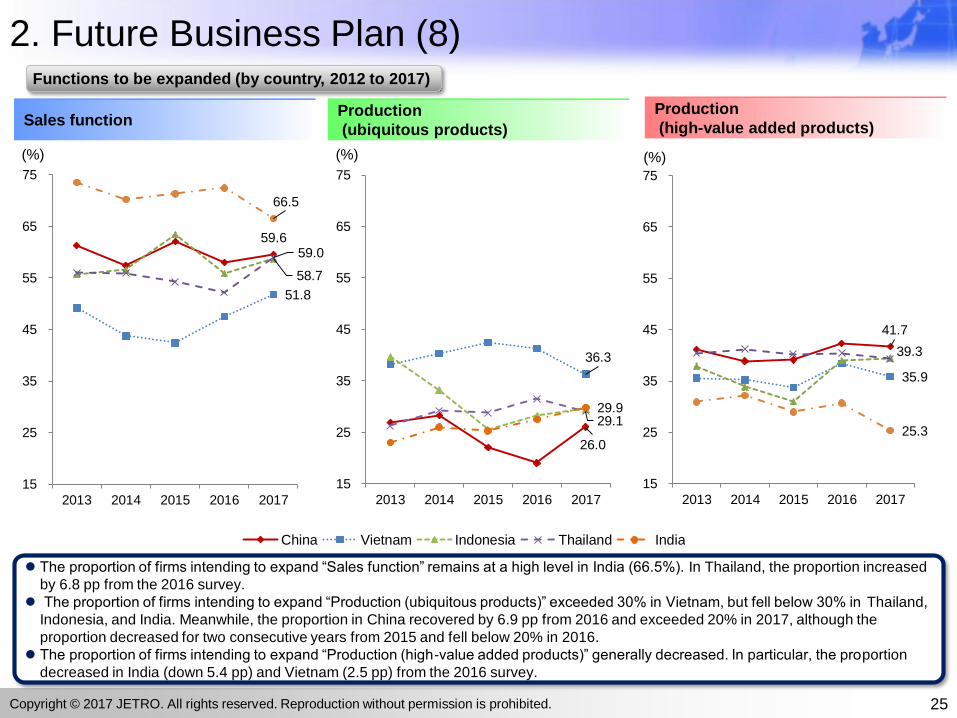
The proportion of firms intending to expand “Sales function” remains at a high level in India (66.5%). In Thailand, the proportion increased
by 6.8 pp from the 2016 survey.
The proportion of firms intending to expand “Production (ubiquitous products)” exceeded 30% in Vietnam, but fell below 30% in Thailand,
Indonesia, and India. Meanwhile, the proportion in China recovered by 6.9 pp from 2016 and exceeded 20% in 2017, although the
proportion decreased for two consecutive years from 2015 and fell below 20% in 2016.
The proportion of firms intending to expand “Production (high-value added products)” generally decreased. In particular, the proportion
decreased in India (down 5.4 pp) and Vietnam (2.5 pp) from the 2016 survey.
(%) (%) (%)
41.7
35.9
39.3
25.3
15
25
35
45
55
65
75
2013 2014 2015 2016 2017
25
Functions to be expanded (by country, 2012 to 2017)
Sales functionProduction
(ubiquitous products)
Production
(high-value added products)
Copyright © 2017 JETRO. All rights reserved. Reproduction without permission is prohibited.
63.9
41.7
27.2
14.4
13.9
13.9
10.0
6.1
13.9
60.8
46.0
24.3
14.9
12.2
17.6
8.1
8.1
9.5
61.1
48.2
27.8
14.8
20.4
14.8
18.5
1.9
13.0
Sales decrease
Increase of costs(e.g., procurement/labor costs)
Low growth potential
Reviewing production anddistribution networks
Tightening of regulations
Difficulty in securing labor force
Relationship with clients
Low receptivity for high-valueadded products
Others
Total (n=180)
ASEAN (n=74)
China (n=54)
2. Future Business Plan (9)
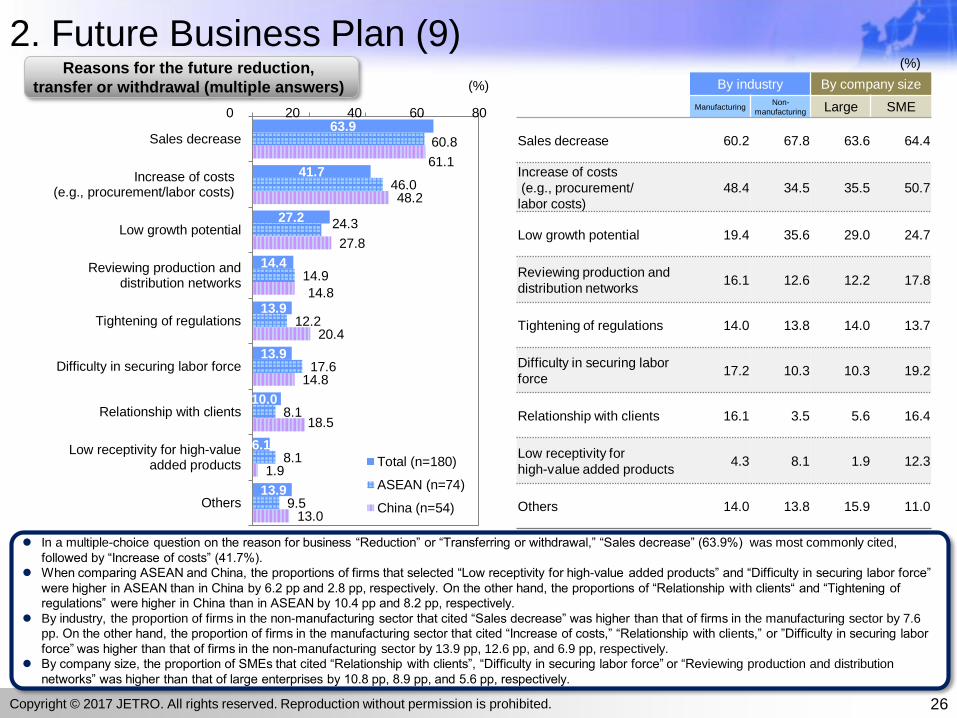
In a multiple-choice question on the reason for business “Reduction” or “Transferring or withdrawal,” “Sales decrease” (63.9%) was most commonly cited,
followed by “Increase of costs” (41.7%).
When comparing ASEAN and China, the proportions of firms that selected “Low receptivity for high-value added products” and “Difficulty in securing labor force”
were higher in ASEAN than in China by 6.2 pp and 2.8 pp, respectively. On the other hand, the proportions of “Relationship with clients“ and “Tightening of
regulations” were higher in China than in ASEAN by 10.4 pp and 8.2 pp, respectively.
By industry, the proportion of firms in the non-manufacturing sector that cited “Sales decrease” was higher than that of firms in the manufacturing sector by 7.6
pp. On the other hand, the proportion of firms in the manufacturing sector that cited “Increase of costs,” “Relationship with clients,” or ”Difficulty in securing labor
force” was higher than that of firms in the non-manufacturing sector by 13.9 pp, 12.6 pp, and 6.9 pp, respectively.
By company size, the proportion of SMEs that cited “Relationship with clients”, “Difficulty in securing labor force” or “Reviewing production and distribution
networks” was higher than that of large enterprises by 10.8 pp, 8.9 pp, and 5.6 pp, respectively.
0 20 40 60 80
(%) By industry By company size
ManufacturingNon-
manufacturing Large SME
Sales decrease 60.2 67.8 63.6 64.4
Increase of costs
(e.g., procurement/
labor costs)
48.4 34.5 35.5 50.7
Low growth potential 19.4 35.6 29.0 24.7
Reviewing production and
distribution networks16.1 12.6 12.2 17.8
Tightening of regulations 14.0 13.8 14.0 13.7
Difficulty in securing labor
force17.2 10.3 10.3 19.2
Relationship with clients 16.1 3.5 5.6 16.4
Low receptivity for
high-value added products4.3 8.1 1.9 12.3
Others 14.0 13.8 15.9 11.0
(%)
26
Reasons for the future reduction,
transfer or withdrawal (multiple answers)
Copyright © 2017 JETRO. All rights reserved. Reproduction without permission is prohibited.
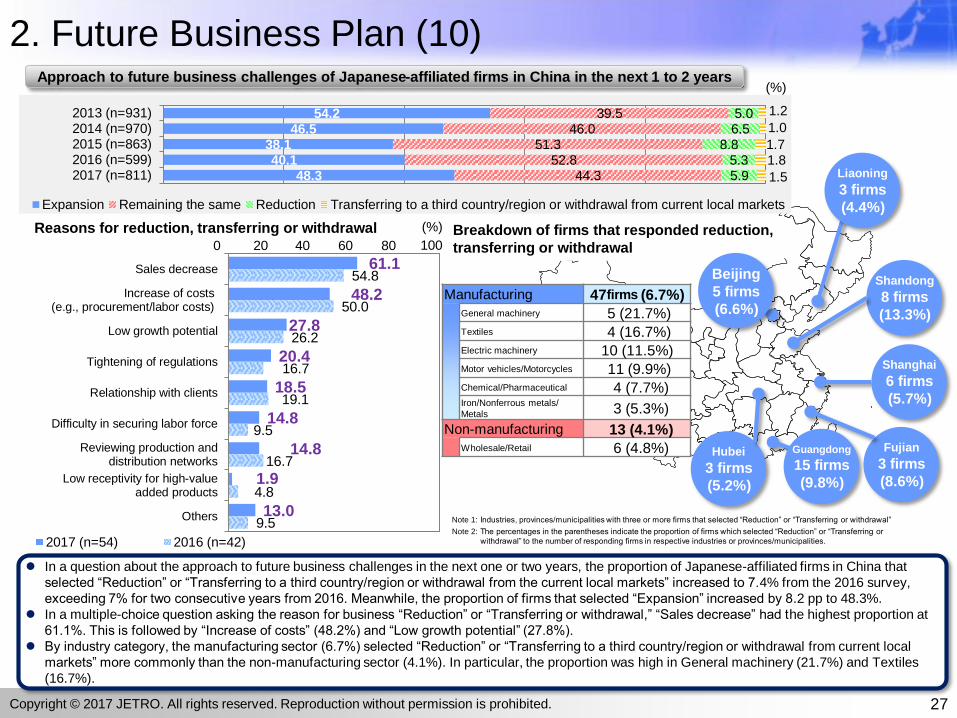
2. Future Business Plan (10)
61.1
48.2
27.8
20.4
18.5
14.8
14.8
1.9
13.0
54.8
50.0
26.2
16.7
19.1
9.5
16.7
4.8
9.5
Sales decrease
Increase of costs (e.g., procurement/labor costs)
Low growth potential
Tightening of regulations
Relationship with clients
Difficulty in securing labor force
Reviewing production anddistribution networks
Low receptivity for high-valueadded products
Others
2017 (n=54) 2016 (n=42)
0 20 40 60 80
(%)
100
Manufacturing 47firms (6.7%) General machinery 5 (21.7%) Textiles 4 (16.7%) Electric machinery 10 (11.5%) Motor vehicles/Motorcycles 11 (9.9%) Chemical/Pharmaceutical 4 (7.7%) Iron/Nonferrous metals/
Metals 3 (5.3%)
Non-manufacturing 13 (4.1%) Wholesale/Retail 6 (4.8%)
Shanghai
6 firms
(5.7%)
Liaoning
3 firms
(4.4%)
Guangdong
15 firms
(9.8%)
54.2 46.5
38.140.1
48.3
39.5 46.0
51.352.8
44.3
5.0 6.5
8.85.3 5.9
1.2
1.0
1.71.8
1.5
2013 (n=931)2014 (n=970)2015 (n=863)2016 (n=599)2017 (n=811)
Expansion Remaining the same Reduction Transferring to a third country/region or withdrawal from current local markets
(%)
Fujian
3 firms
(8.6%)
Hubei
3 firms
(5.2%)
27
In a question about the approach to future business challenges in the next one or two years, the proportion of Japanese-affiliated firms in China that
selected “Reduction” or “Transferring to a third country/region or withdrawal from the current local markets” increased to 7.4% from the 2016 survey,
exceeding 7% for two consecutive years from 2016. Meanwhile, the proportion of firms that selected “Expansion” increased by 8.2 pp to 48.3%.
In a multiple-choice question asking the reason for business “Reduction” or “Transferring or withdrawal,” “Sales decrease” had the highest proportion at
61.1%. This is followed by “Increase of costs” (48.2%) and “Low growth potential” (27.8%).
By industry category, the manufacturing sector (6.7%) selected “Reduction” or “Transferring to a third country/region or withdrawal from current local
markets” more commonly than the non-manufacturing sector (4.1%). In particular, the proportion was high in General machinery (21.7%) and Textiles
(16.7%).
Shandong
8 firms
(13.3%)
Approach to future business challenges of Japanese-affiliated firms in China in the next 1 to 2 years
Breakdown of firms that responded reduction,
transferring or withdrawal
Reasons for reduction, transferring or withdrawal
Note 2: The percentages in the parentheses indicate the proportion of firms which selected “Reduction” or “Transferring or
withdrawal” to the number of responding firms in respective industries or provinces/municipalities.
Note 1: Industries, provinces/municipalities with three or more firms that selected “Reduction” or “Transferring or withdrawal”
Copyright © 2017 JETRO. All rights reserved. Reproduction without permission is prohibited.
Beijing
5 firms
(6.6%)
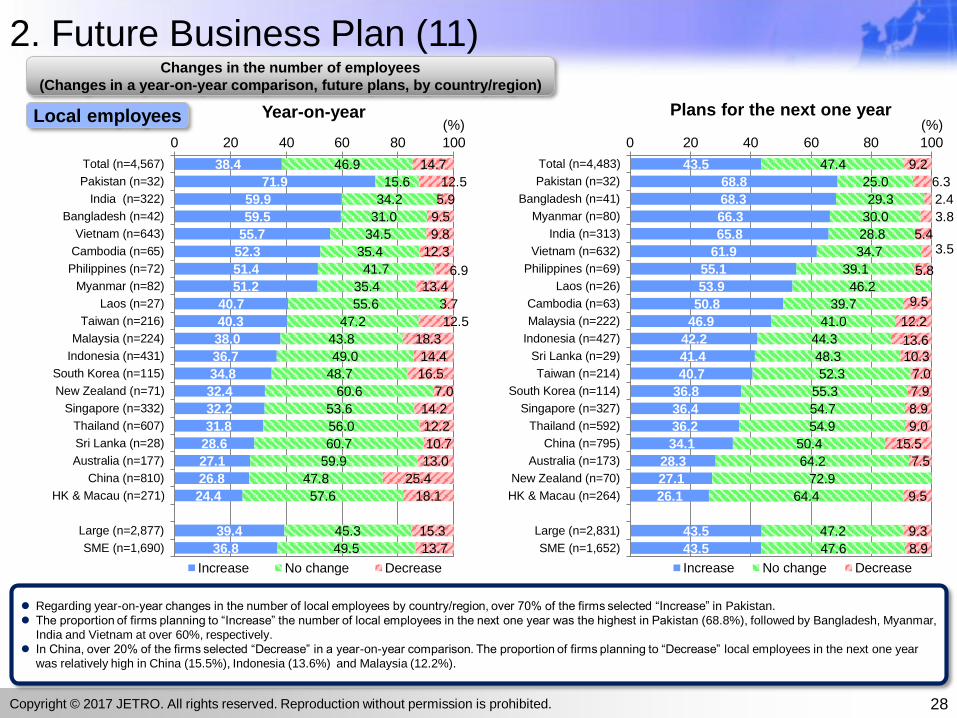
43.5
68.8
68.3
66.3
65.8
61.9
55.1
53.9
50.8
46.9
42.2
41.4
40.7
36.8
36.4
36.2
34.1
28.3
27.1
26.1
43.5
43.5
47.4
25.0
29.3
30.0
28.8
34.7
39.1
46.2
39.7
41.0
44.3
48.3
52.3
55.3
54.7
54.9
50.4
64.2
72.9
64.4
47.2
47.6
9.2
6.3
2.4
3.8
5.43.5
5.8
9.5
12.2
13.6
10.3
7.0
7.9
8.9
9.0
15.5
7.5
9.5
9.3
8.9
Total (n=4,483)
Pakistan (n=32)
Bangladesh (n=41)
Myanmar (n=80)
India (n=313)
Vietnam (n=632)
Philippines (n=69)
Laos (n=26)
Cambodia (n=63)
Malaysia (n=222)
Indonesia (n=427)
Sri Lanka (n=29)
Taiwan (n=214)
South Korea (n=114)
Singapore (n=327)
Thailand (n=592)
China (n=795)
Australia (n=173)
New Zealand (n=70)
HK & Macau (n=264)
Large (n=2,831)
SME (n=1,652)
Increase No change Decrease
2. Future Business Plan (11)
Regarding year-on-year changes in the number of local employees by country/region, over 70% of the firms selected “Increase” in Pakistan.
The proportion of firms planning to “Increase” the number of local employees in the next one year was the highest in Pakistan (68.8%), followed by Bangladesh, Myanmar,
India and Vietnam at over 60%, respectively.
In China, over 20% of the firms selected “Decrease” in a year-on-year comparison. The proportion of firms planning to “Decrease” local employees in the next one year
was relatively high in China (15.5%), Indonesia (13.6%) and Malaysia (12.2%).
38.4
71.9
59.9
59.5
55.7
52.3
51.4
51.2
40.7
40.3
38.0
36.7
34.8
32.4
32.2
31.8
28.6
27.1
26.8
24.4
39.4
36.8
46.9
15.6
34.2
31.0
34.5
35.4
41.7
35.4
55.6
47.2
43.8
49.0
48.7
60.6
53.6
56.0
60.7
59.9
47.8
57.6
45.3
49.5
14.7
12.5
5.9
9.5
9.8
12.3
6.9
13.4
3.7
12.5
18.3
14.4
16.5
7.0
14.2
12.2
10.7
13.0
25.4
18.1
15.3
13.7
Total (n=4,567)
Pakistan (n=32)
India (n=322)
Bangladesh (n=42)
Vietnam (n=643)
Cambodia (n=65)
Philippines (n=72)
Myanmar (n=82)
Laos (n=27)
Taiwan (n=216)
Malaysia (n=224)
Indonesia (n=431)
South Korea (n=115)
New Zealand (n=71)
Singapore (n=332)
Thailand (n=607)
Sri Lanka (n=28)
Australia (n=177)
China (n=810)
HK & Macau (n=271)
Large (n=2,877)
SME (n=1,690)
Increase No change Decrease
20 40 60 80 1000
(%)
20 40 60 80 1000
(%)
28
Local employees Year-on-year Plans for the next one year
Changes in the number of employees
(Changes in a year-on-year comparison, future plans, by country/region)
Copyright © 2017 JETRO. All rights reserved. Reproduction without permission is prohibited.

2. Future Business Plan (12)
Regarding changes in the number of Japanese expatriates by country/region, “No change” was most frequently selected in all
countries/regions in both year-on-year comparison and in plans for the next one year.
In the past one year, the proportion of firms that selected “Decrease” exceeded 20% in Laos. The proportion was less than 20% in China
(18.8%), Singapore (17.6%), and Malaysia (17.5%).
Regarding plans for the next one year, the proportion of firms that selected “Increase” was higher in Laos (19.2%), Myanmar (17.5%), India
(17.3%), and Bangladesh (17.1%). On the other hand, the proportion of firms that selected “Decrease” was the highest in China (20.9%).
13.1
31.3
23.2
21.1
20.9
15.7
15.3
14.3
13.8
13.6
13.3
11.4
11.1
10.4
10.3
9.7
9.7
6.0
3.5
3.0
14.6
10.4
72.3
65.6
69.5
61.4
64.2
72.0
80.6
78.6
79.3
74.0
69.1
75.8
66.7
74.3
78.9
71.5
73.5
76.7
93.1
89.4
69.2
77.8
14.6
3.1
7.3
17.5
15.0
12.4
4.2
7.1
6.9
12.4
17.6
12.8
22.2
15.4
10.8
18.8
16.8
17.2
3.5
7.6
16.2
11.8
Total (n=4,527)
Cambodia (n=64)
Myanmar (n=82)
Malaysia (n=223)
India (n=321)
Vietnam (n=639)
Philippines (n=72)
Bangladesh (n=42)
Pakistan (n=29)
Australia (n=177)
Singapore (n=330)
Indonesia (n=429)
Laos (n=27)
Thailand (n=598)
Taiwan (n=213)
China (n=802)
HK & Macau (n=268)
South Korea (n=116)
Sri Lanka (n=29)
New Zealand (n=66)
Large (n=2,862)
SME (n=1,665)
Increase No change Decrease
20 40 60 80 100(%)
9.1
19.2
17.5
17.3
17.1
14.5
12.4
11.0
10.9
8.2
7.9
7.8
7.3
7.1
6.9
5.7
5.6
5.0
3.5
3.5
9.7
8.1
76.7
73.1
71.3
70.9
80.5
79.7
75.6
69.9
74.9
80.3
85.7
79.7
75.2
92.9
83.2
83.8
81.2
74.1
86.2
76.7
74.9
80.0
14.1
7.7
11.3
11.8
2.4
5.8
12.0
19.2
14.2
11.5
6.4
12.5
17.4
9.8
10.6
13.2
20.9
10.3
19.8
15.5
11.9
Total (n=4,454)
Laos (n=26)
Myanmar (n=80)
India (n=313)
Bangladesh (n=41)
Philippines (n=69)
Vietnam (n=635)
Malaysia (n=219)
Indonesia (n=423)
Thailand (n=585)
New Zealand (n=63)
Cambodia (n=64)
Singapore (n=327)
Pakistan (n=28)
Australia (n=173)
HK & Macau (n=265)
Taiwan (n=213)
China (n=785)
Sri Lanka (n=29)
South Korea (n=116)
Large (n=2,820)
SME (n=1,634)
Increase No change Decrease
20 40 60 80 1000(%)
0
29
Year-on-year Plans for the next one year
Changes in the number of employees
(Changes in a year-on-year comparison, future plans, by country/region)
Japanese expatriates
Copyright © 2017 JETRO. All rights reserved. Reproduction without permission is prohibited.
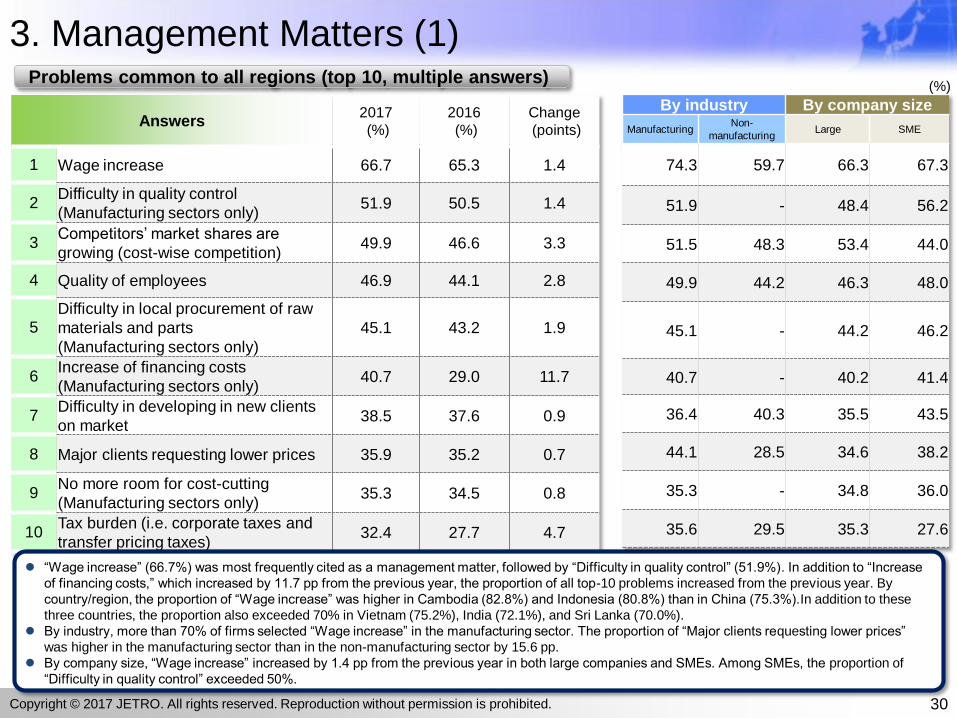
3. Management Matters (1)
Answers2017
(%)
2016
(%)
Change
(points)
1 Wage increase 66.7 65.3 1.4
2Difficulty in quality control
(Manufacturing sectors only) 51.9 50.5 1.4
3Competitors’ market shares are
growing (cost-wise competition) 49.9 46.6 3.3
4 Quality of employees 46.9 44.1 2.8
5Difficulty in local procurement of raw
materials and parts
(Manufacturing sectors only)
45.1 43.2 1.9
6Increase of financing costs
(Manufacturing sectors only) 40.7 29.0 11.7
7Difficulty in developing in new clients
on market 38.5 37.6 0.9
8 Major clients requesting lower prices 35.9 35.2 0.7
9No more room for cost-cutting
(Manufacturing sectors only) 35.3 34.5 0.8
10Tax burden (i.e. corporate taxes and
transfer pricing taxes) 32.4 27.7 4.7
“Wage increase” (66.7%) was most frequently cited as a management matter, followed by “Difficulty in quality control” (51.9%). In addition to “Increase
of financing costs,” which increased by 11.7 pp from the previous year, the proportion of all top-10 problems increased from the previous year. By
country/region, the proportion of “Wage increase” was higher in Cambodia (82.8%) and Indonesia (80.8%) than in China (75.3%).In addition to these
three countries, the proportion also exceeded 70% in Vietnam (75.2%), India (72.1%), and Sri Lanka (70.0%).
By industry, more than 70% of firms selected “Wage increase” in the manufacturing sector. The proportion of “Major clients requesting lower prices”
was higher in the manufacturing sector than in the non-manufacturing sector by 15.6 pp.
By company size, “Wage increase” increased by 1.4 pp from the previous year in both large companies and SMEs. Among SMEs, the proportion of
“Difficulty in quality control” exceeded 50%.
By industry By company size
ManufacturingNon-
manufacturingLarge SME
74.3 59.7 66.3 67.3
51.9 - 48.4 56.2
51.5 48.3 53.4 44.0
49.9 44.2 46.3 48.0
45.1 - 44.2 46.2
40.7 - 40.2 41.4
36.4 40.3 35.5 43.5
44.1 28.5 34.6 38.2
35.3 - 34.8 36.0
35.6 29.5 35.3 27.6
(%)
30
Problems common to all regions (top 10, multiple answers)
Copyright © 2017 JETRO. All rights reserved. Reproduction without permission is prohibited.
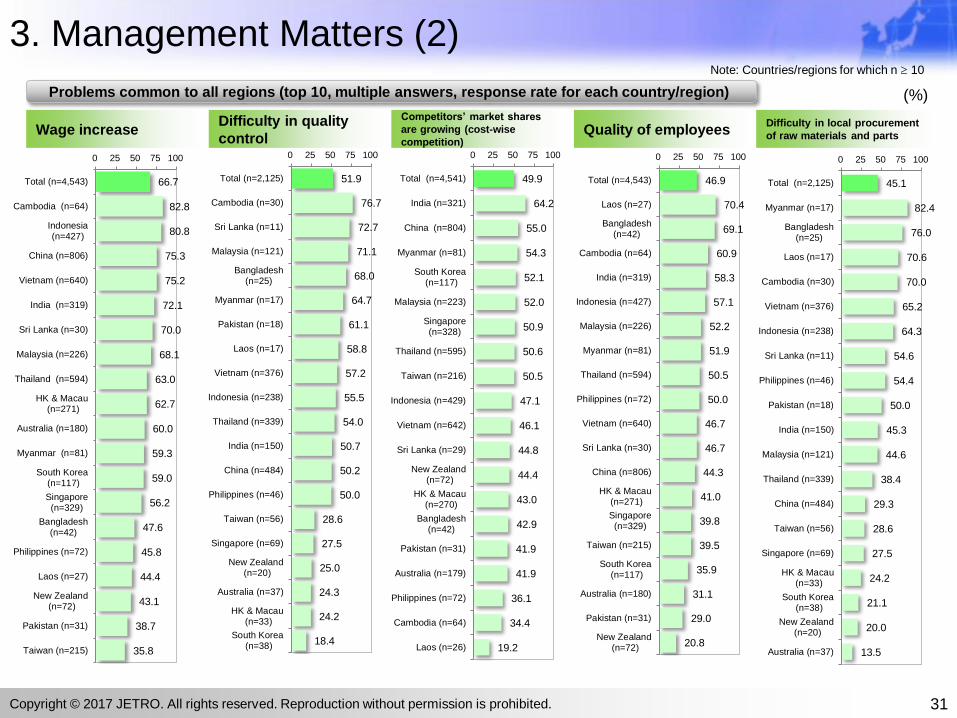
3. Management Matters (2)
66.7
82.8
80.8
75.3
75.2
72.1
70.0
68.1
63.0
62.7
60.0
59.3
59.0
56.2
47.6
45.8
44.4
43.1
38.7
35.8
0 25 50 75 100
Total (n=4,543)
Cambodia (n=64)
Indonesia(n=427)
China (n=806)
Vietnam (n=640)
India (n=319)
Sri Lanka (n=30)
Malaysia (n=226)
Thailand (n=594)
HK & Macau (n=271)
Australia (n=180)
Myanmar (n=81)
South Korea (n=117)
Singapore(n=329)
Bangladesh(n=42)
Philippines (n=72)
Laos (n=27)
New Zealand (n=72)
Pakistan (n=31)
Taiwan (n=215)
(%)
51.9
76.7
72.7
71.1
68.0
64.7
61.1
58.8
57.2
55.5
54.0
50.7
50.2
50.0
28.6
27.5
25.0
24.3
24.2
18.4
0 25 50 75 100
Total (n=2,125)
Cambodia (n=30)
Sri Lanka (n=11)
Malaysia (n=121)
Bangladesh(n=25)
Myanmar (n=17)
Pakistan (n=18)
Laos (n=17)
Vietnam (n=376)
Indonesia (n=238)
Thailand (n=339)
India (n=150)
China (n=484)
Philippines (n=46)
Taiwan (n=56)
Singapore (n=69)
New Zealand (n=20)
Australia (n=37)
HK & Macau (n=33)
South Korea (n=38)
49.9
64.2
55.0
54.3
52.1
52.0
50.9
50.6
50.5
47.1
46.1
44.8
44.4
43.0
42.9
41.9
41.9
36.1
34.4
19.2
0 25 50 75 100
Total (n=4,541)
India (n=321)
China (n=804)
Myanmar (n=81)
South Korea (n=117)
Malaysia (n=223)
Singapore(n=328)
Thailand (n=595)
Taiwan (n=216)
Indonesia (n=429)
Vietnam (n=642)
Sri Lanka (n=29)
New Zealand (n=72)
HK & Macau (n=270)
Bangladesh(n=42)
Pakistan (n=31)
Australia (n=179)
Philippines (n=72)
Cambodia (n=64)
Laos (n=26)
45.1
82.4
76.0
70.6
70.0
65.2
64.3
54.6
54.4
50.0
45.3
44.6
38.4
29.3
28.6
27.5
24.2
21.1
20.0
13.5
0 25 50 75 100
Total (n=2,125)
Myanmar (n=17)
Bangladesh(n=25)
Laos (n=17)
Cambodia (n=30)
Vietnam (n=376)
Indonesia (n=238)
Sri Lanka (n=11)
Philippines (n=46)
Pakistan (n=18)
India (n=150)
Malaysia (n=121)
Thailand (n=339)
China (n=484)
Taiwan (n=56)
Singapore (n=69)
HK & Macau (n=33)
South Korea (n=38)
New Zealand (n=20)
Australia (n=37)
46.9
70.4
69.1
60.9
58.3
57.1
52.2
51.9
50.5
50.0
46.7
46.7
44.3
41.0
39.8
39.5
35.9
31.1
29.0
20.8
0 25 50 75 100
Total (n=4,543)
Laos (n=27)
Bangladesh(n=42)
Cambodia (n=64)
India (n=319)
Indonesia (n=427)
Malaysia (n=226)
Myanmar (n=81)
Thailand (n=594)
Philippines (n=72)
Vietnam (n=640)
Sri Lanka (n=30)
China (n=806)
HK & Macau (n=271)
Singapore(n=329)
Taiwan (n=215)
South Korea (n=117)
Australia (n=180)
Pakistan (n=31)
New Zealand (n=72)
31
Problems common to all regions (top 10, multiple answers, response rate for each country/region)
Wage increaseDifficulty in quality
control
Competitors’ market shares
are growing (cost-wise
competition) Quality of employees
Difficulty in local procurement
of raw materials and parts
Note: Countries/regions for which n 10
Copyright © 2017 JETRO. All rights reserved. Reproduction without permission is prohibited.

3. Management Matters (3)
40.7
59.5
50.2
48.7
43.3
42.4
41.1
37.8
36.4
35.3
34.0
32.7
32.6
30.0
29.7
29.4
27.5
26.3
16.7
12.0
0 25 50 75 100
Total (n=2,125)
Malaysia (n=121)
China (n=484)
Indonesia (n=238)
Cambodia (n=30)
HK & Macau (n=33)
Taiwan (n=56)
Thailand (n=339)
Sri Lanka (n=11)
Myanmar (n=17)
India (n=150)
Vietnam (n=376)
Philippines (n=46)
New Zealand (n=20)
Australia (n=37)
Laos (n=17)
Singapore (n=69)
South Korea (n=38)
Pakistan (n=18)
Bangladesh(n=25)
(%)
38.5
50.0
45.7
44.8
42.2
42.1
40.4
40.0
39.9
38.2
35.8
35.0
33.3
33.3
31.0
27.8
25.1
25.0
23.6
19.4
0 25 50 75 100
Total (n=4,541)
Laos (n=26)
Myanmar (n=81)
HK & Macau (n=270)
Thailand (n=595)
Singapore(n=328)
Malaysia (n=223)
Vietnam (n=642)
China (n=804)
Indonesia (n=429)
India (n=321)
South Korea (n=117)
Taiwan (n=216)
Bangladesh(n=42)
Sri Lanka (n=29)
Philippines (n=72)
Australia (n=179)
Cambodia (n=64)
New Zealand (n=72)
Pakistan (n=31)
35.9
43.9
41.5
40.2
39.9
37.3
36.8
34.7
34.6
34.5
32.3
30.6
29.6
29.3
26.4
26.2
22.9
20.3
19.8
19.2
0 25 50 75 100
Total (n=4,541)
Thailand (n=595)
China (n=804)
South Korea (n=117)
India (n=321)
Indonesia (n=429)
Malaysia (n=223)
Taiwan (n=216)
Vietnam (n=642)
Sri Lanka (n=29)
Pakistan (n=31)
Philippines (n=72)
Singapore(n=328)
HK & Macau (n=270)
New Zealand (n=72)
Bangladesh(n=42)
Australia (n=179)
Cambodia (n=64)
Myanmar (n=81)
Laos (n=26)
35.3
46.1
41.2
40.0
39.7
37.5
33.3
30.4
29.5
29.0
27.3
27.3
26.1
24.3
22.7
17.7
15.0
12.0
11.8
11.1
0 25 50 75 100
Total (n=2,125)
China (n=484)
Indonesia (n=238)
Cambodia (n=30)
Malaysia (n=121)
Thailand (n=339)
Singapore (n=69)
Taiwan (n=56)
Vietnam (n=376)
South Korea (n=38)
Sri Lanka (n=11)
HK & Macau (n=33)
Philippines (n=46)
Australia (n=37)
India (n=150)
Laos (n=17)
New Zealand (n=20)
Bangladesh(n=25)
Myanmar (n=17)
Pakistan (n=18)
32.4
58.9
52.6
51.3
46.4
44.4
42.9
40.9
40.3
35.5
31.8
31.6
30.8
24.4
21.8
16.4
14.8
14.7
9.7
7.2
0 25 50 75 100
Total (n=4,511)
Indonesia (n=428)
Myanmar (n=78)
India (n=320)
Sri Lanka (n=28)
Cambodia (n=63)
Bangladesh(n=42)
Vietnam (n=640)
Philippines (n=72)
Pakistan (n=31)
Malaysia (n=223)
China (n=798)
South Korea (n=117)
Australia (n=180)
Thailand (n=587)
Taiwan (n=213)
Laos (n=27)
Singapore(n=327)
New Zealand (n=72)
HK & Macau (n=265)
32
Increase of financing costs Difficulty in developing in
new clients on market
Major clients requesting
lower prices
No more room for
cost-cuttingTax burden (i.e. corporate taxes
and transfer pricing taxes)
Problems common to all regions (top 10, multiple answers, response rate for each country/region)
Note: Countries/regions for which n 10
Copyright © 2017 JETRO. All rights reserved. Reproduction without permission is prohibited.
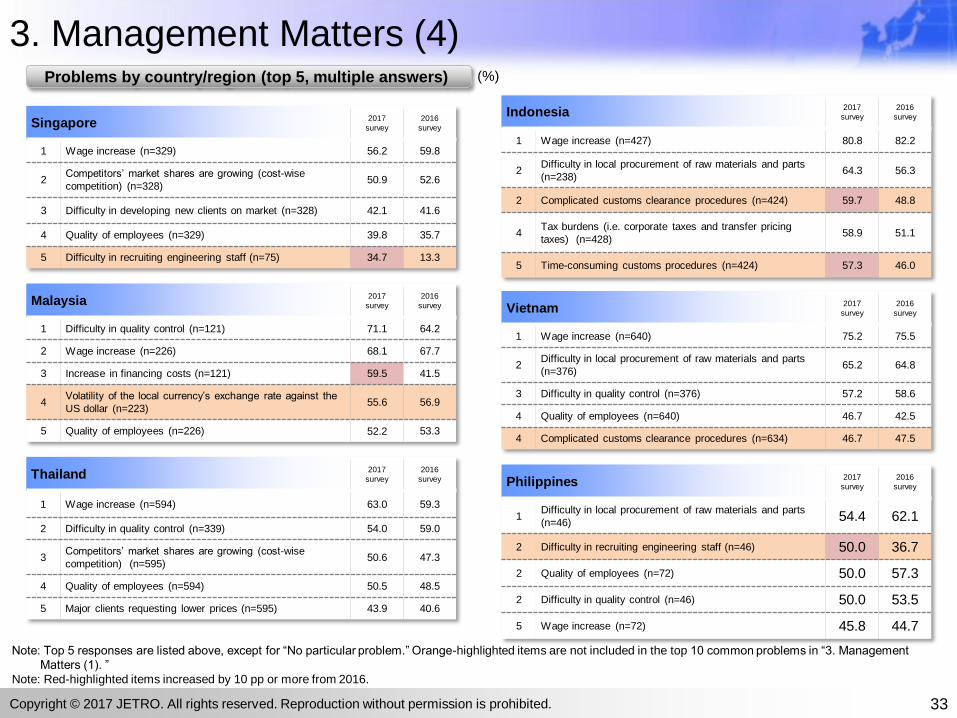
3. Management Matters (4)
Singapore2017
survey
2016
survey
1 Wage increase (n=329) 56.2 59.8
2Competitors’ market shares are growing (cost-wise
competition) (n=328) 50.9 52.6
3 Difficulty in developing new clients on market (n=328) 42.1 41.6
4 Quality of employees (n=329) 39.8 35.7
5 Difficulty in recruiting engineering staff (n=75) 34.7 13.3
Malaysia2017
survey
2016
survey
1 Difficulty in quality control (n=121) 71.1 64.2
2 Wage increase (n=226) 68.1 67.7
3 Increase in financing costs (n=121) 59.5 41.5
4Volatility of the local currency’s exchange rate against the
US dollar (n=223) 55.6 56.9
5 Quality of employees (n=226) 52.2 53.3
Thailand2017
survey
2016
survey
1 Wage increase (n=594) 63.0 59.3
2 Difficulty in quality control (n=339) 54.0 59.0
3Competitors’ market shares are growing (cost-wise
competition) (n=595) 50.6 47.3
4 Quality of employees (n=594) 50.5 48.5
5 Major clients requesting lower prices (n=595) 43.9 40.6
Indonesia2017
survey
2016
survey
1 Wage increase (n=427) 80.8 82.2
2Difficulty in local procurement of raw materials and parts
(n=238) 64.3 56.3
2 Complicated customs clearance procedures (n=424) 59.7 48.8
4Tax burdens (i.e. corporate taxes and transfer pricing
taxes) (n=428) 58.9 51.1
5 Time-consuming customs procedures (n=424) 57.3 46.0
Vietnam2017
survey
2016
survey
1 Wage increase (n=640) 75.2 75.5
2Difficulty in local procurement of raw materials and parts
(n=376) 65.2 64.8
3 Difficulty in quality control (n=376) 57.2 58.6
4 Quality of employees (n=640) 46.7 42.5
4 Complicated customs clearance procedures (n=634) 46.7 47.5
Philippines2017
survey
2016
survey
1Difficulty in local procurement of raw materials and parts
(n=46) 54.4 62.1
2 Difficulty in recruiting engineering staff (n=46) 50.0 36.7
2 Quality of employees (n=72) 50.0 57.3
2 Difficulty in quality control (n=46) 50.0 53.5
5 Wage increase (n=72) 45.8 44.7
Note: Top 5 responses are listed above, except for “No particular problem.” Orange-highlighted items are not included in the top 10 common problems in “3. Management
Matters (1). ”
Note: Red-highlighted items increased by 10 pp or more from 2016.
(%)
33
Problems by country/region (top 5, multiple answers)
Copyright © 2017 JETRO. All rights reserved. Reproduction without permission is prohibited.

3. Management Matters (5)
Pakistan2017
survey
2016
survey
1 Difficulty in quality control (n=18) 61.1 52.9
2Difficulty in local procurement of raw materials and parts
(n=18) 50.0 41.2
3Volatility of the local currency’s exchange rate against the US
dollar (n=31) 48.4 32.3
4 High import duties (n=31) 48.4 41.9
4 Time-consuming customs procedures (n=31) 45.2 32.3
Sri Lanka 2017
survey
2016
survey
1 Difficulty in quality control (n=11) 72.7 44.4
2 Wage increase (n=30) 70.0 65.4
3Difficulty in local procurement of raw materials and parts
(n=11) 54.6 55.6
4 Quality of employees (n=30) 46.7 15.4
5Tax burdens (i.e. corporate taxes and transfer pricing taxes)
(n=28) 46.4 34.6
Bangladesh2017
survey
2016
survey
1Difficulty in local procurement of raw materials and parts
(n=25) 76.0 81.3
2 Inadequate logistics infrastructure (n=25) 72.0 62.5
3 Quality of employees (n=42) 69.1 60.4
4 Difficulty in quality control (n=25) 68.0 56.3
5 Power shortage or blackout (n=25) 68.0 65.6
Cambodia2017
survey
2016
survey
1 Wage increase (n=64) 82.8 69.7
2 Difficulty in quality control (n=30) 76.7 76.3
3Difficulty in local procurement of raw materials and parts
(n=30) 70.0 73.7
4 Quality of employees (n=64) 60.9 62.9
5 Complicated customs clearance procedures (n=64) 46.9 44.8
Myanmar2017
survey
2016
survey
1Difficulty in local procurement of raw materials and parts
(n=17) 82.4 70.0
1 Power shortage or blackout (n=17) 82.4 85.0
2 Difficulty in quality control (n=17) 64.7 50.0
2 Inadequate logistics infrastructure (n=17) 64.7 55.0
5 Wage increase (n=81) 59.3 75.3
Laos2017
survey
2016
survey
1Difficulty in local procurement of raw materials and parts
(n=17) 70.6 63.6
2 Quality of employees (n=27) 70.4 72.2
3 Difficulty in recruiting engineering staff (n=17) 64.7 27.3
4 Difficulty in quality control (n=17) 58.8 81.8
5 Inadequate logistics infrastructure (n=17) 52.9 36.4
India2017
survey
2016
survey
1 Wage increase (n=319) 72.1 67.5
2Competitors’ market shares are growing (cost-wise
competition) (n=321) 64.2 59.2
3 Quality of employees (n=319) 58.3 49.5
4Tax burdens (i.e. corporate taxes and transfer pricing taxes)
(n=320) 51.3 52.6
5 Difficulty in quality control (n=150) 50.7 51.1
(%)
34
Problems by country/region (top 5, multiple answers)
Note: Top 5 responses are listed above, except for “No particular problem.” Orange-highlighted
items are not included in the top 10 common problems in “3. Management Matters (1). ”
Note: Red-highlighted items increased by 10 pp or more from 2015. Blue-highlighted items
decreased by 10 pp or more from 2016.
Copyright © 2017 JETRO. All rights reserved. Reproduction without permission is prohibited.

3. Management Matters (6)
China2017
survey
2016
survey
1 Wage increase (n=806) 75.3 77.8
2Growing market shares of competitors (cost-wise
competition) (n=804) 55.0 44.4
3 Increase in financing costs (n=484) 50.2 31.9
3 Difficulty in quality control (n=484) 50.2 45.0
5 No more room for cost-cutting (n=484) 46.1 48.2
Hong Kong & Macau2017
survey
2016
survey
1 Wage increase (n=271) 62.7 59.2
2 Difficulty in developing in new clients (n=270) 44.8 45.9
3Growing market shares of competitors (cost-wise
competition) (n=270) 43.0 36.9
4 Increase in financing costs (n=33) 42.4 19.5
5 Quality of employees (n=271) 41.0 35.2
Taiwan2017
survey
2016
survey
1Growing market shares of competitors (cost-wise
competition) (n=216) 50.5 51.4
2 Increase in financing costs (n=56) 41.1 25.0
3 Quality of employees (n=215) 39.5 34.3
4 Wage increase(n=215) 35.8 31.9
5 Major clients requesting lower prices (n=216) 34.7 33.2
South Korea2017
survey
2016
survey
1 Wage increase (n=117) 59.0 57.5
2Growing market shares of competitors (cost-wise
competition) (n=117) 52.1 53.8
3 Major clients requesting lower prices (n=117) 40.2 46.8
4 Quality of employees (n=117) 35.9 31.6
5 Difficulty in developing in new clients (n=117) 35.0 41.0
Australia2017
survey
2016
survey
1 Wage increase(n=180) 60.0 62.9
2Growing market shares of competitors (cost-wise
competition) (n=179) 41.9 33.7
3Volatility of the local currency’s exchange rate against the
US dollar (n=180) 31.7 41.8
4 Quality of employees (n=180) 31.1 26.2
5 Increase in financing costs (n=37) 29.7 29.2
New Zealand2017
survey
2016
survey
1Growing market shares of competitors (cost-wise
competition) (n=72) 44.4 35.1
2 Wage increase (n=72) 43.1 35.1
3Volatility of the local currency’s exchange rate against the
US dollar (n=72) 33.3 34.2
4 Difficulty in recruiting engineering staff (n=20) 30.0 22.7
4 Increase in financing costs (n=20) 30.0 18.2
(%)
35
Problems by country/region (top 5, multiple answers)
Note: Top 5 responses are listed above, except for “No particular problem.” Orange-highlighted items are not included in the top 10 common problems in “3. Management
Matters (1). ”
Note: Red-highlighted items increased by 10 pp or more from 2015. Blue-highlighted items decreased by 10 pp or more from 2016.
Copyright © 2017 JETRO. All rights reserved. Reproduction without permission is prohibited.

“Difficulty in quality control,” “Quality of employees” and “Difficulty in local procurement of raw materials and parts” were cited more commonly in
India, Indonesia, Vietnam and Thailand than in China.
Only Indonesia exceeded China in the proportion of “Wage increase.” China was higher than four other countries in the proportion of “No more room
for cost-cutting” and “Increase in financing costs.”
The proportion of firms citing “Time-consuming customs procedures” was higher in India, Indonesia, and Vietnam than in China by over 10 pp.
3. Management Matters (7)
36
Comparison between China and other major countries in Asia (top 5, multiple answers)
Copyright © 2017 JETRO. All rights reserved. Reproduction without permission is prohibited.
0
20
40
60
801. Wage increase
2. Difficulty in qualitycontrol
3. Growing marketshares of competitors
(cost-wise competition)
4. Quality of employees
5. Difficulty in localprocurement of rawmaterials and parts
6. No more room forcost-cutting
7. Complicated customsclearance procedures
8. Tax burdens (i.e.corporate taxes and
transfer pricing taxes)
9. Time-consumingcustoms procedures
10. Major clientsrequesting lower prices
11. Increase in financingcosts
China Vietnam
0
20
40
60
80
1001. Wage increase
2. Difficulty in qualitycontrol
3. Growing marketshares of competitors
(cost-wise competition)
4. Quality of employees
5. Difficulty in localprocurement of rawmaterials and parts
6. No more room for cost-cutting
7. Complicated customsclearance procedures
8. Tax burdens (i.e.corporate taxes and
transfer pricing taxes)
9. Time-consumingcustoms procedures
10. Major clientsrequesting lower prices
11. Increase in financingcosts
China Indonesia
0
20
40
60
801. Wage increase
2. Difficulty in quality control
3. Growing market shares ofcompetitors (cost-wise
competition)
4. Quality of employees
5. Difficulty in localprocurement of raw materials
and parts
6. No more room for cost-cutting
7. Complicated customsclearance procedures
8. Tax burdens (i.e. corporatetaxes and transfer pricing
taxes)
9. Time-consuming customsprocedures
10. Major clients requestinglower prices
11. Increase in financing costs
China India
0
20
40
60
801. Wage increase
2. Difficulty in qualitycontrol
3. Growing market sharesof competitors (cost-wise
competition)
4. Quality of employees
5. Difficulty in localprocurement of rawmaterials and parts
6. No more room for cost-cutting
7. Complicated customsclearance procedures
8. Tax burdens (i.e.corporate taxes and
transfer pricing taxes)
9. Time-consumingcustoms procedures
10. Major clientsrequesting lower prices
11. Increase in financingcosts
China Thailand

35.4
45.7
40.0
43.8
39.3
44.5
33.9
36.7
35.2
33.5
42.3
35.9
33.3
37.4
30.5
37.0
28.7
17.1
26.4
25.9
46.4
42.8
46.7
42.2
45.9
40.4
50.4
46.7
47.9
48.8
39.7
45.0
45.2
40.8
47.6
40.7
49.1
53.6
41.7
38.4
14.5
9.9
6.7
9.4
11.3
11.9
13.5
10.0
16.9
15.2
12.8
13.8
14.3
17.9
16.4
14.8
18.2
23.7
19.4
28.6
3.8
1.7
6.7
4.7
3.5
3.2
2.2
6.7
2.6
5.1
5.4
7.1
3.9
5.6
7.4
4.0
5.7
12.5
7.1
Total (n=4,473)
Indonesia (n=416)
Pakistan (n=30)
Cambodia (n=64)
China (n=795)
Malaysia (n=218)
Vietnam (n=631)
Sri Lanka (n=30)
Philippines (n=71)
Thailand (n=586)
Myanmar (n=78)
India (n=318)
Bangladesh (n=42)
Australia (n=179)
HK & Macau (n=269)
Laos (n=27)
Singapore (n=324)
Taiwan (n=211)
New Zealand (n=72)
South Korea (n=112)
Significantly affected Slightly affectedHardly any impact No impact
4. Rising Costs of Production and Services (1)
A combined 81.8% of the firms responded that their business activities are "Significantly affected" or "Slightly affected" by the negative impact of the rising costs of
production and services resulting from soaring prices of payroll, energy, and raw materials. About 80% of the firms in Asia and Oceania are affected negatively.
The proportion of firms sustaining negative impact was the highest in Indonesia at 88.5%, followed by Pakistan, Cambodia and China.
By industry in Indonesia, the impact was most serious in Food, Textiles, Wood/Pulp, General machinery, Travel/Amusement and Restaurant. A combined 100% of the
firms responded that their business activities are "Significantly affected" or "Slightly affected" by negative impact. The proportion of firms that selected “Significantly
affected” was the highest in Food (80.0%).
By industry in China, over 50% of the firms selected "Significantly affected" in Wood/Pulp (66.7%),Restaurant (66.7%), Textiles (56.5%), Chemical/Pharmaceuticals
(52.9%), Communications/Software (52.6%) and Food (50.0%).
0 10020 40 60 80
(%)
37
Negative impact of soaring costs of production and services
on business activities (by country/region)
Note: Countries/regions for which n 10
Copyright © 2017 JETRO. All rights reserved. Reproduction without permission is prohibited.

26.8
39.4
38.7
25.4
30.2
33.1
26.5
13.2
23.4
48.4
54.6
46.8
56.2
50.8
46.3
51.1
47.3
34.2
19.6
3.0
12.1
16.0
15.9
14.9
18.8
28.1
27.9
5.3
3.0
2.4
2.4
3.2
5.8
3.6
11.4
14.4
Non-manufacturing total(n=2,332)
Restaurant (n=33)
Transport (n=248)
Construction (n=169)
Travel/Amusement (n=63)
Communications/Software (n=121)
Wholesale/Retail (n=1,036)
Finance/Insurance (n=167)
Business services (n=111)
Significantly affected Slightly affected
Hardly any impact No impact
4. Rising Costs of Production and Services (2)
A total of 89.0% of the manufacturing firms and 75.2% of the non-manufacturing firms responded that they are “Significantly affected” or
“Slightly affected” by the negative impact of rising costs. Manufacturing firms are affected more seriously than non-manufacturing firms.
In the manufacturing sector, the proportion of firms that selected “Significantly affected” was the highest in Wood/Pulp.
In the non-manufacturing sector, the Restaurant industry marked the highest proportion in “Significantly affected” regarding negative impact.
In all industries, Business services had the highest proportion of “Hardly any impact” or “No impact,” at over 40%.
44.8
55.1
49.5
46.7
45.8
62.9
38.9
42.9
43.6
43.9
33.9
44.2
37.6
41.4
44.0
44.6
25.7
48.9
44.9
43.3
42.9
52.3
9.0
7.3
7.7
8.7
8.5
8.6
12.2
6.1
9.7
10.7
6.2
2.1
1.4
0.7
1.2
2.9
6.1
3.3
2.5
7.7
Manufacturing total(n=2,141)
Textiles (n=109)
Motor vehicles/Motorcycles (n=418)
Food (n=150)
Iron/Nonferrousmetals/Metals (n=343)
Wood/Pulp (n=35)
General machinery (n=90)
Rubber/Leather (n=49)
Electric machinery(n=330)
Chemical/Pharmaceutical (n=280)
Precision machinery(n=65)
Significantly affected Slightly affected
Hardly any impact No impact
0 20 40 60 80 100
(%) 0 20 40 60 80 100
(%)
38Copyright © 2017 JETRO. All rights reserved. Reproduction without permission is prohibited.
Negative impact of soaring costs of production and services
on business activities (by industry)
Manufacturing Non-manufacturing

48.4
69.8
58.6
55.8
Total
Finance/Insurance
Transport
Motor vehicles/Motorcycles
38.6
64.5
58.2
57.1
Total
Wood/Pulp
General machinery
Precision machinery
29.5
50.0
47.0
45.2
Total
Restaurant
Food
Wood/Pulp
24.2
38.3
34.4
31.8
Total
Communications/Software
Finance/Insurance
Business services
21.5
46.0
41.8
37.5
Total
Electric machinery
Motor vehicles/Motorcycles
Precision machinery
4. Rising Costs of Production and Services (3)
AnswersResponse rate
(%)
1Cost-cutting (e.g., administration cost, indirect
cost) 48.4
2Reviewing suppliers of raw materials and
procurement content38.6
3 Increasing prices of products (or services) 29.5
4Encouraging recruitment of local staff, reducing
payroll cost24.2
5Reviewing production (consolidation of lineup,
improvement, adding of value) 22.8
6Encouraging automation and power-saving
(e.g., introducing industrial robots) 21.5
7Cost-cutting through mass production and
volume sales20.2
8Cost-cutting through increasing local
procurement rate19.8
9 No particular measures 4.6
10Shifting production/service capabilities to third
country/areas (*) 4.6
The most common countermeasure was “Cost-cutting (e.g., administration cost, indirect cost)” at 48.4%. In particular, this countermeasure is taken
(considered) more commonly by non-manufacturing industries, such as Finance/Insurance and Transport. The proportion of firms that “Encouraged
recruitment of local staff and reduced payroll cost” or that is considering doing so was also high.
In the Wood/Pulp industries, the proportion of firms that reviewed or are considering reviewing “suppliers of raw materials and procurement content”
exceeded 60%. “Increasing prices of products (or services)” was cited by 45.2% of respondents.
In the Precision machinery industry, “Reviewing suppliers of raw materials and procurement content” accounted for 57.1%, while “Encouraging automation
and power-saving” accounted for 37.5%.
0 20 40 60 80 100(%)
Total (n=3,623) Note: China includes a shift of production/service capabilities to other areas on the Mainland.
39Copyright © 2017 JETRO. All rights reserved. Reproduction without permission is prohibited.
Countermeasures against rising costs currently being
taken or under consideration (multiple answers) Industries with a significantly higher response rate than average

4. Rising Costs of Production and Services (4)
Encouraged recruitment of local
staff, reducing payroll cost
Raised the prices of products (or
services)
Reviewed production
(consolidation of lineup,
improvement, adding of value)
48.4
58.2
54.6
54.4
51.9
51.6
51.4
50.4
50.0
49.1
47.5
44.4
42.2
39.1
32.8
0 25 50 75 100
Total (n=3,623)
HK & Macau (n=208)
China (n=671)
Taiwan (n=147)
Indonesia (n=362)
Singapore (n=252)
South Korea(n=72)
Australia (n=139)
India (n=254)
Cambodia (n=55)
Philippines (n=59)
Thailand (n=477)
Malaysia (n=185)
Vietnam (n=524)
Myanmar (n=64)
(%)
38.6
47.0
45.3
44.7
43.8
40.6
39.0
38.9
32.7
27.9
25.0
24.6
23.8
23.4
18.7
0 25 50 75 100
Total (n=3,623)
Indonesia (n=362)
China (n=671)
Vietnam (n=524)
Thailand (n=477)
India (n=254)
Philippines (n=59)
Malaysia (n=185)
Cambodia (n=55)
HK & Macau (n=208)
South Korea (n=72)
Singapore (n=252)
Taiwan (n=147)
Myanmar (n=64)
Australia (n=139)
29.5
37.0
35.7
32.7
32.2
31.8
31.3
30.9
30.2
29.3
29.2
28.2
25.5
23.8
23.3
0 25 50 75 100
Total (n=3,623)
Indonesia (n=362)
Malaysia (n=185)
India (n=254)
Philippines (n=59)
Singapore (n=252)
Myanmar (n=64)
Cambodia (n=55)
Australia (n=139)
HK & Macau (n=208)
South Korea(n=72)
Vietnam (n=524)
China (n=671)
Taiwan (n=147)
Thailand (n=477)
24.2
38.2
29.0
27.6
26.4
26.4
25.0
24.1
23.6
21.8
21.2
20.9
19.4
18.6
18.4
0 25 50 75 100
Total (n=3,623)
Cambodia (n=55)
Singapore (n=252)
Indonesia (n=362)
India (n=254)
China (n=671)
Myanmar (n=64)
Vietnam (n=524)
HK & Macau (n=208)
Taiwan (n=147)
Thailand (n=477)
Australia (n=139)
South Korea(n=72)
Philippines (n=59)
Malaysia (n=185)
22.8
29.3
27.9
26.1
25.4
25.0
24.0
23.6
23.5
21.6
20.8
19.4
19.1
18.1
14.6
0 25 50 75 100
Total (n=3,623)
HK & Macau (n=208)
Taiwan (n=147)
China (n=671)
Philippines (n=59)
Myanmar (n=64)
Indonesia (n=362)
Cambodia (n=55)
Thailand (n=477)
Australia (n=139)
South Korea(n=72)
Singapore (n=252)
Vietnam (n=524)
India (n=254)
Malaysia (n=185)
40Copyright © 2017 JETRO. All rights reserved. Reproduction without permission is prohibited.
Countermeasures against rising costs currently being taken or under consideration
(by country/region) (multiple answers) (1/2)
Cost-cutting
(e.g., administration cost,
indirect cost)
Reviewing suppliers of raw
materials and procurement
content
Note 1: Countries/regions for which n 50
Note 2: China includes a shift of production/service
capabilities to other areas in the mainland.

4. Rising Costs of Production and Services (5)
21.5
37.8
29.4
26.0
25.0
23.1
21.6
20.3
14.3
13.9
12.7
12.6
12.3
11.5
3.1
0 25 50 75 100
Total (n=3,623)
Malaysia (n=185)
China (n=671)
Indonesia (n=362)
South Korea (n=72)
Thailand (n=477)
Vietnam (n=524)
Philippines (n=59)
Taiwan (n=147)
HK & Macau (n=208)
Cambodia (n=55)
India (n=254)
Singapore (n=252)
Australia (n=139)
Myanmar (n=64)
Encouraged automation and power-
saving (e.g., introduced industrial
robots)
Cost-cutting by mass production and
volume sales
20.2
29.1
23.8
23.6
23.1
22.8
22.0
20.3
18.7
17.0
16.7
14.1
13.1
12.4
10.1
0 25 50 75 100
Total (n=3,623)
Cambodia (n=55)
Indonesia (n=362)
India (n=254)
Vietnam (n=524)
China (n=671)
Philippines (n=59)
Thailand (n=477)
Australia (n=139)
Taiwan (n=147)
South Korea (n=72)
Myanmar (n=64)
Singapore (n=252)
Malaysia (n=185)
HK & Macau (n=208)
Cost-cutting by increasing local
procurement rate
19.8
29.5
24.4
23.7
23.2
23.2
22.5
21.8
14.1
12.7
12.5
11.6
10.1
9.5
4.3
0 25 50 75 100
Total (n=3,623)
India (n=254)
China (n=671)
Philippines (n=59)
Malaysia (n=185)
Indonesia (n=362)
Vietnam (n=524)
Thailand (n=477)
Myanmar (n=64)
Cambodia (n=55)
South Korea (n=72)
Taiwan (n=147)
HK & Macau (n=208)
Singapore (n=252)
Australia (n=139)
Shifted production/service capabilities
to third country/areas
4.6
14.7
11.1
10.8
5.6
5.1
4.8
4.2
3.6
3.3
3.2
2.2
2.1
1.7
1.6
0 25 50 75 100
Total (n=3,623)
Singapore (n=252)
HK & Macau (n=208)
Australia (n=139)
South Korea (n=72)
Philippines (n=59)
Taiwan (n=147)
Thailand (n=477)
Cambodia (n=55)
China (n=671)
India (n=254)
Malaysia (n=185)
Vietnam (n=524)
Indonesia (n=362)
Myanmar (n=64)
41
(%)
Copyright © 2017 JETRO. All rights reserved. Reproduction without permission is prohibited.
Note 1: Countries/regions for which n 50
Note 2: China includes a shift of production/service
capabilities to other areas in the mainland.
Countermeasures against rising costs currently being taken or under consideration
(by country/region) (multiple answers) (2/2)
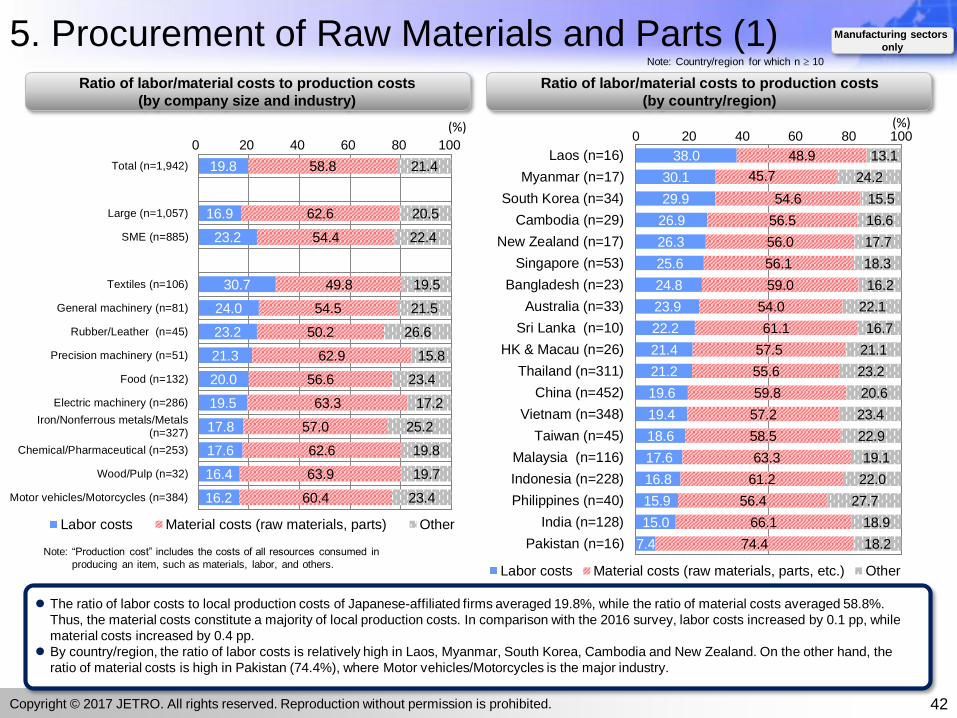
5. Procurement of Raw Materials and Parts (1)
42
20 40 60 80 1000
(%)
38.0
30.1
29.9
26.9
26.3
25.6
24.8
23.9
22.2
21.4
21.2
19.6
19.4
18.6
17.6
16.8
15.9
15.0
7.4
48.9
45.7
54.6
56.5
56.0
56.1
59.0
54.0
61.1
57.5
55.6
59.8
57.2
58.5
63.3
61.2
56.4
66.1
74.4
13.1
24.2
15.5
16.6
17.7
18.3
16.2
22.1
16.7
21.1
23.2
20.6
23.4
22.9
19.1
22.0
27.7
18.9
18.2
Laos (n=16)
Myanmar (n=17)
South Korea (n=34)
Cambodia (n=29)
New Zealand (n=17)
Singapore (n=53)
Bangladesh (n=23)
Australia (n=33)
Sri Lanka (n=10)
HK & Macau (n=26)
Thailand (n=311)
China (n=452)
Vietnam (n=348)
Taiwan (n=45)
Malaysia (n=116)
Indonesia (n=228)
Philippines (n=40)
India (n=128)
Pakistan (n=16)
Labor costs Material costs (raw materials, parts, etc.) Other
20 40 60 80 1000(%)
The ratio of labor costs to local production costs of Japanese-affiliated firms averaged 19.8%, while the ratio of material costs averaged 58.8%.
Thus, the material costs constitute a majority of local production costs. In comparison with the 2016 survey, labor costs increased by 0.1 pp, while
material costs increased by 0.4 pp.
By country/region, the ratio of labor costs is relatively high in Laos, Myanmar, South Korea, Cambodia and New Zealand. On the other hand, the
ratio of material costs is high in Pakistan (74.4%), where Motor vehicles/Motorcycles is the major industry.
19.8
16.9
23.2
30.7
24.0
23.2
21.3
20.0
19.5
17.8
17.6
16.4
16.2
58.8
62.6
54.4
49.8
54.5
50.2
62.9
56.6
63.3
57.0
62.6
63.9
60.4
21.4
20.5
22.4
19.5
21.5
26.6
15.8
23.4
17.2
25.2
19.8
19.7
23.4
Total (n=1,942)
Large (n=1,057)
SME (n=885)
Textiles (n=106)
General machinery (n=81)
Rubber/Leather (n=45)
Precision machinery (n=51)
Food (n=132)
Electric machinery (n=286)
Iron/Nonferrous metals/Metals(n=327)
Chemical/Pharmaceutical (n=253)
Wood/Pulp (n=32)
Motor vehicles/Motorcycles (n=384)
Labor costs Material costs (raw materials, parts) Other
Copyright © 2017 JETRO. All rights reserved. Reproduction without permission is prohibited.
Ratio of labor/material costs to production costs
(by company size and industry)
Ratio of labor/material costs to production costs
(by country/region)
Manufacturing sectors
only
Note: Country/region for which n 10
Note: “Production cost” includes the costs of all resources consumed in
producing an item, such as materials, labor, and others.
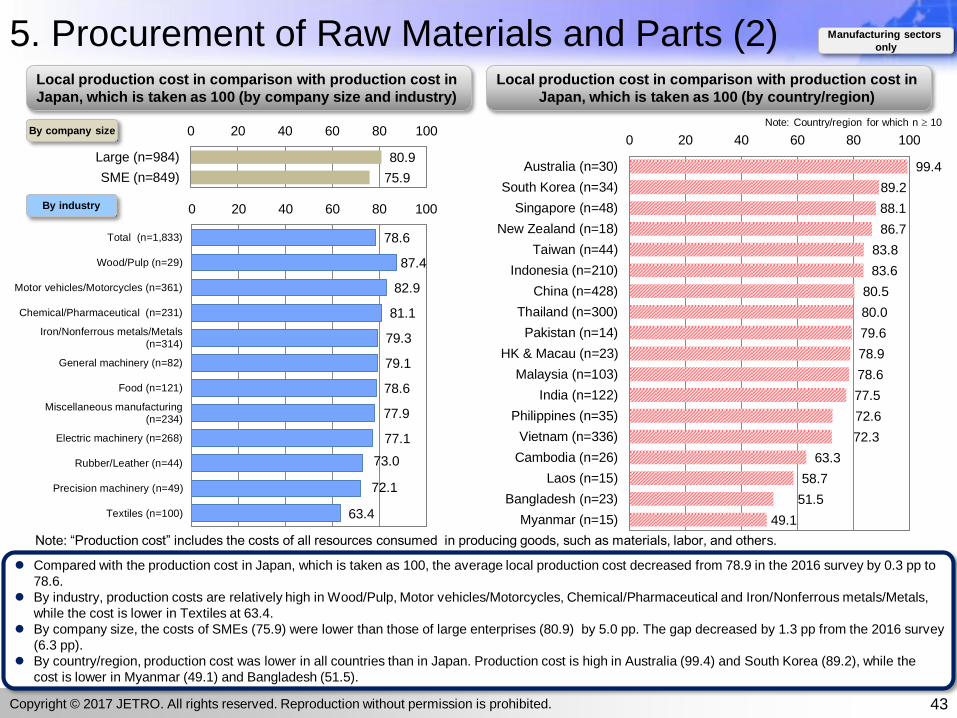
5. Procurement of Raw Materials and Parts (2)
43
Compared with the production cost in Japan, which is taken as 100, the average local production cost decreased from 78.9 in the 2016 survey by 0.3 pp to
78.6.
By industry, production costs are relatively high in Wood/Pulp, Motor vehicles/Motorcycles, Chemical/Pharmaceutical and Iron/Nonferrous metals/Metals,
while the cost is lower in Textiles at 63.4.
By company size, the costs of SMEs (75.9) were lower than those of large enterprises (80.9) by 5.0 pp. The gap decreased by 1.3 pp from the 2016 survey
(6.3 pp).
By country/region, production cost was lower in all countries than in Japan. Production cost is high in Australia (99.4) and South Korea (89.2), while the
cost is lower in Myanmar (49.1) and Bangladesh (51.5).
99.4
89.2
88.1
86.7
83.8
83.6
80.5
80.0
79.6
78.9
78.6
77.5
72.6
72.3
63.3
58.7
51.5
49.1
0 20 40 60 80 100
Australia (n=30)
South Korea (n=34)
Singapore (n=48)
New Zealand (n=18)
Taiwan (n=44)
Indonesia (n=210)
China (n=428)
Thailand (n=300)
Pakistan (n=14)
HK & Macau (n=23)
Malaysia (n=103)
India (n=122)
Philippines (n=35)
Vietnam (n=336)
Cambodia (n=26)
Laos (n=15)
Bangladesh (n=23)
Myanmar (n=15)
78.6
87.4
82.9
81.1
79.3
79.1
78.6
77.9
77.1
73.0
72.1
63.4
0 20 40 60 80 100
Total (n=1,833)
Wood/Pulp (n=29)
Motor vehicles/Motorcycles (n=361)
Chemical/Pharmaceutical (n=231)
Iron/Nonferrous metals/Metals(n=314)
General machinery (n=82)
Food (n=121)
Miscellaneous manufacturing(n=234)
Electric machinery (n=268)
Rubber/Leather (n=44)
Precision machinery (n=49)
Textiles (n=100)
80.9
75.9
0 20 40 60 80 100
Large (n=984)
SME (n=849)
Copyright © 2017 JETRO. All rights reserved. Reproduction without permission is prohibited.
Note: Country/region for which n 10
Local production cost in comparison with production cost in
Japan, which is taken as 100 (by company size and industry)
Local production cost in comparison with production cost in
Japan, which is taken as 100 (by country/region)
Manufacturing sectors
only
By company size
By industry
Note: “Production cost” includes the costs of all resources consumed in producing goods, such as materials, labor, and others.
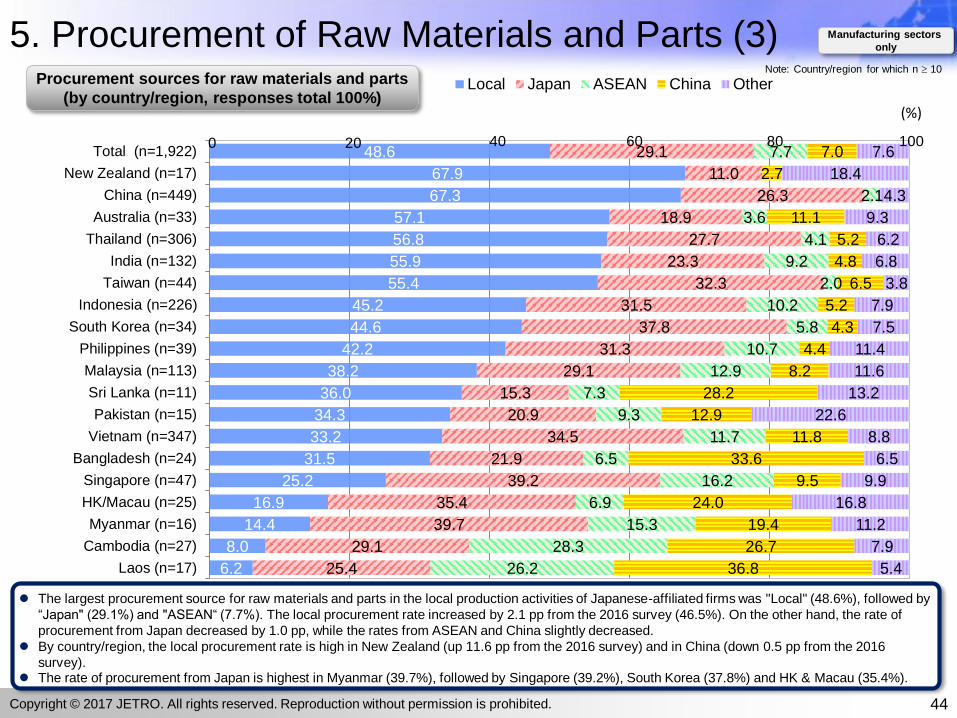
48.6
67.9
67.3
57.1
56.8
55.9
55.4
45.2
44.6
42.2
38.2
36.0
34.3
33.2
31.5
25.2
16.9
14.4
8.0
6.2
29.1
11.0
26.3
18.9
27.7
23.3
32.3
31.5
37.8
31.3
29.1
15.3
20.9
34.5
21.9
39.2
35.4
39.7
29.1
25.4
7.7
2.1
3.6
4.1
9.2
2.0
10.2
5.8
10.7
12.9
7.3
9.3
11.7
6.5
16.2
6.9
15.3
28.3
26.2
7.0
2.7
11.1
5.2
4.8
6.5
5.2
4.3
4.4
8.2
28.2
12.9
11.8
33.6
9.5
24.0
19.4
26.7
36.8
7.6
18.4
4.3
9.3
6.2
6.8
3.8
7.9
7.5
11.4
11.6
13.2
22.6
8.8
6.5
9.9
16.8
11.2
7.9
5.4
Total (n=1,922)
New Zealand (n=17)
China (n=449)
Australia (n=33)
Thailand (n=306)
India (n=132)
Taiwan (n=44)
Indonesia (n=226)
South Korea (n=34)
Philippines (n=39)
Malaysia (n=113)
Sri Lanka (n=11)
Pakistan (n=15)
Vietnam (n=347)
Bangladesh (n=24)
Singapore (n=47)
HK/Macau (n=25)
Myanmar (n=16)
Cambodia (n=27)
Laos (n=17)
Local Japan ASEAN China Other
5. Procurement of Raw Materials and Parts (3)
44
The largest procurement source for raw materials and parts in the local production activities of Japanese-affiliated firms was "Local" (48.6%), followed by
“Japan" (29.1%) and "ASEAN“ (7.7%). The local procurement rate increased by 2.1 pp from the 2016 survey (46.5%). On the other hand, the rate of
procurement from Japan decreased by 1.0 pp, while the rates from ASEAN and China slightly decreased.
By country/region, the local procurement rate is high in New Zealand (up 11.6 pp from the 2016 survey) and in China (down 0.5 pp from the 2016
survey). The rate of procurement from Japan is highest in Myanmar (39.7%), followed by Singapore (39.2%), South Korea (37.8%) and HK & Macau (35.4%).
0 10020 40 60 80
(%)
Copyright © 2017 JETRO. All rights reserved. Reproduction without permission is prohibited.
Procurement sources for raw materials and parts
(by country/region, responses total 100%)
Manufacturing sectors
only
Note: Country/region for which n 10

60.8 67.3
52.9 56.8
45.2
55.9 49.7
44.6 43.0 45.2 42.4 38.2
27.9 33.2
26.2
42.2
31.4 26.3
30.7 27.7
28.9
23.3 35.4 37.8
29.4 31.5
29.0 29.1
37.9 34.5 50.9
31.3
2.4 2.1
5.0 4.1
12.7
9.2 4.7 5.8
14.3 10.2
10.9 12.9 13.2 11.7
8.0 10.7
4.3 5.2 7.2 4.8 5.3 4.3 3.7 5.2
8.1 8.2 11.3 11.8
5.7 4.4
5.4 4.3 7.1 6.2 6.0 6.8 4.9 7.5 9.6 7.9 9.6 11.6 9.7 8.8 9.2 11.4
0%
10%
20%
30%
40%
50%
60%
70%
80%
90%
100%
2012(n=474)
2017(n=449)
2012(n=417)
2017(n=306)
2012(n=98)
2017(n=132)
2012(n=63)
2017(n=34)
2012(n=109)
2017(n=226)
2012(n=147)
2017(n=113)
2012(n=158)
2017(n=347)
2012(n=60)
2017(n=39)
China Thailand India South Korea Indonesia Malaysia Vietnam Philippines
Local Japan ASEAN China Other
5. Procurement of Raw Materials and Parts (4)
45
Comparing the procurement sources for raw materials and parts in eight major countries in the 2012 survey with those in the 2017 survey, local
procurement rates increased in China, Thailand, India, Indonesia, Vietnam and the Philippines.The rate increased in the Philippines (16.0 pp), India
(10.7 pp), China (6.5 pp), and Vietnam (5.3 pp) in five years.
The rate of procurement from Japan decreased in all countries, except South Korea, Indonesia, and Malaysia.
The procurement rate from China increased in all five countries, excluding India, South Korea and the Philippines. The rate is particularly high in
Vietnam at 11.8%.
Copyright © 2017 JETRO. All rights reserved. Reproduction without permission is prohibited.
Procurement sources of major countries (comparison between the 2012 survey and the 2017 survey)
Manufacturing sectors
only
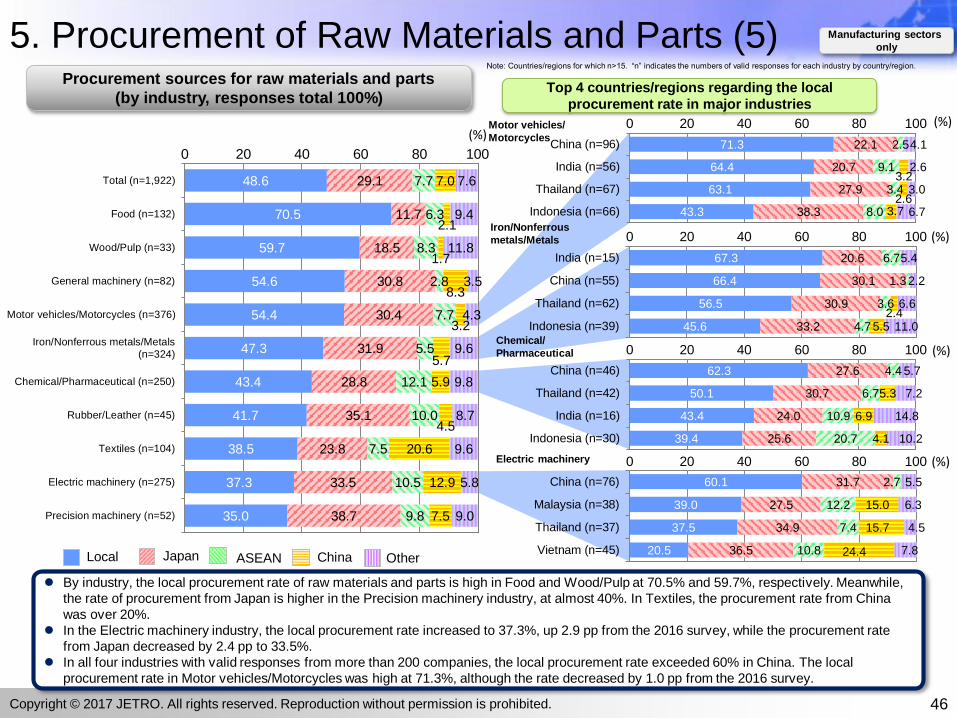
71.3
64.4
63.1
43.3
22.1
20.7
27.9
38.3
2.5
9.1
3.4
8.0
3.2
2.6 3.7
4.1
2.6
3.0
6.7
China (n=96)
India (n=56)
Thailand (n=67)
Indonesia (n=66)
0 20 40 60 80 100 (%)
67.3
66.4
56.5
45.6
20.6
30.1
30.9
33.2
6.7
1.3
3.6
4.7 2.4
5.5
5.4
2.2
6.6
11.0
India (n=15)
China (n=55)
Thailand (n=62)
Indonesia (n=39)
0 20 40 60 80 100 (%)
62.3
50.1
43.4
39.4
27.6
30.7
24.0
25.6
4.4
6.7
10.9
20.7
5.3
6.9
4.1
5.7
7.2
14.8
10.2
China (n=46)
Thailand (n=42)
India (n=16)
Indonesia (n=30)
0 20 40 60 80 100 (%)
60.1
39.0
37.5
20.5
31.7
27.5
34.9
36.5
2.7
12.2
7.4
10.8
15.0
15.7
24.4
5.5
6.3
4.5
7.8
China (n=76)
Malaysia (n=38)
Thailand (n=37)
Vietnam (n=45)
0 20 40 60 80 100 (%)
48.6
70.5
59.7
54.6
54.4
47.3
43.4
41.7
38.5
37.3
35.0
29.1
11.7
18.5
30.8
30.4
31.9
28.8
35.1
23.8
33.5
38.7
7.7
6.3
8.3
2.8
7.7
5.5
12.1
10.0
7.5
10.5
9.8
7.0
2.1
1.7
8.3
3.2
5.7
5.9
4.5
20.6
12.9
7.5
7.6
9.4
11.8
3.5
4.3
9.6
9.8
8.7
9.6
5.8
9.0
Total (n=1,922)
Food (n=132)
Wood/Pulp (n=33)
General machinery (n=82)
Motor vehicles/Motorcycles (n=376)
Iron/Nonferrous metals/Metals(n=324)
Chemical/Pharmaceutical (n=250)
Rubber/Leather (n=45)
Textiles (n=104)
Electric machinery (n=275)
Precision machinery (n=52)
Local Japan ASEAN China Other
5. Procurement of Raw Materials and Parts (5)
46
0 10080604020
(%)
By industry, the local procurement rate of raw materials and parts is high in Food and Wood/Pulp at 70.5% and 59.7%, respectively. Meanwhile,
the rate of procurement from Japan is higher in the Precision machinery industry, at almost 40%. In Textiles, the procurement rate from China
was over 20%.
In the Electric machinery industry, the local procurement rate increased to 37.3%, up 2.9 pp from the 2016 survey, while the procurement rate
from Japan decreased by 2.4 pp to 33.5%.
In all four industries with valid responses from more than 200 companies, the local procurement rate exceeded 60% in China. The local
procurement rate in Motor vehicles/Motorcycles was high at 71.3%, although the rate decreased by 1.0 pp from the 2016 survey.
Copyright © 2017 JETRO. All rights reserved. Reproduction without permission is prohibited.
Procurement sources for raw materials and parts
(by industry, responses total 100%) Top 4 countries/regions regarding the local
procurement rate in major industries
Note: Countries/regions for which n>15. “n” indicates the numbers of valid responses for each industry by country/region.
Manufacturing sectors
only
Motor vehicles/
Motorcycles
Iron/Nonferrous
metals/Metals
Chemical/
Pharmaceutical
Electric machinery
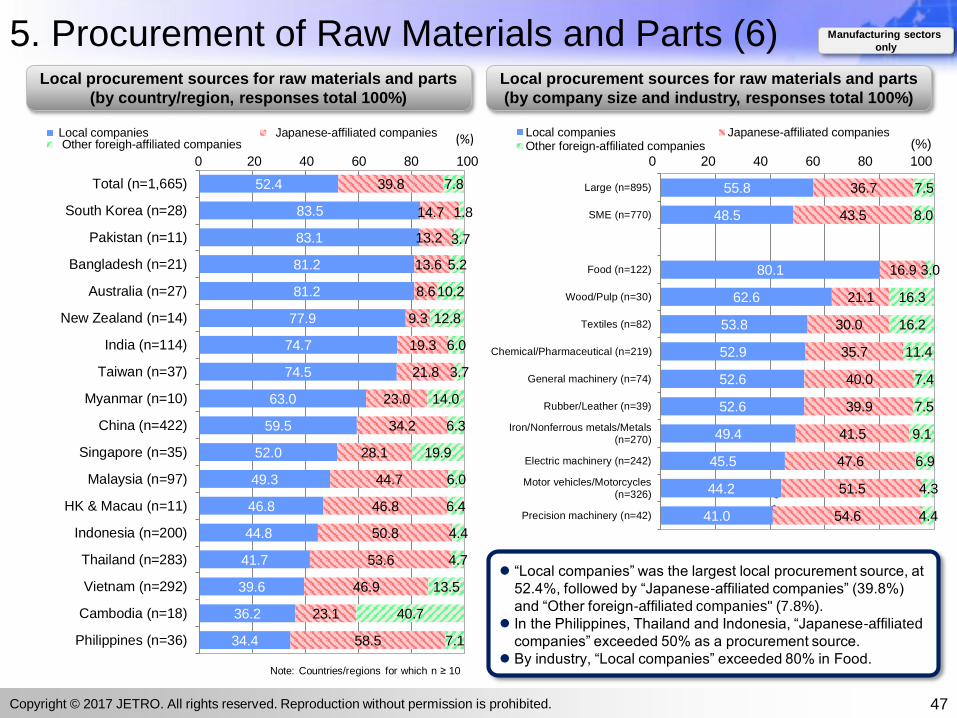
52.4
83.5
83.1
81.2
81.2
77.9
74.7
74.5
63.0
59.5
52.0
49.3
46.8
44.8
41.7
39.6
36.2
34.4
39.8
14.7
13.2
13.6
8.6
9.3
19.3
21.8
23.0
34.2
28.1
44.7
46.8
50.8
53.6
46.9
23.1
58.5
7.8
1.8
3.7
5.2
10.2
12.8
6.0
3.7
14.0
6.3
19.9
6.0
6.4
4.4
4.7
13.5
40.7
7.1
Total (n=1,665)
South Korea (n=28)
Pakistan (n=11)
Bangladesh (n=21)
Australia (n=27)
New Zealand (n=14)
India (n=114)
Taiwan (n=37)
Myanmar (n=10)
China (n=422)
Singapore (n=35)
Malaysia (n=97)
HK & Macau (n=11)
Indonesia (n=200)
Thailand (n=283)
Vietnam (n=292)
Cambodia (n=18)
Philippines (n=36)
Local companies Japanese-affiliated companies Other foreigh-affiliated companies
5. Procurement of Raw Materials and Parts (6)
47
“Local companies” was the largest local procurement source, at
52.4%, followed by “Japanese-affiliated companies” (39.8%)
and “Other foreign-affiliated companies" (7.8%).
In the Philippines, Thailand and Indonesia, “Japanese-affiliated
companies” exceeded 50% as a procurement source.
By industry, “Local companies” exceeded 80% in Food.
0 20 40 60 80 100
(%)
0 20 40 60 80 100
(%)
55.8
48.5
80.1
62.6
53.8
52.9
52.6
52.6
49.4
45.5
44.2
41.0
36.7
43.5
16.9
21.1
30.0
35.7
40.0
39.9
41.5
47.6
51.5
54.6
7.5
8.0
3.0
16.3
16.2
11.4
7.4
7.5
9.1
6.9
4.3
4.4
Large (n=895)
SME (n=770)
Food (n=122)
Wood/Pulp (n=30)
Textiles (n=82)
Chemical/Pharmaceutical (n=219)
General machinery (n=74)
Rubber/Leather (n=39)
Iron/Nonferrous metals/Metals(n=270)
Electric machinery (n=242)
Motor vehicles/Motorcycles(n=326)
Precision machinery (n=42)
Local companies Japanese-affiliated companiesOther foreign-affiliated companies
Copyright © 2017 JETRO. All rights reserved. Reproduction without permission is prohibited.
Local procurement sources for raw materials and parts
(by country/region, responses total 100%)
Local procurement sources for raw materials and parts
(by company size and industry, responses total 100%)
Manufacturing sectors
only
Note: Countries/regions for which n ≥ 10

5. Procurement of Raw Materials and Parts (7)
48
72.8
80.7
79.9
79.0
76.5
73.3
71.8
32.0
0 25 50 75 100
Total (n=1,962)
China (n=451)
India (n=139)
Vietnam (n=357)
Thailand (n=311)
Indonesia (n=228)
Malaysia (n=117)
Singapore (n=50)
22.8
30.2
50.0
41.9
30.0
25.9
18.0
12.2
8.9
0 25 50 75
Total (n=1,962)
ASEAN Average(n=1,161)
Singapore (n=50)
Malaysia (n=117)
Vietnam (n=357)
Indonesia (n=228)
Thailand (n=311)
India (n=139)
China (n=451)
(%)
11.4
18.8
18.0
14.5
11.6
11.2
7.2
0 25
Total (n=1,962)
Malaysia (n=117)
Singapore (n=50)
Indonesia (n=228)
Thailand (n=311)
Vietnam (n=357)
India (n=139)
(%) (%)
83.0
91.7
89.6
82.5
81.4
76.8
70.4
0 25 50 75 100
Total (n=1,408)
India (n=109)
China (n=356)
Thailand (n=234)
Indonesia (n=167)
Vietnam (n=280)
Malaysia (n=81)
(%)
59.6
70.1
69.5
68.2
54.3
51.4
51.4
0 25 50 75 100
Total (n=1,408)
Thailand (n=234)
Indonesia (n=167)
Vietnam (n=280)
Malaysia (n=81)
China (n=356)
India (n=109)
(%)
As a raw material/part
procurement policy in the
future, the largest proportion of
firms at 72.8% responded that
they would raise the local
procurement rate in the
operating country/region.
As local procurement sources
that will become important in
the future for raising the local
procurement rate, “Local
companies” were cited by
83.0% of the firms, while
“Japanese-affiliated firms” was
cited by 59.6%.
13.7
20.0
15.4
14.5
13.2
13.0
12.0
9.3
0 25
Total (n=1,962)
Singapore (n=50)
Vietnam (n=357)
Thailand (n=311)
Indonesia (n=228)
India (n=139)
Malaysia (n=117)
China (n=451)
(%)
Copyright © 2017 JETRO. All rights reserved. Reproduction without permission is prohibited.
Manufacturing sectors
only
Note: Country/region for which n 50
Note: Country/region for which n 50
Future raw materials/parts procurement policy
(by country/region, multiple answers)
Ratio of firms that responded that they
would raise the local procurement
rate in the operating country/region
Ratio of firms that responded that
they would raise the procurement
rate from “ASEAN”
Ratio of firms that responded that
they would raise the procurement
rate from “JAPAN”
Ratio of firms that responded that
they would raise the procurement
rate from “CHINA”
Important local procurement sources to raise the local
procurement rate (by country/region, multiple answers)
Ratio of firms that responded that local companies
are important for raising the local procurement rate
Ratio of firms that responded that Japanese-
affiliated companies are important for raising the
local procurement rate

5. Procurement of Raw Materials and Parts (8)
49
84.8
63.1
20.3
18.7
14.3
9.2
To make costs lower
To shorten lead time
To diversify risks
To improve quality
To speed up after-sales/maintenance services
To follow instructionsby clients
Tariff reduction in linewith FTA
0 20 40 60 100
(%)
80
For firms that responded that they would raise the procurement rate from the local market, ASEAN, and China, the biggest reason was “To make costs
lower.”
The major reasons for raising the local procurement rate were “To make costs lower” (84.8%) and “To shorten lead time” (63.1%).
The major reason for raising the procurement rate from ASEAN was “To make costs lower” (80.7%). “To shorten lead time” (28.5%), “To diversify
risks“ (32.9%), and “To improve quality” (23.0%) also accounted for a certain proportion. The proportion of “To diversify risks” (up 4.7 pp from the previous
year) exceeded that of "To shorten lead time” (down 3.3 pp).
The biggest reason for raising the rate of procurement from Japan was “To improve quality” (63.9%).
80.7
28.5
32.9
23.0
4.1
4.8
14.5
0 20 40 60 100
(%)
80
90.5
12.6
19.4
15.8
0.9
10.4
2.7
0 20 40 60 100
(%)
80
21.7
11.4
25.5
63.9
7.6
26.6
5.7
0 20 40 60 100
(%)
80
(n=1,408) (n=435) (n=222) (n=263)
Not applicable
Copyright © 2017 JETRO. All rights reserved. Reproduction without permission is prohibited.
Manufacturing sectors
only
Reasons for raising future procurement rate for raw materials/parts
(multiple answers)
Reason for raising procurement rate
from local market
Reason for raising procurement rate
from ASEANReason for raising procurement rate
from JapanReason for raising procurement rate
from China
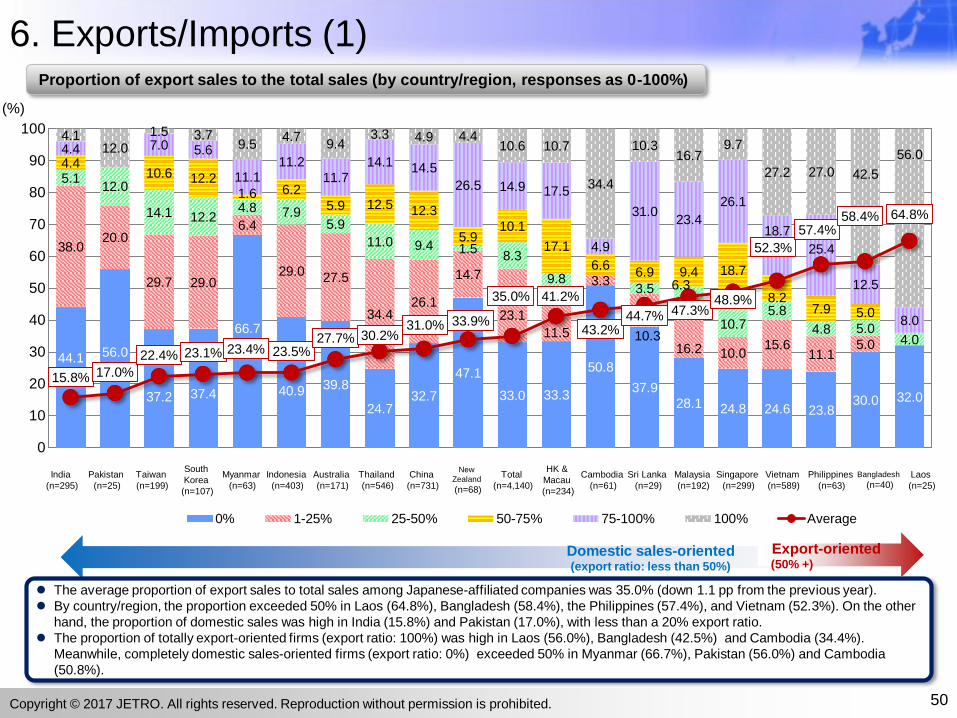
44.1 56.0
37.2 37.4
66.7
40.9 39.8
24.7 32.7
47.1
33.0 33.3
50.8
37.9 28.1 24.8 24.6 23.8
30.0 32.0
38.0 20.0
29.7 29.0
6.4
29.0 27.5
34.4 26.1
14.7
23.1
11.5
3.3
10.3 16.2 10.0
15.6 11.1
5.0
5.1 12.0
14.1 12.2 4.8 7.9
5.9
11.0 9.4 1.5 8.3
9.8 3.5 6.3
10.7 5.8
4.8 5.0 4.0
4.4 10.6 12.2
1.6 6.2
5.9 12.5 12.3
5.9 10.1
17.1
6.6 6.9 9.4 18.7
8.2 7.9 5.0
4.4 7.0 5.6
11.1 11.2
11.7 14.1 14.5
26.5 14.9 17.5
4.9
31.0 23.4
26.1
18.7
25.4
12.5
8.0
4.1 12.0
1.5 3.7 9.5
4.7 9.4
3.3 4.9 4.4 10.6 10.7
34.4
10.3 16.7
9.7
27.2 27.0 42.5
56.0
15.8% 17.0%
22.4% 23.1% 23.4% 23.5%27.7% 30.2%
31.0% 33.9%
35.0% 41.2%
43.2%44.7% 47.3%
48.9%
52.3%
57.4%58.4% 64.8%
0% 1-25% 25-50% 50-75% 75-100% 100% Average
Domestic sales-oriented(export ratio: less than 50%)
6. Exports/Imports (1)
0
100
90
80
70
60
50
40
30
10
20
(%)
India
(n=295)
Pakistan
(n=25)
Taiwan
(n=199)
South
Korea
(n=107)
Myanmar
(n=63)
Indonesia
(n=403)
Australia
(n=171)
Thailand
(n=546)
China
(n=731)
New
Zealand
(n=68)
Total
(n=4,140)
HK &
Macau
(n=234)
Cambodia
(n=61)
Sri Lanka
(n=29)
Malaysia
(n=192)
Singapore
(n=299)
Vietnam
(n=589)
Philippines
(n=63)
Bangladesh
(n=40) Laos
(n=25)
The average proportion of export sales to total sales among Japanese-affiliated companies was 35.0% (down 1.1 pp from the previous year).
By country/region, the proportion exceeded 50% in Laos (64.8%), Bangladesh (58.4%), the Philippines (57.4%), and Vietnam (52.3%). On the other
hand, the proportion of domestic sales was high in India (15.8%) and Pakistan (17.0%), with less than a 20% export ratio.
The proportion of totally export-oriented firms (export ratio: 100%) was high in Laos (56.0%), Bangladesh (42.5%) and Cambodia (34.4%).
Meanwhile, completely domestic sales-oriented firms (export ratio: 0%) exceeded 50% in Myanmar (66.7%), Pakistan (56.0%) and Cambodia
(50.8%).
50Copyright © 2017 JETRO. All rights reserved. Reproduction without permission is prohibited.
Proportion of export sales to the total sales (by country/region, responses as 0-100%)
Export-oriented(50% +)
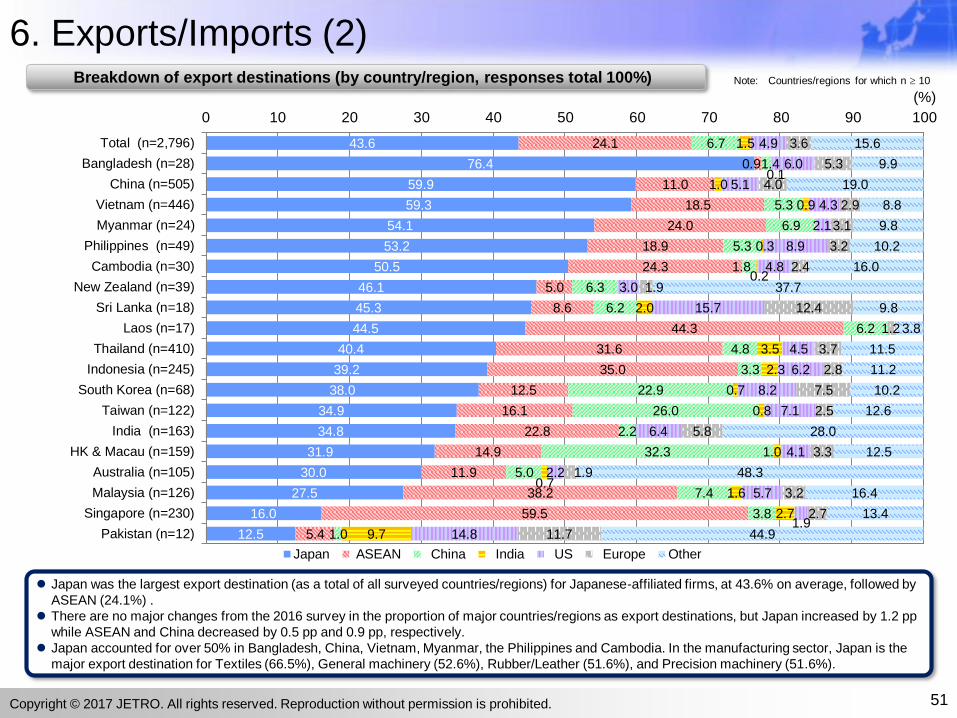
43.6
76.4
59.9
59.3
54.1
53.2
50.5
46.1
45.3
44.5
40.4
39.2
38.0
34.9
34.8
31.9
30.0
27.5
16.0
12.5
24.1
0.9
11.0
18.5
24.0
18.9
24.3
5.0
8.6
44.3
31.6
35.0
12.5
16.1
22.8
14.9
11.9
38.2
59.5
5.4
6.7
1.4
5.3
6.9
5.3
1.8
6.3
6.2
6.2
4.8
3.3
22.9
26.0
2.2
32.3
5.0
7.4
3.8
1.0
1.5
0.1 1.0
0.9
0.3
0.2
2.0
3.5
2.3
0.7
0.8
1.0
0.7 1.6
2.7
9.7
4.9
6.0
5.1
4.3
2.1
8.9
4.8
3.0
15.7
4.5
6.2
8.2
7.1
6.4
4.1
2.2
5.7
1.9 14.8
3.6
5.3
4.0
2.9
3.1
3.2
2.4
1.9
12.4
1.2
3.7
2.8
7.5
2.5
5.8
3.3
1.9
3.2
2.7
11.7
15.6
9.9
19.0
8.8
9.8
10.2
16.0
37.7
9.8
3.8
11.5
11.2
10.2
12.6
28.0
12.5
48.3
16.4
13.4
44.9
Total (n=2,796)
Bangladesh (n=28)
China (n=505)
Vietnam (n=446)
Myanmar (n=24)
Philippines (n=49)
Cambodia (n=30)
New Zealand (n=39)
Sri Lanka (n=18)
Laos (n=17)
Thailand (n=410)
Indonesia (n=245)
South Korea (n=68)
Taiwan (n=122)
India (n=163)
HK & Macau (n=159)
Australia (n=105)
Malaysia (n=126)
Singapore (n=230)
Pakistan (n=12)
Japan ASEAN China India US Europe Other
6. Exports/Imports (2)
0 10 20 30 40 50 60 70 80 90 100
(%)
Japan was the largest export destination (as a total of all surveyed countries/regions) for Japanese-affiliated firms, at 43.6% on average, followed by
ASEAN (24.1%) .
There are no major changes from the 2016 survey in the proportion of major countries/regions as export destinations, but Japan increased by 1.2 pp
while ASEAN and China decreased by 0.5 pp and 0.9 pp, respectively.
Japan accounted for over 50% in Bangladesh, China, Vietnam, Myanmar, the Philippines and Cambodia. In the manufacturing sector, Japan is the
major export destination for Textiles (66.5%), General machinery (52.6%), Rubber/Leather (51.6%), and Precision machinery (51.6%).
51Copyright © 2017 JETRO. All rights reserved. Reproduction without permission is prohibited.
Breakdown of export destinations (by country/region, responses total 100%) Note: Countries/regions for which n 10
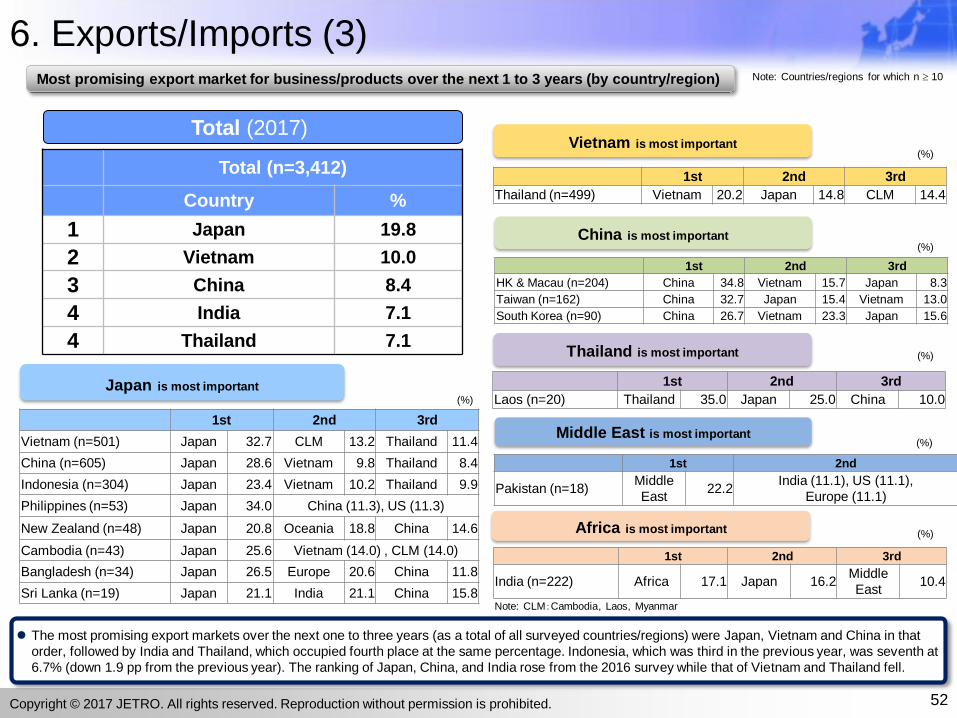
6. Exports/Imports (3)
Total (2017)
Total (n=3,412)
Country %
1 Japan 19.8
2 Vietnam 10.0
3 China 8.4
4 India 7.1
4 Thailand 7.1
Note: CLM:Cambodia, Laos, Myanmar
52
Japan is most important
Vietnam is most important
Thailand is most important
1st 2nd 3rd
Vietnam (n=501) Japan 32.7 CLM 13.2 Thailand 11.4
China (n=605) Japan 28.6 Vietnam 9.8 Thailand 8.4
Indonesia (n=304) Japan 23.4 Vietnam 10.2 Thailand 9.9
Philippines (n=53) Japan 34.0 China (11.3), US (11.3)
New Zealand (n=48) Japan 20.8 Oceania 18.8 China 14.6
Cambodia (n=43) Japan 25.6 Vietnam (14.0) , CLM (14.0)
Bangladesh (n=34) Japan 26.5 Europe 20.6 China 11.8
Sri Lanka (n=19) Japan 21.1 India 21.1 China 15.8
China is most important
1st 2nd 3rd
HK & Macau (n=204) China 34.8 Vietnam 15.7 Japan 8.3
Taiwan (n=162) China 32.7 Japan 15.4 Vietnam 13.0
South Korea (n=90) China 26.7 Vietnam 23.3 Japan 15.6
1st 2nd 3rd
Laos (n=20) Thailand 35.0 Japan 25.0 China 10.0
1st 2nd 3rd
Thailand (n=499) Vietnam 20.2 Japan 14.8 CLM 14.4
Middle East is most important
1st 2nd
Pakistan (n=18) Middle
East22.2
India (11.1), US (11.1),
Europe (11.1)
1st 2nd 3rd
India (n=222) Africa 17.1 Japan 16.2Middle
East10.4
Africa is most important
(%)
(%)
(%)
(%)
(%)
(%)
The most promising export markets over the next one to three years (as a total of all surveyed countries/regions) were Japan, Vietnam and China in that
order, followed by India and Thailand, which occupied fourth place at the same percentage. Indonesia, which was third in the previous year, was seventh at
6.7% (down 1.9 pp from the previous year). The ranking of Japan, China, and India rose from the 2016 survey while that of Vietnam and Thailand fell.
Copyright © 2017 JETRO. All rights reserved. Reproduction without permission is prohibited.
Most promising export market for business/products over the next 1 to 3 years (by country/region) Note: Countries/regions for which n 10
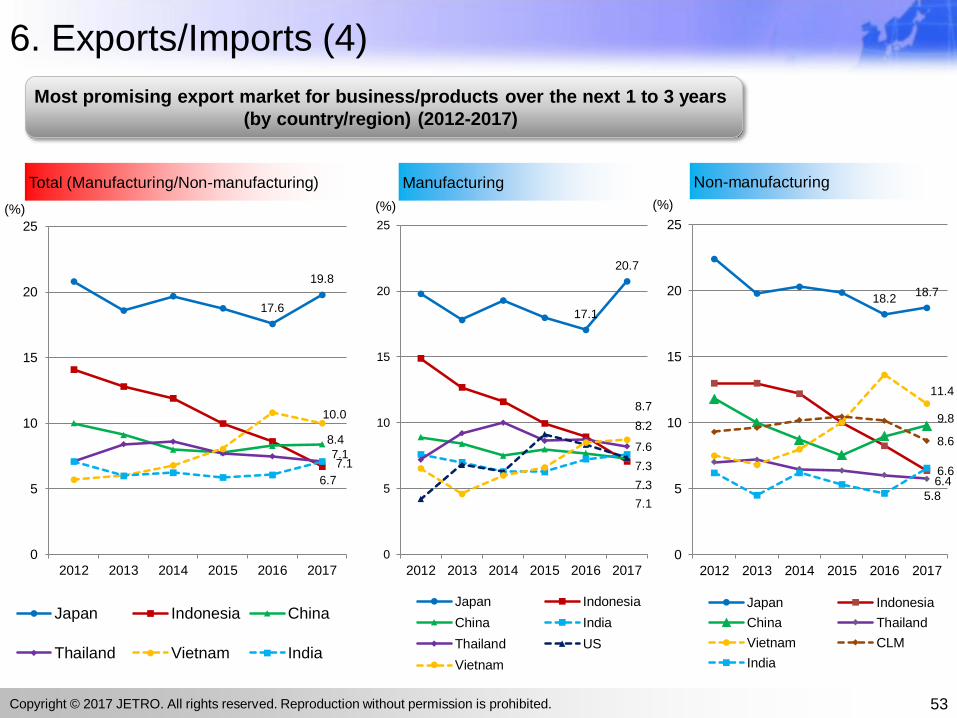
6. Exports/Imports (4)
53
17.6
19.8
6.7
8.4
7.1
10.0
7.1
0
5
10
15
20
25
2012 2013 2014 2015 2016 2017
Japan Indonesia China
Thailand Vietnam India
Total (Manufacturing/Non-manufacturing)
(%)
17.1
20.7
7.1
7.3
7.6
8.2
7.3
8.7
0
5
10
15
20
25
2012 2013 2014 2015 2016 2017
Japan Indonesia
China India
Thailand US
Vietnam
18.2 18.7
6.4
9.8
5.8
11.4
8.6
6.6
0
5
10
15
20
25
2012 2013 2014 2015 2016 2017
Japan Indonesia
China Thailand
Vietnam CLM
India
Non-manufacturingManufacturing
(%) (%)
Copyright © 2017 JETRO. All rights reserved. Reproduction without permission is prohibited.
Most promising export market for business/products over the next 1 to 3 years
(by country/region) (2012-2017)
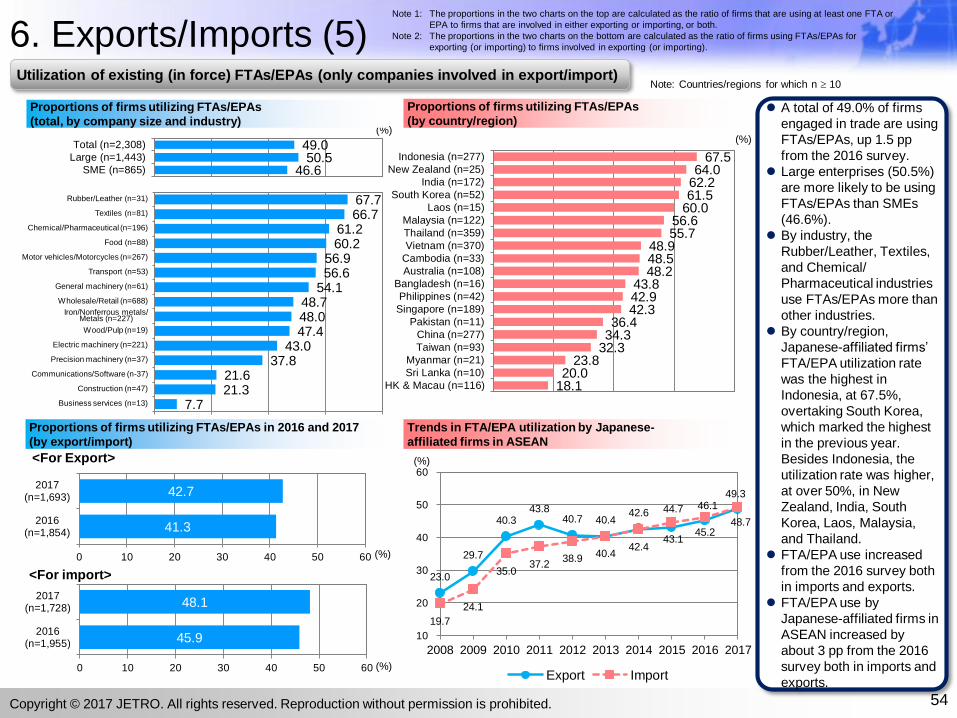
6. Exports/Imports (5)
A total of 49.0% of firms
engaged in trade are using
FTAs/EPAs, up 1.5 pp
from the 2016 survey.
Large enterprises (50.5%)
are more likely to be using
FTAs/EPAs than SMEs
(46.6%).
By industry, the
Rubber/Leather, Textiles,
and Chemical/
Pharmaceutical industries
use FTAs/EPAs more than
other industries.
By country/region,
Japanese-affiliated firms’
FTA/EPA utilization rate
was the highest in
Indonesia, at 67.5%,
overtaking South Korea,
which marked the highest
in the previous year.
Besides Indonesia, the
utilization rate was higher,
at over 50%, in New
Zealand, India, South
Korea, Laos, Malaysia,
and Thailand.
FTA/EPA use increased
from the 2016 survey both
in imports and exports.
FTA/EPA use by
Japanese-affiliated firms in
ASEAN increased by
about 3 pp from the 2016
survey both in imports and
exports.
7.7 21.3 21.6
37.8 43.0
47.4 48.0 48.7
54.1 56.6 56.9
60.2 61.2
66.7 67.7
0 20 40 60 80
Business services (n=13)
Construction (n=47)
Communications/Software (n-37)
Precision machinery (n=37)
Electric machinery (n=221)
Wood/Pulp (n=19)
Iron/Nonferrous metals/Metals (n=227)
Wholesale/Retail (n=688)
General machinery (n=61)
Transport (n=53)
Motor vehicles/Motorcycles (n=267)
Food (n=88)
Chemical/Pharmaceutical (n=196)
Textiles (n=81)
Rubber/Leather (n=31)
67.5 64.0
62.2 61.5
60.0 56.6 55.7
48.9 48.5 48.2
43.8 42.9 42.3
36.4 34.3
32.3 23.8
20.0 18.1
Indonesia (n=277)
New Zealand (n=25)
India (n=172)
South Korea (n=52)
Laos (n=15)
Malaysia (n=122)
Thailand (n=359)
Vietnam (n=370)
Cambodia (n=33)
Australia (n=108)
Bangladesh (n=16)
Philippines (n=42)
Singapore (n=189)
Pakistan (n=11)
China (n=277)
Taiwan (n=93)
Myanmar (n=21)
Sri Lanka (n=10)
HK & Macau (n=116)
23.0
29.7
40.343.8
40.7 40.442.6
43.145.2
48.7
19.7
24.1
35.037.2
38.9 40.442.4
44.7 46.149.3
10
20
30
40
50
60
2008 2009 2010 2011 2012 2013 2014 2015 2016 2017
Export Import
46.6 50.5
49.0
SME (n=865)
Large (n=1,443)
Total (n=2,308)
41.3
42.7
0 10 20 30 40 50 60
2016(n=1,854)
2017(n=1,693)
45.9
48.1
0 10 20 30 40 50 60
2016(n=1,955)
2017(n=1,728)
(%)
(%)
(%)
54
(%)
(%)
Copyright © 2017 JETRO. All rights reserved. Reproduction without permission is prohibited.
Note 1: The proportions in the two charts on the top are calculated as the ratio of firms that are using at least one FTA or
EPA to firms that are involved in either exporting or importing, or both.
Note 2: The proportions in the two charts on the bottom are calculated as the ratio of firms using FTAs/EPAs for
exporting (or importing) to firms involved in exporting (or importing).
Utilization of existing (in force) FTAs/EPAs (only companies involved in export/import)
Proportions of firms utilizing FTAs/EPAs
(total, by company size and industry)
Proportions of firms utilizing FTAs/EPAs
(by country/region)
Note: Countries/regions for which n 10
Proportions of firms utilizing FTAs/EPAs in 2016 and 2017
(by export/import)
Trends in FTA/EPA utilization by Japanese-
affiliated firms in ASEAN
<For Export>
<For import>
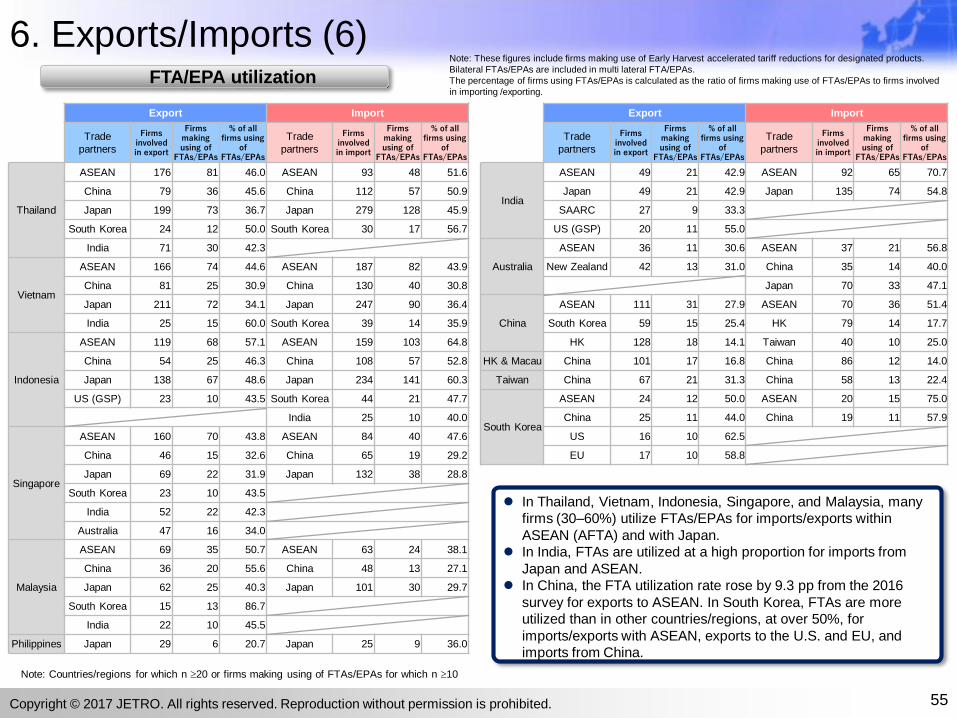
6. Exports/Imports (6)
In Thailand, Vietnam, Indonesia, Singapore, and Malaysia, many
firms (30–60%) utilize FTAs/EPAs for imports/exports within
ASEAN (AFTA) and with Japan.
In India, FTAs are utilized at a high proportion for imports from
Japan and ASEAN.
In China, the FTA utilization rate rose by 9.3 pp from the 2016
survey for exports to ASEAN. In South Korea, FTAs are more
utilized than in other countries/regions, at over 50%, for
imports/exports with ASEAN, exports to the U.S. and EU, and
imports from China.
55
Export Import
Trade
partners
Firms involved in export
Firms making using of
FTAs/EPAs
% of all firms using
of FTAs/EPAs
Trade
partners
Firms involved in import
Firms making using of
FTAs/EPAs
% of all firms using
of FTAs/EPAs
Thailand
ASEAN 176 81 46.0 ASEAN 93 48 51.6
China 79 36 45.6 China 112 57 50.9
Japan 199 73 36.7 Japan 279 128 45.9
South Korea 24 12 50.0 South Korea 30 17 56.7
India 71 30 42.3
Vietnam
ASEAN 166 74 44.6 ASEAN 187 82 43.9
China 81 25 30.9 China 130 40 30.8
Japan 211 72 34.1 Japan 247 90 36.4
India 25 15 60.0 South Korea 39 14 35.9
Indonesia
ASEAN 119 68 57.1 ASEAN 159 103 64.8
China 54 25 46.3 China 108 57 52.8
Japan 138 67 48.6 Japan 234 141 60.3
US (GSP) 23 10 43.5 South Korea 44 21 47.7
India 25 10 40.0
Singapore
ASEAN 160 70 43.8 ASEAN 84 40 47.6
China 46 15 32.6 China 65 19 29.2
Japan 69 22 31.9 Japan 132 38 28.8
South Korea 23 10 43.5
India 52 22 42.3
Australia 47 16 34.0
Malaysia
ASEAN 69 35 50.7 ASEAN 63 24 38.1
China 36 20 55.6 China 48 13 27.1
Japan 62 25 40.3 Japan 101 30 29.7
South Korea 15 13 86.7
India 22 10 45.5
Philippines Japan 29 6 20.7 Japan 25 9 36.0
Export Import
Trade
partners
Firms involved in export
Firms making using of
FTAs/EPAs
% of all firms using
of FTAs/EPAs
Trade
partners
Firms involved in import
Firms making using of
FTAs/EPAs
% of all firms using
of FTAs/EPAs
India
ASEAN 49 21 42.9 ASEAN 92 65 70.7
Japan 49 21 42.9 Japan 135 74 54.8
SAARC 27 9 33.3
US (GSP) 20 11 55.0
Australia
ASEAN 36 11 30.6 ASEAN 37 21 56.8
New Zealand 42 13 31.0 China 35 14 40.0
Japan 70 33 47.1
China
ASEAN 111 31 27.9 ASEAN 70 36 51.4
South Korea 59 15 25.4 HK 79 14 17.7
HK 128 18 14.1 Taiwan 40 10 25.0
HK & Macau China 101 17 16.8 China 86 12 14.0
Taiwan China 67 21 31.3 China 58 13 22.4
South Korea
ASEAN 24 12 50.0 ASEAN 20 15 75.0
China 25 11 44.0 China 19 11 57.9
US 16 10 62.5
EU 17 10 58.8
Copyright © 2017 JETRO. All rights reserved. Reproduction without permission is prohibited.
FTA/EPA utilization
Note: These figures include firms making use of Early Harvest accelerated tariff reductions for designated products.
Bilateral FTAs/EPAs are included in multi lateral FTA/EPAs.
The percentage of firms using FTAs/EPAs is calculated as the ratio of firms making use of FTAs/EPAs to firms involved
in importing /exporting.
Note: Countries/regions for which n 20 or firms making using of FTAs/EPAs for which n 10
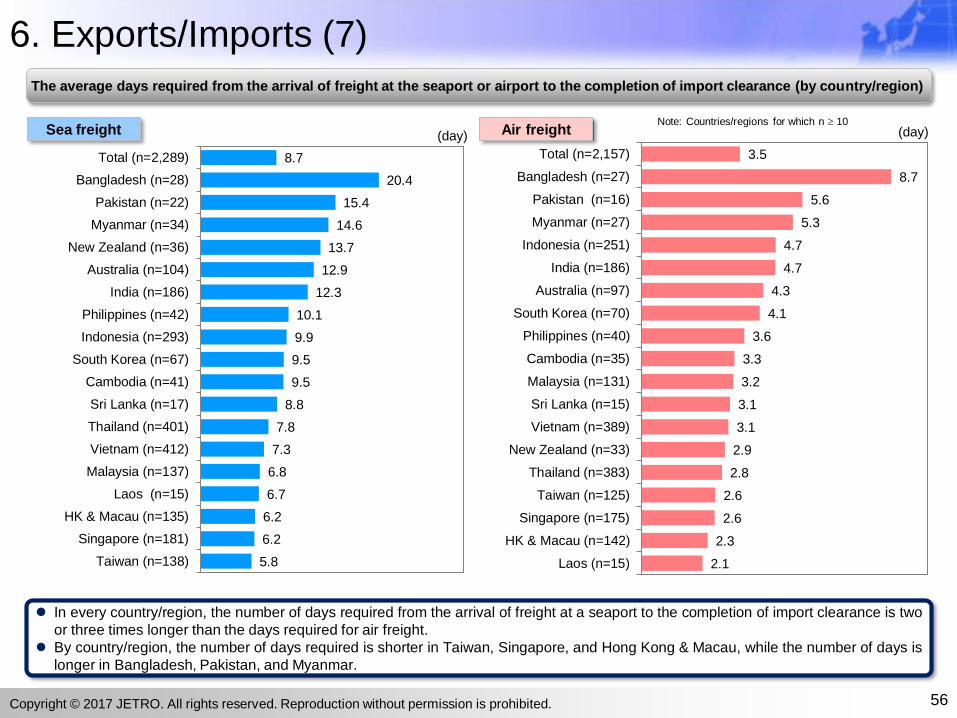
6. Exports/Imports (7)
In every country/region, the number of days required from the arrival of freight at a seaport to the completion of import clearance is two
or three times longer than the days required for air freight.
By country/region, the number of days required is shorter in Taiwan, Singapore, and Hong Kong & Macau, while the number of days is
longer in Bangladesh, Pakistan, and Myanmar.
The average days required from the arrival of freight at the seaport or airport to the completion of import clearance (by country/region)
8.7
20.4
15.4
14.6
13.7
12.9
12.3
10.1
9.9
9.5
9.5
8.8
7.8
7.3
6.8
6.7
6.2
6.2
5.8
Total (n=2,289)
Bangladesh (n=28)
Pakistan (n=22)
Myanmar (n=34)
New Zealand (n=36)
Australia (n=104)
India (n=186)
Philippines (n=42)
Indonesia (n=293)
South Korea (n=67)
Cambodia (n=41)
Sri Lanka (n=17)
Thailand (n=401)
Vietnam (n=412)
Malaysia (n=137)
Laos (n=15)
HK & Macau (n=135)
Singapore (n=181)
Taiwan (n=138)
(day)
56
3.5
8.7
5.6
5.3
4.7
4.7
4.3
4.1
3.6
3.3
3.2
3.1
3.1
2.9
2.8
2.6
2.6
2.3
2.1
Total (n=2,157)
Bangladesh (n=27)
Pakistan (n=16)
Myanmar (n=27)
Indonesia (n=251)
India (n=186)
Australia (n=97)
South Korea (n=70)
Philippines (n=40)
Cambodia (n=35)
Malaysia (n=131)
Sri Lanka (n=15)
Vietnam (n=389)
New Zealand (n=33)
Thailand (n=383)
Taiwan (n=125)
Singapore (n=175)
HK & Macau (n=142)
Laos (n=15)
(day) Sea freight Air freight
Copyright © 2017 JETRO. All rights reserved. Reproduction without permission is prohibited.
Note: Countries/regions for which n 10
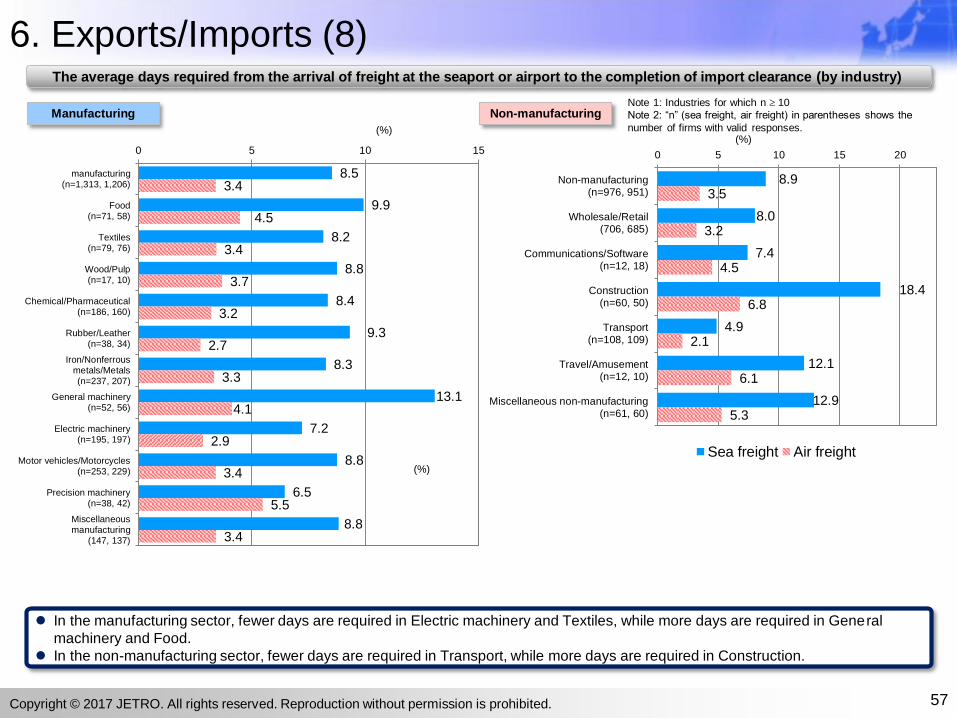
8.9
8.0
7.4
18.4
4.9
12.1
12.9
3.5
3.2
4.5
6.8
2.1
6.1
5.3
0 5 10 15 20
Non-manufacturing(n=976, 951)
Wholesale/Retail(706, 685)
Communications/Software(n=12, 18)
Construction(n=60, 50)
Transport(n=108, 109)
Travel/Amusement(n=12, 10)
Miscellaneous non-manufacturing(n=61, 60)
Sea freight Air freight
6. Exports/Imports (8)
In the manufacturing sector, fewer days are required in Electric machinery and Textiles, while more days are required in General
machinery and Food.
In the non-manufacturing sector, fewer days are required in Transport, while more days are required in Construction.
The average days required from the arrival of freight at the seaport or airport to the completion of import clearance (by industry)
Note 1: Industries for which n 10
Note 2: “n” (sea freight, air freight) in parentheses shows the
number of firms with valid responses.
(%)
(%)
57
(%)
8.5
9.9
8.2
8.8
8.4
9.3
8.3
13.1
7.2
8.8
6.5
8.8
3.4
4.5
3.4
3.7
3.2
2.7
3.3
4.1
2.9
3.4
5.5
3.4
0 5 10 15
manufacturing(n=1,313, 1,206)
Food(n=71, 58)
Textiles(n=79, 76)
Wood/Pulp(n=17, 10)
Chemical/Pharmaceutical(n=186, 160)
Rubber/Leather(n=38, 34)
Iron/Nonferrousmetals/Metals(n=237, 207)
General machinery(n=52, 56)
Electric machinery(n=195, 197)
Motor vehicles/Motorcycles(n=253, 229)
Precision machinery(n=38, 42)
Miscellaneousmanufacturing
(147, 137)
Manufacturing Non-manufacturing
Copyright © 2017 JETRO. All rights reserved. Reproduction without permission is prohibited.
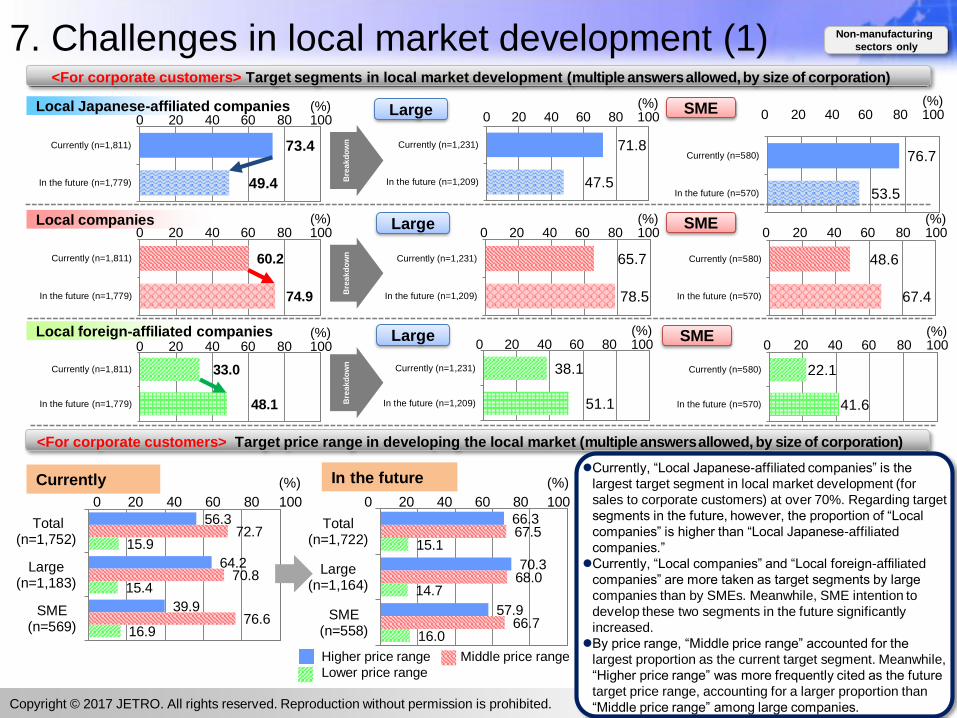
74.9
60.2
In the future (n=1,779)
Currently (n=1,811)
49.4
73.4
In the future (n=1,779)
Currently (n=1,811)
22.1
41.6
Currently (n=580)
In the future (n=570)
38.1
51.1
Currently (n=1,231)
In the future (n=1,209)
48.6
67.4
Currently (n=580)
In the future (n=570)
65.7
78.5
Currently (n=1,231)
In the future (n=1,209)
71.8
47.5
Currently (n=1,231)
In the future (n=1,209)
76.7
53.5
Currently (n=580)
In the future (n=570)
7. Challenges in local market development (1)
58
<For corporate customers> Target segments in local market development (multiple answersallowed, by size of corporation)
Local companies
Local foreign-affiliated companies
SMELarge
48.1
33.0
In the future (n=1,779)
Currently (n=1,811)
Local Japanese-affiliated companies0 20 40 60 80 100
(%)
<For corporate customers> Target price range in developing the local market (multiple answersallowed, by size of corporation)
0 20 40 60 80 100(%)
0 20 40 60 80 100(%)
0 20 40 60 80 100(%)
0 20 40 60 80 100(%)
0 20 40 60 80 100(%)
0 20 40 60 80 100(%)
0 20 40 60 80 100(%)
0 20 40 60 80 100(%)
56.3
64.2
39.9
72.7
70.8
76.6
15.9
15.4
16.9
Total(n=1,752)
Large(n=1,183)
SME(n=569)
0 20 40 60 80 100
(%) Currently
66.3
70.3
57.9
67.5
68.0
66.7
15.1
14.7
16.0
Total(n=1,722)
Large(n=1,164)
SME(n=558)
0 20 40 60 80 100
(%)
Higher price range Middle price range
Lower price range
Bre
ak
do
wn
In the futureCurrently, “Local Japanese-affiliated companies” is the
largest target segment in local market development (for
sales to corporate customers) at over 70%. Regarding target
segments in the future, however, the proportion of “Local
companies” is higher than “Local Japanese-affiliated
companies.”
Currently, “Local companies” and “Local foreign-affiliated
companies” are more taken as target segments by large
companies than by SMEs. Meanwhile, SME intention to
develop these two segments in the future significantly
increased.
By price range, “Middle price range” accounted for the
largest proportion as the current target segment. Meanwhile,
“Higher price range” was more frequently cited as the future
target price range, accounting for a larger proportion than
“Middle price range” among large companies.Copyright © 2017 JETRO. All rights reserved. Reproduction without permission is prohibited.
Large
Large SME
SME
Non-manufacturing
sectors only
Bre
ak
do
wn
Bre
ak
do
wn
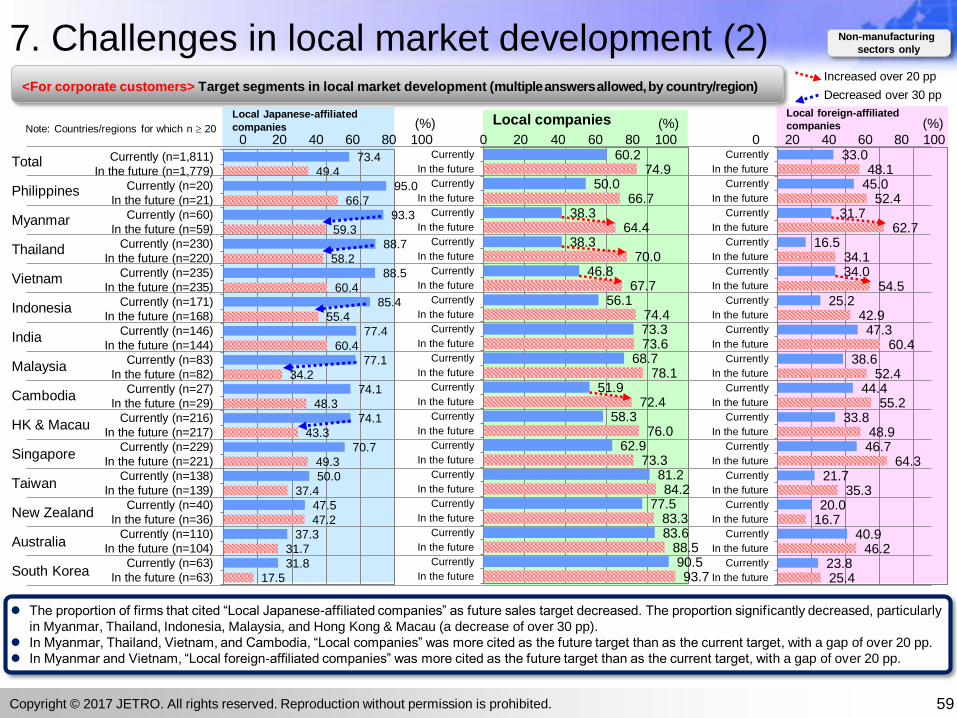
Local Japanese-affiliated
companies
Local foreign-affiliated
companiesLocal companies
73.4
49.4
95.0
66.7
93.3
59.3
88.7
58.2
88.5
60.4
85.4
55.4
77.4
60.4
77.1
34.2
74.1
48.3
74.1
43.3
70.7
49.3
50.0
37.4
47.5
47.2
37.3
31.7
31.8
17.5
Currently (n=1,811)
In the future (n=1,779)
Currently (n=20)
In the future (n=21)
Currently (n=60)
In the future (n=59)
Currently (n=230)
In the future (n=220)
Currently (n=235)
In the future (n=235)
Currently (n=171)
In the future (n=168)
Currently (n=146)
In the future (n=144)
Currently (n=83)
In the future (n=82)
Currently (n=27)
In the future (n=29)
Currently (n=216)
In the future (n=217)
Currently (n=229)
In the future (n=221)
Currently (n=138)
In the future (n=139)
Currently (n=40)
In the future (n=36)
Currently (n=110)
In the future (n=104)
Currently (n=63)
In the future (n=63)
7. Challenges in local market development (2)
59
0 20 40 60 80 1000 20 40 60 80 100
(%)
0 20 40 60 80 100
<For corporate customers> Target segments in local market development (multipleanswersallowed, by country/region)
Total
Philippines
Myanmar
Thailand
Vietnam
Indonesia
India
Malaysia
Cambodia
HK & Macau
Singapore
Taiwan
New Zealand
Australia
South Korea
The proportion of firms that cited “Local Japanese-affiliated companies” as future sales target decreased. The proportion significantly decreased, particularly
in Myanmar, Thailand, Indonesia, Malaysia, and Hong Kong & Macau (a decrease of over 30 pp).
In Myanmar, Thailand, Vietnam, and Cambodia, “Local companies” was more cited as the future target than as the current target, with a gap of over 20 pp.
In Myanmar and Vietnam, “Local foreign-affiliated companies” was more cited as the future target than as the current target, with a gap of over 20 pp.
Increased over 20 pp
Decreased over 30 pp
(%)
60.2 74.9
50.0 66.7
38.3 64.4
38.3 70.0
46.8 67.7
56.1 74.4 73.3 73.6
68.7 78.1
51.9 72.4
58.3 76.0
62.9 73.3
81.2 84.2
77.5 83.3 83.6
88.5 90.5 93.7
Currently
In the future
Currently
In the future
Currently
In the future
Currently
In the future
Currently
In the future
Currently
In the future
Currently
In the future
Currently
In the future
Currently
In the future
Currently
In the future
Currently
In the future
Currently
In the future
Currently
In the future
Currently
In the future
Currently
In the future
33.0 48.1
45.0 52.4
31.7 62.7
16.5 34.1 34.0
54.5 25.2
42.9 47.3
60.4 38.6
52.4 44.4
55.2 33.8
48.9 46.7
64.3 21.7
35.3 20.0
16.7 40.9
46.2 23.8 25.4
Currently
In the future
Currently
In the future
Currently
In the future
Currently
In the future
Currently
In the future
Currently
In the future
Currently
In the future
Currently
In the future
Currently
In the future
Currently
In the future
Currently
In the future
Currently
In the future
Currently
In the future
Currently
In the future
Currently
In the future
(%)
Copyright © 2017 JETRO. All rights reserved. Reproduction without permission is prohibited.
Non-manufacturing
sectors only
Note: Countries/regions for which n 20

7. Challenges in local market development (3)
60
Local foreign-affiliated
companies
0 20 40 60 80 100
Local companiesLocal Japanese-affiliated
companies
0 20 40 60 80 100
(%)
0 20 40 60 80 100
73.4
49.4
92.9
67.7
88.8
52.2
80.4
48.9
77.6
53.4
77.0
58.1
70.4
46.7
65.9
42.9
40.0
35.7
Currently (n=1,811)
In the future (n=1,779)
Currently (n=99)
In the future (n=99)
Currently (n=205)
In the future (n=203)
Currently (n=46)
In the future (n=45)
Currently (n=147)
In the future (n=146)
Currently (n=87)
In the future (n=86)
Currently (n=125)
In the future (n=120)
Currently (n=833)
In the future (n=815)
Currently (n=15)
In the future (n=14)
60.2
74.9
26.3
48.5
43.9
64.0
54.4
66.7
43.5
69.9
46.0
73.3
72.0
75.8
73.2
84.4
80.0
78.6
Currently
In the future
Currently
In the future
Currently
In the future
Currently
In the future
Currently
In the future
Currently
In the future
Currently
In the future
Currently
In the future
Currently
In the future
<For corporate customers> Target segments in local market development (multipleanswersallowed, by industry)
Total
Business services
Transport
Travel/Amusement
Construction
Communications/
Software
Finance/Insurance
Wholesale/Retail
Restaurant
(%) (%)
33.0
48.1
30.3
52.5
34.6
56.2
23.9
37.8
28.6
50.7
36.8
58.1
44.0
55.8
32.7
45.0
0.0
28.6
Currently
In the future
Currently
In the future
Currently
In the future
Currently
In the future
Currently
In the future
Currently
In the future
Currently
In the future
Currently
In the future
Currently
In the future
Copyright © 2017 JETRO. All rights reserved. Reproduction without permission is prohibited.
Non-manufacturing
sectors only
Increased over 20 pp
Decreased over 30 pp

Foreign residents
23.3
20.3
21.5
20.8
26.8
19.1
Currently
In the future
Currently
In the future
Currently
In the future
Lower price rangeMiddle price rangeTarget price range Higher price range
Lower classMiddle income classTarget customers Upper class
7. Challenges in local market development (4)
61
<For individual consumers> Target segments in local market development and price range (multiple answersallowed, by company size)
55.1
67.3
59.5
67.4
46.4
67.2
Currently (n=713)
In the future (n=716)
Currently (n=474)
In the future (n=475)
Currently (n=239)
In the future (n=241)
79.4
77.0
82.1
79.6
74.1
71.8
Currently
In the future
Currently
In the future
Currently
In the future
15.9
20.1
17.3
22.3
13.0
15.8
Currently
In the future
Currently
In the future
Currently
In the future
54.0
68.2
60.5
70.4
41.1
64.0
Currently (n=697)
In the future (n=705)
Currently (n=461)
In the future (n=469)
Currently (n=236)
In the future (n=236)
72.2
66.1
71.2
67.2
74.2
64.0
Currently
In the future
Currently
In the future
Currently
In the future
17.4
17.6
18.2
19.2
15.7
14.4
Currently
In the future
Currently
In the future
Currently
In the future
Total
Large
SME
Total
Large
SME
0 20 40 60 80 100 0 20 40 60 80 100
0 20 40 60 80 100 0 20 40 60 80 100 0 20 40 60 80 100
Over 70% of firms target “Middle income class” for sales to individual consumers, both currently and in the future. The proportion of "Upper class" is significantly
increasing as the future target. In particular, "Upper class" was more cited by SMEs as a future target than as a current target, with a gap of 20.8 pp. Meanwhile,
large companies seem to intend to strengthen sales to “Lower class.”
Regarding the targeted price range, “Middle price range” accounted for the largest proportion. However both large companies and SMEs are more likely to
strengthen “Higher price range” in the future.
(%) (%)
(%) (%) (%)
0 20 40 60 80 100
(%) (%)
Copyright © 2017 JETRO. All rights reserved. Reproduction without permission is prohibited.
Non-manufacturing
sectors only
0 20 40 60 80 100

Foreign residentsLower class
23.3
20.3
17.7
21.2
27.4
25.8
23.1
25.9
16.9
12.5
27.9
25.4
20.3
20.3
42.9
33.3
14.3
15.4
47.8
34.8
22.6
12.9
23.2
17.7
15.0
10.5
23.3
15.7
Currently
In the future
Currently
In the future
Currently
In the future
Currently
In the future
Currently
In the future
Currently
In the future
Currently
In the future
Currently
In the future
Currently
In the future
Currently
In the future
Currently
In the future
Currently
In the future
Currently
In the future
Currently
In the future
15.9
20.1
15.7
19.2
19.1
19.1
19.2
14.8
18.5
17.2
16.2
29.9
18.6
20.3
19.1
20.8
7.9
26.2
13.0
13.0
22.6
22.6
7.3
12.7
30.0
21.1
18.6
21.7
Currently
In the future
Currently
In the future
Currently
In the future
Currently
In the future
Currently
In the future
Currently
In the future
Currently
In the future
Currently
In the future
Currently
In the future
Currently
In the future
Currently
In the future
Currently
In the future
Currently
In the future
Currently
In the future
7. Challenges in local market development (5)
62
<For individual consumers> Target segments in local market development (multipleanswersallowed, by country/region)
Middle income classUpper class
55.1 67.3 64.7 69.2
63.1 73.0
61.5 59.3 60.0
67.2 58.8
65.7 57.6
78.0 57.1
75.0 52.4 55.4
52.2 60.9
51.6 77.4
46.3 65.8
45.0 73.7
38.4 60.2
Currently (n=713)
In the future (n=716)
Currently (n=51)
In the future (n=52)
Currently (n=84)
In the future (n=89)
Currently (n=26)
In the future (n=27)
Currently (n=65)
In the future (n=64)
Currently (n=68)
In the future (n=67)
Currently (n=59)
In the future (n=59)
Currently (n=21)
In the future (n=24)
Currently (n=63)
In the future (n=65)
Currently (n=23)
In the future (n=23)
Currently (n=31)
In the future (n=31)
Currently (n=82)
In the future (n=79)
Currently (n=20)
In the future (n=19)
Currently (n=86)
In the future (n=83)
Total
India
Vietnam
Malaysia
Taiwan
Singapore
Australia
Myanmar
Indonesia
Cambodia
New Zealand
HK & Macau
South Korea
Thailand
79.4
77.0
86.3
78.9
71.4
74.2
84.6
96.3
86.2
85.9
82.4
70.2
89.8
78.0
71.4
70.8
76.2
72.3
60.9
73.9
83.9
80.7
82.9
73.4
85.0
84.2
76.7
75.9
Currently
In the future
Currently
In the future
Currently
In the future
Currently
In the future
Currently
In the future
Currently
In the future
Currently
In the future
Currently
In the future
Currently
In the future
Currently
In the future
Currently
In the future
Currently
In the future
Currently
In the future
Currently
In the future
Increased over 15 pp
Firms tend to further strengthen sales to “Upper class” in Australia, Myanmar, New Zealand, Hong Kong & Macau, South Korea, and
Thailand, where consumers’ income levels are relatively high.
“Middle income class” accounted for a larger proportion as a future target segment than as a current target segment in Malays ia and
Cambodia, with a gap of over 10 pp. Meanwhile, “Lower class” accounted for a larger proportion as a future target than a current target in
Singapore and Indonesia, with a gap of over 10 pp.
0 20 40 60 80 1000 20 40 60 80 100(%)
0 20 40 60 80 100(%) (%)
0 20 40 60 80 100(%)
Copyright © 2017 JETRO. All rights reserved. Reproduction without permission is prohibited.
Non-manufacturing
sectors only
Note: Countries/regions for which n 10
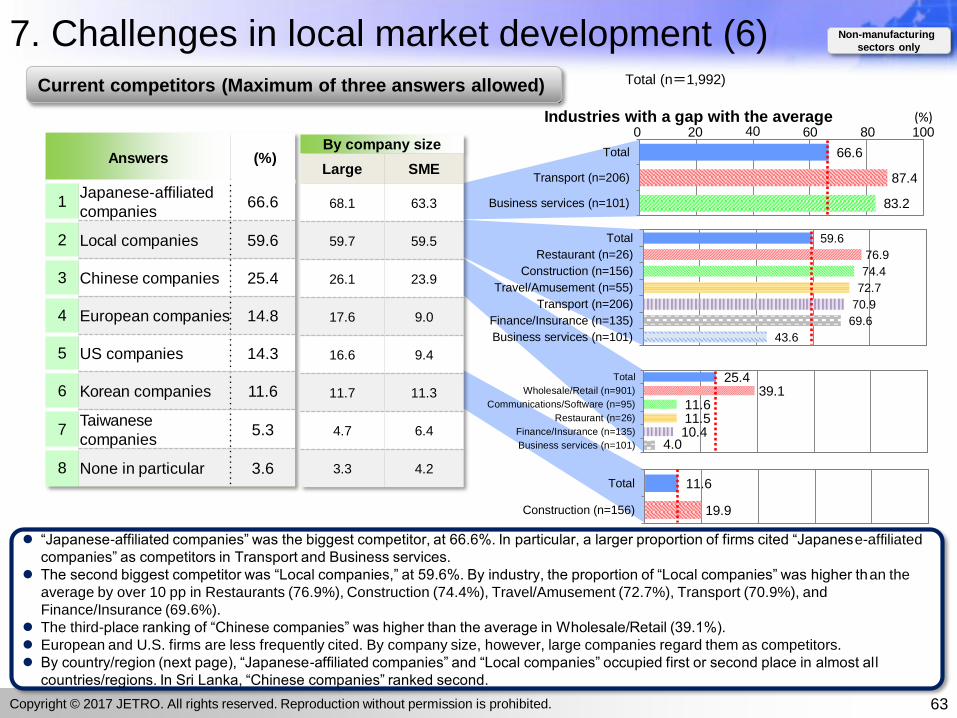
66.6
87.4
83.2
Total
Transport (n=206)
Business services (n=101)
59.6
76.9
74.4
72.7
70.9
69.6
43.6
Total
Restaurant (n=26)
Construction (n=156)
Travel/Amusement (n=55)
Transport (n=206)
Finance/Insurance (n=135)
Business services (n=101)
25.439.1
11.6 11.5 10.4
4.0
Total
Wholesale/Retail (n=901)
Communications/Software (n=95)
Restaurant (n=26)
Finance/Insurance (n=135)
Business services (n=101)
7. Challenges in local market development (6)
63
Answers (%)
1Japanese-affiliated
companies66.6
2 Local companies 59.6
3 Chinese companies 25.4
4 European companies 14.8
5 US companies 14.3
6 Korean companies 11.6
7Taiwanese
companies5.3
8 None in particular 3.6
“Japanese-affiliated companies” was the biggest competitor, at 66.6%. In particular, a larger proportion of firms cited “Japanese-affiliated
companies” as competitors in Transport and Business services.
The second biggest competitor was “Local companies,” at 59.6%. By industry, the proportion of “Local companies” was higher than the
average by over 10 pp in Restaurants (76.9%), Construction (74.4%), Travel/Amusement (72.7%), Transport (70.9%), and
Finance/Insurance (69.6%).
The third-place ranking of “Chinese companies” was higher than the average in Wholesale/Retail (39.1%).
European and U.S. firms are less frequently cited. By company size, however, large companies regard them as competitors.
By country/region (next page), “Japanese-affiliated companies” and “Local companies” occupied first or second place in almost all
countries/regions. In Sri Lanka, “Chinese companies” ranked second.
Industries with a gap with the average0 20 40 60 80 100
(%)
Total (n=1,992) Current competitors (Maximum of three answers allowed)
By company size
Large SME
68.1 63.3
59.7 59.5
26.1 23.9
17.6 9.0
16.6 9.4
11.7 11.3
4.7 6.4
3.3 4.2 11.6
19.9
Total
Construction (n=156)
Copyright © 2017 JETRO. All rights reserved. Reproduction without permission is prohibited.
Non-manufacturing
sectors only
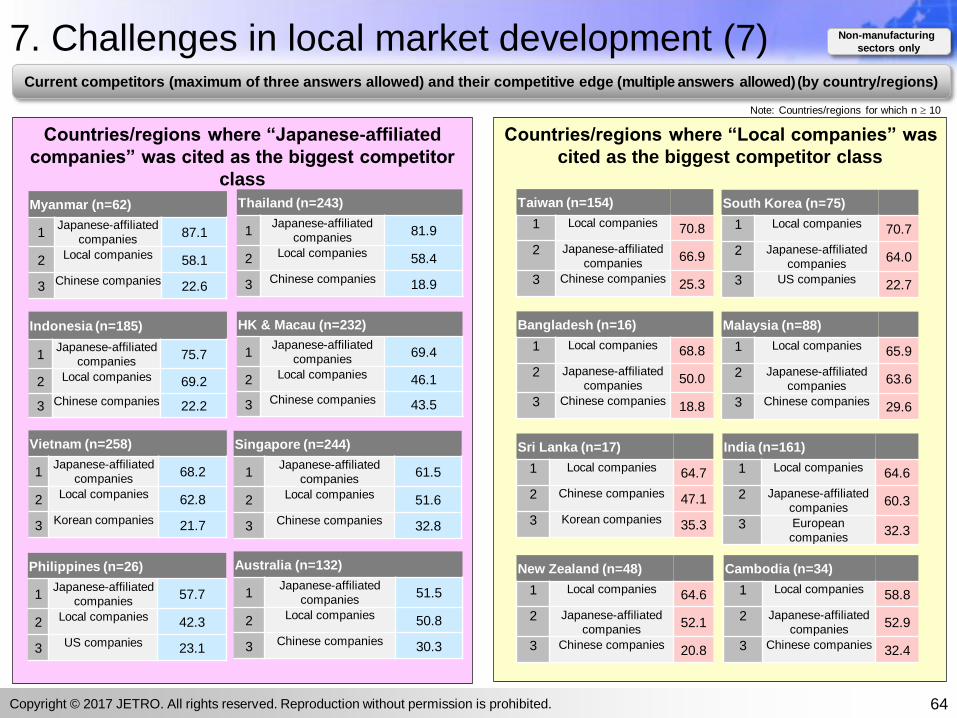
Countries/regions where “Japanese-affiliated
companies” was cited as the biggest competitor
class
7. Challenges in local market development (7)
64
Current competitors (maximum of three answers allowed) and their competitive edge (multiple answers allowed) (by country/regions)
(%) Countries/regions where “Local companies” was
cited as the biggest competitor class
Vietnam (n=258)
1Japanese-affiliated
companies68.2
2 Local companies 62.8
3 Korean companies 21.7
Singapore (n=244)
1Japanese-affiliated
companies61.5
2 Local companies 51.6
3 Chinese companies 32.8
Thailand (n=243)
1Japanese-affiliated
companies81.9
2 Local companies 58.4
3 Chinese companies 18.9
Myanmar (n=62)
1Japanese-affiliated
companies87.1
2 Local companies 58.1
3 Chinese companies 22.6
Philippines (n=26)
1Japanese-affiliated
companies57.7
2 Local companies 42.3
3 US companies 23.1
Australia (n=132)
1Japanese-affiliated
companies51.5
2 Local companies 50.8
3 Chinese companies 30.3
HK & Macau (n=232)
1Japanese-affiliated
companies69.4
2 Local companies 46.1
3 Chinese companies 43.5
Cambodia (n=34)
1 Local companies 58.8
2 Japanese-affiliated
companies52.9
3 Chinese companies 32.4
Malaysia (n=88)
1 Local companies 65.9
2 Japanese-affiliated
companies63.6
3 Chinese companies 29.6
India (n=161)
1 Local companies 64.6
2 Japanese-affiliated
companies60.3
3 European
companies32.3
Sri Lanka (n=17)
1 Local companies 64.7
2 Chinese companies 47.1
3 Korean companies 35.3
Bangladesh (n=16)
1 Local companies 68.8
2 Japanese-affiliated
companies50.0
3 Chinese companies 18.8
New Zealand (n=48)
1 Local companies 64.6
2 Japanese-affiliated
companies52.1
3 Chinese companies 20.8
Taiwan (n=154)
1 Local companies 70.8
2 Japanese-affiliated
companies66.9
3 Chinese companies 25.3
South Korea (n=75)
1 Local companies 70.7
2 Japanese-affiliated
companies64.0
3 US companies 22.7
Indonesia (n=185)
1Japanese-affiliated
companies75.7
2 Local companies 69.2
3 Chinese companies 22.2
Copyright © 2017 JETRO. All rights reserved. Reproduction without permission is prohibited.
Non-manufacturing
sectors only
Note: Countries/regions for which n 10
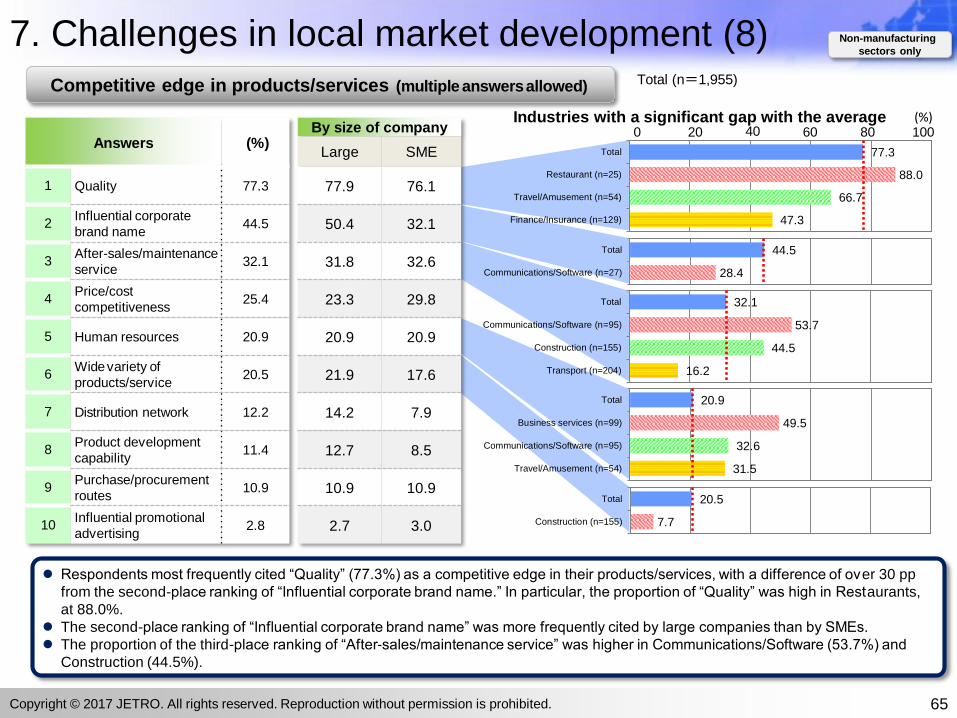
77.3
88.0
66.7
47.3
Total
Restaurant (n=25)
Travel/Amusement (n=54)
Finance/Insurance (n=129)
44.5
28.4
Total
Communications/Software (n=27)
32.1
53.7
44.5
16.2
Total
Communications/Software (n=95)
Construction (n=155)
Transport (n=204)
20.9
49.5
32.6
31.5
Total
Business services (n=99)
Communications/Software (n=95)
Travel/Amusement (n=54)
20.5
7.7
Total
Construction (n=155)
7. Challenges in local market development (8)
65
Answers (%)
1 Quality 77.3
2Influential corporate
brand name44.5
3After-sales/maintenance
service32.1
4Price/cost
competitiveness25.4
5 Human resources 20.9
6Wide variety of
products/service20.5
7 Distribution network 12.2
8Product development
capability11.4
9Purchase/procurement
routes10.9
10Influential promotional
advertising2.8
Respondents most frequently cited “Quality” (77.3%) as a competitive edge in their products/services, with a difference of over 30 pp
from the second-place ranking of “Influential corporate brand name.” In particular, the proportion of “Quality” was high in Restaurants,
at 88.0%.
The second-place ranking of “Influential corporate brand name” was more frequently cited by large companies than by SMEs.
The proportion of the third-place ranking of “After-sales/maintenance service” was higher in Communications/Software (53.7%) and
Construction (44.5%).
Industries with a significant gap with the average0 20 40 60 80 100
(%)
Total (n=1,955) Competitive edge in products/services (multiple answersallowed)
By size of company
Large SME
77.9 76.1
50.4 32.1
31.8 32.6
23.3 29.8
20.9 20.9
21.9 17.6
14.2 7.9
12.7 8.5
10.9 10.9
2.7 3.0
Copyright © 2017 JETRO. All rights reserved. Reproduction without permission is prohibited.
Non-manufacturing
sectors only
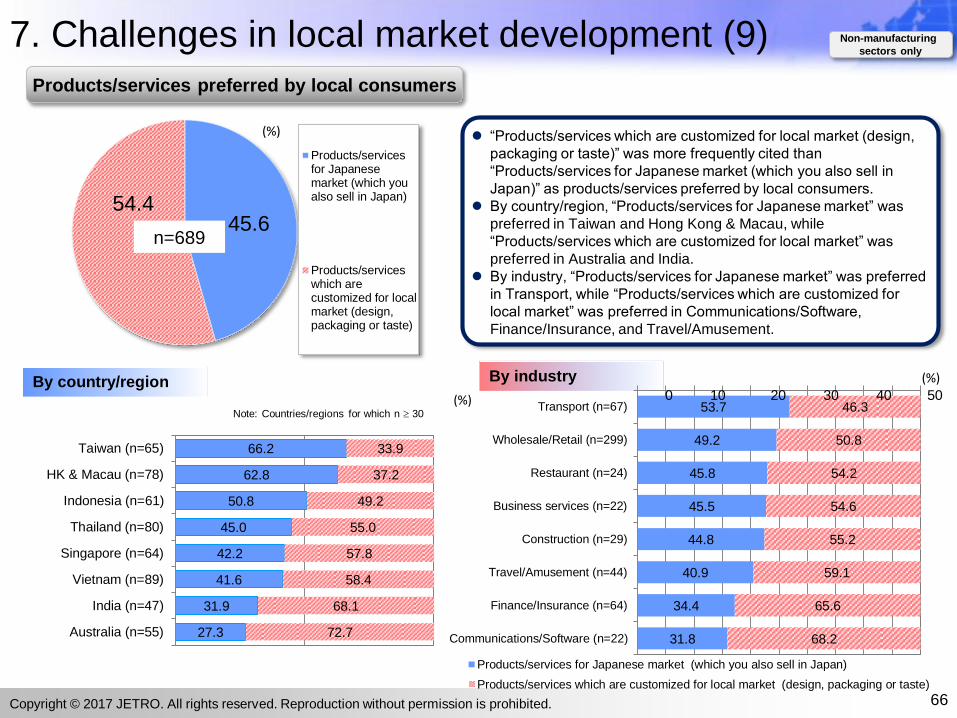
53.7
49.2
45.8
45.5
44.8
40.9
34.4
31.8
46.3
50.8
54.2
54.6
55.2
59.1
65.6
68.2
Transport (n=67)
Wholesale/Retail (n=299)
Restaurant (n=24)
Business services (n=22)
Construction (n=29)
Travel/Amusement (n=44)
Finance/Insurance (n=64)
Communications/Software (n=22)
Products/services for Japanese market (which you also sell in Japan)
Products/services which are customized for local market (design, packaging or taste)
7. Challenges in local market development (9)
66
Products/services preferred by local consumers
“Products/services which are customized for local market (design,
packaging or taste)” was more frequently cited than
“Products/services for Japanese market (which you also sell in
Japan)” as products/services preferred by local consumers.
By country/region, “Products/services for Japanese market” was
preferred in Taiwan and Hong Kong & Macau, while
“Products/services which are customized for local market” was
preferred in Australia and India.
By industry, “Products/services for Japanese market” was preferred
in Transport, while “Products/services which are customized for
local market” was preferred in Communications/Software,
Finance/Insurance, and Travel/Amusement.
66.2
62.8
50.8
45.0
42.2
41.6
31.9
27.3
33.9
37.2
49.2
55.0
57.8
58.4
68.1
72.7
Taiwan (n=65)
HK & Macau (n=78)
Indonesia (n=61)
Thailand (n=80)
Singapore (n=64)
Vietnam (n=89)
India (n=47)
Australia (n=55)
(%) 0 10 20 30 40 50
(%) By country/region By industry
45.6 54.4
Products/servicesfor Japanesemarket (which youalso sell in Japan)
Products/serviceswhich arecustomized for localmarket (design,packaging or taste)
n=689
(%)
Copyright © 2017 JETRO. All rights reserved. Reproduction without permission is prohibited.
Non-manufacturing
sectors only
Note: Countries/regions for which n 30

19.3
41.7
24.6
33.3
21.7
21.7
17.9
20.0
16.4
7.0
30.0
15.0
18.2
17.1
10.6
44.5
50.0
52.5
41.7
47.8
47.8
50.0
47.5
50.8
57.9
30.0
45.0
37.5
38.2
33.3
28.8
8.3
16.4
18.8
21.7
21.7
25.0
20.0
29.9
28.1
20.0
40.0
38.6
36.8
47.0
7.4
6.5
6.2
8.8
8.8
7.1
12.5
2.9
7.0
20.0
5.7
7.9
9.1
Total (n=694)
Malaysia (n=24)
Indonesia (n=61)
India (n=48)
Cambodia (n=23)
Myanmar (n=23)
New Zealand (n=28)
Thailand (n=80)
Singapore (n=67)
Australia (n=57)
Sri lanka (n=10)
South Korea (n=20)
Vietnam (n=88)
HK & Macau (n=76)
Taiwan (n=66)
Primarily based on price Based on both price and quality, but with a tendency to be price-sensitive
Based on both price and quality, but with a tendency to be quality-sensitive Primarily based on quality
7. Challenges in local market development (10)
67
Balance between price and quality for local consumers (By country/region, response total 100%)
0 10 20 30 40 50 60 70 80 90 100
(%)
In a question asking local consumers about the balance between price and quality, a total of 63.8% of firms selected “Primarily based on price” or "Based
on both price and quality, but with a tendency to be price-sensitive.” In the entire Asia and Oceania region, local consumers attach more importance to
price than quality.
By country/region, the proportion of firms that attach importance to price was the highest in Malaysia at 91.7%, followed by Indonesia (77.1%), India
(75.0%), and Cambodia and Myanmar (both 69.5%).
On the other hand, the proportion of “Primarily based on quality” and “Based on both price and quality, but with a tendency to be quality-sensitive” were
higher in Taiwan, Hong Kong & Macau, Vietnam, and South Korea.
Copyright © 2017 JETRO. All rights reserved. Reproduction without permission is prohibited.
Non-manufacturing
sectors only
Note: Countries/regions for which n 10
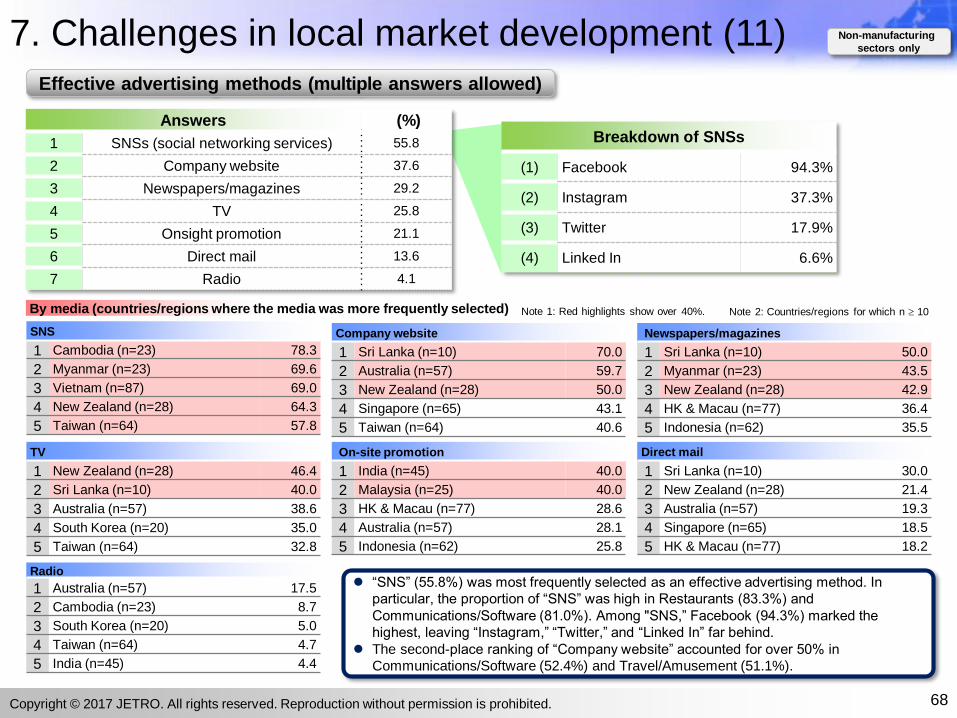
7. Challenges in local market development (11)
68
Effective advertising methods (multiple answers allowed)
Answers (%)
1 SNSs (social networking services) 55.8
2 Company website 37.6
3 Newspapers/magazines 29.2
4 TV 25.8
5 Onsight promotion 21.1
6 Direct mail 13.6
7 Radio 4.1
Breakdown of SNSs
(1) Facebook 94.3%
(2) Instagram 37.3%
(3) Twitter 17.9%
(4) Linked In 6.6%
SNS
1 Cambodia (n=23) 78.3
2 Myanmar (n=23) 69.6
3 Vietnam (n=87) 69.0
4 New Zealand (n=28) 64.3
5 Taiwan (n=64) 57.8
TV
1 New Zealand (n=28) 46.4
2 Sri Lanka (n=10) 40.0
3 Australia (n=57) 38.6
4 South Korea (n=20) 35.0
5 Taiwan (n=64) 32.8
Radio
1 Australia (n=57) 17.5
2 Cambodia (n=23) 8.7
3 South Korea (n=20) 5.0
4 Taiwan (n=64) 4.7
5 India (n=45) 4.4
Newspapers/magazines
1 Sri Lanka (n=10) 50.0
2 Myanmar (n=23) 43.5
3 New Zealand (n=28) 42.9
4 HK & Macau (n=77) 36.4
5 Indonesia (n=62) 35.5
Direct mail
1 Sri Lanka (n=10) 30.0
2 New Zealand (n=28) 21.4
3 Australia (n=57) 19.3
4 Singapore (n=65) 18.5
5 HK & Macau (n=77) 18.2
On-site promotion
1 India (n=45) 40.0
2 Malaysia (n=25) 40.0
3 HK & Macau (n=77) 28.6
4 Australia (n=57) 28.1
5 Indonesia (n=62) 25.8
Company website
1 Sri Lanka (n=10) 70.0
2 Australia (n=57) 59.7
3 New Zealand (n=28) 50.0
4 Singapore (n=65) 43.1
5 Taiwan (n=64) 40.6
Note 1: Red highlights show over 40%.By media (countries/regions where the media was more frequently selected)
“SNS” (55.8%) was most frequently selected as an effective advertising method. In
particular, the proportion of “SNS” was high in Restaurants (83.3%) and
Communications/Software (81.0%). Among "SNS,” Facebook (94.3%) marked the
highest, leaving “Instagram,” “Twitter,” and “Linked In” far behind.
The second-place ranking of “Company website” accounted for over 50% in
Communications/Software (52.4%) and Travel/Amusement (51.1%).
Copyright © 2017 JETRO. All rights reserved. Reproduction without permission is prohibited.
Non-manufacturing
sectors only
Note 2: Countries/regions for which n 10

7. Challenges in local market development (12)
69
Answers
(Top 10) Total
(n=1,879)
1Recruiting/developing human
resources*57.1
2 Diversification of products/services 42.6
3 Launching new products/services 36.6
4 Finding local partners 33.1
5 Resetting prices 30.0
6Expansion of distribution network
(distributors, real-world shops) 27.6
7 Surveys of target segments 23.7
8Reconsideration of
purchase/procurement routes16.7
9Expansion of distribution network
(e-commerce) 16.6
10Reconsideration of
advertising/promotion methods15.3
As a trouble experienced in expanding business in the local market, the proportion of “Recruiting/developing human resources” was the
highest at 57.1%. Specifically, human resources for “Sales/marketing” was the most frequently cited at 89.3%, with a great difference
from other answer options.
“Recruiting/developing human resources” was the most-frequently cited issue in all countries/regions, except South Korea and New
Zealand. The proportion of this answer option exceeded 50% in many countries (next page). In South Korea and New Zealand,
“Launching new products/services” was the highest. In Malaysia, Myanmar, and India, “Finding local partners” exceeded 40%.
By size of
corporation
Large
(n=1,274)
SME
(n=605)
57.5 56.4
41.6 44.8
37.6 34.6
34.5 29.9
28.5 33.1
28.3 26.3
23.5 24.1
16.1 17.9
16.3 17.2
13.3 19.3
(%)
Troubles experienced in expanding business in the local market (multipleanswersallowed,by country/region)
Breakdown: Sales/marketing (89.3%), Purchasing/procurement (10.7%), Advertising/promotion (9.7%), R&D/product development (8.6%)
Industries higher than the average by over 10 pp
36.6
56.0
Total
Restaurant (n=25)
33.1
46.9
45.1
Total
Construction (n=147)
Communication/Software (n=91)
30.0
68.0
Total
Restaurant (n=25)
57.1
68.1
Total
Communication/Software (n=91)
Copyright © 2017 JETRO. All rights reserved. Reproduction without permission is prohibited.
Non-manufacturing
sectors only

7. Challenges in local market development (13)
70
Problems by country/region (top 5, multiple answersallowed)
Recruiting/developing
human resources
Diversification of
products/servicesFinding local partners
Launching new
products/servicesResetting prices
57.1
81.3
71.6
69.0
65.4
64.7
62.1
60.9
56.2
54.4
52.7
52.6
52.0
50.0
50.0
45.7
44.0
32.5
0 25 50 75 100
Total (n=1,879)
Bangladesh (n=16)
Taiwan (n=148)
Myanmar (n=58)
Vietnam (n=243)
Sri Lanka (n=17)
Malaysia (n=87)
Indonesia (n=174)
South Korea(n=73)
Thailand (n=230)
Singapore (n=224)
HK & Macau (n=228)
India (n=152)
Cambodia (n=34)
Laos (n=10)
Australia (n=116)
Philippines (n=25)
New Zealand (n=40)
(%)
42.6
48.2
47.8
46.0
45.3
44.1
43.7
42.9
41.2
40.5
40.0
39.5
38.6
37.5
36.2
35.0
32.9
20.0
0 25 50 75 100
Total (n=1,879)
Vietnam (n=243)
Thailand (n=230)
Malaysia (n=87)
Taiwan (n=148)
Cambodia (n=34)
Indonesia (n=174)
Singapore (n=224)
Sri Lanka (n=17)
Australia (n=116)
Philippines (n=25)
India (n=152)
HK & Macau (n=228)
Bangladesh (n=16)
Myanmar (n=58)
New Zealand (n=40)
South Korea(n=73)
Laos (n=10)
36.6
57.5
52.9
50.0
50.0
42.5
40.2
37.9
37.5
36.5
34.7
32.4
30.9
29.9
29.3
28.0
25.0
22.4
0 25 50 75 100
Total (n=1,879)
South Korea(n=73)
Sri Lanka (n=17)
Taiwan (n=148)
Laos (n=10)
New Zealand (n=40)
Singapore (n=224)
Malaysia (n=87)
India (n=152)
Thailand (n=230)
HK & Macau (n=228)
Cambodia (n=34)
Vietnam (n=243)
Indonesia (n=174)
Australia (n=116)
Philippines (n=25)
Bangladesh (n=16)
Myanmar (n=58)
33.1
44.8
41.4
40.1
38.2
38.0
35.3
34.5
33.3
31.3
30.2
30.0
29.4
26.0
24.0
18.8
17.5
10.0
0 25 50 75 100
Total (n=1,879)
Malaysia (n=87)
Myanmar (n=58)
India (n=152)
Cambodia (n=34)
Singapore (n=224)
Sri Lanka (n=17)
Taiwan (n=148)
Indonesia (n=174)
Vietnam (n=243)
Australia (n=116)
Thailand (n=230)
HK & Macau (n=228)
South Korea(n=73)
Philippines (n=25)
Bangladesh (n=16)
New Zealand (n=40)
Laos (n=10)
30.0
50.0
41.2
37.5
37.5
36.2
33.0
32.4
31.6
30.5
29.8
28.0
26.7
26.5
25.3
25.0
24.7
23.0
0 25 50 75 100
Total (n=1,879)
Laos (n=10)
Sri Lanka (n=17)
Bangladesh (n=16)
India (n=152)
Myanmar (n=58)
Singapore (n=224)
Cambodia (n=34)
Indonesia (n=174)
Vietnam (n=243)
HK & Macau (n=228)
Philippines (n=25)
Australia (n=116)
Thailand (n=230)
Malaysia (n=87)
New Zealand (n=40)
South Korea(n=73)
Taiwan (n=148)
Copyright © 2017 JETRO. All rights reserved. Reproduction without permission is prohibited.
Note: Countries/regions for which n 10
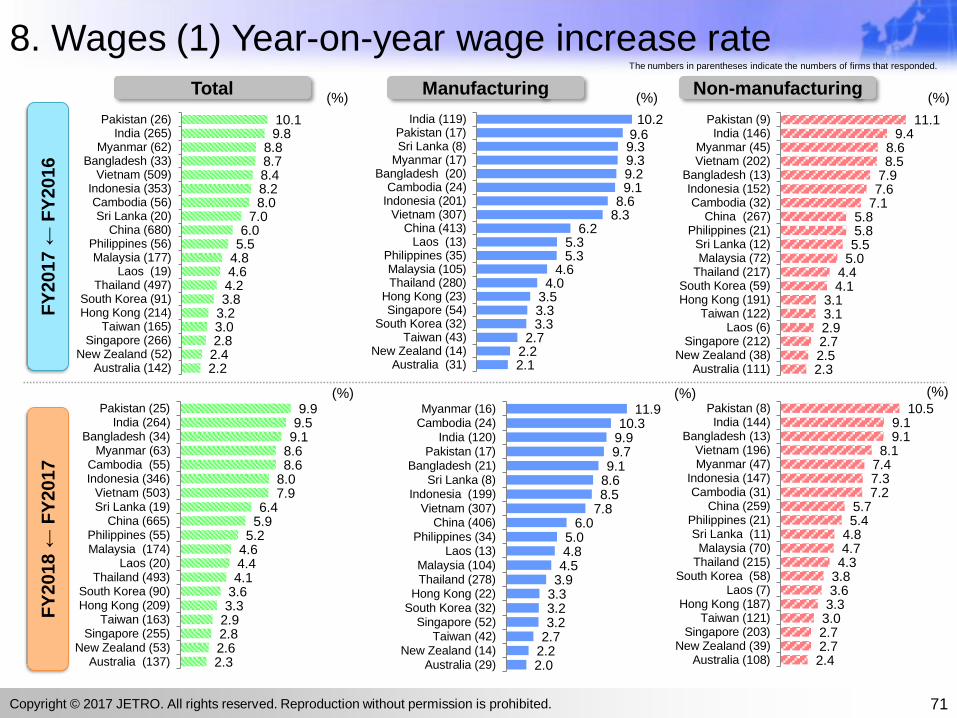
2.12.22.7
3.33.33.54.0
4.65.35.3
6.28.38.69.19.29.39.39.6
10.2
Australia (31)New Zealand (14)
Taiwan (43)South Korea (32)
Singapore (54)Hong Kong (23)
Thailand (280)Malaysia (105)
Philippines (35)Laos (13)
China (413)Vietnam (307)
Indonesia (201)Cambodia (24)
Bangladesh (20)Myanmar (17)Sri Lanka (8)Pakistan (17)
India (119)
2.3 2.5 2.7 2.9 3.1 3.1
4.1 4.4
5.0 5.5 5.8 5.8
7.1 7.6 7.9 8.5 8.6
9.4 11.1
Australia (111)New Zealand (38)
Singapore (212)Laos (6)
Taiwan (122)Hong Kong (191)South Korea (59)
Thailand (217)Malaysia (72)Sri Lanka (12)
Philippines (21)China (267)
Cambodia (32)Indonesia (152)
Bangladesh (13)Vietnam (202)Myanmar (45)
India (146)Pakistan (9)
8. Wages (1) Year-on-year wage increase rate
71
2.2 2.4 2.8 3.0 3.2 3.8 4.2 4.6 4.8 5.5 6.0
7.0 8.0 8.2 8.4 8.7 8.8
9.8 10.1
Australia (142)New Zealand (52)
Singapore (266)Taiwan (165)
Hong Kong (214)South Korea (91)
Thailand (497)Laos (19)
Malaysia (177)Philippines (56)
China (680)Sri Lanka (20)
Cambodia (56)Indonesia (353)
Vietnam (509)Bangladesh (33)
Myanmar (62)India (265)
Pakistan (26)
2.32.62.82.93.33.64.14.44.65.2
5.96.4
7.98.08.68.69.19.59.9
Australia (137)New Zealand (53)
Singapore (255)Taiwan (163)
Hong Kong (209)South Korea (90)
Thailand (493)Laos (20)
Malaysia (174)Philippines (55)
China (665)Sri Lanka (19)Vietnam (503)
Indonesia (346)Cambodia (55)
Myanmar (63)Bangladesh (34)
India (264)Pakistan (25)
2.02.22.73.23.23.33.94.54.85.0
6.07.88.58.69.19.79.910.3
11.9
Australia (29)
New Zealand (14)Taiwan (42)
Singapore (52)South Korea (32)
Hong Kong (22)Thailand (278)
Malaysia (104)
Laos (13)Philippines (34)
China (406)Vietnam (307)
Indonesia (199)Sri Lanka (8)
Bangladesh (21)Pakistan (17)
India (120)
Cambodia (24)Myanmar (16)
2.4 2.7 2.7 3.0 3.3 3.6 3.8 4.3 4.7 4.8 5.4 5.7
7.2 7.3 7.4 8.1
9.1 9.1
10.5
Australia (108)New Zealand (39)
Singapore (203)Taiwan (121)
Hong Kong (187)Laos (7)
South Korea (58)Thailand (215)Malaysia (70)
Sri Lanka (11)Philippines (21)
China (259)Cambodia (31)
Indonesia (147)Myanmar (47)Vietnam (196)
Bangladesh (13)India (144)
Pakistan (8)
(%)
(%) (%)
(%)
(%)
(%)
Copyright © 2017 JETRO. All rights reserved. Reproduction without permission is prohibited.
Total Non-manufacturingManufacturing
FY
2017 ←
FY
2016
FY
2018 ←
FY
2017
The numbers in parentheses indicate the numbers of firms that responded.

6.0
9.9
3.9
8.5
7.8
0
10
20
30
20112012201320142015201620172018
China India Thailand Indonesia Vietnam
5.7
9.1
4.3
7.3
8.1
0
10
20
30
20112012201320142015201620172018
5.9
9.5
4.1
8.0
7.9
0
10
20
30
20112012201320142015201620172018
8. Wages (2) Year-on-year wage increase rate (China and major countries)
72
By industry category, the wage increase rate fluctuates relatively less in the manufacturing sector.
In 2017, the wage increase rate (total; same applies to the following) slightly decreased in China, Thailand, India, Indonesia, and Vietnam.
In China, the wage increase rate decreased every year after peaking out at 12.9% in 2011. The rate was 6.0% in 2017 and is expected to be 5.9%
in 2018 (forecast), showing continued decrease.
In Indonesia, the wage increase rate decreased every year after peaking out at 24.7% in 2013. The rate was 8.2% in 2017 and is expected to be
8.0% in 2018 (forecast), showing continued decrease.
The wage increase rate is expected to decrease gradually in all countries in 2018 (forecast) .
(%) (%) (%)
Copyright © 2017 JETRO. All rights reserved. Reproduction without permission is prohibited.
Total Manufacturing Non-manufacturing
Note: 2018 rates are forecasts.
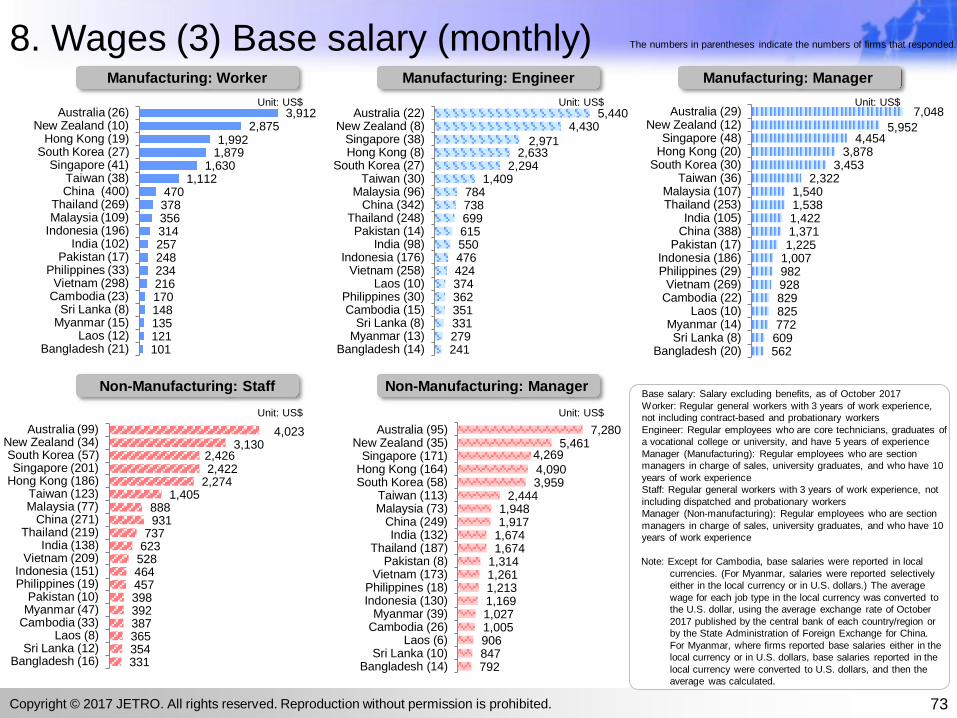
101 121 135 148 170 216 234 248 257 314 356 378 470
1,112 1,630
1,879 1,992
2,875 3,912
Bangladesh (21)Laos (12)
Myanmar (15)Sri Lanka (8)
Cambodia (23)Vietnam (298)
Philippines (33)Pakistan (17)
India (102)Indonesia (196)Malaysia (109)Thailand (269)
China (400)Taiwan (38)
Singapore (41)South Korea (27)
Hong Kong (19)New Zealand (10)
Australia (26)
8. Wages (3) Base salary (monthly)
73
241 279 331 351 362 374 424 476 550 615 699 738 784
1,409 2,294
2,633 2,971
4,430 5,440
Bangladesh (14)Myanmar (13)Sri Lanka (8)
Cambodia (15)Philippines (30)
Laos (10)Vietnam (258)
Indonesia (176)India (98)
Pakistan (14)Thailand (248)
China (342)Malaysia (96)
Taiwan (30)South Korea (27)
Hong Kong (8)Singapore (38)
New Zealand (8)Australia (22)
562 609 772 825 829 928 982 1,007 1,225 1,371 1,422 1,538 1,540
2,322 3,453
3,878 4,454
5,952
7,048
Bangladesh (20)Sri Lanka (8)
Myanmar (14)Laos (10)
Cambodia (22)Vietnam (269)
Philippines (29)Indonesia (186)
Pakistan (17)China (388)India (105)
Thailand (253)Malaysia (107)
Taiwan (36)South Korea (30)Hong Kong (20)Singapore (48)
New Zealand (12)Australia (29)
331 354 365 387 392 398 457 464 528 623 737
931 888
1,405 2,274 2,422 2,426
3,130 4,023
Bangladesh (16)Sri Lanka (12)
Laos (8)Cambodia (33)Myanmar (47)Pakistan (10)
Philippines (19)Indonesia (151)
Vietnam (209)India (138)
Thailand (219)China (271)
Malaysia (77)Taiwan (123)
Hong Kong (186)Singapore (201)
South Korea (57)New Zealand (34)
Australia (99)
792 847 906 1,005 1,027 1,169 1,213 1,261 1,314 1,674 1,674 1,917 1,948
2,444 3,959 4,090
4,269 5,461
7,280
Bangladesh (14)Sri Lanka (10)
Laos (6)Cambodia (26)Myanmar (39)
Indonesia (130)Philippines (18)
Vietnam (173)Pakistan (8)
Thailand (187)India (132)
China (249)Malaysia (73)Taiwan (113)
South Korea (58)Hong Kong (164)Singapore (171)
New Zealand (35)Australia (95)
Copyright © 2017 JETRO. All rights reserved. Reproduction without permission is prohibited.
Unit: US$ Unit: US$Unit: US$
Manufacturing: Worker Manufacturing: Engineer Manufacturing: Manager
The numbers in parentheses indicate the numbers of firms that responded.
Unit: US$ Unit: US$
Non-Manufacturing: Manager Non-Manufacturing: StaffBase salary: Salary excluding benefits, as of October 2017
Worker: Regular general workers with 3 years of work experience,
not including contract-based and probationary workers
Engineer: Regular employees who are core technicians, graduates of
a vocational college or university, and have 5 years of experience
Manager (Manufacturing): Regular employees who are section
managers in charge of sales, university graduates, and who have 10
years of work experience
Staff: Regular general workers with 3 years of work experience, not
including dispatched and probationary workers
Manager (Non-manufacturing): Regular employees who are section
managers in charge of sales, university graduates, and who have 10
years of work experience
Note: Except for Cambodia, base salaries were reported in local
currencies. (For Myanmar, salaries were reported selectively
either in the local currency or in U.S. dollars.) The average
wage for each job type in the local currency was converted to
the U.S. dollar, using the average exchange rate of October
2017 published by the central bank of each country/region or
by the State Administration of Foreign Exchange for China.
For Myanmar, where firms reported base salaries either in the
local currency or in U.S. dollars, base salaries reported in the
local currency were converted to U.S. dollars, and then the
average was calculated.

8. Wages (4) Annual salary
74
4,232
4,994
5,140
5,352
5,556
5,912
7,315
8,066
8,453
11,119
12,179
12,599
14,903
25,278
40,245
41,332
46,373 56,064
75,432
Myanmar (10)
Bangladesh (13)
Cambodia (13)
Laos (10)
Sri Lanka (7)
Philippines (28)
Vietnam (232)
Indonesia (163)
India (94)
Pakistan (14)
Malaysia (65)
Thailand (216)
China (314)
Taiwan (26)
Hong Kong (6)
South Korea (27)
Singapore (35)
New Zealand (8)
Australia (22)
1,885 1,889 2,059 2,631 2,856 3,673 3,982 4,102 4,379 5,421 5,900 6,997
10,131 19,071
26,516 29,595
32,712 35,625
54,697
Bangladesh (19)Myanmar (11)
Laos (12)Cambodia (21)
Sri Lanka (7)Vietnam (260)
India (97)Philippines (31)
Pakistan (17)Indonesia (179)
Malaysia (75)Thailand (232)
China (357)Taiwan (35)
Singapore (34)Hong Kong (16)
South Korea (27)New Zealand (10)
Australia (26)
9,441
9,794
10,449
11,035
11,890
14,148
15,418
16,899
21,743
21,806
24,174
25,093
26,304
41,155
58,199
58,396
70,387 80,111
100,262
Sri Lanka (7)
Bangladesh (19)
Myanmar (9)
Laos (10)
Cambodia (20)
Philippines (27)
Vietnam (239)
Indonesia (172)
Pakistan (17)
India (98)
Malaysia (75)
China (352)
Thailand (220)
Taiwan (33)
South Korea (31)
Hong Kong (16)
Singapore (42)
New Zealand (12)
Australia (29)
11,801
13,106
14,444
14,721
16,177
19,020
20,072
20,267
20,489
26,972
27,351
28,280
35,339
41,711
59,593
60,762
68,989 75,171
102,544
Laos (6)
Bangladesh (9)
Cambodia (25)
Myanmar (34)
Sri Lanka (10)
Philippines (18)
Indonesia (115)
Vietnam (152)
Pakistan (8)
Thailand (163)
India (126)
Malaysia (54)
China (227)
Taiwan (100)
Hong Kong (146)
South Korea (54)
Singapore (153)
New Zealand (34)
Australia (98)
4,353
5,276
5,512
5,607
5,752
6,230
7,390
7,952
8,487
9,918
11,880
13,709
17,674
24,360
33,252
38,165
38,234
42,274
55,784
Laos (7)
Cambodia (29)
Sri Lanka (11)
Pakistan (10)
Bangladesh (12)
Myanmar (41)
Philippines (19)
Indonesia (132)
Vietnam (186)
India (130)
Thailand (186)
Malaysia (58)
China (243)
Taiwan (105)
Hong Kong (161)
South Korea (53)
Singapore (175)
New Zealand (32)
Australia (100)
Copyright © 2017 JETRO. All rights reserved. Reproduction without permission is prohibited.
Unit: US$ Unit: US$Unit: US$
Manufacturing: Worker Manufacturing: Engineer Manufacturing: Manager
The numbers in parentheses indicate the numbers of firms that responded.
Unit: US$ Unit: US$
Non-Manufacturing: Manager Non-Manufacturing: Staff Annual salary (annual amount of real obligation fees):
Total liability for an employee (the total of annual base
salary, benefits, social security, overtime allowances,
and bonuses, excluding severance benefits, as of
FY2017)
See the previous page for the definitions of worker,
engineer, manager (manufacturing), staff, and manager
(non-manufacturing) .
Note: Except for Cambodia, annual salaries were
reported in local currencies. (For Myanmar,
salaries were reported selectively either in the
local currency or in U.S. dollars.) The annual
salary for each job type in the local currency was
converted to U.S. dollars, using the average
exchange rate of October 2017 published by the
central bank of each country/region or by the
State Administration of Foreign Exchange for
China. For Myanmar, where firms reported annual
salaries either in the local currency or in U.S.
dollars, annual salaries reported in the local
currency were converted to U.S. dollars to
calculate the average.

8. Wages (5) Bonuses
75
0.4 0.4
0.6 1.1 1.1 1.2
1.5 1.5 1.6 1.7 1.8 1.9 2.0 2.0
2.2 3.1
3.7 4.1
4.5
Australia (15)
New Zealand (8)
Cambodia (14)
India (86)
Laos (10)
Myanmar (13)
Hong Kong (8)
Vietnam (266)
Sri Lanka (8)
Philippines (29)
Indonesia (175)
China (350)
Malaysia (96)
Bangladesh (13)
Singapore (38)
Thailand (248)
Taiwan (30)
Pakistan (12)
South Korea (25)
0.2 0.3 0.5
1.0 1.1 1.1
1.4 1.5 1.5 1.7 1.7 1.8 1.8 1.9
2.3 3.0
3.4 3.4
4.5
New Zealand (9)Australia (19)
Cambodia (20)India (91)Laos (14)
Myanmar (14)Vietnam (311)
Sri Lanka (8)Hong Kong (19)Philippines (32)Indonesia (193)
China (407)Bangladesh (20)
Malaysia (109)Singapore (39)Thailand (271)
Taiwan (40)Pakistan (15)
South Korea (25)
0.60.8
1.11.21.31.3
1.61.6
1.81.81.81.92.02.1
2.33.1
3.63.7
3.9
Australia (22)
Cambodia (19)
India (95)
Laos (10)
Myanmar (13)
New Zealand (11)
Vietnam (274)
Sri Lanka (8)
Hong Kong (21)
Philippines (28)
Bangladesh (19)
Indonesia (182)
China (388)
Malaysia (103)
Singapore (48)
Thailand (251)
Pakistan (15)
South Korea (28)
Taiwan (36)
1.0 1.0 1.1 1.2 1.3 1.3 1.4
1.7 1.7
2.0 2.1 2.1 2.1 2.2 2.3 2.4
2.6 2.7
3.4
Laos (6)
Cambodia (26)
New Zealand (29)
Australia (79)
Sri Lanka (10)
Myanmar (38)
India (130)
Hong Kong (165)
Vietnam (165)
Bangladesh (13)
Indonesia (126)
China (250)
Pakistan (7)
Singapore (169)
Malaysia (71)
Philippines (19)
Thailand (187)
South Korea (52)
Taiwan (109)
0.70.7
1.01.0
1.21.31.3
1.51.61.6
1.91.9
2.12.22.22.3
2.52.5
3.0
New Zealand (31)
Australia (82)
Laos (6)
Cambodia (31)
Myanmar (45)
Sri Lanka (11)
India (135)
Vietnam (215)
Hong Kong (189)
Pakistan (9)
Indonesia (149)
China (271)
Singapore (202)
Malaysia (75)
Bangladesh (15)
Philippines (20)
Thailand (217)
South Korea (54)
Taiwan (118)
Copyright © 2017 JETRO. All rights reserved. Reproduction without permission is prohibited.
Unit: months Unit: monthsUnit: months
Manufacturing: Worker Manufacturing: Engineer Manufacturing: Manager
The numbers in parentheses indicate the numbers of firms that responded.
Unit: months Unit: months
Non-Manufacturing: Manager Non-Manufacturing: Staff

Copyright © 2017 JETRO. All rights reserved. Reproduction without permission is prohibited.
Contact details for inquiries:
Japan External Trade Organization (JETRO)
Overseas Research Department / Asia and Oceania Division /
China and North Asia Division
1-12-32 Akasaka, Minato-ku, Tokyo 107-6006
TEL: 03-3582-5179 (Asia and Oceania Division)
03-3582-5181 (China and North Asia Division)
E-mail: [email protected] (Asia and Oceania Division)
[email protected] (China and North Asia Division)
Responsibility for any decisions made based on or in relation to the information provided in this
material shall rest solely on the reader. Although JETRO strives to provide accurate
information, JETRO will not be responsible for any loss or damage incurred by readers through
the use of such information in any manner.