2017 final results announcement - champion … · stock exchange of hong kong limited take no...
TRANSCRIPT

Save the Planet. - Don't print this unless it's really necessary
The Securities and Futures Commission of Hong Kong, Hong Kong Exchanges and Clearing Limited and The
Stock Exchange of Hong Kong Limited take no responsibility for the contents of this announcement, make no
representation as to its accuracy or completeness and expressly disclaim any liability whatsoever for any loss
howsoever arising from or in reliance upon the whole or any part of the contents of this announcement.
2017 FINAL RESULTS ANNOUNCEMENT
Champion Real Estate Investment Trust is a trust formed to own and invest in income-
producing office and retail properties. The Trust’s focus is on Grade-A commercial properties
in prime locations. It currently offers investors direct exposure to
2.93 million sq. ft. of prime office and retail floor area by way of two landmark properties in
Hong Kong, Three Garden Road and Langham Place,
one on each side of the Victoria Harbour.

2
FINAL RESULTSThe board of directors (“Board”) of Eagle Asset Management (CP) Limited (“REIT
Manager”) as manager of Champion Real Estate Investment Trust (“Champion REIT” or
“Trust”) is pleased to announce financial results of the Trust for the year ended 31 December
2017 (“Year” or “Period”).
FINANCIAL HIGHLIGHTS
For the year ended 31 December 2017
2017 2016 Change
For the entire year HK$’ million HK$’ million
Total Rental Income1 2,431 2,299 + 5.7%
Net Property Operating Expenses1 265 272 - 2.8%
Net Property Income 2,166 2,027 + 6.9%
Profit After Tax 11,140 3,182 + 250.1%
Distributable Income 1,487 1,408 + 5.6%
Distribution Amount 1,413 1,331 + 6.2%
Distribution per Unit (HK$) 0.2426 0.2292 + 5.8%
2017 2016 Change
As at 31 December HK$’ million HK$’ million
Gross Value of Portfolio 76,704 66,842 + 14.8%
Net Asset Value per Unit (HK$) 10.36 8.72 + 18.8%
Gearing Ratio 18.9% 21.7% - 2.8pp
Net Expense Ratio (entire year) 10.9% 11.8% - 0.9pp
Payout Ratio (entire year) 95.0% 94.5% + 0.5pp
1 Building Management Fee Income is directly offset against Building Management Fee Expenses instead of being
classified as an income item.

3
MANAGEMENT DISCUSSION AND ANALYSIS
OVERVIEW
The Trust’s distributable income reached another record high in 2017 after achieving stable
rental income growth across all properties. Our office portfolio continued to deliver steady
growth and the retail market also showed signs of recovery in the second half of 2017. For the
year ended 31 December 2017, the Trust’s distributable income increased by 5.6% to
HK$1,487 million (2016: HK$1,408 million), while distribution per unit (“DPU”) rose 5.8%
to HK$0.2426 (2016: HK$0.2292).
Total rental income for 2017 recorded an increase of 5.7% to HK$2,431 million (2016:
HK$2,299 million). Positive rental reversions for both Three Garden Road and Langham
Place Office continued to generate stable income growth for our office portfolio. Despite
March 2017’s unfortunate escalator incident, Langham Place Mall benefitted from the
improving retail environment, achieving steady rental income growth of 4.7%. Net property
operating expenses of the Trust experienced a reduction of 2.8% to HK$265 million. This was
mainly due to savings in rental commissions paid as a result of our lower tenancy turnover
and a decrease in net building management expenses. Net property income for 2017 increased
by 6.9% to HK$2,166 million (2016: HK$2,027 million).
As at 31 December 2017, the Trust had succeeded in significantly mitigating its exposure to
potential interest rate risks by increasing the proportion of its fixed rate debt to 50.0% (21.5%
as at 31 December 2016). Coupled with the HIBOR hike, the higher fixed rate debt portion
increased cash finance costs for 2017 to HK$322 million, 15% higher than HK$280 million
for 2016. The growth in net property income compensated the increased cash finance costs,
and resulted in 5.6% growth in distributable income to HK$1,487 million for 2017 (2016:
HK$1,408 million).
The appraised value of the Trust’s properties as at 31 December 2017 stood at HK$76.7
billion, an increase of 14.8% over HK$66.8 billion as at 31 December 2016. This increase
was driven primarily by higher rental rate assumptions. Net asset value per unit as at 31
December 2017 was HK$10.36, an increase of 18.8% when compared with HK$8.72 for 31
December 2016. The Trust’s gearing ratio decreased to 18.9% as at 31 December 2017 from
21.7% as at 31 December 2016.
The Trust actively looks for opportunities to enhance value for all unitholders. In July 2017,
the Trust announced a possible disposal of its interest in Langham Place Office Tower. No
offer has been received by the REIT Manager to date.

4
OPERATIONAL REVIEW
Three Garden Road
2017 2016 Change
HK$’000 HK$’000
Rental Income 1,231,542 1,157,217 + 6.4%
Net Property Operating Expenses 119,172 117,570 + 1.4%
Net Property Income 1,112,370 1,039,647 + 7.0%
While Hong Kong’s economy and property sector continued to gain strength during 2017,
Central office market momentum slowed as PRC tenants, which drove the demand for Central
office space, adopted a wait-and-see attitude ahead of the National People’s Congress in
October 2017. Leasing activities picked up subsequently in the fourth quarter. Despite several
multinational corporations deciding to relocate away from Hong Kong’s Central business hub,
the district’s overall supply situation for 2017 remained tight. Eagerly filling spaces vacated
by the departing multinationals, Chinese financial institutions and corporations continued to
be Central’s major office tenants.
In spite of softer demand in the
second and third quarters,
performance of Three Garden Road
remained stable throughout 2017. As
at 31 December 2017, occupancy at
the property reached 94.2% (92.4%
as at 30 June 2017). This
improvement in occupancy was
largely the result of Chinese financial
institutions expanding in-house,
relocating or setting up new
operations. Encouragingly, average
occupancy at the property stayed
above 90% throughout 2017.
Banking35%
Asset Management
32%
Business Centre/
Co-working Space
2%
Legal 4%
Medical2%
Consultancy2%
Corporate7%
Media5% Others
5%Vacant
6%
Tenant ProfileThree Garden Road -
Office(Dec 17)

5
The property continued to achieve significant positive rental reversions in 2017 and drove
rental income growth of 6.4% to reach HK$1,232 million (2016: HK$1,157 million). Passing
rents surged 18.3% to HK$92.52 per lettable sq. ft. from HK$78.20 per lettable sq. ft. as at 31
December 2016. Market rents also experienced a gradual rise as leasing momentum improved.
The latest leasing transaction has reached HK$120 per lettable sq. ft..
Net property income for Three Garden Road during 2017 increased by 7.0% to HK$1,112
million (2016: HK$1,040 million) as a result of higher rentals. Net property operating
expenses rose 1.4% to HK$119 million. Reflecting lower tenancy turnover, decreased rental
commissions at this property were offset by higher government rents and rates.
Langham Place Office Tower
2017 2016 Change
HK$’000 HK$’000
Rental Income 343,939 324,743 + 5.9%
Net Property Operating Expenses 25,728 29,643 - 13.2%
Net Property Income 318,211 295,100 + 7.8%
Langham Place Office Tower’s prime
location and top-quality construction and
facilities ensured it remained a preferred
address for leading lifestyle tenants. In 2017,
this was especially true of companies in
Hong Kong’s image-conscious beauty
segment. With a view to ease the potential
competition from decentralized office
supply for traditional occupants, we put a
greater focus on lifestyle tenants.
Gratifyingly, many existing tenants at the
property have also opted to expand
gradually. At the end of 2017, the property’s
proportion of lifestyle, healthcare and
beauty segments had expanded to 52% of its tenant mix.
Health Care & Beauty
42%
Lifestyle10%
Merchandising & Trading
23%
Professional & Sales Services
14%
Medical Services
5%
Others3%
Vacant3%
Tenant ProfileLangham Place -
Office(Dec 17)

6
The property’s total rental income for 2017 rose 5.9% to HK$344 million (2016: HK$325
million). Positive rental reversions as well as higher rental from tenant mix rebranding
continued to contribute to stable income growth. The latest achieved rents have surpassed
HK$50 per sq. ft. based on gross floor area. Occupancy levels as at 31 December 2017 also
remained high at 97.1% and tenant negotiations regarding the rental of several available
spaces have now reached an advanced stage.
Rental commissions at Langham Place Office Tower during 2017 decreased by HK$5 million
due to lower tenancy turnover, which drove down net property operating expenses from
HK$30 million to HK$26 million. Net property income rose by 7.8% to reach HK$318
million (2016: HK$295 million).
Langham Place Mall
2017 2016 Change
HK$’000 HK$’000
Rental Income 855,540 816,949 + 4.7%
Net Property Operating Expenses 119,807 125,182 - 4.3%
Net Property Income 735,733 691,767 + 6.4%
Buoyed by an improved local economy and rising tourist arrivals, Hong Kong’s retail market
showed encouraging signs of a recovery in the second half of 2017. Tenant sales at Langham
Place Mall were also experiencing
a rebound until March 2017’s
escalator incident sparked a mid-
year slowdown. A special post-
escalator incident promotion
program helped minimize
potentially negative fall out by
bringing fresh experience to
shoppers. Over the course of 2017,
sales at Langham Place Mall
increased by 5.3%, measurably
outperforming the local retail
market’s 2.2% sales again.
Entertainment15%
Fashion & Accessories
40%
Food & Beverage
22%
Health & Beauty10%
Others13%
Tenant ProfileLangham Place -
Mall(Dec 17)

7
Nowadays, Hong Kong consumers value malls for the experience they promise rather than
just the range of goods they offer. In order to enhance its visitors’ satisfaction and establish
itself as a community hub, Langham Place Mall once again introduced several “firsts” for
Hong Kong’s retail sector in 2017. The mall’s many retail innovations included the opening
of niche food and beverage stores, such as YiFang Taiwan Fruit Tea and Taoyuan Village. In
addition to cutting-edge experimental events aimed at making shoppers’ visits more
memorable, such as collaborating with our popular tenant, LINE Friends, the mall also
pioneered a hugely popular virtual reality promotion for Christmas 2017.
Langham Place Mall’s total rental income for 2017 rose 4.7% to HK$856 million (2016:
HK$817 million). Our active asset management strategy resulted in the significant growth of
turnover rent while base rent remained stable. The record high turnover rent of HK$116
million (2016: HK$86 million) was driven by the solid sales performance of the mall’s beauty
and skincare segments. The average passing base rents for Langham Place Mall as at 31
December 2017 stood at HK$176.71 per lettable sq. ft..
Net property operating expenses at the property for 2017 fell by 4.3% to HK$120 million
(2016: HK$125 million). Despite the unexpected increase in property miscellaneous expenses
following March 2017’s escalator incident, the combined effects of increased income from
building management fees and reduced improvement work expenses resulted in a HK$8
million decline in net building management expenses. Net property income for 2017 rose
6.4% to HK$736 million (2016: HK$692 million).
OUTLOOK
Key global economic data point towards a more optimistic outlook for the world’s major
markets in 2018. Accelerated growth in Mainland China’s economy and RMB appreciation
may also help boost the recovery of Hong Kong’s retail sector. Together with the ongoing
liberalization of its country’s financial markets, the Chinese government’s development of the
Guangdong-Hong Kong-Macau Greater Bay Area could well reinforce Hong Kong’s status as
a leading Asian financial hub. Collectively, these trends should also help strengthen long-term
demand for office space in the Central Business District.
The ongoing tight supply of Central office space should continue to benefit Central landlords
in the year ahead. The decentralized office supply should not pose a major threat as the target
segments are generally different from our office tenant mix. The occupancy of our office
portfolio looks set to remain high. Given that spot rents are still below the passing rents for
both Three Garden Road and Langham Place Office Tower, positive rental reversion should
continue in the coming year.

8
The recovery of Hong Kong’s retail sales in the second half of 2017 improved the operating
environment for retailers, we are prudently optimistic of our prospects for 2018. With the
emergence of experimental retail in the digital era, the Trust will continue to pioneer
innovative ways to enrich Langham Place Mall’s shopping experience.
Despite the improved global economic outlook, market uncertainties such as the possibility of
future interest rate rises remain. As a result, the Trust will maintain its policy of prudently
monitoring the market situation in order to mitigate the potential impact of any rise in interest
rates. The Trust will also start planning the enhancing of its credit profile by refinancing debts
scheduled to mature in 2019.
On property portfolio management, the Trust will keep exploring opportunities in rebalancing
the property portfolio. We consider acquisition opportunities in Greater China given the
development of the Guangdong-Hong Kong-Macau Greater Bay Area and the Belt and Road
initiative.
The brighter economic outlook for 2018 means the Trust’s existing property portfolio should
continue to deliver stable rental income growth. That said, potential rises in interest rates may
lead to higher finance costs and thus impact the Trust’s DPU growth. As a result, we will
continue to remain prudent when reviewing our portfolio and investigating sound strategic
opportunities to benefit and optimize value for unitholders.
VALUATION OF PROPERTIES
According to the Property Valuation Reports issued by Knight Frank Petty Limited on 5
February 2018, the appraised total value of Champion REIT properties, broken down by
usage as at 31 December 2017 were:
Three Garden Road Langham Place Sub-total
Dec 2017 Valuation HK$ mil HK$ mil HK$ mil
Office 44,632 9,450 54,082
Retail 600 20,510 21,110
Car Park 577 365 942
Miscellaneous 352 218 570
Total 46,161 30,543 76,704

9
LR 13.66(1)
As at 31 December 2017, the appraised value of the Trust’s property portfolio stood at
HK$76.7 billion, a rise of 14.8% from HK$66.8 billion as at December 2016. This increase
was primarily driven by higher rental assumptions and the compression of capitalization rates
at Langham Place Mall from 4.0% to 3.75%. The capitalization rates used to value Three
Garden Road and Langham Place Office during 2017 remained unchanged at 3.6% and 4.0%
respectively.
FINANCIAL REVIEW DISTRIBUTIONS
Champion REIT’s total distribution amount for 2017 was HK$1,413 million, representing
6.2% growth compared with HK$1,331 million for 2016. The total distribution amount for
2017 is based on 95% of the Trust’s distributable income and amended distribution formula in
the Trust Deed which became effective for the distribution period ended 31 December 2017.
The distribution per unit for the six months ended 31 December 2017 (“Final Distribution
per Unit”) stood at HK$0.1255. This is subject to adjustment that may result from the
issuance of any new units between 1 January 2018 and the record date. A further
announcement informing unitholders of any adjustment to the Final Distribution per Unit will
be made in due course.
With an Interim Distribution per Unit of HK$0.1171 and a Final Distribution per Unit of
HK$0.1255, the Total Distribution per Unit for 2017 amounted to HK$0.2426 (2016:
HK$0.2292). Based on the closing unit price of HK$5.73 recorded on 29 December 2017, the
Total Distribution per Unit represents a distribution yield of 4.2%.
CLOSURE OF REGISTER OF UNITHOLDERS
The Register of Unitholders will be closed from Friday, 4 May 2018 to Wednesday,
9 May 2018 (“Record Date”), both days inclusive, during which period no transfer of Units
will be effected. The payment of the distribution for the six months ended 31 December 2017
will be made on Wednesday, 16 May 2018 to Unitholders whose names appear on the
Register of Unitholders on the Record Date.
10
In order to qualify for the distribution for the six months ended 31 December 2017 and be
entitled to attend and vote at the 2018 Annual General Meeting to be held on Wednesday,
9 May 2018, all properly completed transfer forms (accompanied by the relevant Unit
certificates) must be lodged with Champion REIT’s Unit Registrar, Computershare Hong
Kong Investor Services Limited of Shops 1712-1716, 17th Floor, Hopewell Centre, 183
Queen’s Road East, Wanchai, Hong Kong for registration not later than 4:30 p.m. Thursday,
3 May 2018.
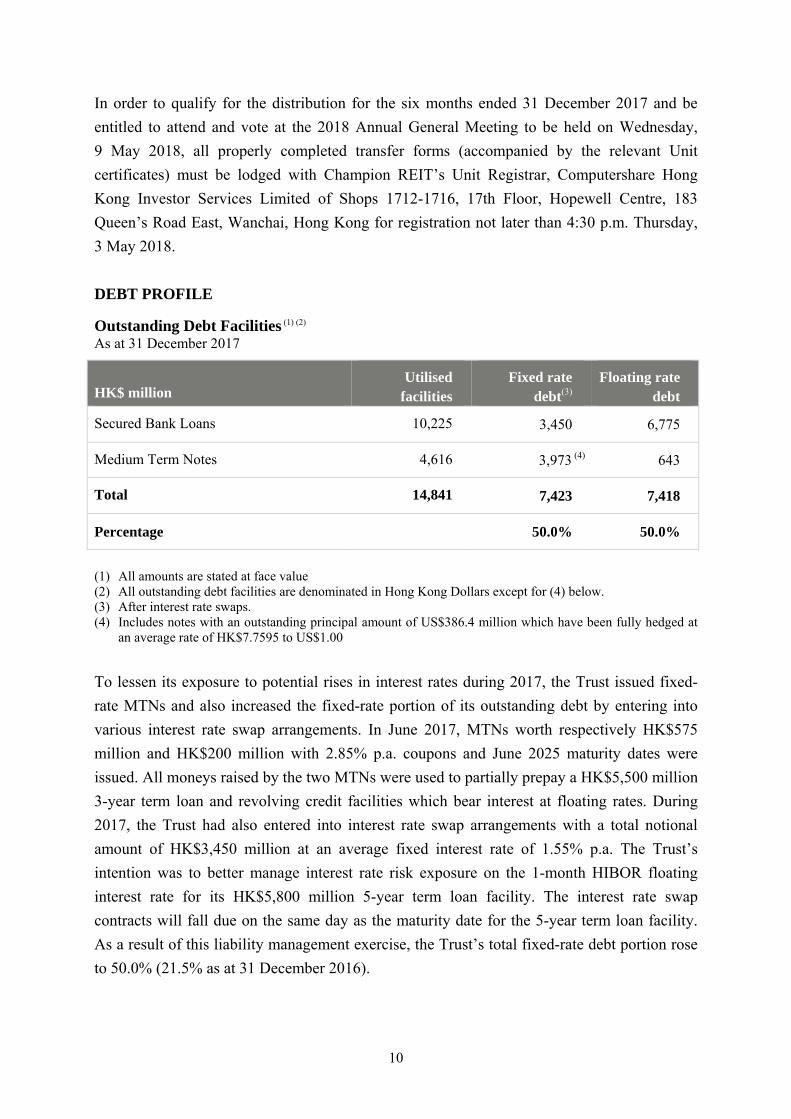
DEBT PROFILE
Outstanding Debt Facilities (1) (2) As at 31 December 2017
HK$ million Utilised
facilities Fixed rate
debt(3) Floating rate
debt
Secured Bank Loans 10,225 3,450 6,775
Medium Term Notes 4,616 3,973 (4) 643
Total 14,841 7,423 7,418
Percentage 50.0% 50.0%
(1) All amounts are stated at face value (2) All outstanding debt facilities are denominated in Hong Kong Dollars except for (4) below. (3) After interest rate swaps. (4) Includes notes with an outstanding principal amount of US$386.4 million which have been fully hedged at
an average rate of HK$7.7595 to US$1.00
To lessen its exposure to potential rises in interest rates during 2017, the Trust issued fixed-
rate MTNs and also increased the fixed-rate portion of its outstanding debt by entering into
various interest rate swap arrangements. In June 2017, MTNs worth respectively HK$575
million and HK$200 million with 2.85% p.a. coupons and June 2025 maturity dates were
issued. All moneys raised by the two MTNs were used to partially prepay a HK$5,500 million
3-year term loan and revolving credit facilities which bear interest at floating rates. During
2017, the Trust had also entered into interest rate swap arrangements with a total notional
amount of HK$3,450 million at an average fixed interest rate of 1.55% p.a. The Trust’s
intention was to better manage interest rate risk exposure on the 1-month HIBOR floating
interest rate for its HK$5,800 million 5-year term loan facility. The interest rate swap
contracts will fall due on the same day as the maturity date for the 5-year term loan facility.
As a result of this liability management exercise, the Trust’s total fixed-rate debt portion rose
to 50.0% (21.5% as at 31 December 2016).

11
As at 31 December 2017, the average life of the Trust’s outstanding debt was 3.5 years while
the effective interest rate (after interest rate swaps are taken into account) stood at 2.6%.
Outstanding Debt Maturity Profile (1) As at 31 December 2017
HK$ million % of total
Due in year 2019 4,425 29.8
Due in year 2021 5,800 39.1
Due in year 2022 643 4.3
Due in year 2023 2,998 (2) 20.2
Due in year 2024 200 1.3
Due in year 2025 775 5.2
Total 14,841 100.0
(1) All amounts are stated at face value (2) After accounting for cross-currency swaps
As at 31 December 2017, the total value of the Trust’s investment properties had been
appraised at HK$76.7 billion, a 14.8% increase over HK$66.8 billion as at 31 December 2016.
Correspondingly, gearing ratio (i.e. total borrowings as a percentage of gross assets) declined
from 21.7% as at 31 December 2016 to 18.9% as at 31 December 2017. At the same time, the
Trust’s gross liabilities (i.e. excluding net assets attributable to unitholders) as a percentage of
gross assets stood at 23.1% (31 December 2016: 26.1%).
NET ASSET VALUE PER UNIT
Net asset value per unit increased 18.8% to HK$10.36 as at 31 December 2017 (31 December
2016: HK$8.72), represented an 80.8% premium on the HK$5.73 closing unit price on 29
December 2017.

12
CASH POSITION
As at 31 December 2017, the Trust had total undrawn bank loan facilities of HK$300 million
and a cash balance of HK$1,190 million. With these financial resources, the Trust has
sufficient liquid assets to satisfy its working capital and operating requirements.
PLEDGE ASSETS
As at 31 December 2017, properties of Champion REIT with a fair value of HK$46.2 billion
were pledged to secure the debt facilities granted to the Trust. Only Three Garden Road was
pledged to secure the Trust’s bank loans.
COMMITMENTS
As at 31 December 2017, the Trust did not have any significant commitments.
NEW UNITS ISSUED
As at 31 December 2017, the total number of issued Units of Champion REIT was
5,823,028,120. As compared with the position of 31 December 2016, a total of 24,790,793
new Units were issued during the year as follows:-
On 30 August 2017, 11,029,600 new Units were issued to the REIT Manager at the price
of HK$5.79 per Unit (being the Market Price ascribed in the Trust Deed) as payment of
50% of the Manager’s Fee of approximately HK$63,861,000 for the first half of 2017.
On 14 March 2017, 13,761,193 new Units were issued to the REIT Manager at the price
of HK$4.50 per Unit (being the Market Price ascribed in the Trust Deed) as payment of
50% of the Manager’s Fee of approximately HK$61,925,000 for the second half of 2016.
REAL ESTATE SALE AND PURCHASE
Champion REIT did not enter into any (i) real estate sales and purchases; and (ii) investments
in Property Development and Related Activities (as defined in the Trust Deed) during the year
ended 31 December 2017.

13
RELEVANT INVESTMENTS The full investment portfolio of the Relevant Investments (as defined in the Trust Deed) of
Champion REIT as at 31 January 2018 is set out below:
As at 31 January 2018 Type Primary Listing Country
of Issuer
Currency Total Cost Mark-to-
market Value
Weighting
of GAV (%)
Credit
Rating
KERPRO 5 ⅞ 04/06/21 Bond Singapore Exchange BVI USD HK$67,296,000 HK$63,547,000 0.0885% N/A
NANFUN 4 ½ 09/20/22 EMTN Bond Singapore Exchange BVI USD HK$9,797,000 HK$9,665,000 0.0135% S&P BBB-
NANFUN 4 ⅞ 05/29/24 EMTN Bond Singapore Exchange BVI USD HK$56,603,000 HK$56,011,000 0.0780% S&P BBB-
NWDEVL 5 ¼ 02/26/21 Bond HKEX BVI USD HK$41,574,000 HK$40,889,000 0.0569% N/A
PCCW 3 ¾ 03/08/23 Bond Singapore Exchange BVI USD HK$49,641,000 HK$49,678,000 0.0692% S&P BBB
Total
HK$224,911,000 HK$219,790,000 0.3060%
Notes: (1) The weighting of GAV is by reference to the latest published accounts as adjusted for any distribution declared and any published
valuation.
(2) All figures presented above have been rounded to the nearest thousand.
CORPORATE GOVERNANCE
Champion REIT is committed to attaining global best practices and standards for all activities
and transactions conducted in relation to the Trust and any matters arising out of its listing or
trading on The Stock Exchange of Hong Kong Limited (“Stock Exchange”). The current
corporate governance framework adopted by the REIT Manager emphasizes accountability to
all Unitholders, resolution of conflict of interest issues, transparency in reporting, compliance
with relevant regulations and sound operating and investing procedures. The REIT Manager
has in place a comprehensive set of compliance procedures and guidelines (“Compliance
Manual”) which set out the key processes, systems and measures used to implement this
corporate governance framework.
Throughout the year ended 31 December 2017, the REIT Manager and Champion REIT have
complied with the Code on Real Estate Investment Trusts, the Trust Deed of Champion REIT,
the relevant provisions and requirements of the Securities and Futures Ordinance (“SFO”)
and the Rules Governing the Listing of Securities on the Stock Exchange (“Listing Rules”)
applicable to Champion REIT.

14
The REIT Manager and Champion REIT have also complied with the provisions of the
Compliance Manual and all code provisions, where applicable, as set out in the Corporate
Governance Code and Corporate Governance Report contained in Appendix 14 to the Listing
Rules throughout the Year. In respect of the code governing dealings in the securities of
Champion REIT (“Code on Securities Dealings”), specific enquiry has been made with the
REIT Manager’s Directors, senior executives and officers and they (except Mr. Lo Kai Shui
who has not yet signed and returned the confirmation to the REIT Manager) have confirmed
that they complied with the required standard set out in the Code on Securities Dealings
throughout the year ended 31 December 2017. The spouse of Ms. Wong Ka Ki, Ada (“Ms.
Wong”), the Executive Director of the REIT Manager in July 2017, had acquired an
aggregate of 1,200,000 Units, and in August 2017, disposed of 800,000 Units in Champion
REIT (“Dealings”). Upon becoming aware of the Dealings, Ms. Wong filed the disclosure of
notification forms in compliance with Part XV of the SFO within three business days.
The REIT Manager has in place a policy on the preservation and prevention of misuse of
inside information setting out the principles and procedures for handling and disclosing inside
information and such policy has been incorporated in the Compliance Manual and
communicated to the REIT Manager’s Directors, senior management and licensed
representatives.
Key components of the governance framework and the corporate governance report for the
year ended 31 December 2017 will be set out in the forthcoming Annual Report.
CORPORATE SOCIAL RESPONSIBILITYCorporate Social Responsibility is one of the tenets of Champion REIT’s management
philosophy. The REIT Manager recognizes that Corporate Social Responsibility will create
long-term value for customers, partners, investors, employees and other stakeholders. To this
end, issues covering ethical operating practices, the workplace, the environment and the
community are given serious consideration at the strategic level as well as in the day-to-day
operations of the Trust’s properties. Detailed information regarding the practices and the
achievements of Champion REIT in these areas will be published in the Annual Report.
15
BUY-BACK, SALE OR REDEMPTION OF UNITS
A general mandate for buy-back of Units in the open market was given by Unitholders at the
annual general meeting held on 23 May 2017. During the year ended 31 December 2017,
neither the REIT Manager nor any of Champion REIT’s special purpose vehicles had bought
back, sold or redeemed any Units pursuant to this mandate.
PUBLIC FLOAT
As far as the REIT Manager is aware, as at the date of this announcement, the Trust has
maintained a sufficient public float with more than 25% of the issued and outstanding Units
of Champion REIT being held by the public.
REVIEW OF ANNUAL RESULTS
The audited final results for the year ended 31 December 2017 have been reviewed by the
Disclosures Committee and the Audit Committee of the REIT Manager.
ANNUAL GENERAL MEETING
The 2018 Annual General Meeting of Champion REIT will be held on Wednesday, 9 May
2018 at 4:00 p.m.. Notice of the meeting will be published and despatched to Unitholders
in due course.
ISSUANCE OF ANNUAL REPORT
The 2017 Annual Report of Champion REIT will be despatched to Unitholders and
published on the websites of the Hong Kong Exchanges and Clearing Limited
(www.hkexnews.hk) and Champion REIT (www.ChampionReit.com) before the end of
March 2018.
App16 45(2)
App16 45(6)

16
SCOPE OF WORK OF MESSRS. DELOITTE TOUCHE TOHMATSUThe figures in respect of the Trust’s consolidated statement of financial position,
consolidated income statement, consolidated statement of comprehensive income,
distribution statement and the related notes thereto for the year ended 31 December 2017 as
set out in this announcement have been agreed by the Trust’s external auditor, Messrs.
Deloitte Touche Tohmatsu, to the amounts set out in the Trust’s audited consolidated
financial statements for the year. The work performed by Messrs. Deloitte Touche
Tohmatsu in this respect did not constitute an assurance engagement in accordance with
Hong Kong Standards on Auditing, Hong Kong Standards on Review Engagements or
Hong Kong Standards on Assurance Engagements issued by the Hong Kong Institute of
Certified Public Accountants and consequently no assurance has been expressed by Messrs.
Deloitte Touche Tohmatsu on this announcement.
BOARD OF DIRECTORS
As at the date of this announcement, the Board comprises three Non-executive Directors,
namely Dr. Lo Ka Shui (Chairman), Mr. Ip Yuk Keung, Albert and Mr. Lo Kai Shui; one
Executive Director, Ms. Wong Ka Ki, Ada (Chief Executive Officer) and four Independent
Non-executive Directors, namely Mr. Cha Mou Sing, Payson, Mr. Cheng Wai Chee,
Christopher, Mr. Ho Shut Kan and Mr. Shek Lai Him, Abraham.
By Order of the Board
Eagle Asset Management (CP) Limited
(as manager of Champion Real Estate Investment Trust)
Lo Ka Shui
Chairman
Hong Kong, 14 February 2018

17
FINANCIAL STATEMENTS CONSOLIDATED INCOME STATEMENT FOR THE YEAR ENDED 31 DECEMBER 2017 NOTES 2017 2016 HK$'000 HK$'000 Rental income 5 2,396,316 2,267,340 Building management fee income 268,878 258,185 Rental related income 6 34,705 31,569 _________ _________
Total revenue 2,699,899 2,557,094 Property operating expenses 7 (533,585) (530,580) _________ _________
Net property income 2,166,314 2,026,514 Interest income 17,729 12,094 Manager's fee 8 (259,958) (243,182) Trust and other expenses (20,667) (22,546) Increase in fair value of investment properties 9,850,151 2,001,856 Finance costs 9 (348,638) (347,897) _________ _________
Profit before tax and distribution to unitholders 10 11,404,931 3,426,839 Income taxes 11 (265,279) (245,257) _________ _________
Profit for the year, before distribution to unitholders 11,139,652 3,181,582 Distribution to unitholders (1,412,730) (1,330,794) _________ _________
Profit for the year, after distribution to unitholders 9,726,922 1,850,788 _________ _________ _________ _________
Basic earnings per unit 12 HK$1.92 HK$0.55 _________ _________ _________ _________

18
CONSOLIDATED STATEMENT OF COMPREHENSIVE INCOME FOR THE YEAR ENDED 31 DECEMBER 2017 2017 2016 HK$'000 HK$'000 Profit for the year, after distribution to unitholders 9,726,922 1,850,788 _________ _________
Other comprehensive (expense)/income: Items that may be subsequently reclassified to profit or loss: Cash flow hedges: Fair value adjustments on cross currency swaps and interest rate swaps designated as cash flow hedges (39,856) 105,378 Reclassification of fair value adjustments to profit or loss 3,626 (3,552) _________ _________
(36,230) 101,826 _________ _________
Total comprehensive income for the year 9,690,692 1,952,614 _________ _________ _________ _________

19
CONSOLIDATED STATEMENT OF FINANCIAL POSITION AS AT 31 DECEMBER 2017 NOTES 2017 2016 HK$'000 HK$'000 Non-current assets Investment properties 76,704,000 66,841,500 Notes receivables 220,531 221,121 Derivative financial instruments 36,587 32,408 __________ __________
Total non-current assets 76,961,118 67,095,029 __________ __________
Current assets Trade and other receivables 13 294,910 316,391 Tax recoverable 6,421 3,716 Bank balances and cash 1,190,389 957,531 __________ __________
Total current assets 1,491,720 1,277,638 __________ __________
Total assets 78,452,838 68,372,667 __________ __________
Current liabilities Trade and other payables 14 1,338,049 1,280,344 Deposits received 652,685 575,699 Tax liabilities 38,921 48,421 Distribution payable 730,979 696,481 __________ __________
Total current liabilities 2,760,634 2,600,945 __________ __________
Non-current liabilities, excluding net assets attributable to unitholders Secured bank borrowings 10,172,623 10,924,600 Medium term notes 4,612,054 3,814,384 Derivative financial instruments 17,674 - Deferred tax liabilities 538,611 497,975 __________ __________
Total non-current liabilities, excluding net assets attributable to unitholders 15,340,962 15,236,959 __________ __________
Total liabilities, excluding net assets attributable to unitholders 18,101,596 17,837,904 __________ __________
Net assets attributable to unitholders 60,351,242 50,534,763 __________ __________ __________ __________
Number of units in issue ('000) 15 5,823,028 5,798,237 __________ __________ __________ __________
Net asset value per unit 16 HK$10.36 HK$8.72 __________ __________ __________ __________

20
DISTRIBUTION STATEMENT FOR THE YEAR ENDED 31 DECEMBER 2017 2017 2016 HK$'000 HK$'000 Profit for the year, before distribution to unitholders 11,139,652 3,181,582 Adjustments:
- Manager's fee paid and payable in units 129,979 121,591 - Increase in fair value of investment properties (9,850,151) (2,001,856) - Non-cash finance costs 26,968 68,178 - Deferred tax 40,636 38,686 _________ _________
Total distributable income to unitholders (note (i)) 1,487,084 1,408,181 _________ _________ _________ _________
Interim distribution, paid to unitholders (note (ii)) 681,751 634,313 Final distribution, to be paid to unitholders (note (iii)) 730,979 696,481 _________ _________
Total distributions for the year 1,412,730 1,330,794 _________ _________ _________ _________
Payout ratio 95.0% 94.5% _________ _________ _________ _________
Distributions per unit: Interim distribution per unit, paid to unitholders (note (ii)) HK$0.1171 HK$0.1094 Final distribution per unit, to be paid to unitholders (note (iii)) HK$0.1255 HK$0.1198 __________ __________
HK$0.2426 HK$0.2292 __________ __________ __________ __________
Notes: (i) Pursuant to the Trust Deed, the total distributable income is profit for the year, before distribution to unitholders as adjusted to eliminate the effects of Adjustments (as set out in the Trust Deed) which have been recorded in the consolidated income statement for the relevant year. Champion REIT is required to distribute to unitholders not less than 90% of its distributable income of each financial period. (ii) The interim distribution per unit of HK$0.1171 (2016: HK$0.1094) for the six months ended 30
June 2017 is calculated based on the interim distribution of HK$681,751,000 (2016: HK$634,313,000) for the period and 5,823,028,120 units (2016: 5,798,237,327 units) in issue as of 22 September 2017 (2016: 21 September 2016), which was the record date for the period. The distribution was paid to unitholders on 6 October 2017.
(iii) The final distribution per unit of HK$0.1255 (2016: HK$0.1198) for the year ended 31 December
2017 is calculated based on the final distribution to be paid to unitholders of HK$730,979,000 (2016: HK$696,481,000) for the period and 5,823,028,120 units (2016: 5,811,998,520 units) in issue as at 31 December 2017 (2016: 23 May 2017). The final distribution per unit for the year ended 31 December 2017 will be subject to further adjustments upon the issuance of units between 1 January 2018 and 9 May 2018, which is the record date set for such period. The final distribution will be paid to unitholders on 16 May 2018.

21
NOTES TO THE CONSOLIDATED FINANCIAL STATEMENTS FOR THE YEAR ENDED 31 DECEMBER 2017 1. GENERAL
Champion REIT is a Hong Kong collective investment scheme authorised under section 104 of
the Securities and Futures Ordinance (Chapter 571 of the Laws of Hong Kong) and its units are listed on The Stock Exchange of Hong Kong Limited (the "HKSE"). Champion REIT is governed by the deed of trust dated 26 April 2006, as amended from time to time (the "Trust Deed"), entered into between Eagle Asset Management (CP) Limited (the "Manager" of Champion REIT) and HSBC Institutional Trust Services (Asia) Limited (the "Trustee"), and the Code on Real Estate Investment Trusts (the "REIT Code") issued by the Securities and Futures Commission of Hong Kong.
The principal activity of Champion REIT and its subsidiaries (the "Group") is to own and invest
in income-producing commercial properties in Hong Kong with the objective of producing stable and sustainable distributions to unitholders and to achieve long term growth in the net asset value per unit. The address of the registered office of the Manager and the Trustee, is Suite 3008, 30th Floor, Great Eagle Centre, 23 Harbour Road, Hong Kong, and 1 Queen's Road Central, Hong Kong, respectively.
The consolidated financial statements are presented in Hong Kong dollars, which is the same as
the functional currency of Champion REIT. 2. APPLICATION OF NEW AND REVISED HONG KONG FINANCIAL REPORTING
STANDARDS ("HKFRSs") The Group has applied the following amendments to HKFRSs issued by the Hong Kong Institute
of Certified Public Accountants ("HKICPA") for the first time in the current year: Amendments to HKAS 7 Disclosure Initiative Amendments to HKAS 12 Recognition of Deferred Tax Assets for Unrealised Losses Amendments to HKFRS 12 As part of the Annual Improvements to HKFRSs 2014 - 2016 Cycle

22
2. APPLICATION OF NEW AND REVISED HONG KONG FINANCIAL REPORTING
STANDARDS ("HKFRSs") - continued New and revised HKFRSs in issue but not yet effective The Group has not early applied the following new and revised HKFRSs that have been issued
but are not yet effective: Amendments to HKAS 28 As part of the Annual Improvements to HKFRSs 2014 - 2016 Cycle1 Amendments to HKAS 28 Long-term Interests in Associates and Joint Ventures2 Amendments to HKAS 40 Transfers of Investment Property1 Amendments to HKFRS 2 Classification and Measurement of Share-based Payment Transactions1 Amendments to HKFRS 4 Applying HKFRS 9 Financial Instruments with HKFRS 4 Insurance Contracts1 Amendments to HKFRS 9 Prepayment Features with Negative Compensation2 Amendments to HKFRS 10 Sale or Contribution of Assets between an Investor and HKAS 28 and its Associate or Joint Venture4 Amendments to HKFRSs Annual Improvements to HKFRSs 2015-2017 Cycle2 HKFRS 9 Financial Instruments1 HKFRS 15 Revenue from Contracts with Customers and the related Amendments1 HKFRS 16 Leases2
HKFRS 17 Insurance Contracts3
HK(IFRIC) – Int 22 Foreign Currency Transactions and Advance Consideration1 HK(IFRIC) – Int 23 Uncertainty over Income Tax Treatments2
1 Effective for annual periods beginning on or after 1 January 2018 2 Effective for annual periods beginning on or after 1 January 2019 3 Effective for annual periods beginning on or after 1 January 2021 4 Effective for annual periods beginning on or after a date to be determined

23
3. SIGNIFICANT ACCOUNTING POLICIES
Statement of compliance The consolidated financial statements have been prepared in accordance with HKFRSs issued by the HKICPA. In addition, the consolidated financial statements include the relevant provisions of the Trust Deed, the REIT Code and the Rules Governing the Listing of Securities on the HKSE.
Basis of preparation of consolidated financial statements
The consolidated financial statements have been prepared on the historical cost basis, except for investment properties and certain financial instruments, which are measured at fair values.
Historical cost is generally based on the fair value of consideration given in exchange for goods
and services. Fair value is the price that would be received to sell an asset or paid to transfer a liability in an
orderly transaction between market participants at the measurement date, regardless of whether that price is directly observable or estimated using another valuation technique. In estimating the fair value of an asset or a liability, the Group takes into account the characteristics of the asset or liability if market participants would take those characteristics into account when pricing the asset or liability at the measurement date. Fair value for measurement and/or disclosure purposes in the consolidated financial statements is determined on such a basis.
A fair value measurement of a non-financial asset takes into account a market participant's ability
to generate economic benefits by using the asset in its highest and best use or by selling it to another market participant that would use the asset in its highest and best use.
In addition, for the financial reporting purposes, fair value measurements are categorised into
Level 1, 2 or 3 based on the degree to which the inputs to the fair value measurements are observable and the significance of the inputs to the fair value measurement in its entirety, which are described as follows:
Level 1 inputs are quoted prices (unadjusted) in active markets for identical assets or
liabilities that the entity can access at the measurement date; Level 2 inputs are inputs, other than quoted prices included within Level 1, that are
observable for the asset or liability, either directly or indirectly; and Level 3 inputs are unobservable inputs for the asset or liability.

24
4. SEGMENT INFORMATION
The Group's operating segments, based on information reported to the chief operating decision
maker ("CODM"), management of the Manager, are identified for the purpose of resource allocation and performance assessment and more specifically focused on the operating results of the three investment properties, namely Three Garden Road, Langham Place Office Tower and Langham Place Mall.
Segment revenue and results The following is an analysis of the Group's revenue and results by the three investment properties
for the year under review. For the year ended 31 December 2017 Three Langham Garden Place Langham Road Office Tower Place Mall Consolidated HK$'000 HK$'000 HK$'000 HK$'000 Revenue 1,376,761 392,298 930,840 2,699,899 _________ _______ _________ _________ _________ _______ _________ _________
Segment results - Net property income 1,112,370 318,211 735,733 2,166,314 _________ _______ _________
Interest income 17,729 Manager's fee (259,958) Trust and other expenses (20,667) Increase in fair value of investment properties 9,850,151 Finance costs (348,638) _________
Profit before tax and distribution to unitholders 11,404,931 Income taxes (265,279) _________
Profit for the year, before distribution to unitholders 11,139,652 Distribution to unitholders (1,412,730) _________
Profit for the year, after distribution to unitholders 9,726,922 _________ _________
Amounts regularly provided to the CODM but not included in the measure of segment profit or loss: Increase in fair value of investment properties 6,820,598 973,000 2,056,553 9,850,151 _________ _______ _________ _________ _________ _______ _________ _________

25
4. SEGMENT INFORMATION - continued
Segment revenue and results - continued For the year ended 31 December 2016 Three Langham Garden Place Langham Road Office Tower Place Mall Consolidated HK$'000 HK$'000 HK$'000 HK$'000 Revenue 1,297,618 370,100 889,376 2,557,094 _________ _______ _________ _________ _________ _______ _________ _________
Segment results - Net property income 1,039,647 295,100 691,767 2,026,514 _________ _______ _________
Interest income 12,094 Manager's fee (243,182) Trust and other expenses (22,546) Increase in fair value of investment properties 2,001,856 Finance costs (347,897) _________
Profit before tax and distribution to unitholders 3,426,839 Income taxes (245,257) _________
Profit for the year, before distribution to unitholders 3,181,582 Distribution to unitholders (1,330,794) _________
Profit for the year, after distribution to unitholders 1,850,788 _________ _________
Amounts regularly provided to the CODM but not included in the measure of segment profit or loss: Increase in fair value of investment properties 1,690,180 75,000 236,676 2,001,856 _________ _______ _________ _________ _________ _______ _________ _________
Other segment information Three Langham Garden Place Langham Road Office Tower Place Mall Consolidated HK$'000 HK$'000 HK$'000 HK$'000 For the year ended 31 December 2017 Additions to non-current assets 10,402 - 1,947 12,349 _______ _______ _______ _______ _______ _______ _______ _______
For the year ended 31 December 2016 Additions to non-current assets 52,820 - 3,824 56,644 _______ _______ _______ _______ _______ _______ _______ _______

26
4. SEGMENT INFORMATION - continued
Other segment information - continued Segment assets and liabilities
For the purpose of performance assessment, fair values of investment properties are reviewed by
the CODM. As at 31 December 2017, the fair value of Three Garden Road, Langham Place Office Tower and Langham Place Mall was HK$46,161,000,000 (2016: HK$39,330,000,000), HK$9,450,000,000 (2016: HK$8,477,000,000) and HK$21,093,000,000 (2016: HK$19,034,500,000), respectively.
Save as abovementioned, no other assets or liabilities are included in the measures of the Group's
segment reporting. Geographical information The Group's activities are all carried out in Hong Kong. The Group's revenue from external customers and information about its non-current assets are all
located in Hong Kong. Information about major tenants There were no tenants whose revenue contributed over 10% of the total revenue of the Group for
the both years ended 31 December 2017 and 2016. 5. RENTAL INCOME
2017 2016 HK$'000 HK$'000 Rental income 2,350,893 2,223,879 Car park income 45,423 43,461 _________ _________
2,396,316 2,267,340 _________ _________ _________ _________
6. RENTAL RELATED INCOME
2017 2016 HK$'000 HK$'000 Interest income from tenants 524 274 Promotional levy income 11,768 10,834 Sundry income 22,413 20,461 _______ _______
34,705 31,569 _______ _______ _______ _______

27
7. PROPERTY OPERATING EXPENSES
2017 2016 HK$'000 HK$'000 Building management expenses 304,039 298,678 Car park operating expenses 10,230 10,185 Government rent and rates 72,059 64,348 Legal cost and stamp duty 3,110 5,949 Promotion expenses 19,909 24,614 Property and lease management service fee 73,379 66,683 Property miscellaneous expenses 5,690 2,576 Rental commission 41,258 50,984 Repairs and maintenance 3,911 6,563 _______ _______
533,585 530,580 _______ _______ _______ _______
8. MANAGER'S FEE
Pursuant to the Trust Deed, as the net property income of Champion REIT exceeds HK$200
million for each of the six months ended 30 June 2017 and 31 December 2017, the Manager is entitled to receive 12% of the net property income for each of the six months ended 30 June 2017 and 31 December 2017 as remuneration.
2017 2016 HK$'000 HK$'000 Manager's fee: In the form of units 129,979 121,591 In the form of cash 129,979 121,591 _______ _______
259,958 243,182 _______ _______ _______ _______
Based on the election on 30 November 2012, the Manager continued to receive 50% of the
Manager's fee for each of the six months ended 30 June and 31 December 2017 arising from the properties currently owned by Champion REIT in the form of units calculated based on the issue price per unit as determined in accordance with the Trust Deed, and the balance of 50% in the form of cash.
9. FINANCE COSTS
2017 2016 HK$'000 HK$'000 Finance costs represent: Interest expense on bank borrowings 200,757 216,510 Interest expense on medium term notes 146,931 130,371 Other borrowing costs 950 1,016 _______ _______
348,638 347,897 _______ _______ _______ _______

28
10. PROFIT BEFORE TAX AND DISTRIBUTION TO UNITHOLDERS
2017 2016 HK$'000 HK$'000 Profit before tax and distribution to unitholders has been arrived at after charging (crediting): Auditors' remuneration 2,050 2,010 Trustee's remuneration 12,548 11,643 Principal valuer's fee 335 355 Other professional fees and charges 4,655 4,282 Roadshow and public relations expenses 1,258 1,334 Bank charges 253 387 Exchange difference (1,515) (86) _______ _______ _______ _______
11. INCOME TAXES
2017 2016 HK$'000 HK$'000 Hong Kong Profits Tax: Current tax - Current year 225,173 204,851 - (Over) underprovision in prior years (530) 1,720 _______ _______
224,643 206,571 Deferred tax - Current year 40,636 38,686 _______ _______
265,279 245,257 _______ _______ _______ _______
Hong Kong Profits Tax is calculated at 16.5% of the estimated assessable profits for both years. 12. BASIC EARNINGS PER UNIT
The calculation of the basic earnings per unit before distribution to unitholders is based on the
profit for the period, before distribution to unitholders of HK$11,139,652,000 (2016: HK$3,181,582,000) with the weighted average number of units of 5,815,899,965 (2016: 5,791,214,549) in issue during the year, taking into account the units issuable as Manager's fee for its service for each of the year ended 31 December 2017 and 2016.
There were no dilutive potential units during the years ended 31 December 2017 and 2016,
therefore the diluted earnings per unit has not been presented.

29
13. TRADE AND OTHER RECEIVABLES
2017 2016 HK$'000 HK$'000 Trade receivables 24,646 21,035 Deferred rent receivables 183,291 210,191 Deposits, prepayments and other receivables 86,973 85,165 _______ _______
294,910 316,391 _______ _______ _______ _______
Rental receivables from tenants are payable on presentation of invoices. The collection is closely
monitored to minimise any credit risk associated with these receivables. Aging analysis of the Group's trade receivables presented based on the invoice date at the end of
the reporting period is as follows: 2017 2016 HK$'000 HK$'000 0 - 3 months 24,646 21,035 _______ _______ _______ _______
Included in the Group's trade receivable balance are debtors with aggregate carrying amount of
HK$24,646,000 (2016: HK$21,035,000) which are past due at the reporting date for which the Group has not provided for impairment loss as there has not been a significant change in credit quality and the amounts are still considered recoverable. The Group does not hold any collateral over these balances.
14. TRADE AND OTHER PAYABLES
2017 2016 HK$'000 HK$'000 Trade payables 103,854 75,117 Rental received in advance 24,502 25,775 Other payables and accruals 246,218 215,977 Accrued stamp duty 963,475 963,475 _________ _________
1,338,049 1,280,344 _________ _________ _________ _________
The accrual for stamp duty is based on the current stamp duty rate of 4.25% (2016: 4.25%) and
the stated consideration of HK$22,670,000,000 in the property sale and purchase agreements for the legal assignment of the investment properties which Champion REIT acquired the property interest in Three Garden Road upon listing.

30
14. TRADE AND OTHER PAYABLES - continued
Aging analysis of trade payables presented based on the invoice date at the end of the reporting
period is as follows: 2017 2016 HK$'000 HK$'000 0 - 3 months 103,854 75,117 _______ _______ _______ _______
15. ISSUED UNITS
Number of units HK$'000 Balance at 1 January 2016 5,771,681,761 24,038,427 Payment of Manager's fee through issuance of new units during the year (note (i)) 26,555,566 114,002 ____________ ____________
Balance at 31 December 2016 5,798,237,327 24,152,429 Payment of Manager's fee through issuance of new units during the year (note (i)) 24,790,793 125,787 ____________ ____________
Balance at 31 December 2017 5,823,028,120 24,278,216 ____________ ____________ ____________ ____________
Note:
(i) Details of units issued during the year as payment of Manager's fee are as follows:
Issue price per Payment of the unit determined Manager's fees based on the Aggregate Number of Issue date for the period Trust Deed issue price units issued HK$ HK$'000 In 2017 14 March 2017 1.7.2016 to 31.12.2016 4.500 61,926 13,761,193 30 August 2017 1.1.2017 to 30.6.2017 5.790 63,861 11,029,600 _______ __________
125,787 24,790,793 _______ __________ _______ __________
In 2016 11 March 2016 1.7.2015 to 31.12.2015 3.830 54,337 14,187,113 24 August 2016 1.1.2016 to 30.6.2016 4.824 59,665 12,368,453 _______ __________
114,002 26,555,566 _______ __________ _______ __________

31
16. NET ASSET VALUE PER UNIT
The net asset value per unit is calculated by dividing the net assets attributable to unitholders as at
31 December 2017 of HK$60,351,242,000 (2016: HK$50,534,763,000) by the number of units in issue of 5,823,028,120 as at 31 December 2017 (2016: 5,798,237,327).
17. NET CURRENT LIABILITIES
At 31 December 2017, the Group's net current liabilities, calculated as current liabilities less
current assets, amounted to HK$1,268,914,000 (2016: HK$1,323,307,000). 18. TOTAL ASSETS LESS CURRENT LIABILITIES
At 31 December 2017, the Group's total assets less current liabilities amounted to
HK$75,692,204,000 (2016: HK$65,771,722,000). 19. CAPITAL COMMITMENT
2017 2016 HK$'000 HK$'000 Capital expenditure in respect of the improvement works of investment properties contracted for but not provided in the consolidated financial statements - 10,000 _______ _______ _______ _______