2017 exit survey report - gnb.ca
TRANSCRIPT

2017 Grade 12 Exit Survey
Anglophone Sector
Department of Education and Early Childhood Development

The 2017 Grade 12 Exit Survey can be found on the Department of Education and Early Childhood Development's website at: www2.gnb.ca/content/gnb/en/departments/education/publications.html.
Le rapport pour le secteur francophone Sondage de fin d'études secondaires 2017 est disponible au www2.gnb.ca/content/gnb/fr/ministeres/education/publications.html.
This report was prepared by the Corporate Data Management and Analysis Branch, Policy and Planning Division. Published by:Department of Education and Early Childhood Development P.O. Box 6000 Fredericton, New Brunswick E3B 5H1 Canada ISBN: 978-1-4605-1811-3 September 2017

Table o Methodol Detailed RSection A
StudeSection B
Most Cours
Section CSatisfBullyiVictim
Section DSatisfE-Lea
Section EExpeParticExpeHoursKnowVotingParen
Section FFrencFrencLanguEnrolMain
Section GPhysi
Section HSatisf
Section I –Most ExpeParenBarrieSatisfFinanPlansJobs/
Appendix
f Conten
ogy ............
Results ......A – Demograent Profile ...
B – AcademiRecent Fina
se RepetitionC – School Efaction with ng ..............
m of BullyingD – E-Learnifaction with arning and N – Experienriential Oppocipation in a riential Lears per Week
wledge of Gog Intention..ntal Involvem– Languag
ch Immersioch Immersiouage Skills .ment in an AReason for
G – Physicalical Activity a
H – Learningfaction with – My FutureLikely to do ctation Regant/Guardian ers to Pursufaction with
ncial Literacys to Stay in t/Occupationa
x……………
ts
...................
...................aphic Inform...................ic Backgroual Marks ......n .................
Environmenthe School E...................
g ..................ng and NewTechnology
New Technontial Opportortunities at Career Expning OpportSpent on Ex
overnance ......................
ment in Schoe Skills ......n .................n Retention ...................Additional LaEnrolling in l Activity anand Healthy
g Environmethe Learninge .................After High S
arding FuturExpectationing a Post-Sthe Knowledy ..................he Provinceal Categorie
………………
...................
...................mation ...........................und ...................................................
nt .................Environment......................................
w TechnologUsed at Schlogies .........
tunities .......School and loration Progunities ........
xtra-Curricul......................................
ool and Distr............................................................................
anguage Coan Additiona
nd Healthy Ly Living ........ent ..............g Environme...................
School .........re Studies ....ns RegardingSecondary Edge Acquired...................
e ...................es, Entrepren
……………
....................
....................
...................
...................
...................
...................
...................
...................t .......................................................gies ...........hool ..................................................Outside Sch
gram .............................ar Activities ......................................rict Governa............................................................................urse ...........al LanguageLiving ..............................................ent .......................................................................g their Child’
Education ....d at School .......................................neurial Plans
………………
...................
...................
...................
...................
...................
...................
...................
...................
...................
...................
...................
...................
...................
...................
...................hool ..................................................and Part-Ti......................................
ance ...........................................................................................................
e Course ..........................................................................................................................................’s Future Stu............................................................................s .................
………………
....................
....................................................................................................................................................................................................................................................................................................................................me Employm................................................................................................................................................................................................................................................................................................................udies ..........................................................................................................
………………
...................
...................
................. 3
................. 4
................. 5
................. 5
................. 6
................. 7
................. 7
............... 10
............... 10
............... 11
............... 11
............... 11
............... 13
............... 13
............... 14
............... 14ment ....... 15............... 16............... 17............... 17............... 18............... 18............... 18............... 19............... 19............... 20............... 21............... 21............... 22............... 22............... 24............... 24............... 26............... 27............... 28............... 29............... 30............... 30............... 31
……………
... 2
... 3
…..33

2
Methodol In April 20in the provgraduates opportunitprovides thwell their s It should bexperienceongoing emaking. Sample D The Exit Ssuperintensubsequen A list contschool’s greturn varrepresents2017. Note: The Data Anal The survewere instruschool exanswer oConsequean N/A opone or mooverview o Since the representadocument
ogy
17, the Depvince the link
the oppories at schoohe Departmeschool prepa
be noted thae and is not ffort to be t
esign and S
Survey was dndents in 20nt surveys, a
taining the graduating pried from ons 34% of the
same samp
lysis
y is made uucted to ansperience. Or who ans
ently, a spection was avare of the onl
of the results
survey wasative of the to refer to th
artment of Ek to an onlinrtunity to sol, access toent with dataared them fo
at the objectan evaluatio
transparent
Selection
developed in06. To ensuand with a fe
names of raopulation, w
ne school toe entire Gra
pling rules al
up of differeswer the qu
Only one anwered a q
cific number ailable for stline coursess, the “N/A’’
s administeopinion of ahe students
Education ane version ofshare their o new technoa on student
or the future.
tive of this son of schooland accoun
n consultatioure continuityew questions
andomly sewas submitteo another, bade 12 stude
lso applied to
nt questionsestions, unle
nswer was aquestion inc
‘n’ is assoctudents to w
s in which theanswers are
red to a saall students. surveyed.
nd Early Chif the 2017 G
opinion oologies and ts’ plans afte
survey is to gs and distric
ntable, and t
on with varioy in reportins being adde
lected Graded to each hbut a total oent populatio
o the francop
s organized ess otherwisaccepted fo
correctly areiated with e
whom the que student wae not include
ample of stuConsequen
ldhood DeveGrade 12 Exi
n various the school
er high scho
gather informcts. The survthe data ga
ous sectors ng, the majoed or revised
de 12 studehigh school of 2,019 stuon in the an
phone secto
into nine thse indicatedor each quee not inclu
each questiouestion did nas enrolled).ed in the ana
udents, the ntly, the term
elopment seit Survey. Thissues sucenvironmen
ool and their
mation abouvey is part ofathered help
of the Depaority of questd each year.
ents, represein the prov
udents werenglophone s
or.
hemes (Apped, as an oveestion. Stududed in theon. For somenot apply (e.g. To get a malysis.
results obtam “responde
ent all high she survey prch as enricnt. The surve
perception
ut students’ f the Depart
ps inform de
artment and tions were u.
enting 45% vince. The e surveyed, sector as of
endix A). Sterview of thedents who de total sume of the queg. satisfactio
more represe
ained may ent’’ is used
schools rovides chment ey also of how
school tment’s ecision-
district used in
of the rate of which March
udents eir high did not
m (n=). estions, on with
entative
not be in this

Detailed R Section A Table 1 snumber ofnearly 49%language only 2.4%Mi’kmaw/W The vast m Just over communitythey beloncitizens bo Just over 6their moththeir paren Only 8.2%said they f Sixty-nine secondary
Results
A – Demogra
shows the df female res%. Less thamost spoke
% spoke bWolastoqey
majority (96%
7% of respy, and 3.2%nged to a viorn in or outs
61% of resper, but only nts.
% of respondfollow a Pers
percent of y education,
aphic Inform
demographicpondents wn two percen at home.
both Frenchat home.
%) of respon
ondents sel% not living in
sible minoriside Canada
pondents live4.9% of res
dents said thsonalized Le
respondenand 59% ind
mation
c profile of as slightly hnt of studen Ninety-two
h and Eng
ndents were
f-identified an a First Naty. The vas
a.
ed with bothpondents liv
hey are a peearning Plan
ts indicateddicated the s
students whhigher at 50%nts identified percent of
glish at ho
17 or 18 yea
as Aboriginaation commust majority (
parents. Nved with thei
erson with a (PLP).
d their paresame for the
ho participa%, while ma as gender irespondent
ome. Nea
ars old.
al, includingunity. Seven(91%) of the
Nineteen perir father. Ne
diagnosed
nt/mother/gueir parent/fat
ated in the Eale respondeindependentts spoke Enarly 5% of
g 4.2% livingn percent ofe responden
rcent of respearly 8% sha
learning dis
uardian hadther/guardia
Exit Surveyents account. English wglish at homf students
g in a First f respondennts were Ca
pondents liveared time be
sability, while
d completedn.
3
. The nted for was the me and
spoke
Nation ts said nadian
ed with etween
e 8.6%
d post-

4
1 (n=): number of respondents
Table 1 – Student Profile
Gender (n1=2019) Citizenship (n=2019)
Male 48.7% A landed immigrant in Canada 4.3%
Female 50.2% A non-permanent resident of Canada 1.9%
Gender independent 1.1% A Canadian citizen born in or outside Canada 90.9%
Other 2.8%
Language spoken at home (n=2019) Living with (n=2019)
English 92.0% Both parents 61.2%
French 0.5% Mother only 18.6%
Equally, both French and English 2.4% Father only 4.9%
Mi’kmaw/Wolastoqey 4.8% Time shared with both parents 7.9%
Other Languages(s) 0.3% Guardian(s) 4.3%
Other 3.1%
Age (n=2019) Member of a visible minority or an Aboriginal person (n=2017)
16 or under 0.3% An Aboriginal person living in a First Nation community 4.2%
17 51.8% An Aboriginal person not living in a First Nation community 3.2%
18 43.9% A visible minority (other than Aboriginal) 7.0%
19 3.1%
20 0.4% A person with a diagnosed learning disability (n=2018)
21 or over 0.4% Yes 8.2%
Following a Personalized Learning Plan (PLP) (n=2019)
Parent/guardian post-secondary education (n=2019)
Yes 8.6% Parent/mother/guardian 69.2%
Parent/father/guardian 58.6%

5
Section B – Academic Background Most Recent Final Marks Although the academic data varied depending on the subject, the overall proportion of students in each category is similar. Most respondents reported receiving marks in the 80% to 89% range or 90% or more range in most subjects. Physical Education and Health (88%), Cooperative education (84%) and Skilled trades (80%) are the three subjects in which marks were the highest (80% or higher). Conversely, Mi’kmaw/Wolastoqey (10%), Native Studies (5.8%), and Law (5.4%) are the subjects with the highest failure rates (less than 60%). It should be noted that these marks were self-reported and may not represent the actual results achieved.
Table 2 – Most Recent Final Marks What were your most recent final marks in the following subject areas? 90% or
more 80%-89% 70%-79% 60%-69% Less than 60% n
Computer science (any) 38.8% 27.8% 19.1% 10.7% 3.6% 580
Cooperative education 58.2% 26.1% 10.5% 4.1% 1.1% 555
English 28.9% 37.6% 21.9% 10.3% 1.3% 1926
French Immersion Language Arts 32.6% 34.3% 22.6% 9.3% 1.2% 926
History (any) 34.8% 36.5% 20.6% 7.6% 0.6% 1657
Law 34.4% 32.0% 18.3% 9.9% 5.4% 634
Mi’kmaw/Wolastoqey 28.8% 20.0% 21.3% 20.0% 10.0% 80
Mathematics (any) 27.4% 31.3% 24.6% 13.7% 3.0% 1783
Music 53.5% 25.1% 13.7% 5.8% 1.8% 927
Native Studies 50.6% 22.7% 15.1% 5.8% 5.8% 172
Physical Education and Health 66.4% 21.7% 8.2% 2.8% 1.0% 1260
Post-intensive French 36.5% 31.8% 19.5% 10.6% 1.6% 559
Science (any) 36.5% 34.6% 18.9% 8.5% 1.6% 1734
Skilled trades (any) 44.8% 35.6% 12.9% 5.2% 1.5% 466
Visual arts 51.9% 25.5% 13.2% 7.3% 2.1% 969

6
Course Re Four out ohad to tacourse moa passinghad to re3.6%, tworespondenmore courmark.
epetition
of five respoake a Gradore than oncg mark. Twetake one o courses. Onts had to rerses to recei
ndents nevede 11 or 1ce to receiv
welve percencourse, an
Only 2.8% oetake three oive a passin
er 2
ve nt nd of or ng
Figure Were yoonce in courses
1 – Course ou required toorder to recei
s?
8
12.0%
3.6%1.3%
Repetition o take any Graive a passing
81.6%
% 1.5%
Course R(n=20
ade 11 or 12 g mark; if yes,
Repetition 016)
Never hamore tha
1 course
2 course
3 course
More tha
courses more how many
ad to take a couran once
e
es
es
an 3 courses
e than
rse

Section C Satisfactio Results shrespondenstudents wclassroomproblems. Eighty-nine78% agreerespondenindicated t Seventy-foschool exavailable m Sixty percenvironmeenvironme
Figure 2 –How do you
60.7%
4.8%
Die
C – School E
on with the
how that resnts believed were well be. In all, 61%
e percent ofed or strongnts indicatedthat if they h
our percent xperience acmet their nee
cent of respent’s sustaientally friend
– Satisfactionu feel about e
9.6%
24.9%%
iscipline is maeffectively (n=
Environmen
School Env
pondents sethat discipli
ehaved in cla% of respon
f respondently agreed th
d that schooad a problem
of respondecademically eds.
pondents indinability. Sely.
n with the Seach of the fol
anaged =2016)
Stronglydisagree
Disagree
Agree
Strongly agree
nt
vironment
eemed satisine was maass but only dents did no
ts agreed orhat it was a pl was a placm, there was
ents enjoyedchallenging
dicated that eventy-five
chool Envirllowing statem
72.7%
5.3%
Studentsc
fied with thenaged effec59% said s
ot believe th
r strongly agplace wherece where thes an adult th
d their schog. Seventy-s
their schoopercent o
ronment ments?
4.8%
17.2%
%
s are well behclass (n=2010)
Strodisa
Dis
Agr
Stro
e school envctively at schstudents werhat learning
greed that the they felt reey felt like thhey could tal
ool experiencsix percent
ol encouragof responde
haved in )
onglyagree
sagree
ree
ongly agree
vironment. Shool. Seventre well beha was interru
ey felt safe aespected. Sixhey belongek to at schoo
ce, and 66%said the v
ged them toents felt t
355.5%
3.4%
Studentsoutside
Sixty-six percty-eight perc
aved outsideupted by dis
at their schoxty-nine perced. Eighty pol.
% considerevariety of c
o contribute heir schoo
8.7%
32.4%
s are well behaof the classro(n=2016)
Strondisag
Disag
Agree
Stron
7
cent of cent of
e of the scipline
ool and cent of
percent
ed their ourses
to the ol was
aved oom
nglygree
gree
e
ngly agree

8
Figure 2 –How do you
33.6%
5.6%
Learnbehav
3.2%
21.7
I fe
– Satisfactionu feel about e
9.6%
51.1%%
ing is interrupviour problemstudents (n=2
Sd
D
A
S
% 7.5%
67.6%
%
eel safe at my (n=2016)
6
10
M
n with the Seach of the fol
pted by the ms of other 2016)
Stronglydisagree
Disagree
Agree
Strongly agree
school
Stronglydisagree
Disagree
Agree
Strongly agree
6.2%
19.0%
64.3%
0.5%
y school is enfriendly (
chool Envirllowing statem
5.9%
63.9
13.7%
Felt r
2
56.7%
9.7%
My schacadem
%
nvironmentally(n=2017)
StrondisagDisag
Agree
Stronagree
ronment ments?
%
16.5%
9%
%
respected at s(n=2016)
6.0%
27.6%
hool experiencmically challe
(n=2017)
y
nglygreegree
e
nglye
school
Stronglydisagree
Disagree
Agree
Stronglyagree
ce was nging
StronglydisagreeDisagree
Agree
Stronglyagree
7
18.3%
57.9%
15.8%
I enjoyed myexperience (
56.9%
12.1%
My schoofelt like I
6
17.
62.8%
13.1%
The vaavailabl
7.9%
%
y school (n=2018)
Strongdisagr
Disag
Agree
Strongagree
8.4%
22.5%
ol is a place wbelonged (n=
Strodisa
Disa
Agre
Stro
6.3%
.7%
riety of coursle met my nee(n=2017)
Strodisa
Disa
Agre
Stro
glyree
ree
e
gly
where I =2016)
onglyagree
agree
ee
ongly agree
es eds
nglygree
agree
ee
ngly agree

Figure 2 –How do you
– Satisfactionu feel about e
5
6
n with the Seach of the fol
7.9%
32.2%53.0%
.9%
My school encontrib
environment'(n=
chool Envirllowing statem
%
courages me ute to the 's sustainabili
=2017)
Stronglydisagree
Disagree
Agree
Strongly
ronment ments?
to
ity
ye
e
y agree
6
2
Ifa
6.3% 13.3%
60.2%
20.2%
f I had a problan adult I coul
school (
lem, there wasd talk to at the(n=2017)
Stronglydisagree
Disagree
Agree
Strongly a
s e
agree
9

10
Bullying Bullying at39% of rebullied in e
Victim of Of the resindicated teachers, victims sai Figure 4 –
Did the bu
Did t
Did you reor anoth
Did youyou w
Was the
Figure 3
Bullied
Bullied in
Bull
t school wasespondents elementary s
Bullying
spondents wit was by thand 58% reid the issue
– Victim of B
ullying occur fre
he bullying ususame studen
eport the bullyiner adult at the
u inform your pwere bullied at s
e bullying issue
– Bullying
d in high schoo
n middle schoo
lied in element(n=2007
s present at reported be
school and 1
who reportedhe same peeported beinhad been re
Bullying
equently? (n=1
ually come fromts? (n=1046)
ng to your teacschool? (n=10
parent/guardianschool? (n=10
e resolved? (n=
0%
l (n=2007)
l (n=2011)
ary school)
all grade leveing bullied.19% in high s
d being bullieople. Fortng a victim esolved.
0%
021)
m the
chers33)
n that14)
=983)
Vict
19.2%
39.0%
33.2%
20%
B
vels, but waThirty-three
school.
ied at schooty-seven peof bullying
57.2%
46.7%
58.2%
55.2%
20%
tim of Bully
Ye
%
% 40%% o
BullyingYes
as more preve percent of
ol, 57% werrcent of resto their par
81.6%
%
40%
% of Respon
ying
es
80.8
% 60of Responden
valent in midf responden
re bullied frespondents rrents. In the
4
53.3%
4
44
60%
ndents
No
8%
61.0%
66.8%
0% 8nts
No
ddle school, nts reported
equently anreported it te end, 55%
42.8%
18.4%
%
41.8%
4.8%
80% 1
0% 1
where d being
d 82% o their of the
00%
00%

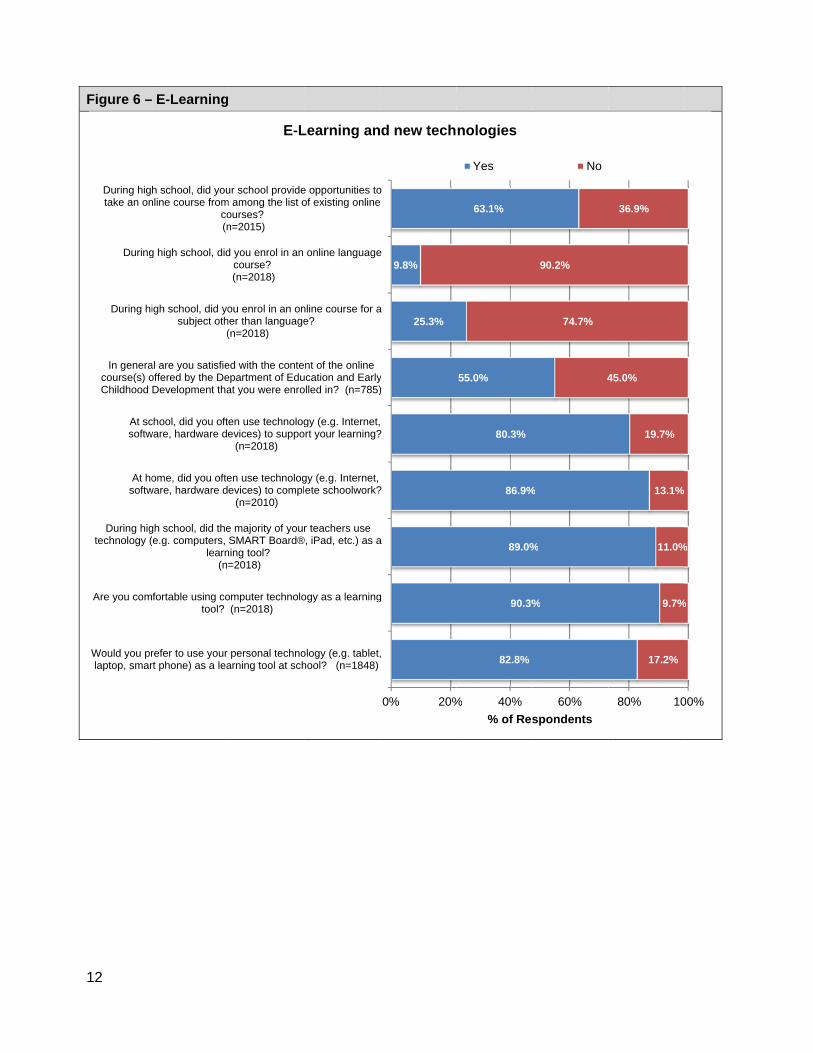
Section D Satisfactio When asksatisfied oquality of tcomputer use compopportunitvery dissa
E-Learnin Sixty-threeonline cousatisfied wChildhoodonline cou Ninety perEighty-sevand 80% ateachers uthree perctablet, lapt
Figure 5 –Indicate yo
Access to cpurposes in
Opp
Useful
Opport
D – E-Learni
on with Tec
ked to indicor very satisfthe device. skills acquir
puters effecies their schtisfied with o
ng and new
e percent ofurse from amwith the cont Developmerse other tha
rcent of resven percent at school toused technocent of resptop, smart ph
– Satisfactioour level of sa
computers/technn school, includ
of the de
Ability to use
portunities to imp
lness of the com
unities to learn
ng and New
chnology Us
cate their lefied with theSeventy-fivered at schooctively, 28%hool gave theopportunities
technologie
f respondenmong the list tent of the oent. Twentyan language
spondents wsaid they of support lealogy (e.g. coondents saihone) as a le
on with Techatisfaction for
nological deviceing the function
evice (n=2019)
computers effe
prove computer
mputer skills acq
to use electroni(n=2019)
w Technolog
sed at Scho
evel of satiseir access toe percent of ol. While 84
% said theyem to impros to learn to
es
nts indicatedof existing o
online coursy-five percene during high
were comfortften used coarning. Eightomputers, Sd they wouearning tool
hnology User each of the f
e for educationanality and quality
ctively (n=2019
r skills (n=2019
quired (n=2012
c research tools
Te
Very d
gies
ool
sfaction witho computersrespondent
4% of respoy were disve their comuse electron
d that their sonline cours
se offered bynt of responh school and
table using omputer techty-nine percMART Boarld prefer to at school.
ed at Schoofollowing state
7.8%
3.0%
6.0%
5.1%
6.5%
18.0%
12.0%
22.0%
19.7%
23.2%
0% 20
aly
9)
9)
)
s
echnology
issatisfied
h technologys at school, ts were satisondents werssatisfied omputer skills,nic research
school provses. Fifty-fivy the Depar
ndents indicad 9.8% in an
computer tehnology at h
cent of respord®, iPad, etuse their o
ol ements.
%
%
%
60.
% 40%
% of Re
Dissatisfied
y, 74% of including the
sfied with there satisfied wr very diss, and 30% w tools.
vided opportve percent inrtment of Edated they w online langu
echnology ahome to comondents saidtc.) as a leaown persona
57.1%
.8%
57.6%
61.4%
58.6%
60%
espondents
Satisfied
respondentse functionale usefulnesswith their absatisfied wiwere dissatis
tunities to tandicated theducation and
were enrolleduage course
as a learninmplete schood their high rning tool. Eal technolog
17.2%
23.4%
14.4%
13.8%
11.7%
80% 1
Very satisfie
11
s were ity and s of the bility to th the
sfied or
ake an y were d Early d in an e.
ng tool. olwork, school Eighty-
gy (e.g.
%
%
%
%
100%
d
12
Figure 6 –
During higtake an on
During
During hi
In generacourse(s) oChildhood
At scsoftw
At hosoftw
During higtechnology (
Are you com
Would you prlaptop, smar
– E-Learning
h school, did younline course from
co (n
g high school, did
igh school, did yosubject oth
(
al are you satisfieoffered by the DeDevelopment tha
chool, did you oftware, hardware de
ome, did you ofteware, hardware d
gh school, did thee.g. computers,
learn (n
fortable using cotool?
refer to use your rt phone) as a lea
ur school providem among the list oourses?n=2015)
d you enrol in an course?
(n=2018)
ou enrol in an onher than language(n=2018)
ed with the conteepartment of Eduat you were enro
en use technologevices) to suppo (n=2018)
en use technologevices) to compl (n=2010)
e majority of yourSMART Board®
ning tool?=2018)
omputer technolo(n=2018)
personal technoarning tool at sch
E-L
e opportunities toof existing online
online language
nline course for ae?
nt of the onlineucation and Earlyolled in? (n=785)
gy (e.g. Internet,ort your learning?
gy (e.g. Internet,ete schoolwork?
r teachers use®, iPad, etc.) as a
ogy as a learning
ology (e.g. tablet,hool? (n=1848)
Learning an
9.8%
25.3%
0% 20%
o
e
a
y)
?
?
a
g
,
d new tech
63.1%
55.0%
80.3%
86.9%
89.0%
90.3%
82.8%
% 40%% of Res
nologies
Yes
%
%
%
90.2%
74.7%
4
60%spondents
No
36.9%
45.0%
19.7%
13.1%
11.0%
9.7%
17.2%
80% 10
%
%
00%

Section E Experient When askrespondenorganized 53% of reWorldbooknewspapeoften rece Figure 7 –
Figure 8 –Did you par
Cultural act
Cultural
How often (e.g. EBSCO
Read the ne
Rece
New Br
Person
Car
– Experien
tial Opportu
ked to indicants said they
through scespondents k) offered a
er or online nived tutoring
– Experienti
– Participatiorticipate in an
ivities organize
activities organ(n=
do you use theO, Google Sch
your schoo
ewspaper, onli(n=2
eived tutoring d
Co-op or
unswick Youth C(n=
al Development (PDCP
reer Focusing pro(
If yes, did yo
ntial Opport
unities at Sc
ate the oppoy often or shool and 46said they
at school. news, or wag during high
ial Opportun
on in a Co-ony of the follow
ed through scho
nized separate=2018)
e electronic resolar, Worldbool? (n=2018)
ne news or wa2018)
uring high scho
career exploratio
Career Connectio=2017)and Career Plan
P) (n=2017)ogram (e.g. Care(n=2017)
ou find it valuabl
Co-op
tunities
chool and O
ortunities theometimes h
6% in culturnever or raHowever, 5tched TV ne
h school.
nities at Sch
p or Career wing during yo
0%
ool (n=2018)
e from school
search toolsok) offered at
tch TV news
ool (n=1120)
Experientia
7
0%
on (n=2018)
ons Program
nning course
eer Cruising)
e? (n=1435)
p or Career
Outside Sch
ey had to pahad the opporal activities arely used 54% indicatews. Thirty-o
hool and Ou
Explorationour high scho
17.8%
23.1%
27.8%
17.0%
45.2%
% 20%
al Opportun
Never
35.6%
.5%
54.
57
20%
r ExploratioY
hool
articipate in ortunity to porganized electronic rted they ofone percent
utside Schoo
n Program ool years?
%
29.9%
31.1%
25.4%
29.3%
40%
% of Res
nities
Rarely
.7%
7.7%
65.6%
92
40%
% of Resp
on ProgramYes
experientialparticipate inseparate froresearch tooften or somof responde
ol
23.6%
39.5%
34.6%
27.8%
36.2%
60%
spondents
Sometimes
64.4%
2.5%
45
4
60%
pondents
No
l activities, 5n cultural acom school. ols (e.g. EB
metimes reaents sometim
%
24.5%
12.8%
11.1%
19.0%
17.5%
6.8
80% 10
Often
5.3%
42.3%
34.4%
80% 10
13
52% of ctivities
About BSCO, ad the mes or
%
8%
00%
00%

14
Participat In all, 36%but just 7participateprogram. valuable. Experient When ask68% of theresidentialvisual artspercent of volunteer often had them. Fiftyprojects.
Figure 9 –
Oppor
Opport
Oppo
Opportu
Opportuwere o
Opportunit
tion in a Car
% of respond7.5% in theed in a Perso Of those t
tial Learning
ed to indicate responden finish, pow
s, music, thef respondentlearning exthe opportuny-four perce
– Participati
rtunities to take
tunities to take
ortunities to paexperi
unities to particthat are care
unities to particof a high degre
ties to participa(n=
reer Explor
dents partice New Brunonal Developthat did par
g Opportun
te the occasnts said the
wer train aneatre), and ts indicated xperiences. nity to partic
ent indicated
ion in Exper
e courses in the(n=2019)
courses in fine
articipate in voluiences (n=2019
cipate in learnineer related (n=2
cipate in elective of interest to
ate in entrepren=2019)
ation Progr
ipated in a nswick Youtpment and Crticipate in a
nities
sions they hay often or sd chassis, c65% in leathat they soSeventy-thre
cipate in elecd that they
riential Lear
e skilled trades
e arts (n=2019)
unteer learning9)
ng experiences2019)
ve courses thatyou (n=2019)
neurial projects
Experient
ram
co-op/careeth Career C
Career Planna career foc
ad to participsometimes pculinary tecrning exper
ometimes or ee percentctive coursehad the opp
rning Opport
19.5%
7.4%
13.9%
11.3%
9.6%
22.8%
10.3%
2
23
17.9%
0% 20%
s
)
g
s
t
s
tial Learning
Never
er exploratioConnectionsning course,cusing prog
pate in expeparticipated hnology), 82
riences that often had thof respond
es that were portunity to
tunities
12.6%
22.0%
3.7%
%
23.7%
31
39.0%
41
% 40%
% of Re
g Opportun
Rarely
n program ds Program. , and 58% ingram, 66% s
eriential learin skilled tra2% in fine are career-
he opportunents said thof a high departicipate
.0%
38.0%
43.9%
1.1%
34.7%
60%
espondents
nities
Sometimes
during high Fifty-five p
n a career fosaid they fo
rning opportuades coursearts course-related. Sixity to particihey sometimegree of intein entrepre
36.9%
43.2%
26.1%
21.1%
31.4%
18.8%
80% 1
s Often
school percent ocusing ound it
unities, es (e.g. s (e.g.
xty-four pate in mes or erest to neurial
100%

Hours per Part-time eactivities othan 10 ho Forty-threeby the schactivity outorganized participateband, stud Forty-eighweek, increspondenresponden
Figure 10Approximaduring the
Sports o
Sp
Other exte
Extra-curr
Org
Vo
Tu
r Week Spe
employmentoutside schoours a week.
e percent of hool, 41% intside of schoby the sch
ed in activitiedent council)
t percent of luding 5.6%
nts said theynts were invo
– Hours perately how ma
e school year?
rganized by the
ports not organ(n=2
ended physicalschool (n=2
ricular activitiesschool (n=2
ganized activitieschool (
Social action
olunteer work i(n=2
utoring another
Part-time emp
nt on Extra
t (40%), spoool (9.1%) w.
the respondn sports actool. Sixteen hool, while es organize).
the respond% who voluy tutored anolved in soci
r Week Spenny hours per ?
e school (n=20
ized by the sch2018)
activity outside2019)
s organized by 2019)
es not through n=2019)
n groups (n=20
n your commu2019)
r student (n=20
ployment (n=20
Extra-Cu
-Curricular
orts organizewere the top
dents indicattivities outsipercent spe11% spent d by their s
dents did at lnteered mo
nother studeial action gro
t on Extra-Cweek are you
27.
3
0%
018)
hool
e of
the
the
019)
nity
019)
018)
urricular Act
0 h
Activities a
ed by the scp three activ
ted that theyde the scho
ent between more than
school at lea
least one hoore than 10ent for at leaoups for an h
urricular Actu involved in e
56.6%
58.7%
.0%
57.4%
60.3%
51.6%
32.9% 1
20%
tivities and
hr 1-5 hr
and Part-Tim
chool (11%)vities to whic
y participatedool, and 73%6 and 10 ho
n 10 hours ast one hou
our of volunte0 hours perast one houhour or more
tivities and Pextra-curricul
80.2%
81.3%
45.1%
10.7% 16.6%
40%% of Respon
Part-Time W
rs 6-10 h
me Employ
, and other ch responde
d in sports a% in other ours a weeka week. F
ur a week (e
eer work in tr week. Ninur a week. Te per week.
Part-Time Emlar activities a
16.4%
23.0%
25.2%
27.5%
34.3%
1
% 3
60% 8dents
Work
hrs More
ment
extended pents devoted
activities orgextended p
k involved in orty-three pe.g. drama,
the communneteen percTwenty perc
mployment and part-time
%
13.9%
13.4%
15.9%
10.6%
18.8%
10.1%
7.2%
3.7%
8.4%
3.6%
11.1%
7.7%
9.1%
7.4%
5
5.
39.9%
80% 10
than 10 hrs
15
hysical d more
anized hysical sports
percent clubs,
nity per cent of cent of
work
%
%
%
%
%
5.0%
2.2%
.6%
1.7%
00%

16
Knowledg Responderesponden11% of reSupport Cstudent coMatters). Knowledgeabout the Brunswickfair amoun Figure 11 –How much d
InternationaTra
ge of Gover
ents had limitnts knew nospondents s
Committee. ouncil. On
e of governmGovernme
k and 27% ant or a lot ab
– Knowledgdo you know
District Educat
Parent School
Y
Municipal
Government
Gove
al organizationsade Organizatio
rnance
ted knowledothing (79%)said they haHowever, 5ly 13% sai
ment varied nt of Canadbout municiout internati
e of Governabout each o
tion Council (D
l Support Com (n=2018)
Student co
Youth organizat
(local) governm
t of New Bruns
ernment of Can
s (e.g. United Non, NATO) (n=
dge of gover) or very littad a fair am6% said thed the same
by level. Fifda, while 4pal (local) gonal organiz
nance of the following
EC) (n=2018)
mittee (PSSC)
uncil (n=2018)
tions (n=2018)
ment (n=2018)
swick (n=2018)
nada (n=2018)
Nations, World2018)
Knowledg
nance at thetle (16%) ab
mount or a loey had a faire about you
fty percent o1% said thovernment. zations (e.g.
g?
16.2%
41.2
21.7%
17.5%
30.5%
0% 20%
ge of Govern
Nothing
e school andbout the Disot of knowler amount oruth organiz
of respondene same ab Thirty-six p OECD, Uni
78.9%
65.3%
60.9%
2%
27.8%
37.0%
32.5%
33
% 40%
% of R
nance
Very little
d district levestrict Educatedge about r a lot of knoations (e.g.
nts knew a fbout the Gopercent of reited Nations
2
31.9%
3.4%
38.0%
36.1
60%
Respondents
A fair amo
el. The majtion Councilthe Parent Sowledge abo NBASAA,
fair amount oovernment oespondents k).
15.7%
23.8%
25.8%
4.4
8.6%
10.4%
21.6%
32.8%
%
25.1%
18.0%
5
8.
13.8
11.
80%
unt A lot
ority of . Just School out the Youth
or a lot of New knew a
4%
%
%
1.0%
2.3%
%
3.0%
.3%
6%
8%
0%
100%

Voting Int Seventy-erespondento vote election aprovincial were legaSeventy vote in aThe intentcouncil elecollege w79%. Onlysaid they pnext Distrelection. Parental I Roughly thschool or dEducation School As
Figure 1Were you
Dis
Pa
tention
ight percnts said thein the nex
and 77% inelection, w
ally entitledpercent pl
a municipaltion to vote ections at un
was slightly y 39% of resplanned to vict Educatio
nvolvemen
hree in ten redistrict goveCouncil, 8.
sociation.
3 – Parentaur parents/gua
strict Education
arent School S
Home and Sch
cent of y planned xt federal the next
when they to vote. anned to election. in student
niversity or higher at
spondents vote in the on Council
t in School
espondents ernance. On4% in the P
l Involvemeardians involv
n Council (DEC
upport Commit(n=2018)
hool Associatio
Pa
and Distric
did not knownly 2.9% conParent Scho
Figure 12 Do you planentitled to?
nt in Schooved in the foll
Studentuniversity
Municip
Provinc
Fede
Distr
2
8
6
0%
C) (n=2018)
ttee (PSSC)
on (n=2018)
arental Invo
ct Governan
w whether thnfirmed that ool Support
– Voting Intn to vote in th
l and Districlowing?
t council electioy or college (n=
pal election (n=
cial election (n=
ral election (n=
rict Education C(n=2017)
2.9%
8.4%
6.9%
% 20%
lment in GoYes
nce
heir parents their parentCommittee
tention he following e
ct Governan
3
0% 2
on at=1678)
=2017)
=2017)
=2017)
Council
Voting
65.6%
60.9%
60.5%
40%% of Resp
overnanceNo
or guardiants were invo, and 6.9%
elections when
nce
78.6%
70.0%
76.8%
78.0%
39.4%
20% 40%
% of Resp
IntentionYes
60%pondents
Don
ns were invoolved in the
in the Hom
n you are lega
21.4
30.0%
23.2
22.0
60.6%
60% 80%
ondents
No
31.5%
30.7%
32.6%
80% 10
’t know
17
olved in District
me and
ally
4%
%
2%
0%
100%
00%

18
Section F French Im According Of those e44% in late French Im Of those wstudies, 63high schoo
– Languag
mmersion
to respondeenrolled at oe immersion
mmersion Re
who had be3% remaineol and 14% s
FigurIf you
FiguIf yo
%of
Res
pond
ents
%of
Res
pond
ents
e Skills
ents, 50% wone point in
n.
etention
een enrolleded in an immswitched bef
re 14 – Frencwere enrolle
ure 15 – Frenu were enroll
0.0%
10.0%
20.0%
30.0%
40.0%
50.0%
60.0%
E
% o
f Res
pond
ents
0.0%
10.0%
20.0%
30.0%
40.0%
50.0%
60.0%
70.0%
Copro
% o
f Res
pond
ents
Fren
were never en French Im
d in Frenchmersion progfore high sch
ch Immersiod in French Im
nch Immersled in French
55.8%
Early French Im(Grade 1 en
French Im
62.6%
ontinue with the Fogram until Grade
12
nch Immers
enrolled in anmersion, 56
Immersion gram, while hool.
on mmersion, we
ion RetentioImmersion, d
mmersionntry)
L
mersion (n
14.4%
FIe
Switch to the Eprogram befor
school
ion Retenti
n immersion6% were en
at one poi23% switch
ere you enroll
on did you:
44.2%
Late French Im(Grades 6-
=1005)
23
Englishre high
Switch toprogra
sc
on (n=1002
n program durolled in ea
int during thhed to the E
lled in:
mmersion-12)
3.1%
o the Englisham in highchool
2)
uring their srly immersio
he course oEnglish prog
studies. on and
of their gram in

Language When askFrench outhey were 51% could
Enrolmen Fifteen pethan Englilanguage.
Figure 16 –Indicate how
Figure 17aLanguage Were you ecourse at s
I am co
I could ea
I can e
EnrolCours
e Skills
ed about theutside schoo
taught Frend easily unde
nt in an Add
rcent of respish or Frenc
– Languagew much you a
a – EnrolmenCourse
ever enrolled ichool, other t
mfortable using
asily understand (n
easily understan
I use Frenc
15.0%
85.0%
ment in an Ase, other tha
(n=
eir languagel. Howevernch as a seerstand new
itional Lang
pondents indch, at schoo
Skills agree with the
t in an Addit
in an additionthan English o
French outside s
my teacher whenn=2018)
d new ideas in F
ch in my daily act
%
Additional Laan English or=2016)
e skills, 48%, only 23% i
econd languaideas in Fre
guage Cour
dicated they ol, and 38%
e following sta
tional
nal language or French?
0
school (n=2018)
n taught French
French (n=2017)
tivities (n=2017)
Lang
St
Yes
No
anguage r French
% of respondeindicated usage, 60% coench.
rse
were enrollereported th
atements con
FigurLangI am cother
25.8%
19.7%
24.0%
41.8
0% 20%
guage Skills
trongly disagre
ents said thsing French ould easily
ed in an addhey were co
ncerning langu
re 17b – Comguage comfortable ur than English
8%
26.4%
20.3%
25.0%
% 40%
% of Res
s
ee Disagree
28.
25.2%
12.9%
I am comfother t
ey were comin their dailyunderstand
ditional languomfortable u
uage skills.
mfortable Us
using an addih or French.
35.2%
33.4%
38.2%
33.0%
60%
spondents
e Agree
33.1%
.7%
fortable usinthan English
(n=317)
mfortable spy activities. their teache
uage courseusing an add
ing an Addit
itional languag
%
15.5%
14.4%
21.9%
17.9%
7.5
80% 1
Strongly agree
ng a languagh or French
Strongly Dis
Disagree
Agree
Strongly Agr
19
peaking When er, and
e, other ditional
tional
ge,
%
5%
00%
e
ge
sagree
ree

20
Sixty-two pparticipate
Main Reas The main interest, fofamily reas
Figure 17cI am satisfie
percent of ree in additiona
son for Enr
reason for lollowed by sons (7.5%)
c – Satisfactioed with the op
FigLaWhlan
espondents wal language
rolling in an
earning an aother reaso.
on with Oppopportunities th
gure 18 – Maanguage Couhat was your nguage cours
I amm
ad
7.5
10.1
1
What wad
were satisfiecourses.
n Additional
additional lans (19%), t
ortunities to hat my schoo
ain Reason urse main reasone?
19.0%
19.
48.3%
13.3%
satisfied wity school gavditional lang
18.3
45.5%
%
18.7%
was your maiditional lang
ed with the o
Language
anguage, givtravel purpo
participate il gave me to p
for Enrolling
for enrolling i
%
.4%
th the opporve me to partguage course
3%
5%
n reason forguage course
opportunities
Course
ven by 46% oses (18%),
in an Additioparticipate in
g in an Add
in an addition
rtunities thatrticipate in es. (n=315)
Strongly Di
Disagree
Agree
Strongly Ag
r enrolling ine? (n=268)
Travel purpose
Personal intere
Family reasons
Job opportunit
Other reason(s
s their schoo
of respondejob opportu
onal Languag additional lan
itional
nal
t
isagree
gree
n an
es
est
s
ies
s)
ol provided th
ents, was peunities (10%
ge Course nguage cours
hem to
ersonal %), and
ses.
Section G
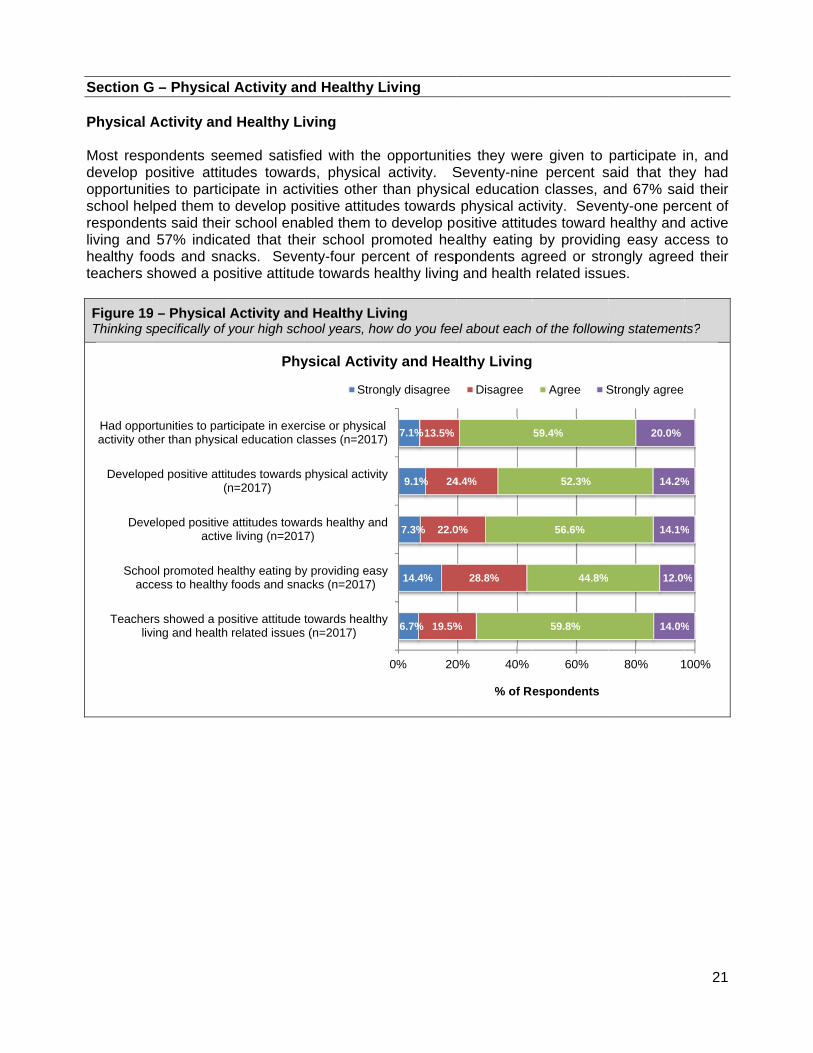
Physical A Most respdevelop popportunitschool helrespondenliving and healthy foteachers s Figure 19Thinking s
Had oppoactivity oth
Develope
Deve
Schooacc
Teacherliv
G – Physical
Activity and
ondents seepositive attituies to particped them to
nts said their57% indica
ods and snashowed a po
9 – Physical specifically of
rtunities to parther than physic
ed positive attit(n
eloped positiveactive
ol promoted hecess to healthy
rs showed a poving and health
l Activity an
d Healthy Li
emed satisfiudes toward
cipate in actio develop por school enaated that theacks. Seve
ositive attitud
Activity andyour high sch
ticipate in exercal education cl
tudes towards n=2017)
e attitudes towae living (n=201
ealthy eating byfoods and sna
ositive attitude related issues
Phy
nd Healthy L
iving
ied with theds, physicalivities other ositive attitudabled them toeir school prenty-four perde towards h
d Healthy Livhool years, ho
rcise or physicalasses (n=2017
physical activit
ards healthy an7)
y providing easacks (n=2017)
towards healths (n=2017)
ysical Activ
Stron
Living
e opportunitie activity. Sthan physic
des towards o develop poromoted hearcent of resphealthy living
ving ow do you fee
7.1%
9.1%
7.3%
14.4%
6.7%
13.5%
24
22.0
19.5%
0% 20
al7)
ty
nd
sy
hy
vity and Hea
ngly disagree
es they werSeventy-ninecal education
physical acositive attitualthy eatingpondents agg and health
el about each
4.4%
0%
28.8%
%
0% 40%
% of Re
althy Living
Disagree
re given to e percent sn classes, a
ctivity. Seveudes toward by providingreed or strorelated issu
of the followi
59.4%
52.3%
56.6%
44.8%
59.8%
60%
espondents
Agree S
participate isaid that theand 67% saienty-one per
healthy andng easy accongly agree
ues.
ing statement
20.0%
14.2%
14.1%
12.0%
14.0%
80% 1
Strongly agree
21
in, and ey had id their cent of
d active cess to ed their
ts?
%
%
%
%
100%

22
Section H Satisfactio With respelearning etheir subjeunderstand According indicated trespondenthat the les Seventy-thschool hadoffered acschool was
Figure 20 –Indicate you
Respondehad read oindicated tguidance a
Mos
Most of m
Lessons
If I did not
My school
Overal
My s
My schth
I feel m
H – Learning
on with the
ect to their nvironment.ect area, and.
to 85% of that their scnts said that ssons involv
hree percend strong leactivities and s well-organ
– Satisfactiour overall sati
ents were asor viewed, athat the matabout how to
st teachers kno
my teachers preis easy to und
s involved discu(
understand a lavailable fo
experience en(n
l, teachers care
chool has a strschoo
hool offers activhe overall scho
my school is wewere
g Environme
Learning E
high school Eighty-sev
nd 82% said
f the responchool experie
their teacheved discussio
nt of responarning enviro
initiatives tnized and ex
on with the Lisfaction with
sked whethend if it helpeerials and eo do researc
ow their subject
esent the materderstand. (n=2
ussions, projec(n=2017)
lesson in classor me. (n=2017
ncouraged me tn=2016)
ed about my le(n=2016)
rong learning eol spirit. (n=201
vities and initiaol environment
ell-organized aclear. (n=2016
ent
Environmen
experienceven percentd their teac
ndents, extrence encouers cared abon, projects
ndents agreeonment and to improve
xpectations w
Learning Enyour high sch
r their schooed them devexpertise in tch, and 54%
t area. (n=2017
rial in a way tha2017)
cts and activitie
, extra help wa7)
to want to learn
earning success
environment an6)
tives to improvt. (n=2016)
nd expectation)
Learnin
Stro
nt
, the majori agreed or
chers presen
a help wasraged thembout their leaand activitie
ed or strongschool spirthe overall
were clear.
nvironment hool learning
ol experiencelop researcthe school li
% about how
3.7%
3.5%
2.6%
3.1%
7.6%
4.6%
7.7%
5.0%
7.4%
9.5%
14.3%
8.3%
11.9%
23.1
14.4%
19.4
18.6%
20.2
0% 20
7)
at
es
as
n.
s.
nd
ve
ns
ng Environm
ongly disagree
ty of responstrongly agrnt the mate
s available fm to want to
arning succes.
gly agreed rit. Seventyschool env
environment.
ce taught thech skills. Fifbrary suppo
w to evaluate
%
1%
%
%
%
%
65
71
63
0% 40%
% of R
ment
e Disagree
ndents werereed that th
erial in a wa
for them. Slearn. Eigh
ess. Eighty
with the stay-six percenvironment, a
.
em to questifty-five perce
orted their ste sources. E
.5%
70.0%
1.4%
3.7%
56.1%
63.6%
56.6%
62.7%
60.3%
60%
espondents
Agree
e satisfied wheir teachersay that is e
Sixty-nine phty-one perc
y-nine perce
atement that said their
and 72% fe
ion the thingent of respotudies by proEighty-two p
21.2%
12.2%
17.7%
21.2%
13.2%
17.3%
16.3%
13.6%
12.1%
80% 1
Strongly agree
with the s knew easy to
percent cent of nt said
at their school
elt their
gs they ndents oviding percent
%
%
%
%
%
%
100%
e

indicated telectronic permission Seventy-fosupported evaluate sonline) anhad acces Figure 21aHow do you
Figure 21bMy school eresearch sk
Direc
Direction/i
Access learning
Access to
Direc
Direction/i
Access learning
Access to
that they haresearch t
ns, copyright
our percent their studie
sources. Sed other lear
ss to informa
a – Researchu feel about e
b – Researchexperience takills. How do y
ction/instruction(
instruction abo(n=
to books (papetools (including
(n=
information aband citatio
Materia
ction/instruction(
instruction abo(n=
to books (papetools (including
(n=
information aband citatio
Mate
ad access totools), and t and citation
of respondees by provideventy-nine rning tools (iation about p
h skills ach of the fol
h skills ught me to quyou feel abou
n about how to(n=2015)
out how to evalu=2015)
er and/or onlineg electronic res=2015)
bout permissionons (n=2015)
ls and expe
n about how to(n=2013)
out how to evalu=2013)
er and/or onlineg electronic res=2013)
bout permissionons (n=2013)
erials and ex
o books (pap63% indic
ns.
ents indicating guidancpercent ind
including elepermissions,
llowing statem
uestion the thut each of the
0%
do research
uate sources
e) and othersearch tools)
ns, copyright,
ertise in theSt
0%
do research
uate sources
e) and othersearch tools)
ns, copyright,
xpertise in Str
per and/or ocated that t
ed that the e about how
dicated that ectronic resecopyright an
ments related
hings I have refollowing stat
12.0%
11.3%
5.8%
10.1%
12.4%
27.2
% 20%
school librtrongly disagree
5.6%
5.8%
4.3%
6.4%
20.9%
24.0%
16.7%
22.6%
% 20%
my classesrongly disagree
online) and they had a
materials aw to do resethey had acearch tools)nd citations.
to research s
ead or viewedtements?
33.0%
35.0%
2%
6
40%% of Res
rary to suppe Disagree
40%% of Res
s to supporte Disagree
other learninaccess to
and expertisearch, and 7ccess to bo, and 71% i.
skills?
d and helped
47.8%
46.7%
65.6%
53.3%
60%spondents
port my stue Agree
64.8%
61.5%
68.6%
61.7%
60%spondents
t my studieAgree S
ng tools (incinformation
se in their c70% about
ooks (paper indicated tha
me develop
%
%
7.3
7.0
16.2%
9.3%
80% 1
diesStrongly agree
8.7
8.7
10.5
9.2%
80% 1
s Strongly agree
23
cluding about
classes how to and/or at they
3%
0%
%
%
100%
e
%
%
5%
%
100%
e
24
Section I –
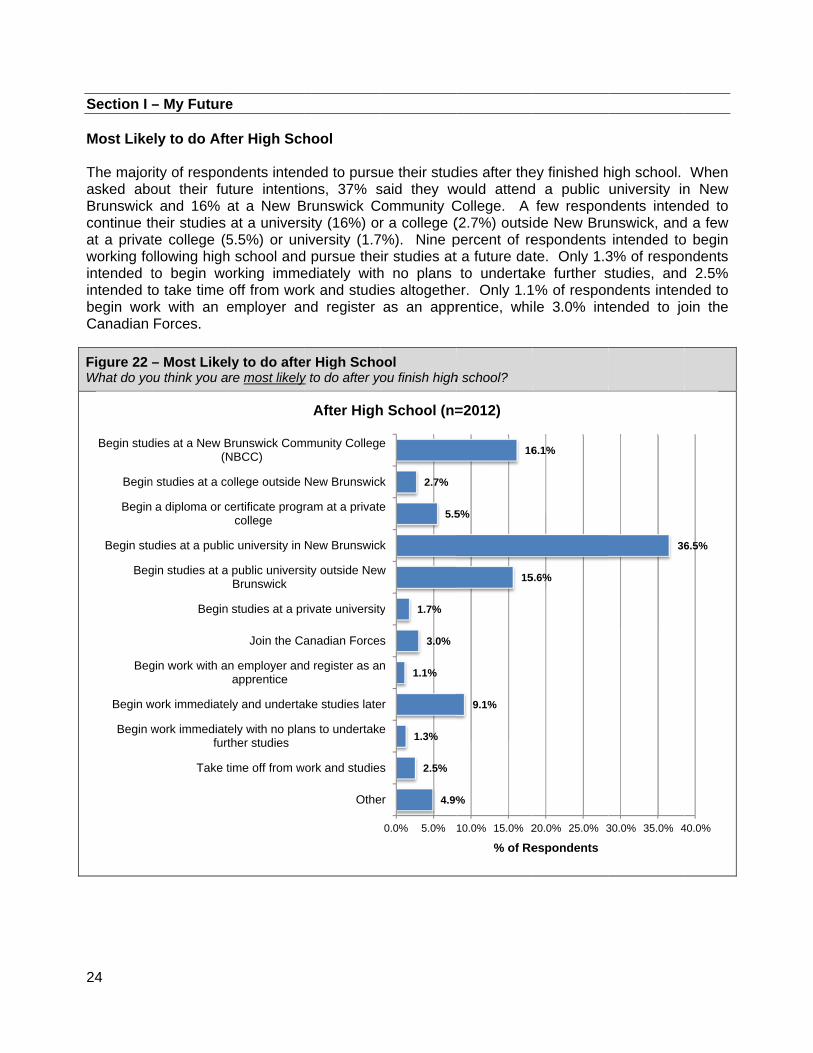
Most Like The majorasked aboBrunswickcontinue that a privatworking fointended tintended tobegin worCanadian
Figure 22 –What do yo
Begin stud
Begin
Begin
Begin stu
Beg
Beg
Begin w
Begin w
– My Future
ely to do Aft
rity of responout their fu
k and 16% aheir studies te college (5
ollowing highto begin woo take time rk with an eForces.
– Most Likeou think you a
dies at a New B(N
n studies at a co
a diploma or c
udies at a publi
gin studies at a
Begin
gin work with a
work immediate
work immediatefurt
Take t
e
ter High Sch
ndents intenture intentioat a New Bat a univers
5.5%) or unh school andorking immeoff from woremployer an
ly to do aftere most likely
Brunswick ComNBCC)
ollege outside
certificate progrcollege
c university in
public universBrunswick
studies at a pr
Join the Ca
n employer andapprentice
ely and underta
ely with no planther studies
time off from w
hool
ded to pursuons, 37% s
Brunswick Csity (16%) oriversity (1.7
d pursue theediately withrk and studind register
er High Schoy to do after yo
mmunity College
New Brunswic
ram at a private
New Brunswic
ity outside New
rivate university
anadian Forces
d register as an
ake studies late
ns to undertake
work and studies
Othe
After High
ue their studsaid they w
Community Cr a college (
7%). Nine pir studies at
h no plans es altogetheas an appr
ool you finish high
2.7%
5.5
1.7%
3.0%
1.1%
1.3%
2.5%
4.9%
0.0% 5.0%
e
k
e
k
w
y
s
n
er
e
s
er
h School (n=
dies after thewould attendCollege. A (2.7%) outsipercent of ret a future dato undertak
er. Only 1.1rentice, whi
h school?
16
5%
15
9.1%
%
10.0% 15.0% 2
% of Re
=2012)
ey finished hd a public
few responde New Bruespondents te. Only 1.3ke further s% of responle 3.0% int
6.1%
5.6%
20.0% 25.0% 3
espondents
high school.university in
ndents intenunswick, and
intended to3% of respostudies, andndents intentended to jo
36
30.0% 35.0% 4
When n New ded to
d a few o begin ndents
d 2.5% nded to oin the
6.5%
40.0%

Eighty-twopost-secon11% had waitlist, an Of the 3.0intended tenlisted. Of the 1.1work withapprenticefield of intcontact representa Of the resto begin wfurther stu Figure 24 Have you e
Figure 25bHave you bapprentices
57.
E
56.0
Hayo
o percent of ndary educ
applied, 5nd 0.8% had
0% of respto join the
% of responh an empe, 76% had terest. Forwith their
ative.
pondents thwork immedidies, 62% in
– Canadianenlisted?
b – Apprentbeen in contacship represen
42.6%
4%
Enlisted withForces
44.0%0%
ave you beenour regional
representa
the respondcation had .7% had b been reject
pondents thaCanadian F
ndents that iloyer and found an e
rty-four percr regional
hat indicatedately and un
ndicated that
n Forces
ticeship ct with your re
ntative?
h the Canadias (n=61)
Yes
No
n in contact wapprenticesh
ative? (n=25)
Yes
No
dents going been acce
been put onted.
at indicatedForces, 43%
intended to register as
employer incent had be
apprentic
d they were ndertake stut they had a
egional
an
with hip
on to epted, n the
they % had
begin s an their
een in ceship
going udies later, olready found
FigstaHav
FigHavinte
FigHav
or begin wod a job.
gure 23 – Poatus ve you?
ure 25a – Apve you found erest?
ure 26 – Beve you alread
82.1%
5.7%0.8%
Post-sec
76.0
24.0%
Have youregiste
37.6%
Fo
ork with no p
st-secondar
pprenticeshan employer
egin work imdy found a job
11.4%
%
%
condary educ(n=1574)
0%
u found an emered as an ap
(n=25)
62.4%
ound a job (n
plans to und
ry education
hip in your field o
mmediatelyb?
cation status)
Applied
Been accepte
Been put on thwaitlist
Been rejected
mployer andpprentice?
Yes
No
n=210)
Yes
No
25
dertake
n
of
s
ed
he
d
d

26
Expectatio Most respyears or le17% a madoctorate. planned tohow far the
Figure 2How far d
2-year
Profe
on Regardi
pondents exess (15%).
aster’s degre Only 3.6%
o stop at higey expected
27 – Expectado you expec
Complet
or less certifica
3-year certifica
Certified jo
Bach
Ma
Doc
ssional degree
ng Future S
pected to oTwenty-one
ee, 9.9% a p% expected t
gh school. to go in the
ation Regardt to go in you
0
te high school
ate or diploma
ate or diploma
ourneyperson
helor’s degree
aster’s degree
ctorate (Ph.D.)
e/designations
Not sure
Studies
obtain a unive percent of rofessional dto become aInterestingly
eir future stud
ding Future r future studie
3.
.0% 5.
Student Ex
versity degrf respondentdegree/desia certified joy, 16% of redies.
Studies es?
5.0%
4.4%
6%
7.4%
0% 10.
%
xpectation (n
ree (56%) ots planned tgnation (law
ourneypersoespondents
9.9%
.0% 15.0
% of Responde
n=2011)
or a certificato obtain a b
wyer, dentistn. Only 5.0indicated th
15.4%
17.1%
15.8%
0% 20.0
ents
ate/diploma bachelor’s d, etc.), and 7
0% of respohey were no
21.4%
0% 25.0
in two degree, 7.4% a ndents ot sure
%

Parent/Gu According obtaining education degree/debecome aparents exregarding
Figure How far
My pare
I do not
uardian Exp
to responda certificate
expected signation (8
a certified joxpected, antheir future s
28 – Parent/r do think your
2-year
Profe
ents/guardians
t know my pareregarding m
pectations R
dents, obtaine/diploma in
by paren8.0%) and courneypersond 5.7% of studies.
/Guardian Er parents / gu
Comple
or less certifica
3-year certifica
Certified j
Bach
Ma
Doc
essional degree
don’t have any
ents’/guardiansmy future studie
Pare
Regarding t
ning a bachn two yearsnts. Thescompleting
on. Nineteerespondents
Expectationsuardians expe
0
te high school
ate or diploma
ate or diploma
ourneyperson
helor’s degree
aster’s degree
ctorate (Ph.D.)
e/designations
y expectations
’ expectations es.
ent/Guardian
heir Child’s
elor's degres or less (1se were fa doctorate
en percent os said their
s Regarding ect you to go i
4.0%
3.0%
5
5
0.0% 5.0%
n Expectati
s Future Stu
ee (24%), a12%) were followed by
e (5.5%). Oof responder parents di
their Child’in your future
7.1%
11.6%
%
11.7
5.5%
8.0%
5.7%
10.0% 15% of Res
ion (n=2012
udies
master’s dthe most c
y receivingOnly 3.0% ents did notd not have
s Future Stustudies?
%
%
19.0%
.0% 20.0%spondents
2)
degree (12%common levg a profesexpected tht know whaany expec
udies
24.4%
%
25.0% 30.0
27
%), and vels of ssional hem to at their ctations
0%

28
Barriers to According post-seconbarrier, anwant to dosomewhatpoor readileave homto the post
Figure 29To what eschool?
P
Not kno
Unable
o Pursuing
to 55% of ndary educand 33%, somo was a mat of a barriering and writ
me was a bart-secondary
9 – Barriers extent do you
Not having e
Poor
Poor reading an
owing what I rea
Having
to get accepteprogram of my
No barrier
a Post-Sec
respondentsation. Twenmewhat of aajor barrier, r or a major ing skills. Errier. Eighteprogram of
to Pursuingsee the follow
enough money
school marks
nd writing skills
ally want to do
to leave home
ed in the post-sy choice (n=201
Bar
r at all A
condary Edu
s, not havingnty-three pe
a barrier. Twand 22% sabarrier for 2Eighty-one pen percent ochoice was
g a Post-Secwing as barrie
0%
(n=2011)
(n=2011)
(n=2011)
(n=2011)
(n=2011)
secondary11)
rriers to Pos
relatively mino
ucation
g enough mercent of reswelve perceaid it was s7% of respo
percent of reof respondesomewhat o
condary Eduers for you in
21.0%
43.6%
39.5%
57
20%
st-Seconda
r barrier S
money was tspondents b
ent said that somewhat ofondents, whiespondents nts said thator a major ba
ucation furthering yo
64.5%
7.3%
63.3%
23.9%
2
40%
% of Resp
ry Educatio
Somewhat of a
the main babelieved mot not knowinf a barrier. ile only 15%did not belit being unabarrier.
our education
29.9%
2
26.5%
23.9%
18.
32.5%
60%
ondents
on
a barrier A
rrier to pursoney was ang what they
Poor marks% said the sa
eve that havble to get ac
beyond high
0.3%
%
.7%
20.4%
11.3%
21.9%
14.4%
12.3%
22.5%
12.1
80%
A major barrier
suing a major
y really s were
ame for ving to cepted
%
6.1%
3.8%
1%
4.4%
5.7%
100%
r

Satisfactio The majoSeventy-sereceived into pursue for future with the stsecondarypercent of Figure 30 Indicate ho
I am sati
My school
M
I have dundert
stu
I have and
require
on with the
rity of respeven percen school andfurther studstudies andtatement thay education
respondent
– Satisfactiow you feel ab
sfied with the qscho
has prepared
My school has p
developed the sake further stu
udy skills, organ
received adequd the necessaryements which w
about m
I feel confi
Knowledge
ondents apnt of respo
d 76% believies. Sixty-se 59% for wo
at they receivrequiremen
ts indicated t
on with the bout each of t
quality of educaool (n=2011)
me for future s
prepared me fo
skills and abilitidies (e.g.: timenizational skills
uate informatioy post-secondawill help me to y future (n=201
dent about my
Knowle
e Acquired
peared sationdents saidved they hadeven percenork. Seventved adequa
nts to help that they felt
Knowledge the following s
ation received
studies (n=2011
or work (n=2011
ies necessary te managements) (n=2011)
on about careerary educationmake decision11)
future (n=2011
edge Acquir
Stron
at School
sfied with td they wered learned thent of respondty percent ote informatiomake decist confident a
Acquired atstatements.
6.1%
8.3%
10.6%
5.9%
7.7%
7.3%
17.2%
24
18.4%
21.9
16.0%
0% 20
in
1)
1)
to,
rs
s
1)
red at Scho
ngly disagree
the knowlede satisfied we skills and ddents believ
of respondenon about casions about about their fu
t School
%
4.6%
30.4%
%
9%
%
0% 40%
% of R
ool for the F
Disagree
dge they acwith the qudeveloped thved that schnts agreed oreers and ththeir future
uture.
66.2%
57.8%
50.9%
64.6%
60.6%
55.8%
60%
Respondents
uture
Agree
cquired at suality of eduhe abilities nool preparedor strongly ahe necessarye. Seventy
%
10.5
9.3
8.1
11.0
9.8
20.8%
80%
Strongly agre
29
school. ucation needed d them agreed y post--seven
5%
3%
1%
0%
8%
100%
e

30
Financial A new qurespondenmanage thapply thes Figure 31 Answer the
Plans to S Forty-five stay in thleave the years. Splanned tocome barespondenstay in the
I have acqwill need
I feel conknowledg
Literacy
uestion wasnts indicatedheir personase skills and
– Financial e following qu
Stay in the P
percent of rhe province
province bueventeen p
o leave the pack. Twents were noe province.
uired the finanto manage my
fident that I ame to manage m
s added in d they had aal finances. knowledge t
Literacy uestions regar
Province
respondentsand 15%
ut come bacpercent of reprovince withenty-four pot sure if th
cial skills and ky personal finan
m able to apply my personal fina
2017 in reacquired the Fifty perceto manage t
rding financia
planned to planned to ck in a few espondents h no plan to percent of hey plan to
knowledge thatnces (n=2012)
these skills anances (n=2012
FinanStrongly
egards to fie financial sknt of responheir persona
l literacy.
23.3%
21.1%
0% 20
t I)
d2)
ncial Literacy disagree
Figure 32Are you p
16.6%
24.0
Pla
nancial literkills and knondents felt cal finances.
28.9%
28.8%
0% 40%
% of R
cyDisagree
2 – Plans to lanning to sta
44.9%
14.6%
%
0%
ns to Stay in
racy. Fortyowledge thaconfident tha
41
43
60%
Respondents
Agree S
Stay in the ay in the prov
I plan to st
I plan to lecome back
I plan to leI have no p
Not sure
the Province
y-eight percat they will nat they are a
1.1%
3.4%
6.7
6.7
80%
Strongly agree
Province vince in the fu
ay in the provinc
ave the provincek in a few years.
ave the provinceplan to come bac
e (n=2012)
cent of need to able to
7%
7%
100%
ture?
ce.
e and
e andck.

What type Respondeover 21% occupationtrades, trarespondennot sure w
Figure 33 Indicate the
Busine
Natural and
Occupatio
Occu
Trad
Natural re
e of job/occ
ents were asof respond
ns in educatansport andnts indicated
what type of o
– What typee type of job/o
ess, finance an
d applied scien
ons in educationand govern
upations in art,
Sa
des, transport arelate
esources, agricoccu
Occupations
cupational c
sked what tydents indicattion, law andd equipmend they were occupation t
e of job/occoccupational c
Managemen
d administratio
nces and relate
Healt
n, law and socinment services
culture, recrea
ales and servic
and equipment ed occupationsulture and relatupations
in manufacturin
Job
category do
ype of job/oted they intd social, comt operatorspursuing a jthey intende
cupational ccategory you
0
nt occupations
on occupations
ed occupations
th occupations
ial, communitys
ation and sport
ce occupations
operators andsted production
ng and utilities
Not sure
Other
b/occupatio
o you intend
occupationaltended to pmmunity and
and relatejob in a cated to pursue.
category dointend to purs
1.5%
4
1.6%
2.3%
0.5%
0.0% 5.0%
nal category
d to pursue?
category thursue a car
d governmened occupatiegory that w.
o you intendrsue.
9.0%
7.7%
4.4%
10
10
% 10.0%
% of Re
y (n=2011)
?
hey intendedreer in healnt services, aons. Seve
was not listed
d to pursue
14.1%
0.4%
0.1%
1
15.0%
espondents
d to pursuelth, 14% indand 10% indenteen percd, while 10%
?
21.2%
17.2%
20.0% 2
31
e. Just dicated dicated cent of % were
%
5.0%
32
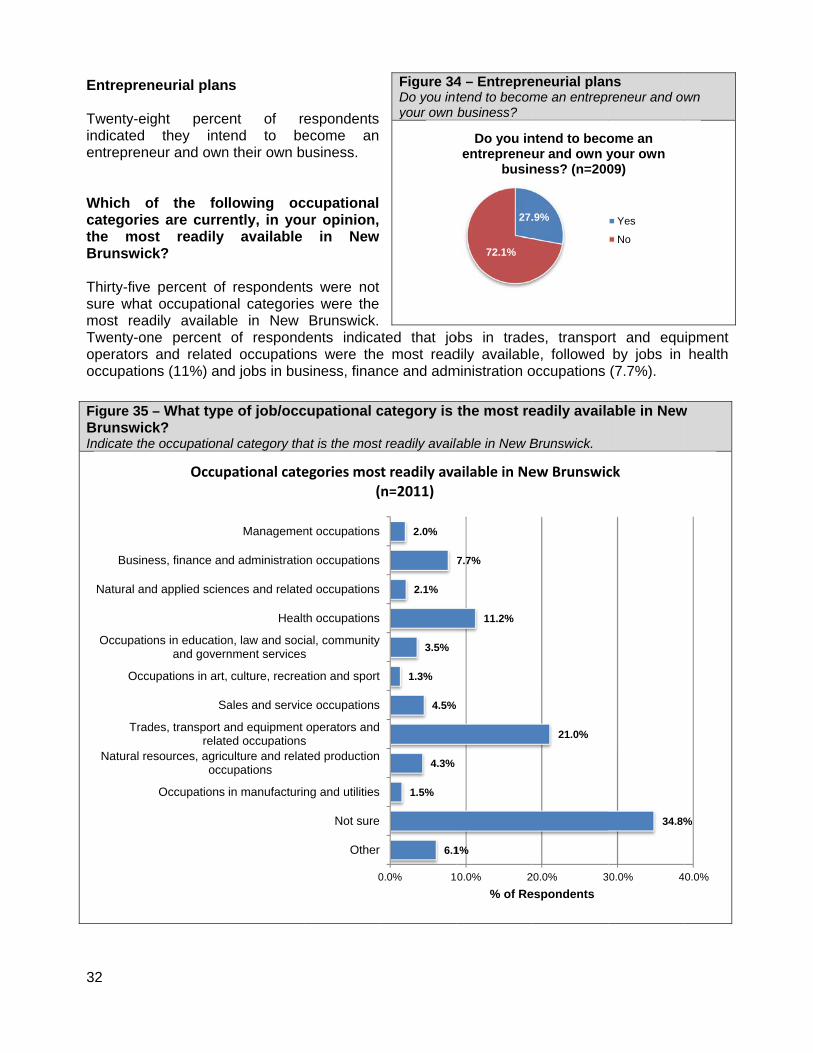
Entrepren Twenty-eigindicated entreprene Which ocategoriesthe mosBrunswic Thirty-five sure whatmost readTwenty-onoperators occupation Figure 35 BrunswicIndicate the
Busine
Natural and
Occupatio
Occu
Trad
Natural re
neurial plan
ght percethey inte
eur and own
of the fols are curre
st readily k?
percent of occupation
dily availablne percent
and relatedns (11%) an
– What typek?
e occupationa
ess, finance an
d applied scien
ons in educationand govern
upations in art,
Sa
des, transport arelate
esources, agricoccu
Occupations
Occup
s
ent of reend to ben their own b
lowing ocently, in you
available
respondental categoriele in New of respond
d occupationd jobs in bus
e of job/occ
al category tha
Managemen
d administratio
nces and relate
Healt
n, law and socinment services
culture, recrea
ales and servic
and equipment ed occupationsulture and relatupations
in manufacturin
pational cate
espondents ecome an usiness.
ccupational ur opinion,
in New
ts were not es were the
Brunswick. dents indicans were thesiness, finan
cupational c
at is the most
0
nt occupations
on occupations
ed occupations
th occupations
ial, communitys
ation and sport
ce occupations
operators andsted production
ng and utilities
Not sure
Other
egories mos(
ated that joe most readnce and adm
Figure 34Do you intyour own
category is
t readily availa
2.0%
2.1%
3.5%
1.3%
4.5%
4.3%
1.5%
6.1
0.0% 1
t readily avan=2011)
obs in tradedily available
ministration o
4 – Entrepretend to becombusiness?
the most re
lable in New B
27.
72.1%
Do you inentrepreneu
busin
7.7%
11.2%
1%
0.0% 2% of Re
ailable in Ne
es, transpore, followed
occupations
eneurial planme an entrepr
eadily availa
Brunswick.
.9%
ntend to becour and own yness? (n=200
21.0%
20.0% 3espondents
ew Brunswic
rt and equby jobs in (7.7%).
ns reneur and ow
able in New
ome an your own 09)
Yes
No
34.8%
0.0% 4
ck
ipment health
wn
w
%
0.0%

Appendix
2017 Grade 12 Exit Survey

2017 GRADE 12 EXIT SURVEY
1
Introduction You have been chosen to participate in a survey of Grade 12 students in order to help us (the Department of Education and Early Childhood Development, your school district and school) understand your opinions of your school experience, activities and future plans. Your answers are confidential and important to us. Thank you for taking the time to participate. Instructions Read every question carefully, and then answer each question by filling in the appropriate bubble. Each bubble must be filled completely. For example:
Strongly disagree Disagree Agree Strongly agree
Answer each question. If a question does not apply to you, fill in the not applicable (N/A) bubble. Only one answer is accepted for each question. Unless otherwise indicated, the questions relate to your high school (9-12) experience. The survey will take approximately 30 minutes to complete.
You may now proceed
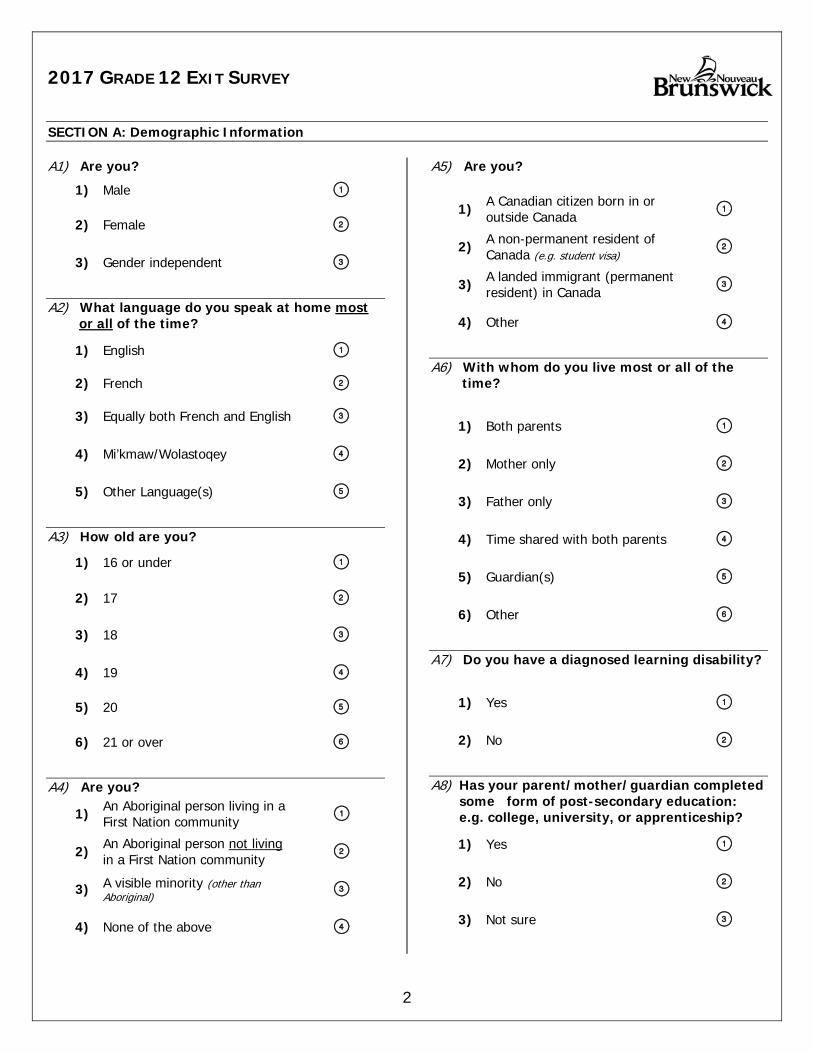
2017 GRADE 12 EXIT SURVEY
2
SECTION A: Demographic Information A1) Are you?
1) Male
2) Female
3) Gender independent
A2) What language do you speak at home most or all of the time?
1) English
2) French
3) Equally both French and English
4) Mi’kmaw/Wolastoqey
5) Other Language(s)
A3) How old are you?
1) 16 or under
2) 17
3) 18
4) 19
5) 20
6) 21 or over
A4) Are you?
1) An Aboriginal person living in a First Nation community
2) An Aboriginal person not living in a First Nation community
3) A visible minority (other than Aboriginal)
4) None of the above
A5) Are you?
1) A Canadian citizen born in or outside Canada
2) A non-permanent resident of Canada (e.g. student visa)
3) A landed immigrant (permanent resident) in Canada
4) Other
A6) With whom do you live most or all of the time?
1) Both parents
2) Mother only
3) Father only
4) Time shared with both parents
5) Guardian(s)
6) Other
A7) Do you have a diagnosed learning disability?
1) Yes
2) No
A8) Has your parent/mother/guardian completed
some form of post-secondary education: e.g. college, university, or apprenticeship?
1) Yes
2) No
3) Not sure

2017 GRADE 12 EXIT SURVEY
3
A9) Has your parent/father/guardian completed some form of post-secondary education: e.g. college,
university, apprenticeship?
1) Yes
2) No
3) Not sure
SECTION B: Academic Background B1) Do you have a Personalized Learning Plan (PLP)?
1) Yes
2) No
3) Not sure
B2) What were your most recent final marks in the following subject areas? (If you were never enrolled in one of the following courses, indicate N/A.) NOTE: If you are following a Personalized Learning Plan and you do not receive marks, indicate N/A to the following questions.
N/A 90% or more 80%-89% 70%-79% 60%-69% Less than 60%
a) Computer science (any)
b) Cooperative education
c) English
d) French Immersion Language Arts
e) History (any)
f) Law
g) Mi’kmaw/Wolastoqey
h) Mathematics (any)
2017 GRADE 12 EXIT SURVEY
4
N/A 90% or more 80%-89% 70%-79% 60%-69% Less than 60%
i) Music
j) Native Studies
k) Physical Education and Health
l) Post-intensive French
m) Science (any)
n) Skilled trades (any)
o) Visual arts
Never had to take a course
more than once
1 course 2 courses 3 courses More than 3 courses
B3) Were you required to take any Grade 11 or 12 courses more than once in order to receive a passing mark? If yes, how many?
SECTION C: School Environment C1) How do you feel about each of the following statements?
Strongly disagree Disagree Agree Strongly agree
a) Discipline is managed effectively at my school.
b) Students are generally well behaved in class.
c) Students are generally well behaved outside of the classroom (e.g. in the hallways, on the bus, on school property).
d) I feel safe at my school.
e) My learning is interrupted by the behaviour problems of other students.
f) I felt respected at my school.
g) My school is a place where I felt like I belonged.

2017 GRADE 12 EXIT SURVEY
5
Strongly disagree Disagree Agree Strongly agree
h) I enjoyed my school experience.
i) My school experience was academically challenging.
j) The variety of courses available met my needs.
k) My school is environmentally friendly (e.g. recycling, composting, solar panels).
l) My school encourages me to contribute to the environment’s sustainability.
m) If I had a problem, there was an adult I could talk to at my school.
C2) The following statements relate to bullying at school.
Yes No
a) I was bullied during my high school years.
b) I was bullied during my middle school years.
c) I was bullied during my elementary school years.
C3) Answer the follow-up questions regarding bullying at school. NOTE: if you were never bullied at school, indicate N/A to the following questions.
N/A Yes No
a) Did the bullying occur frequently (at least once a week)?
b) Did the bullying usually come from the same student(s)?
c) Did you report the bullying to your teachers or another adult at the school?
d) Did you inform your parent(s)/guardian(s) that you were bullied at school?
e) Was your bullying issue resolved?
2017 GRADE 12 EXIT SURVEY
6
SECTION D: E-Learning and New Technologies D1) Indicate your level of satisfaction for each of the following statements.
Very dissatisfied Dissatisfied Satisfied Very satisfied
a) Access to computers/technological device for educational purposes in school, including the functionality and quality of the device.
b) My ability to use computers effectively.
c) Opportunities that my school gave me to improve my computer skills.
d) Usefulness of the computer skills acquired.
e) Opportunities that my school gave me to learn how to use electronic research tools.
D2) Indicate “yes” or “no” to the following questions regarding e-learning and new technologies.
N/A Yes No
a) During high school, did your school provide opportunities to take an online course from among the list of existing online courses?
b) During high school, did you enrol in an online language course?
c) During high school, did you enrol in an online course for a subject other than language?
d)
In general are you satisfied with the content of the online course(s) offered by the Department of Education and Early Childhood Development that you were enrolled in? (If you did not enrol, indicate N/A.)
e) At school, did you often use technology (e.g. Internet, software, hardware devices) to support your learning?
f) At home, did you often use technology (e.g. Internet, software, hardware devices) to complete schoolwork?
g) During high school, did the majority of your teachers use technology (e.g. computers, SMARTBOARD®, iPad, etc.) as a learning tool?
h) Are you comfortable using computer technology as a learning tool?
i) Would you prefer to use your personal technology (e.g. tablet, laptop, smart phone) as a learning tool at school?

2017 GRADE 12 EXIT SURVEY
7
SECTION E: Experiential Opportunities E1) Answer the following questions regarding experiential opportunities.
N/A Never Rarely Sometimes Often
a)
Have you had opportunities in high school to participate in cultural activities organized through your school (e.g. plays, visits to museums, art galleries, musical groups)?
b)
Have you had opportunities in high school to participate in cultural activities not organized by your school (e.g. visited a museum or went to a play with your parents/guardians)?
c)
How often do you use the electronic research tools (e.g. EBSCO, Google Scholar, Worldbook) offered at your school?
d) How often do you read the newspaper, online news or watch TV news?
e) Did you receive tutoring during high school? (If you did not need any, indicate N/A.)
E2) Did you participate in any of the following during high school (thinking back as far as Grade 9)?
Yes No
a) Co-op Education or Career Exploration
b) New Brunswick Youth Career Connections Program
c) Personal Development and Career Planning course (PDCP)
d) Career Focusing program (e.g. Career Cruising)
If yes, did you find it valuable?

2017 GRADE 12 EXIT SURVEY
8
E3) Answer the following questions regarding experiential learning opportunities.
Never Rarely Sometimes Often
a)
Have you had opportunities in high school to take courses in the skilled trades (e.g. Residential Finish, Power Train and Chassis, Culinary Technology)?
b) Have you had opportunities in high school to take courses in fine arts (e.g. visual arts, music, theatre)?
c) Have you had opportunities in high school to participate in volunteer learning experiences (e.g. volunteered as part of a classroom activity or assignment)?
d) Have you had opportunities in high school to participate in career-related learning experiences (e.g. career fairs, Job Fest, post-secondary days)?
e) Have you had opportunities in high school to participate in elective courses that were of a high degree of interest to you?
f)
In high school, have you had the opportunity to participate in entrepreneurial projects (creating a product, offering a service, or by organizing an event that responded to a need of the school or the community, projects in which the students were the directors and managers)?

2017 GRADE 12 EXIT SURVEY
9
E4) Approximately how many hours per week are you involved in extra-curricular activities and part-time work during the school year?
0 1-5 6-10 More than 10
a) Sports organized by the school (e.g. basketball, hockey)
b) Sports not organized by the school (e.g. minor hockey, soccer club)
c) Other extended physical activity outside of school (e.g. running, biking, hiking)
d) Extra-curricular activities organized by the school (e.g. drama, clubs, band, student council, public speaking)
e) Organized activities not through the school (e.g. leadership, youth programs, music lessons)
f) Social action groups (e.g. environment, animal protection, politics)
g) Volunteer work in your community
h) Tutoring another student
i) Part-time employment
E5) How much do you know about each of the following?
Nothing Very little A fair amount A lot
a) District Education Council (DEC)
b) Parent School Support Committee (PSSC)
c) Student council
d) Youth organizations (e.g. NBASAA, Youth Matters)
e) Municipal (local) government
f) Government of New Brunswick
g) Government of Canada
h) International organizations (e.g. United Nations, World Trade Organization, NATO)

2017 GRADE 12 EXIT SURVEY
10
E6) Do you plan to vote in the following elections when you are legally entitled to?
N/A Yes No
a) Student council elections at university or college (If you don’t plan to attend a post-secondary institution, indicate N/A.)
b) Municipal elections
c) Provincial elections
d) Federal elections
e) District Education Council (DEC) elections
E7) Was your parent(s)/guardian(s) involved in the following?
Yes No Don’t know
a) District Education Council (DEC)
b) Parent School Support Committee (PSSC)
c) Home and School Association

2017 GRADE 12 EXIT SURVEY
11
SECTION F: Language Skills F1) If you were enrolled in French Immersion, were you enrolled in:
1) Early French Immersion (Grade 1 entry)
2) Late French Immersion (Grade 6 entry)
3) Never enrolled in French Immersion (English program/Core French)
F2) If you were enrolled in French Immersion did you:
1) Continue with the French Immersion program until Grade 12?
2) Switch to the English program before high school?
3) Switch to the English program in high school?
4) N/A (I was never enrolled in French Immersion)
F3) Indicate how much you agree with the following statements concerning language skills.
Strongly disagree Disagree Agree Strongly agree
a) I am comfortable using French outside school.
b) When I was last taught French second language, I could easily understand my teacher.
c) I can easily understand new ideas in French.
d) I use French in my daily activities.
F4) Here are some questions about additional languages: a) Were you ever enrolled in a language course other than English or French at school?
1) Yes
2) No

2017 GRADE 12 EXIT SURVEY
12
b) If you selected “Yes” for the previous question, please answer the following.
Strongly Disagree Disagree Agree Strongly agree
1) I am comfortable using a language other than English or French.
2) I am satisfied with the opportunities that my school gave me to participate in additional language courses.
c) What was your main reason for enrolling in an additional language course?
1) Travel purposes
2) Personal interest
3) Family reasons
4) Job opportunities
5) Other reason(s)
6) I was never enrolled in an additional language class
SECTION G: Physical Activity and Healthy Living G1) Thinking specifically of your high school years, how do you feel about each of the following
statements? Strongly Disagree Disagree Agree Strongly agree
a) My school has provided opportunities to participate in exercise or physical activity other than phys. ed. class.
b) My school has helped me to develop positive attitudes towards physical activity.
c) My school has helped me to develop positive attitudes towards healthy and active living.
d) My school promoted healthy eating by providing easy access to healthy food and snacks.
e) Most teachers showed a positive attitude towards healthy living and health related issues.

2017 GRADE 12 EXIT SURVEY
13
SECTION H: Learning Environment H1) Indicate your overall satisfaction with your high school learning environment.
Strongly Disagree Disagree Agree Strongly
agree
a) Most teachers in my school know their subject area.
b) Most of my teachers present the material in a way that is easy to understand.
c) Lessons involved discussions, projects and activities.
d) If I did not understand a lesson in class, extra help was available for me.
e) My school experience encouraged me to want to learn.
f) Overall, teachers cared about my learning success.
g) My school has a strong learning environment and school spirit.
h) My school offers activities and initiatives to improve the overall school environment.
i) I feel my school is well-organized and expectations were clear.
H2) How do you feel about each of the following statements related to research skills?
Strongly Disagree Disagree Agree Strongly
agree
a) Materials and expertise in the school library to support my studies included:
i. Direction/instruction about how to do research
ii. Direction/instruction about how to evaluate sources
iii. Access to books (paper and/or online) and other
learning tools (including electronic research tools)
iv. Access to information about permissions, copyright, and citations

2017 GRADE 12 EXIT SURVEY
14
Strongly Disagree Disagree Agree Strongly
agree
b) Materials and expertise in my classes to support my studies included:
i. Direction/instruction about how to do research
ii. Direction/instruction about how to evaluate sources
iii. Access to books (paper and/or online) and other
learning tools (including electronic research tools)
iv. Access to information about permissions, copyright, and citations
SECTION I: My Future I1) What do you think you are most likely to do when you finish high school? (Only one answer is accepted.)
1) Begin studies at a New Brunswick Community College (NBCC or CCNB) (go to question I1A)
2) Begin studies at a college outside New Brunswick (e.g. CEGEP, Holland College) (go to question I1A)
3) Begin a diploma or certificate program at a private college (e.g. Eastern College, Oulton’s) (go to question I1A)
4) Begin studies at a public university in New Brunswick (e.g. UNB, UdeM, STU, Mount Allison) (go to question I1A)
5) Begin studies at a public university outside New Brunswick (e.g. Dalhousie, Acadia, McGill, Carleton) (go to question I1A)
6) Begin studies at a private university (e.g. Crandall, St. Stephen’s) (go to question I1A)
7) Join the Canadian Forces (go to question I1B)
8) Begin work with an employer and register as an apprentice (go to question I1C1 and I1C2)
9) Begin work immediately and undertake studies later (go to question I1D)
A) Begin work immediately with no plans to undertake further studies (go to question I1D)
B) Take time off from work and studies (e.g. travel) (go to question I2)
C) Other (go to question I2)

2017 GRADE 12 EXIT SURVEY
15
I1A) Regarding the options above related to your future studies, have you: (Only one answer is accepted.)
1) Applied?
2) Been accepted?
3) Been put on the waitlist?
4) Been rejected?
I1B) If you selected “Join the Canadian Forces” from the list above, have you enlisted?
1) Yes
2) No
3) Not applicable
I1C1) If you selected “Begin work with an employer
and register as an apprentice” from the list above, have you found an employer in your field of interest?
1) Yes
2) No
3) Not applicable
I1C2) Have you been in contact with your regional apprenticeship representative?
1) Yes
2) No
3) Not applicable
I1D) If you selected “Begin work immediately and undertake studies later” or “Begin work immediately
with no plans to undertake further studies” from the list above, have you already found a job?
1) Yes
2) No
3) Not applicable

2017 GRADE 12 EXIT SURVEY
16
I1E1) What type of job/occupational category do you intend to pursue? (Only one answer is accepted.)
1) Management occupations
2) Business, finance and administration occupations
3) Natural and applied sciences and related occupations
4) Health occupations
5) Occupations in education, law and social, community and government services
6) Occupations in art, culture, recreation and sport
7) Sales and service occupations
8) Trades, transport and equipment operators and related occupations
9) Natural resources, agriculture and related production occupations
A) Occupations in manufacturing and utilities
B) Not sure
C) Other
I1E2) Do you intend to become an entrepreneur and own your own business?
1) Yes
2) No

2017 GRADE 12 EXIT SURVEY
17
I1F) Which of the following occupational categories are currently, in your opinion, the most readily
available in New Brunswick? (Only one answer is accepted.)
1) Management occupations
2) Business, finance and administration occupations
3) Natural and applied sciences and related occupations
4) Health occupations
5) Occupations in education, law and social, community and government services
6) Occupations in art, culture, recreation and sport
7) Sales and service occupations
8) Trades, transport and equipment operators and related occupations
9) Natural resources, agriculture and related production occupations
A) Occupations in manufacturing and utilities
B) Not sure
C) Other

2017 GRADE 12 EXIT SURVEY
18
I2) How far do you expect to go in your future studies? (Only one answer is accepted.)
1) Complete high school
2) 2-year or less certificate or diploma
3) 3-year certificate or diploma
4) Certified journeyperson (completion of apprenticeship qualifications)
5) Bachelor’s degree
6) Master’s degree
7) Doctorate (Ph.D.)
8) Professional degree/designations (e.g. Medicine, Dentistry, Law)
9) Not sure
I3) How far do you think your parent(s)/guardian(s) expect you to go in your future studies? (Only one answer is accepted.)
1) Complete high school
2) 2-year or less certificate or diploma
3) 3-year certificate or diploma
4) Certified journeyperson (completion of apprenticeship qualifications)
5) Bachelor’s degree
6) Master’s degree
7) Doctorate (Ph.D.)
8) Professional degree/designations (e.g. Medicine, Dentistry, Law)
9) My parents/guardians don’t have any expectations
A) I do not know my parents’/guardians’ expectations regarding my future studies

2017 GRADE 12 EXIT SURVEY
19
I4) To what extent do you see the following as barriers for you in furthering your education beyond high school?
No barrier at all
A relatively minor barrier
Somewhat of a barrier
A major barrier
a) Not having enough money to pay for education/ training
b) Poor school marks
c) Poor reading and writing skills
d) Not knowing what I really want to do
e) Having to leave home
f) Unable to get accepted in the post-secondary program of my choice
I5) Indicate how you feel about each of the following statements.
Strongly Disagree
Disagree Agree Strongly agree
a) I am satisfied with the quality of education received in my school.
b) My school has prepared me for future studies.
c) My school has prepared me for work.
d) I have developed the skills and abilities necessary to undertake further studies (e.g.: time management, study skills, organizational skills).
e)
I have received adequate information about careers and the necessary post-secondary education requirements which will help me to make decisions about my future.
f) I feel confident about my future.

2017 GRADE 12 EXIT SURVEY
20
I6) Answer the following questions regarding financial literacy.
Strongly Disagree
Disagree Agree Strongly agree
a)
I have acquired the financial skills and knowledge that I will need to manage my personal finances (e.g., balancing income and spending, credit cards and loans, available financial services).
b)
I feel confident that I am able to apply these skills and knowledge to manage my personal finances (e.g., balancing income and spending, credit cards and loans, available financial services).
I7) Are you planning to stay in the province after graduation? (Only one answer is accepted.)
1) I plan to stay in the province.
2) I plan to leave the province and come back in a few years.
3) I plan to leave the province and I have no plan to come back.
4) Not sure.
This now completes the Exit Survey. Thank you for your cooperation.