2017 end of key stage teacher assessment outcomes and national … · teacher assessment outcomes...
TRANSCRIPT
1 EAS FP‐KS3 KS4 prov WNT LA Data Analysis – August 2017
2017 End of Key Stage Teacher Assessment Outcomes and National Test results
Monmouthshire
All schools are subject to rigorous reporting and monitoring of standards each year, with the principal focus in key stages 2 and 3 being on English/Welsh first language, mathematics and science, and the percentage of pupils achieving the expected level in all three core subjects – the core subject indicator (CSI).
In the Foundation Phase schools report on the performance of 7 year olds in language, literacy and communication (English or Welsh language) (LLC), mathematical development (MD), and personal and social development, wellbeing and cultural development (PSDWCD). The foundation phase indicator (FPI) measures the percentage achieving the expected outcome in all three areas of learning.
Whilst assessment of LLC and MD is broadly comparable to performance in English/Welsh and mathematics at KS2 and KS3, PSDWCD is not the same as science. Instead it provides a holistic assessment of pupils’ wellbeing and the extent to which they are able to inter-relate appropriately with those around them. It also reflects a growing awareness of culture and diversity and of the environment in which they live. As such, it is an important measure of their overall ‘readiness’ for learning. Achievement in each of LLC, MD and PSDWCD is measured in relation to one of six ‘outcome’ descriptors.
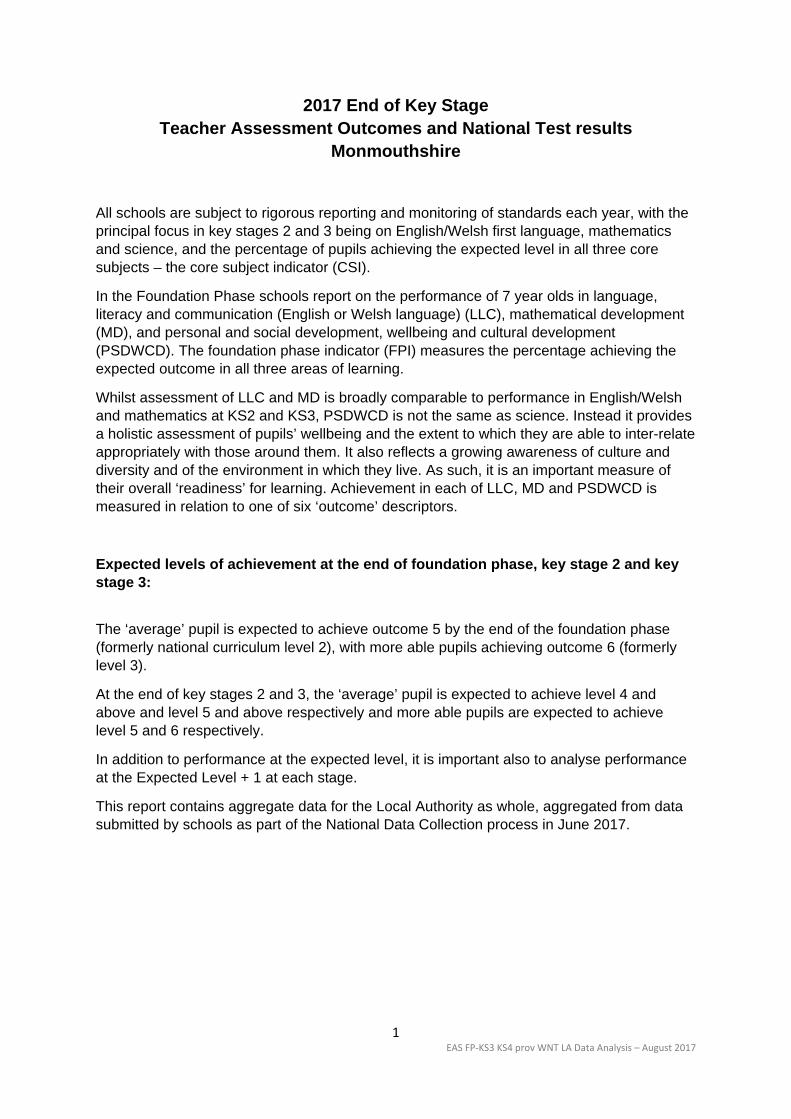
Expected levels of achievement at the end of foundation phase, key stage 2 and key stage 3:
The ‘average’ pupil is expected to achieve outcome 5 by the end of the foundation phase (formerly national curriculum level 2), with more able pupils achieving outcome 6 (formerly level 3).
At the end of key stages 2 and 3, the ‘average’ pupil is expected to achieve level 4 and above and level 5 and above respectively and more able pupils are expected to achieve level 5 and 6 respectively.
In addition to performance at the expected level, it is important also to analyse performance at the Expected Level + 1 at each stage.
This report contains aggregate data for the Local Authority as whole, aggregated from data submitted by schools as part of the National Data Collection process in June 2017.
2 EAS FP‐KS3 KS4 prov WNT LA Data Analysis – August 2017
Expected Levels
Expected Levels + 1 (Higher Levels)
Cohort sizes Number of
pupils 1 pupil represents
Foundation Phase 905 0.11%Key Stage 2 874 0.11%Key Stage 3 825 0.12%
3 EAS FP‐KS3 KS4 prov WNT LA Data Analysis – August 2017
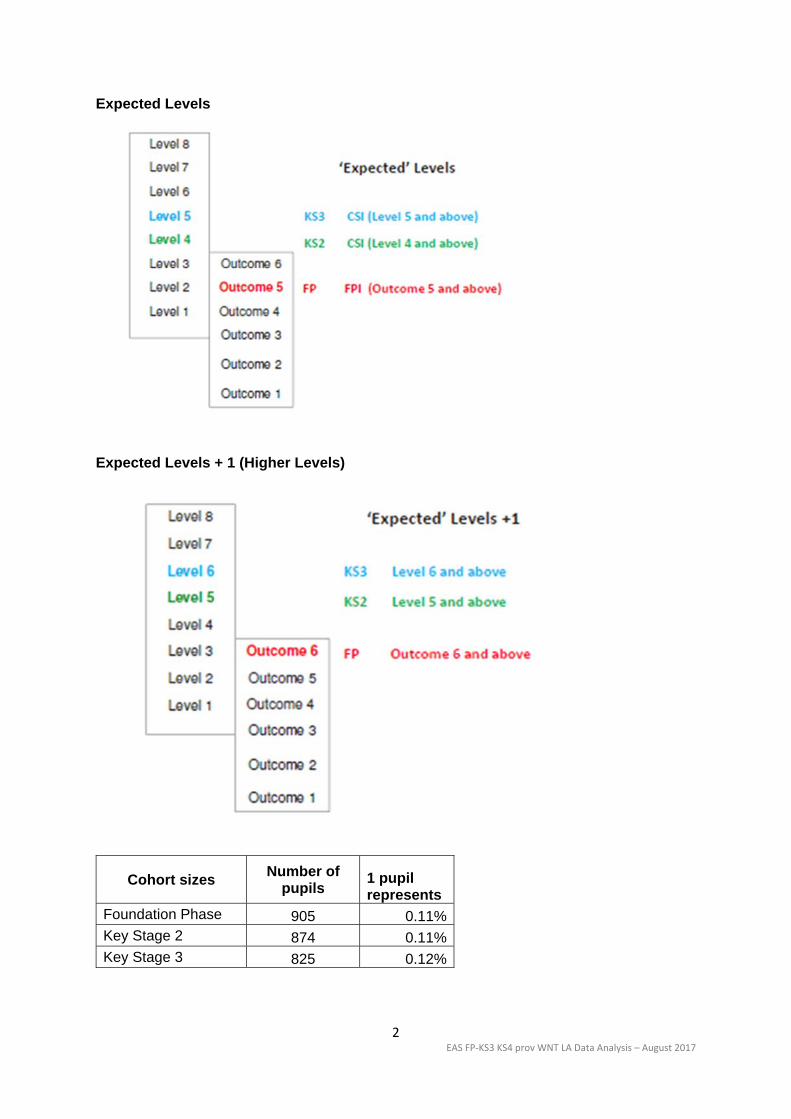
1. Foundation Phase
Performance in the foundation phase improved from 91.7% in 2016, to 93.8% pupils achieving the foundation phase indicator (FPI) in 2017, an increase of 2.1 percentage points. Monmouthshire currently ranks 1st in Wales for the FPI when compared with other local authorities, which matches the LA’s FSM ranking (1st, 2017 PLASC data), and matches the rank position in 2016.
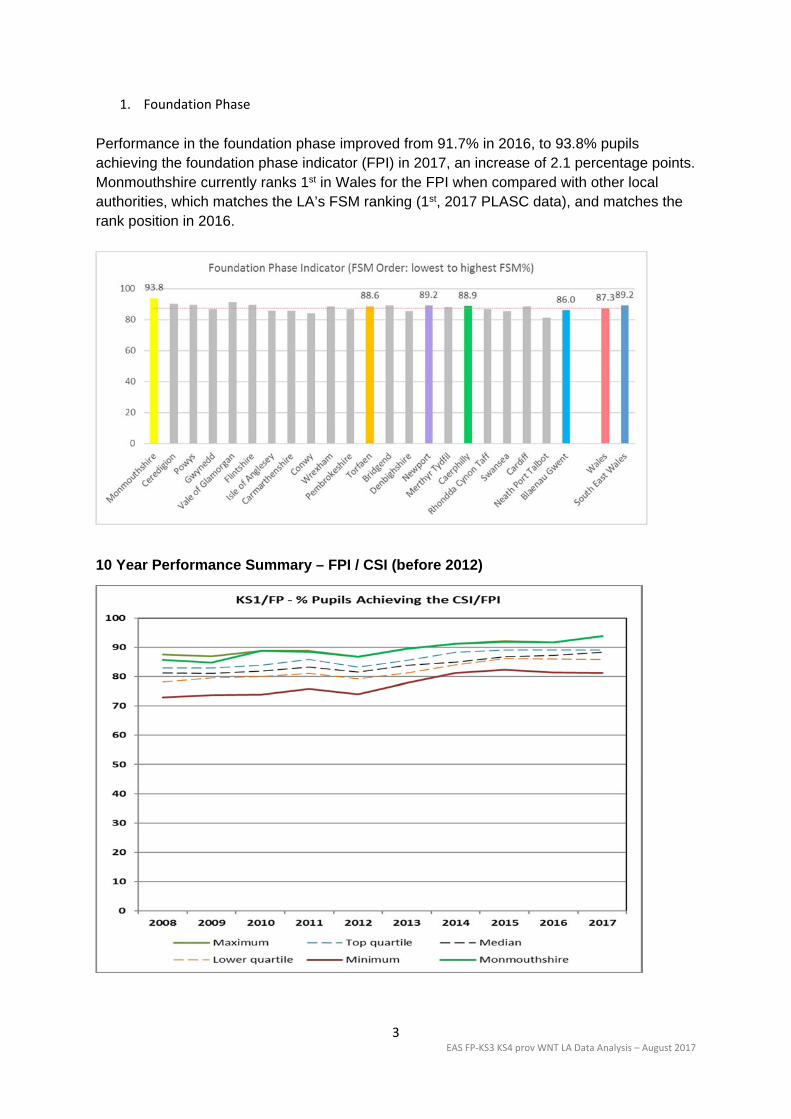
10 Year Performance Summary – FPI / CSI (before 2012)
4 EAS FP‐KS3 KS4 prov WNT LA Data Analysis – August 2017
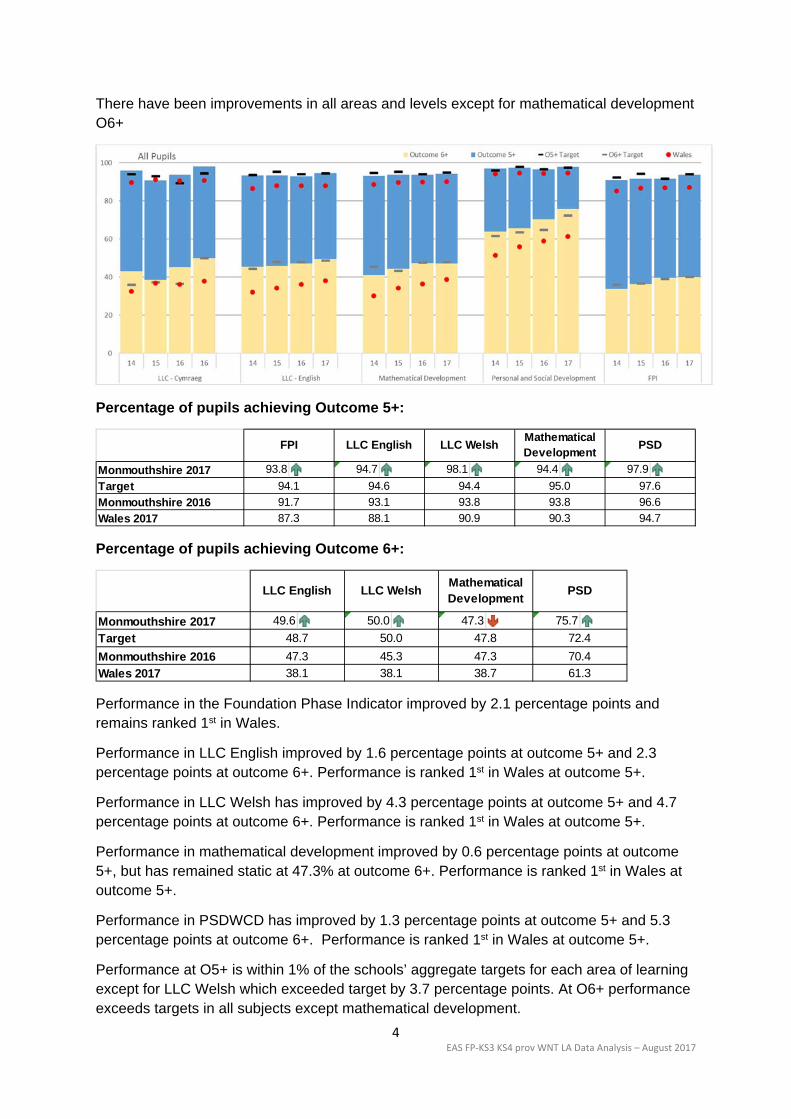
There have been improvements in all areas and levels except for mathematical development O6+
Percentage of pupils achieving Outcome 5+:
Percentage of pupils achieving Outcome 6+:
Performance in the Foundation Phase Indicator improved by 2.1 percentage points and remains ranked 1st in Wales.
Performance in LLC English improved by 1.6 percentage points at outcome 5+ and 2.3 percentage points at outcome 6+. Performance is ranked 1st in Wales at outcome 5+.
Performance in LLC Welsh has improved by 4.3 percentage points at outcome 5+ and 4.7 percentage points at outcome 6+. Performance is ranked 1st in Wales at outcome 5+.
Performance in mathematical development improved by 0.6 percentage points at outcome 5+, but has remained static at 47.3% at outcome 6+. Performance is ranked 1st in Wales at outcome 5+.
Performance in PSDWCD has improved by 1.3 percentage points at outcome 5+ and 5.3 percentage points at outcome 6+. Performance is ranked 1st in Wales at outcome 5+.
Performance at O5+ is within 1% of the schools’ aggregate targets for each area of learning except for LLC Welsh which exceeded target by 3.7 percentage points. At O6+ performance exceeds targets in all subjects except mathematical development.
Monmouthshire 2017 93.8 1.0 94.7 1.0 98.1 1.0 94.4 1.0 97.9 1.0
Target
Monmouthshire 2016
Wales 2017
FPI LLC English LLC WelshMathematical Development
PSD
94.1
91.7
87.3
94.6
93.1
88.1
94.4
93.8
90.9
95.0
93.8
90.3
97.6
96.6
94.7
Monmouthshire 2017 49.6 1.0 50.0 1.0 47.3 -1.0 75.7 1.0
Target
Monmouthshire 2016
Wales 2017
LLC English LLC WelshMathematical Development
PSD
47.3
38.1
45.3
38.1
47.3
38.7
70.4
61.3
48.7 50.0 47.8 72.4
5 EAS FP‐KS3 KS4 prov WNT LA Data Analysis – August 2017
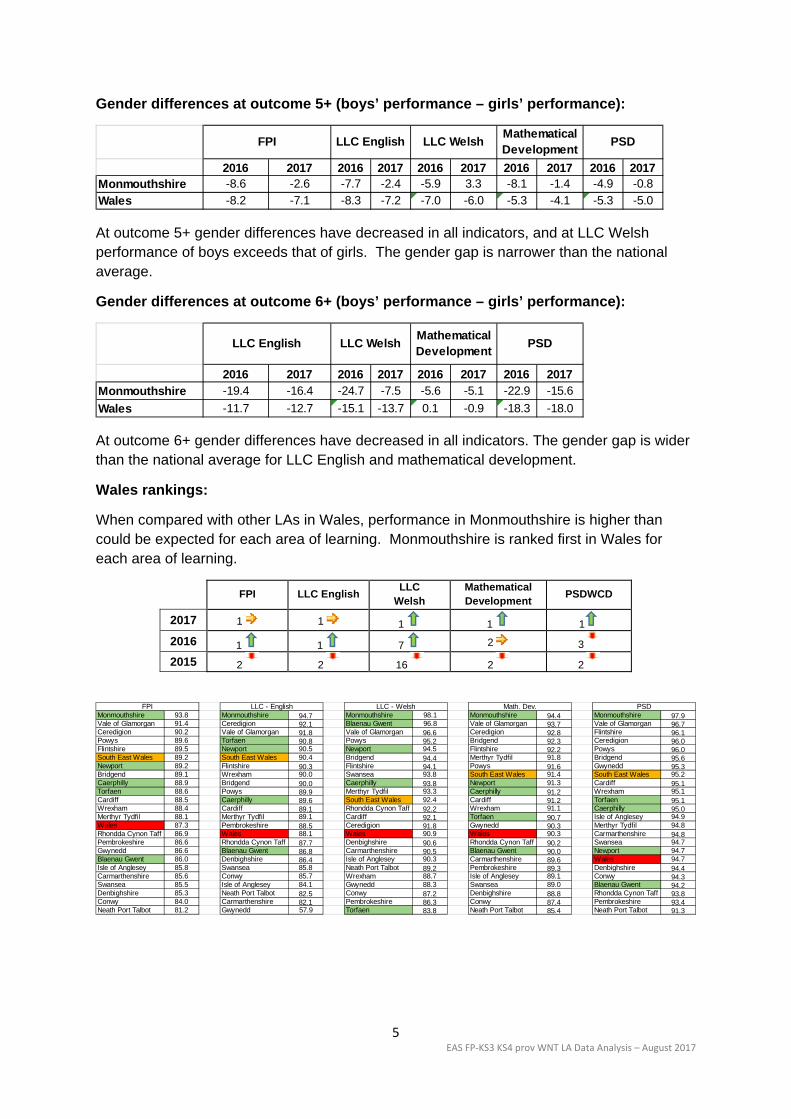
Gender differences at outcome 5+ (boys’ performance – girls’ performance):
At outcome 5+ gender differences have decreased in all indicators, and at LLC Welsh performance of boys exceeds that of girls. The gender gap is narrower than the national average.
Gender differences at outcome 6+ (boys’ performance – girls’ performance):
At outcome 6+ gender differences have decreased in all indicators. The gender gap is wider than the national average for LLC English and mathematical development.
Wales rankings:
When compared with other LAs in Wales, performance in Monmouthshire is higher than could be expected for each area of learning. Monmouthshire is ranked first in Wales for each area of learning.
FPI LLC English LLC
Welsh Mathematical Development
PSDWCD
2017 1 1 1 1 1
2016 1 1 7 2 3
2015 2 2 16 2 2
2016 2017 2016 2017 2016 2017 2016 2017 2016 2017Monmouthshire -8.6 -2.6 -7.7 -2.4 -5.9 3.3 -8.1 -1.4 -4.9 -0.8
Wales -8.2 -7.1 -8.3 -7.2 -7.0 -6.0 -5.3 -4.1 -5.3 -5.0
FPI LLC English LLC WelshMathematical Development
PSD
2016 2017 2016 2017 2016 2017 2016 2017
Monmouthshire -19.4 -16.4 -24.7 -7.5 -5.6 -5.1 -22.9 -15.6
Wales -11.7 -12.7 -15.1 -13.7 0.1 -0.9 -18.3 -18.0
LLC WelshMathematical Development
PSDLLC English
Monmouthshire 93.8 Monmouthshire 94.7 Monmouthshire 98.1 Monmouthshire 94.4 Monmouthshire 97.9Vale of Glamorgan 91.4 Ceredigion 92.1 Blaenau Gwent 96.8 Vale of Glamorgan 93.7 Vale of Glamorgan 96.7Ceredigion 90.2 Vale of Glamorgan 91.8 Vale of Glamorgan 96.6 Ceredigion 92.8 Flintshire 96.1Powys 89.6 Torfaen 90.8 Powys 95.2 Bridgend 92.3 Ceredigion 96.0Flintshire 89.5 Newport 90.5 Newport 94.5 Flintshire 92.2 Powys 96.0South East Wales 89.2 South East Wales 90.4 Bridgend 94.4 Merthyr Tydfil 91.8 Bridgend 95.6Newport 89.2 Flintshire 90.3 Flintshire 94.1 Powys 91.6 Gwynedd 95.3Bridgend 89.1 Wrexham 90.0 Swansea 93.8 South East Wales 91.4 South East Wales 95.2Caerphilly 88.9 Bridgend 90.0 Caerphilly 93.8 Newport 91.3 Cardiff 95.1Torfaen 88.6 Powys 89.9 Merthyr Tydfil 93.3 Caerphilly 91.2 Wrexham 95.1Cardiff 88.5 Caerphilly 89.6 South East Wales 92.4 Cardiff 91.2 Torfaen 95.1Wrexham 88.4 Cardiff 89.1 Rhondda Cynon Taff 92.2 Wrexham 91.1 Caerphilly 95.0Merthyr Tydfil 88.1 Merthyr Tydfil 89.1 Cardiff 92.1 Torfaen 90.7 Isle of Anglesey 94.9Wales 87.3 Pembrokeshire 88.5 Ceredigion 91.8 Gwynedd 90.3 Merthyr Tydfil 94.8Rhondda Cynon Taff 86.9 Wales 88.1 Wales 90.9 Wales 90.3 Carmarthenshire 94.8Pembrokeshire 86.6 Rhondda Cynon Taff 87.7 Denbighshire 90.6 Rhondda Cynon Taff 90.2 Swansea 94.7Gwynedd 86.6 Blaenau Gwent 86.8 Carmarthenshire 90.5 Blaenau Gwent 90.0 Newport 94.7Blaenau Gwent 86.0 Denbighshire 86.4 Isle of Anglesey 90.3 Carmarthenshire 89.6 Wales 94.7Isle of Anglesey 85.8 Swansea 85.8 Neath Port Talbot 89.2 Pembrokeshire 89.3 Denbighshire 94.4Carmarthenshire 85.6 Conwy 85.7 Wrexham 88.7 Isle of Anglesey 89.1 Conwy 94.3Swansea 85.5 Isle of Anglesey 84.1 Gwynedd 88.3 Swansea 89.0 Blaenau Gwent 94.2Denbighshire 85.3 Neath Port Talbot 82.5 Conwy 87.2 Denbighshire 88.8 Rhondda Cynon Taff 93.8Conwy 84.0 Carmarthenshire 82.1 Pembrokeshire 86.3 Conwy 87.4 Pembrokeshire 93.4Neath Port Talbot 81.2 Gwynedd 57.9 Torfaen 83.8 Neath Port Talbot 85.4 Neath Port Talbot 91.3
LLC - English LLC - Welsh Math. Dev. PSDFPI
6 EAS FP‐KS3 KS4 prov WNT LA Data Analysis – August 2017
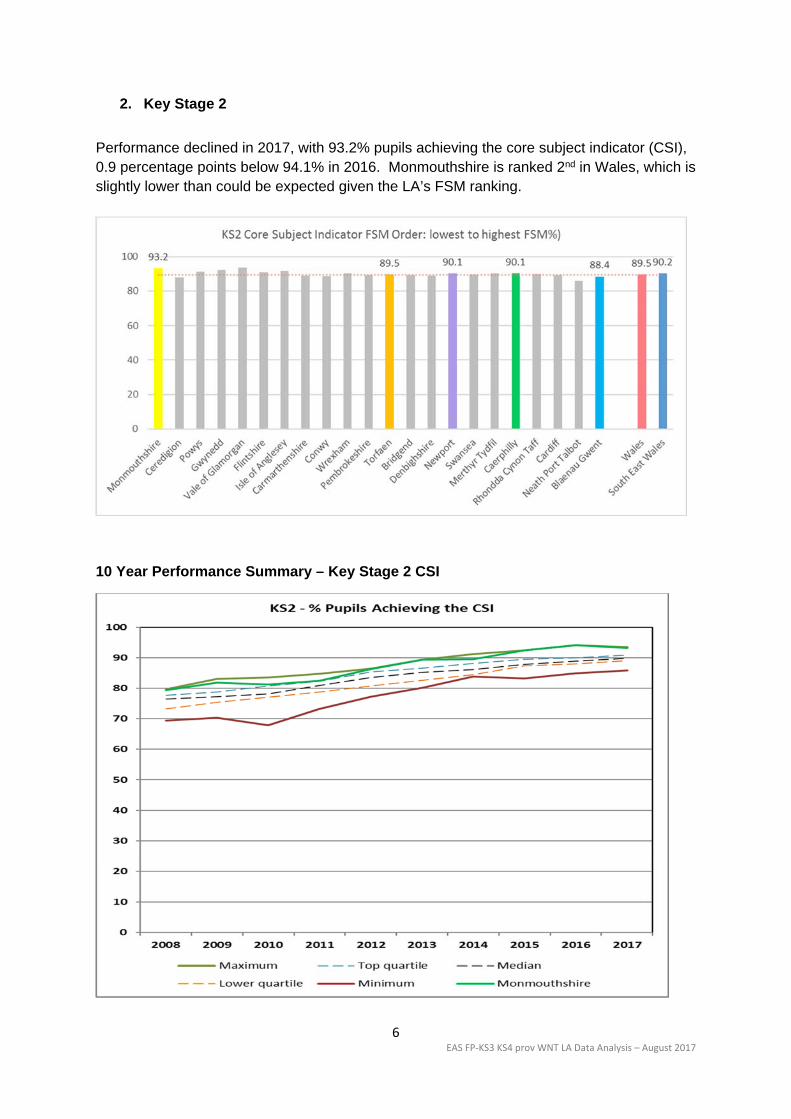
2. Key Stage 2
Performance declined in 2017, with 93.2% pupils achieving the core subject indicator (CSI), 0.9 percentage points below 94.1% in 2016. Monmouthshire is ranked 2nd in Wales, which is slightly lower than could be expected given the LA’s FSM ranking.
10 Year Performance Summary – Key Stage 2 CSI
7 EAS FP‐KS3 KS4 prov WNT LA Data Analysis – August 2017
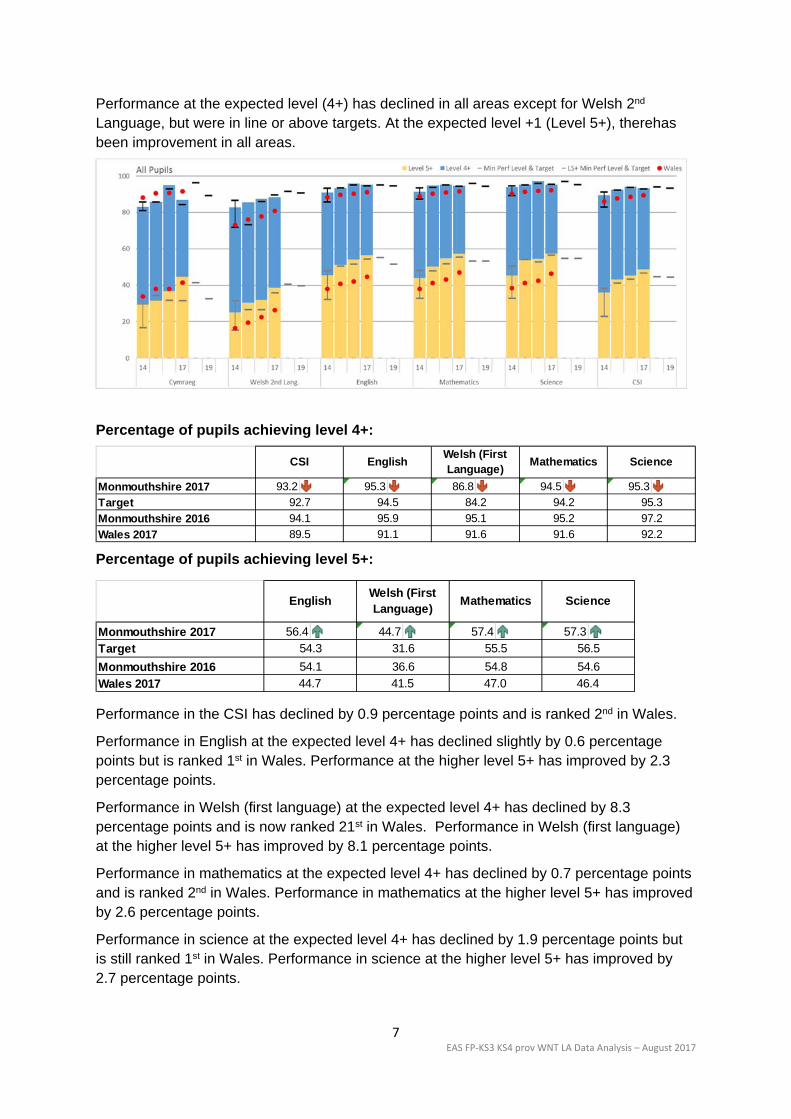
Performance at the expected level (4+) has declined in all areas except for Welsh 2nd Language, but were in line or above targets. At the expected level +1 (Level 5+), therehas been improvement in all areas.
Percentage of pupils achieving level 4+:
Percentage of pupils achieving level 5+:
Performance in the CSI has declined by 0.9 percentage points and is ranked 2nd in Wales.
Performance in English at the expected level 4+ has declined slightly by 0.6 percentage points but is ranked 1st in Wales. Performance at the higher level 5+ has improved by 2.3 percentage points.
Performance in Welsh (first language) at the expected level 4+ has declined by 8.3 percentage points and is now ranked 21st in Wales. Performance in Welsh (first language) at the higher level 5+ has improved by 8.1 percentage points.
Performance in mathematics at the expected level 4+ has declined by 0.7 percentage points and is ranked 2nd in Wales. Performance in mathematics at the higher level 5+ has improved by 2.6 percentage points.
Performance in science at the expected level 4+ has declined by 1.9 percentage points but is still ranked 1st in Wales. Performance in science at the higher level 5+ has improved by 2.7 percentage points.
Monmouthshire 2017 93.2 -1.0 95.3 -1.0 86.8 -1.0 94.5 -1.0 95.3 -1.0
Target
Monmouthshire 2016
Wales 2017
95.1
91.6
CSI EnglishWelsh (First Language)
95.9
94.592.7
94.1
89.5
Mathematics Science
95.3
97.2
92.2
94.2
95.2
91.691.1
84.2
Monmouthshire 2017 56.4 1.0 44.7 1.0 57.4 1.0 57.3 1.0
Target
Monmouthshire 2016
Wales 2017
54.1
44.7
EnglishWelsh (First Language)
36.6
41.5
54.3 31.6
47.0
54.8
Mathematics Science
54.6
46.4
55.5 56.5
8 EAS FP‐KS3 KS4 prov WNT LA Data Analysis – August 2017
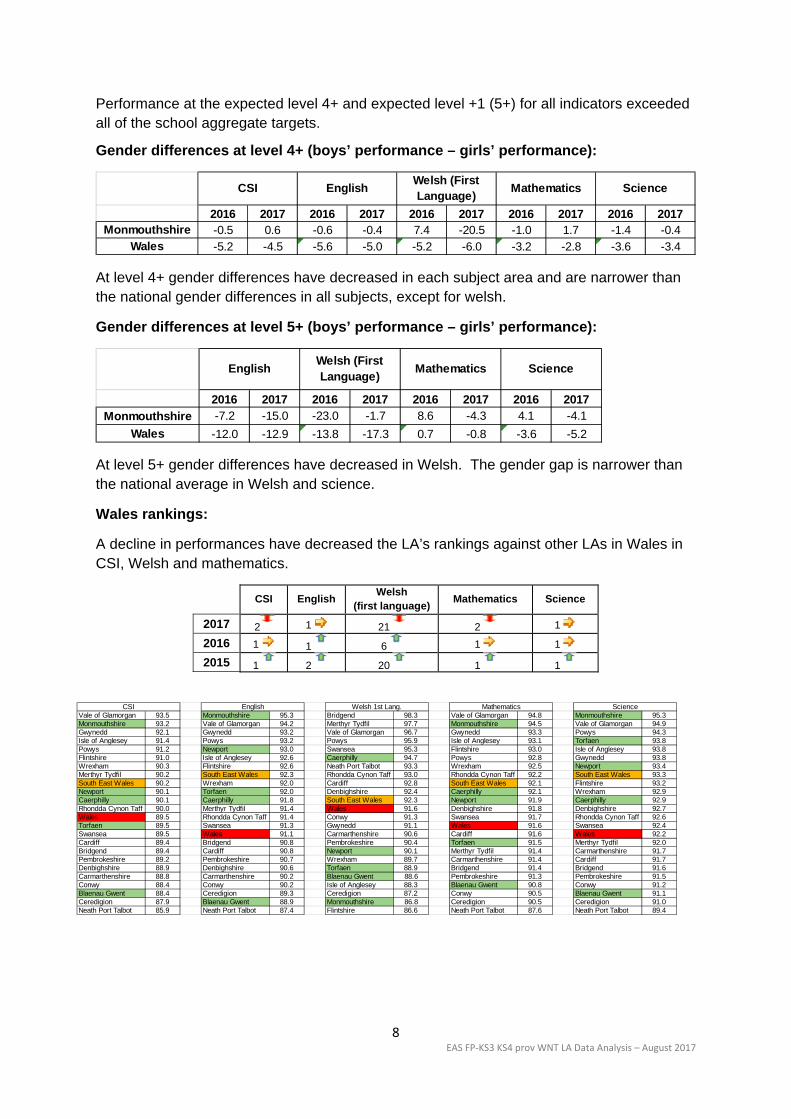
Performance at the expected level 4+ and expected level +1 (5+) for all indicators exceeded all of the school aggregate targets.
Gender differences at level 4+ (boys’ performance – girls’ performance):
At level 4+ gender differences have decreased in each subject area and are narrower than the national gender differences in all subjects, except for welsh.
Gender differences at level 5+ (boys’ performance – girls’ performance):
At level 5+ gender differences have decreased in Welsh. The gender gap is narrower than the national average in Welsh and science.
Wales rankings:
A decline in performances have decreased the LA’s rankings against other LAs in Wales in CSI, Welsh and mathematics.
CSI English Welsh
(first language) Mathematics Science
2017 2 1 21 2 1
2016 1 1 6 1 1
2015 1 2 20 1 1
2016 2017 2016 2017 2016 2017 2016 2017 2016 2017Monmouthshire -0.5 0.6 -0.6 -0.4 7.4 -20.5 -1.0 1.7 -1.4 -0.4
Wales -5.2 -4.5 -5.6 -5.0 -5.2 -6.0 -3.2 -2.8 -3.6 -3.4
CSI EnglishWelsh (First Language)
Mathematics Science
2016 2017 2016 2017 2016 2017 2016 2017
Monmouthshire -7.2 -15.0 -23.0 -1.7 8.6 -4.3 4.1 -4.1
Wales -12.0 -12.9 -13.8 -17.3 0.7 -0.8 -3.6 -5.2
EnglishWelsh (First Language)
Mathematics Science
Vale of Glamorgan 93.5 Monmouthshire 95.3 Bridgend 98.3 Vale of Glamorgan 94.8 Monmouthshire 95.3Monmouthshire 93.2 Vale of Glamorgan 94.2 Merthyr Tydfil 97.7 Monmouthshire 94.5 Vale of Glamorgan 94.9Gwynedd 92.1 Gwynedd 93.2 Vale of Glamorgan 96.7 Gwynedd 93.3 Powys 94.3Isle of Anglesey 91.4 Powys 93.2 Powys 95.9 Isle of Anglesey 93.1 Torfaen 93.8Powys 91.2 Newport 93.0 Swansea 95.3 Flintshire 93.0 Isle of Anglesey 93.8Flintshire 91.0 Isle of Anglesey 92.6 Caerphilly 94.7 Powys 92.8 Gwynedd 93.8Wrexham 90.3 Flintshire 92.6 Neath Port Talbot 93.3 Wrexham 92.5 Newport 93.4Merthyr Tydfil 90.2 South East Wales 92.3 Rhondda Cynon Taff 93.0 Rhondda Cynon Taff 92.2 South East Wales 93.3South East Wales 90.2 Wrexham 92.0 Cardiff 92.8 South East Wales 92.1 Flintshire 93.2Newport 90.1 Torfaen 92.0 Denbighshire 92.4 Caerphilly 92.1 Wrexham 92.9Caerphilly 90.1 Caerphilly 91.8 South East Wales 92.3 Newport 91.9 Caerphilly 92.9Rhondda Cynon Taff 90.0 Merthyr Tydfil 91.4 Wales 91.6 Denbighshire 91.8 Denbighshire 92.7Wales 89.5 Rhondda Cynon Taff 91.4 Conwy 91.3 Swansea 91.7 Rhondda Cynon Taff 92.6Torfaen 89.5 Swansea 91.3 Gwynedd 91.1 Wales 91.6 Swansea 92.4Swansea 89.5 Wales 91.1 Carmarthenshire 90.6 Cardiff 91.6 Wales 92.2Cardiff 89.4 Bridgend 90.8 Pembrokeshire 90.4 Torfaen 91.5 Merthyr Tydfil 92.0Bridgend 89.4 Cardiff 90.8 Newport 90.1 Merthyr Tydfil 91.4 Carmarthenshire 91.7Pembrokeshire 89.2 Pembrokeshire 90.7 Wrexham 89.7 Carmarthenshire 91.4 Cardiff 91.7Denbighshire 88.9 Denbighshire 90.6 Torfaen 88.9 Bridgend 91.4 Bridgend 91.6Carmarthenshire 88.8 Carmarthenshire 90.2 Blaenau Gwent 88.6 Pembrokeshire 91.3 Pembrokeshire 91.5Conwy 88.4 Conwy 90.2 Isle of Anglesey 88.3 Blaenau Gwent 90.8 Conwy 91.2Blaenau Gwent 88.4 Ceredigion 89.3 Ceredigion 87.2 Conwy 90.5 Blaenau Gwent 91.1Ceredigion 87.9 Blaenau Gwent 88.9 Monmouthshire 86.8 Ceredigion 90.5 Ceredigion 91.0Neath Port Talbot 85.9 Neath Port Talbot 87.4 Flintshire 86.6 Neath Port Talbot 87.6 Neath Port Talbot 89.4
CSI English Welsh 1st Lang. Mathematics Science

9 EAS FP‐KS3 KS4 prov WNT LA Data Analysis – August 2017
3. Key Stage 3
Performance continues to improve, with 92.7% pupils achieving the core subject indicator (CSI), an increase of 0.8 percentage points from 91.9% in 2016. Monmouthshire is ranked 2nd in Wales.
10 Year Performance Summary – Key Stage 3 CSI

10 EAS FP‐KS3 KS4 prov WNT LA Data Analysis – August 2017
Performance has improved across all indicators at expected level 5+, level 6+ and level 7+, except for English L6+.
Percentage of pupils achieving level 5+
Percentage of pupils achieving level 6+
Percentage of pupils achieving level 7+
Performance in the CSI has improved by 0.8 percentage points and is ranked 2nd in Wales, up from 3rd in 2016.
Performance in English at the expected level 5+ has improved by 0.3 percentage points and is ranked 2nd in Wales. Performance in English at level 6+ has declined by 1.3 percentage points, but has improved at level 7+ by 7.2 percentage points.
Monmouthshire 2017 92.7 1.0 94.5 1.0 - 0.0 94.5 1.0 97.0 1.0
Target
Monmouthshire 2016
Wales 2017
94.2
90.587.4
91.9
94.9 95.2
93.6
93.5
-
-
CSI EnglishWelsh (First Language)
Mathematics Science
96.3
95.1
93.590.8
95.1
Monmouthshire 2017 71.4 -1.0 - 0.0 75.3 1.0 78.7 1.0
Target
Monmouthshire 2016
Wales 2017
Welsh (First Language)
-
-
58.7
Science
65.6
76.5
74.2
72.7
58.7 65.5
74.5
70.9 75.1
English Maths
Monmouthshire 2017 31.9 1.0 - 0.0 40.5 1.0 39.9 1.0
Monmouthshire 2016
Wales 2017
Welsh (First Language)
ScienceMaths
26.5
English
24.7
20.7
38.8
30.8
-
20.7
34.1
11 EAS FP‐KS3 KS4 prov WNT LA Data Analysis – August 2017
Performance in mathematics at the expected level 5+ has improved by 0.9 percentage points and is ranked 2nd in Wales. Performance in mathematics at level 6+ and level 7+ has improved by 0.8 and 1.7 percentage points respectively.
Performance in science at the expected level 5+ has improved by 1.9 percentage points and is ranked 6th in Wales. Performance in mathematics at level 6+ and level 7+ has improved by 2.2 and 5.8 percentage points respectively.
Performance at the expected Level 5+ was within 2% of school aggregate targets.
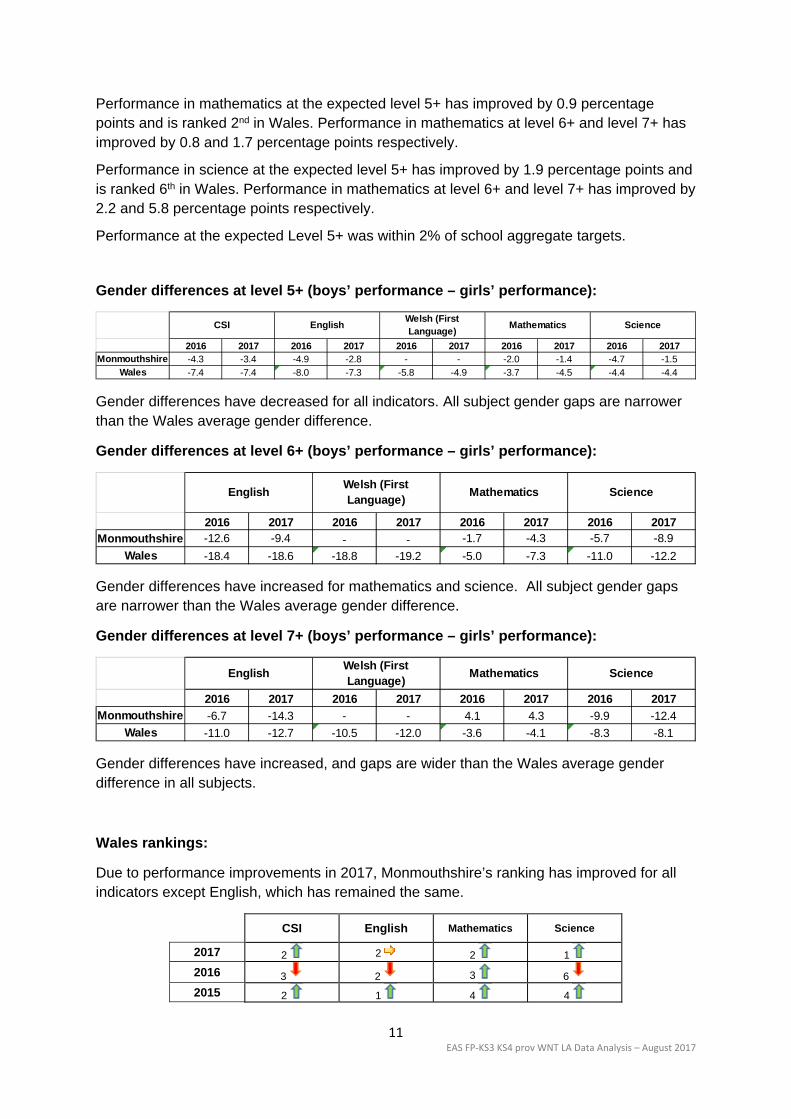
Gender differences at level 5+ (boys’ performance – girls’ performance):
Gender differences have decreased for all indicators. All subject gender gaps are narrower than the Wales average gender difference.
Gender differences at level 6+ (boys’ performance – girls’ performance):
Gender differences have increased for mathematics and science. All subject gender gaps are narrower than the Wales average gender difference.
Gender differences at level 7+ (boys’ performance – girls’ performance):
Gender differences have increased, and gaps are wider than the Wales average gender difference in all subjects.
Wales rankings:
Due to performance improvements in 2017, Monmouthshire’s ranking has improved for all indicators except English, which has remained the same.
CSI English Mathematics Science
2017 2 2 2 1
2016 3 2 3 6
2015 2 1 4 4
2016 2017 2016 2017 2016 2017 2016 2017 2016 2017Monmouthshire -4.3 -3.4 -4.9 -2.8 - - -2.0 -1.4 -4.7 -1.5
Wales -7.4 -7.4 -8.0 -7.3 -5.8 -4.9 -3.7 -4.5 -4.4 -4.4
Welsh (First Language)
Mathematics ScienceCSI English
2016 2017 2016 2017 2016 2017 2016 2017Monmouthshire -12.6 -9.4 - - -1.7 -4.3 -5.7 -8.9
Wales -18.4 -18.6 -18.8 -19.2 -5.0 -7.3 -11.0 -12.2
Welsh (First Language)
English Mathematics Science
2016 2017 2016 2017 2016 2017 2016 2017
Monmouthshire -6.7 -14.3 - - 4.1 4.3 -9.9 -12.4
Wales -11.0 -12.7 -10.5 -12.0 -3.6 -4.1 -8.3 -8.1
ScienceWelsh (First Language)
English Mathematics
12 EAS FP‐KS3 KS4 prov WNT LA Data Analysis – August 2017
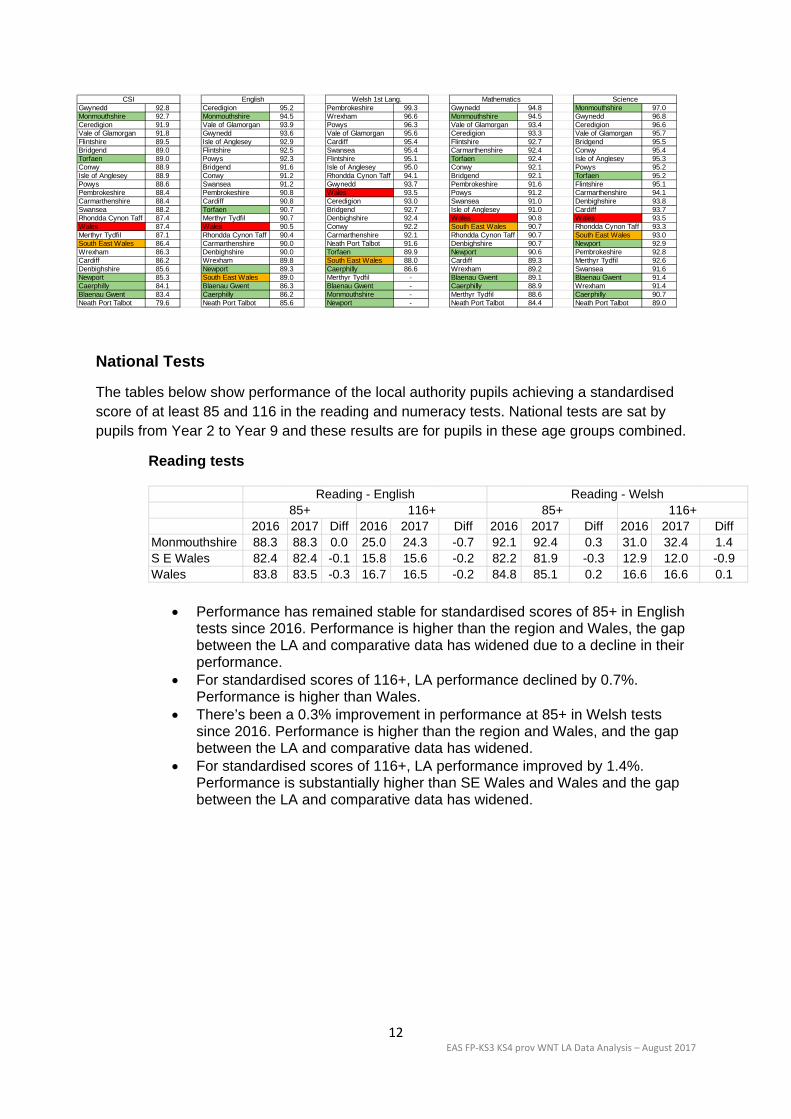
National Tests
The tables below show performance of the local authority pupils achieving a standardised score of at least 85 and 116 in the reading and numeracy tests. National tests are sat by pupils from Year 2 to Year 9 and these results are for pupils in these age groups combined.
Reading tests
Performance has remained stable for standardised scores of 85+ in English tests since 2016. Performance is higher than the region and Wales, the gap between the LA and comparative data has widened due to a decline in their performance.
For standardised scores of 116+, LA performance declined by 0.7%. Performance is higher than Wales.
There’s been a 0.3% improvement in performance at 85+ in Welsh tests since 2016. Performance is higher than the region and Wales, and the gap between the LA and comparative data has widened.
For standardised scores of 116+, LA performance improved by 1.4%. Performance is substantially higher than SE Wales and Wales and the gap between the LA and comparative data has widened.
Gwynedd 92.8 Ceredigion 95.2 Pembrokeshire 99.3 Gwynedd 94.8 Monmouthshire 97.0Monmouthshire 92.7 Monmouthshire 94.5 Wrexham 96.6 Monmouthshire 94.5 Gwynedd 96.8Ceredigion 91.9 Vale of Glamorgan 93.9 Powys 96.3 Vale of Glamorgan 93.4 Ceredigion 96.6Vale of Glamorgan 91.8 Gwynedd 93.6 Vale of Glamorgan 95.6 Ceredigion 93.3 Vale of Glamorgan 95.7Flintshire 89.5 Isle of Anglesey 92.9 Cardiff 95.4 Flintshire 92.7 Bridgend 95.5Bridgend 89.0 Flintshire 92.5 Swansea 95.4 Carmarthenshire 92.4 Conwy 95.4Torfaen 89.0 Powys 92.3 Flintshire 95.1 Torfaen 92.4 Isle of Anglesey 95.3Conwy 88.9 Bridgend 91.6 Isle of Anglesey 95.0 Conwy 92.1 Powys 95.2Isle of Anglesey 88.9 Conwy 91.2 Rhondda Cynon Taff 94.1 Bridgend 92.1 Torfaen 95.2Powys 88.6 Swansea 91.2 Gwynedd 93.7 Pembrokeshire 91.6 Flintshire 95.1Pembrokeshire 88.4 Pembrokeshire 90.8 Wales 93.5 Powys 91.2 Carmarthenshire 94.1Carmarthenshire 88.4 Cardiff 90.8 Ceredigion 93.0 Swansea 91.0 Denbighshire 93.8Swansea 88.2 Torfaen 90.7 Bridgend 92.7 Isle of Anglesey 91.0 Cardiff 93.7Rhondda Cynon Taff 87.4 Merthyr Tydfil 90.7 Denbighshire 92.4 Wales 90.8 Wales 93.5Wales 87.4 Wales 90.5 Conwy 92.2 South East Wales 90.7 Rhondda Cynon Taff 93.3Merthyr Tydfil 87.1 Rhondda Cynon Taff 90.4 Carmarthenshire 92.1 Rhondda Cynon Taff 90.7 South East Wales 93.0South East Wales 86.4 Carmarthenshire 90.0 Neath Port Talbot 91.6 Denbighshire 90.7 Newport 92.9Wrexham 86.3 Denbighshire 90.0 Torfaen 89.9 Newport 90.6 Pembrokeshire 92.8Cardiff 86.2 Wrexham 89.8 South East Wales 88.0 Cardiff 89.3 Merthyr Tydfil 92.6Denbighshire 85.6 Newport 89.3 Caerphilly 86.6 Wrexham 89.2 Swansea 91.6Newport 85.3 South East Wales 89.0 Merthyr Tydfil - Blaenau Gwent 89.1 Blaenau Gwent 91.4Caerphilly 84.1 Blaenau Gwent 86.3 Blaenau Gwent - Caerphilly 88.9 Wrexham 91.4Blaenau Gwent 83.4 Caerphilly 86.2 Monmouthshire - Merthyr Tydfil 88.6 Caerphilly 90.7Neath Port Talbot 79.6 Neath Port Talbot 85.6 Newport - Neath Port Talbot 84.4 Neath Port Talbot 89.0
CSI English Welsh 1st Lang. Mathematics Science
2016 2017 Diff 2016 2017 Diff 2016 2017 Diff 2016 2017 DiffMonmouthshire 88.3 88.3 0.0 25.0 24.3 -0.7 92.1 92.4 0.3 31.0 32.4 1.4S E Wales 82.4 82.4 -0.1 15.8 15.6 -0.2 82.2 81.9 -0.3 12.9 12.0 -0.9Wales 83.8 83.5 -0.3 16.7 16.5 -0.2 84.8 85.1 0.2 16.6 16.6 0.1
Reading - English Reading - Welsh85+ 116+ 85+ 116+

13 EAS FP‐KS3 KS4 prov WNT LA Data Analysis – August 2017
Numeracy tests
There’s been a 0.4% decline in performance at 85+ in Procedural tests since 2016. Performance is higher than Wales and the gap between the LA and Wales data remains stable.
At 116+, LA performance improved by 0.2%. Performance is higher than Wales, and the gap between the LA and Wales data has narrowed slightly.
Performance at 85+ in Reasoning tests remains stable since 2016. There is a decline in the regional and national data and performance is higher than the comparative data.
At 116+, LA performance declined by 1.4%. Performance is higher than Wales but the gap has narrowed.
Wales Rankings
2016 2017 Diff 2016 2017 Diff 2016 2017 Diff 2016 2017 DiffMonmouthshire 88.7 88.3 -0.4 21.5 21.7 0.2 87.8 87.7 -0.1 20.4 19.0 -1.4S E Wales 82.4 82.1 -0.3 14.5 14.7 0.2 81.9 80.9 -1.0 14.0 13.4 -0.6
Wales 84.3 83.8 -0.5 16.1 16.0 -0.1 84.8 84.2 -0.6 16.9 16.6 -0.3
Numeracy - Procedural Numeracy - Reasoning85+ 116+85+ 116+
2017 2 2 2 42016 2 2 2 72015 1 3 4 7
ReadingEn
Reading We
Numeracy procedural
Numeracy reasoning
Vale of Glamorgan 89.2 Vale of Glamorgan 92.8 Vale of Glamorgan 89.7 Vale of Glamorgan 89.9Monmouthshire 88.3 Monmouthshire 92.4 Monmouthshire 88.3 Gwynedd 88.0Powys 86.4 Merthyr Tydfil 91.2 Ceredigion 86.9 Powys 87.9Swansea 85.7 Cardiff 89.5 Powys 86.8 Monmouthshire 87.7Ceredigion 85.2 Powys 88.6 Swansea 86.6 Ceredigion 87.5Bridgend 84.8 Denbighshire 87.2 Carmarthenshire 86.6 Carmarthenshire 87.5Pembrokeshire 84.6 Neath Port Talbot 86.8 Gwynedd 85.7 Swansea 87.1Carmarthenshire 84.3 Swansea 86.8 Bridgend 85.3 Isle of Anglesey 86.1Cardiff 84.1 Carmarthenshire 85.9 Isle of Anglesey 84.2 Flintshire 85.2Flintshire 83.8 Wales 85.1 Cardiff 84.1 Bridgend 85.1Conwy 83.6 Rhondda Cynon Taff 84.9 Wales 83.8 Pembrokeshire 84.3Wales 83.5 Gwynedd 84.6 Neath Port Talbot 83.8 Wales 84.2Isle of Anglesey 83.0 Ceredigion 84.3 Flintshire 83.7 Conwy 84.0Gwynedd 83.0 Pembrokeshire 83.9 Conwy 83.2 Cardiff 83.8Neath Port Talbot 82.8 Bridgend 83.7 Rhondda Cynon Taff 82.6 Denbighshire 83.1Merthyr Tydfil 82.4 Conwy 82.6 Merthyr Tydfil 82.5 Neath Port Talbot 82.8Rhondda Cynon Taff 82.2 Caerphilly 82.6 Caerphilly 81.8 Merthyr Tydfil 82.7Caerphilly 82.0 Flintshire 82.0 Newport 81.6 Rhondda Cynon Taff 82.5Denbighshire 81.9 Wrexham 82.0 Torfaen 81.5 Wrexham 81.8Newport 81.8 Torfaen 81.0 Denbighshire 81.0 Caerphilly 81.6Torfaen 81.7 Newport 81.0 Wrexham 80.9 Torfaen 80.7Wrexham 80.8 Isle of Anglesey 79.4 Pembrokeshire 79.5 Newport 79.1Blaenau Gwent 78.7 Blaenau Gwent 63.5 Blaenau Gwent 77.4 Blaenau Gwent 75.7
Reading - English Reading - Welsh Numeracy - Procedural Numeracy - Reasoning
14 EAS FP‐KS3 KS4 prov WNT LA Data Analysis – August 2017
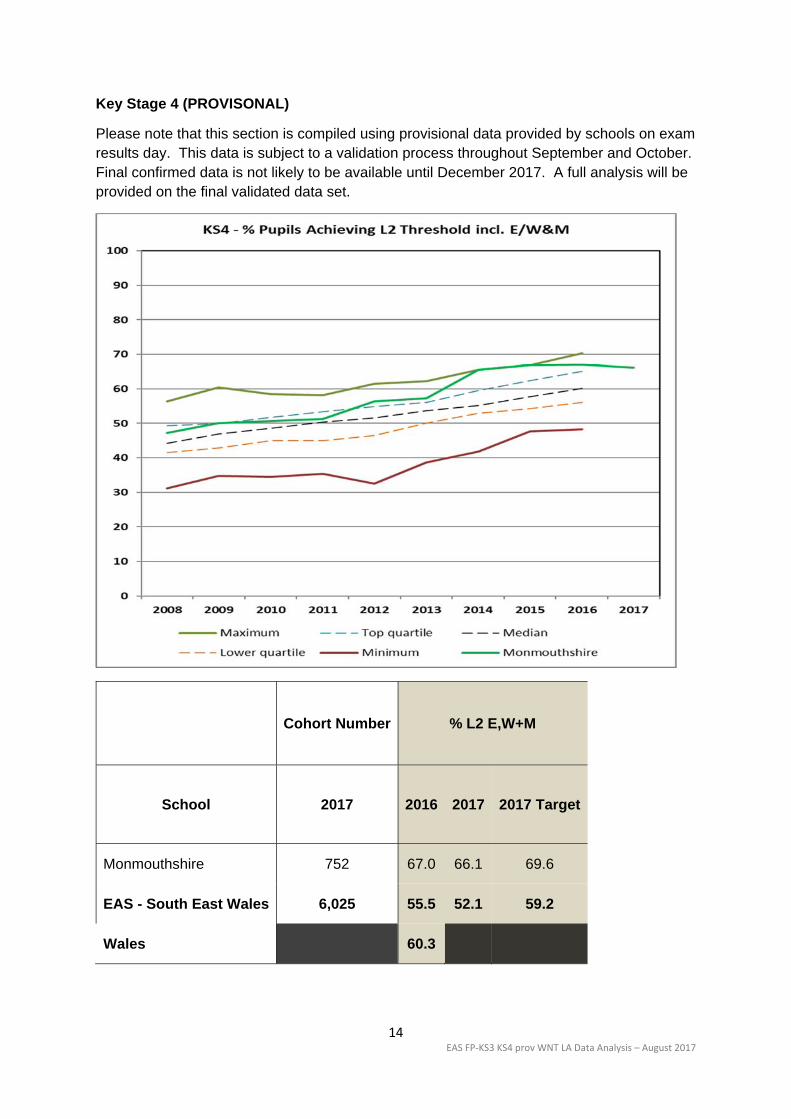
Key Stage 4 (PROVISONAL)
Please note that this section is compiled using provisional data provided by schools on exam results day. This data is subject to a validation process throughout September and October. Final confirmed data is not likely to be available until December 2017. A full analysis will be provided on the final validated data set.
Cohort Number % L2 E,W+M
School 2017 2016 2017 2017 Target
Monmouthshire 752 67.0 66.1 69.6
EAS - South East Wales 6,025 55.5 52.1 59.2
Wales 60.3