2017 childhood lead surveillance report lead & healthy
TRANSCRIPT

1
2017 Childhood Lead Surveillance Report
Lead & Healthy Homes Division

2
Table of Contents
Executive Summary
Introduction
2017 Updates and Highlights
Medicaid
Case Management
East Chicago Superfund Site
Lead in Burmese Populations
Risk Factors
Elevated Blood Lead Levels
Indiana Blood Lead Surveillance
County Data
Endnotes
Contact Information

3
Executive Summary The Indiana State Department of Health (ISDH) is working to increase blood lead screenings in Indiana in order to better identify and provide support to children with elevated blood lead levels. Lead is an issue that has been in the public eye for some time, but for many individuals and physicians, it has been overshadowed by multiple other health risks. Lead’s health effects are often overlooked or assumed to be tied to another condition, but a greater understanding of these effects is necessary. Lead can have lifelong impact on the neurological, psychological, and emotional development of children and can only be mitigated through early testing and intervention. The Indiana Administrative Code defines a child’s blood lead level as elevated if the child has a confirmed blood lead test at or above 10µg/dL. A child’s blood lead level becomes confirmed when he or she receives either a single venous blood test or two capillary blood tests that reveal a blood lead result at or above 10µg/dL. A majority of local health departments across the state use this as their standard for providing case management services. Some local health departments have adopted a lower standard of 5 µg/dL, which matches the current recommendations from the Centers for Disease Control and Prevention (CDC). In 2017, ISDH received 69,508 test results, representing 65,318 Indiana children tested. This is a 23 percent increase from the 56,438 children tested in 2016. Of the children tested, 583 had at least one test with a blood lead level at or above 10 µg/dL. A total of 283 of those children were confirmed cases and were referred to case management. In February 2017, the Lead and Healthy Homes Program at the Indiana State Department of Health (ISDH) re-formed as a new division under the direction of Assistant Commissioner Dr. Judith Lovchik. The programs had been housed under the Environmental and Public Health Division for nearly six years. Paul Krievins was named director of the division in November 2017. In 2017, the division also worked with partners at the Indiana Housing and Community Development Authority (IHCDA) and Family and Social Services Administration (FSSA) to identify three new sources of funding for lead hazard control and abatement. IHCDA was able to identify funds through its Community Development Block Grant (CDBG) and HUD Demonstration Grant, while ISDH was able to partner with the FSSA’s Children’s Health Insurance Program (CHIP) to identify multi-year funding. These funds, totaling more than $7.4 million in the first year, represent Indiana’s commitment to helping address lead risks in communities and are the catalyst for future investments in lead-safe housing.
Introduction
The Lead and Healthy Homes Division (LHHD) aims to reduce the incidence of elevated blood lead levels in children throughout Indiana. The division seeks to do this through proactive screening, treatment, case management, and remediation of lead hazards.
Lead is a heavy metal that has been a part of both the U.S. and world economies for some time. Lead has been used for a variety of industrial and residential processes, including in paint, plumbing, jewelry, and cosmetics. The most common lead exposure for children in Indiana is through lead-based paint. Lead was an additive to most paints prior to the ban on lead-based paint in 1978. As it deteriorates with age, or when it is disturbed, such as during remodeling and repair projects, lead paint can generate paint fragments, chips, and dust. These particles can be ingested or inhaled by small children, with potentially

4
significant health consequences. This is especially concerning in Indiana, where U.S. Census data show more that 62% of all housing was built before 1980.
Research has shown that elevated blood lead levels (EBLLs) can negatively impact cognitive function and cause behavioral disorders and slowed physical development in young children. Children under age 7 are more vulnerable to lead hazards due to the lack of a fully formed blood brain barrier and because they are more likely to put hands or other objects into their mouths. Sometimes there are no symptoms of an elevated blood lead level. In fact, signs of lead exposure could be mistaken for other conditions like ADHD, autism, or the flu. However, exposure to any level of lead could harm a child’s nervous system, brain development, and growth.
Lead exposure also can have a financial impact, including increased medical and education costs through adulthood (Peter Muenning, 2009). Additional costs incurred include expenses associated with state and local county government case management and increased utilization of Medicaid (Needlemen, 1990).
Indiana law does not require universal testing of children under age 7. Only children covered by Medicaid are required by federal law to be tested for lead, with mandatory testing for those children at 12 and 24 months, or between 36 and 72 months if they have not previously been tested. However, it is important for parents and healthcare providers to recognize the importance of identifying children with elevated blood lead levels early and providing education and other resources to help decrease the long-term effects of lead. The Indiana State Department of Health’s Lead and Healthy Homes Division remains committed to identifying at-risk children and monitoring the treatment of those who have confirmed elevated blood lead levels.
An at-risk child is defined by 410 IAC 29-1-2 as a child who:
i. lives in or regularly visits a house or other structure built before 1978;
ii. has a sibling or playmate who has been lead poisoned;
iii. has frequent contact with an adult who:
a. works in an industry;
b. or has a hobby that uses lead;
iv. is an immigrant or refugee or has recently lived abroad;
v. is a member of a minority group;
vi. is a Medicaid recipient;
vii. uses medicines or cosmetics containing lead; or
viii. lives in a geographic area that increases the child’s probability of exposure to lead
2017 Highlights In 2017, 65,318 individual children were screened in Indiana. This includes children who received an initial screening with results below the elevated threshold and did not require a subsequent confirmatory test and those whose initial tests came in as elevated and may or may not have a subsequent confirmatory test. The number of children tested represents about 11 percent of the children under age 7 in the state, based on the U.S. Census population estimate for 2017. According to Indiana statute, a child becomes a confirmed case when he or she receives at least one venous blood test or two capillary blood tests within a three-month period with a blood lead result at or above 10µg/dL.

5
Among the children tested:
283 had a confirmed blood level at or above 10μg/dL
56% were males
48% were white
Medicaid Data
In 2017, FSSA provided the Lead & Healthy Homes Division with an assessment showing which children receiving lead screenings were also covered by Medicaid. A total of 33,823 unique Indiana children covered by Medicaid were tested in 2017. This represents 52% of the total tests received. Of the children who had blood lead levels at or above 10μg/dL, 62% received Medicaid benefits.
One of the goals of the Lead and Healthy Homes Division in 2018 is to increase the percentage of children receiving Medicaid who are screened by their physician. Comparing the number of Medicaid-eligible children who receive their first dose of Measles, Mumps and Rubella vaccine (a requirement for all children receiving Medicaid benefits) with those who receive a blood lead test either at 12 or 24 months (also a Medicaid requirement) has shown that while 94% of all Medicaid-eligible children receive the vaccine, only 11% had a blood lead test.
The poor testing rate has necessitated an all-hands-on-deck response plan that seeks to inform and motivate parents, physicians, service providers, educators, and the general public about the importance of lead testing in young children. Specific efforts to address this will include issuing provider report cards, sending messaging to WIC recipients, a detailed review of the process and effectiveness of current surveillance systems, and increasing community engagement among at-risk populations.
Case Management – Training and Outreach
In 2017, ISDH undertook a number of projects designed to increase the transparency and effectiveness of
the case management process. These efforts resulted in multiple improvements in case manager
understanding of state lead laws, updated state forms and processes, and movement toward a new web-
based case management tool.
One of the first projects ISDH staff worked on in 2017 was a concerted effort to increase the number of
local health departments whose staff have been trained on proper blood lead specimen collection,
appropriate packaging and laboratory submission of specimens, and case management of children with
elevated blood lead results. This training is required under the Indiana Administrative Code (410 IAC 29)
for all new hires. Through a combination of in-person trainings hosted in Indianapolis at the ISDH labs
and field-based trainings at local health department offices, the program saw an increase in the number
of health departments trained from 71% in 2016 to 98% in 2017.
ISDH staff also updated a number of the forms and outreach materials available to local health
departments and the public. Staff created a new home visit assessment form that combined the
nutritional, behavioral, and developmental questionnaires into one dual-language (Spanish/English)
form. Staff also updated a bilingual lead brochure. All new outreach materials can be found on ISDH’s
website at http://www.in.gov/isdh/26550.htm.
ISDH also participated in testing and training on a new web-based case management and data collection
system from the Centers for Disease Control and Prevention (CDC). The new web-based system, called

6
the Healthy Housing Lead Poisoning Surveillance System (HHLPSS), is one of two options being
considered as a replacement for the current system, called the Systematic Tracking of Elevated Lead
Levels and Remediation (STELLAR) tool. HHLPSS has a number of advantages over the old STELLAR
system, offering greater accessibility, an ability to directly accept provider data, and an ability for both
ISDH and local health departments to access shared saved data. Pending additional testing,
implementation of a new case management system is slated to begin in 2018 and will include training
and outreach to local health departments regarding data collection and case management.
Each year, Indiana looks to improve not only statewide performance relative to screening and case management, but also to assist all 93 local health departments in their efforts to provide services to families of children with elevated blood lead levels. In order to do this effectively, ISDH supports case referral and surveillance associated with active cases for each local health department. Support can include assistance with tracking down missing lead test information, providing referrals for risk assessments, and help with tracking necessary homes visits and assessments.
East Chicago Lead Site
In 2017, ISDH and its agency partners, including the Indiana Department of Environmental Management and Indiana Housing and Community Development Authority, continued efforts to help address concerns about lead exposure among residents living near the former U.S. Steel federal Superfund site in East Chicago. The ISDH’s Division of Emergency Preparedness, in conjunction with the East Chicago Health Department (ECHD), between 2016 and 2017 tested a total of 2,278 individuals, including 499 children under age 7, for elevated blood lead levels. Of the 499 children tested, a total of 39 had confirmed blood lead levels at or above 5 µg/dL, the level of concern set for this population through an executive order issued by Governor Eric J. Holcomb. Governor Eric J. Holcomb also worked to provide both short-term support to the affected citizens, in the form of Executive Orders 17-13 and 17-14, and long-term support in the form of House Enrolled Act 1344, which authorized resources needed to help with lead hazard control efforts. In addition, in July 2016, ISDH awarded $100,000 in funding to help ECHD hire a public health nurse and health educator and provide education and outreach at numerous multi-agency neighborhood meetings. Nearly $80,000 of that initial allocation was carried over into a new contract that began July 1, 2017, with the same commitment to help support staff and outreach related to addressing the crisis. Through the end of 2017, the ECHD was on track to spend all awarded funds as it continued to provide testing, case management, and outreach services to those affected by lead in their community. ISDH remains committed to the well-being of citizens in East Chicago and will continue to provide support and other needed assistance throughout 2018.
Lead in Indiana’s Burmese Population Over the past decade, Marion and Allen counties have experienced increases in their Burmese populations. Concerns about lead levels among these residents arose as a result of elevated blood lead levels identified within members of the community. Subsequent investigations were conducted both by the Fort Wayne Allen County Department of Health in 2014 and the Marion County Public Health

7
Department in 2016. The ISDH Food Protection and Environmental Public Health divisions, in partnership with the Lead and Healthy Homes Division, worked with the county health departments in 2017 to develop sampling plans for collection of traditional foods, cosmetics, and pharmaceutical products used by the Burmese population. These efforts revealed that a number of the traditional foods, medicines, and cosmetics being used by this population had lead levels significantly in excess of those considered safe. In response, ISDH and the local health departments developed educational materials in Burmese, which were distributed by local case managers and community leaders. ISDH will continue to work with state and local partners to develop other actions regarding potential future sampling and continue to expand on education about these items and others.
Risk Factors Associated with Elevated Blood Lead Levels in Indiana In 2017, ISDH staff worked to debut an interactive map on the Lead and Healthy Homes Division website to help local health departments visualize lead risk factors within their geographic areas. This map, which can be found at https://www.in.gov/itp/2406.htm, is designed to provide information to local units of government and health departments on areas in their communities with the highest risk factors for lead exposure and to better identify areas in which children are more likely to be exposed to lead. The data sources used to produce this map were organized by census tract and compared data associated with housing stock (pre-1980 construction) and lower-income populations. The maps did not use blood lead levels results or information on historical elevated blood lead levels as a part of the risk criteria. Using this information would have biased the mapping in a way that doesn’t represent risk today.

8
Figure 1 The lead census tract map will allow users to enter an address to assess risk level.
ISDH anticipates that with increased outreach to these high-risk areas, more elevated lead levels will be identified at the city, county, and state levels, which would increase the overall percentage of children impacted by lead in Indiana.

9
FIGURE 2
Indiana Blood Lead Surveillance
In Indiana, blood lead testing is most often conducted by family physicians and pediatricians, either in-office or through a referral to a testing laboratory. Testing is also routinely conducted by local health departments through their clinical services offered in-office and remotely. Less frequently, testing is also performed by nurses and medical staff through organizations like the Indiana Women, Infants and Children (WIC) program and Head Start through private funding. Indiana Administrative Code requires that any person examining the blood of an individual for the presence of lead must report to the state health department the results of the examination not later than one (1) week after completing the examination. In order to understand the baselines in screening among communities, to identify potential lead hazards in communities, and to provide case coordination to Indiana children with elevated blood lead levels, ISDH must receive the information below per the Indiana Administrative Code (410 IAC 29-3-1 Rule 3. Reporting):
(1) With respect to the individual whose blood is examined: A. Full name B. Date of birth C. Gender D. Full address, including street address, city, and ZIP code E. County of residence F. Race and ethnicity G. Parent or guardian’s name and phone number, where applicable H. Any other information that is required to be included to qualify to receive federal funding.
(2) With respect to the examination: A. The date
40811
41267
56438
64030
0.0%
0.1%
0.2%
0.3%
0.4%
0.5%
0
10000
20000
30000
40000
50000
60000
70000
2014 2015 2016 2017
Number of Children Tested for Lead and the Percentage of Confirmed Elevated Cases (≥10µg/dL), 2014-2017
Children Tested Percentage of Confirmed Cases (>=10ug/dL)

10
B. The type of blood test performed C. The person’s normal limits for the test (interpreted as elevated or non-elevated) D. The results of the test E. The interpretation of the results of the test by the person who examined the specimen for
the presence of lead
In 2017, the Lead and Healthy Homes Division began to improve both the quality and quantity of information being transmitted. Through work with a number of the larger health systems throughout the state, the program saw significant improvements in the accuracy of the reportable fields submitted week to week.
For additional information on the full lead result reporting code, please visit the Indiana Administrative Code. Please consult the following link for more information about reporting blood lead results: https://secure.in.gov/isdh/files/FINAL(2.0)CD_Reportable_Diseases_List-1-7-2016.pdf.
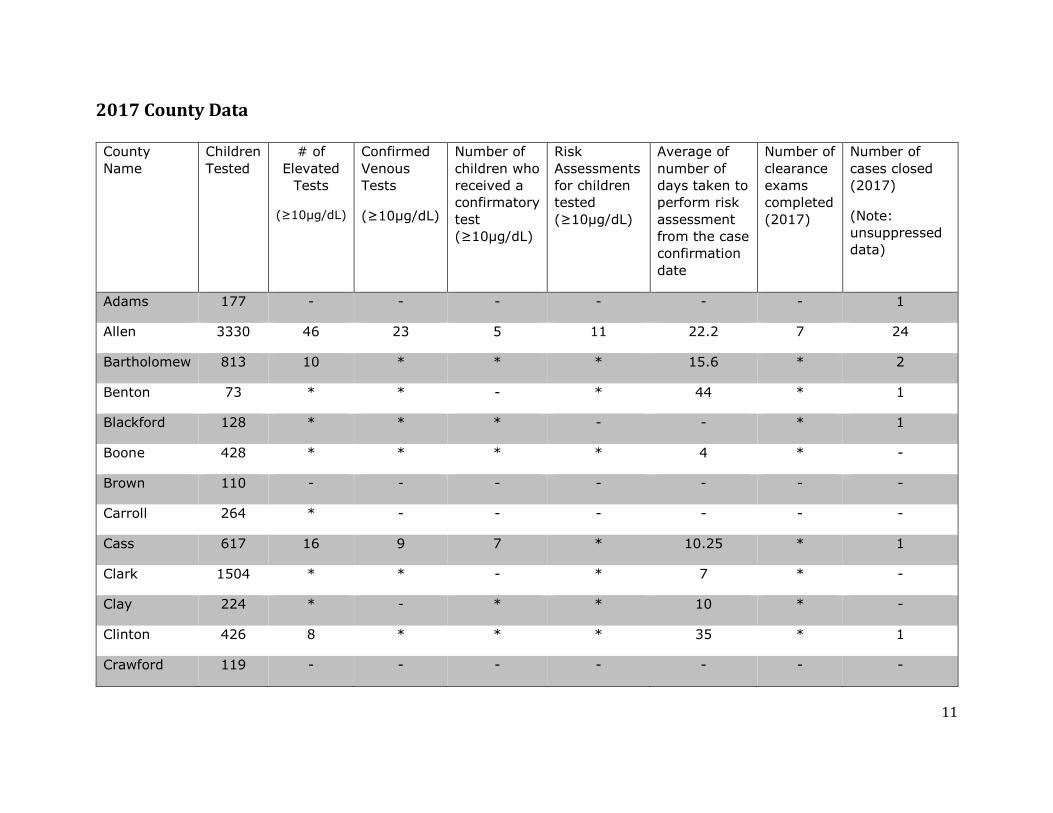
2017 County Data
Data listed in the table below include the number of children with a screening result at or above 10µg/dL. It comes from a variety of sources, with limitations identified in the bullets below:
- Children whose test results did not include the required county listing are not included in these numbers.
- The number of risk assessments and identified hazards is included by county. However, risk assessments can be conducted for children who do not have an elevated blood lead level, and the number of hazards identified may be larger than the number of risk assessments done.
- Clearance exams are only conducted if lead hazards are identified during the risk assessment and if efforts have been made by the property owner to alleviate the issues. If no hazards are reported, Indiana law does not require a clearance exam. If there were fewer than 5 results for any given county data point, the values were suppressed in order to maintain confidentiality.
11
2017 County Data County
Name
Children
Tested
# of
Elevated
Tests
(≥10µg/dL)
Confirmed
Venous
Tests
(≥10µg/dL)
Number of
children who
received a
confirmatory
test
(≥10µg/dL)
Risk
Assessments
for children
tested
(≥10µg/dL)
Average of
number of
days taken to
perform risk
assessment
from the case
confirmation
date
Number of
clearance
exams
completed
(2017)
Number of
cases closed
(2017)
(Note:
unsuppressed
data)
Adams 177 - - - - - - 1
Allen 3330 46 23 5 11 22.2 7 24
Bartholomew 813 10 * * * 15.6 * 2
Benton 73 * * - * 44 * 1
Blackford 128 * * * - - * 1
Boone 428 * * * * 4 * -
Brown 110 - - - - - - -
Carroll 264 * - - - - - -
Cass 617 16 9 7 * 10.25 * 1
Clark 1504 * * - * 7 * -
Clay 224 * - * * 10 * -
Clinton 426 8 * * * 35 * 1
Crawford 119 - - - - - - -

12
Daviess 87 - - - 11 - - 1
De Kalb 237 - - - * - - -
Dearborn 290 * - * 7 65 * 1
Decatur 249 * - - 12 - - -
Delaware 824 21 8 * 8 31.6 * 2
Dubois 57 * * - * 6 * -
Elkhart 5448 58 7 7 * 20 * 8
Fayette 237 * * * * 13.5 * 2
Floyd 1033 6 * * 7 4 - 1
Fountain 106 * * - * 17 * 1
Franklin 241 * * - - - - -
Fulton 134 * * - - - - -
Gibson 253 * - * * 42 - 1
Grant 1087 8 * * - - - 5
Greene 463 * - - * 16 * -
Hamilton 1903 6 * * * 25 * 2
Hancock 242 * * - 6 - - 1
Harrison 546 - - - * 43 - -
Hendricks 505 * - - 6 - - 3
Henry 210 * * - 8 - - 1

13
Howard 862 * * * - - - 5
Huntington 172 * * * * 9 * 1
Jackson 513 11 * * * 50 - -
Jasper 187 - - - * - - -
Jay 182 * * - * 8 * -
Jefferson 355 - - - - - - -
Jennings 130 * * - - - - 1
Johnson 814 7 * * * 22.5 - 2
Knox 223 * * * * 51 - 1
Kosciusko 455 * - - - - - 3
La Porte 1206 8 * * * - * 1
Lagrange 110 - - - - - - 1
Lake 4799 34 22 * 13 12.6 12 23
Lawrence 755 * * * * 79.5 - 1
Madison 1177 21 5 * * 26.4 * 3
Marion 8936 83 33 23 51 12.38 28 43
Marshall 385 * * * - - - 1
Martin 102 * * - - - - -
Miami 268 * * - * 22 - 3
Monroe 2582 * * * - - - -

14
Montgomery 498 9 * * * 19.75 * -
Morgan 761 * - - - - - -
Newton 89 * - * - - - -
Noble 199 6 * * * 7 * 1
Ohio 44 * - * * 48 * -
Orange 196 - - - 6 - - -
Owen 393 * * * * 90 * -
Parke 131 - - - - - - -
Perry 142 - - - - - - -
Pike 37 - - - - - - -
Porter 927 * * - * - * 1
Posey 163 * - - - - - -
Pulaski 94 * - - - - - -
Putnam 239 * * - * 15 - -
Randolph 108 * - - - - - -
Ripley 348 * - - - - - -
Rush 71 * - * * 9 * 1
Scott 279 * * - * 62 * -
Shelby 109 * * * * 7 * 1
Spencer 177 - - - - - - 1

15
St Joseph 4430 54 23 16 6 35 - 21
Starke 142 - - - - - - -
Steuben 189 * - * * 14 * -
Sullivan 116 - - - - - - 1
Switzerland 68 * * - * 7.5 * -
Tippecanoe 1668 22 10 * 6 12.13 * 8
Tipton 94 - - - - - - -
Union 110 - - - - - - 1
Vanderburgh 1427 17 12 * * 12 * 4
Vermillion 198 * * * * 122 * 1
Vigo 1204 9 6 * * 10.8 * 4
Wabash 182 * * * - - - 1
Warren 49 * * - - - - -
Warrick 239 - - - - - - 1
Washington 357 * * * * 15 * -
Wayne 1353 14 6 * 6 10.8 6 9
Wells 264 * * - * - * -
White 331 - - - - - - 2
Whitley 323 * * * - - - -
Unknown 990 11 * - - - - -
* means that data less than 5 have been suppressed to protect confidentiality. Risk assessments and hazards identified from I-Lead reporting.

16
ENDNOTES The information contained in this report was compiled by the Lead and Healthy Homes Program in compliance with IC 16-41-39.4-5.
REFERENCES
Centers for Disease Control and Prevention. (n.d.). Retrieved February 9, 2015, from www.cdc.gov: www.cdc.gov/nceh/lead/
Needlemen, S. e. (1990). British Medical Journal. Retrieved February 4, 2016, from National Library of Medicine, National Institute of Health: http://www.ncbi.nlm.nih.gov/pmc/articles/PMC1663823/
Peter Muenning, M. M. (2009, September 7). JAMA Pediatrics. Retrieved February 11, 2016, from JAMA: http://archpedi.jamanetwork.com
Environmental Public Health Tracking (2014, December). Economic burden of the environment on the health of children in Minnesota. Retrieved from Minnesota Department of Health: http://www.health.state.mn.us/divs/hpcd/tracking/projects/burden.html
U.S. Census Bureau, Population Division. (2017, June). Annual Estimates of the Resident Population by Single Year of Age and Sex for the United States, States, and Puerto Rico Commonwealth: April 1, 2010 to July 1, 2017 Population Estimates Retrieved September 27, 2018, from https://factfinder.census.gov/faces/tableservices/jsf/pages/productview.xhtml?src=bkmk
CONTACT INFORMATION:
Indiana State Department of Health
Lead & Healthy Homes Division
100 N. Senate Ave., N855
Indianapolis, IN 46204