2017 budget study session - .net framework
TRANSCRIPT
2017 Budget Study
Session
10/10/2016 1
Managing Member Meeting
October 18th, 2016
Date of Meeting: 10/18/16Item No.: 4C
Agenda
• Budget Schedule
• 2016 Forecast and Key Messages
• 2017-2021 Capital Improvement Plan
• 2017 Budget and Key Messages
• 2017-2021 Operating Forecast
10/10/2016 2

Budget Schedule
• October 18
• Strategic Business Plan update
• Transition Plan update
• Budget study session
• November 1
• Approve 2017 operating budget
• Approve 2017-2021 Capital Improvement Plan
• Capital Construction contribution
10/10/2016 3
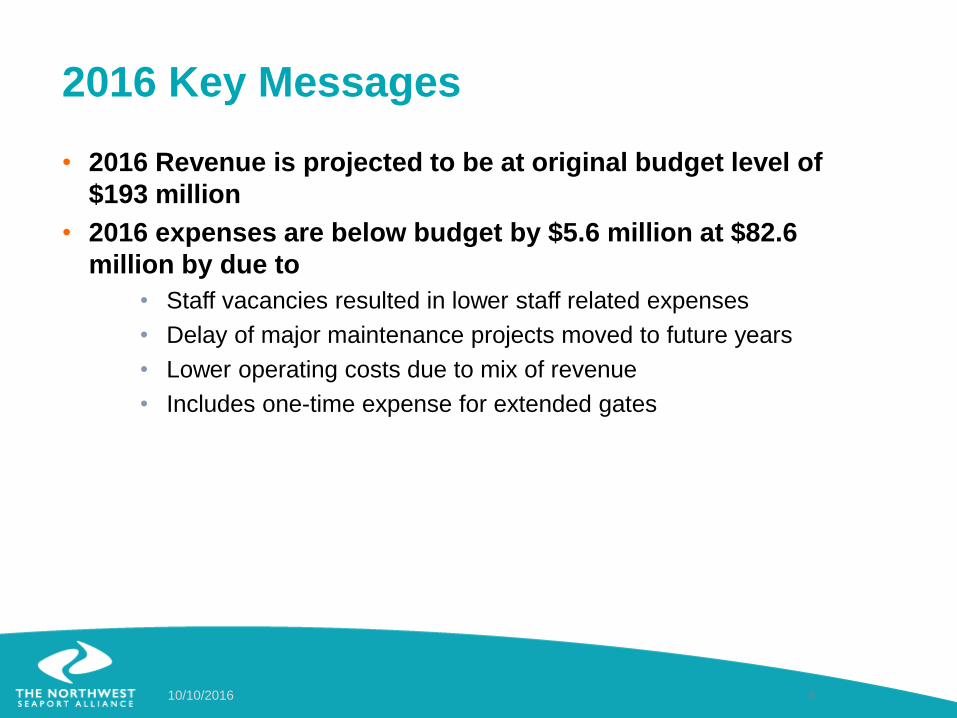
2016 Key Messages
• 2016 Revenue is projected to be at original budget level of
$193 million
• 2016 expenses are below budget by $5.6 million at $82.6
million by due to
• Staff vacancies resulted in lower staff related expenses
• Delay of major maintenance projects moved to future years
• Lower operating costs due to mix of revenue
• Includes one-time expense for extended gates
10/10/2016 4

2016 Forecasted Operating Results
10/10/2016 5
2016 2016
$ Million Budget Forecast
Revenue 192.9$ 193.0$
Expenses
Operations 44.0$ 40.9$
Maintenance 17.9 14.3
Administration 19.7 18.9
Security 4.4 4.3
Air & Water Environmental 2.7 4.1
Total Operating Expenses 88.7$ 82.6$
Income from Operations 104.2$ 110.4$
Depreciation 0.6 0.8
Operating Income 103.7$ 109.6$
Non Operating (0.1)$ 0.7$
Net Income 103.6$ 110.3$
Revenue – on Target in total with small changes of revenue by business
Expenses
Operations – Delay of crane removal and other 1 time projects, staffing vacancies
Maintenance – lower paving expenses, delayed movement of temporary shelters fromT7 to EB1
Administration – Lower staff costs due to vacancies, lower outside services
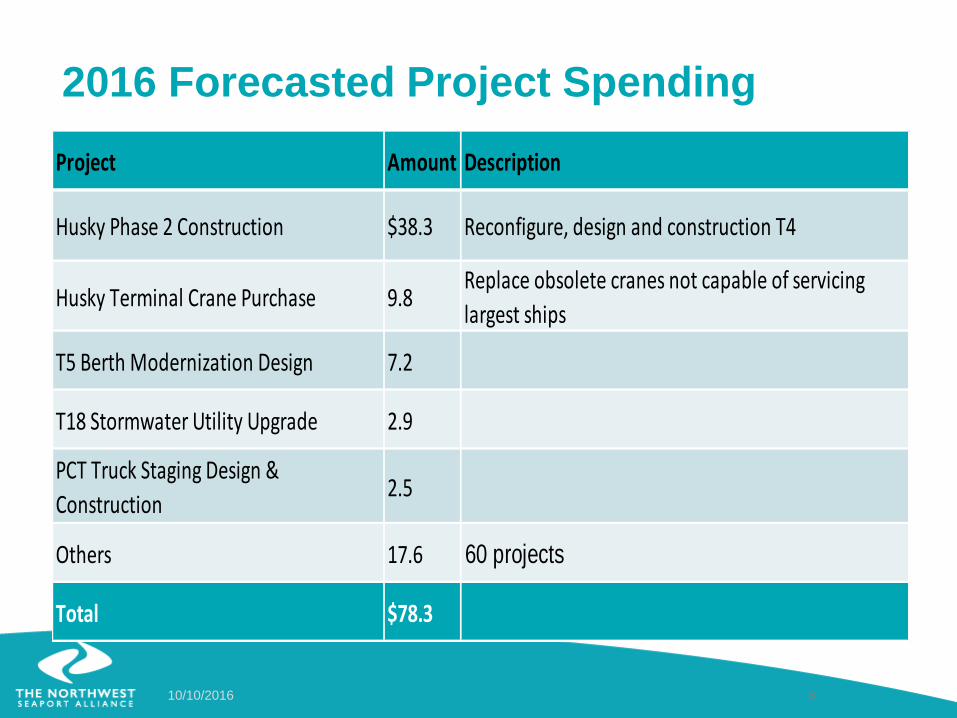
2016 Forecasted Project Spending
10/10/2016 6
Project Amount Description
Husky Phase 2 Construction $38.3 Reconfigure, design and construction T4
Husky Terminal Crane Purchase 9.8Replace obsolete cranes not capable of servicing
largest ships
T5 Berth Modernization Design 7.2
T18 Stormwater Utility Upgrade 2.9
PCT Truck Staging Design &
Construction2.5
Others 17.6 60 projects
Total $78.3

2017 Key Messages
• 2017 Budget is approximately the same as our projection for
2017 one year ago.
• The 2017 budget represents the progression and maturation of
the alliance.
• Fixed revenue based on current leases
• Variable revenue based on conservative volume forecasts
• Additional revenue and major capital reinvestment for North Harbor
T5 has been excluded from this initial budget. (This remains a top
strategic initiative for the NWSA)
• Allocated general and administrative costs are based on support
services agreements developed by both homeports.
• Operating income exceeds minimum revenue required as
calculated by the charter
10/10/2016 7

Five Year Planned CIP
• Capitalized:
• Assets that depreciate over time
• Operating expense
• Included in the operating budget
10/10/2016 8
($ millions)
2016 Forecast 2017 2018 2019 2020 2021 2017 - 2021 Totals
Capitalized $71.1 $87.8 $69.0 $31.1 $23.6 $6.9 $218.4
Operating Expense 7.2 17.8 16.4 6.3 6.0 5.5 52.0
Grand Total $78.3 $105.7 $85.4 $37.4 $29.6 $12.4 $270.4

2017 -2021 Container Terminal Projects
10/10/2016 9
($ millions)
Project Amount Description
T46 Dock Rehabilitation $49.8 Dock rehabilitation and terminal redevelopment,
paving. Partially TIGER grant funded
Husky Terminal Crane Purchase 39.8Replace obsolete cranes not capable of servicing
largest ships
Husky Phase 2 Construction 78.8 Reconfigure, design and construction T4
North Harbor Crane removal / Surplus 10.0
T18 Stormwater Utility Upgrade 12.1
T5 design & electrical transformer 7.9
Others 10.1 28 other projects
Total $208.5
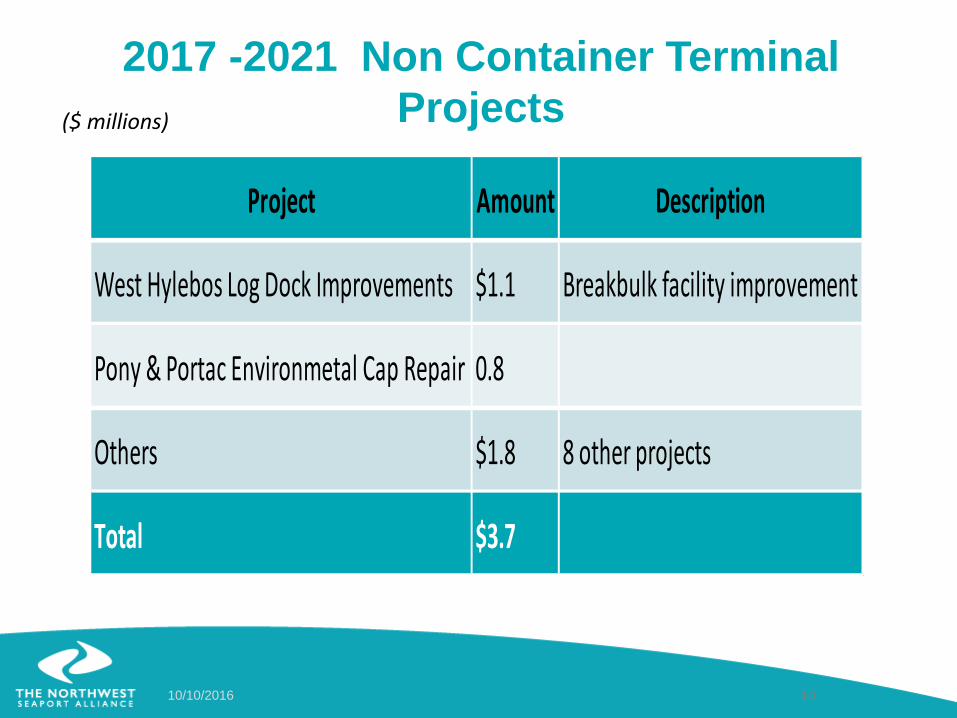
2017 -2021 Non Container Terminal
Projects
10/10/2016 10
($ millions)
Project Amount Description
West Hylebos Log Dock Improvements $1.1 Breakbulk facility improvement
Pony & Portac Environmetal Cap Repair 0.8
Others $1.8 8 other projects
Total $3.7
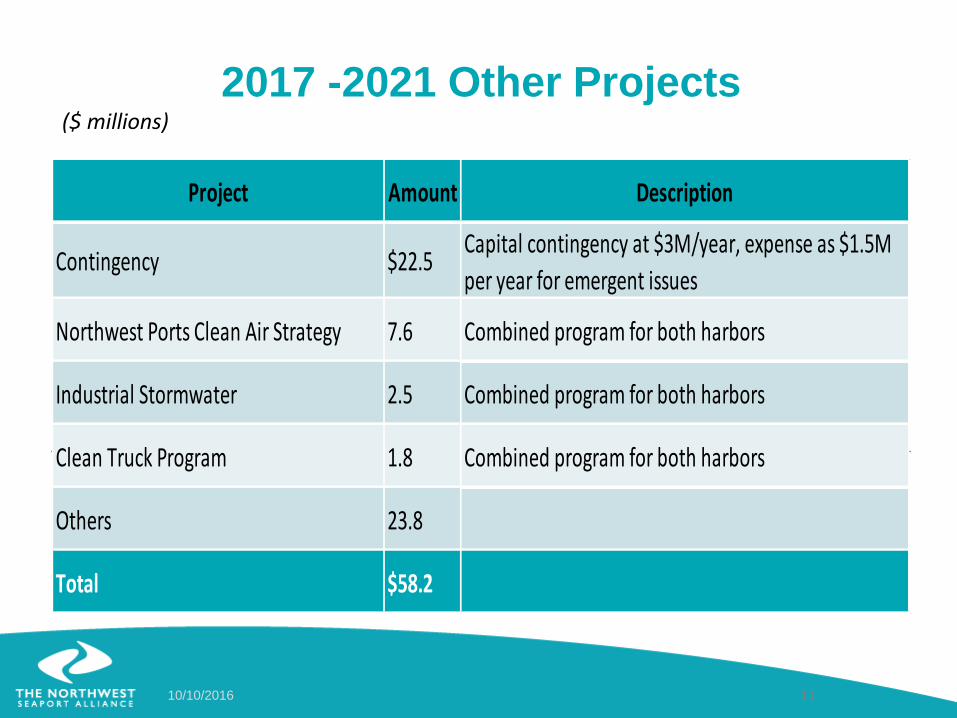
2017 -2021 Other Projects
10/10/2016 11
Total $32.8
($ millions)
Project Amount Description
Contingency $22.5 Capital contingency at $3M/year, expense as $1.5M
per year for emergent issues
Northwest Ports Clean Air Strategy 7.6 Combined program for both harbors
Industrial Stormwater 2.5 Combined program for both harbors
Clean Truck Program 1.8 Combined program for both harbors
Others 23.8
Total $58.2
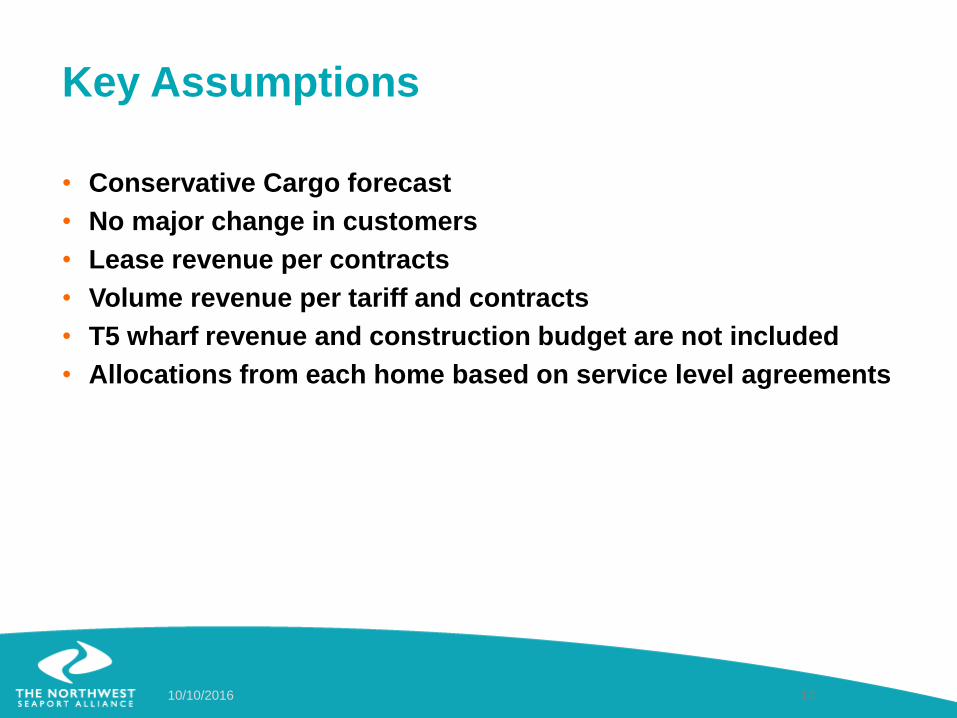
Key Assumptions
• Conservative Cargo forecast
• No major change in customers
• Lease revenue per contracts
• Volume revenue per tariff and contracts
• T5 wharf revenue and construction budget are not included
• Allocations from each home based on service level agreements
10/10/2016 12

2017 Preliminary Operating Budget
10/10/2016 13
2016 2017
$ Million Forecast Budget
Revenue 193.0$ 189.4$
Expenses
Operations 40.9$ 45.7$
Maintenance 14.3 17.7
Administration 18.9 23.2
Security 4.3 4.4
Air & Water Environmental 4.1 3.3
Total Operating Expenses 82.6$ 94.3$
Income from Operations 110.4$ 95.1$
Depreciation 0.8 2.5
Operating Income 109.6$ 92.6$
Non Operating 0.7$ 0.9$
Net Income 110.3$ 93.4$
Return on Revenue 57.1% 49.3%

2017 Preliminary Revenue
10/10/2016 14
• Leases, dockage and wharfage account for ~66% of revenue
• Intermodal revenue from the four Port of Tacoma IY Yards
• Including the lift fee in the South Harbor’s North Intermodal Yard (NIM)
• Equipment includes South Harbor cranes and yard equipment.
• Services revenue from tariff and vessel service agreements for
breakbulk and autos
2016 2017
$ Million Forecast Budget
Lease and Dockage/Wharfage 130.7$ 125.9$
Intermodal 35.3 34.7
Equipment 17.4 18.6
Services 9.7 10.2
Total Revenue 193.0$ 189.4$

2017 Preliminary Operations Expense
10/10/2016 15
• Long shore expenses related to NIM operations and break bulk
line of business
• Outsourced Services Includes:
• Ongoing Pacific Rail Services in the South Harbor’s South
Intermodal Yard
• One-time crane removal in North Harbor
• NWSA staff includes the commercial and operating staff
2016 2017
$ Milllion Forecast Budget
Long Shore 12.5$ 12.9$
Outsourced Services 8.3 12.5
Utilities, Rent and Taxes 5.5 5.6
Commerical & Ops. Staff 5.5 6.9
Allocations and Direct Charges 4.1 4.7
Insurance 1.2 1.1
Fuel 0.8 1.0
Other 3.0 1.0
Total Operations Expense 40.9$ 45.7$

2017 Preliminary Maintenance Expense
10/10/2016 16
• Maintenance includes Port staff as well as outsourced
maintenance
• Outsourced Maintenance includes major paving, roof repair, and
fender repair
• Equipment maintenance mainly Port staff for cranes and
straddle carriers
• Includes fork lifts and other Break Bulk equipment as well
2016 2017
$ Million Forecast Budget
Facilities Maintenance 7.1$ 10.8$
Equipment Maintenance 7.2 6.9
Engr. & Maint. Allocations 0.0 0.0
Other 0.0 0.0
Total Maintenance Expense 14.3$ 17.6$

2017 Preliminary Administration Expense
10/10/2016 17
• Allocations from both Ports
• Includes Finance & Accounting, IT, Commissioners, Government
Affairs, etc.
• Staffing costs in Administration include the NWSA leadership
team
• Outside services includes legal and professional planning
services
2016 2017
$ Million Forecast Budget
General & Administrative Allocations 14.7$ 16.8$
Administrative Staffing 3.6 4.0
Outside Services 0.6 2.5
Total Administrative Expense 18.9$ 23.2$

2016 Preliminary Security Expense
10/10/2016 18
• Primarily the South Harbor security staff
• GCP Main gate
• Roving patrol
• Direct charge for auto’s, breakbulk, and log operations in South
Harbor
2016 2017
$ Million Forecast Budget
Home Port Security Allocations 3.7$ 3.7$
Direct Charge 0.6 0.7
Total Security Expense 4.3$ 4.4$
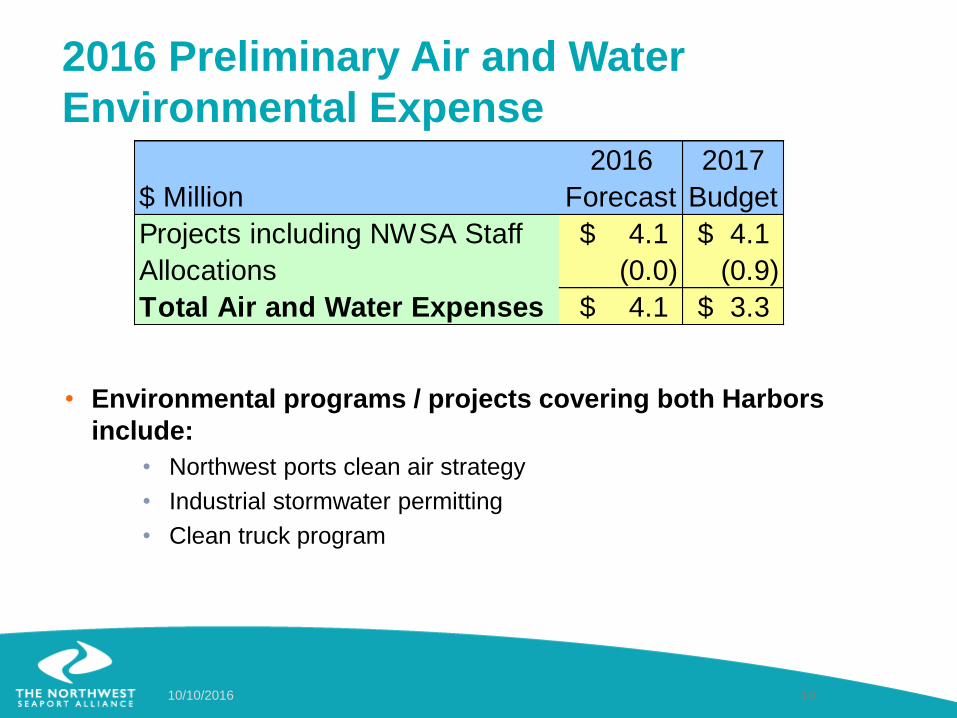
2016 Preliminary Air and Water
Environmental Expense
10/10/2016 19
• Environmental programs / projects covering both Harbors
include:
• Northwest ports clean air strategy
• Industrial stormwater permitting
• Clean truck program
2016 2017
$ Million Forecast Budget
Projects including NWSA Staff 4.1$ 4.1$
Allocations (0.0) (0.9)
Total Air and Water Expenses 4.1$ 3.3$

2017 Preliminary Depreciation Expense
10/10/2016 20
• NWSA Capital purchases including
• South Harbor
• PCT Truck staging area & Security enhancements
• SIM pavement replacement
• T7 warehouse replacement
• Crane upgrades
• North Harbor
• T18 stormwater improvements & rail spur
• T46 fender systems modifications
• New alliance projects will be capitalized and depreciated on the
books of the alliance
2016 2017
$ Million Forecast Budget
Total NWSA Depreciation 0.8$ 2.5$

NWSA Service Level Agreements
• For 2017, both home ports will continue to provide some level
of services to the NWSA
• Service level agreements are reviewed annually during the
budget process and are in effect for one year.
• The NWSA Master Policy delegates approval of service level
agreements to the NWSA CEO
10/10/2016 21

Bond Income Calculation
• Minimum level of net income required for homeports to meet
current bond rate covenants
• Takes into account home port income from other sources
• Based on the home port with the higher required minimum income
• Adjusted for lien coverage requirements (senior = 1.35,
subordinate = 1)
• Section 4.2(b) requires annual review of the bond income
calculation
• Required bond income as defined in the charter is $90 million in
total for NWSA
10/10/2016 22
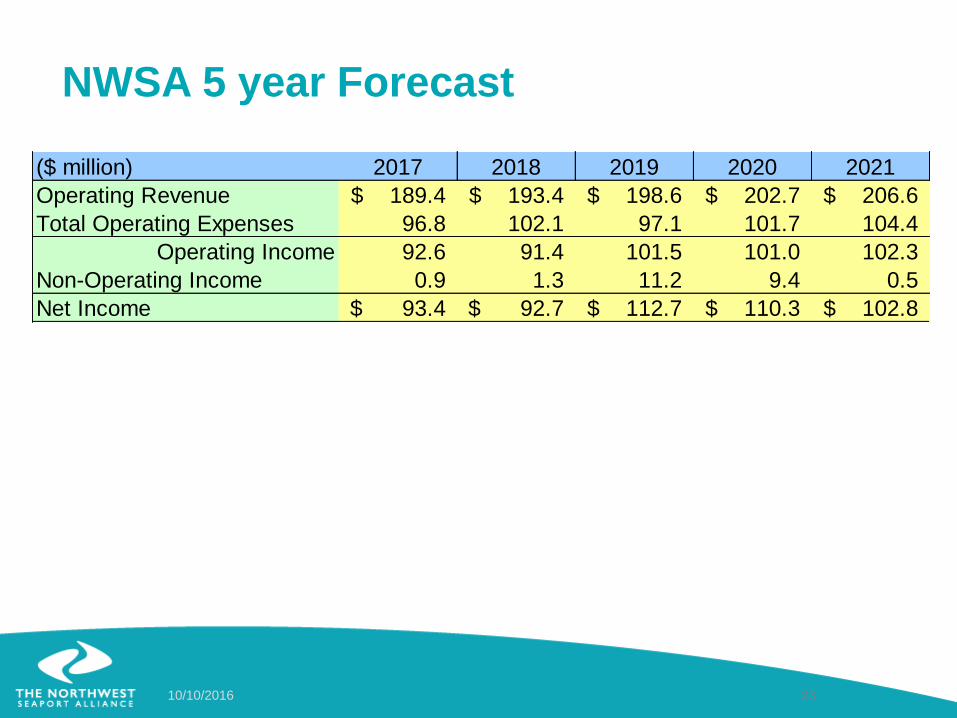
NWSA 5 year Forecast
10/10/2016 23
($ million) 2017 2018 2019 2020 2021
Operating Revenue 189.4$ 193.4$ 198.6$ 202.7$ 206.6$
Total Operating Expenses 96.8 102.1 97.1 101.7 104.4
Operating Income 92.6 91.4 101.5 101.0 102.3
Non-Operating Income 0.9 1.3 11.2 9.4 0.5
Net Income 93.4$ 92.7$ 112.7$ 110.3$ 102.8$

2016 Key Messages
• 2016 Revenue is projected to be at original budget level of
$193 million
• 2016 expenses are below budget by $5.6 million at $82.6
million by due to
• Staff vacancies resulted in lower staff related expenses
• Delay of major maintenance projects moved to future years
• Lower operating costs due to mix of revenue
• Includes one-time expense for extended gates
10/10/2016 24
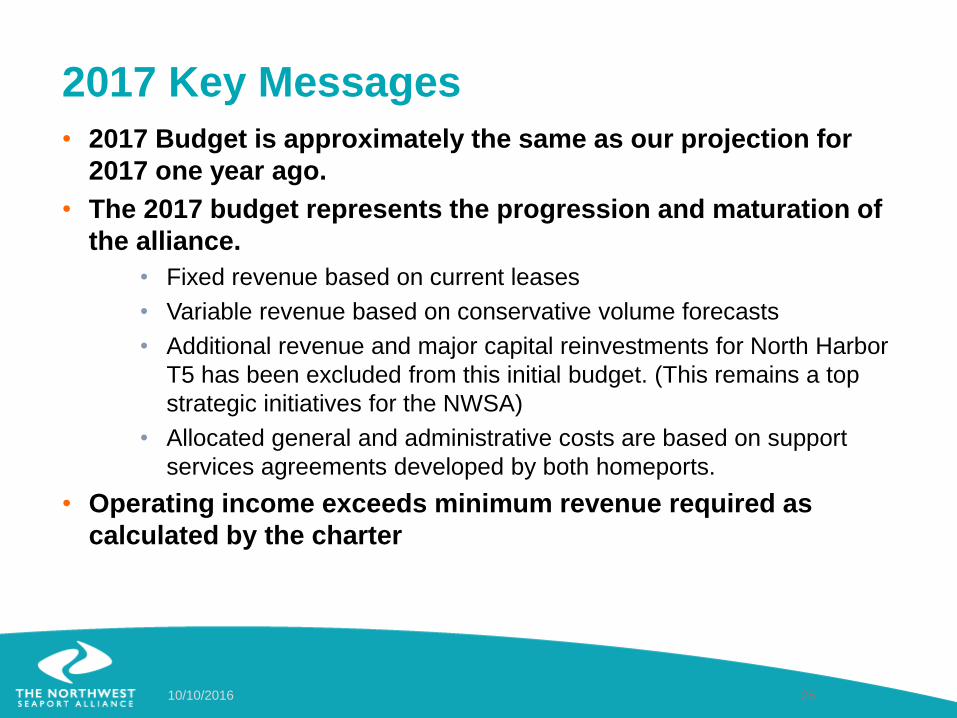
2017 Key Messages
• 2017 Budget is approximately the same as our projection for
2017 one year ago.
• The 2017 budget represents the progression and maturation of
the alliance.
• Fixed revenue based on current leases
• Variable revenue based on conservative volume forecasts
• Additional revenue and major capital reinvestments for North Harbor
T5 has been excluded from this initial budget. (This remains a top
strategic initiatives for the NWSA)
• Allocated general and administrative costs are based on support
services agreements developed by both homeports.
• Operating income exceeds minimum revenue required as
calculated by the charter
10/10/2016 25