2017 audit fee survey reporthpmgroup.co/.../2018/03/fei-audit-fee-2017-report-final.pdf ·...
TRANSCRIPT

2017 AUDIT FEE SURVEY REPORT SPONSORED BY

FIN
AN
CIA
L EX
ECU
TIV
ES R
ESEA
RC
H F
OU
ND
ATI
ON
2017
AU
DIT
FEE
SU
RV
EY
1
2017 AUDIT FEE SURVEY REPORT
CONTENTS
Executive Summary . . . . . . . . . . . . . . . . . . . . . . . . . . . . . . . . . . . . . . . . . . . . . . . . . . . . . . . . . . . . . . . . . . . . . . . . . . . . 2
Section 1: The Audit Fee Marketplace . . . . . . . . . . . . . . . . . . . . . . . . . . . . . . . . . . . . . . . . . . . . . . . . . . . . . . . . . . . . . . 3
Section 2: Reasons for Increases . . . . . . . . . . . . . . . . . . . . . . . . . . . . . . . . . . . . . . . . . . . . . . . . . . . . . . . . . . . . . . . . . . 8
Section 3: Mitigation Strategies . . . . . . . . . . . . . . . . . . . . . . . . . . . . . . . . . . . . . . . . . . . . . . . . . . . . . . . . . . . . . . . . . . 21
Section 4: Respondent Demographics . . . . . . . . . . . . . . . . . . . . . . . . . . . . . . . . . . . . . . . . . . . . . . . . . . . . . . . . . . . . 29
Appendix . . . . . . . . . . . . . . . . . . . . . . . . . . . . . . . . . . . . . . . . . . . . . . . . . . . . . . . . . . . . . . . . . . . . . . . . . . . . . . . . . . . . 32
Interviewees . . . . . . . . . . . . . . . . . . . . . . . . . . . . . . . . . . . . . . . . . . . . . . . . . . . . . . . . . . . . . . . . . . . . . . . . . . . . . . . . . 34
About the Author . . . . . . . . . . . . . . . . . . . . . . . . . . . . . . . . . . . . . . . . . . . . . . . . . . . . . . . . . . . . . . . . . . . . . . . . . . . . . 34
About FERF . . . . . . . . . . . . . . . . . . . . . . . . . . . . . . . . . . . . . . . . . . . . . . . . . . . . . . . . . . . . . . . . . . . . . . . . . . . . . . . . . . . 35
About Workiva . . . . . . . . . . . . . . . . . . . . . . . . . . . . . . . . . . . . . . . . . . . . . . . . . . . . . . . . . . . . . . . . . . . . . . . . . . . . . . . . 35
About MyLogIQ . . . . . . . . . . . . . . . . . . . . . . . . . . . . . . . . . . . . . . . . . . . . . . . . . . . . . . . . . . . . . . . . . . . . . . . . . . . . . . . 35

FIN
AN
CIA
L EX
ECU
TIV
ES R
ESEA
RC
H F
OU
ND
ATI
ON
2017
AU
DIT
FEE
SU
RV
EY
2
2017 AUDIT FEE SURVEY REPORT
EXECUTIVE SUMMARYThe 2017 Audit Fee Survey Report shows the rise in public company and non-profit audit fees is slowing, despite upward pressures. According to an analysis of SEC filings by MyLogIQ, public companies incurred a median audit fee increase of 2.6 percent in 2016, down from 3.5 percent for 2015 audits.
Public companies reported continuing pressures on their audit fees. In addition to increased audit rates, nearly half cited increased audit requirements for documentation and additional testing of internal controls, as well as preparations to implement the new revenue recognition standard.
Despite these pressures, public companies and non-profit entities were able to mitigate their fees by:
• Focusing on key audit areas
• Increasing collaboration with auditors
• Automating internal controls processes
These improvements allowed auditors to review transactions during the course of the year and companies to negotiate rate increases that were fair to both parties given the work involved. As one respondent noted, “It’s not just putting it on the auditors to find opportunities to create efficiencies in their audit,” companies need to take responsibility as well.
Private companies, on the other hand, reported a median increase of 3.7 percent, compared with 2.9 percent last year. Most attributed the increase to inflation, followed by acquisitions and staff turnover. Many private companies reported audit fee mitigation strategies that were similar to public companies, especially preparation and focus on key audit areas.
Looking at reported hourly rates, survey respondents reported a median rate of $216 and an average rate of $225. This compares with $193 and $268, respectively, in last year’s findings.
As final implementation of the new revenue recognition standard and new lease accounting standards are implemented in the coming year, we look forward to continuing the survey to explore how companies benefit from audit fee mitigation strategies.

FIN
AN
CIA
L EX
ECU
TIV
ES R
ESEA
RC
H F
OU
ND
ATI
ON
2017
AU
DIT
FEE
SU
RV
EY
3
2017 AUDIT FEE SURVEY REPORT
SECTION 1: THE AUDIT FEE MARKETPLACE
PUBLIC COMPANIES – SEC FILINGS
Public2016
n=6,3942015
n=6,8462014
n=7,232
Median Fee $523,694 $459,165 $400,708
Median Pct Change 2.6% 3.5% 3.7%
Average Fee $1,843,408 $1,715,044 $1,584,811
Average Pct Change 21.5% 35% 41%
PUBLIC COMPANIES – FERF SURVEY
Public2016
n=1612015* n=89
2014** n=76
Median Fee $2,803,507 $2,410,000 $2,189,000
Median Pct Change 1.3% 1.6% 3.1%
Average Fee $7,446,739 $6,455,626 $8,150,941
Average Pct Change 6.9% 4.5% 10.7%
*2015 fees and percentage changes from FERF’s 2016 Annual Audit Fee Survey Report **2014 fees and percentage changes from FERF’s 2015 Annual Audit Fee Survey Report
“n=” refers to sample size or the number of respondents to a specific question
MEDIAN INCREASES BY FILING STATUS (SEC DATA)
2016 2015 2014
Large Accelerated Filers 3.4% 4.2 4.96
Accelerated Filers 2.5% 3.97 6.31
Non-Accelerated Filers 2.4% 4.3 3.6
Smaller Reporting Companies 2.4% 2.7 2.1

FIN
AN
CIA
L EX
ECU
TIV
ES R
ESEA
RC
H F
OU
ND
ATI
ON
2017
AU
DIT
FEE
SU
RV
EY
4
2017 AUDIT FEE SURVEY REPORT
2015-16 AUDIT FEE PERCENT CHANGE DISTRIBUTION
2,500
2,000
1,500
1,000
500
0
-100
to -9
0%
-90
to -8
0%
-80
to -7
0%
-70
to -6
0%
-60
to -5
0%
-50
to -4
0%
-40
to -3
0%
-30
to -2
0%
-20
to -1
0%
-10
to 0
%
0 to
10%
10 to
20%
20 to
30%
30 to
40%
40 to
50%
50 to
60%
60 to
70%
70 to
80%
80 to
90%
90 to
100
%
>100
%
Among SEC filings, 2,120 registrants reported audit fee increases, with the largest group (1,978) of companies experiencing increases between 0 and 10 percent. In contrast, 2,296 registrants reported audit fee decreases, with 1,978 reporting decreases between 0 and 10 percent.
Overall, 33 percent of the 6,394 reviewed companies experienced increases in audit fees and 36 percent reported audit fee decreases.
INCREASES BY FILING STATUS (2016 SURVEY)
All PublicLarge
Accelerated Accelerated Non-Accelerated
Accelerated, Large Accelerated
& Non-Accelerated Foreign Issuers
Median Fee $2,803,507 $5,797,000 $694,700 $215,000 $5,000,000
Median Pct Change 1.3% 1.8% 0.2% 3.0% 0.0%
Average Fee $7,446,739 $10,021,524 $1,594,728 $365,717 $6,380,300
Average Pct Change 6.9% 4.2% 6.8% 29.6% -0.4%
MEDIAN AND AVERAGE HOURLY RATE (SURVEY)
All Public2016 n=52
2015 n=38
2014 n=34
Median Hours 12,246 13,200 6,720
Median Rate $216 $193 $210
Average Hours 32,508 22,539 25,310
Average Rate $225 $268 $225
Respondents with Fixed Fee Contracts 8 7 2
(Among public company respondents that reported hours-billed data)

FIN
AN
CIA
L EX
ECU
TIV
ES R
ESEA
RC
H F
OU
ND
ATI
ON
2017
AU
DIT
FEE
SU
RV
EY
5
2017 AUDIT FEE SURVEY REPORT
MEDIAN INCREASES BY SELECTED INDUSTRIES (SEC FILINGS)
Industry 2016 2015 2014
Manufacturing 2.2% 3.4% 4.1%
Finance, Insurance and Real Estate 2.9 3.8 3.6
Services 4.1 4.5 5.0
Mining 0.0 0.1 1.9
Transportation, Communication, Electric, Gas and Sanitary Services 2.5 4.2 2.0
Retail Trade 4.0 5.6 5.2
Wholesale Trade 3.2 4.9 4.7
Other Industry 1.0 2.3 2.0
Construction 1.5 1.0 2.6
Agriculture, Forestry and Fishing 3.5 2.1 4.9
Public Administration 0.0 1.5 0.0
PRIMARY AUDIT FIRM
Among SEC filers, 52 percent of the 6,394 registrants reviewed cited one of the Big Four firms as their primary external auditor:
Firm 2016 2015 2014
Ernst & Young 990 1,072 1104
PwC 804 810 846
Deloitte 779 806 817
KPMG 752 792 813
Grant Thornton 242 274 292
BDO 325 327 327
RSM 2 9 29
Crowe Horwath 90 99 98
MaloneBailey 150 163 166
Marcum 101 106 97
Others 2,159 2,388 2,643

FIN
AN
CIA
L EX
ECU
TIV
ES R
ESEA
RC
H F
OU
ND
ATI
ON
2017
AU
DIT
FEE
SU
RV
EY
6
2017 AUDIT FEE SURVEY REPORT
DISCLOSURE OF INEFFECTIVE INTERNAL CONTROLS
2016 2015 2014
Effective 5,171 80.9% 5,411 79% 5,677 78.5%
Ineffective 1,223 19.1% 1,435 21% 1,555 21.5%
MEDIAN INCREASE BY CONTROLS EFFECTIVENESS
2016 2015 2014
Effective 2.3% 3.3% 4.1%
Ineffective 7.5% 7% 5%
Among the 6,394 SEC filings reviewed for the 2016 audit season, nearly 81 percent reported effective internal controls over financial reporting (ICFR). Companies within this group reported a median audit fee increase of 2.3 percent.
In contrast, the 19 percent of registrants who reported ineffective ICFR experienced a median audit fee increase of 7.5 percent. This is not to suggest ineffective ICFR is a direct cause of increased audit fees, but there is a consistent correlation between the two metrics.
PRIVATE COMPANIES - SURVEY
Private2016
n=2812015
n=1262014 n=92
Median Fee $70,000 $102,059 $70,000
Median Pct Change 3.7% 2.9% 2.0%
Average Fee $163,993 $258,935 $254,740
Average Pct Change 3.8% 6.1% 2.7%

FIN
AN
CIA
L EX
ECU
TIV
ES R
ESEA
RC
H F
OU
ND
ATI
ON
2017
AU
DIT
FEE
SU
RV
EY
7
2017 AUDIT FEE SURVEY REPORT
MEDIAN AND AVERAGE HOURLY RATE
Private2016
n=462015 n=39
2014 n=30
Median Hours 510 1,060 850
Median Rate $158 $195 $200
Average Hours 1,754 1,898 2,800
Average Rate $180 $184 $159
Respondents with Fixed Fee Contracts 40 15 12
NON-PROFITS - SURVEY
Non-Profit2016 n=56
2015 n=30
2014 n=57
Median Fee $52,388 $84,625 $36,440
Median Pct Change 1.6 2.3 —-
Average Fee $181,403 $159,844 $107,208
Average Pct Change -2.3% 6.2% 1.3%
MEDIAN AND AVERAGE HOURLY RATE
Non-Profit2016 n=21
2015 n=7
2014 n=6
Median Hours 525 1,400 400
Median Rate $150 $173 $119
Average Hours 3,013 1,935 585
Average Rate $157 $197 $179
Fixed Fee 10 5 4

FIN
AN
CIA
L EX
ECU
TIV
ES R
ESEA
RC
H F
OU
ND
ATI
ON
2017
AU
DIT
FEE
SU
RV
EY
8
2017 AUDIT FEE SURVEY REPORT
SECTION 2: REASONS FOR INCREASESQ: Please indicate the primary factors that contributed to an increase in your audit fees.
PUBLIC COMPANIES, SURVEY DATA
All Public n=80
Large Accelerated
n=55Accelerated
n=14
Non-Accelerated
n=10
Accelerated, Large Accelerated
& Non-Accelerated Foreign Issuers
n=1
Acquisition 71% 85% 43% 40%
New FASB standards 60 64 86 10
Focus on revenue recognition 38 44 43
Inflation 34 36 36 20
Changes to internal controls 30 33 43
Review of manual controls resulting from PCAOB inspections
25 31 14 10
Divestiture 24 33 7
New SEC reporting requirements 18 15 36 10
Turnover of key audit firm team members and/or mandatory partner rotation
18 13 43 10
Review of prior year work-papers resulting from PCAOB inspections
15 18 14
New COSO Framework 14 18 7
PCAOB evidence requests 11 15 7
Turnover in staff 8 9 10
Foreign currency adjustments 5 7
SEC comment letters 3 4
Increased scope 1 2
Restructuring/systems changes 1 100
(Multiple responses allowed)

FIN
AN
CIA
L EX
ECU
TIV
ES R
ESEA
RC
H F
OU
ND
ATI
ON
2017
AU
DIT
FEE
SU
RV
EY
9
2017 AUDIT FEE SURVEY REPORT
FACTORS DRIVING INCREASES - TRANSACTION GROWTH
Mergers and acquisitions remained a notable driver of costs for 2016 audits as M&A markets remained robust. Global M&A volume of $3.9 trillion, according to Dealogic, marked a decline from the $4.7 trillion reported in 2015 but remained above the $3.6 trillion in 2014 and the $2.8 trillion reported in 2013.
This increased deal volume contributed to higher audit fees for nearly three-fourths of the 80 public companies that reported fee increases for their 2016 audits. For instance, one chief accounting officer (CAO) at a healthcare provider cited acquisition-related valuation
services and purchase accounting reviews as major factors for higher audit fees.
“There was quite a bit of work that was done to test the valuation firm’s assumptions,” the executive says. “It became a point of stress when [the audit firm] presented the fees for the work they did, because the fees for the audit of the work approximated we paid for the valuation work they were reviewing.”
In response, the company has started testing valuation work in-house and is working to collaborate more closely with its audit firm on valuation-related reviews.
PCAOB DOCUMENTATION
As in recent surveys, the Public Company Accounting Oversight Board (PCAOB) was cited by numerous respondents as a factor in increased audit fees, particularly for more comprehensive documentation requests.
“We hear stories from our auditor and externally about the PCAOB requiring audits to the level that no one thinks is really reasonable if you’re just looking for material misstatements,” says a financial reporting executive at a life sciences company. “No auditor wants
to be listed for an audit deficiency, so they start auditing like crazy. We’ve seen issues where we were doing a lot of eye-rolling about the level of evidence the auditors wanted about issues that were clearly immaterial, but they were acting like they were important.”
“The ‘reasonable man’ theory has been blown away. They will go down a rabbit hole of saying ‘fix it,’ and their documentation requirements are tremendous from where they used to be.”
Another preparer says his auditor’s documentation requests seem redundant and, at times, excessive.
“We’ve always had good processes in place and great documentation because I used to be an auditor, and trust me, I’m a dream client,” the executive says. “We want to do the right thing for the company, and as a CPA, I understand the importance of documentation. But then they come and demand more.”
The life sciences executive says PCAOB standards or proposals may result in the auditor duplicating tests the company’s staff is performing.
“There are some issues where we don’t see a proposal adding value, but we do see they’re going to result in higher audit fees. If you look at related party transactions, for instance, we have the appropriate controls but we also have to collect an awful lot of information for our auditors to review. Then there’s nothing for them to disclose because we’re managing the risk correctly.”
The healthcare CAO says his company’s audit was affected when the PCAOB selected a competitor’s audit as part of its inspection process.
As in recent surveys, the Public Company Accounting Oversight Board (PCAOB) was cited by numerous respondents as a factor in increased audit fees, particularly for more comprehensive documentation requests.

FIN
AN
CIA
L EX
ECU
TIV
ES R
ESEA
RC
H F
OU
ND
ATI
ON
2017
AU
DIT
FEE
SU
RV
EY
10
2017 AUDIT FEE SURVEY REPORT
“We know from direct interaction with our [audit firm] staff that issues and items that came up through [the competitor’s] inspection were evaluated by our audit team, and the level of intensity of work in certain areas increased as they worked to answer whether some of the issues identified in the PCAOB review could relate to our audit.”
“We also know from talking to our audit team that they’re constantly evaluating whether they believe we’re going to be selected as one of the clients that gets a PCAOB review. It appears that this fear of PCAOB review affects the level of documentation requests and what they’re doing… our auditors are being pushed that they need to do certain work in certain areas, or how they document certain areas, because of prior PCAOB reviews.”
For their part, auditors say they’re reacting to PCAOB Staff Audit Practice Alerts, which the board issues to highlight “Emerging or otherwise noteworthy circumstances that may affect how auditors conduct audits…” For instance, recent alerts highlight the new revenue recognition standard, improper alterations of audit documentation, going concern considerations, and other topics.
“As auditors, we need to be cognizant of practice alerts, and those will be built into the dialogue we have
with our clients,” says Steve Stensrud, lead partner for the manufacturing and distribution practice of Baker Tilly Virchow Krause, LLP. “We’ve developed internal checklists to make sure we’ve followed staff alerts. There are hot topics that will drive changes to our audit approach, and those are usually add-ons to our current audit methodology. Those can tend to drive up costs from that perspective.”
Jason Lawson, a partner with Moss Adams, says the PCAOB and SEC have added a number of new requirements for external auditors, for example, as part of the recently approved AS 3101, such enhanced disclosures related to auditor tenure, independence, and the communication of critical audit matters.
“There are increasingly more opportunities for questioning the lead auditor’s judgment,” Lawson says. “As audit firms and audit professionals embrace to the soon-to-be adopted regulations, auditors will feel the increasing second-guessing pressure from the PCAOB, even as they follow their firms’ quality control guidelines. The dynamics of increasing regulatory oversight is nothing new to experienced auditors. Likewise, the dynamics of significant new regulations on auditors having a domino impact on registrants is also a well-treaded path that companies should anticipate.”

FIN
AN
CIA
L EX
ECU
TIV
ES R
ESEA
RC
H F
OU
ND
ATI
ON
2017
AU
DIT
FEE
SU
RV
EY
11
2017 AUDIT FEE SURVEY REPORT
PCAOB-RELATED SURVEY RESPONSES
Q: If your audit firm was subjected to PCAOB oversight review, were the comments shared with you?
n=132
Yes 49%
No 17
N/A 34
Q: Has your auditor requested that you make changes to your controls as a result of PCAOB requirements or inspection feedback?
n=132
Yes 40%
No 39
N/A 21
Q: Has your auditor requested that you make changes to your controls documentation as a result of PCAOB requirements or inspection feedback?
n=132
Yes 52%
No 26
N/A 22
NEW ACCOUNTING STANDARDS
Financial statement preparers are operating in a dynamic regulatory environment, with new standards related to revenue recognition, leases, credit losses, hedging and goodwill impairment being implemented in rapid succession or simultaneously.
Not surprisingly, public companies report they are engaged in substantial efforts to adopt new standards:
Q: How much effort are you putting toward the implementation of new accounting standards?
n=132
Substantial effort 71%
Some effort 27
Not much activity 2
Slightly more than half of public companies have engaged their external auditors for assistance with their implementation efforts:
Q: Are you engaging your external audit firm for these efforts?
n=125
Yes 54%
No 39
Hiring different external auditor
6
Nearly twice as many public company respondents expect revenue recognition implementation to result in higher audit fees:
Q: If implementing the new revenue recognition standard, do you anticipate an increase in audit-related fees?
n=128
Yes 68%
No 32
PERCENTAGES MAY NOT EQUAL 100 DUE TO ROUNDING

FIN
AN
CIA
L EX
ECU
TIV
ES R
ESEA
RC
H F
OU
ND
ATI
ON
2017
AU
DIT
FEE
SU
RV
EY
12
2017 AUDIT FEE SURVEY REPORT
“Revenue recognition is going to have a prominent effect on fees, whether the spend is on internal, consulting, or from external auditors,” says Lawson. “Companies in different industries may say it’s nominal, and in others there will be a material impact. If I’m looking at it from the controller’s seat at a registrant, in comparison to the prior fiscal year, I’m probably spending or allocating more of my finance team’s attention on Topic 606 for consulting services and internal spend to implement 606. The percentage increase in fees from the external auditor may not be comparable to the spending on consultants and internal resources.”
The new revenue recognition standard is also expected to play a significant role in upcoming PCAOB inspections.
“The PCAOB has given notice to the external audit firms that, as they perform inspections in the near future, they will be looking at how auditors have addressed whether registrants have adopted Topic 606 appropriately,” Lawson says. “They’ll also be verifying whether the company’s disclosures are materially correct. While the initial objective voice that registrants hear may be first from the auditors, consistent with any significant change in standards, the more wide-scale concerns and feedback will be from the regulators.”
For some companies, a need to improve contracts with customers to comply with the new standard’s requirements may generate short-term costs that ultimately result in long-term audit fee savings as contracts become more standardized.
REVENUE RECOGNITION
With an implementation date of January 1, 2018, for public companies, the new revenue recognition standard (Accounting Standards Codification (ASC) 606, Revenue from Contracts with Customers) has had a limited effect on audit fees so far, according to survey respondents.
“There’s been a significant adoption effort by companies,” says Baker Tilly’s Stensrud. “They’ve probably incurred some incremental audit fees related to that. If they don’t have resources internally, they’ve seen a need to hire consultants that can help them through that process.”
“There’s a concern that there are companies that are behind schedule on the adoption of 606, so that could cause some concern among their auditors,” says Chris Jeffrey, a Baker Tilly partner. “When there’s concern from external auditors, that could mean more work – which then means higher fees.”
In our survey, more than two-thirds of respondents (68 percent) expect the new standard to increase fees during audits of their 2017 results.
“ASC 606 has been a huge focus for our clients,” says Eric Miles, a partner with Moss Adams. “Companies and auditors are going to be reviewing the entity’s controls around 606, information produced by the entity and key reports used in the revenue recognition process. Companies are going to have to get their interpretations correct and understood between management and the auditor, and that’s driving significant effort this year.”
For some companies, a need to improve contracts with customers to comply with the new standard’s requirements may generate short-term costs that ultimately result in long-term audit fee savings as contracts become more standardized.

FIN
AN
CIA
L EX
ECU
TIV
ES R
ESEA
RC
H F
OU
ND
ATI
ON
2017
AU
DIT
FEE
SU
RV
EY
13
2017 AUDIT FEE SURVEY REPORT
“One of the things we’re focused on is standardizing contracts as much as possible,” says one preparer in the healthcare industry. “Instead of having 100 different kinds of customer contracts, we’ll have one standard legal contract. One of the findings with the standard is we’ve told the business, ‘As you start writing contracts with customers, you’ve got to be within this framework.’”
“The more types of contracts you have, the more work needs to be done to audit those different variables. As we did our revenue assessment with the auditors, to the extent we had areas where there were standard contracts, we had lower fees. Where we found regions where individual businesses were making separate contracts with customers, those fees were higher because they had to do more sampling and more testing than in regions that basically had one contract for the whole country.”
Lawson says the standard’s effects on contracts will vary by industry and a company’s sales practices.
“If a company has some obligations that are written, and some that are verbal or by handshake, Topic 606 is going to focus on the variability of contracts and how they’re agreed upon. I could see, when there’s an imbalanced sales-driven culture, the new standard may help require more transparency and collaboration among a company’s sales, accounting, and IT departments to ensure adequate gathering of the significant terms of a sales arrangement.”

FIN
AN
CIA
L EX
ECU
TIV
ES R
ESEA
RC
H F
OU
ND
ATI
ON
2017
AU
DIT
FEE
SU
RV
EY
14
2017 AUDIT FEE SURVEY REPORT
PRIVATE COMPANIES
Private Companies n=124
Inflation 48%
Acquisition 28
Turnover in staff 16
Focus on revenue recognition 12
Changes to internal controls 12
New FASB standards 11
Divestiture 6
Turnover of key audit firm team members and/or mandatory partner rotation 6
Foreign currency adjustments 2
Review of prior year workpapers resulting from PCAOB inspections 2
PCAOB comments 2
Review of manual controls resulting from PCAOB inspections 1
New COSO Framework 1
New SEC reporting requirements —
For private company respondents, inflation was cited as the leading factor behind increased audit fees, followed by acquisitions and staff turnover. Respondents says acquisitions led to higher fees both in terms of costs related to a transaction – valuation, due diligence, post-merger integration support – as well as higher ongoing costs associated with auditing a larger entity after the transaction closed.
Unlike their public company counterparts, revenue recognition was less of an influence on private company audit fees, although this is likely to change as private entities prepare for the 2019 adoption of the new revenue standard.

FIN
AN
CIA
L EX
ECU
TIV
ES R
ESEA
RC
H F
OU
ND
ATI
ON
2017
AU
DIT
FEE
SU
RV
EY
15
2017 AUDIT FEE SURVEY REPORT
NON-PROFIT ORGANIZATIONS
Non-Profit n=27
Inflation 56%
Acquisition 7
New FASB standards 7
Changes to internal controls 7
Turnover in staff 7
Focus on revenue recognition 4
Turnover of key audit firm team members and/or mandatory partner rotation 4
Divestiture —
Foreign currency adjustments —
Review of manual controls resulting from PCAOB inspections —
Review of prior year workpapers resulting from PCAOB inspections —
New SEC reporting requirements —
New COSO Framework —
Inflation was cited as the leading factor driving comparatively modest increases in audit fees for non-profit organizations.
INTERNAL CONTROLS INVESTMENT
Respondents reported stable investments in enhancing their internal controls environment, with the majority of companies reporting “some” effort.
Q: To what extent are you working to improve your controls environment?
Public n=130
Private n=212
Non-Profit n=45
Substantial effort 24% 14% 22%
Some effort 68 66 67
Not much activity 5 10 4
Not a current focus 5 10 4
Q: Do you expect those efforts to help reduce audit fees?
Public n=130
Private n=209
Non-Profit n=46
We expect reductions 24% 13% 13%
Little or no impact on fees 77 87 87

FIN
AN
CIA
L EX
ECU
TIV
ES R
ESEA
RC
H F
OU
ND
ATI
ON
2017
AU
DIT
FEE
SU
RV
EY
16
2017 AUDIT FEE SURVEY REPORT
SARBANES-OXLEY COSTS
The majority of public company respondents say Sarbanes-Oxley Section 404 compliance costs have been consistent in recent years:
Q: Has your company experienced an increase or a decrease in its costs of compliance with Sarbanes-Oxley Section 404 within the past three years?
n=131
Increase 55%
Decrease 8
No change 57
Common reasons cited for higher SOX costs include: n=72
Regulatory requirements (e.g. COSO 2013) 42%
The company has implemented a new IT system 39
The company has completed a large acquisition with additional systems 36
PCAOB inspection findings/related issues 36
Growth of organization/staff 31
The company experienced a material weakness or significant deficiency requiring additional Section 404 testing 27
Cybersecurity threats 7(Multiple responses permitted)
Q: Who performs your Sarbanes-Oxley 404 testing?
Public n=131
Large Accelerated
n=89Accelerated
n=27
Non-Accelerated
n=11
Accelerated, Large Accelerated
& Non-Accelerated Foreign Issuers
n=3
Internal audit 56% 57% 74% 9% 100%
Finance/controller resources 19 25 4 18
Outsourced 15 6 22 64
Management (decentralized) 9 12 — 9

FIN
AN
CIA
L EX
ECU
TIV
ES R
ESEA
RC
H F
OU
ND
ATI
ON
2017
AU
DIT
FEE
SU
RV
EY
17
2017 AUDIT FEE SURVEY REPORT
INTERNAL AUDIT
Companies are taking different approaches to internal audit, with larger organizations tending to have dedicated departments.
Public
Q: How is your internal audit function performed?
Public n=136
Large Accelerated
n=92Accelerated
n=29Non-Accelerated
n=12
Accelerated, Large Accelerated
& Non-Accelerated Foreign Issuers
n=3
Separate department 60% 71% 45% 8% 100%
Outsourced 11 4 28 25
Mixed 19 21 14 —
Shared internal responsibilities 2 2 — 8
No internal audit dept 9 1 14 58
Private
Q: How is your internal audit function performed?
Private n=215
Separate department 12%
Outsourced 1
Mixed 4
Shared internal responsibilities 13
No internal audit dept 70
Non-Profit
Separate department 20%
Outsourced 2
Mixed 4
Shared internal responsibilities 17
No internal audit dept 57

FIN
AN
CIA
L EX
ECU
TIV
ES R
ESEA
RC
H F
OU
ND
ATI
ON
2017
AU
DIT
FEE
SU
RV
EY
18
2017 AUDIT FEE SURVEY REPORT
INTERNAL AUDIT INVESTMENT
Investment in internal audit largely remained consistent, with the majority of public company respondents reporting no increase or reduction.
Q: Has your company changed its investment in internal audit?
Public n=135
Private n=211
Non-Profit n=42
Increased 19% 9% 14%
Decreased 7 2 —
Remained the same 64 24 31
Not applicable 10 66 55
Respondents say internal audit provides direct assistance to external audit in nearly three quarters of public companies.
Q: Does your internal audit function provide direct assistance to your external auditors?
Public
n=131
Yes 73%
No 27
One vice president of auditing at a manufacturing company says her company’s independent auditor relies on the company’s internal audit team to test certain controls, which helps reduce fees.
“In the beginning, control owners resisted the level of documentation required to evidence performance of a control, but now control owners understand the importance and documentation has become part of the process when executing controls.”

FIN
AN
CIA
L EX
ECU
TIV
ES R
ESEA
RC
H F
OU
ND
ATI
ON
2017
AU
DIT
FEE
SU
RV
EY
19
2017 AUDIT FEE SURVEY REPORT
INTERNAL AUDIT RELIANCE
Q: To what extent does your external auditor rely on internal audit’s work?
Public
n=131
Substantial 20%
Some 65
None 15
Q: Did your external auditors decrease reliance on work performed by internal audit staff because of the PCAOB inspections?
Public
n=126
Yes 13%
No 87
Q: If your company has increased investment in internal audit, has that reduced external audit costs?
Public
n=134
Yes 21%
No 17
N/A 62
VOLUME OF AUDIT WORK
Financial Statements
Q: Has the volume of work performed by auditors increased?
Public n=101
Private n=164
Non-Profit n=38
Yes 46% 18% 5%
No 54 82 95
Most respondents say the volume of financial statement work performed by their auditors remained consistent year-over-year.
Common explanations for increases include the PCAOB and increased documentation requirements by auditors, M&A, increased validation of information produced by the entity (IPE), the new revenue standard and related SAB 74 disclosures, IT system implementations or upgrades, and organization changes.
Among public company respondents, there’s a nearly even split among executives whether they expect an increased internal audit investment to reduce external audit costs.

FIN
AN
CIA
L EX
ECU
TIV
ES R
ESEA
RC
H F
OU
ND
ATI
ON
2017
AU
DIT
FEE
SU
RV
EY
20
2017 AUDIT FEE SURVEY REPORT
INTERNAL CONTROLS
Similarly, respondents reported stable volumes of effort required by auditors on entities’ internal controls.
Q: To obtain an auditor’s report on internal controls, has the volume of annual audit work by your external auditors changed?
Public n=95
Private n=180
Non-Profit n=40
Yes 47% 8% 3%
No 53 92 97
Reasons cited by respondents for increased volumes include additional testing of IPE and management review controls, M&A-related controls testing, and PCAOB inspections and documentation.
Q: To what extent are you working to improve your controls environment?
Public n=132
Private n=212
Non-Profit n=45
Substantial effort 23% 14% 22%
Some effort 67 66 67
Not much activity 5 10 4
Not a current focus 5 10 7
Q: Do you expect those efforts to help reduce audit fees?
Public n=130
Private n=209
Non-Profit n=45
We expect reductions 24% 13% 13%
Little or no impact 76 87 87
“Enhancing a company’s controls framework represents a continuous process,” says Chris Jeffrey of Baker Tilly. “Every company needs to look at their controls framework on a regular basis to make sure they are, in fact, covering the most significant risks to their financial statements and potential misstatements.”
“If the business has changed in such a way that certain accounts either become immaterial or there’s no activity in them at all, those would be good opportunities to remove those controls.”
Jeffrey says monitoring a controls framework effectively should be a collaborative effort between a company and its auditors.
“What I’ve seen to be the biggest benefit is for the company, management and the external auditors to make sure that everybody is on the same page when it comes to controls,” he says. “Ideally, we want to get to a state in which management and the external auditors are generally testing the same controls. That’s where we find the greatest opportunity for reliance, and then the opportunity to reduce the external auditors’ concern — which then hopefully results in less work.”
FIN
AN
CIA
L EX
ECU
TIV
ES R
ESEA
RC
H F
OU
ND
ATI
ON
2017
AU
DIT
FEE
SU
RV
EY
21
2017 AUDIT FEE SURVEY REPORT
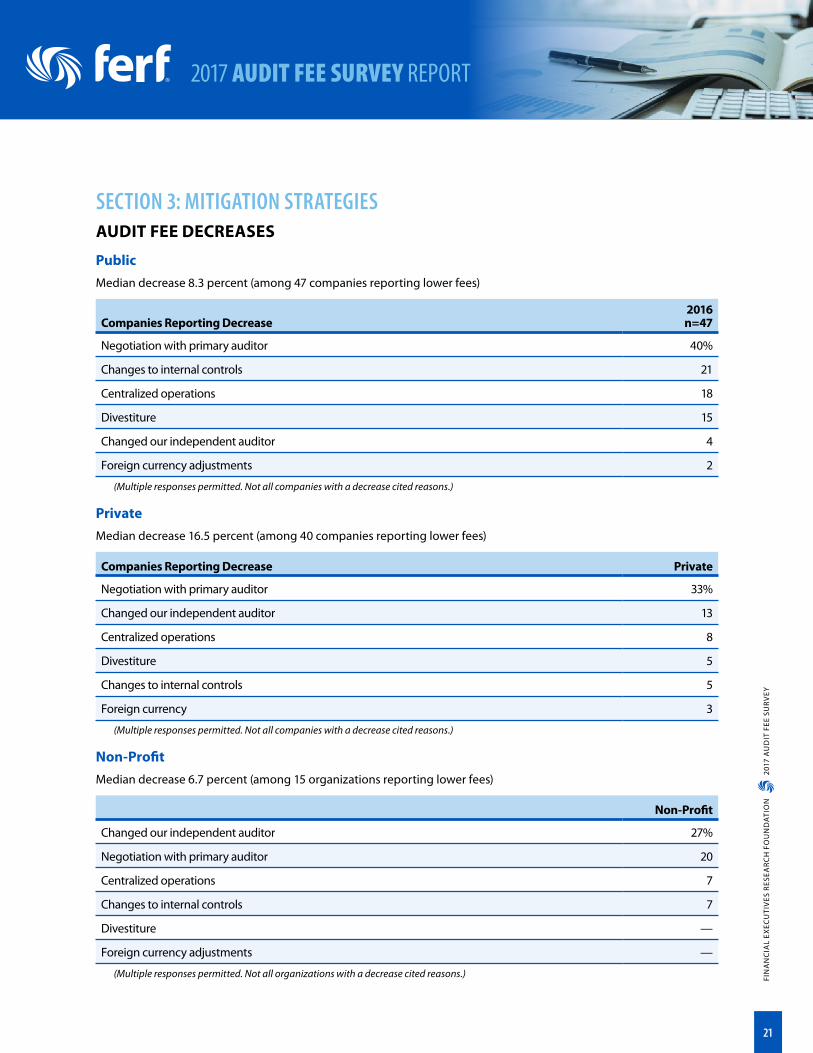
SECTION 3: MITIGATION STRATEGIESAUDIT FEE DECREASES
PublicMedian decrease 8.3 percent (among 47 companies reporting lower fees)
Companies Reporting Decrease2016 n=47
Negotiation with primary auditor 40%
Changes to internal controls 21
Centralized operations 18
Divestiture 15
Changed our independent auditor 4
Foreign currency adjustments 2
(Multiple responses permitted. Not all companies with a decrease cited reasons.)
PrivateMedian decrease 16.5 percent (among 40 companies reporting lower fees)
Companies Reporting Decrease Private
Negotiation with primary auditor 33%
Changed our independent auditor 13
Centralized operations 8
Divestiture 5
Changes to internal controls 5
Foreign currency 3
(Multiple responses permitted. Not all companies with a decrease cited reasons.)
Non-ProfitMedian decrease 6.7 percent (among 15 organizations reporting lower fees)
Non-Profit
Changed our independent auditor 27%
Negotiation with primary auditor 20
Centralized operations 7
Changes to internal controls 7
Divestiture —
Foreign currency adjustments —
(Multiple responses permitted. Not all organizations with a decrease cited reasons.)

FIN
AN
CIA
L EX
ECU
TIV
ES R
ESEA
RC
H F
OU
ND
ATI
ON
2017
AU
DIT
FEE
SU
RV
EY
22
2017 AUDIT FEE SURVEY REPORT
MITIGATION STRATEGIESPublic
Q: Which of the following has your company used to mitigate audit fees?
Mitigation Strategies
All Publicn=161
Large Accelerated
n=109Accelerated
n=32
Non-Accelerated
n=13
Accelerated, Large Accelerated
& Non-Accelerated Foreign Issuer
n=7
Reviewed our audit hours and fees, and negotiated with our auditors 47% 46% 44% 38% 86%
Improved our internal controls 45 51 34 15 43
Increased our audit preparedness 45 41 50 38 100
Reviewed our current audit focus areas to identify areas for improvement 43 46 47 15 43
Increased automation 24 28 19 8 29
Centralized our audit footprint 17 18 16 8 29
Increased staff’s audit skill set 16 16 9 15 57
Increased reliance on internal audit 4 6 —- —- —-(Multiple responses permitted)
RELIANCE ON INTERNAL AUDITPrivate
n=281
Increased our audit preparedness 57%
Reviewed our current audit focus areas to identify areas for improvement 30
Improved our internal controls 27
Reviewed our audit hours and fees, and negotiated with our auditors 26
Increased automation 16
Increased staff’s audit skill set 16
Centralized our audit footprint 5(Multiple responses permitted)
Non-Profitn=56
Increased our audit preparedness 55%
Improved our internal controls 21
Increased automation 18
Increased staff’s audit skill set 16
Reviewed our audit hours and fees, and negotiated with our auditors 13
Reviewed our current audit focus areas to identify areas for improvement 11
Centralized our audit footprint 5(Multiple responses permitted)

FIN
AN
CIA
L EX
ECU
TIV
ES R
ESEA
RC
H F
OU
ND
ATI
ON
2017
AU
DIT
FEE
SU
RV
EY
23
2017 AUDIT FEE SURVEY REPORT
POPULAR STRATEGIES
Approaches to mitigating audit fee increases varied among our public, private and non-profit respondents. For public companies, reviewing audit hours and negotiating with auditors, improving internal controls, increasing audit preparedness and reviewing audit focus areas were the most common tactics.
Among private companies, increasing audit preparedness, reviewing audit focus, enhancing internal controls and negotiating with auditors were cited as priorities.
NEGOTIATION AND PLANNING
A practice that several interviewees recommended is a detailed review at the close of an audit to discuss challenges and opportunities for improvement.
“We have a candid discussion about what went well, what didn’t go so well, and trying to get in front of expected changes in our business that should result in work for them, says a director of financial reporting at a healthcare provider. “We’re pretty upfront about what we expect and how we think that should be reflected in their fee structure.”
“There’s an annual feedback process where we work together to figure out what we can do, collectively, to make the audit more efficient,” says Dino Theodoracopoulos, assistant controller at L3 Technologies. “We’ve tried to over-communicate with our auditors and our divisions about what went well and what didn’t go well with the past year financial statement audit to get our divisions ready for the following year audit. As a result, we expect our auditors will spend less time doing their fieldwork.”
“It’s more than the fee amount — you need to examine breakdown of hours and hours by role,” says Chad Greenway, CFO at petroleum industry training firm PetroSkills. “How many hours are the partners going to be involved? How many is the senior manager? And on down. When you have information in terms of the number of hours, you can think about rates and what’s acceptable and what’s not. This information provides multiple points to evaluate and negotiate with your audit firm.”
“We are sitting down with our auditors and looking at the fees and the hours being billed to understand what’s driving them,” says an auditing vice president at an accelerated filer manufacturer.
“If the hours are higher than we expected, we want to understand how can we work toward reducing those in the future. That cadence is going to be on a quarterly basis so we know what we’re being billed for, why we’re being billed for it and how we can assist in driving those fees down.”
One financial leader says he was able to negotiate a lower fee, in part, by extending the agreement with its existing audit firm.
“We challenged the auditors and say ‘we want you to give us a really competitive quote so we don’t have to go out and bid the audit,’” says Dan Brockman, global controller at engineering and construction management firm Kleinfelder. “They came back and reduced their fees further…They didn’t want to us do a competitive bid. That costs them money, and that costs us money, so they came back with a discount.”
One director of corporate accounting says fee-related discussions should be collaborative and include contributions from all parties to create a more efficient and cost-effective process.
“It’s not just putting it on them to find opportunities to create efficiencies in their audit,” he says. “We’re taking it from a two-sided approach that puts us both on the hook so it’s balanced.”
One director of corporate accounting says fee-related discussions should be collaborative and include contributions from all parties to create a more efficient and cost-effective process.

FIN
AN
CIA
L EX
ECU
TIV
ES R
ESEA
RC
H F
OU
ND
ATI
ON
2017
AU
DIT
FEE
SU
RV
EY
24
2017 AUDIT FEE SURVEY REPORT
In some cases, the need for a company to react to challenging industry conditions can lead to at least short-term decreases in fees from auditors or other service providers. For instance, Harry Soose, CFO of Civil & Environmental Consultants, Inc., says declines in the oil and gas market sector prompted his firm’s clients to ask for rate reductions, so the firm made similar requests to its service providers.
“We had a third of our client base asking us for rate decreases,” he says. “The auditors understood what was happening in the marketplace and knew we had clients aggressively seeking rate reductions. It wasn’t that we were out of step with what they knew was going on. We hadn’t gone to the market for the audit for probably five years, and we talked about our situation.”
“I didn’t use that as a hammer, but at some point it’s something that motivates the auditors to think about what’s going on in the marketplace.”
Another interviewee active in the oil and gas sector negotiated a short-term decrease in its audit fees, with the expectation fees would return to their pre-downturn level as the company’s financial results improved.
Several interviewees say effective audit planning should address the timing of when certain types of work can take place to reduce the volume of tasks that have to be addressed during the traditional first-quarter busy season.
“Revenue is a huge part of their audit and a lot of their testing would ultimately come down to the end of the year, and it would become a huge crunch at the very end of the audit,” says a chief accounting officer. “This was creating a lot of work and stress at the tail end of the audit. We’ve looked at that area and asked if they could spread the testing over the entire year. Why couldn’t they pull a certain amount of files every quarter and spread the work over the year, and take a lot of the stress off the end-of-the-year process.”
“One of the things we bring up regularly is how we, as the company being audited, can make the audit more efficient,” says Soose. “I take that on as a serious challenge and make them aware that I want the audit to be efficient for them. I want a clean audit report, and I want to remove the impediments the auditors might find. It’s not like you’re trying to play Easter egg hunt with your auditors – you really want them to understand what’s going on.”
A preparer at a consumer products company says it reviews its audit procedures and controls framework after
significant organizational events.
“We’ve taken a fresh look to understand which locations remain truly material after a number of divestitures,” the executive says. “We were able to reduce some of those audit locations by establishing we could get to the same level of meaningful coverage without having to, say, do full U.S. GAAP testing in Turkey or Canada.”
One preparer says he has established policies that allow audit fees to exceed approved budgets by a designated percentage before the audit committee is notified.
“We put a process in place because we don’t want the audit committee to be bothered every time fees go up or new things come up that were not contemplated when the budget was set with the auditors,” he says.
Patrick Furlong, CFO of Tetco, Inc., says an auditor may not be happy with the idea of a lower fee, but most firms understand their clients’ desire to be efficient and prefer to have a more focused audit relationship.
“It’s just like any service you’re buying. You need to look at what you can do internally and understand what your resources are. Audits aren’t a mysterious effort — there’s a distinct relationship between time spent by auditors doing work and the fees you get billed, so you should really try to minimize the work auditors have to do during the course of the audit and the company being prepared and efficient.”
Effective audit planning should address the timing of when certain types of
work can take place to reduce the volume of tasks that have to be addressed
during the traditional first-quarter busy season.

FIN
AN
CIA
L EX
ECU
TIV
ES R
ESEA
RC
H F
OU
ND
ATI
ON
2017
AU
DIT
FEE
SU
RV
EY
25
2017 AUDIT FEE SURVEY REPORT
COLLABORATION
A growing number of companies are also working more collaboratively with their auditors, such as communicating more frequently throughout the year, so the auditors understand business developments or address questions about potentially complex issues.
“We meet with the auditors over the course of regular business to keep them apprised of what is going on, particularly if there is something like an acquisition, growth in a certain area or movement into a new geography,” says Soose.
“We know questions will be coming and we try to stay on top of things throughout the year,” says PetroSkills’ Greenway. “We’ve had discussions about the new revenue and leasing standards, for example. We’re staying ahead of these issues as opposed to waiting for the auditors come and ask, ‘How did you evaluate this’ and us being caught flat-footed.”
“At the end, it’s taking what you’ve learned and incorporating them into your procedures and policies. If you do it every day, it’s nothing special. You’re not hoping that in their sampling and testing that they don’t pick that one folder you don’t want them to pick. Then everything’s in good shape.”
Baker Tilly’s Stensrud says auditors also hope to move work outside the crunch of their traditional busy season.
“Most firms are using the quarterly reviews as a form of interim testing, particularly if there are significant or unusual transactions to make sure that those are audited, in effect in real time so you don’t have to go back and assess that as part of the year-end audit process,” he says.
“Those provide a touchpoint to sit down, perhaps before the actual quarter-end, to discuss some of the business operational updates that might drive our audit throughout the year. And if they have a unique transaction, determine if they have the resources to address that, but if they don’t, how do they go through that process? In certain cases, we can provide them guidance and at least have a baseline to start with.”
While regular reviews and spreading work into less-busy periods can be an effective tactic, it can also be challenging to adjust established workflows and patterns.
“I think there’s a desire on all parties’ parts to do that, but in reality, I’m not sure it’s been as collaborative as my clients would’ve liked,” says Eric Miles of Moss Adams.
“One of the common ways this happens is that some audit procedures are done earlier in the year, but they don’t fully run through the auditor’s quality control process until later in the year when the lead partner has time to comment. Things that our clients thought were closed are coming back after they’ve been through the QC process.”
“There’s the intent, but we all live in a whirlwind of the day-to-day, and I’m not sure the process workloads have been built to allow real-time collaboration.”
Communication about emerging issues or potential challenges is also important during the audit process to reduce the chance of misunderstandings or disagreement when the final invoice is presented.
“We expect them to bill us for additional work, but let’s have a dialogue as those significant transactions or out-of-scope work happens so there’s not a surprise at the end of the audit where your fee’s gone up by a third,” says the healthcare reporting director. “Let’s maintain a dialogue so that it’s not a battle over price but a collaborative discussion.”
Growing use of technology is likely to improve collaboration, in part through the more efficient exchange of data and in allowing artificial intelligence tools to perform rote tasks throughout the year.
“Collaboration will be more achievable as accounting firms move down the path of 100 percent population testing and they’re able to build those requests incrementally through the quarters, each quarter,” says Jason Lawson at Moss Adams. “If you’re going to obtain 100 percent of a sales subledger, you can ask for that data on a quarterly basis instead of finally looking at it in the fourth quarter. In so doing, auditors may be able to tailor the direction of testing earlier in the fiscal year whether from a SOX 404 or a substantive basis.”
Communication about emerging issues or potential challenges is also important during the audit process to reduce the chance of misunderstandings or disagreement when the final invoice is presented.

FIN
AN
CIA
L EX
ECU
TIV
ES R
ESEA
RC
H F
OU
ND
ATI
ON
2017
AU
DIT
FEE
SU
RV
EY
26
2017 AUDIT FEE SURVEY REPORT
TAKING ON WORK
Another common strategy for mitigating audit fee increases is expanding internal staffs to perform more audit preparation and related work in-house. Patrick Furlong, for instance, says Tetco has started using controllers at subsidiary companies to prepare financial statements and related notes instead of relying on their audit firm for those tasks.
“The auditors spent a lot of time doing work they didn’t need to be doing – that we should’ve been doing ourselves. There’s a number of those activities, along with being prepared upfront for the auditors when they show up,” Furlong says. “It was pretty easy to figure out what needed to be done and how we needed to present it.”
Similarly, Kleinfelder’s Brockman says his staff has taken on more work that used to be completed by their external auditors.
“They give us schedules that need to be prepared, and we divide those among our team,” he says. “We also draft our own financial statements. We try to keep their work to a minimum, and we meet at least weekly during the audit process if see if we owe them anything or if they have questions. That’s helped to smooth out the process.”
“We have resources within the company so we offered to prepare the walk-throughs ourselves,” says Soose. “We’ve had that person prepare those documents at a less expensive rate, and provided those to the auditors. They still wanted to go back and make sure they understood everything, but our work was helpful in putting their focus on more important things and reducing the audit fee.”
CENTRALIZATION AND SHARED SERVICES
Interviewees at larger organizations with shared services centers say consolidating work in fewer locations, in addition to increasing efficiency and reducing operating costs, can also influence audit-related expenses favorably by standardizing processes, reducing variances in transactions and allowing testing to occur in fewer locations.
“We’re moving to a shared services model and having regional hubs where a lot more work is taking place,” says one executive. “As a result, we can focus a lot of our audit work to regions, as opposed to having teams everywhere. You get more coverage of a lot of transactions in one region versus going to multiple places and flying people around.”
“With the move to shared service, now we have common and standard processes across a significant number of locations,” says an accounting director at a manufacturer. “We can also see best practices from
location to location, such as if one location automates a process. There could be something one location didn’t know was possible.”
“We previously had people who were decentralized geographically, and that can create variances in processes and practice,” says says the healthcare reporting director. “We’ve done work to further integrate our accounting function. That’s created efficiency for us, and we expect it will help them become more efficient in their audit.”
One challenge with shared service centers is an audit partner in one country may be reluctant to sign off on testing performed by a team in a different location.
“There’s some duplication of effort that goes on, and maybe even some rework, but we try to nip that the best we can,” says an accounting executive at a manufacturer. “It’s not that often, but we’re pretty quick to give them feedback that we’re paying for a duplicate test and we don’t want to continue doing that.”
Consolidating work in fewer locations, in addition to increasing efficiency and reducing operating costs, can also influence audit-related expenses favorably.

FIN
AN
CIA
L EX
ECU
TIV
ES R
ESEA
RC
H F
OU
ND
ATI
ON
2017
AU
DIT
FEE
SU
RV
EY
27
2017 AUDIT FEE SURVEY REPORT
AUTOMATION
Automation is also playing a small-but-increasing role in increasing audit efficiency. For example, cloud-based tools that allow companies and auditors to use the same data sources securely can speed processes and, potentially, reduce friction that can contribute to higher fees.
“As internal audit, we’re able to share certain aspects of the work we do,” says Baker Tilly’s Jeffrey. “We’re able to turn access on and off quickly, so we’re able to collaborate with our clients and complete documentation in a way that supports SOX compliance.”
“As we complete those areas, we’re able to turn on access for the external auditors so they can see what they need, when we’re ready for them to see it. That certainly helps in communicating that information and collaborating with the groups we need to work with. If nothing else, that’s going to make the process more efficient and effective, and hopefully less expensive from that standpoint.”
Automation can also help preparers streamline their operations and reduce the volume of paperwork that needs to be reviewed manually.
“We took a billing process that was paper-intense and made it electronic,” says Soose. “Our invoices have a certain level of detail about who’s worked on a project and what they did. We were able to automate that and bring it into our financial management system so we could review and deliver the invoices electronically. That made it easier for the auditors to do their verification that our invoicing is being managed effectively. In the past, you’d have to go find the paper.”
“If you can have a robot continue to look at reserves on a 24-hour cycle and look for any anomalies in the activity, the robot can find it much faster than an auditor can,” says one preparer. “If the robot is testing balances and anomalies, it can raise questions to the controller more efficiently than we can as humans.”
While automation offers promise in increasing efficiency for financial executives and their auditors, most discussions about the benefits focus more on expectations than current results. Some large registrants and audit firms are using robotics process automation (RPA) and artificial intelligence tools, but those efforts haven’t reached the finance or auditing mainstream yet.
“There’s a lot of testing being done at the RPA level,” says Moss Adams’ Lawson. “If you take the simplest example of a bank reconciliation or a simple workpaper, the largest firms are able to take a bunch of macros and pull data from various sources and plant that into, say, Excel-based files and preformat its fields.”
“You can picture that type of technology populating workpapers within seconds, as opposed to staff that could take multiple days. We’ve heard that’s happening at some of the largest firms, at least at a pilot stage.”
RIGHT-SIZING AUDIT FIRMS OR SERVICES
Some companies have tried to optimize their audit fees by shifting from a Big Four to a Top 10 audit firm. Such a shift can result in a decrease in fees while maintaining an appropriate service level for a company’s needs.
“We had no issue with our Big Four firm, but it wasn’t scaled for our business,” says Chad Greenway of PetroSkills. “For smaller companies, there’s a step-down
in costs with firms five through 15 with no decrease in the level of quality. We generate revenue in 50 countries and have four statutory audits, so we needed a firm that could not only handle the consolidated, U.S.-based audit, but also had offices or affiliates in those other locations.”
Cloud-based tools that allow companies and auditors to use the same data sources securely can speed processes and, potentially, reduce friction that can contribute to higher fees.

FIN
AN
CIA
L EX
ECU
TIV
ES R
ESEA
RC
H F
OU
ND
ATI
ON
2017
AU
DIT
FEE
SU
RV
EY
28
2017 AUDIT FEE SURVEY REPORT
UNDERSTAND THE AUDITOR’S POINT OF VIEW
Several interviewees say effective collaboration and fee negotiation both depend, in part, on considering the audit firm’s need to generate revenue and avoiding the risk of being too demanding in fee discussions.
“The audit world has a labor-intense cost structure and there is definitely labor inflation,” says Soose. “The company I work for is a company of engineers, scientists and biologists, and there is a shortage of that kind of talent. Even though you don’t see the Consumer Price Index increasing, labor costs have certainly increased. I think auditing is similar in that they are experiencing labor inflation, so we have to be open to some increase in audit fees.”
“We remain cognizant of the fact they need to be profitable and feel comfortable they’re getting paid for the level and quality of the work they do,” says a financial reporting director. “We take that into consideration when we discuss fees with them.”
“We obviously benchmark our fee to make sure we understand it, then we provide perspective on the type of productivity we would like to see,” says an accounting director. “But we respect the fact they need to do their work independently and tell them they have the latitude to inform us when additional work is required.”

FIN
AN
CIA
L EX
ECU
TIV
ES R
ESEA
RC
H F
OU
ND
ATI
ON
2017
AU
DIT
FEE
SU
RV
EY
29
2017 AUDIT FEE SURVEY REPORT
SECTION 4: RESPONDENT DEMOGRAPHICSSURVEY RESPONDENTS BY INDUSTRY
Public Private Non-ProfitAerospace & Defense 6 3
Agriculture - Chemicals 1 5
Agriculture - Mining and Construction 2 12
Architects and Engineering 2
Biomedical Research
BPO Call Center 1
Construction 6
Education - Higher Education 1 5
Education - Primary or Secondary 1
Electronic Security and Fire Safety 1
Energy - Oil, Gas, Solar, Other 6 8 1
Entertainment Services
Financial Services - Banking 8 3
Financial Services - Asset Management 1
Financial Services - Investment Banking 1
Financial Services - All Others Except Insurance 2 14
Fitness Clubs - Leisure 1
Food Service
Franchising 1
Government 2
Healthcare - Life Sciences 9 5
Healthcare - Medical Devices 1
Healthcare - Pharmaceuticals 6 2
Healthcare - Providers, Services 5 15 6
Insurance 8 13 3
IT Service Providers 1 4
Janitorial
Labor Union 1
Legal 3
Manufacturing - Discrete 11 38
Manufacturing - Process 25 36
Marine Exploration 1
Marketing Technology 1

FIN
AN
CIA
L EX
ECU
TIV
ES R
ESEA
RC
H F
OU
ND
ATI
ON
2017
AU
DIT
FEE
SU
RV
EY
30
2017 AUDIT FEE SURVEY REPORT
SURVEY RESPONDENTS BY INDUSTRY
Public Private Non-ProfitMedia 5 4 1
Native American Gaming 1
Non-Profit Organizations 35
Professional Services - Other than IT 1 19 1
Biomedical Research 1
Entertainment Services 1
Food Service 1
Janitorial 2
Real Estate 2 6
Recreation & Entertainment 2
REIT 1
Residential Services 1
Retail - Hotels, Restaurants 6 8
Retail - All Others 9 5
Sales & Distribution 2
Software and Services 1
Software - Publishers or Developers 5 10
Staffing 1
Technology 17 14
Telecommunications 4 3
Transportation 3 7
Utilities 4 3
Wholesale Distribution 3 19

FIN
AN
CIA
L EX
ECU
TIV
ES R
ESEA
RC
H F
OU
ND
ATI
ON
2017
AU
DIT
FEE
SU
RV
EY
31
2017 AUDIT FEE SURVEY REPORT
SURVEY RESPONDENTS BY REVENUERespondents by Revenue Public Private Non-Profit
Less than $5 million 5 9 1
$5 million to $24.9 million 5 32 20
$25 million to $99 million 11 77 7
$100 million to $499 million 18 69 9
$500 million to $999 million 16 23 2
$1 billion to $4.99 billion 32 7 4
$5 billion to $14.99 billion 21 1 3
$15 billion to $24.99 billion 8
$25 billion to $49.99 billion 5
More than $50 billion 27
PRIMARY AUDIT FIRMS CITED BY RESPONDENTS (SURVEY DATA)All
PublicLarge
Accelerated Accelerated Non-AcceleratedForeign
Issuer PrivateNon-
Profit
Baker Tilly 2 1 1 3 2
BDO 2 1 1 12
Deloitte 31 20 9 2 15 2
EY 29 23 4 1 1 11 1
Grant Thorton 4 3 1 11 3
KPMG 25 20 2 2 1 10 1
Moss Adams 1 1 8
PwC 38 34 3 1 13 3
RSM 5 3 2 20 1
Schenck 5
Other firms mentioned:AAFCPA; Abbott, Stringham, Lynch; Aldrich; Anton, Collins, and Mitchell; Armanino; Aronson; Ball & McGraw; Beerman, Piper and Associates, LLC; BGS; Blazek and Vetterling; Blue & Company; Blum Shapiro; BPM; Briggs & Veselka; CLA; Clark Nuber; Clark Raymond; Clifton Larson Allen; Comer/Nowling; Coulter & Justus; Coulter and Justus, Knoxville, TN; Dixon Hughes Goodman; DMLO; Doeren Mayhew; DZH Phillips; Eide Bailly, LLP; EKS&H; Ellin & Tucker; Erickson and Associates SC; Ferlita Walsh & Gonzalez; FGMK; Frank Rimerman; Funaro & Co PC; Geffen Mesher; George Diem, CPA ; Gilbert Associates; Gilmore, Jasion & Mahler; Grassi; Hall & Company; Hawkins Ash; Hein; Henry + Horne; Holtzman Partners; Hood & Strong; Houldsworth, Russo & Co. ; HRSS; Joseph Eve; Kasperski Dinan & Rink; Katz Nannis Solomon; Katz, Sapper & Miller LLP; Kauffman Rossin; Kcoe & Isom; KMCO; Kohrman Frye & Associates; L.H. Frishkoff; Lane Gorman Trubitt - LGT; Lattimore Black Morgan Cain; LBMC; Lindquist LLP; LMHS, CPAS; Lutz; Mayer Hoffman McCann; Mazars; McDonald Jacobs; McGowen; MCM; Moss Adams; Oisihi and Company; Peck and Associates; Perkins & Co.; Pinnock Robbins Posey Richins; Postlethwaite and Netterville; Rambeau CPAs; RBSM; RCO (Rylander, Clay and Opitz); Redpath & Company; Rehmann Robson; RKL, LLP; Schenck; Schneider Downs; Sol Schwartz & Associates, PC; Somerset; Sovereign CPA Group; Strothman; Sutton Frost Cary; Tushaus & Associates, LLC; VonLeyman; Walter Shuffain; Warren Averett; Weaver; Wilkerson Guthmann; Windes; Wipfli

FIN
AN
CIA
L EX
ECU
TIV
ES R
ESEA
RC
H F
OU
ND
ATI
ON
2017
AU
DIT
FEE
SU
RV
EY
32
2017 AUDIT FEE SURVEY REPORT
APPENDIX
EXHIBIT A AUDIT FEES BY FILING STATUS (SURVEY RESPONSES)
All PublicLarge
Accelerated AcceleratedNon-
Accelerated
Accelerated, Large Accelerated
& Non-Accelerated Foreign Issuers Private
Non-Profit
Median Fee $2,803,507 $5,900,000 $694,700 $215,000 $5,000,000 $70,000 $52,388
Median Pct Change
1.3% 1.8% 0.2% 3.0% 0.0% 3.7% 1.6%
Average Fee $7,446,739 $10,063,290 $1,594,728 $365,717 $6,380,300 $163,993 $181,403
Average Pct Change
6.9% 4.2% 6.8% 29.6% -0.4% 3.8% -2.3%
EXHIBIT B AUDIT HOURS BY FILING STATUS
(Among survey respondents reporting hours and fees)
Large Accelerated Accelerated
Non-Accelerated Private Non-Profit
Responses 39 11 1 49 11
Median Fee $4,750,000 $1,000,000 $151,000 $102,000 $691,375
Median Hours 18,900 6,000 635 500 3,463
Median Calculated Rate* $218 $167 $238 $163 $160
Average Fee $9,286,629 $2,090,725 $151,000 $268,334 $751,842
Average Hours 41,999 10,360 635 1,744 4,011
Average Calculated Rate* $237 $182 $238 $189 $159
*Rate calculated by dividing reported fees by reported hours

FIN
AN
CIA
L EX
ECU
TIV
ES R
ESEA
RC
H F
OU
ND
ATI
ON
2017
AU
DIT
FEE
SU
RV
EY
33
2017 AUDIT FEE SURVEY REPORT
EXHIBIT C AUDIT FEES BY SALES REVENUE (SURVEY RESPONSES)
Public
Public Less
than $5 million
Public $5-24.9M
Public $25-
99.9M
Public $100-
499.9M
Public $500-
999.9MPublic
1-$4.9BPublic
5-$14.9Public 15-
$24.9BPublic 25-
$49.9B
Public More than
$50B
Median Fee $183,000 $5,350,000 $282,000 $442,330 $1,258,620 $2,200,000 $7,500,000 $12,800,000 $9,028,000 $18,564,500
Median Change -2.0% -3.3% 1.6% 3.2% 3.3% 3.2% 3.4% -5.6% 1.4% 0.0%
Average Fee $275,003 $5,697,800 $376,292 $632,694 $1,230,196 $2,865,963 $7,790,084 $13,587,795 $14,753,200 $23,217,750
Average Change -4.6% 2.8% 37.3% 7.9% 10.8% 9.1% 0.8% -6.8% 2.7% 3.7%
Private
Private Less than
$5 millionPrivate
$5-24.9MPrivate
$25-99.9M
Private $100-
499.9M
Private $500-
999.9MPrivate 1-$4.9B
Private 5-$14.9
Median Fee $47,500 $37,250 $60,000 $102,000 $205,000 $455,000 $1,160,000
Median Change 8.3% 0.0% 3.0% 4.2% 4.3% 4.5% 9.5%
Average Fee $256,250 $38,728 $83,359 $173,799 $390,685 $652,386 $1,160,000
Average Change 5.7% -9.5% -6.7% -0.5% 0.1% 4.5% 9.5%
Non-Profit
Non-Profit $25-99.9M
Non-Profit $100-499.9M
Non-Profit $500-999.9M
Non-Profit 1-$4.9B
Non-Profit $5B and above
Median Fee $78,000 $77,000 $275,000 $287,200 $1,415,392
Median Change 0.0% 3.6% -372.7% 3.7% 3.6%
Average Fee $69,970 $94,860 $275,000 $289,225 $1,415,392
Average Change -1.4% 2.6% -372.7% 2.3% 3.6%

FIN
AN
CIA
L EX
ECU
TIV
ES R
ESEA
RC
H F
OU
ND
ATI
ON
2017
AU
DIT
FEE
SU
RV
EY
34
2017 AUDIT FEE SURVEY REPORT
INTERVIEWEESDan Brockman Global Controller, Kleinfelder
Patrick Furlong CFO, Tetco, Inc.
Chad Greenway CFO, PetroSkills
Chris Jeffrey Partner and Midwest Risk and Internal Audit Consulting Leader Baker Tilly
Jason Lawson Partner, Moss Adams
Eric Miles Partner, Moss Adams
Harry Soose CFO, Civil & Environmental Consultants, Inc.
Steven E. Stensrud Partner, Manufacturing and Distribution Team Leader Baker Tilly
Dino Theodoracopoulos Assistant Controller, L3 Technologies
(We also spoke with six additional financial reporting executives who requested anonymity.)
ABOUT THE AUTHORDave Pelland is managing director, research, at Financial Executives Research Foundation (FERF). Before joining FERF, Pelland was managing editor of FEI Daily and Financial Executive magazine. Pelland also worked in a variety of editorial and marketing roles at KPMG LLP. He has also served as editor-in-chief of Risk Management magazine, published by the Risk & Insurance Management Society. He can be reached at +1 973 765 1032 or at [email protected]

FIN
AN
CIA
L EX
ECU
TIV
ES R
ESEA
RC
H F
OU
ND
ATI
ON
2017
AU
DIT
FEE
SU
RV
EY
35
2017 AUDIT FEE SURVEY REPORT
ABOUT FERFAbout Financial Executives Research Foundation Inc. Financial Executives Research Foundation (FERF) is the non-profit 501(c)(3) research affiliate of Financial Executives International (FEI). FERF researchers identify key financial issues and develop impartial, timely research reports for FEI members and nonmembers alike, in a variety of publication formats. FERF relies primarily on voluntary tax-deductible contributions from corporations and individuals. FERF publications can be ordered by logging onto ferf.org
ABOUT WORKIVAWorkiva (NYSE:WK) delivers Wdesk, an intuitive cloud platform that modernizes how people work within thousands of organizations, including over 70 percent of the 500 largest U.S. corporations by total revenue. Wdesk is built upon a data management engine, offering controlled collaboration, data connections, granular permissions, and a full audit trail. Wdesk helps mitigate risk, improves productivity, and gives users confidence in their data-driven decisions. For more information, visit workiva.com
ABOUT MYLOGIQMyLogIQ offers the largest repository of 360° intelligence on public companies. We offer an unrivaled artificial intelligence powered solution for analyzing public companies with real time mining of SEC filings and information posted on public company websites.
Our CompanyIQ™ platform is the new standard in SEC compliance and competitive intelligence. Customers can access our CompanyIQ™ intelligent databases through our Software-As-A-Service or Data-As-A-Service solutions to benchmark with peers, improve SEC compliance, and get ahead of regulatory trends.
MyLogIQ solutions are used by external reporting teams of public companies, big 5 auditing firms, law firms, academia, and regulatory bodies. Users can subscribe to any or all of the following intelligent databases: Disclosure Research and Benchmarking; SEC Comment Letters and Responses; Audit Fees and SOX Analysis; Corporate Governance Analysis; Executive and Director Compensation Analysis; Financial Analysis; IPO, Merger and Debt Transactions; and Ownership and Activist Investors trends.
For more details visit us at www.mylogiq.com or email [email protected]

FIN
AN
CIA
L EX
ECU
TIV
ES R
ESEA
RC
H F
OU
ND
ATI
ON
2017
AU
DIT
FEE
SU
RV
EY
36
2017 AUDIT FEE SURVEY REPORT
Financial Executives Research Foundation (FERF) gratefully acknowledges the following companies for their support and generosity.
PLATINUM MAJOR GIFTS$60,000Microsoft Corporation
$40,000Exxon Mobil Corporation
$20,000Bank of America
GOLD PRESIDENT’S CIRCLE$10,000 – $14,999
Cisco Systems Inc.
Dow Chemical Co.
General Electric Co.
Johnson & Johnson
Wells Fargo
SILVER PRESIDENT’S CIRCLE$5,000 – $9,999
Accenture LLP
Apple, Inc.
The Boeing Company
Comcast Corporation
Corning Incorporated
Cummins Inc.
Dell, Inc.
DuPont
Eli Lilly and Company
General Motors
IBM Corporation
Lockheed Martin Corp.
McDonald’s Corporation
Medtronic, Inc.
Motorola Solutions, Inc.
PepsiCo, Inc.
Pfizer Inc.
Procter & Gamble Co.
Select Medical Corp.
Tenneco
Valeant Pharmaceuticals International
Walmart Stores, Inc.
The views set forth in this publication are those of the author and do not necessarily represent those of the FERF Board as a whole, individual trustees, employees or the members of the Research Committee. FERF shall be held harmless against any claims, demands, suits, damages, injuries, costs, or expenses of any kind or nature whatsoever except such liabilities as may result solely from misconduct or improper performance by FERF or any of its representatives.
© 2017 by Financial Executives Research Foundation, Inc.
All rights reserved. No part of this publication may be reproduced in any form or by any means without written permission from the publisher.
International Standard Book Number: 978-1-61509-233-8
Authorization to photocopy items for internal or personal use, or for the internal or personal use of specific clients, is granted by FERF provided that an appropriate fee is paid to the Copyright Clearance Center, 222 Rosewood Drive, Danvers, MA 01923. Fee inquiries can be directed to Copyright Clearance Center at +1 978 750 8400. For further information, please visit the Copyright Clearance Center online at www.copyright.com