2017 asset liability management workshop - · pdf file2017 asset liability management workshop...
TRANSCRIPT

2017 Asset Liability Management Workshop
Attachment 1, Page 1 of 55

2017 Asset Liability Management Workshop Attachment 1, Page 2 of 55
Overview
Asset Liability Management Objectives & Review
Review of Candidate Portfolios
Review of Investment Decision Factors
Review of Actuarial Decision Factors
ALM Model Results (Cost vs. Volatility Trade-off)
Recap & Next Steps

2017 Asset Liability Management Workshop Attachment 1, Page 3 of 55
Today’s Objective
• Evaluate potential policy portfolios that best balance the long-term investmentobjectives, risk tolerances, and liquidity constraints of the Public Employees’Retirement Fund (PERF)
• Gather feedback from the CalPERS Board and stakeholders
• Prepare for December 2017 Action item resulting in CalPERS Board PolicyPortfolio selection
Conduct the Asset Liability Management (ALM) Workshop

2017 Asset Liability Management Workshop Attachment 1, Page 4 of 55
Steps to Obtain Policy PortfolioLiabilities
Forecast changes in benefit payments
Create simulated liabilities, contributions, and payroll costs
Illustrate key risk considerations for each Candidate Portfolio
Conduct Workshop
Board chooses a Candidate Portfolio based on analysis
Assets
Determine Asset Class Roles and Benchmarks
Create simulated annual returns for each distinct Candidate Portfolio
Determine Capital Market Assumptions and Constraints
Create distinct Candidate Portfolios along efficient frontier
Indicates Step Completed
Indicates Step Ongoing
Step 1
Step 6
Step 3
Step 4
Step 5
Step 2
Step 7
Implement Strategic Asset Allocation Policy Targets and Ranges
Mid-Cycle Capital Markets Review
Step 8
Step 9

2017 Asset Liability Management Workshop Attachment 1, Page 5 of 55
Candidate Portfolios
• With the 2013 Capital Market Assumptions, the ALM Policy Portfolio had an expected compound return of 7.15% for years 1 through 10, expected compound return of 8.39% for the long term (i.e., years greater than 10), blended return of 7.56%, and expected volatility of 11.76%.
• Blended Return is the weighted expected compound rate of return of years 1 though 10 and the long term, minus 15 bps for admin fees.• Circles correspond to Candidate Portfolios A,B, and D. Squares correspond to Current Allocation, Interim Policy, and ALM policy portfolios.
Triangle corresponds to Candidate Portfolio C which is most similar to Current Allocation. Symbols illustrated on pages 6 and 7.
Asset Allocation of Preliminary Candidate Portfolios Allocation9/30/2017
Interim Policy9/30/2016
ALM Policy2013
Asset Class Component Candidate A Candidate B Candidate C Candidate D
Global Equity 34% 42% 50% 59% 50% 46% 47%Private Equity 8% 8% 8% 8% 8% 8% 12%Fixed Income 44% 36% 28% 19% 19% 20% 19%Real Assets 13% 13% 13% 13% - - -Real Estate - - - - 9% 11% 11%Infrastructure/Forestland - - - - 2% 2% 3%Inflation Assets 0% 0% 0% 0% 8% 9% 6%Liquidity 1% 1% 1% 1% 4% 4% 2%
Expected Compound Return (1-10 yrs.) 5.6% 5.8% 6.1% 6.4% 6.0% 5.9% 6.2%
Long Term Expected Return (11-60 yrs.) 7.8% 8.0% 8.3% 8.5% 8.1% 8.0% 8.3%
Blended Return (1-60 yrs.) 6.50% 6.75% 7.00% 7.25% 6.85% 6.77% 7.09%
Expected Volatility 9.1% 10.2% 11.4% 12.8% 11.5% 11.0% 12.0%
Cash Yield: 3.1% 3.0% 2.9% 2.7% - - -

2017 Asset Liability Management Workshop Attachment 1, Page 6 of 55
3.0%
3.5%
4.0%
4.5%
5.0%
5.5%
6.0%
6.5%
7.0%
2% 4% 6% 8% 10% 12% 14%
Expe
cted
Ret
urn
(1-1
0 Ye
ars)
Expected Volatility
Candidate C
Candidate B
Candidate D
Candidate Portfolios - Efficient Frontier
Candidate A Interim PolicyCurrent Allocation
2013 ALM Policy

2017 Asset Liability Management Workshop Attachment 1, Page 7 of 55
0%
3%
6%
9%
12%
15%
2% 4% 6% 8% 10% 12% 14%
Expe
cted
Ret
urn
(1-1
0 Yea
rs)
Expected Volatility
CMA Efficient Frontier +1 Standard Deviation - 1 Standard Deviation
Each Candidate Portfolio Represents a Range of Outcomes
Candidate A
Interim PolicyCurrent Allocation
2013 ALM Policy
Candidate BCandidate C
Candidate D

2017 Asset Liability Management Workshop Attachment 1, Page 8 of 55
0%
0%
0%
1%
1%
1%
0
20
40
60
80
100
120
140
160
180
200
Portf
olio
Valu
e
Down Market A B C D Equity Only
Scenario Analysis (Dot Com Crisis & Recovery)
Candidate Portfolios
Initial Funded Status
Mar. 2000 - Oct. 2007Cumulative Returns Annualized Returns Funded Status Δ Funded Status
A 64% 85% 8.4% 66% 2%B 66% 82% 8.2% 68% 2%C 68% 80% 8.0% 69% 1%D 70% 77% 7.8% 70% 0%
Equity Only 75% 44% 4.9% 61% -14%
• Analysis assumes no rebalancing.• The Funded Status calculation assumes a liability growth rate of 7.9%.

2017 Asset Liability Management Workshop Attachment 1, Page 9 of 55
0%
0%
0%
1%
1%
1%
0
20
40
60
80
100
120
140
160
180
Portf
olio
Valu
e
Down Market A B C D Equity Only
Scenario Analysis (Global Financial Crisis & Recovery)
Candidate Portfolios Initial Funded Status Nov. 2007 - Sep. 2017Cumulative Returns Annualized Returns Funded Status Δ Funded Status
A 64% 63% 5.0% 49% -15%B 66% 60% 4.9% 50% -16%C 68% 58% 4.7% 51% -17%D 70% 56% 4.6% 51% -19%
Equity Only 75% 53% 4.4% 54% -21%
• Analysis assumes no rebalancing.• The Funded Status calculation assumes a liability growth rate of 7.9%.

2017 Asset Liability Management Workshop Attachment 1, Page 10 of 55
Key Risk Considerations
Accepting investment risk will be rewarded Historic hierarchy of risk premia will be stable Short-term and long-term expected return variance Market valuation levels No certainty of any market outcome

2017 Asset Liability Management Workshop Attachment 1, Page 11 of 55
Pros/Cons Relative to Current Interim Policy TargetPortfolio +/- Context
A and B
+
• Shift to less speculative sources of return• Diversification of equity risk • Reduced volatility • Increased cash flow
-
• Exposure to interest rate risk• Reduced overall expected blended return• Discount rate reduction• Material transition activity required
C1
+• Maintain discount rate at the target 7% from December 2016 Board decision• Does not increase exposure to interest rate risk• Reduces transition activity
- • Retains current concentration of equity risk• Maintains current expected volatility and potential for contribution changes
D
+• Increased expected blended return• Supports increase in discount rate or maintain at 7% (December 2016 Board decision) with
a margin for adverse deviation
-• More equity risk concentration• Subject to more drawdown in an equity sell-off• Material transition activity required
1 Candidate Portfolio C is most similar to our current allocation and current path towards a 7% discount rate.

2017 Asset Liability Management Workshop Attachment 1, Page 12 of 55
Difference in Short and Long Term CMAsCurrent low real yield is primary driver of difference
• Source: Wilshire Associates

2017 Asset Liability Management Workshop Attachment 1, Page 13 of 55
0
10
20
30
40
50
60
$ Bi
llion
s
Fiscal Year
Historic & Projected PERF Cash Flow Analysis
Total Contribution & Investment Income Benefit Payments & Other Costs Total Contribution Investment Income
Total Fund Cash Flows are Improving
• Data Source: Historical information from Comprehensive Annual Financial Report (CAFR). Contribution estimates assume a 7% discount rate. Benefit Payments incorporate changes in actuarial assumptions to be presented in Finance and Administration Committee on 11/14/2017.
• Investment Income assumes implementation of “Candidate Portfolio C.” Investment income only includes income from Global Equity (dividends), Global Fixed Income (coupons) and Real Assets (rent).
• Other Costs include refunds, administrative costs of retirement and investment base fees.
2017 Asset Liability Management Workshop Attachment 1, Page 14 of 55
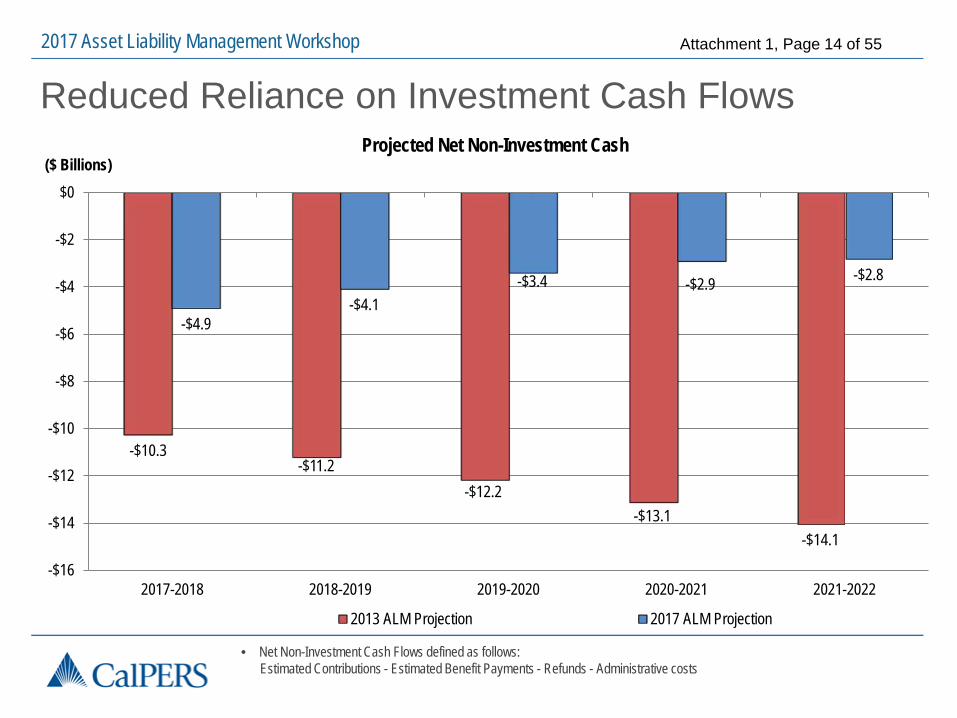
Reduced Reliance on Investment Cash Flows
• Net Non-Investment Cash Flows defined as follows: Estimated Contributions - Estimated Benefit Payments - Refunds - Administrative costs
-$10.3-$11.2
-$12.2-$13.1
-$14.1
-$4.9-$4.1
-$3.4 -$2.9 -$2.8
-$16
-$14
-$12
-$10
-$8
-$6
-$4
-$2
$0
2017-2018 2018-2019 2019-2020 2020-2021 2021-2022
($ Billions)Projected Net Non-Investment Cash
2013 ALM Projection 2017 ALM Projection

2017 Asset Liability Management Workshop Attachment 1, Page 15 of 55
2016 Vs. Today – Market Valuations
As of September 2016 As of September 2017
• Source: Pension Consulting Alliance

2017 Asset Liability Management Workshop Attachment 1, Page 16 of 55
Historical CAPE Measure
• Data Source: Stock Market Data Used in "Irrational Exuberance" Princeton University Press, Robert J. Shiller
0
5
10
15
20
25
30
35
40
45
CAPE
Rat
io
Cyclically Adjusted Price-to-Earnings Ratio (CAPE)
August 2017 CAPE = 31
1917 - 2017 Average CAPE = 17

2017 Asset Liability Management Workshop Attachment 1, Page 17 of 55
-5%
0%
5%
10%
15%
20%
CAPE ≤ 50% 50% < CAPE ≤ 70% 70% < CAPE ≤ 90% CAPE > 90%
Subs
eque
nt A
nnua
lized
Ave
rage
S&P
500
Tot
al Re
turn
3y5y7y10y
• CAPE data: September 1917 – August 2007• Data Source: Stock Market Data Used in "Irrational Exuberance" Princeton University Press, Robert J. Shiller
Historical CAPE and 3, 5, 7 and 10-year Subsequent Average S&P 500 Annualized Total Returns
CAPE as of August 2017is at 95th percentile
Starting CAPE PercentileCAPE ≤ 50% 50% < CAPE ≤ 70% 70% < CAPE ≤ 90% CAPE > 90%
2017 Asset Liability Management Workshop Attachment 1, Page 18 of 55
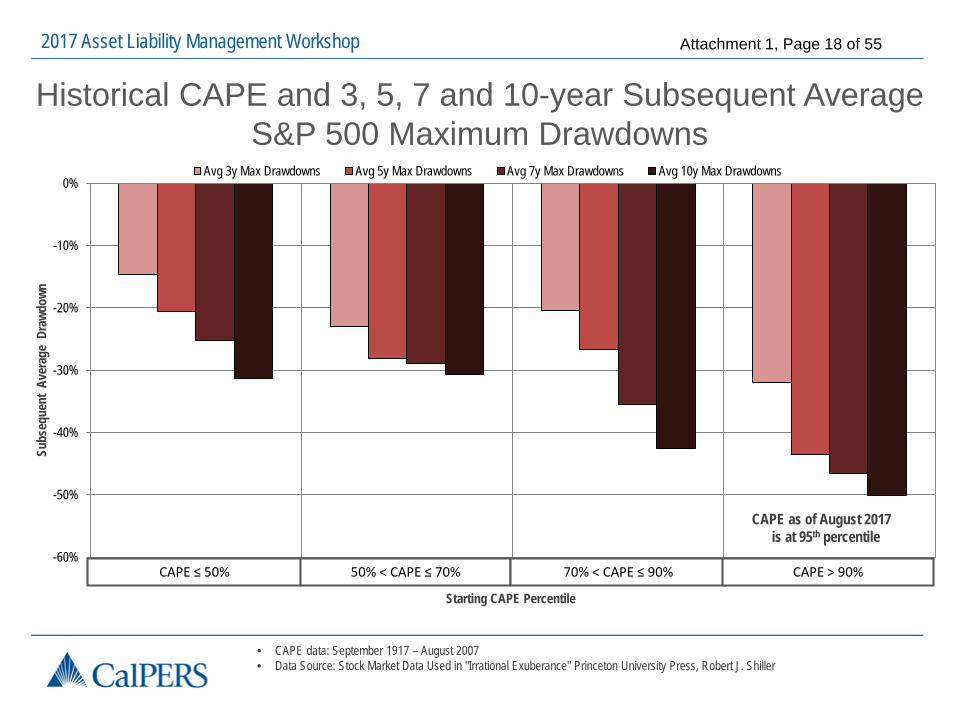
• CAPE data: September 1917 – August 2007 • Data Source: Stock Market Data Used in "Irrational Exuberance" Princeton University Press, Robert J. Shiller
Historical CAPE and 3, 5, 7 and 10-year Subsequent Average S&P 500 Maximum Drawdowns
-60%
-50%
-40%
-30%
-20%
-10%
0%
CAPE ≤ 50% 50% < CAPE ≤ 70% 70% < CAPE ≤ 90% CAPE > 90%
Subs
eque
nt A
vera
ge D
rawd
own
Avg 3y Max Drawdowns Avg 5y Max Drawdowns Avg 7y Max Drawdowns Avg 10y Max Drawdowns
CAPE as of August 2017is at 95th percentile
Starting CAPE Percentile
CAPE ≤ 50% 50% < CAPE ≤ 70% 70% < CAPE ≤ 90% CAPE > 90%

2017 Asset Liability Management Workshop Attachment 1, Page 19 of 55
Review of Actuarial Decision Factors

2017 Asset Liability Management Workshop Attachment 1, Page 20 of 55
2013 Vs. Today – Drivers of Lower Funded Ratio
2013 ALM 2017 ALM 2013 ALM 2017 ALM14.64% Compound Return for the Total Fund over the last 3 fiscal years:(FY2014-15: 2.41%; FY2015-16: 0.62%; FY2016-17: 11.18%)
7.50%
7.375%
7.25%
7.00%
6.7%
6.8%
6.9%
7.0%
7.1%
7.2%
7.3%
7.4%
7.5%
7.6%
FY 2012-13 FY 2017-18 FY 2018-19 FY 2019-20
Discount Rate for State
76%
68%
+1%+1%
-6%
-4%
60%
64%
68%
72%
76%
80%
6/30/2014 InvestmentReturnsminus
DiscountRate¹
DemographicExperience
ActuarialAssumption
Changes
DiscountRate Change
to 7%
6/30/2017(Estimate)
Attribution of Change in Funded Status

2017 Asset Liability Management Workshop Attachment 1, Page 21 of 55
2013 Vs Today – Drivers of Higher Contribution Rates
• Payroll estimated to grow at 2.75%
$10
$20
$30
$40
$50
$60
$70
$80
$90
$100
2016
-17
2017
-18
2018
-19
2019
-20
2020
-21
2021
-22
2022
-23
2023
-24
2024
-25
2025
-26
2026
-27
2027
-28
2028
-29
2029
-30
2030
-31
2031
-32
2032
-33
2033
-34
2034
-35
2035
-36
2036
-37
2037
-38
2038
-39
2039
-40
Cont
ribut
ions
Fiscal Year
Contribution Estimates
Contributions(2017 - 7.00%)
Contributions(2017 - 7.25%)
Contributions(2017 - 7.50%)
Contributions(2013 - 7.50%)
Payroll
($Billions)
2017 Asset Liability Management Workshop Attachment 1, Page 22 of 55
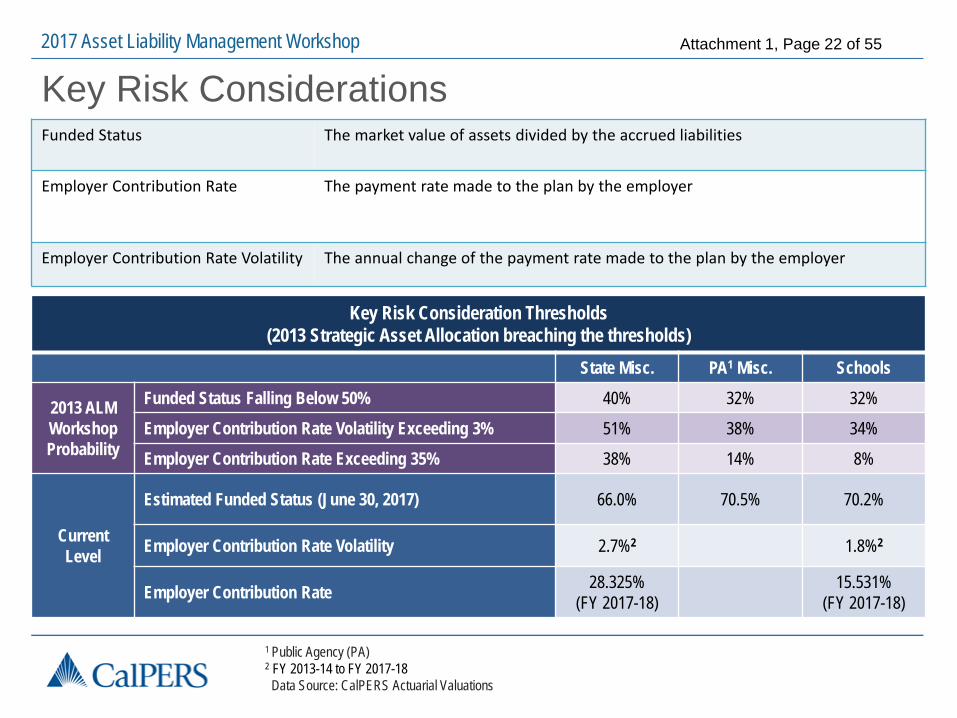
Key Risk Considerations
Key Risk Consideration Thresholds (2013 Strategic Asset Allocation breaching the thresholds)
State Misc. PA1 Misc. Schools
2013 ALM WorkshopProbability
Funded Status Falling Below 50% 40% 32% 32%
Employer Contribution Rate Volatility Exceeding 3% 51% 38% 34%
Employer Contribution Rate Exceeding 35% 38% 14% 8%
Current Level
Estimated Funded Status (June 30, 2017) 66.0% 70.5% 70.2%
Employer Contribution Rate Volatility 2.7%2 1.8%2
Employer Contribution Rate 28.325%(FY 2017-18)
15.531%(FY 2017-18)
1 Public Agency (PA)2 FY 2013-14 to FY 2017-18Data Source: CalPERS Actuarial Valuations
Funded Status The market value of assets divided by the accrued liabilities
Employer Contribution Rate The payment rate made to the plan by the employer
Employer Contribution Rate Volatility The annual change of the payment rate made to the plan by the employer

2017 Asset Liability Management Workshop Attachment 1, Page 23 of 55
Key Risk Considerations
Key Risk Consideration Thresholds (2013 Strategic Asset Allocation breaching the thresholds)
CHP1 PA2 Safety POFF3
2013 ALM Workshop Probability
Funded Status Falling Below 50% 40% 35% 35%
Employer Contribution Rate Volatility Exceeding 5% 46% 38% 33%
Employer Contribution Rate Exceeding 55% 64% 50% 45%
CurrentLevel
Estimated Funded Status (June 30, 2017) 58.8% 67.5% 64.1%
Employer Contribution Rate Volatility 6.7%4 4.7%4
Employer Contribution Rate 52.785%(FY 2017-18)
42.598%(FY 2017-18)
1 California Highway Patrol (CHP)2 Public Agency (PA)
Data Source: CalPERS Actuarial Valuations
Funded Status The market value of assets divided by the accrued liabilities
Employer Contribution Rate The payment rate made to the plan by the employer
Employer Contribution Rate Volatility The annual change of the payment rate made to the plan by the employer
3 Peace Officers and Fire Fighters (POFF)4 FY 2013-14 to FY 2017-18

2017 Asset Liability Management Workshop Attachment 1, Page 24 of 55
ALM Model Building Blocks Starting Point
• Assets and Liabilities at June 30, 2016• Benefit payments for FY 2016-2017• Contributions for FY 2016-2017• Investment return for FY 2016-17 (11.2%)
Liability Projection for 30 Years• Liabilities projected for each discount rate• Open Group (New members join in future years)
Asset Projection for 30 Years • For each discount rate 5,000 investment return paths over 30
years are randomly simulated

2017 Asset Liability Management Workshop Attachment 1, Page 25 of 55
Discount Rate Determination
Asset Class Source Period Number of Years
Global Equity S&P 500 1926 – 2016 90 years
Fixed Income US AggregateBond Index
1926 – 2016 90 years
Real Assets Average REIT 1972 – 2016 44 years
Starting Point CMAs Year 1 to 10 (short term) CMAs Year 10 and Beyond (long term)
• Foundation of CMAs Year 10 and Beyond is long term average per asset class
• Examples of historical measures used:

2017 Asset Liability Management Workshop Attachment 1, Page 26 of 55
Discount Rate Determination (continued) Based on Blended CMA rates and projected Cash Flows
Portfolio Discount Rate1 Volatility
A 6.50% 9.1%
B 6.75% 10.2%
C 7.00% 11.4%
D 7.25% 12.8%
1 Does not include any provision for adverse deviation.
2017 Asset Liability Management Workshop Attachment 1, Page 27 of 55
Generating Investment Return Paths Develop Expected Returns & Volatility
• For first 10 years• For years 11 and beyond
- Performed for each potential candidate portfolio
Generate 30 Year simulations using statistical modeling techniques• 5,000 paths generated for each potential discount rate

2017 Asset Liability Management Workshop Attachment 1, Page 28 of 55
ALM Model Improvements since 2013Simulations Reflect Mean Reversion Capital market annual returns are not independent and
identically distributed (IID)
Simulations consistent with historical market returns reflecting negative serial correlation
Realistic long-term investment scenarios• Overly optimistic/pessimistic scenarios removed

2017 Asset Liability Management Workshop Attachment 1, Page 29 of 55
Historical Returns Exhibit Mean Reversion
Years

2017 Asset Liability Management Workshop Attachment 1, Page 30 of 55
Simulations with Mean Reversion
-30.0%
-20.0%
-10.0%
0.0%
10.0%
20.0%
30.0%
40.0%
0 5 10 15 20 25 30Series6 Series7 Series4 Series3 Series1 Series2 Series5 Series8 Series9 top line bottom line around mean tight to me an
Simulated Annual Investment Returns
Years

2017 Asset Liability Management Workshop Attachment 1, Page 31 of 55
ALM Model ResultsCost vs. Volatility Trade-off

2017 Asset Liability Management Workshop Attachment 1, Page 32 of 55
State Miscellaneous

2017 Asset Liability Management Workshop Attachment 1, Page 33 of 55
Schools

2017 Asset Liability Management Workshop Attachment 1, Page 34 of 55
Public Agency Miscellaneous

2017 Asset Liability Management Workshop Attachment 1, Page 35 of 55
Average Employer Contribution Rates Over Next 30 years (percentage of payroll)

2017 Asset Liability Management Workshop Attachment 1, Page 36 of 55
State Peace Officers and Fire Fighters (POFF)

2017 Asset Liability Management Workshop Attachment 1, Page 37 of 55
California Highway Patrol (CHP)

2017 Asset Liability Management Workshop Attachment 1, Page 38 of 55
Public Agency Safety

2017 Asset Liability Management Workshop Attachment 1, Page 39 of 55
Average Employer Contribution Rates Over Next 30 yrs (percentage of payroll)

2017 Asset Liability Management Workshop Attachment 1, Page 40 of 55
CalPERS Pension Beliefs Pension Belief 4
A retirement plan should…have professionally managed funds with a long-term horizon, and incorporate pooled investments and pooled risks
Pension Belief 5Funding policies should be applied in a fair, consistent manner, accommodate investment return fluctuations and support rate stability
Pension Belief 7Retirement system decisions must give precedence to the fiduciary duty owed to members, but should also consider the interests of other stakeholders

2017 Asset Liability Management Workshop Attachment 1, Page 41 of 55
Recap and Next Steps

2017 Asset Liability Management Workshop Attachment 1, Page 42 of 55
2017-18 ALM Timeline
Review Actuarial Assumptions and Methods
2017 2018
Tuesday, November 14th
Finance & Administration Committee
Monday, November 13th
Board Meeting
Adopt Actuarial Assumptions and Methods for Ratifications by the Board
Select Strategic Policy Portfolio
Tuesday, December 19th
Finance & Administration Committee
Adopt Discount Rate for Ratifications by the Board
Wednesday, December 20th
Board of Administration Meeting
Review Transition and Implementation Plan
Monday, February 12th
Investment Committee
Review Amendments to Statement of Investment Policy
Adopt Strategic Asset Allocation for Ratifications by the Board
Monday, December 18th
Investment CommitteeAsset Liability Management Workshop

2017 Asset Liability Management Workshop Attachment 1, Page 43 of 55
AppendixAsset Liability Management Related Activities – Workshop and Open Session
Jul 2015 Offsite Workshop - Investment Portfolio PrioritiesJul 2015 Offsite Workshop – Investment BeliefsSep 2015 Investment Committee – Investment Beliefs Implementation FindingsNov 2015 Investment Committee Workshop – Private EquityJan 2016 Offsite Workshop - Investment Portfolio Priorities (three identified)Apr 2016 Investment Committee – Private Asset Class Roles and BenchmarksMay 2016 Investment Committee – Private Asset Class Roles and BenchmarksJun 2016 Investment Committee – Interim Asset Allocation Targets ReviewJul 2016 Offsite Workshop – Investment Portfolio Priorities (EDHEC Risk Factor review, Benchmark review)Sep 2016 Investment Committee - Risk reductionNov 2016 Finance and Administration Committee – Securing CalPERS Future – Managing Funding Risks, Stakeholder Outreach and EngagementDec 2016 Finance and Administration Committee Workshop – Securing CalPERS Future – Managing Funding Risks, Stakeholder Outreach and
Engagement (Phase in discount rate reduction to 7%)
Apr 2017 Investment Committee – Private Asset Class Roles and BenchmarksMay 2017 Investment Committee – Private Asset Class Roles and BenchmarksJun 2017 Investment Committee – Adoption of Capital Markets AssumptionsJul 2017 Offsite Workshop – Use of Leverage in Strategic Asset Allocation

2017 Asset Liability Management Workshop Attachment 1, Page 44 of 55
Investment Portfolio Priorities Specific to CalPERS, implementable, and will influence portfolio construction:
1. Protect the Funded Ratio
(mitigate severe drawdowns)
2. Stabilize Employer Contribution Rates
(manage overall volatility)
3. Achieve Long-term Required Rate of Return
(over the long run, but not in every market environment)
“Asset allocation is the dominant determinant of portfolio risk and return”
Investment Belief 6

2017 Asset Liability Management Workshop Attachment 1, Page 45 of 55
Asset Liability Decision-Making Framework
Contribution Rate
Funded Status
Contribution Rate Volatility
OUTPUTS
Decision Framework
Investment Landscape
Plan Specification
Actuarial Parameters
INPUTS

2017 Asset Liability Management Workshop Attachment 1, Page 46 of 55
Short Name Investment Belief
1 Liabilities Liabilities must influence the asset structure.
2 Long-Term Horizon A long time investment horizon is a responsibility and an advantage.
3 Stakeholders CalPERS investment decisions may reflect wider stakeholder views.
4 Three Forms of Capital Long-term value creation requires effective management of three forms of capital: financial, physical, and human.
5 Accountability CalPERS must articulate its investment goals and performance measure and ensure clear accountability for their execution.
6 Strategic Allocation Strategic asset allocation is the dominant determinant of portfolio risk and return.
7 Risk Reward CalPERS will take risk only where we have a strong belief we will be rewarded.
8 Costs Matter Costs matter and need to be effectively managed.
9 Multi-faceted Risk Risk of CalPERS is multi-faceted and not fully captured through measures such as volatility or tracking error.
10 Resources / Process Strong processes and teamwork and deep resources are needed to achieve CalPERS’ goals and objectives.
ALM Objectives Reflect Investment Beliefs

2017 Asset Liability Management Workshop Attachment 1, Page 47 of 55
Asset Class Roles & BenchmarksGlobal Equity
• Role: Total return oriented and to capture the equity risk premium (ERP), defined as the excess return over risk-free Government Bonds, by means of ownership risk in companies and exposure to corporate earnings growth. The major driver is appreciation, with some cash yield.• Growth• Liquidity
• Benchmark: Global All-World All Capitalization
Private Equity• Role: Enhance equity returns through an active, value-added approach. The major driver for
returns is appreciation, aided by leverage, with negligible cash yield.• Growth
• Benchmark: Global All-World All Capitalization + Return Premium

2017 Asset Liability Management Workshop Attachment 1, Page 48 of 55
Asset Class Roles & Benchmarks - ContinuedGlobal Fixed Income
• Role: Serve as an economic diversifier to equity risk and be a reliable source of income.• Diversification• Income• Liquidity
• Benchmark: 90% Long Liabilities + 10% International Fixed Income Index
Real Assets• Role: Own real assets with stable cash yield and act as an economic diversifier to equity risk.
• Diversification• Income• Inflation
• Benchmark: U.S. Core Fund Index

2017 Asset Liability Management Workshop Attachment 1, Page 49 of 55
Asset Class Roles & Benchmarks - ContinuedInflation Assets
• Role: Provide strong liquid protection against inflation.• Inflation• Liquidity
• Benchmark: 75% Inflation Linked Bond + 25% Commodities
Liquidity• Role: Exhibit safety and capital preservation properties.
• Liquidity
• Benchmark: 91 Day Treasury Bill

2017 Asset Liability Management Workshop Attachment 1, Page 50 of 55
Common Factors for Liabilities & Assets
$1
$2
$3
$4
1987 1992 1997 2003 2008 2014
$ Gro
wth
Valuation YearPERF Payroll Growth Inflation Growth CA GDP Growth
• Data Source: CalPERS Comprehensive Annual Financial Reports and Bloomberg

2017 Asset Liability Management Workshop Attachment 1, Page 51 of 55
Asset Class Arithmetic Return
CompoundReturn
Volatility(Std. Dev)
Correlation Constraints (%)
GlobalEquity
Private Equity
FixedIncome
Real Asset
Inflation Asset Liquidity Floor Cap
Global Equity 8.14% 6.80% 17.00% 1.00 0.81 0.01 0.59 0.39 0.00 0% 100%
Private Equity 11.26% 8.30% 25.50% 0.81 1.00 0.00 0.48 0.33 0.00 5% 8%
Fixed Income 3.21% 3.00% 6.58% 0.01 0.00 1.00 0.09 0.40 0.31 15% 100%
Real Asset 6.49% 5.75% 12.55% 0.59 0.48 0.09 1.00 0.21 0.00 9% 13%
Inflation Asset 3.08% 2.77% 8.00% 0.39 0.33 0.40 0.21 1.00 0.08 0% 12%
Liquidity 2.00% 2.00% 1.00% 0.00 0.00 0.31 0.00 0.08 1.00 1% 100%
U.S. Inflation Assumption: 2.00%
2017 Capital Market Assumptions

2017 Asset Liability Management Workshop Attachment 1, Page 52 of 55
0.0
10.0
20.0
30.0
40.0
50.0
60.0
$ Bi
llion
s
Fiscal Year
Historic & Projected PERF Cash Flow Analysis in 2013
Total Contributions & Investment Income Benefit Payments & Other Costs
PotentialShortfall
Cash Flows with 7.5% Discount Rate and 2013 Allocation
• Investment Income has an assumed cash yield of 2.37% based on PERF policy asset allocation.• Investment income only includes income from Global Equity (dividends), Global Fixed Income (coupons),
and Real Assets (rent).• Other Costs include refunds, administrative costs of retirement, and investment base fees
2017 Asset Liability Management Workshop Attachment 1, Page 53 of 55
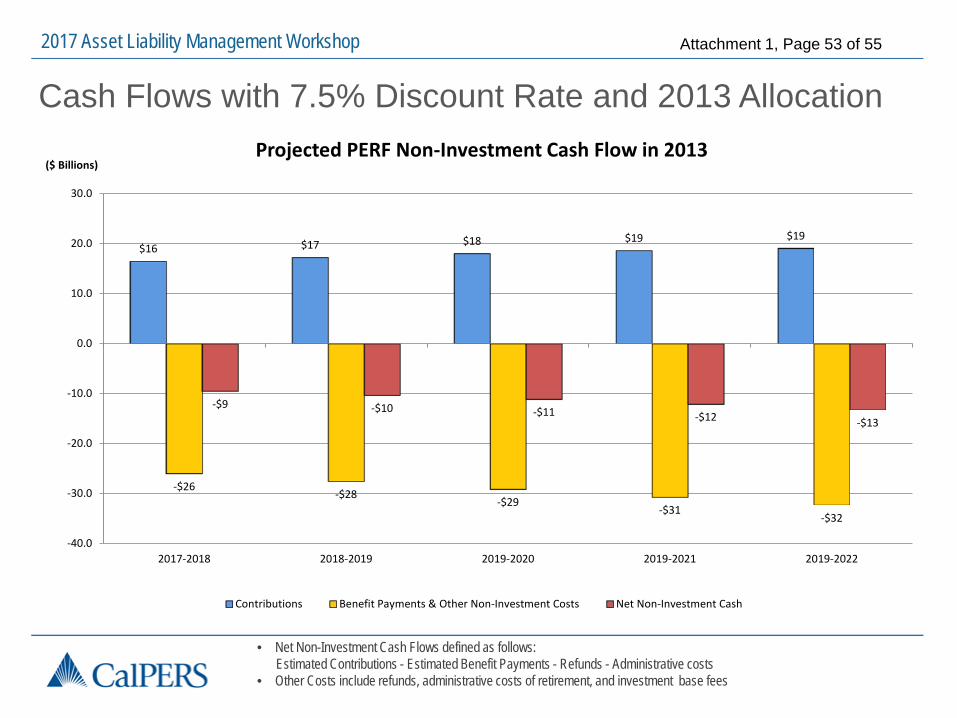
Cash Flows with 7.5% Discount Rate and 2013 Allocation
$16 $17 $18 $19 $19
-$26-$28
-$29-$31
-$32
-$9 -$10 -$11 -$12 -$13
-40.0
-30.0
-20.0
-10.0
0.0
10.0
20.0
30.0
2017-2018 2018-2019 2019-2020 2019-2021 2019-2022
($ Billions)Projected PERF Non-Investment Cash Flow in 2013
Contributions Benefit Payments & Other Non-Investment Costs Net Non-Investment Cash
• Net Non-Investment Cash Flows defined as follows: Estimated Contributions - Estimated Benefit Payments - Refunds - Administrative costs
• Other Costs include refunds, administrative costs of retirement, and investment base fees

2017 Asset Liability Management Workshop Attachment 1, Page 54 of 55
Contribution, Benefit Payments and Investment Income 2013 and Today
• Data Source: 2013 and 2017 Contribution and Benefit Payments are from ACTO.• Investment Income assumes implementation of “Candidate Portfolio C.” Investment income only includes income from
Global Equity (dividends), Global Fixed Income (coupons), and Real Assets (rent).
$0
$10
$20
$30
$40
$50
$60
$ Billi
ons
Fiscal Year
Total PERF Benefit Payments (2017) Total PERF Contributions (2017) Est. Investment Income (2017)Total PERF Benefit Payments (2013) Total PERF Contributions (2013) Est. Investment Income (2013)

2017 Asset Liability Management Workshop Attachment 1, Page 55 of 55
Stability of Investment IncomeRealized Investment Income and Total Return
$6.3 $6.5$7.3 $7.1
18%
2%
1%
11%
0
2
4
6
8
10
12
14
16
18
20
$0
$2
$4
$6
$8
$10
$12
$14
$16
$18
$20
FY13/14 FY14/15 FY15/16 FY16/17
Inve
stm
ent T
otal
Retu
rn (%
)
Inve
stm
ent i
ncom
e
Investment Income (LHS) Fund Total Return (RHS)
• Investment income defined as cash income from:Global Equity (dividends), Global Fixed Income (coupons), Real Assets (rent)
($ Billions)