2017 - american council on · pdf filemapping internationalization on u.s. campuses: 2017...
TRANSCRIPT

100 Years of Leadership and Advocacy
2017EDITION
Mapping Internationalization on U.S. Campuses

ACE and the American Council on Education are registered marks of the American Council on Education and may not be used or reproduced without the express written permission of ACE.
American Council on EducationOne Dupont Circle NWWashington, DC 20036
© 2017. All rights reserved. No part of this publication may be reproduced or transmitted in any form or by any means electronic or mechanical, including photocopying, recording, or by any information storage and retrieval system, with-out permission in writing from the publisher.
100 Years of Leadership and Advocacy

Mapping Internationalization on U.S. Campuses: 2017 Edition
Robin Matross HelmsDirector
Center for Internationalization and Global Engagement
Lucia BrajkovicSenior Research Specialist
Center for Internationalization and Global Engagement
Data analysis by:Brice Struthers
Associate Academic Innovation SpecialistCenter for Education Attainment and Innovation

About the Sponsor
ACE is grateful for the generous support of Navitas, which sponsored the production of this report and the dissemination of the Mapping findings.
For more than 20 years, Navitas has partnered with more than 30 universities worldwide to increase interna-tional students’ access to higher education and prepare them for future success. Through these partnerships, Navitas endeavors to help institutions:
• Transform enrollment by recruiting, transitioning, and retaining a greater number and more diverse community of international students;
• Raise the institution’s global profile and increase its international competitiveness;
• Enhance the international and domestic student experience and broaden global perspectives across the entire campus community and beyond;
• Increase the probability of success for international students by developing specialized acclimation and transition programs; and
• Generate significant and sustainable new revenue streams for reinvestment in key areas of the institu-tion.
Navitas’ North American university partners include Simon Fraser University (Canada), University of Manitoba (Canada), University of Massachusetts Lowell, University of Massachusetts Dartmouth, University of Massachu-setts Boston, University of New Hampshire, Florida Atlantic University, University of Idaho, and Richard Bland College of William and Mary (VA). More information can be found at www.navitas.com.
About the Center for Internationalization and Global Engagement
ACE’s Center for Internationalization and Global Engagement (CIGE) helps institutions develop and sustain comprehensive, effective internationalization programs that increase global engagement for students, faculty and staff. We believe effective internationalization goes beyond traditional study abroad programs and interna-tional student enrollment. It requires a comprehensive institutional commitment that also includes curriculum, research, faculty development, and active strategies for institutional engagement. In addition, CIGE monitors and analyzes global trends in higher education in cooperation with other education associations around world.

ContentsAcknowledgments . . . . . . . . . . . . . . . . . . . . . . . . . . . . . . . . . . . . . . . . . . . . . . . . . . . . . . . . . . . . . . . . . . . . . . . . . . . . . . v
Executive Summary . . . . . . . . . . . . . . . . . . . . . . . . . . . . . . . . . . . . . . . . . . . . . . . . . . . . . . . . . . . . . . . . . . . . . . . . . . . . . vii
Introduction . . . . . . . . . . . . . . . . . . . . . . . . . . . . . . . . . . . . . . . . . . . . . . . . . . . . . . . . . . . . . . . . . . . . . . . . . . . . . . . . . . 1
The Survey Findings . . . . . . . . . . . . . . . . . . . . . . . . . . . . . . . . . . . . . . . . . . . . . . . . . . . . . . . . . . . . . . . . . . . . . . . . . . . . . 5
Articulated Institutional Commitment . . . . . . . . . . . . . . . . . . . . . . . . . . . . . . . . . . . . . . . . . . . . . . . . . . . . . . . . . . . . . 7
Administrative Leadership, Structure, and Staffing . . . . . . . . . . . . . . . . . . . . . . . . . . . . . . . . . . . . . . . . . . . . . . . . . . . . 10
Curriculum, Co-curriculum, and Learning Outcomes . . . . . . . . . . . . . . . . . . . . . . . . . . . . . . . . . . . . . . . . . . . . . . . . . . . . 14
Faculty Policies and Practices . . . . . . . . . . . . . . . . . . . . . . . . . . . . . . . . . . . . . . . . . . . . . . . . . . . . . . . . . . . . . . . . . . 20
Student Mobility . . . . . . . . . . . . . . . . . . . . . . . . . . . . . . . . . . . . . . . . . . . . . . . . . . . . . . . . . . . . . . . . . . . . . . . . . . . 25
Collaboration and Partnerships . . . . . . . . . . . . . . . . . . . . . . . . . . . . . . . . . . . . . . . . . . . . . . . . . . . . . . . . . . . . . . . . . 32
Looking Forward . . . . . . . . . . . . . . . . . . . . . . . . . . . . . . . . . . . . . . . . . . . . . . . . . . . . . . . . . . . . . . . . . . . . . . . . . . . . . . . 38
References . . . . . . . . . . . . . . . . . . . . . . . . . . . . . . . . . . . . . . . . . . . . . . . . . . . . . . . . . . . . . . . . . . . . . . . . . . . . . . . . . . . 41
Appendix: Methodology . . . . . . . . . . . . . . . . . . . . . . . . . . . . . . . . . . . . . . . . . . . . . . . . . . . . . . . . . . . . . . . . . . . . . . . . . . 43


American Council on Education v
AcknowledgmentsThe authors gratefully acknowledge the contributions of a number of colleagues to this report. Jermain Griffin, Heather Ward, Brad Farnsworth, Barbara Hill, Lisa Motley, and other staff in the American Council on Edu-cation (ACE) Center for Internationalization and Global Engagement assisted with survey design and report editing, and provided intellectual and moral support throughout the project.
Jonathan M. Turk in ACE’s Center for Policy Research and Strategy guided data analysis, and helped ensure that our narrative accurately reflects the numbers. Ronald Matross provided valuable advice on question formulation and survey design. An intrepid group of George Washington University (DC) graduate students assisted with data entry: Arielle Gousse, Richard Owens, Erya Zhao, and Joy Zhou. Manuel S. González Canché, associate professor at the University of Georgia, supplied additional expertise on data analysis techniques, while Chris R. Glass, assistant professor at Old Dominion University (VA), brought a crucial scholarly and practitioner perspective to the editing process.
Lindsay Addington, Rahul Choudaha, Clay Hensley, Yoko Kono, and Dawn Michele Whitehead wrote text for “Related Research” boxes featured in the report. Their contributions complement the report’s findings and add valuable detail to the overall picture of internationalization painted by the data.
ACE’s J’Nai Baylor and Sujay Bharati helped with list management and survey distribution. Sarah Zogby and Ally Hammond brought their considerable creativity and expertise to bear on the design of the report, while the rest of ACE’s Publications team corrected our typos and inelegant language. Former ACE colleagues Patti McGill Peterson, Christopher J. Nellum, Lucia Greve, and Prashant Shrestha also contributed to the project.
Finally, this report would not be possible without the individuals who completed the Mapping Survey on behalf of the 1,164 participating colleges and universities—we are deeply appreciative of their time and insights.


American Council on Education vii
Executive SummaryMapping Internationalization on U.S. Campuses is a signature project of the American Council on Education (ACE) Center for Internationalization and Global Engagement (CIGE). Conducted every five years, Mapping assesses the current state of internationalization at American colleges and universities, analyzes progress and trends over time, and identifies future priorities.
The 2016 Mapping Survey—like the three previous iterations—addressed the six key areas that make up the CIGE Model for Comprehensive Internationalization: articulated commitment; administrative structures and staffing; curriculum, co-curriculum, and learning outcomes; faculty policies and practices; student mobility; and collaboration and partnerships. Key findings include:
• Institutions are optimistic about their internationalization progress. Nearly three-quarters (72 per-cent) of respondents indicated that internationalization accelerated in recent years, and the propor-tion of institutions reporting “high” or “very high” levels of internationalization rose from just over one-fifth in 2011 to 30 percent in 2016.
• Internationalization is increasingly an administrative-intensive endeavor, coordinated by a single office and/or a senior international officer. More institutions are implementing policies, procedures, and planning processes to guide internationalization efforts.
• In-house models dominate when it comes to resources for internationalization and the management of activities and programs. However, a notable proportion of institutions are also engaging with outside entities (e.g., third-party program providers, funders, and international partners) to further support and supplement internal efforts.
• While student mobility has consistently been a focus of internationalization efforts, the 2016 data indicate an increasingly sharp emphasis on this area relative to other aspects of internationalization. This is reflected in stated priorities, as well as resource allocations for education abroad and interna-tional student recruiting—including a marked increase in the percentage of institutions that engage overseas student recruiters. The level of support international students receive once they arrive on campus, while trending upward, remains a concern.
• Though the curriculum and co-curriculum take a backseat to student mobility in terms of stated priorities for internationalization, an increasing percentage of institutions are implementing aca-demic and co-curricular policies and programming that facilitate on-campus global learning on a broader scale and among a broader base of students.
• More institutions are offering internationally focused professional development opportunities for faculty; however, still only about one in 10 specify international engagement as a consideration in pro-motion and tenure decisions. Overall, the faculty-related data raise questions about the recognition of faculty as key drivers of internationalization.
• International partnerships and activities abroad are garnering increased attention, energy, and support on many campuses. However, there is still a wide spectrum in terms of activity levels, as well as the extent of planning and intentionality surrounding global engagement.

viii Mapping Internationalization on U .S . Campuses: 2017 Edition
• Consistent with the 2001, 2006, and 2011 data, there are notable differences by Carnegie Classifica-tion in terms of internationalization progress and focus. While doctoral institutions continue to lead overall, a number of indicators suggest that their progress has plateaued in certain areas. Associate and special focus institutions, in contrast, have seen considerable advances in many areas, particularly when it comes to the curriculum.
Finer-grained data on the practice of internationalization—as operationalized through policies, programs, and activities—shed additional light on the realities of how internationalization is playing out on campuses, and paint a more complex picture when it comes to progress and trends over time. Mirroring the structure of the survey instrument, subsequent sections of this report explore in detail the data for each pillar of the CIGE Model for Comprehensive Internationalization, and their implications for the overall state of internationalization nationwide. Notable differences by Carnegie Classification are included as relevant on an indicator-by-indicator basis.
New in 2017, the report includes additional analyses for different segments of U.S. higher education, as well as information about studies conducted by ACE and other organizations that complement the Mapping Survey data. The conclusion summarizes the overall landscape of internationalization, offers suggestions for additional research, and highlights areas—in particular, the curriculum and faculty professional development—that require additional attention and effort as institutions pursue a comprehensive approach to internationalization.

American Council on Education 1
IntroductionWelcome to the 2017 edition of Mapping Internationalization on U.S. Campuses.
Now in its fourth iteration, Mapping is the only comprehensive study of U.S. higher education internationaliza-tion. Conducted every five years, it assesses the current state of internationalization at American colleges and universities, analyzes progress and trends over time, and identifies future priorities. The Mapping Survey is administered to colleges and universities nationwide, representing all sectors of U.S. higher education.
With data spanning two decades, Mapping is the signature research project of ACE’s Center for Internation-alization and Global Engagement (CIGE). CIGE provides in-depth analysis of critical international education issues and administers programs and services to support higher education institutions’ internationalization and global engagement strategies.
A core principle underpinning CIGE’s research and programs is “comprehensive internationalization,” defined by CIGE as “a strategic, coordinated process that seeks to align and integrate international policies, programs, and initiatives, and positions colleges and universities as more globally oriented and internationally connected institutions.” This process requires a clear commitment by top-level institutional leaders, meaningfully impacts the curriculum and a broad range of stakeholders, and results in deep and ongoing incorporation of interna-tional perspectives and activities throughout the institution.
The Mapping study is structured around the CIGE Model for Comprehensive Internationalization, illustrated in Figure 1, which consists of six pillars delineating key areas that together constitute a comprehensive interna-tionalization approach:
• Articulated institutional commitment: Mission statements; strategic plans; funding allocation; for-mal assessment mechanisms
• Administrative structure and staffing: Reporting structures; staff and office configurations
• Curriculum, co-curriculum, and learning outcomes: General education and language requirements; co-curricular activities and programs; specified student learning outcomes
• Faculty policies and practices: Hiring guidelines; tenure and promotion policies; faculty development opportunities
• Student mobility: Education abroad programs; international student recruitment and support
• Collaboration and partnerships: Institutional partnerships; joint degree and dual/double degree pro-grams; branch campuses; other offshore programs

2 Mapping Internationalization on U .S . Campuses: 2017 Edition
Figure 1. CIGE Model for Comprehensive Internationalization
COMPREHENSIVE INTERNATIONALIZATION
Articulated institutional commitment
Administrativeleadership,
structure, and staffi ng
Curriculum, co-curriculum, and
learning outcomes
Faculty policies and practices
Studentmobility
Collaboration and partnerships
An important feature of the CIGE Model is the arrow that runs along the bottom, illustrating the interconnect-edness of the individual pillars. Progress (or lack thereof) in one area impacts what can be achieved in the others. Previous Mapping reports—and subsequent sections of this one—explore these interconnections, as well as the implications of data in one pillar in terms of potential opportunities and challenges in other areas.
Institutions’ approaches to internationalization are—and should be—different based on their unique circum-stances and goals. However, a broad examination across these categories at colleges and universities nation-wide provides a useful picture of collective progress toward the ideal of comprehensive internationalization, recent successes and emerging challenges, and areas that merit a sharper focus by institutions, as well as policymakers, researchers, and practitioners in the international education field.

American Council on Education 3
The 2016 SurveyIn a longitudinal survey project, a key challenge is to maintain a balance between the consistency that allows for meaningful comparisons over time, and updates that reflect new issues and developments in the field. For the 2016 Mapping Survey, we sought this balance by maintaining the basic structure of the survey, based on the CIGE Model for Comprehensive Internationalization, but refining the wording of certain questions, eliminating items that were no longer relevant, and adding new content to address emerging topics of interest. Noteworthy changes include:
• We used the term “education abroad” instead of “study abroad.” Sometimes accepted terminology seems to change just for the sake of change, but in this case we think the nuances are important. “Education abroad” accounts for service learning, internships, research experiences, and other non-classroom-based activities that take students to other countries and contribute to their learning and development. We also asked specific questions to gauge the prevalence and priority of these various education abroad activities.
• Our questions about international engagement and partnerships were more detailed. In 2001, rela-tionships with counterparts abroad were barely on the internationalization radar for most institutions. Now, though, partnerships are much more common, and many colleges and universities are focusing on how best to utilize these arrangements to advance institutional priorities. Among other related issues, the new survey addressed strategic planning for partnerships; whether institutions have a phys-ical presence in another country and what form it takes; and whether they have created a partnership director position to manage global engagement activities.
• We disaggregated information on funding trends by source. A somewhat surprising finding from the last Mapping Survey was that between 2006 and 2011—a time when the recession was wreaking havoc on campus budgets nationwide—overall funding for internationalization remained relatively stable. In the 2016 survey, we sought to better understand the funding mix that underpins internation-alization initiatives, including internal institutional support, government (state, federal, and interna-tional) grants, alumni giving, and other private donations, as well as how these funding levels have changed in recent years.
• The survey addressed emerging support structures for international students. To supplement questions about academic support structures and co-curricular activities, we added questions about in-tensive English and “pathway” programs, which are gaining visibility as a way to smooth international students’ transition to the United States and facilitate academic and social integration.
Perhaps most importantly, we streamlined the survey and avoided asking respondents to provide information that is available from other sources. Rather than reinventing the wheel, we have incorporated relevant addi-tional data into subsequent sections of this report.
Data collection was a multistage process. We initially sent the Mapping Survey to chief academic officers/provosts in February 2016. Throughout the subsequent nine months, we followed up with senior international officers, institutional researchers, and presidents. In the end, we received a total of 1,164 valid survey responses from colleges and universities nationwide, for an overall response rate of 39.5 percent—the highest ever across the four iterations of the survey, both in terms of the number of surveys received and the response rate.

4 Mapping Internationalization on U .S . Campuses: 2017 Edition
About This Report
1 The Integrated Postsecondary Education Data System (IPEDS) is a system of interrelated surveys conducted annually by the National Center for Education Statistics (NCES), a part of the Institute of Education Sciences within the U.S. Department of Education: https://nces.ed.gov/ipeds.
In presenting the Mapping findings, we start with the key takeaways—the overall conclusions that result from a broad analysis across the full spectrum of data. From there, we drill down into the more nuanced data in each area of the CIGE Model, and examine the specifics of how particular aspects of internationalization are playing out on college and university campuses.
Finally, we look toward the future, and consider the implications of the 2016 data in terms of where interna-tionalization is headed, and which areas merit additional attention, resources, and research; as part of this analy-sis, we also consider recent political developments and the overall climate for internationalization efforts.
Throughout the report we have included feature boxes with additional information that supplements the pri-mary narrative:
• “Sector Snapshot” boxes provide summaries of the 2016 data for particular segments of U.S. higher education. As in past Mapping reports, we highlight variations by Carnegie Classification throughout the report. For this edition, however, we also analyzed differences along other dimensions, as defined by IPEDS1: minority serving, control (public versus private), and “urbanicity” (city, suburb, town, rural).
• “Data Drill-Down” boxes highlight follow-on research to the 2011 Mapping Survey that further ex-plores key findings of the previous study. Topics include internationalization of tenure and promotion policies, joint and dual degree programs, and good practices for international partnerships.
• “Related Research” boxes complement the data with relevant information from studies conducted by other organizations and experts in the international education field. They are intended to help us map internationalization beyond what is captured in our own research, and add additional detail to the overall internationalization picture.
In addition:
• The report’s Appendix provides additional methodological details of the study, including survey distribution strategies and data analysis techniques. As in previous iterations, we weighted the data so that it represents the overall makeup of U.S. higher education by Carnegie Classification; the Appendix also explains our weighting scheme.
• The full Mapping Survey data set in table format—2016 data by Carnegie Classification and longitu-dinal comparisons across the four iterations of the survey—are available online at www.acenet.edu/mapping.
The Mapping report is intended to serve a variety of purposes for different audiences. For on-campus inter-nationalization leaders and practitioners, it provides a basis for benchmarking, and understanding how their institutions compare to counterparts nationwide. CIGE uses the findings to inform our research agenda and programmatic content in subsequent years; by highlighting key topics for further exploration, our hope is that other organizations, researchers, and practitioners will contribute to follow-on research and activities as well. Most broadly, Mapping represents a key contribution by ACE to national and international policy conversa-tions aimed at advancing the internationalization agenda both in the U.S. and around the world.

American Council on Education 5
The Survey FindingsAt the broadest level, the 2016 Mapping Survey data indicate that internationalization continues to gain momentum among U.S. colleges and universities. In terms of the pace of progress, nearly three-quarters (72 per-cent) of respondents indicated that internationalization accelerated in recent years, compared to 64 percent in 2011. And as illustrated in Figure 2, the proportion of institutions reporting “high” or “very high” levels of internationalization increased from just over one-fifth in 2011 to 29 percent in 2016. The percentage indicating “low” or “very low” internationalization levels, in contrast, fell 11 percentage points since the last iteration of the survey.
Figure 2. Reported overall level of institutional internationalization in recent years
2011
2016
Very lowLowModerateHighVery high
6
8
15
21
35
37
22
20
22
13
As in 2011, “improving student preparedness for a global era” is front and center among institutions’ reasons for internationalizing, followed by “diversifying students, faculty, and staff at the home campus,” and “be-coming more attractive to prospective students at home and overseas.” Revenue generation holds the number four spot (up from number six in 2011), indicating an increased (or at least more overt) focus on this as a goal. Increasing study abroad and recruiting international students are first and second, respectively, when it comes to priority activities for internationalization, followed by developing partnerships with institutions and organi-zations abroad, internationalizing the curriculum/co-curriculum, and faculty development.
PRIORITY ACTIVITIES FOR INTERNATIONALIZATION#1: Increasing study abroad for U.S. students#2: Recruiting international students#3: Partnerships with institutions abroad#4: Internationalizing the curriculum/co-curriculum#5: Faculty development

6 Mapping Internationalization on U .S . Campuses: 2017 Edition
Looking beyond perceived internationalization levels and stated priorities, the 2016 data reveal a number of key trends that add detail and nuance to the overall internationalization picture. These include:
• Internationalization is increasingly an administrative-intensive endeavor, coordinated by a single office and/or a senior international officer. More institutions are implementing policies, procedures, and planning processes to guide internationalization efforts.
• In-house models dominate when it comes to resources for internationalization and the management of activities and programs. However, a notable proportion of institutions are also engaging with outside entities (e.g., third-party program providers, funders, and international partners) to further support and supplement internal efforts.
• While student mobility has consistently been a focus of internationalization efforts, the 2016 data indicate an increasingly sharp emphasis on this area relative to other aspects of internationalization. This is reflected in stated priorities, as well as resource allocations for education abroad and interna-tional student recruiting—including a marked increase in the percentage of institutions that engage overseas student recruiters. The level of support that international students receive once they arrive on campus, while trending upward, remains a concern.
• Though the curriculum and co-curriculum take a backseat to student mobility in terms of stated priorities for internationalization, an increasing percentage of institutions are implementing aca-demic and co-curricular policies and programming that facilitate on-campus global learning on a broader scale and among a broader base of students.
• More institutions are offering internationally focused faculty professional development opportuni-ties; however, still only about one in 10 specify international engagement as a consideration in promo-tion and tenure decisions. Overall, the faculty-related data raise questions about the recognition of faculty as key drivers of internationalization.
• International partnerships and activities abroad are garnering increased attention, energy, and support on many campuses. However, there is still a wide spectrum in terms of activity levels, as well as the extent of planning and intentionality surrounding global engagement.
• Consistent with the 2001, 2006, and 2011 data, there are notable differences by Carnegie Classifica-tion in terms of internationalization progress and focus. While doctoral institutions continue to lead overall, a number of indicators suggest that their progress has plateaued in certain areas. Associate and special focus institutions, in contrast, have seen considerable advances in many areas, particularly when it comes to the curriculum.
As in previous iterations of the Mapping Survey, finer-grained data on the practice of internationalization—as operationalized through policies, programs, and activities—shed additional light on the realities of how inter-nationalization is playing out on campuses, and paint a more complex picture when it comes to progress and trends over time. The following sections explore these details, and their implications for the overall state of internationalization nationwide. Notable differences by Carnegie Classification are included as relevant on an indicator-by-indicator basis.
American Council on Education 7
Data Drill-Down: Onward and UpwardWhile the Mapping study has evolved over time, we have maintained a core base of questions that have been asked in every iteration of the survey. Like the overall internationalization landscape, for many of these items, there have been both steps forward and steps backward.
For a handful of survey items, however, there have been steady—if sometimes modest—increases every five years. Taken together, these data provide a sense of some of the key focus areas and directions of U.S. higher education internationalization over the last two decades. Consistently upward-trending survey items include:
• Is internationalization or global education among the top five priorities in your institu-tion’s strategic plan?
• Does your institution have a separate strategic plan that addresses institution-wide inter-nationalization?
• Has your institution developed specific international or global student learning out-comes?
• Does your institution, or do any schools or departments within your institution, provide specific institutional funds for student education abroad, in addition to all other sources of financial aid?
• Does your institution provide scholarships/stipends/other financial aid as a means to recruit international students?
While there are certain areas of internationalization that have shown a net negative change over the years of the survey (i.e., 2001 levels were higher than 2016 levels) in all of these cases, there were ups and downs in between. In what is perhaps an encouraging sign of overall forward prog-ress, there are no Mapping indicators that have seen progressive declines in each of the four itera-tions of the survey.
Articulated Institutional CommitmentA sizeable proportion of U.S. colleges and universities have articulated a commitment to internationalization through their mission statements and/or strategic plans, with upward trends evident in all sectors across the years since the first Mapping Survey. The 2016 data are encouraging when it comes to financial support for internationalization efforts—another means by which institutions demonstrate such a commitment. Efforts to assess internationalization progress, however, appear to have stalled.

8 Mapping Internationalization on U .S . Campuses: 2017 Edition
Mission statements and strategic plansApproximately half (49 percent) of responding institutions’ mission statements specifically refer to interna-tionalization or related activities (e.g., international or global activities). A similar proportion (47 percent) have included internationalization or related activities among the top five priorities in their strategic plans.
Mirroring the 2011 data, 27 percent of institutions have a separate strategic plan that specifically addresses institution-wide internationalization. As illustrated in Figure 3, however, a greater proportion of institutions in all sectors have a campus-wide task force that works solely on advancing internationalization than have a separate strategic plan. On both of these indicators, doctoral institutions saw declines of 10 percentage points, while other sectors saw a slight decrease (master’s and baccalaureate) or increase (associate and special focus) since 2011.
Figure 3. Percentage of institutions with dedicated strategic plans and task forces for internationalization (2016)
45
65
59
41 4330
45
Doctoral
Masterʼs
Baccalaureate
Associate
Special Focus
Total
Strategic plan Task force
0 10 20 30 40 50 60 70 80

American Council on Education 9
Financial supportDespite the constrained budget environment of recent years, many colleges and universities are devoting considerable resources to internationalization efforts—including, for a sizeable percentage, by actively seeking external funding.
• Over 70 percent of institutions reported that internal funding for internationalization increased or re-mained the same over the past three years. Doctoral and master’s institutions were most likely to report that funding increased.
• About one-fifth of institutions (21 percent) have developed a formal strategy and/or launched a dedi-cated fundraising campaign to raise money to support internationalization or related activities.
• On the whole, fundraising efforts appear to be gaining steam; as illustrated in Figure 4, after a dip between 2006 and 2011 (during the economic recession), in 2016 a greater proportion of institutions reported receiving support for internationalization from alumni, individual donors other than alumni, foundations, and corporations than in either of the two previous surveys. A notably greater proportion of doctoral institutions receive funds from each of these sources than do institutions in other sectors.
Figure 4. Percentage of institutions receiving funding for internationalization from external sources
2006
2011
2016
Federal government State government Alumni Private donors other than alumni
Foundations Corporations
20
18
18
8
4
5
18
15
28
24
21
33
20
18
28
7
6
10
AssessmentSomewhat surprisingly, given overall commitment levels and resource allocations, the percentage of insti-tutions reporting that they had formally assessed their internationalization progress or impact in recent years declined from 37 percent in 2011 to 29 percent in 2016. Although perhaps partially explained by changes in question wording, 2016 saw the lowest-ever proportion of institutions engaged in assessment efforts of any years of the survey. The downward trend was consistent across all sectors, but was most pronounced for doc-toral and master’s institutions.

10 Mapping Internationalization on U .S . Campuses: 2017 Edition
Data Drill-Down: Government ConnectionsSince 2001, the percentage of institutions receiving government funding for internationalization has declined; in 2016, fewer than one in five colleges and universities had received money from the federal government in the prior three years, while only 5 percent had garnered state funding during the same period. In terms of motivations, in both 2011 and 2016, participating in public diplomacy—a key rationale behind a number of federally funded programs related to higher education internationalization—was cited by just 1 percent of institutions among their top three reasons for internationalization.
To further understand the role of government policies and programs in driving higher education internationalization, CIGE undertook two studies: one examined internationalization-related pol-icies worldwide (Helms, Rumbley, Brajkovic, and Mihut 2015) and the other focused on such pol-icies in the United States (Helms 2015c). The latter resulted in a number of recommendations for ways to promote U.S. government support for higher education internationalization, and facilitate better alignment between government and institutional goals and needs. These include:
• Interagency collaboration among the key U.S. government players with internationaliza-tion-related policies and programs
• A higher level of engagement between these agencies and the higher education commu-nity
• Greater attention to internationalization at home as a way to deliver global competence to the large majority of U.S. students who are not internationally mobile
• More federal funding for internationalization-related programs across the board
In addition to U.S. federal and state governments, foreign governments are part of the interna-tionalization equation for some U.S. colleges and universities. In the 2016 Mapping Survey, for example, 13 percent of institutions reported that they had received funding for internationalization programs or activities from foreign governments. Seventeen percent count government entities among their international partners, though this represents an eleven percentage point decline since 2011.
Administrative Leadership, Structure, and StaffingThe 2016 data indicate that at many institutions, internationalization is an increasingly administrative-inten-sive endeavor coordinated by a single office. Top leadership remains an important driver, but other administra-tors are playing key roles and are being supported by professional development funding and programs.
LeadershipInstitution presidents are seen as the top catalysts for campus internationalization. The role of the senior international officer (SIO), however, is gaining prominence—in terms of prevalence nationwide, as well as per-ceived influence on campus.

American Council on Education 11
Related Research: Presidents and SIOsThe 2016 Mapping Survey data clearly point to presidents and senior international officers (SIOs) as primary drivers of internationalization. Two national studies provide additional details about these key populations: the 2017 edition of ACE’s American College President Study (ACPS) and the Association of International Education Administrators’ (AIEA) 2014 Senior International Officer (SIO) Survey.
Since its inception in 1986, ACPS has tracked demographic data on college and university presi-dents from all sectors of U.S. higher education, including their education, career paths, length of service, and personal characteristics.
The most recent ACPS—its eighth iteration—found that just under half (45 percent) of responding presidents have international experience of some type. Specifically:
• 21 percent have professional experience overseas
• 16 percent studied outside the United States
• 12 percent have received an international grant
• 8 percent were born outside the United States
• 7 percent have been employed by a higher education institution outside the United States
• 6 percent received a degree outside the United States
Building on previous iterations in 1999, 2006, and 2011, AIEA’s 2014 SIO survey provides a snap-shot of this leadership position within the professional and academic fields of international educa-tion. Findings include:
• The top three primary SIO responsibilities are managing linkages and partnerships, rep-resenting the institution in international dealings, and strategic planning for international-ization.
• Director is the most common title for SIOs, held by nearly half of respondents. Twenty-four percent hold the title of associate or assistant vice president/chancellor/provost, while 18 percent are categorized as vice president/chancellor/provost.
• Sixty-five percent of responding SIOs report to a vice president/chancellor/provost of academic affairs. This was by far the most prominent reporting line among those included in the survey.

12 Mapping Internationalization on U .S . Campuses: 2017 Edition
• In 2016, there was an increase of 22 percentage points in the proportion of institutions reporting that internationalization activities and programs are led by a single office on campus; this is now the case at a majority (58 percent) of colleges and universities. Doctoral institutions led the way with an increase of 31 percentage points, though master’s institutions are most likely overall to have such a centralized structure in place.
• As illustrated in Figure 5, slightly more than half (53 percent) of institutions have a full-time admin-istrator who oversees or coordinates multiple internationalization activities or programs—a 13 per-centage point increase over 2011. The greatest increases occurred among associate and special focus institutions, while doctoral institutions, in contrast, saw a 2 percentage point decline on this indicator.
• Among institutions with such an administrator, 12 percent indicated that she or he reports to the president, with another 47 percent indicating a reporting line to the chief academic officer—nearly identical percentages to 2011. While the chief academic officer is the most common reporting line for all sectors, SIOs are more likely to report directly to the president at associate and special focus institu-tions than at institutions in any of the other three sectors.
• SIOs occupy the number two slot when it comes to catalysts for internationalization—ahead of chief academic officers, faculty, and other administrative leaders, both in terms of the percentage of institutions that identify SIOs as the most vital catalyst, and the percentage that rank them in the top two. At doctoral institutions, the SIO is in fact seen as the top catalyst for internationalization, ahead of the president.
Figure 5. Percentage of institutions with a full-time administrator who oversees multiple international-ization activities or programs
0 20 40 60 80
2011 2016
Doctoral
Masterʼs
Baccalaureate
Associate
Special Focus
Total

American Council on Education 13
Sector Snapshot: Minority Serving InstitutionsOf the 1,164 institutions that responded to the Mapping Survey, 286 are classified as mi-nority serving institutions (MSIs). While differences between MSI and non-MSI data were small for a majority of indicators, there are a few notable areas of divergence.
• MSIs report a higher level of internationalization than non-MSI institutions. Thirty-five percent of MSIs rate their level of internationalization as high or very high, compared to 28 percent of non-MSI institutions. They are also more likely than their non-MSI counterparts to report that internationalization has accelerated to a significant degree in recent years.
• MSIs are more likely to have received federal, state, and foreign government funding for internationalization in recent years, but are less likely to have garnered dedicated donations from alumni. A greater percentage of MSI institutions than non-MSIs also reported an increase in internal funding for internationalization.
• Dedicated staff for internationalization are more common among MSIs. Fifty-nine percent of MSIs have a full-time administrator overseeing internationalization, compared to 51 percent of non-MSIs. This individual is more likely to report to the president at MSIs than at non-MSIs (19 percent compared to 9 percent). Thirty-five percent of MSIs have a staff member whose primary responsibility is international partnership development, compared to 29 percent of non-MSIs.
• MSIs are more likely than non-MSIs to have established internationally focused tenure and promotion criteria for all (as opposed to some) faculty. The overall percentage of institutions that consider international background and experience in promotion in tenure decisions is about the same for both types of institutions, however.
• International student recruiting plans at MSIs, when they exist, are more likely to include enrollment targets than are such plans at non-MSIs.
• In terms of international partnerships, MSIs are notably more active in Mexico and Brazil than are their non-MSI counterparts. MSIs are also slightly more likely to partner with foreign governments, nongovernmental organizations (NGOs), and corporations abroad.
14 Mapping Internationalization on U .S . Campuses: 2017 Edition
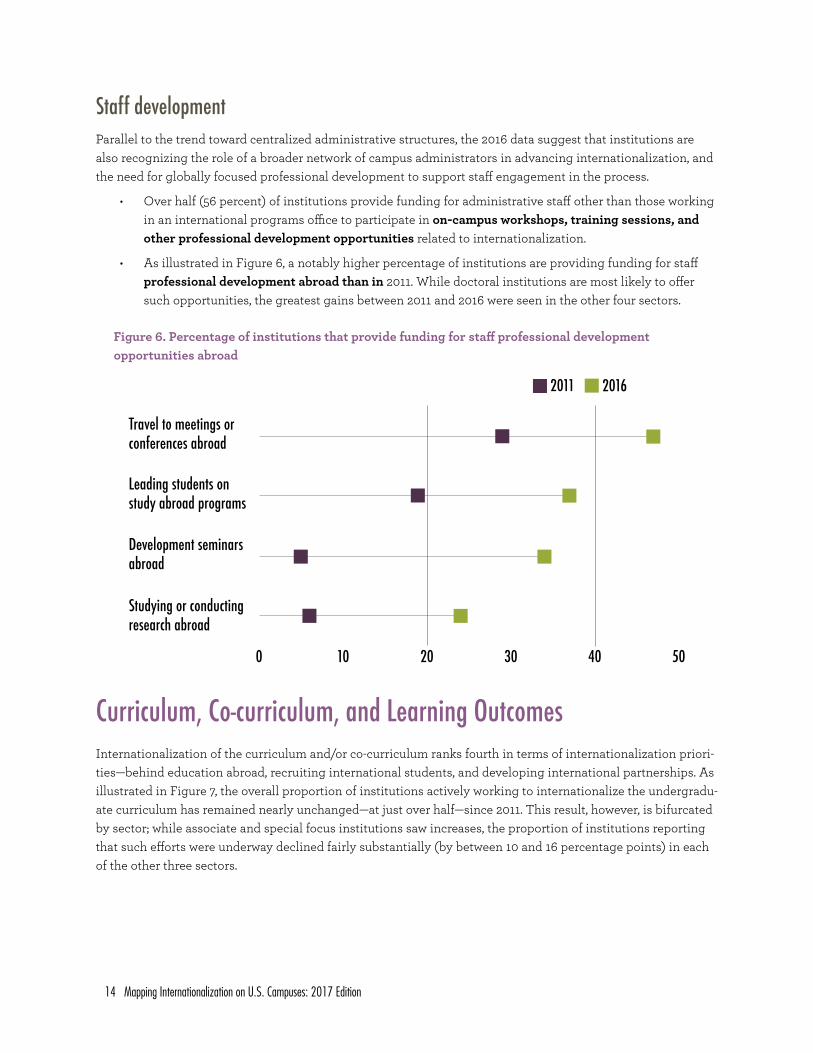
Staff developmentParallel to the trend toward centralized administrative structures, the 2016 data suggest that institutions are also recognizing the role of a broader network of campus administrators in advancing internationalization, and the need for globally focused professional development to support staff engagement in the process.
• Over half (56 percent) of institutions provide funding for administrative staff other than those working in an international programs office to participate in on-campus workshops, training sessions, and other professional development opportunities related to internationalization.
• As illustrated in Figure 6, a notably higher percentage of institutions are providing funding for staff professional development abroad than in 2011. While doctoral institutions are most likely to offer such opportunities, the greatest gains between 2011 and 2016 were seen in the other four sectors.
Figure 6. Percentage of institutions that provide funding for staff professional development opportunities abroad
Curriculum, Co-curriculum, and Learning OutcomesInternationalization of the curriculum and/or co-curriculum ranks fourth in terms of internationalization priori-ties—behind education abroad, recruiting international students, and developing international partnerships. As illustrated in Figure 7, the overall proportion of institutions actively working to internationalize the undergradu-ate curriculum has remained nearly unchanged—at just over half—since 2011. This result, however, is bifurcated by sector; while associate and special focus institutions saw increases, the proportion of institutions reporting that such efforts were underway declined fairly substantially (by between 10 and 16 percentage points) in each of the other three sectors.
0 10 20 30 40 50
2011 2016
Studying or conducting research abroad
Development seminars abroad
Leading students on study abroad programs
Travel to meetings or conferences abroad

American Council on Education 15
Figure 7. Percentage of institutions engaged in efforts to internationalize the undergraduate curricu-lum
Learning outcomes and academic requirementsDespite the relative lack of explicit emphasis in this area, 2016 saw notable positive movement when it comes to operationalizing on-campus student global learning. Compared to 2011, more institutions have delineated broad-based global learning outcomes, and have implemented academic policies (e.g., general education re-quirements) that extend the reach of internationally focused content to a larger proportion of students.
• Nearly two-thirds (64 percent) of institutions have specified international or global student learning outcomes for all students, or for students in some schools, departments, or programs. This represents an increase of nine percentage points since 2011, with the primary upward shift occurring for institu-tion-wide learning outcomes. The upward trend is consistent across sectors; however, associate and special focus institutions saw the greatest gains, of 11 and 17 percentage points, respectively.
• In 2016, almost half (49 percent) of institutions reported that their general education requirements in-clude an international/global component. In terms of content, most of these institutions allow students to fulfill this requirement with either courses that focus on global trends/issues (e.g., health, environ-ment, or peace studies), or those that feature perspectives issues, or events from specific countries or areas outside the U.S.; less than 10 percent require students to take courses of both these types.
• For the first time in the history of the Mapping study, foreign language requirements are on the rise, if modestly. In 2016, 46 percent of institutions reported having a foreign language requirement for (un-dergraduate) graduation—17 percent for all students, and 29 percent for some students.
0
20
40
60
80
100
Doctoral
0
20
40
60
80
100
Baccalaureate
0
20
40
60
80
100
Associate
0
20
40
60
80
100Total
2011 2016 2011 2016
2011 2016 2011 2016
Yes No
0
20
40
60
80
100
Master’s
0
20
40
60
80
100
Special Focus
2011 2016
2011 2016

16 Mapping Internationalization on U .S . Campuses: 2017 Edition
Related Research: Assessing Student Global LearningDawn Michele Whitehead, Senior Director for Global Learning and Curricular Change
Office of Integrative Liberal Learning and the Global CommonsAssociation of American Colleges & Universities
As institutions implement strategic campus internationalization plans that operationalize their com-mitment to advancing global dimensions, many institutions have focused on global learning across curricular and co-curricular activities. The AAC&U Global Learning VALUE Rubric is used to assess student learning, guide institutional conversations about global learning, develop student learning outcomes, support assignment creation, and guide co-curricular programming. Institutions often modify the global learning rubric to suit their institutional context and mission and to match their student learning outcomes.
The rubric is designed to measure students’ progress over time on six key dimensions of global learning:
• Global self-awareness: in the context of global learning, the continuum through which stu-dents develop a mature, integrated identity with a systemic understanding of the interrela-tionships among the self, local, and global communities, and the natural and physical world
• Perspective taking: the ability to engage and learn from perspectives and experiences different from one’s own and to understand how one’s place in the world both informs and limits one’s knowledge
• Cultural diversity: the ability to recognize the origins and influences of one’s own cultural heritage along with its limitations in providing all that one needs to know in the world
• Personal and social responsibility: the ability to recognize one’s responsibilities to society—locally, nationally, and globally—and to develop a perspective on ethical and power relations both across the globe and within individual societies
• Global systems: the complex and overlapping worldwide systems, including natural systems (those systems associated with the natural world including biological, chemical, and phys-ical sciences) and human systems (those systems developed by humans such as cultural, economic, political, and built), which operate in observable patterns and often are affected by or are the result of human design or disruption
• Knowledge application: in the context of global learning, the application of an integrated and systemic understanding of the interrelationships between contemporary and past chal-lenges facing cultures, societies, and the natural world (i.e., contexts) on the local and global levels
For each of the six dimensions, the rubric outlines indicators for four increasingly complex levels of learning and understanding. In addition to serving as a tool for institutions, faculty, and staff, the rubric provides students with language to describe and analyze their experiences and ensures a con-nection between the learning outcomes and student reflection.

American Council on Education 17
As illustrated in Figure 8, this indicates a reversal in the downward trend seen across the years of the Mapping study; doctoral and baccalaureate institutions, in fact, saw a return to 2001 proportions. Bac-calaureate institutions are notably more likely to require foreign language study for all undergraduate students than institutions in any other sector.
• For half of those institutions with a language requirement in place, the required length of study is one year or the equivalent. About one-fifth of institutions require two years of study or the equivalent, while a similar proportion require one semester or the equivalent.
Figure 8. Percentage of institutions with a foreign language graduation requirement for undergraduates
Doctoral Masterʼs Baccalaureate Associate
0
20
40
60
80
100
2001 2006 2011 2016
Special Focus Total
Related Research: Foreign Language EnrollmentsSince 1958, the Modern Language Association (MLA) has gathered and analyzed data on undergrad-uate and graduate course enrollments in languages other than English in U.S. colleges and univer-sities. Key findings from the most recent Enrollments in Languages Other Than English in United States Institutions of Higher Education report (Goldberg, Looney, and Lusin 2013) include:
• Total enrollment across all languages decreased by 6.7 percent between 2009 and 2013.
• During the same time period, enrollments increased in Korean (44.7 percent), American Sign Language (19.0 percent), Portuguese (10.1 percent), and Chinese (2.0 percent). The number of bachelor’s degrees awarded in these languages, as reported by the U.S. Depart-ment of Education, also increased between 2009 and 2013.
• Spanish enrollment exceeded enrollment in all other languages combined. For the first time in the history of the survey, however, Spanish enrollments fell at every institutional level; nearly half of this enrollment decrease occurred in the two-year sector.
• Following Spanish, French, American Sign Language, and German had the highest total student enrollment.
In addition its published reports, the MLA maintains a searchable database of enrollment data from all iterations of the survey since its origination in 1958.

18 Mapping Internationalization on U .S . Campuses: 2017 Edition
CurriculumAlthough only about half of responding institutions reported having curriculum internationalization initia-tives underway, among those that do, efforts appear to be occurring on a somewhat broader scale than in 2011. Ninety-two percent of these institutions indicated that internationalization of individual courses is taking place—making this the most common level for such efforts. However, a greater percentage than in 2011 reported efforts toward curriculum internationalization at the department/program, school, and institution levels.
International/global tracks, concentrations, or certificates are a component of curriculum internationaliza-tion for a sizeable contingent of colleges and universities.
• As in 2011, business is, by a large margin, the most common field in which such options are available to students.
• All academic areas saw increases, except the physical and natural sciences, which remain at the bot-tom of the list when it comes to availability of such options.
• In addition to field-specific certificates/concentrations/tracks, 17 percent of institutions offer broader-based programs open to students in any major.
Finally, for many institutions, technology is playing an important role when it comes to internationalizing curricular content. About one-third (32 percent) of respondents reported that their institutions are using technology (e.g., video conferencing, online learning programs, social media) to facilitate course-level collabora-tion between faculty and/or students on the home campus and counterparts overseas.
Data Drill-Down: Technology in the Global ClassroomAn increasing percentage of institutions are employing technology to bring a global dimension to courses and instruction on the home campus. The 2011 Mapping Survey data indicated that this was an aspect of internationalization pursued by about one in five institutions; as of 2016, the proportion had risen to 32 percent.
Integrating technology in the curriculum in order to enhance students’ global learning and intercul-tural experience can be challenging, however. It requires additional time and creativity of faculty and staff, and depends upon adequate Internet connectivity and equipment, among other things.
Connecting Classrooms: Using Online Technology to Deliver Global Learning (Ward 2015), an install-ment in CIGE’s Internationalization in Action series, discusses the rationale, practical considerations, benefits, and challenges of initiating a new Collaborative Online International Learning (COIL) pro-gram. The report draws on the experience of institutions that participated in the ACE-COIL Center In-ternationalization Through Technology Awards Program in 2013, and also identifies a number of other approaches in the emerging field of virtual exchange in higher education. Topics explored include:
• Securing institutional commitment and resources
• Engaging key campus stakeholders
• Identifying an international partner
• Establishing a shared classroom culture
• Managing different languages, learning styles, and expectations
• Selecting appropriate technology

American Council on Education 19
Sector Snapshot: Public Versus PrivateOf the 1,164 Mapping Survey responses received, 53 percent came from public colleges and universi-ties, and 47 percent from private institutions. While public and private institutions’ survey responses were similar in many areas, there are a number of indicators—particularly those pertaining to fund-ing—for which there were noteworthy differences.
Private, not-for-profit institutions are more likely than their public counterparts to:
• Reference internationalization in their mission statements; designate internationalization as one of their top five strategic priorities; and report “high” or “very high” levels of interna-tionalization.
• Have launched a dedicated fundraising campaign to support internationalization, and to have received funding from alumni and other individual donors.
• Provide scholarships for education abroad; allow students to apply their institutional finan-cial aid to support such experiences; send students abroad on third-party provider programs; and report an increase in the number of students participating in all types of education abroad in recent years.
• Fund scholarships for international students, travel for recruitment officers, and engage-ment of overseas student recruiters; provide most types of support services for international students.
• Be engaged in initiatives to internationalize the undergraduate curriculum; include a global component in their general education requirements; and require some or all students to study a foreign language in order to graduate.
• Offer internationally focused faculty development programs and funding, particularly for opportunities abroad.
Public institutions, in contrast, are more likely to:
• Have a campus-wide task force on internationalization.
• Require all students to study a foreign language.
• Receive federal and/or state funding for internationalization activities.
• Provide ESL support for matriculated international students.
• Offer faculty workshops on internationalizing the curriculum.
Only a handful (20) of private, for-profit institutions responded to the survey—too few to allow for meaningful comparisons. Not surprisingly, however, those for-profit institutions that did respond are notably more likely to specify revenue generation as a goal for internationalization and partner with corporations abroad than are the not-for-profit institutions included in the survey.

20 Mapping Internationalization on U .S . Campuses: 2017 Edition
Co-curriculum In terms of numbers, the 2016 data indicate a notable increase in internationally focused co-curricular program-ming. As illustrated in Figure 9, for every type of activity or initiative included in the survey, a greater percent-age of institutions reported offerings than in 2011; this upward trend is consistent across all sectors, though such programs are still most widely available at doctoral institutions.
While the news is generally positive, the co-curriculum data point to an important caveat. In 2016, as in 2011 and previous years of the survey, the most ubiquitous co-curricular programs (e.g., international festivals and events and a meeting place for students interested in international topics) are ones that, in and of themselves, do not necessarily entail sustained and intensive engagement by students. Ongoing programs and those with a more intensive or explicit educational component, though offered by an increasing proportion of institutions, are still much less common.
Figure 9. Percentage of institutions offering co-curricular programs and opportunities
45
65
59
41 4330
45
2011 2016
0 10 20 30 40 50 60 70 80
Buddy program that pairs U.S. and international students to help integrate students socially
Language partner program that pairs U.S. and international students
Residence hall with special programs designed to facili-tate the integration of U.S. and international students
Meeting place for students interested in international topics
Regular and ongoing international festivals or events on campus
Programs to link study abroad returnees or international students with students in K–12 schools
Faculty Policies and PracticesThe 2016 survey saw modest gains in the percentage of institutions that factor international experience and activity into hiring and tenure decisions, and in the proportion that recognize faculty contributions to inter-nationalization through awards. Although faculty professional development is seen as a relatively low priority area for internationalization, opportunities of this type expanded over the last five years—with an emphasis on funding and mobility, as opposed to on-campus workshops and curriculum-focused activities. In spite of these gains, the faculty-related data, when taken together and compared to data in other areas, raise concerns about overall status and recognition of faculty members’ key role in the internationalization process.

American Council on Education 21
Hiring, tenure, and recognitionThe 2016 data indicate that in comparison to five years ago, more colleges and universities are intentionally seeking to hire faculty with an international orientation. Just under half (47 percent) of 2016 survey respondents reported that their institutions “occasionally” or “frequently” give preference to candidates with international background, experience, or interests when hiring faculty in fields that are not explicitly international/global, compared to 40 percent in 2011. At a majority of these institutions it is still an “occasional” practice, though a decline in the percentage of institutions responding “rarely” or “never” underscores the general upward trend in this area.
For the first time in 10 years, the 2016 data also indicate a slight increase (from 8 percent to 10 percent) in the percentage of institutions that specify international work or experience as a consideration in faculty promotion and tenure decisions. Similarly, the percentage of institutions that recognize international en-gagement through faculty awards rose from 8 percent to 11 percent over the past five years. Figure 10 illustrates these shifts.
While any upward movement is a positive step, it is important to note that still only one in 10 institutions are re-warding faculty members’ international engagement via one or both of these mechanisms. And while doctoral universities lead on both measures (24 percent consider international work/experience in tenure decisions, and 35 percent confer awards for international activity), each in fact saw slight declines among institutions in this sector between 2011 and 2016.
Figure 10. Percentage of institutions that consider international work or experience in promotion and tenure decisions and/or offer faculty awards for international activity
Doctoral Masterʼs Baccalaureate Associate Special Focus Total
International work considered in tenure decisionsAwards for international activity
2011 2016 2011 2016 2011 2016 2011 2016 2011 2016 2011 2016
25
39
24
37
12
15
14
18
11
89
781 5
710
315
7
8
8 10
11

22 Mapping Internationalization on U .S . Campuses: 2017 Edition
Professional developmentAs a priority activity for internationalization, faculty development ranks number five—behind recruiting international students, increasing education abroad, developing international partnerships, and international-izing the curriculum/co-curriculum. Only slightly over one-fifth of respondents indicated that faculty develop-ment is among their institution’s top three internationalization priorities.
Despite this low-priority status, however, internationalization-related professional development opportunities are generally more available to faculty than in 2011; Figure 11 highlights this trend. Such opportunities are most ubiquitous in the doctoral sector; however, for a number of the activities and programs included in the survey, the proportion of doctoral universities offering them in fact declined between 2011 and 2016.
Mirroring institutions’ relative emphasis on student mobility compared to the on-campus curriculum, faculty professional development opportunities abroad are offered by more institutions than are campus-based and curriculum-focused opportunities. Funding predominates in terms of the form of professional devel-opment support provided; for example, in 2016 a higher percentage of institutions indicated that they provide funding to faculty to internationalize their courses than in 2011, but a smaller proportion are offering work-shops to help with this process.
For the first time in 2016, the Mapping Survey asked if institutions offered workshops on teaching and in-tegrating international students. Slightly over one-quarter (28 percent) of respondents indicated that such programs are available on their campuses.
Data Drill-Down: Internationalizing the Tenure CodeIn order to provide examples and guidance for those institutions considering implementing interna-tionally focused tenure and promotion criteria, CIGE undertook an analysis of 91 publicly available tenure and promotion codes from 61 of the U.S. colleges and universities that indicated in the 2011 Mapping Survey that international work or experience was a consideration in the process. These included institution-, school/college-, and departmental-level policies.
Findings from the study are explored in CIGE’s report Internationalizing the Tenure Code: Policies to Promote a Globally Focused Faculty (Helms 2015b). Highlights include:
• The most common internationally focused criteria relate to research and service. Teach-ing-related international criteria are relatively uncommon.
• Many tenure policies specify that faculty are expected to attain a “national or interna-tional” reputation in their fields, though indicators of such a reputation are not often delin-eated.
Key factors for successful implementation of internationalized tenure policies include institutional readiness, outreach and stakeholder engagement, and alignment of criteria and institutional inter-nationalization goals.
The report includes examples of specific internationally focused criteria, institutional case studies, and expert advice.

American Council on Education 23
Figure 11. Percentage of institutions offering faculty development funding, programs, and opportunities
Overall statusWhile the 2016 faculty data indicate gains both in terms of policies and professional development support, they are less encouraging when viewed in light of progress in other areas of internationalization. Though no one data point is overly problematic on its own, taken together and compared to specific indicators in other areas, they raise questions about the recognition of faculty as key drivers of internationalization.
First, a comparison of the faculty professional development data to staff development indicators underscores its relatively low-priority status. As noted previously, over half of institutions provide globally focused on-campus professional development workshops for administrative staff, yet for each type of on-campus faculty devel-opment opportunity included in the survey, no more than 30 percent of respondents indicated that it is offered by their institutions.
The data also suggest a gap between institutional measures to recruit international students and efforts to ensure that faculty are well prepared to support those students once they arrive on campus. While 28 percent of institutions offer workshops on teaching and integrating international students, as explored in more
47
59
55
64
30
40
23
30
25
30
12
21
15
19
11
1535
36
26
29
Travel
to meet
ings o
r
confere
nces a
broad
Leadin
g stud
ents o
n stud
y
abroad
progra
mStu
dying
or cond
ucting
resear
ch abr
oadTea
ching
at inst
itution
s
abroad
Interna
tionaliz
ing the
ir
course
s
Oppor
tunitie
s for fa
culty t
o impro
ve
foreign
langua
ge ski
llsUsi
ng tec
hnolog
y to en
hance
course
s’ inte
rnation
al dimens
ion
Worksho
ps on
global
learnin
g
assess
ments Fundin
g to ho
st
interna
tional f
aculty
Worksho
ps on
interna
tional-
izing th
e curri
culum
Increase Decrease
2011 2016

24 Mapping Internationalization on U .S . Campuses: 2017 Edition
Sector Snapshot: “Urbanicity”Of the sector-specific analyses conducted on the 2016 data, “urbanicity” (defined by a number of IPEDS designators condensed into four categories) is the one for which the results are most consistent across indicators. In all areas addressed in the Mapping Survey, institutions located in cities and suburban ar-eas report higher levels of internationalization than do their counterparts in small towns, which in turn outpace institutions in rural areas.
While the degree of difference among the sectors varies by category and question, results on broad indi-cators related to levels of internationalization are representative of the pattern seen throughout the data.
Percentage of institutions that characterize their overall level of internationalization as very high or high:
Percentage of institutions reporting that internationalization has accelerated in recent years:
This pattern is remarkably consistent overall; however, the data highlight a few noteworthy characteris-tics of rural institutions:
• Their senior international officers (SIOs) are more likely to report to the president than are SIOs at more urban institutions.
• Seventeen percent have begun international partnerships for the first time in the last three years; about one-fifth have a staff member whose primary role is to develop international part-nerships.
• Forty percent have specified geographic targets for partnership expansion, with China and Mex-ico figuring most prominently.
36%
32%
20%
12%City
Suburb
Town
Rural
76% 76% 69% 46%
City Suburb Town Rural

American Council on Education 25
detail in the subsequent section, a notably higher proportion of colleges and universities have an interna-tional student recruiting plan in place and/or provide funding for various activities and incentives to promote inbound student mobility.
Most broadly, although the 2016 and 2011 data on top catalysts for internationalization are not entirely com-parable, they suggest that as the prominence of SIOs has increased, the perceived influence of faculty may be diminishing. And while many institutions carefully monitor and set targets for student mobility, only a small proportion (14 percent) of institutions are actively tracking faculty international teaching and/or research collaborations on an ongoing basis, suggesting again that faculty members’ international engagement is receiving less attention and interest than the activities of their students.
Student MobilityAs noted previously, increasing study abroad and recruiting international students are, respectively, the num-ber-one and number-two priority activities for internationalization across sectors. Reflecting this emphasis and continuing upward trends between 2006 and 2011, 2016 saw increased resources and attention devoted to these areas, though support for international students remains a concern.
International student recruitingPlanning and goal-setting frame international student recruiting efforts for many institutions. Funding for various recruiting mechanisms and activities is increasing, though undergraduate recruiting is a greater focus in terms of resource allocation than graduate student recruiting.
• Nearly half (48 percent) of institutions have an international student recruiting plan in place—either for the institution as a whole, or for one or more schools/colleges. Of these plans, over 80 percent spec-ify numerical enrollment targets for undergraduates, graduate students, or both.
• Fifty-eight percent of the recruiting plans cited by respondents include geographic targets. By a clear margin, the top three target countries are China, India, and Vietnam. These are followed by four additional countries, each of which was identified by 30 to 40 percent of respondents as a target: South Korea, Brazil, Japan, and Saudi Arabia. While these priorities generally hold across sectors, Japan figures particularly prominently as a target country among associate institutions.
• The percentage of institutions providing funding for travel by institutional recruitment officers to recruit both undergraduate and graduate students increased in 2016. Nearly twice the percentage of institutions fund such travel for recruiting at the undergraduate level (44 percent) as at the graduate level (23 percent).
• Just over a third (36 percent) of institutions employ technology other than email and web pages in their recruiting efforts (e.g., by participating in virtual college fairs and delivering online information sessions for interested students). While the 2016 and 2011 data on this indicator are not fully compara-ble, they suggest an upward trend.
• The percentage of institutions that provide scholarships or other financial aid for undergraduate international students increased by eleven percentage points to just under half (49 percent), while the proportion offering funding to graduate international students increased from 24 percent to 30 percent. Not surprisingly, the latter is much more common among doctoral and master’s universities than at institutions in the other three sectors.

26 Mapping Internationalization on U .S . Campuses: 2017 Edition
• A markedly higher percentage of institutions are engaging overseas student recruiters (agents) than in 2011. Though undergraduate recruiting is again the primary focus, as illustrated in Figure 12, for both the undergraduate and graduate levels, the percentage of institutions providing funding for recruiting agents more than doubled between 2011 and 2016. For both student populations, master’s institutions engage agents at higher rates than colleges and universities in other sectors.
Related Research: Good Practices for Engaging RecruitersLindsay Addington, Associate Director of International Initiatives
National Association for College Admission Counseling
The use of incentive compensation by U.S. colleges and universities to recruit U.S. citizens as stu-dents is prohibited by the Higher Education Act of 1965, as amended in 1992, as well as by the Na-tional Association for College Admission Counseling’s (NACAC) Statement of Principles of Good Practice (SPGP). Given the increasing influence of globalization on higher education, in 2011 NACAC convened a commission on international student recruitment to determine whether the long-stand-ing provision within the association’s principles—banning per-capita remuneration—should apply equally to domestic and international recruitment.
As detailed in its final report (National Association for College Admission Counseling 2013), the com-mission concluded that while NACAC should remain cognizant of the potential negative effects of commissioned recruiting, the widespread use of this method by institutions around the world for in-ternational recruitment necessitated acknowledgement by the association, and required an adaptive focus on promoting best practices. In 2013, the association modified the SPGP to explicitly permit members to utilize agents for international student recruitment, provided they ensure accountability, transparency, and integrity when doing so. NACAC advises institutions that engage with agencies to commit the fiscal and human resources needed to vet, select, train, and manage agency partners, and to successfully support the potential growth in enrollment of international students.
As a result of this change, NACAC began closely observing the practices of U.S. institutions that use agents to recruit international students. As reported in its State of College Admission report (Cline-dinst, Koranteng , and Nicola 2015), a NACAC survey of four-year colleges and universities found that 37 percent of responding institutions worked with international student recruitment agencies, with an additional 20 percent actively considering using agencies. Seventy-three percent of institu-tions using agents require a formal contract and 60 percent regularly assess the performance and sat-isfaction of agency-recruited students—activities that NACAC advocates should be standard practice.
International Student Recruitment Agencies: A Guide for Schools, Colleges and Universities, pub-lished by NACAC (West and Addington 2014), details these and other concrete steps institutions can take to engage with agencies responsibly.
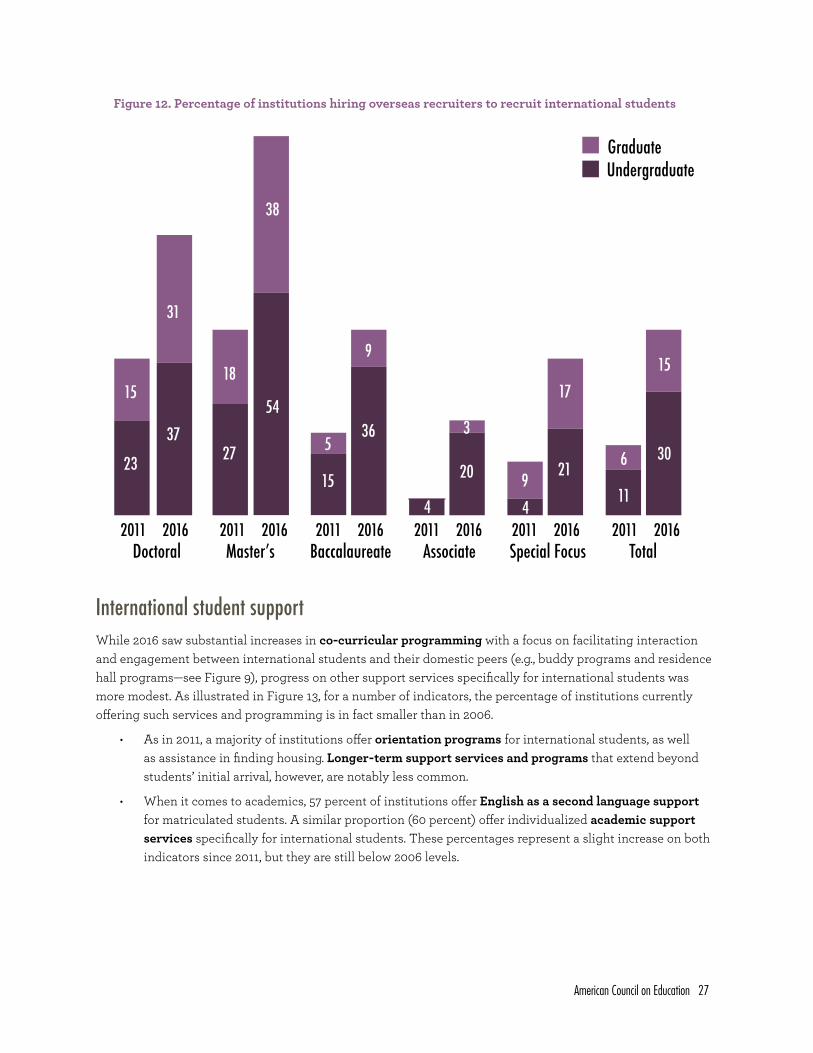
American Council on Education 27
Figure 12. Percentage of institutions hiring overseas recruiters to recruit international students
International student supportWhile 2016 saw substantial increases in co-curricular programming with a focus on facilitating interaction and engagement between international students and their domestic peers (e.g., buddy programs and residence hall programs—see Figure 9), progress on other support services specifically for international students was more modest. As illustrated in Figure 13, for a number of indicators, the percentage of institutions currently offering such services and programming is in fact smaller than in 2006.
• As in 2011, a majority of institutions offer orientation programs for international students, as well as assistance in finding housing. Longer-term support services and programs that extend beyond students’ initial arrival, however, are notably less common.
• When it comes to academics, 57 percent of institutions offer English as a second language support for matriculated students. A similar proportion (60 percent) offer individualized academic support services specifically for international students. These percentages represent a slight increase on both indicators since 2011, but they are still below 2006 levels.
Doctoral Masterʼs Baccalaureate Associate Special Focus Total2011 2016 2011 2016 2011 2016 2011 2016 2011 2016 2011 2016
UndergraduateGraduate
23
15
37
31
27
18
54
38
15
536
9
4
20
3
49
21
17
11
6 30
15

28 Mapping Internationalization on U .S . Campuses: 2017 Edition
Figure 13. Percentage of institutions offering programs or services for international students2006 2011 2016
Individualized academic support services 70 57 60
Orientation to the United States and the local community 59 50 63
Orientation to the institution and/or the U.S. classroom 72 62 69
Assistance in finding housing 57 50 57
Institutional advisory committee of international students 23 18 22
International alumni services and/or chapters 13 8 13
Support services for dependents of international students 9 6 12
Host-family program for international students 27 22 22
English as a second language (ESL) program 65 50 57
Related Research: Financial Aid for International StudentsClay Hensley, Senior Director, International Strategy and Outreach
Yoko Kono, Assistant Director, International Market AnalyticsCollege Board
According to data collected by the College Board’s Annual Survey of Colleges (ASC), more than 2,500 higher education institutions across the United States reported enrolling at least one inter-national (non-resident alien) degree-seeking undergraduate student in academic year 2014–15. Of these institutions, approximately one-third (or more than 800) reported awarding institutional grant or scholarship aid—need-based and/or non-need-based—to enrolled international undergraduate students in 2014–15. The total amount of financial aid allocated represents roughly $1.2 billion invest-ment in the potential of international students on U.S. campuses.
Data from the ASC also indicates that over the last decade, there has been a notable rise in the number of higher education institutions awarding financial aid. The amount of aid awarded to degree-seeking international undergraduate students has risen at an even faster pace, well above the rate of increase of college tuition prices within U.S. higher education. Approximately one in six international undergraduate students in 2014–15 received some form of institutional aid, though this amount as a percentage of total cost of attendance varies widely across institutions. The college and university profiles available at the College Board’s Big Future website include international student financial aid data for individual institutions.
Typically, international undergraduate students are not eligible to receive federal or state financial aid.
Further information on trends related to U.S. colleges and universities allocating financial aid for in-ternational students is included in a College Board presentation titled “International Undergraduate Student Financial Aid Trends: 2017 Update.”

American Council on Education 29
Pre-matriculation programs for international studentsIn addition to English language support for international students once they have enrolled, pre-matriculation programs designed to help students build English proficiency and acclimate to the U.S. academic envi-ronment have garnered attention in recent years as a means of both recruiting and supporting international students. Such initiatives take two primary forms:
• Intensive English programs/institutes/centers that provide instruction to full-time international stu-dents (undergraduate or graduate) who are not matriculated in an academic degree program.
• “Bridge” or “pathway” programs that provide a full-time course of study for international students, usually involving English language preparation and other credit-bearing coursework.
Overall, nearly half (49 percent) of respondents indicated that their institutions are operating, developing, or considering an intensive English language program, compared to about a third (32 percent) for bridge/path-way programs. As illustrated in Figure 14, the dominant model for such programs is in-house development and administration, though a limited percentage of institutions are collaborating (or considering collaborating) with third-party providers to establish and operate such programs. For both types, doctoral institutions are most likely to have existing programs in place; however, the proportion of institutions considering developing them is fairly consistent across sectors.
Figure 14. Percentage of institutions offering, developing, or considering intensive English and path-way programs (2016)
Existing program operated by the institution
Existing program operated by/with a third-party provider
Developing a program internally
Developing a program with a third-party provider
Considering developing a program
Bridge or pathway programIntensive English program
29 14
5 2
5 6
2 1
9 8
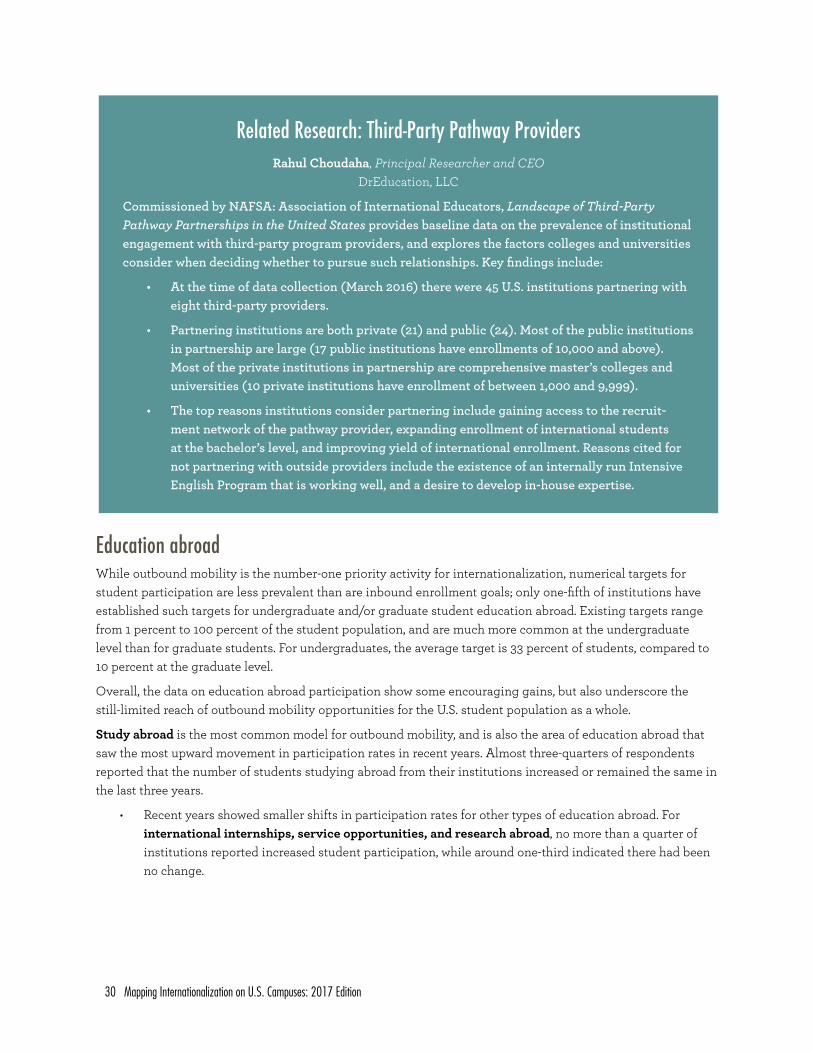
30 Mapping Internationalization on U .S . Campuses: 2017 Edition
Education abroadWhile outbound mobility is the number-one priority activity for internationalization, numerical targets for student participation are less prevalent than are inbound enrollment goals; only one-fifth of institutions have established such targets for undergraduate and/or graduate student education abroad. Existing targets range from 1 percent to 100 percent of the student population, and are much more common at the undergraduate level than for graduate students. For undergraduates, the average target is 33 percent of students, compared to 10 percent at the graduate level.
Overall, the data on education abroad participation show some encouraging gains, but also underscore the still-limited reach of outbound mobility opportunities for the U.S. student population as a whole.
Study abroad is the most common model for outbound mobility, and is also the area of education abroad that saw the most upward movement in participation rates in recent years. Almost three-quarters of respondents reported that the number of students studying abroad from their institutions increased or remained the same in the last three years.
• Recent years showed smaller shifts in participation rates for other types of education abroad. For international internships, service opportunities, and research abroad, no more than a quarter of institutions reported increased student participation, while around one-third indicated there had been no change.
Related Research: Third-Party Pathway ProvidersRahul Choudaha, Principal Researcher and CEO
DrEducation, LLC
Commissioned by NAFSA: Association of International Educators, Landscape of Third-Party Pathway Partnerships in the United States provides baseline data on the prevalence of institutional engagement with third-party program providers, and explores the factors colleges and universities consider when deciding whether to pursue such relationships. Key findings include:
• At the time of data collection (March 2016) there were 45 U.S. institutions partnering with eight third-party providers.
• Partnering institutions are both private (21) and public (24). Most of the public institutions in partnership are large (17 public institutions have enrollments of 10,000 and above). Most of the private institutions in partnership are comprehensive master’s colleges and universities (10 private institutions have enrollment of between 1,000 and 9,999).
• The top reasons institutions consider partnering include gaining access to the recruit-ment network of the pathway provider, expanding enrollment of international students at the bachelor’s level, and improving yield of international enrollment. Reasons cited for not partnering with outside providers include the existence of an internally run Intensive English Program that is working well, and a desire to develop in-house expertise.

American Council on Education 31
• For all types of education abroad, very few respondents indicated that participation rates had de-creased in the last three years. However, as illustrated in Figure 15, for each program type, a substantial proportion responded “not applicable.” While this was the case at 22 percent of institutions for study abroad, for internships, service opportunities, and research, between 43 percent and 54 percent of institutions responded “not applicable,” indicating that a substantial proportion of U.S. students do not have access to these types of opportunities.
Institutions rely on a variety of internal and external entities to develop and deliver education abroad programs for their students. Mirroring the data on pre-matriculation programs cited previously, the most common ad-ministrative model is in-house control and operation; institutional study abroad offices are the most frequently cited overseers (by 52 percent of institutions), followed by individual faculty (at 49 percent of institutions). However, a sizeable proportion of institutions also reported that they engage with outside entities; third-party providers, institutional partners abroad, and consortia were each cited by between a quarter and a third of respondents.
Finally, when it comes to financing, just over half of colleges and universities provide institutional funds as student scholarships for education abroad. As is the case for inbound international students, such funding is more widely available to undergraduate than graduate students. Special focus institutions in particular appear to have prioritized this type of support in recent years; the proportion of institutions in this sector providing institutional funds for study abroad doubled between 2011 and 2016.
In many cases, students’ institutional financial aid can be applied to education abroad experiences. This is most commonly the case for programs administered internally, particularly those that are faculty-led.
Figure 15. Percentage of institutions indicating education abroad participation has increased, de-creased, or remained the same in the last three years (2016)
Study abroad
International internships (placed abroad)
Service opportunities abroad
Research abroad
Increased Remained the same Decreased Not applicable
45 27 7 22
19 31 1 48
25 32 1 43
14 31 1 54

32 Mapping Internationalization on U .S . Campuses: 2017 Edition
Collaboration and PartnershipsOverall, the 2016 data indicate that international engagement and collaboration are garnering increased atten-tion, energy, and support on many campuses. However, there is still a wide spectrum in terms of activity levels, as well as the extent of planning and intentionality surrounding institutional relationships abroad.
Institutional partnershipsNearly half of responding institutions reported that they have begun to develop international partnerships or have expanded the number of partner relationships in the last three years. It is important to note, however, that international collaboration, though increasingly common, is still by no means universal—nearly a quarter of institutions reported that they do not currently maintain any international partnerships; for associate institu-tions, the proportion is close to half (44 percent).
Related Research: Student MobilityThe Institute of International Education’s 2016 Open Doors study, supported by a grant from the U.S. Department of State’s Bureau of Educational and Cultural Affairs, is “a comprehensive infor-mation resource on international students and scholars studying or teaching at higher education institutions in the United States, and U.S. students studying abroad for academic credit at their home colleges or universities.” For inbound international students, key findings from the most recent iteration of the survey include:
• The total number of international students enrolled in U.S. higher education increased by 7.1 percent to 1,043,839 students in academic year 2015–16—69,000 more students than the prior year.
• International students now represent just over 5 percent of the more than 20 million stu-dents enrolled in U.S. higher education, up from around four percent in previous years.
• Fifty-three percent of total international student enrollment comes from three top coun-tries of origin: China, India, and Saudi Arabia.
When it comes to education abroad for U.S. students:
• 313,415 American students received academic credit for study abroad in 2014–15, an in-crease of 2.9 percent over the previous year. Study abroad by U.S. students has more than tripled in the past two decades; however, the rate of growth has slowed in recent years.
• Europe remains the top destination for U.S. students. The report notes that “study abroad to Europe increased by five percent in 2014/15, driving study abroad growth. The United Kingdom remains the leading destination for American students, followed by Italy, Spain, France and China—which remained the fifth largest host destination despite a seven per-cent decrease.”
• Although the total number of students going abroad is currently at an all-time high, still only about 10 percent of all U.S. undergraduate students study abroad before obtaining their degree.
American Council on Education 33
Mirroring the trend toward greater centralization of internationalization efforts in general, many institutions are developing structures, policies, and procedures to support and organize their global engagement initiatives.
• Just over 40 percent of institutions have articulated a formal strategy for international partnership development or are in the process of developing such a strategy.
• Thirty percent of institutions employ a staff member whose primary responsibility is developing in-ternational partnerships. These positions are most common among doctoral and master’s institutions, though they also exist at a sizeable proportion of institutions in other sectors.
• Thirty-two percent of institutions have specific campus-wide guidelines for developing/approving new partnerships and/or assessing existing relationships. An additional 8 percent of respondents indi-cated that such policies exist within some departments and programs.
While academic institutions abroad are the most common partners for U.S. institutions, as illustrated in Figure 16, many colleges and universities are also engaging with other types of entities; about a third of insti-tutions, for example, partner with nongovernmental organizations. The “other” types of organizations cited as partners by 5 percent of respondents include foundations, charitable and religious organizations, foreign study abroad providers, city governments, museums, K–12 schools, hospitals, and research institutes.
Data Drill-Down: Good Practices for PartnershipsIt was clear from the 2011 Mapping Survey data that international partnerships were becoming an increasingly prominent aspect of internationalization for many U.S. colleges and universities—a trend reinforced by the 2016 data. Given the substantial percentage of institutions that reported they were embarking on international partnerships for the first time or were seeking to expand their collaborations with counterparts abroad, CIGE undertook additional research designed to provide guidance and inform institutional practice in this area.
For the project, we analyzed standards of good practice for international higher education partner-ships set forth by a variety of organizations (in the United States and around the world) to identify areas of convergence, as well as gaps (i.e., important issues that are not adequately addressed by the standards, but require attention). The resulting report, International Higher Education Partnerships: A Global Review of Standards and Practices (Helms 2015a), synthesizes these areas thematically, and provides examples and advice from institutions whose experiences illustrate key concepts. The themes, organized into two broad categories, include:
Program administration and management:
• Transparency and accountability
• Faculty and staff engagement
• Quality assurance
• Strategic planning and the role of institutional leadership
Cultural and contextual issues:
• Cultural awareness
• Access and equity
• Institutional and human capacity building
• Ethical dilemmas and “negotiated space”

34 Mapping Internationalization on U .S . Campuses: 2017 Edition
Figure 16. Percentage of institutions partnering with entities abroad (2016)
Academic Institutions 73
NGOs 34
Foreign Governments 17
Corporations 12
Other 5
When it comes to geographic focus, China occupies the top spot—both for existing partnerships, and as a target for expanded activity. More broadly, as illustrated in Figure 17, European and Asian countries are on the forefront for current collaborations; for the United Kingdom, France, Germany, Japan, and South Korea, between one-fifth and one-quarter of respondents reported that their institutions are active in terms of existing relationships.
Asia is also well represented among countries targeted by institutions for partnership expansion; along with China and South Korea, India and Vietnam are included in the top six. Latin America—namely, Brazil and Mex-ico—is also garnering attention for future collaborations. Overall, the top countries identified for partnership expansion map closely to those targeted for international student recruiting, suggesting that for many institu-tions, access to prospective students is a driver of partnership development.
The European countries in which there is a high level of current partnership activity, in contrast, are a relatively low priority for growth; for the United Kingdom, Germany, and France, just 3 percent of institutions reported an interest in expanding their collaborative activities.
While the data on priority countries highlight likely directions for future global engagement activity by U.S. colleges and universities, it is important to note that nearly half (46 percent) of respondents reported that their institutions have not identified specific countries for partnership expansion—underscoring again that planning for international activity (or pursuing such activity at all) is by no means a universal endeavor.
Figure 17. Top countries for international partnerships (2016)
Existing Activity Targeted for Expanded Activity
China
Japan
United Kingdom
Germany
France
South Korea
China
India
Brazil
Mexico
Vietnam
South Korea

American Council on Education 35
Collaborative degree programsCollaborative degree programs provide a structured path for student mobility between international partner institutions. Such programs take two primary forms:
• Dual/double degree program: Students take courses and receive a degree or diploma from each partici-pating institution.
• Joint degree program: Students receive a single diploma or degree endorsed by both participating institutions.
Overall, a relatively small segment of U.S. institutions has pursued collaborative degree programs, or is intend-ing to pursue them in the near future.
• Sixteen percent of institutions operated dual/double degree programs in 2016, compared to 10 per-cent in 2011. Doctoral institutions are substantially more likely to offer such programs than institutions of any other type.
• The proportion of institutions offering joint degree programs held constant at 8 percent between 2011 and 2016. As is the case for dual degrees, joint degree programs are most common at doctoral institu-tions, but 2016 saw a fairly steep decline (12 percentage points) in their pervasiveness in this sector.
• 2016 saw a decline in the percentage of institutions indicating that they were in the process of devel-oping dual or joint degree programs—from 15 percent in 2011 to 10 percent or less for each type of program in 2016.
Enrollment patterns indicate that the mobility facilitated by collaborative degree programs is mostly one-way, suggesting that such programs are largely serving U.S. institutions as a mechanism for international student recruiting. As illustrated in Figure 18, for nearly 80 percent of the dual and joint degree programs accounted for in the survey, enrollment consists entirely or mostly of non-U.S. students. Just over one in 10 programs of either type serve “a fairly even mix” of U.S. and non-U.S. students.
Figure 18. Percentage of dual and joint degree programs enrolling U.S. students and non-U.S. students (2016)
Dual/double degree
Joint degree
Entirely U.S. students Entirely non-U.S. students Mostly U.S. students Mostly non-U.S. students A fairly even mix of both
47 7 31 14
48 9 30 11
2
3

36 Mapping Internationalization on U .S . Campuses: 2017 Edition
Data Drill-Down: Joint and Dual DegreesIn 2013, CIGE surveyed and interviewed representatives of institutions that indicated in the 2011 Mapping Survey that they were operating international joint and/or dual degree programs or were in the process of developing them. The resulting report, Mapping International Joint and Dual De-grees: U.S. Program Profiles and Perspectives (Helms 2014), provides information about institution and program characteristics and policies, academic focus areas, partner locations, and program-matic challenges, as well as how joint and dual degree programs factor into broader institutional strategy and planning.
Key findings from the study include:
• While nearly half of survey respondents reported that international collaborative degrees were mentioned in strategic planning documents or were being incorporated into such documents, only 15 percent indicated that their institutions had a specific policy in place that encouraged the development of international joint degrees; 18 percent reported a pol-icy to encourage dual degrees. In some cases, there was an unofficial policy or understand-ing that these programs were encouraged.
• Program enrollment was notably skewed toward non-U.S. students. Nearly two-thirds (63 percent) of programs enrolled only students from the partner country, while about one-third enrolled a mix of U.S. and foreign students. Just 4 percent of programs included in the survey enrolled only U.S. students.
• Overall, academic issues such as course equivalencies and teaching methodologies pre-sented a greater challenge for joint and dual degree programs than did administrative practicalities such as legal/regulatory and health/safety issues. In nearly all areas, joint degree programs were perceived as more challenging to implement and sustain than dual degree programs.
• The top partner countries (in terms of the number of programs reported by survey respon-dents) were China, France, Turkey, Germany, and South Korea. There were country-specific variations in the primary academic focus areas, most common degree level, and most press-ing challenges faced by programs with partners in these countries.
In addition to aggregated data, the report presents program examples from a variety of institutions, as well as emerging trends and models. The role of joint and dual degree programs in institutions’ efforts toward comprehensive internationalization is addressed, along with the potential impact of such programs on global higher education more broadly.

American Council on Education 37
Institutional presence abroadWhile bringing international students to the home campus is a key priority for many institutions when it comes to their global engagement portfolios, a proportion are also expanding their international reach through programs for students who live—and remain—outside the U.S. Some of these involve an institutional partner abroad, while others are operated independently by the U.S. institution. As highlighted in Figure 19, such programs, when offered, often rely on technology to deliver course content—partially or in combination with in-person instruction. In terms of scope, individual courses are the most common offering, though the prevalence of fully online degree programs is notable as well.
Figure 19. Percentage of institutions delivering programs and instruction for students located overseas (2016)
Full degree programs Non-degree programs Individual courses
Entirely or largely face-to-face 5 2 11
Entirely or largely via technology (online, videoconferencing, etc.) 9 4 11
Via a combination of face-to-face and technology 5 2 7
Finally, in order to facilitate the range of partnership and programmatic activity described throughout this section, some institutions have established branch campuses or other foreign outposts. While such entities have garnered a fair amount of media attention in recent years, they are operated by a narrow segment of U.S. institutions, mainly in the doctoral sector. Administrative offices are the most common type of outpost, followed by study centers for U.S. students and branch campuses. Numbers are small in all cases, however; the propor-tion of institutions operating each type of entity (with at least one full-time staff member abroad) hovers around just 5 percent.
Related Research: International Branch CampusesThe Cross-Border Education Research Team (C-BERT), hosted at the State University of New York at Albany and The Pennsylvania State University, maintains a comprehensive list of international branch campuses (IBCs). C-BERT defines an IBC as: “an entity that is owned, at least in part, by a foreign higher education provider; operated in the name of the foreign education provider; and provides an entire aca-demic program, substantially on site, leading to a degree awarded by the foreign education provider.” Cur-rently, the C-BERT database includes a total of 247 IBCs in operation globally, 22 new IBCs planning to open, and 42 IBCs that have closed.
In 2016, C-BERT and the Observatory on Borderless Higher Education published a report, Interna-tional Branch Campuses: Trends and Developments (Garrett, Kinser, Lane, and Merola 2016), which provides a full list of known IBCs in operation, along with data on year established, degrees and pro-grams offered, and student numbers. According to the report:
• There are 33 IBC “exporting” countries. The top exporters and the number of IBCs operated by their institutions are: United States (77), United Kingdom (38), France (28), Russia (21), and Australia (14).
• There are 76 IBC “importing” countries. The top importers and the number of IBCs they host are: China (32), United Arab Emirates (32), Singapore (12), Malaysia (12), and Qatar (11).

38 Mapping Internationalization on U .S . Campuses: 2017 Edition
Looking ForwardAs in 2011 and previous iterations of the survey, the final picture painted by the 2016 Mapping Survey data is of a complex landscape—with promising gains in many areas, slower (or no) progress in others, and some noteworthy shifts in broader trends and priorities. The past five years have generally seen greater institutional support for internationalization, in terms of administrative structures and staffing as well as financial resources. Articulated commitment to internationalization in mission statements and strategic plans is more prevalent, and is increasingly scaffolded by specific policies and programming that operationalize broad ideals. Associate and special focus institutions in particular have seen notable progress in a number of areas.
While the data in the individual pillars of the CIGE Model for Comprehensive Internationalization are for the most part encouraging, a comparison of overall percentages across categories indicates that for many insti-tutions, internationalization efforts are still focused first and foremost on the external. As noted at the beginning of this report, student mobility in both directions and international partnerships are identified as top priorities for internationalization; finer-grained data presented in subsequent sections reinforce their promi-nence.
On-campus internationalization efforts, in contrast, are seen as relatively less important; internationalization of the curriculum/co-curriculum and faculty professional development rank number four and number five, respectively, in terms of overall priorities for internationalization. Though 2016 saw progress in terms of stu-dent learning outcomes and academic requirements, still only about half of institutions reported active efforts toward curriculum internationalization. When it comes to faculty policies and support, progress over time has been markedly slower than in many other areas, and recognition of faculty contributions to internationalization is a concern going forward.
The external orientation for internationalization efforts is ultimately problematic in that it neglects the core of the academic enterprise. At its heart, higher education is about student learning, and for the majority of U.S. students who are not internationally mobile—as well as international students coming to U.S. institutions from around the world—that means the on-campus curriculum and co-curriculum. As the primary drivers of teach-ing and research, faculty are the lynchpins of student learning; in order for students to achieve global learning goals, faculty must be globally competent themselves, able to convey their international experience and exper-tise in the classroom, well prepared to engage effectively with international students, and actively committed to the internationalization endeavor.
It is not an accident that “curriculum, co-curriculum, and student learning outcomes,” and “faculty policies and practices” are the two center pillars of the CIGE Model for Comprehensive Internationalization. Their position is indicative of their importance; attention to these areas is critical in order for internationalization to fully take hold throughout colleges and universities, rather than remaining a peripheral activity. As core activities, they are arguably the hardest to change; going forward, however, they require increased effort and resources as institutions strive for deeper, more comprehensive campus internationalization.
Perhaps the biggest lesson to be learned from 20 years of Mapping Survey data is that internationalization is an ongoing, rarely linear process, with new issues, challenges, and opportunities continually emerging. In addition to providing insights into the current landscape, a key purpose of the Mapping study is to identify areas where additional research is needed—particularly when it comes to practical implications and good practices.
The data point to a number of topics that merit further investigation by CIGE, other organizations, scholars, and practitioners in the internationalization field. Examples include:

American Council on Education 39
• As the two primary perceived catalysts of campus internationalization, what are the specific roles of the president and the senior international officer in advancing the process? How can their efforts complement and reinforce each other?
• What funding models are emerging to support campus internationalization activities? How do insti-tutions identify and secure outside funding? Who on campus spearheads internationalization-focused fundraising initiatives, and how can they tap the resources and expertise of other offices, faculty, and staff?
• In light of the increased emphasis on internationally oriented co-curricular programming, how are in-stitutions integrating co-curricular and classroom-based global learning? Are campus-wide student learning outcomes an effective mechanism by which to facilitate this connection and reach a broad base of students?
• How can the increased administrative structures, staffing, and policies evident in the Mapping Survey data support and enhance—rather than supplant—faculty engagement in internationalization? What are the most effective means of promoting, incentivizing, and rewarding faculty members’ international activity?
• How effective are bridge and pathway programs when it comes to preparing international students for academic work, and integrating them into the campus community? How can institutions maximize the quality of the educational experience for participants in these programs?
• Given the increasing interest in particular countries (e.g., India) when it comes to recruiting interna-tional students and developing institutional partnerships, how are institutions currently engaging with counterparts in these countries? What are the key challenges they face, and what good practices are emerging to guide other U.S. institutions in developing bilateral relationships?
• How are institutions engaging with nonacademic partners and other entities abroad? Which types of activities are best facilitated by these collaborations? What regulatory, contractual, and legal issues arise, and how do they differ from the issues inherent in purely academic partnerships?
Finally, in looking toward the future of internationalization, it is impossible to ignore U.S. political develop-ments in early 2017. The Mapping Survey closed in December 2016—following the election of President Don-ald Trump, but prior to his inauguration. As of the writing of this report, the Trump administration has issued a series of executive orders and policy statements related to immigration and foreign relations that will likely impact, perhaps dramatically, student mobility—the aspect of internationalization delineated clearly by the data as the top priority for U.S. colleges and universities.
In a letter to the secretary of the Department of Homeland Security sent by ACE and 46 other U.S. higher edu-cation associations in response to the January 2017 executive order titled “Protecting the Nation from Foreign Terrorist Entry into the United States,” ACE President Molly Corbett Broad stated: “We fear the chilling effect this will have on the ability of international students and scholars to continue to see the U.S. as a welcoming place for study and research.” This “chilling effect” was also a central component of the court arguments that ultimately stayed the initial executive order.
While anecdotal reports from U.S. campuses as well as sources abroad indicate that the current political envi-ronment is indeed factoring into international students’ decisions about where to study, the long-term effect on student mobility numbers—and broader internationalization efforts—is difficult to predict. Responses will undoubtedly vary by institution and sector.
At a recent meeting of the current ACE Internationalization Laboratory cohort, some participants described the overall climate for internationalization as “demoralizing”; others, however, characterized it as

40 Mapping Internationalization on U .S . Campuses: 2017 Edition
“energizing”—a time to refocus and push forward. In light of new policy hurdles and a charged political climate, some colleges and universities may indeed turn away from internationalization activities. For others, though, momentum will continue, perhaps with different activities and emphases coming to the fore.
Rather than relying on direct recruiting of international students, for example, some institutions might seek to strengthen relationships with international partners as a means to facilitate student mobility. Others may develop new academic programming for overseas student populations, or enhance their capacity for virtual teaching and research collaborations. And some institutions may turn their internationalization focus inward, with increased attention and resources devoted to on-campus curricular, co-curricular, and faculty development initiatives—exactly what is needed, as noted previously, to advance progress toward comprehensive internation-alization in ways that an exclusively external orientation and ongoing emphasis on mobility will not allow.
Whatever happens in terms of politics and policy, the overall lesson from the Mapping study will likely endure: There are always challenges to internationalization, but there are always opportunities as well. Only time—and the 2022 edition of Mapping Internationalization on U.S. Campuses—will tell what impact the current political discourse will have, and how the internationalization journey will play out on U.S. college and university campuses in the coming years.
CIGE Research and ResourcesIn addition to those described in “Data Drill-Down” boxes throughout this report, CIGE offers a number of other reports and resources that explore the topics addressed by the Mapping Survey from a variety of perspectives. These include:
• Internationalization in Action. The Internationalization in Action series features insti-tutional strategies and good practices gathered from participants in CIGE programs and other experts in the field. Topics rotate regularly, and each installment includes analysis, examples, sample documents, and advice from a variety of institutions.
• Internationalization Toolkit. This online resource consists of examples of policies, pro-grams, surveys, and other resources collected from participants in the ACE Internation-alization Laboratory program and other institutions. Resources are organized according to the six aspects of the CIGE Model for Comprehensive Internationalization and are provided as models for other colleges and universities.
• CIGE Insights. CIGE Insights is a series of occasional papers exploring key issues and themes surrounding the internationalization and global engagement of higher education. Papers include data, analysis, expert commentary, case examples, and recommendations for policy and practice.
• International Briefs for Higher Education Leaders. Produced in partnership with the Bos-ton College Center for International Higher Education, the International Briefs for Higher Education Leaders series is designed to inform strategic decisions about international programs and initiatives. Aimed at college and university leaders, the briefs offer analysis and commentary on countries and topics of importance to higher education worldwide.

American Council on Education 41
ReferencesAssociation of International Education Administrators. 2014. Senior International Officer (SIO) Survey.
Durham, NC: Association of International Education Administrators. http://www.aieaworld.org/surveys.
Choudaha, Rahul. 2017. Landscape of Third-Party Pathway Partnerships in the United States. Washington, DC: NAFSA: Association of International Educators. http://www.nafsa.org/Professional_Resources/Browse_by_Interest/International_Students_and_Scholars/Landscape_of_Third-Party_Pathway_Partnerships_in_the_United_States.
Clinedinst, Melissa, Anna-Maria Koranteng, and Tara Nicola. 2015. State of College Admission. Arlington, VA: National Association for College Admission Counseling. https://indd.adobe.com/view/c555ca95-5bef-44f6-9a9b-6325942ff7cb.
Gagliardi, Jonathan S., Lorelle L. Espinosa, Jonathan M. Turk, and Morgan Taylor. 2017. American College Presi-dent Study 2017. Washington, DC: American Council on Education.
Garrett, Richard, Kevin Kinser, Jason E. Lane, and Rachael Merola. 2016. International Branch Campuses: Trends and Developments 2016. The Observatory on Borderless Higher Education and Cross-Border Educa-tion Research Team (C-BERT). http://www.obhe.ac.uk/documents/view_details?id=1035.
Goldberg, David, Dennis Looney, and Natalia Lusin. 2013. Enrollments in Languages Other Than English in United States Institutions of Higher Education, Fall 2013. New York: Modern Language Association. https://www.mla.org/content/download/31180/1452509/EMB_enrllmnts_nonEngl_2013.pdf.
Helms, Robin Matross. 2014. Mapping International Joint and Dual Degrees: U.S. Program Profiles and Perspec-tives. CIGE Insights. Washington, DC: American Council on Education. http://www.acenet.edu/news-room/Documents/Mapping-International-Joint-and-Dual-Degrees.pdf.
Helms, Robin Matross. 2015a. International Higher Education Partnerships: A Global Review of Standards and Practices. CIGE Insights. Washington, DC: American Council on Education. http://www.acenet.edu/news-room/Documents/CIGE-Insights-Intl-Higher-Ed-Partnerships.pdf.
Helms, Robin Matross. 2015b. Internationalizing the Tenure Code: Policies to Promote a Globally Focused Fac-ulty. CIGE Insights. Washington, DC: American Council on Education. http://www.acenet.edu/news-room/Documents/Internationalizing-the-Tenure-Code-Policies-to-Promote-a-Globally-Focused-Faculty.pdf.
Helms, Robin Matross 2015c. Internationalizing U.S. Higher Education: Current Policies, Future Directions. CIGE Insights. Washington, DC: American Council on Education. http://www.acenet.edu/news-room/Doc-uments/Current-Policies-Future-Directions-Part-2-US.pdf.
Helms, Robin Matross, Laura E. Rumbley, Lucia Brajkovic, and Georgiana Mihut. 2015. Internationalizing Higher Education Worldwide: National Policies and Programs. CIGE Insights. Washington, DC: American Council on Education. http://www.acenet.edu/news-room/Documents/National-Policies-and-Programs-Part-1-Global.pdf.
Institute of International Education. 2016. Open Doors Report on International Educational Exchange 2016. Washington, DC: Institute of International Education. https://www.iie.org/opendoors.
National Association for College Admission Counseling. 2013. Report of the Commission on International Student Recruitment to the National Association for College Admission Counseling. Arlington, VA: National Association for College Admission Counseling. https://www.nacacnet.org/globalassets/documents/ publications/international-initiatives/reportcommissioninternationalstudentrecuitment.pdf.

42 Mapping Internationalization on U .S . Campuses: 2017 Edition
National Association for College Admission Counseling. 2016. Statement of Principles of Good Practice. Arling-ton, VA: National Association for College Admission Counseling. https://www.nacacnet.org/globalassets/documents/advocacy-and-ethics/statement-of-principles-of-good-practice/spgp_10_1_2016_final.pdf.
National Center for Education Statistics. 2016. Integrated Postsecondary Education Data System (IPEDS). Washington, DC: U.S. Department of Education. https://nces.ed.gov/ipeds/Home/UseTheData.
Ward, Heather H. 2015. Connecting Classrooms: Using Online Technology to Deliver Global Learning. Inter-nationalization in Action. Washington, DC: American Council on Education. http://www.acenet.edu/news-room/Pages/Internationalization-in-Action-Special-Edition-Connecting-Classrooms-Using- Online-Technology-to-Deliver-Global-Learning.aspx.
West, Eddie, and Lindsay Addington. 2014. International Student Recruitment Agencies: A Guide for Schools, Colleges and Universities. Arlington, VA: National Association for College Admission Counseling. https://www.nacacnet.org/globalassets/documents/knowledge-center/international/internationalstudentrecruit-mentagencies_nacac.pdf.

American Council on Education 43
Appendix: MethodologyA total of 2,945 colleges and universities were invited to participate in ACE’s 2016 Mapping Internationaliza-tion on U.S. Campuses Survey. These included accredited, degree-granting institutions that had a designated IPEDS identification number, and were listed in the Higher Education Publications, Inc.’s Higher Education Directory database.
Data collection took place between February and December of 2016. CIGE first sent the survey to the provosts at these institutions, then contacted other key campus officers—namely senior international officers and institu-tional research directors. Finally, presidents of nonrespondent institutions were invited to participate. Respon-dents had the option to complete the survey online or submit a paper version.
A total of 1,164 valid responses were submitted, yielding a 39.5 percent response rate. The response rate exceeded the 31 percent obtained in the 2011 survey. As with previous studies, the 2011 and 2016 responding institutions are not a matched sample. Therefore, trends over time described in the report cannot be attributed to a specific set of institutions.
Data analysis was conducted by institutional type following the 2016 Carnegie Classifications of Institutions of Higher Education. The data weighting scheme included post-stratification weights, based on an algorithm called Iterative Proportional Fitting (IPF). The IPF aims to create a weight that reduces the difference between observed and expected values, where the expected values are the actual population distribution of the institu-tional types. This approach allows the representation of each institutional type to mirror as closely as possible the distribution of the population of all accredited, degree-granting institutions. The data from the 2011 survey appearing in this report have been re-weighted using the IPF approach in order to provide a more accurate longitudinal comparison with the 2016 survey data.
As in 2011, the 2016 iteration of the survey included special focus institutions, providing a more comprehen-sive overview of the national higher education landscape than in previous years. Special focus institutions are defined as institutions awarding baccalaureate or higher-level degrees where a high concentration of degrees (more than 75 percent) is in a single field or set of related fields (excludes tribal colleges). The national averages reported in the 2011 and 2016 studies include special focus institutions. However, comparative data from 2001 and 2006 are not available for this sector.

100 Years of Leadership and Advocacy