2017 aarp brain health and nutrition study · pdf filethis report was prepared by laura...
TRANSCRIPT

AARP RESEARCH | AARP.ORG/RESEARCH | © 2018 AARP. ALL RIGHTS RESERVED
2017 AARP Brain Health and Nutrition Survey
Laura Mehegan, Chuck Rainville, and Laura SkufcaAARP ResearchJanuary 2018
https://doi.org/10.26419/res.00187.001

AARP RESEARCH | AARP.ORG/RESEARCH | © 2018 AARP. ALL RIGHTS RESERVEDAARP RESEARCH | AARP.ORG/RESEARCH | © 2018 AARP. ALL RIGHTS RESERVED 2
About AARPAARP is the nation’s largest nonprofit, nonpartisan organization dedicated to empowering Americans 50and older to choose how they live as they age. With nearly 38 million members and offices in every state,the District of Columbia, Puerto Rico, and the U.S. Virgin Islands, AARP works to strengthen communitiesand advocate for what matters most to families with a focus on health security, financial stability andpersonal fulfillment. AARP also works for individuals in the marketplace by sparking new solutions andallowing carefully chosen, high-quality products and services to carry the AARP name. As a trusted sourcefor news and information, AARP produces the nation's largest circulation publications, AARP TheMagazine and AARP Bulletin. To learn more, visit www.aarp.org or follow @AARP and @AARPadvocateson social media.
The views expressed herein are for information, debate, and discussion, and do not necessarily representofficial policies of AARP.
Acknowledgments
GfK conducted this survey for AARP using its nationally representative online panel, Knowledge Panel.This report was prepared by Laura Mehegan, Chuck Rainville & Laura Skufca in AARP Research. Foradditional information about the survey, contact Laura Mehegan at [email protected]. Media inquiriesshould be directed to Greg Phillips at [email protected].

AARP RESEARCH | AARP.ORG/RESEARCH | © 2018 AARP. ALL RIGHTS RESERVEDAARP RESEARCH | AARP.ORG/RESEARCH | © 2018 AARP. ALL RIGHTS RESERVED
Objectives
• To characterize the eating habits of adults age 40and older.
• To understand adults’ willingness to eat a healthierdiet and the barriers preventing them from healthyeating.
• To explore the relationship between mental well-being and brain health with eating habits.
3

AARP RESEARCH | AARP.ORG/RESEARCH | © 2018 AARP. ALL RIGHTS RESERVEDAARP RESEARCH | AARP.ORG/RESEARCH | © 2018 AARP. ALL RIGHTS RESERVED
Methodology• An online survey fielded October 25-November 8, 2017 among a
nationally representative sample of 2,033 Americans age 40+.
• Additional interviews were conducted to achieve the following samples :
– 351 Hispanic/Latinos age 40+ (conducted in both English andSpanish)
– 350 African Americans age 40+
– 200 Asian Americans age 40+.
• The data were weighted by age, gender, race, ethnicity, employmentstatus and income.
• All estimates are for the general 40+ US population unless otherwisenoted.
• The margin of error for the national sample of adults age 40+ is +/- 2.7percentage points. The margin of error among subgroups (e.g., agecohorts, race/ethnicity oversamples) is higher.
• Percentages may not equal 100% due to rounding.
4

AARP RESEARCH | AARP.ORG/RESEARCH | © 2018 AARP. ALL RIGHTS RESERVEDAARP RESEARCH | AARP.ORG/RESEARCH | © 2018 AARP. ALL RIGHTS RESERVED
Key FindingsMAJOR TAKEAWAYS
• Adults who eat at least the recommended amount of fruits and vegetables reportbetter brain health and have higher average mental well-being scores. The moreservings of fruits and vegetables consumed, the better the brain health andmental well-being scores.
• But most adults age 40 and older are not getting the proper nutrition. Virtually noone consumed the recommended number of servings in all five food groups andone-third did not consume the recommended amount in ANY food group.
• Four in 10 or more adults age 40 and older consumed the United StatesDepartment of Agriculture (USDA)-recommended amount of fruits (1.5-2 cups perday) and vegetables (2-3 cups per day) but very few consumed therecommended amount of dairy (3 cups per day), grain foods (5-7 servings perday), or protein (5-6 servings per day). A large majority of adults consumed toofew servings in these three food groups.
• Nearly nine in 10 adults say they would eat a healthy diet if they were aware thatit could reduce their risk off cognitive decline, heart disease, or diabetes.
5

AARP RESEARCH | AARP.ORG/RESEARCH | © 2018 AARP. ALL RIGHTS RESERVEDAARP RESEARCH | AARP.ORG/RESEARCH | © 2018 AARP. ALL RIGHTS RESERVED
Key FindingsMAJOR TAKEAWAYS
• AARP has the potential to help adults eat a more brain-healthy diet. More than 60percent of adults age 40 and older said that they would eat more fish, less redmeat, and lower their dairy fat intake if they knew it was good for their brainhealth.
• About 40 percent of adults said the barriers to eating a healthy diet were thedifficulty and expense. This shows AARP has the potential to help by providingadults with practical tips to make it easier for them to eat a healthy diet for lessmoney.
• Fewer barriers to healthy eating were noted by adults who eat the recommendedamount of fruits and vegetables per day.
• Healthcare providers are missing an opportunity to discuss diet and nutrition withtheir patients. More than half of adults (51%) say they would be more likely to eata healthier diet if their doctor recommended it but few report that their doctors(10%) are recommending they follow a special eating plan.
6

AARP RESEARCH | AARP.ORG/RESEARCH | © 2018 AARP. ALL RIGHTS RESERVEDAARP RESEARCH | AARP.ORG/RESEARCH | © 2018 AARP. ALL RIGHTS RESERVED
Key FindingsNutrition and Brain Health
• Adults age 40 and older who eat healthy most of the time are twice as likely to report theirbrain health as “excellent” or “very good” compared to those who rarely do (77% vs. 39%)and have significantly higher average mental well-being scores.
• But more than six in 10 (63%) adults eat poorly saying they ate well only three or four daysper week or less often. Significantly more adults age 65 and older said they ate nutritiously“most of the time” compared to adults age 40-54.
• Women eat better than men. Twice as many women than men eat the recommendedamounts of both fruits and vegetables.
• Adults age 40 and older who eat fish/seafood in a typical week but not red meat reportbetter brain health and higher average mental well-being scores compared to individualswho eat red meat but not fish/seafood in a typical week.
• Individuals who follow some of the eating patterns included in the Mediterranean diet reportbetter brain health and higher mental well-being scores. This includes those who eatfish/seafood, raw nuts, and olive oil in a typical week.
7

AARP RESEARCH | AARP.ORG/RESEARCH | © 2018 AARP. ALL RIGHTS RESERVEDAARP RESEARCH | AARP.ORG/RESEARCH | © 2018 AARP. ALL RIGHTS RESERVED
Key FindingsWillingness to Change Eating Habits
• A majority of adults age 40 and older said they are confident they can eat a healthier dietand intend to do so. Those who show confidence and intent are more likely to report betterbrain health, better overall health, and higher average mental well-being scores.
• Large majorities of adults say they would be likely to eat a healthy diet knowing it mayreduce their risk of cognitive decline/dementia, diabetes, and heart disease. Interestingly,adults with heart disease are slightly but significantly less likely to change their diet tobenefit their heart.
• Most adults say they are likely to change their diet in specific ways knowing it is good fortheir brain (eat more fish/seafood, limit red meat, limit whole-fat dairy):
– Those who already eat brain-healthy fish/seafood in a typical week are more likely tosay they will eat even more fish/seafood and less red meat compared to red-meat-eaters
– Those who already eat low-fat dairy options are significantly more likely to say theywill limit the whole-fat dairy in their diets compared to those who eat all whole-fat dairy.
8

AARP RESEARCH | AARP.ORG/RESEARCH | © 2018 AARP. ALL RIGHTS RESERVEDAARP RESEARCH | AARP.ORG/RESEARCH | © 2018 AARP. ALL RIGHTS RESERVED
Key FindingsBarriers to Healthy Eating and Food Insecurity
• The difficulty in doing so, the cost, personal identity as not a “healthy foods” type of person, andtaste were key road blocks noted for healthy eating. Additionally, a majority mentioned that arecommendation from their doctor would make adults age 40 and older more likely to eat healthy.
• Adults who have a body mass index (BMI) in the obese range are more likely to cite barriers tohealthy eating compared to those who have a lower BMI. These particular individuals areespecially likely to say eating healthy would be too expensive, too difficult, and that they are not a“healthy foods” type of person.
• Adults age 40-54 were significantly more likely to cite barriers to healthy eating compare to adultsage 65 and older.
9

AARP RESEARCH | AARP.ORG/RESEARCH | © 2018 AARP. ALL RIGHTS RESERVEDAARP RESEARCH | AARP.ORG/RESEARCH | © 2018 AARP. ALL RIGHTS RESERVED
Many adults age 40 and older consume the foods that are thought to begood for brain health.
10
Berries:33%
Oliveoil: 50%
Raw nuts:36%
Fish/seafood:52%
Recommendedservings of
vegetables perday: 40%
Recommendedservings of fruit
per day: 46%
Beans/legumes:51%
All/mostlylow-fat
dairy: 51%
Coffee:65%
Greenand/or black
tea: 20%
Red wine:16%
Moderate to lightdrinkers (amongdrinkers): Men:
82%, Women: 85%
Darkchocolate:
27%

AARP RESEARCH | AARP.ORG/RESEARCH | © 2018 AARP. ALL RIGHTS RESERVEDAARP RESEARCH | AARP.ORG/RESEARCH | © 2018 AARP. ALL RIGHTS RESERVED
Dietary Recommendations, BrainHealth, and Mental Well-Being*
11
*Warwick-Edinburgh Mental Well-Being Scale (WEMWBS) © NHS Health Scotland, University of Warwick and University of Edinburgh, 2006,all rights reserved. Scale consists of 14-items and ranges from 14-70.

AARP RESEARCH | AARP.ORG/RESEARCH | © 2018 AARP. ALL RIGHTS RESERVEDAARP RESEARCH | AARP.ORG/RESEARCH | © 2018 AARP. ALL RIGHTS RESERVED
Adults age 40+, on average, are more likely to consume enough fruitsand vegetables but not enough dairy, protein, or grains.
12
* From: https://www.choosemyplate.gov/ (Amount varies by age and gender)
What should people eat?*
1.5-2 cups per day 2-3 cups per day 5-7 servings per day3 cups per day 5-6 servings day
46%40%
19%
8%2%
Fruit Vegetables Dairy Protein Grain foods
Percent who consume the recommended amount from each food group*
*A recently released report from the CDC (Lee-Kwan, Moore, Blanck, Harris, & Galuska, 2017) concluded that many fewer adults eat the recommendedamount of fruits and vegetables compared to the 2017 AARP Brain Health and Nutrition Survey. The difference in the results of the two studies is due toseveral factors including different survey methods (data collection mode and instrument) with different stated objectives.

AARP RESEARCH | AARP.ORG/RESEARCH | © 2018 AARP. ALL RIGHTS RESERVEDAARP RESEARCH | AARP.ORG/RESEARCH | © 2018 AARP. ALL RIGHTS RESERVED
Virtually no one consumes the dietary recommendations in all five foodgroups and one-third (34%) of adults age 40 and older do not meet thedietary recommendations in any of the food groups.
13
Q6 to Q10 About how many servings of [fruits, vegetables, grain foods, protein, dairy] do you eat in a typical day?Note: Examples of servings were provided for each food group
Food groupPercent who consumed no servings to six or more servings per day, by food group
None One Two Three Four Five Six or more
Fruits 14% 40% 27% 13% 4% 1% 1%
Vegetables 7% 32% 35% 17% 5% 2% 2%
Grain foods 8% 33% 31% 18% 6% 2% 2%
Protein 1% 20% 34% 24% 10% 5% 6%
Dairy 10% 40% 30% 13% 3% 2% 2%
34% 31%23%
10%2% 1%
No food groups 1 food group 2 food groups 3 food groups 4 food groups All food groups
Out of five food groups, the percentage of adults who consumed therecommended number of servings in each

AARP RESEARCH | AARP.ORG/RESEARCH | © 2018 AARP. ALL RIGHTS RESERVEDAARP RESEARCH | AARP.ORG/RESEARCH | © 2018 AARP. ALL RIGHTS RESERVED
44%
22%17% 16%
7%2%
48%
56%
36%
22%
9%2%
0%
20%
40%
60%
80%
100%
Fruit Vegetables* Both fruitsand vegetables*
Dairy* Protein Grains
Percent who consume the recommended amount of servings for each foodgroup, by gender
Men Women
More than twice as many women than men consume the recommendedamount of fruits and vegetables combined and vegetables alone.Women are also more likely to consume the recommended amount ofdairy foods.
14
*Statistically significant difference.
AARP RESEARCH | AARP.ORG/RESEARCH | © 2018 AARP. ALL RIGHTS RESERVEDAARP RESEARCH | AARP.ORG/RESEARCH | © 2018 AARP. ALL RIGHTS RESERVED
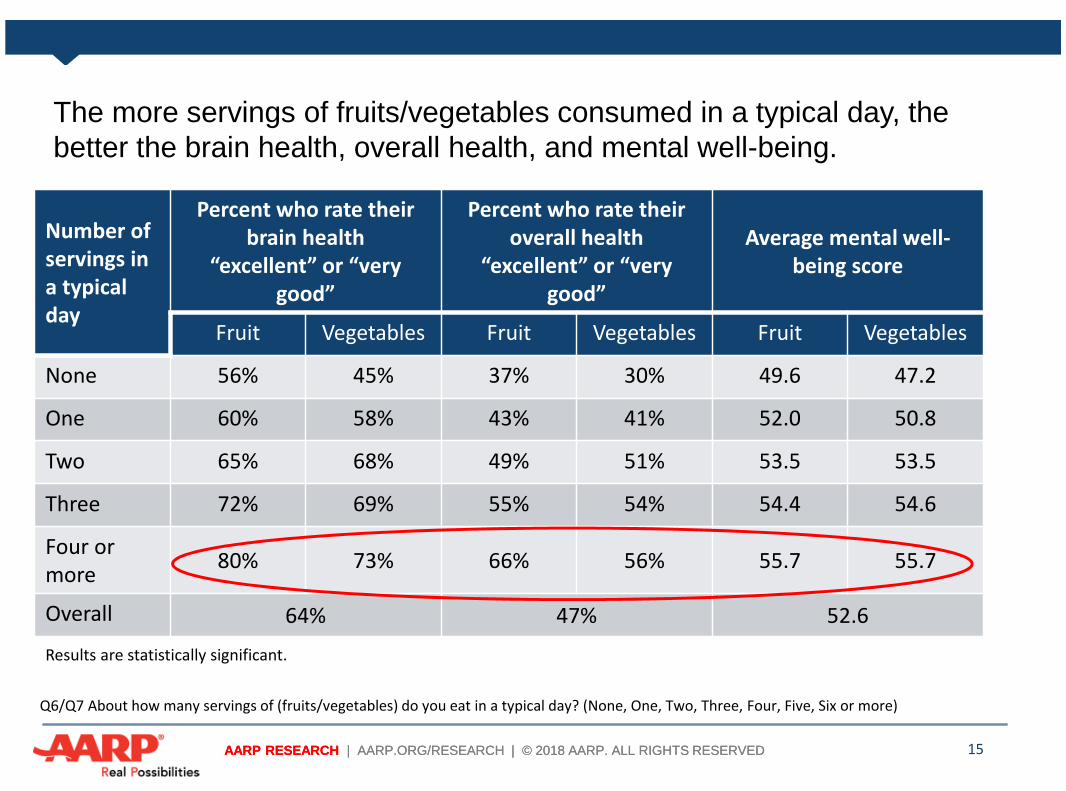
The more servings of fruits/vegetables consumed in a typical day, thebetter the brain health, overall health, and mental well-being.
15
Q6/Q7 About how many servings of (fruits/vegetables) do you eat in a typical day? (None, One, Two, Three, Four, Five, Six or more)
Number ofservings ina typicalday
Percent who rate theirbrain health
“excellent” or “verygood”
Percent who rate theiroverall health
“excellent” or “verygood”
Average mental well-being score
Fruit Vegetables Fruit Vegetables Fruit Vegetables
None 56% 45% 37% 30% 49.6 47.2
One 60% 58% 43% 41% 52.0 50.8
Two 65% 68% 49% 51% 53.5 53.5
Three 72% 69% 55% 54% 54.4 54.6
Four ormore
80% 73% 66% 56% 55.7 55.7
Overall 64% 47% 52.6
Results are statistically significant.

AARP RESEARCH | AARP.ORG/RESEARCH | © 2018 AARP. ALL RIGHTS RESERVEDAARP RESEARCH | AARP.ORG/RESEARCH | © 2018 AARP. ALL RIGHTS RESERVED
Adults age 40 and older who eat the recommended amount of fruits andvegetables report better brain health.
16
70% 69% 68%61% 59% 61%
0%
20%
40%
60%
80%
100%
Both fruits and vegetables Fruit Vegetables
Percent who rate their brain health as “excellent” or “very good,” by theconsumption of recommended amounts of fruits and vegetables
Consumes recommended amount Consumes less than recommended amount
Q6/Q7 About how many servings of (fruits/vegetables) do you eat in a typical day? (None, One, Two, Three, Four, Five, Six or more)
Results are statistically significant.

AARP RESEARCH | AARP.ORG/RESEARCH | © 2018 AARP. ALL RIGHTS RESERVEDAARP RESEARCH | AARP.ORG/RESEARCH | © 2018 AARP. ALL RIGHTS RESERVED
More than six in 10 (63%) adults age 40 and older eat poorly saying that they“ate nutritious and well-balanced meals” three or four days per week or lessoften. While about one-third (35%) ate nutritiously “most or all of the time,”significantly more adults age 65+ ate well.
17
35%37%
20%
6%
0%
10%
20%
30%
40%
50%
Most or all of thetime (5-7 days)
Moderate amountof time (3-4 days)
Little of the time(1-2 days)
Rarely(less than 1 day)
Percent of time “ate nutritious and well-balanced meals”
Q5 Below is a list of the ways you might have felt or behaved. How often did you do the following during the past week? I ate nutritious and well-balanced meals [Rarely or none of the time (less than 1 day); Some or little of the time (1-2 days); Occasionally or a moderate amount of time (3-4 days);Most or all of the time (5-7 days)]
Significantlymore adults age65 and older said
they atenutritiously 5-7days per weekcompared to
adults age 40-54(44% vs. 28%).

AARP RESEARCH | AARP.ORG/RESEARCH | © 2018 AARP. ALL RIGHTS RESERVEDAARP RESEARCH | AARP.ORG/RESEARCH | © 2018 AARP. ALL RIGHTS RESERVED
Adults age 40-54 are less likely to report that they eat nutritious mealscompared to adults age 65 and older. Relatedly, these younger adults are morelikely to specify certain barriers to healthy eating. Interestingly, it is those whoare age 65 and older who are more likely to think changing their diet will notmake a difference.
18
Barriers to Healthy EatingPercent who agree, by age
Age 40-54 Age 55-64 Age 65+
Eating healthy would be too expensive 44% 38% 27%
Family may not like the taste of healthyfoods
35% 24% 23%
It’s hard to eat a healthy diet 45% 34% 36%
I want to eat a healthy diet but thereare no stores nearby that sell healthyfoods
12% 9% 6%
Changing my diet will not make thatmuch of a difference
14% 16% 22%
AARP RESEARCH | AARP.ORG/RESEARCH | © 2018 AARP. ALL RIGHTS RESERVEDAARP RESEARCH | AARP.ORG/RESEARCH | © 2018 AARP. ALL RIGHTS RESERVED
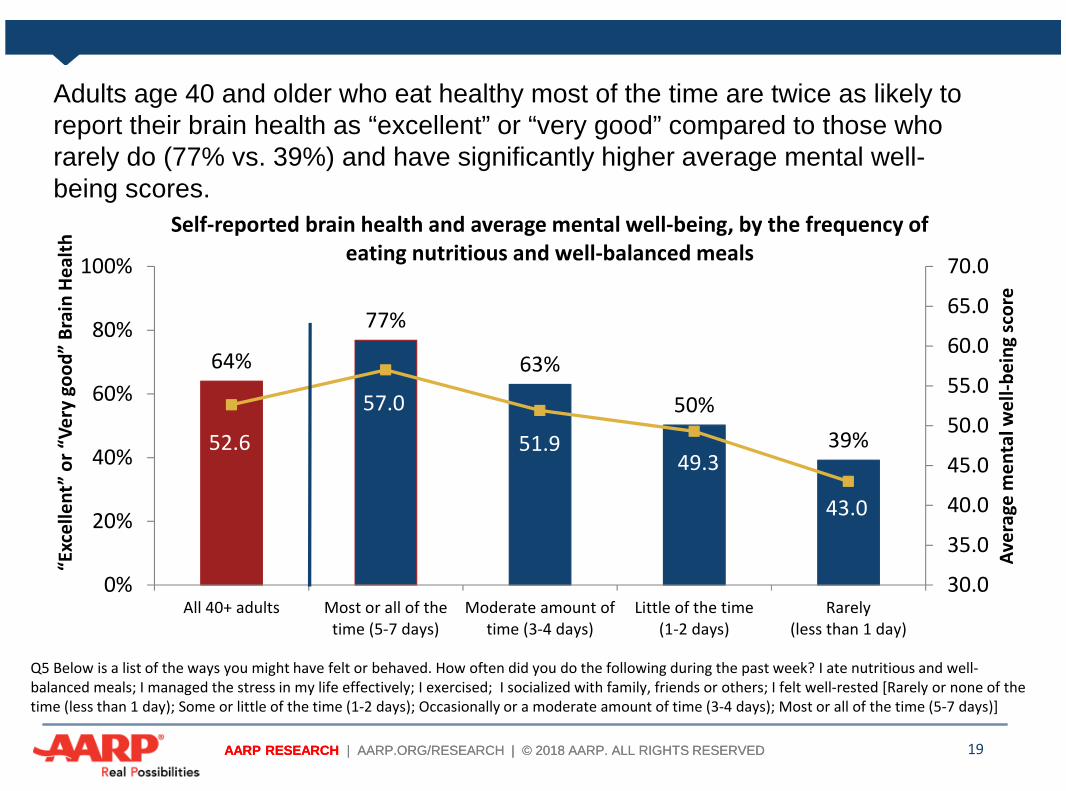
Adults age 40 and older who eat healthy most of the time are twice as likely toreport their brain health as “excellent” or “very good” compared to those whorarely do (77% vs. 39%) and have significantly higher average mental well-being scores.
19
64%
77%
63%
50%
39%52.6
57.0
51.949.3
43.0
30.0
35.0
40.0
45.0
50.0
55.0
60.0
65.0
70.0
0%
20%
40%
60%
80%
100%
All 40+ adults Most or all of thetime (5-7 days)
Moderate amount oftime (3-4 days)
Little of the time(1-2 days)
Rarely(less than 1 day)
Ave
rage
me
nta
lwe
ll-b
ein
gsc
ore
“Exc
elle
nt”
or
“Ve
rygo
od
”B
rain
He
alth
Self-reported brain health and average mental well-being, by the frequency ofeating nutritious and well-balanced meals
Q5 Below is a list of the ways you might have felt or behaved. How often did you do the following during the past week? I ate nutritious and well-balanced meals; I managed the stress in my life effectively; I exercised; I socialized with family, friends or others; I felt well-rested [Rarely or none of thetime (less than 1 day); Some or little of the time (1-2 days); Occasionally or a moderate amount of time (3-4 days); Most or all of the time (5-7 days)]

AARP RESEARCH | AARP.ORG/RESEARCH | © 2018 AARP. ALL RIGHTS RESERVEDAARP RESEARCH | AARP.ORG/RESEARCH | © 2018 AARP. ALL RIGHTS RESERVED
Selected Foods, Brain Health,and Mental Well-Being
20

AARP RESEARCH | AARP.ORG/RESEARCH | © 2018 AARP. ALL RIGHTS RESERVEDAARP RESEARCH | AARP.ORG/RESEARCH | © 2018 AARP. ALL RIGHTS RESERVED
Adults consume more red meat than the healthier option of fish/seafoodin a typical week.
21
Type of food% who consume in a typical
week% who consume 3+ days per
week
Healthy FoodsAny type of fish/seafoodBeans and legumesOlive oilRaw nutsBerries
52%51%50%38%33%
13%25%33%23%20%
Less Healthy FoodsRed meatDessertsBeverages with sugarPrepared foods (e.g.,frozen dinners, cannedsoups and stews, etc.)
66%50%35%32%
33%28%22%15%
Q13 In a typical week, do you consume any of the following?Q13a How often do you consume each of the following in a typical week? Rarely (less than 1 day); Some or little of the time (1-2days); Occasionally or a moderate amount of time (3-4 days); Most or all of the time (5-7 days)

AARP RESEARCH | AARP.ORG/RESEARCH | © 2018 AARP. ALL RIGHTS RESERVEDAARP RESEARCH | AARP.ORG/RESEARCH | © 2018 AARP. ALL RIGHTS RESERVED
Adults age 40 and older who eat fish/seafood and raw nuts aresignificantly more likely to report better brain health.
22
67% 68%60% 61%
0%
20%
40%
60%
80%
100%
Fish/seafood* Raw nuts
Yes No
Q13 In a typical week, do you consume any of the following? (Shellfish; Dark-meat fish; Light-meal fish; Raw nuts)*Items were combined.
Percent who rate their brain health as “excellent” or “very good,” by the consumptionof certain healthy foods in a typical week
Eat more of this….

AARP RESEARCH | AARP.ORG/RESEARCH | © 2018 AARP. ALL RIGHTS RESERVEDAARP RESEARCH | AARP.ORG/RESEARCH | © 2018 AARP. ALL RIGHTS RESERVED
Adults age 40 and older who eat sugary drinks/desserts and prepared foods aresignificantly less likely to report that their brain health is “excellent” or “verygood.”
23
Q13 In a typical week, do you consume any of the following? (Beverages containing sugar; Desserts such as cakes, pies, cookies, pastries, or othersweets)*Items were combined.
59% 60%69% 66%
0%
20%
40%
60%
80%
100%
Beverages with sugarand dessert*
Prepared foods
Yes No
Percent who rate their brain health as “excellent” or “very good,” by the consumptionof less-healthy foods in a typical week
Eat less of this….
AARP RESEARCH | AARP.ORG/RESEARCH | © 2018 AARP. ALL RIGHTS RESERVEDAARP RESEARCH | AARP.ORG/RESEARCH | © 2018 AARP. ALL RIGHTS RESERVED
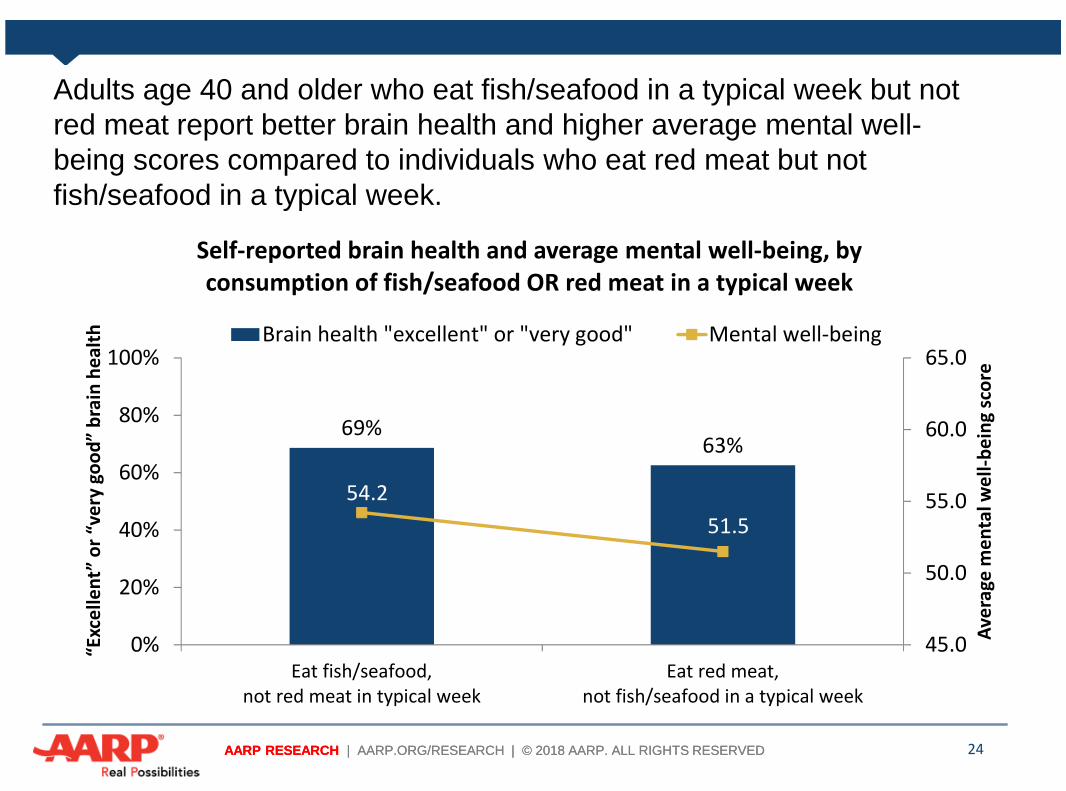
Adults age 40 and older who eat fish/seafood in a typical week but notred meat report better brain health and higher average mental well-being scores compared to individuals who eat red meat but notfish/seafood in a typical week.
24
69%63%
54.2
51.5
45.0
50.0
55.0
60.0
65.0
0%
20%
40%
60%
80%
100%
Eat fish/seafood,not red meat in typical week
Eat red meat,not fish/seafood in a typical week
Ave
rage
me
nta
lwe
ll-b
ein
gsc
ore
“Exc
elle
nt”
or
“ve
rygo
od
”b
rain
he
alth
Self-reported brain health and average mental well-being, byconsumption of fish/seafood OR red meat in a typical week
Brain health "excellent" or "very good" Mental well-being

AARP RESEARCH | AARP.ORG/RESEARCH | © 2018 AARP. ALL RIGHTS RESERVEDAARP RESEARCH | AARP.ORG/RESEARCH | © 2018 AARP. ALL RIGHTS RESERVED
Olive oil, a healthy option, is used for cooking by nearly two-thirds(65%) of adults age 40+ and a majority use it most for cooking. Adultswith higher annual incomes are more likely to use olive oil for cookingcompared to those with lower incomes.
25
Q12 Which of the following types of oils do you use for cooking?Q12a Of the types of oils you use for cooking, which do you use the most?
1%2%4%4%5%
9%13%14%
38%39%42%
65%
0% 20% 40% 60% 80% 100%
Lard or type of animal fat
Safflower oil
Grapeseed oil
Sunflower oil
Peanut oil
Crisco
Coconut oil
Margarine
Butter
Canola oil
Vegetable oil
Olive oil
Percent who cook with each common type ofoil/fat
Oil used mostoften for
cooking (62%)
Three-quarters of adultswith an annual income of
$75,000 or more useolive oil for cookingcompared to half of
those with an annualincome of less than
$40,000 and six in 10(62%) with an incomebetween $40,000 and
$74,999.
AARP RESEARCH | AARP.ORG/RESEARCH | © 2018 AARP. ALL RIGHTS RESERVEDAARP RESEARCH | AARP.ORG/RESEARCH | © 2018 AARP. ALL RIGHTS RESERVED
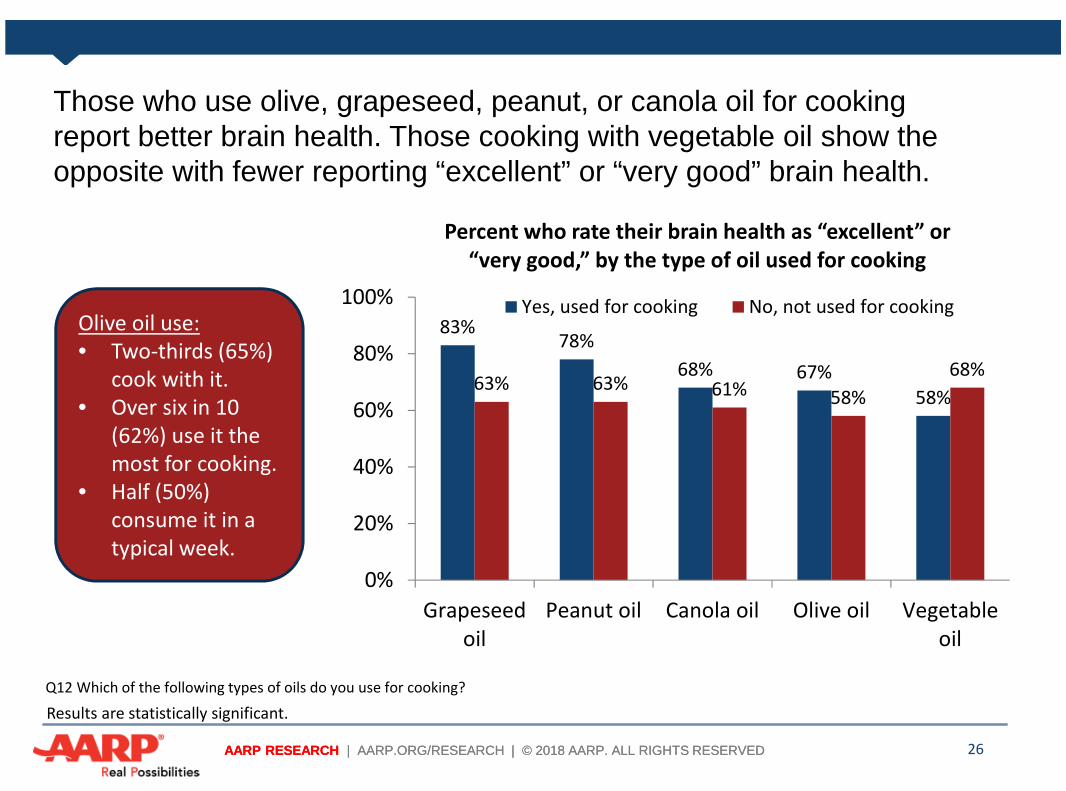
Those who use olive, grapeseed, peanut, or canola oil for cookingreport better brain health. Those cooking with vegetable oil show theopposite with fewer reporting “excellent” or “very good” brain health.
26
83%78%
68% 67%58%
63% 63% 61% 58%
68%
0%
20%
40%
60%
80%
100%
Grapeseedoil
Peanut oil Canola oil Olive oil Vegetableoil
Percent who rate their brain health as “excellent” or“very good,” by the type of oil used for cooking
Yes, used for cooking No, not used for cooking
Q12 Which of the following types of oils do you use for cooking?
Olive oil use:• Two-thirds (65%)
cook with it.• Over six in 10
(62%) use it themost for cooking.
• Half (50%)consume it in atypical week.
Results are statistically significant.

AARP RESEARCH | AARP.ORG/RESEARCH | © 2018 AARP. ALL RIGHTS RESERVEDAARP RESEARCH | AARP.ORG/RESEARCH | © 2018 AARP. ALL RIGHTS RESERVED
Willingness to Change EatingHabits
27

AARP RESEARCH | AARP.ORG/RESEARCH | © 2018 AARP. ALL RIGHTS RESERVEDAARP RESEARCH | AARP.ORG/RESEARCH | © 2018 AARP. ALL RIGHTS RESERVED
A majority of adults age 40 and older are confident they can eat ahealthier diet and intend to. Significantly more women than men agree.
28
Q21/25 Suppose you found out that eating a healthy, well-balanced diet could help you maintain or improve your brain health. Knowing this,please indicate whether you agree or disagree with the following statements: (a) I am confident I can eat a healthier, well-balanced diet. (b) Iintend to make eating a healthy, well-balanced diet part of my regular routine. (7-point scale where 1=strongly disagree, 7=strongly agree)
64%56%
19%25%
17% 18%
0%
20%
40%
60%
80%
100%
Confident Intent
Percent who are confident they can eat a healthierdiet and intend to do so based on knowledge that it
can maintain or improve brain health
Agree (5,6,7) Neutral Disagree (1,2,3)
Significant differences werenoted by gender andrace/ethnicity:• Women (67%) were more
confident than men (60%)they can eat a healthy dietand more women intendto do so (61% vs. 51%).
• More Hispanic/Latinoadults agreed they intendto make healthy eatingpart of their regularroutine compared to thegeneral population (66%vs. 56%).

AARP RESEARCH | AARP.ORG/RESEARCH | © 2018 AARP. ALL RIGHTS RESERVEDAARP RESEARCH | AARP.ORG/RESEARCH | © 2018 AARP. ALL RIGHTS RESERVED
Adults age 40 and older who are confident they can eat a healthy dietand intend to do so are significantly more likely to report their brainhealth and overall health as “excellent” or “very good” and they alsohave higher average mental well-being scores.
29
ConfidenceIndividuals who are confidentthey can eat a healthy dietcompared to those who are notconfident are more likely toreport:• “Excellent” or “very good”
brain health (68% vs. 57%)• “Excellent” or “very good”
overall health (54% vs. 38%)• Higher average mental well-
being scores (54.1 vs. 50.1)
IntentIndividuals who intend to eat ahealthy diet compared to thosewho do not are more likely toreport:• “Excellent” or “very good”
brain health (70% vs. 58%)• “Excellent” or “very good”
overall health (54% vs. 39%)• Higher average mental well-
being scores (54.5 vs. 49.5)
AARP RESEARCH | AARP.ORG/RESEARCH | © 2018 AARP. ALL RIGHTS RESERVEDAARP RESEARCH | AARP.ORG/RESEARCH | © 2018 AARP. ALL RIGHTS RESERVED
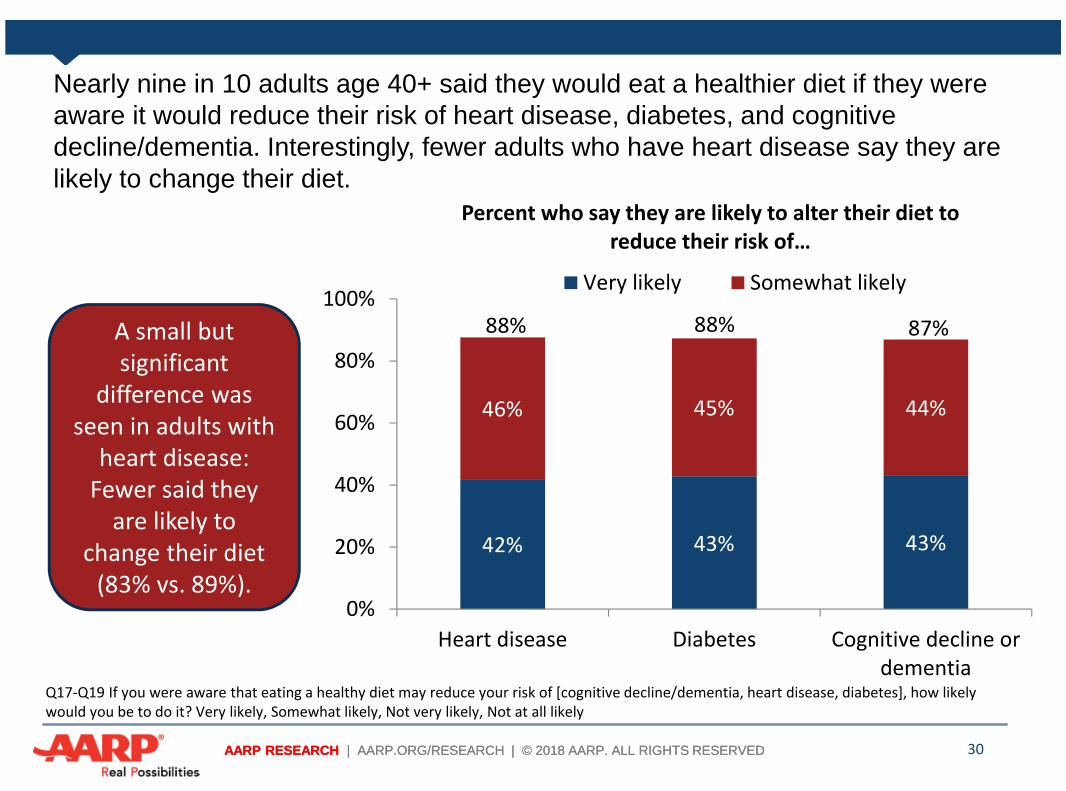
Nearly nine in 10 adults age 40+ said they would eat a healthier diet if they wereaware it would reduce their risk of heart disease, diabetes, and cognitivedecline/dementia. Interestingly, fewer adults who have heart disease say they arelikely to change their diet.
30
42% 43% 43%
46% 45% 44%
0%
20%
40%
60%
80%
100%
Heart disease Diabetes Cognitive decline ordementia
Percent who say they are likely to alter their diet toreduce their risk of…
Very likely Somewhat likely
88% 87%88%A small butsignificant
difference wasseen in adults with
heart disease:Fewer said they
are likely tochange their diet
(83% vs. 89%).
Q17-Q19 If you were aware that eating a healthy diet may reduce your risk of [cognitive decline/dementia, heart disease, diabetes], how likelywould you be to do it? Very likely, Somewhat likely, Not very likely, Not at all likely

AARP RESEARCH | AARP.ORG/RESEARCH | © 2018 AARP. ALL RIGHTS RESERVEDAARP RESEARCH | AARP.ORG/RESEARCH | © 2018 AARP. ALL RIGHTS RESERVED
A majority of adults age 40+ said they would be likely to make specificdietary changes because it is good for their brain health.
31
31% 27% 23%
38% 40% 40%
0%
20%
40%
60%
80%
100%
Limit whole-fat dairy More Fish/Seafood Less red meat
Percent who say they are likely to alter their diets in specific waysbecause it’s better for their brain health
Very likely Somewhat likely
69%63%67%
Q14 If you were aware that eating fish/seafood is good for your brain health, how likely would you be to increase the amount of fish/seafood inyour diet? Q15 If you were aware eating less red meat is better for your brain health, how likely would be to limit the amount of red meat in yourdiet? Q16 If you were aware eating low-fat dairy is better for your brain health than whole-fat dairy, how likely would you be to limit the amountof whole-fat dairy in your diet?
AARP RESEARCH | AARP.ORG/RESEARCH | © 2018 AARP. ALL RIGHTS RESERVEDAARP RESEARCH | AARP.ORG/RESEARCH | © 2018 AARP. ALL RIGHTS RESERVED
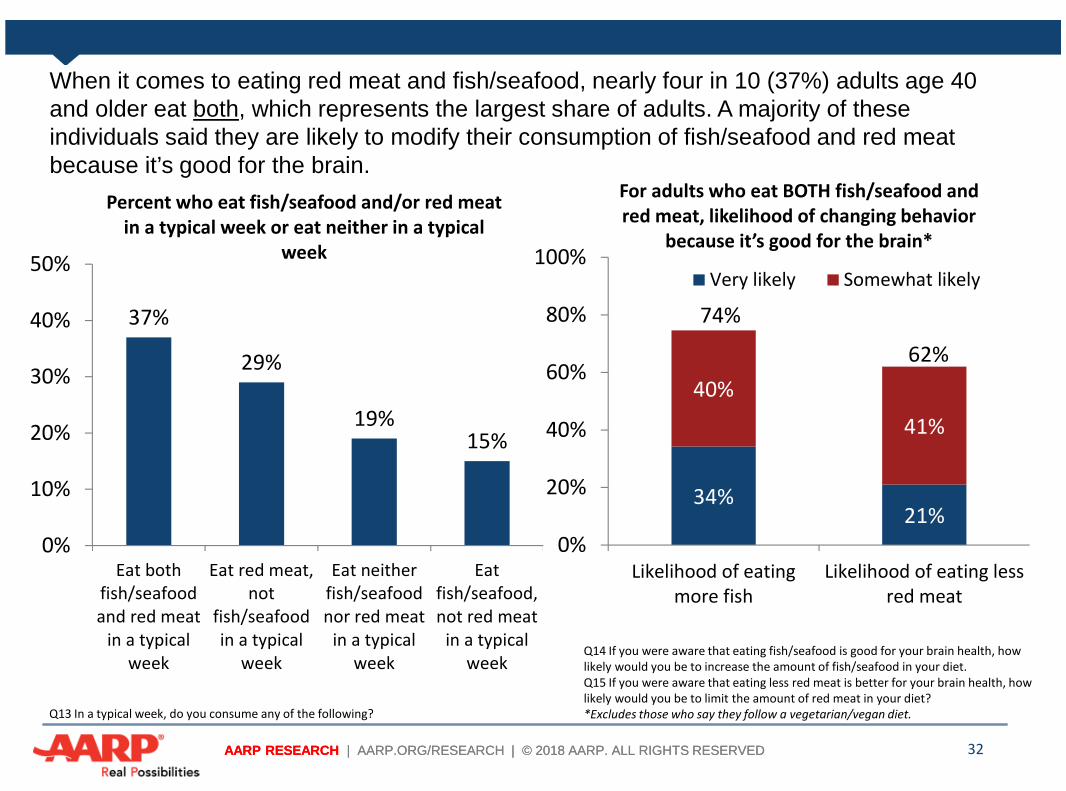
When it comes to eating red meat and fish/seafood, nearly four in 10 (37%) adults age 40and older eat both, which represents the largest share of adults. A majority of theseindividuals said they are likely to modify their consumption of fish/seafood and red meatbecause it’s good for the brain.
32
37%
29%
19%15%
0%
10%
20%
30%
40%
50%
Eat bothfish/seafoodand red meat
in a typicalweek
Eat red meat,not
fish/seafoodin a typical
week
Eat neitherfish/seafoodnor red meat
in a typicalweek
Eatfish/seafood,not red meat
in a typicalweek
Percent who eat fish/seafood and/or red meatin a typical week or eat neither in a typical
week
34%21%
40%
41%
0%
20%
40%
60%
80%
100%
Likelihood of eatingmore fish
Likelihood of eating lessred meat
For adults who eat BOTH fish/seafood andred meat, likelihood of changing behavior
because it’s good for the brain*
Very likely Somewhat likely
74%
62%
Q14 If you were aware that eating fish/seafood is good for your brain health, howlikely would you be to increase the amount of fish/seafood in your diet.Q15 If you were aware that eating less red meat is better for your brain health, howlikely would you be to limit the amount of red meat in your diet?*Excludes those who say they follow a vegetarian/vegan diet.Q13 In a typical week, do you consume any of the following?

AARP RESEARCH | AARP.ORG/RESEARCH | © 2018 AARP. ALL RIGHTS RESERVEDAARP RESEARCH | AARP.ORG/RESEARCH | © 2018 AARP. ALL RIGHTS RESERVED
Individuals who already consume the healthier option of fish/seafood and exclude red meat (15%of adults age 40 and older) are significantly more likely to opt for dietary changes that are betterfor brain health compared to those who eat only red meat and not fish/seafood (29% of adults).
33
42%
12%
38%
45%
0%
20%
40%
60%
80%
100%
Eat fish/seafood, not redmeat in a typical week
Eat red meat, notfish/seafood in a typical
week
Likelihood of eating more fish because it isgood for brain health, by whether or not fish
or red meat are eaten in a typical week
Very likely Somewhat likely
Q14 If you were aware that eating fish/seafood is good for your brain health, how likelywould you be to increase the amount of fish/seafood in your diet.Excludes those who say they follow a vegetarian/vegan diet.
80%
57%
51%
8%
31%
45%
0%
20%
40%
60%
80%
100%
Eat fish/seafood, not redmeat in a typical week
Eat red meat, notfish/seafood in a typical
week
Likelihood of limiting red meat because it isgood for brain health, by whether or not
fish or red meat are eaten in a typical week
Very likely Somewhat likely
82%
53%
Q15 If you were aware that eating less red meat is better for your brain health, howlikely would you be to limit the amount of red meat in your diet?Excludes those who say they follow a vegetarian/vegan diet.

AARP RESEARCH | AARP.ORG/RESEARCH | © 2018 AARP. ALL RIGHTS RESERVEDAARP RESEARCH | AARP.ORG/RESEARCH | © 2018 AARP. ALL RIGHTS RESERVED
Adults age 40 and older who are already choosing healthier, low-fat dairy optionsare much more likely to say they would be willing to limit the amount of whole-fatdairy in their diets even further.
34
42%
18% 12%4%
45%
47%
29%
16%
0%
20%
40%
60%
80%
100%
Mostly low-fat Mix of low- andwhole-fat
Mostly whole-fat All whole-fat
Likelihood of limiting whole-fat dairy because it is good for brain health, by theproportion of low- and whole-fat dairy consumed in a typical day*
Very likely Somewhat likely
Q16 If you were aware that eating low-fat dairy is better for your brain health than whole-fat dairy, how likely would you be to limit the amount ofwhole-fat dairy in your diet?*Excluding those who do not eat dairy in a typical day.
87%
65%
41%
20%
The dairy foods I consume are:• All low-fat – 15%• Mostly low-fat – 36%• Mix of low- and whole-fat – 29%• Mostly whole-fat – 14%• All whole-fat – 6%

AARP RESEARCH | AARP.ORG/RESEARCH | © 2018 AARP. ALL RIGHTS RESERVEDAARP RESEARCH | AARP.ORG/RESEARCH | © 2018 AARP. ALL RIGHTS RESERVED
Barriers to Healthy Eating
35

AARP RESEARCH | AARP.ORG/RESEARCH | © 2018 AARP. ALL RIGHTS RESERVEDAARP RESEARCH | AARP.ORG/RESEARCH | © 2018 AARP. ALL RIGHTS RESERVED
The top barriers to eating a healthy diet are: the difficulty, the expense,individual identity (not a “healthy foods type” of person), and the taste. Amajority said they would change their diet if their doctor made arecommendation.
36
Q23 Please indicate whether you agree or disagree with the following statements. (7-point scale: 1=strongly disagree, 7=strongly agree)
10%
12%
17%
17%
18%
20%
28%
30%
37%
39%
0% 10% 20% 30% 40% 50%
No stores nearby that sell healthy foods
Dental issues, an illness, or condition that makes eating…
Changing diet won't make much difference
Don't have much of an appetite
Do not know what foods are best to eat
I do not like taste
Family may not like taste
Not "healthy foods type" of person
Too expensive
Hard to eat a healthy diet
Percent who agree with each of the followingbarriers to eating a healthy diet
More than half (53%) saidthey would be more likelyto change their diet if their
doctor advised them to.

AARP RESEARCH | AARP.ORG/RESEARCH | © 2018 AARP. ALL RIGHTS RESERVEDAARP RESEARCH | AARP.ORG/RESEARCH | © 2018 AARP. ALL RIGHTS RESERVED
Adults age 40 and older who do not consume the recommended daily amount of fruits andvegetables are significantly more likely to agree with barriers to healthy eating. There is anespecially large difference for those who say they are not a “healthy foods” type of person.
Barriers
Percent who agree with selected barriers to healthy eating by whether ornot they consume the recommended amount of fruits and vegetable
servings in a typical day
Fruit Vegetables
% who eattoo little
% who eat therecommended
amount
% who eat toolittle
% who eat therecommended
amount
Hard to eat healthy 44% 33% 44% 31%
Eating healthy would be tooexpensive
40% 32% 40% 32%
Not a “healthy foods” type ofperson
38% 20% 39% 17%
Family will not like the taste 30%* 26%* 31% 24%
Do not like the taste 24% 15% 25% 13%
Do not know what to eat 23% 13% 21% 13%
37
*Not statistically significant.

AARP RESEARCH | AARP.ORG/RESEARCH | © 2018 AARP. ALL RIGHTS RESERVEDAARP RESEARCH | AARP.ORG/RESEARCH | © 2018 AARP. ALL RIGHTS RESERVED
Differences were noted by selected demographic characteristics for thebarriers to healthy eating; in particular Hispanic/Latino adults were morelikely to cite certain barriers.
38
Eating healthy would be too expensive (36%) Hispanic/Latino adults (44%), younger adults (43%) compared to older adults (27%), and lower-income adults
(47%) compared to higher income adults (28%) cited cost as a barrier.
It’s hard to eat a healthy diet: 38% Younger adults (44%) were more likely to cite the difficulty of eating healthy as a barrier compared to adults
who are older (55-64: 33%, 65+: 35%).
I do not know what is best to eat: 18% Hispanic/Latino adults (29%) compared to the general population and lower income adults (24%) compared
to higher income adults (13%) were more likely to cite lack of information as a barrier.
If my doctor told me to change my diet, I’d be more likely to do it: 51% Hispanic/Latino adults (61%) compared to the general population and older adults (56%) compared to
younger adults (55-64: 51%; 40-54: 48%) were more likely to say their doctor would influence them.
I want to eat healthy but there are no stores nearby that sell healthy foods: 9% Hispanic/Latino (18%) and African American/Black (14%) adults compared to the general population were
more likely to cite location as a barrier as were lower-income compare to higher income adults (13% vs. 6%).
*Age groups: 40-54, 55-64, & 65+. Income groups: Less than $40,000, $40,000-$74,500, $75,000+.
AARP RESEARCH | AARP.ORG/RESEARCH | © 2018 AARP. ALL RIGHTS RESERVEDAARP RESEARCH | AARP.ORG/RESEARCH | © 2018 AARP. ALL RIGHTS RESERVED
Health Status
39

AARP RESEARCH | AARP.ORG/RESEARCH | © 2018 AARP. ALL RIGHTS RESERVEDAARP RESEARCH | AARP.ORG/RESEARCH | © 2018 AARP. ALL RIGHTS RESERVED
Four in 10 (43%) adults age 40 and older say their activities are not limited at allby diseases, conditions, or illnesses. Individuals with no limitations on theiractivities have significantly higher average mental well-being scores and aresignificantly more likely to say their brain health is “excellent” or “very good.”
40
Q3 To what extent do diseases, conditions, or illnesses limit your ability to engage in activities you would like to do (i.e., physical activity,socializing, shopping, doing yard work, etc.)
43%
28%
21%
8%
0%
10%
20%
30%
40%
50%
To no extentat all
To a littleextent
To someextent
To a greatextent
Extent to which diseases, conditions or illnesseslimit ability to engage in activities
Extent thatdiseases limit
activity
Outcome measures
% who ratebrain health
“excellent” or“very good”
Average mentalwell-being
score
To no extent atall
74% 55.0
To a littleextent
61% 52.2
To some extent 51% 50.1
To a greatextent
49% 47.5
Overall 64% 52.6
More adults age 40-54 (54%) say they are notlimited by medical conditions compared tothose 55-64 (44%) and 65 and older (30%).

AARP RESEARCH | AARP.ORG/RESEARCH | © 2018 AARP. ALL RIGHTS RESERVEDAARP RESEARCH | AARP.ORG/RESEARCH | © 2018 AARP. ALL RIGHTS RESERVED
A majority of adults (53%) age 40 and older suffer from at least one of thefollowing conditions: high blood pressure, high cholesterol, diabetes, heartdisease, or gout. Those with heart disease rate their brain health and mental well-being lower and those with high blood pressure rate their brain health lower.
41
Q4 Do you currently have any of the following conditions or illnesses?
53%
37%
28%
14%7%
3%
0%
20%
40%
60%
80%
100%
At least one High bloodpressure
High cholesterol Diabetes Heart disease Gout
Percent who report selected health conditions
Individuals with heart disease are lesslikely to rate their brain health as
“excellent” or “very good” compared tothose without heart disease (48% vs.65%). They also report lower average
mental well-being scores (49.7 vs. 52.9).
Individuals with high blood pressure are lesslikely to rate their brain health as “excellent”or “very good” compared to those without
high blood pressure (60% vs. 66%).

AARP RESEARCH | AARP.ORG/RESEARCH | © 2018 AARP. ALL RIGHTS RESERVEDAARP RESEARCH | AARP.ORG/RESEARCH | © 2018 AARP. ALL RIGHTS RESERVED
A discrepancy exists between adults’ subjective view of their weight and theirobjective weight based on their Body Mass Index (BMI). About half (55%)consider themselves to weigh more than they should but two-thirds (68%) areactually overweight or obese.
42
Q28 Which sounds most like your view of your weight relative to your height?Q28a What is your height (feet, inches)?Q28b What is your weight (pounds)?
11%
33%
56%
3%
29%
68%
0%
20%
40%
60%
80%
100%
Less than the proper weight for myheight/Underweight
The proper weight for myheight/Normal Weight
More than the proper weight formy height/Overweight or obese
Comparison between self-assessment of weight relative to height andBody Mass Index (BMI) calculation
Qualitative view of weight/height BMI (calculated using height and weight)

AARP RESEARCH | AARP.ORG/RESEARCH | © 2018 AARP. ALL RIGHTS RESERVEDAARP RESEARCH | AARP.ORG/RESEARCH | © 2018 AARP. ALL RIGHTS RESERVED
Relatively few adults age 40 and older follow special nutrition plans.However, significantly more adults with heart disease, high bloodpressure, diabetes, and high cholesterol follow a low-salt diet.
43
Q20 Which of the following, if any, nutrition plans do you currently follow?
2%
3%
4%
4%
5%
5%
19%
22%
27%
0% 10% 20% 30% 40% 50%
DASH
Weight-loss
Vegetarian/Vegan
Mediterranean
Gluten-free
Dairy-free
Low-carb
Low-fat
Low-salt
Percent who follow specific nutrition plans
Health concern
Percent who eat a low-salt diet, by whether
or not they have aspecific health concern
Yes No
Heart disease 43% 26%
High blood pressure 40% 20%
Diabetes 37% 26%
High cholesterol 35% 24%
Significantly moreindividuals with diabetes
eat a low-carb diet(37% vs. 16%)

AARP RESEARCH | AARP.ORG/RESEARCH | © 2018 AARP. ALL RIGHTS RESERVEDAARP RESEARCH | AARP.ORG/RESEARCH | © 2018 AARP. ALL RIGHTS RESERVED
Relatively few doctors discuss diet and proper nutrition with their patients andeven fewer have recommended they follow an eating plan. More than half ofadults (53%) agree that if their doctor told them to change their diet, they wouldbe more likely to do it.
44
61%
37%29%
10%
27%
0%
20%
40%
60%
80%
100%
Done blood test toidentify nutritional
deficiencies
Talked to youabout diet
Talked to youabout proper
nutrition
Recommend youfollow eating plan
None
Percent whose doctor has done any of the following…
Q23 Please indicate whether you agree or disagree with the following statements: If my doctor told me to change my diet, I’d be more likely to do it.Q27 Thinking about your visits to see your doctor or your primary health care provider, have they ever done any of the following?
53% say their doctor’ssuggestion would influencethem to change their diet.

AARP RESEARCH | AARP.ORG/RESEARCH | © 2018 AARP. ALL RIGHTS RESERVEDAARP RESEARCH | AARP.ORG/RESEARCH | © 2018 AARP. ALL RIGHTS RESERVED
Obese adults are more likely to say their doctors talk to them about diet (51%)and nutrition (35%). Very few (14%) say their doctor has recommended theyfollow a special eating plan. Because obesity is associated with many adversehealth outcomes, this suggests that not enough doctors are addressing this issue.
45
BMI classification* (%)
% who say their doctor has…
Talked to them abouttheir diet
Talked to them aboutproper nutrition
Recommended theyfollow a special eating
plan
Underweight (3%) 26% 27% 11%
Normal weight (29%) 24% 25% 7%
Overweight (33%) 36% 27% 8%
Obese (35%) 51% 35% 14%
Q27 Thinking about your visits to see your doctor or your primary health care provider, have they ever done any of the following? Talked to youabout your diet; Talked to you about proper nutrition; Recommended you follow a special eating plan.
*BMI classification: Underweight – Less than 18.5; Normal weight – 18.5-24.9; Overweight – 25-29.9; Obese – 30 and over

AARP RESEARCH | AARP.ORG/RESEARCH | © 2018 AARP. ALL RIGHTS RESERVEDAARP RESEARCH | AARP.ORG/RESEARCH | © 2018 AARP. ALL RIGHTS RESERVED
Underweight and obese adults share several similar barriers to healthy eating compared tonormal weight and overweight adults. However, obese adults are much more likely thanother adults to feel that eating a healthy diet is too expensive, difficult, and they are not a“healthy foods” type of person.
46
Barrier to healthy eating% who agree with each barrier to healthy eating by BMI classification
Underweight Normal weight Overweight Obese
Family may not like the taste ofhealthy foods
42% 21% 25% 35%
It is hard to eat a healthy diet 38% 30% 38% 48%
Eating healthy would be tooexpensive
35% 30% 35% 45%
Do not know what foods are best toeat
24% 18% 17% 20%
I am not a “healthy foods” type ofperson
19% 23% 31% 35%
Do not like the taste of healthyfoods
11% 18% 20% 21%
*BMI classification: Underweight – Less than 18.5; Normal weight – 18.5-24.9; Overweight – 25-29.9; Obese – 30 and over
Q23 Please indicate whether you agree or disagree with the following statements. (7-point scale: 1=strongly disagree, 7=strongly agree)