2017-2018 { econ 3029 { advanced macro lecture 4 ... · 1.a short story of easter island ... i...
TRANSCRIPT
2017-2018 – Econ 3029 – Advanced Macro
Lecture 4: Sustainable Growth and Easter Island Economics
Franck [email protected]
University College London
Version 1.111/03/2018
Changes from version 1.0 are in red
1 / 51

Disclaimer
These are the slides I am using in class. They are not self-contained, do not alwaysconstitute original material and do contain some “cut and paste” pieces from varioussources that might not always explicitly referring to (although I am trying to cite mysources as much as possible). Therefore, they are not intended to be used outside ofthe course nor to be distributed. Thank you for signalling me typos or mistakes [email protected].
2 / 51
0. IntroductionWhat is this lecture about?
I Existing concerns regarding the earth’s population explosion and the pressure itplaces on natural resources
I Debate on sustainable growth in the light of a possible global warming of theearth.
I In this Lecture, we will first discuss of an example of an economic, social anddemographic collapse (Easter Island) (Jarred Diamond [2005])
I We will them present a dynamic model with endogenous population and a modelfor the dynamics of the ecosystem.
I We will then be able to discuss the possibility of an “Easter Island” type ofcollapse, and what are the important economic and biological forces in such adynamics.
3 / 51

0. IntroductionPlan of the Lecture
1. A Short Story of Easter Island
2. A Model for the dynamics of Easter Island
3. Applying the Model to Easter Island
4. Summary
5. References
4 / 51

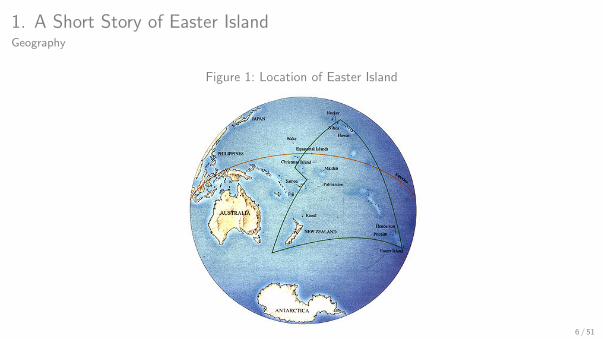
1. A Short Story of Easter IslandGeography
I Easter Island (also called Rapa Nui) is a small Pacific island, 3200km from thecoast of Chile and 7000km from New-Zealand), with a population (as of the early1990’s) of about 2,100.
I Easter is a triangular island consisting entirely of three volcanoes that arose fromthe sea.
I Subtropical location at latitude 27 degrees south, approximately as far south ofthe equator as Miami and Taipei lie north of the equator
5 / 51
1. A Short Story of Easter IslandGeography
Figure 1: Location of Easter Island
6 / 51

1. A Short Story of Easter IslandGeography Figure 2: Location of Easter Island
7 / 51

1. A Short Story of Easter IslandGeography
I Mild climate
I Fertile soils because of its its recent volcanic origins
I While a subtropical climate is warm by the standards of European and NorthAmerican winters, it is cool by the standards of mostly tropical Polynesia
I Modest rainfalls.
I The rain that does fall percolates quickly into Easter’s porous volcanic soils. As aconsequence, freshwater supplies are limited.
I Easter is a windy place
I Easter’s isolation meant, that it is deficient not just in coral-reef fish but in fishgenerally, of which it has only 127 species compared to more than a thousand fishspecies on Fiji.
8 / 51

1. A Short Story of Easter IslandGeography
Figure 3: Landscape
9 / 51

1. A Short Story of Easter IslandGeography
Figure 4: Volcanos
10 / 51

1. A Short Story of Easter IslandDiscovery by Europeans
I First European contact in 1722 (by three Dutch ships). This visit lasted only asingle day.
I The next known contact was a brief visit from a Spanish ship in 1770
I In 1774, visit from James Cook, who provided a systematic description ofEaster Island.
I A desertic island with about 3,000 inhabitants.
11 / 51

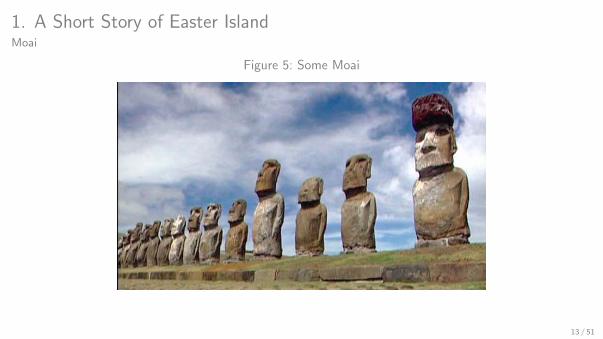
1. A Short Story of Easter IslandThe Moai
I Moai: enormous statues carved from volcanic stone.
I 887 on the island.
I Many statues rested on large platforms (ahu) made of rubble.
I About 300 ahu have been identified, of which many were small and lacked moai,but about 113 did bear moai.
I The largest ‘movable” statues weigh more than 80 tons, far form the quarry.
I The largest statue of all lies unfinished in the quarry where it was carved, andweighs about 270 tons.
12 / 51
1. A Short Story of Easter IslandMoai
Figure 5: Some Moai
13 / 51
1. A Short Story of Easter IslandWhy is it mysterious?
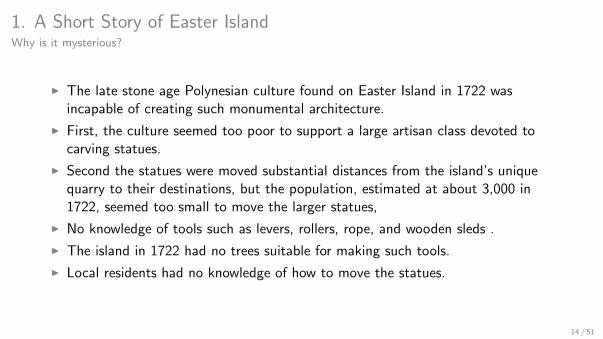
I The late stone age Polynesian culture found on Easter Island in 1722 wasincapable of creating such monumental architecture.
I First, the culture seemed too poor to support a large artisan class devoted tocarving statues.
I Second the statues were moved substantial distances from the island’s uniquequarry to their destinations, but the population, estimated at about 3,000 in1722, seemed too small to move the larger statues,
I No knowledge of tools such as levers, rollers, rope, and wooden sleds .
I The island in 1722 had no trees suitable for making such tools.
I Local residents had no knowledge of how to move the statues.
14 / 51

1. A Short Story of Easter IslandThe explanation in one slide
I The Polynesian civilization in place at the time of first European discovery in 1722was much poorer and much less populous than it had been a few hundred yearsearlier.
I A economic story of rising wealth and rising population, followed by decline(collapse).
I Easter Island suffered a sharp decline after perhaps a thousand years of apparentpeace and prosperity.
I The population rose well above its long-run sustainable level and subsequently fellin tandem with disintegration of the existing social order and a rise in violentconflict.
I The islanders degraded their environment to the point that it could no longersupport the population and culture it once had.
15 / 51

1. A Short Story of Easter IslandArcheological records
I Easter Island was first settled by a small group of Polynesians about or shortlyafter 400 A.D. (Anno Domini = apres J.C.)
I The pollen record obtained from core samples and dated with carbon datingmethods shows that the island supported a great palm forest at this time.
I In the years following initial settlement, one important activity was cutting downtrees, making canoes, and catching fish.
I Archaeological record shows a high density of fish bones during this early period.
I Wood was also used to make tools and for firewood, and the forest was a nestingplace for birds that the islanders also ate.
I The population grew rapidly and was wealthy in the sense that meetingsubsistence requirements was relatively easy.
I This relative high level of wealth left resources to devote to other activitiesincluding, as time went on, carving and moving statues.
16 / 51

1. A Short Story of Easter IslandThe collapse
I Noticeable forest reduction is evident in the pollen record by about 900 A.D.
I Most of the statues were carved between about 1100 and 1500.
I By about 1400 the palm forest was entirely gone.
I Diet changed for the worse as forest depletion became severe, containing less fish(and thus less protein) than earlier.
I Loss of forest cover also led to reduced water retention in the soil and to soilerosion (wind), causing lower agricultural yields.
I Population probably peaked at about 10,000 sometime around 1400 A.D., thenbegan to decline.
I The period 1400 to 1500 was a period of falling food consumption and initiallyactive, but subsequently declining, carving activity.
I Carving had apparently ceased by 1500.
17 / 51

1. A Short Story of Easter IslandThe collapse (2)
I Around 1500, a new tool called “mata’a” enters the archaeological record.
I This tool resembles a spearhead and is likely to be a weapon.
Figure 6: Mata’a
18 / 51

1. A Short Story of Easter IslandThe collapse (3)
I In addition, many islanders began inhabiting caves and fortified dwellings.
I There is also strong evidence of cannibalism at this time.
I Numbers of house sites in the coastal lowlands, where almost everybody lived,declined by 70% from peak values around 1400-1600 to the 1700s, suggesting acorresponding decline in numbers of people.
I With the exhaustion of resources, the island has entered into a period of socialcollapse, violence and population decline.
19 / 51

1. A Short Story of Easter IslandThe collapse (4)
I Captain Cook in 1774 described the islanders as “small,lean, timid, and miserable.”
Figure 7: James Cook
20 / 51

1. A Short Story of Easter IslandThe collapse (5)
Figure 8: Demographic and ecological dynamics Bahn and Flenley [1992]
4
The resource dynamics are determined by resource growth and harvesting activities. An additional input is labor, or population, and population growth is endogenously driven by a fertility function. The economy is decentralized in a sense that the relative prices of the goods and wages are determined by market forces. Meanwhile, although people as consumers individually maximize utility, the original BT model has one sector-level aggregate production function for each sector that is linear in labor, given the sizes of the existing resource stock and population. Another important characteristic of the model is that, as with many economic models, the economy is in equilibrium in each period. Hence there is no observable adjustment process towards equilibrium within each period.
Figure 1. Behavior over Time for key Easter Island metrics Source: Bahn, P., and J. Flenley, 1992
The aforementioned characteristics are consistent with a
fully-decentralized economy where each individual as a consumer makes consumption choices independently and as a worker allocate his/her labor hours as an independent producer. Individuals in this economy behave in a myopic manner in a sense that they do not maximize their utility across multiple time periods and instead focus only on the current period, in contrast to the group of dynamic models in which economic agents are assumed to carry out infinite-time-horizon optimization of their choices. The model is interesting in part because its simplicity allows researchers to easily incorporate additional variables to address more fully various issues surrounding economic growth and sustainability, and because despite the simplicity its behavior is potentially
21 / 51
1. A Short Story of Easter IslandThe Rapa Nui ecodisaster: A message for our future?
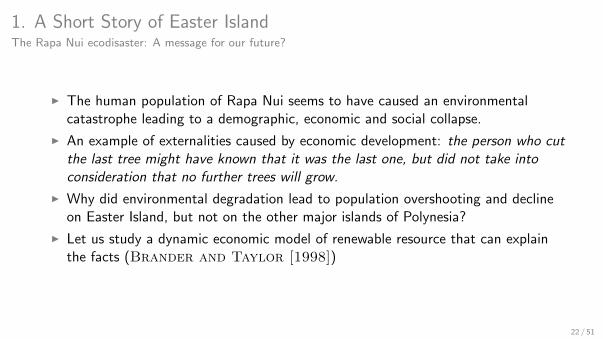
I The human population of Rapa Nui seems to have caused an environmentalcatastrophe leading to a demographic, economic and social collapse.
I An example of externalities caused by economic development: the person who cutthe last tree might have known that it was the last one, but did not take intoconsideration that no further trees will grow.
I Why did environmental degradation lead to population overshooting and declineon Easter Island, but not on the other major islands of Polynesia?
I Let us study a dynamic economic model of renewable resource that can explainthe facts (Brander and Taylor [1998])
22 / 51

2. A Model for the dynamics of Easter IslandRenewable resource dynamics
I The resource at time t is S(t)
I Resource = the ecological complex consisting of the forest and soil
I G (S(t)) = natural growth
I H(t) = harvest
I Law of motion of the resource :
S(t) =dS(t)
dt= G (S(t))− H(t)
23 / 51

2. A Model for the dynamics of Easter IslandRenewable resource dynamics
I G is assumed to be a logistic function:
G (S(t)) = rS(t)
(1− S(t)
K
)I K = “carrying capacity” = maximum size of the resource
I r = regeneration rate.
I Figure 9 is an example with K = 10 and r = 20% (black) or r = 40% (gray)
24 / 51

2. A Model for the dynamics of Easter IslandRenewable resource dynamics
Figure 9: G (S) (panel (a)) and S(t) starting from S(0) = 5 (panel (b))
(a) (b)
0 2 4 6 8 10
0
0.2
0.4
0.6
0.8
1
S
G(S
)
0 20 40 60 80 100
6
8
10
tS
(t)
25 / 51

2. A Model for the dynamics of Easter IslandInputs and outputs
I The economy produces and consumes two goods.
I H(t) is the harvest of the renewable resource,
I M(t) is some aggregate ”other good.”
I In the case of Easter Island:
× harvest is food× good M(t) is tools, housing, artistic output (including monumental architecture),
household production, etc.
I good M is the numeraire (price is 1)
I price of food is p(t)
26 / 51

2. A Model for the dynamics of Easter IslandTechnologies and wage
I Production done with the resource and labor L
I Assumption: L(t) = population
I Technology for food (supply): Hs(t) = αS(t)LH(t)
I Technology for the other good: Ms(t) = LM(t)
I wages wH(t) and wM(t)
I There is free disposal fo the resource (all the production of food goes to theworkers), so that
wH(t) = p(t)Hs(t)
Lh(t)= p(t)αS(t)
I Perfect competition on the labor market for the M good:
wM(t) =dMs(t)
dLM(t)= 1
27 / 51

2. A Model for the dynamics of Easter IslandPreferences
I Individuals live one period and work 1 unit
I Fertility decisions are not derived from optimal behavior (as opposed to Lecture1). Population dynamics will be described later.
I u = h(t)βm(t)1−β
I By arbitrage, we will have wH(t) = wM(t) = w(t)
I Budget constraint : p(t)h(t) + m(t) = w(t)× 1I optimal solution (details in class)
× hd(t) = β w(t)p(t)
× md(t) = (1− β)w(t)
I so that in the aggregate Hd(t) = β w(t)L(t)p(t) and Md(t) = (1− β)w(t)L(t)
28 / 51

2. A Model for the dynamics of Easter IslandPrice of the ressource
I We have wH(t) = p(t)αS(t).
I In equilibrium, wH(t) = w(t).
I Therefore p(t) = w(t)αS(t) .
29 / 51

2. A Model for the dynamics of Easter IslandEquilibrium
I Supply of labor : L(t)
I Demand of labour : LH(t) + M(t)
I Supply of food : Hs(t) = αS(t)LH(t)
I Demand of food : Hd(t) = β w(t)L(t)p(t)
I Wage in the food sector : p(t) = w(t)αS(t)
I Wage in the “other sector” : w(t) = 1
30 / 51

2. A Model for the dynamics of Easter IslandEquilibrium
I From the previous equations (details in class):
I H(t) = αβS(t)L(t)
I As L(t) is given at date t, we obtain S(t)
I The the dynamics of the resource is given by
S(t) =dS(t)
dt= rS(t)
(1− S(t)
K
)− αβS(t)L(t)
I See Figure 10.
31 / 51

2. A Model for the dynamics of Easter IslandEquilibrium
Figure 10: Resource dynamics for a fixed population
124 THE AMERICAN ECONOMIC REVIEW MARCH 1998
Panel A: Resource Dynamics
Resource Harvest, / Growth t /
| \/ H =4o:LS I / (Harvest Function)
// G G(S) / ~~~~~(Growth Function)
S* Resource Stock, S K
Panel B: Population Dynamics
(dL/dt)lL - b-d+F = b-d +
(oapS (dL/dt)/L ~ ~ ~ ~ "~ (net fertility)
0 S* Resource Stock, S
b-d
FiGURE 1. A RICARDO-MALTHUS STEADY STATE
harvest will not necessarily equal the under- lying biological growth rate of the resource. If, for example, temporary equilibrium harvest H exceeds biological growth G, then the stock diminishes. Substituting (2) and (8) into (1) yields the following expression for the evolu- tion of the resource stock.
(9) dSIdt = rS( - SIK) - a,/LS.
If the resource stock falls, then labor produc- tivity in the resource sector falls, the Ricardian production possibility frontier shifts in, and this establishes a new temporary equilibrium with a lower harvest.
Panel A of Figure 1 illustrates a typical steady state (i.e., where dSldt = 0) using the harvest function (8) and the resource growth function (2). (Ignore the dashed lines for now.) As shown in the figure, stock S * implies that harvest H = ac4LS * just matches resource growth G(S) at S = S*. Thus S* is a steady state if the actual population level is L.
B. Malthusian Population Dynamics
Our discussion of Figure 1 so far implicitly treats population as fixed at size L, allowing us to focus purely on resource dynamics. We now consider population dynamics. We as- sume an underlying proportional birth rate, b, and an underlying proportional death rate, d. Thus the base rate of population increase is (b - d), which we assume to be negative, im- plying that without any forest stock or arable soil the population would eventually disap- pear. However, consumption of the resource good increases fertility and/or decreases mor- tality, and therefore increases the rate of pop- ulation growth.8 In particular, the population growth rate is given by
(10) dLIdt = L[b - d + F]
where F = 4HIL is the fertility function, and 4* is a positive constant. Thus higher per capita consumption of the resource good leads to higher population growth. It is in this sense that population dynamics are "Malthusian." 9 Noting from (8) that HIL = a/3S, equation (10) can be rewritten as
(11) dL/dt = L(b- d + afS).
III. Population and Resource Interactions
Equations (9) and ( 11 ) form a two-equation system of differential equations characterizing the evolution of the Ricardo-Malthus model. These equations are a variation of the Lotka- Volterra predator-prey model.10 Human pop- ulation, L, is the "predator" and the resource
8 One might let net fertility depend on total consump- tion rather than on resource consumption, although the case could be argued either way and has little effect on the analysis.
9 Among modern high-income societies, population growth is negatively correlated with income at both the country and individual level. Most premodern societies appear to exhibit Malthusian population dynamics, in that higher consumption causes higher population growth.
'0 Predator-prey systems have sometimes been studied in renewable resource economics. See, in particular, David L. Ragozin and Gardner Brown (1985) and Philip Neher ( 1990).
This content downloaded from 193.49.48.249 on Fri, 15 Nov 2013 07:19:33 AMAll use subject to JSTOR Terms and Conditions
32 / 51

2. A Model for the dynamics of Easter IslandDemographics
I mortality rate d is exogeneous
I fertility rate is b + F (t)
I F (t) = φH(t)L(t) (fertility is increasing with the availability of resources.
I b − d < 0 : without resources, population tends to zero.
I The growth rate of population is given by :
dL(t)
dt= (b − d + F (t))× L(t)
I See Figure 11
I Using H(t) = αβS(t)L(t), we can rewrite the equation of the populationdynamics as
dL(t)
dt= (b − d + φαβS(t))× L(t)
33 / 51

2. A Model for the dynamics of Easter IslandEquilibrium
Figure 11: Population dynamics for a fixed resource
124 THE AMERICAN ECONOMIC REVIEW MARCH 1998
Panel A: Resource Dynamics
Resource Harvest, / Growth t /
| \/ H =4o:LS I / (Harvest Function)
// G G(S) / ~~~~~(Growth Function)
S* Resource Stock, S K
Panel B: Population Dynamics
(dL/dt)lL - b-d+F = b-d +
(oapS (dL/dt)/L ~ ~ ~ ~ "~ (net fertility)
0 S* Resource Stock, S
b-d
FiGURE 1. A RICARDO-MALTHUS STEADY STATE
harvest will not necessarily equal the under- lying biological growth rate of the resource. If, for example, temporary equilibrium harvest H exceeds biological growth G, then the stock diminishes. Substituting (2) and (8) into (1) yields the following expression for the evolu- tion of the resource stock.
(9) dSIdt = rS( - SIK) - a,/LS.
If the resource stock falls, then labor produc- tivity in the resource sector falls, the Ricardian production possibility frontier shifts in, and this establishes a new temporary equilibrium with a lower harvest.
Panel A of Figure 1 illustrates a typical steady state (i.e., where dSldt = 0) using the harvest function (8) and the resource growth function (2). (Ignore the dashed lines for now.) As shown in the figure, stock S * implies that harvest H = ac4LS * just matches resource growth G(S) at S = S*. Thus S* is a steady state if the actual population level is L.
B. Malthusian Population Dynamics
Our discussion of Figure 1 so far implicitly treats population as fixed at size L, allowing us to focus purely on resource dynamics. We now consider population dynamics. We as- sume an underlying proportional birth rate, b, and an underlying proportional death rate, d. Thus the base rate of population increase is (b - d), which we assume to be negative, im- plying that without any forest stock or arable soil the population would eventually disap- pear. However, consumption of the resource good increases fertility and/or decreases mor- tality, and therefore increases the rate of pop- ulation growth.8 In particular, the population growth rate is given by
(10) dLIdt = L[b - d + F]
where F = 4HIL is the fertility function, and 4* is a positive constant. Thus higher per capita consumption of the resource good leads to higher population growth. It is in this sense that population dynamics are "Malthusian." 9 Noting from (8) that HIL = a/3S, equation (10) can be rewritten as
(11) dL/dt = L(b- d + afS).
III. Population and Resource Interactions
Equations (9) and ( 11 ) form a two-equation system of differential equations characterizing the evolution of the Ricardo-Malthus model. These equations are a variation of the Lotka- Volterra predator-prey model.10 Human pop- ulation, L, is the "predator" and the resource
8 One might let net fertility depend on total consump- tion rather than on resource consumption, although the case could be argued either way and has little effect on the analysis.
9 Among modern high-income societies, population growth is negatively correlated with income at both the country and individual level. Most premodern societies appear to exhibit Malthusian population dynamics, in that higher consumption causes higher population growth.
'0 Predator-prey systems have sometimes been studied in renewable resource economics. See, in particular, David L. Ragozin and Gardner Brown (1985) and Philip Neher ( 1990).
This content downloaded from 193.49.48.249 on Fri, 15 Nov 2013 07:19:33 AMAll use subject to JSTOR Terms and Conditions
34 / 51

2. A Model for the dynamics of Easter IslandEquilibrium dynamics
I the system dynamics is therefore given by the following pair of differentialequations:
{dS(t)dt = rS(t)
(1− S(t)
K
)− αβS(t)L(t) (A)
dL(t)dt = (b − d + φαβS(t))× L(t) (B)
35 / 51

2. A Model for the dynamics of Easter IslandSteady States
I A steady state satisfies S(t) = L(t) = 0
I Looking at the pair of differential equations we get the following proposition (seedetails in class)
Proposition 1
There are three possible steady states:
1. “unoccupied or virgin island”: L = 0 and S = K2. “collapsed island”: L = 0 and S = 03. “sustainable island”: {
S = d−bφαβ
L = rαβ
(1− d−b
φαβK
)
36 / 51
2. A Model for the dynamics of Easter IslandInterior Steady State
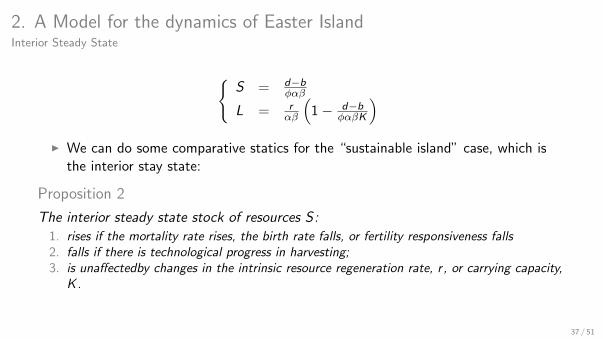
{S = d−b
φαβ
L = rαβ
(1− d−b
φαβK
)I We can do some comparative statics for the “sustainable island” case, which is
the interior stay state:
Proposition 2
The interior steady state stock of resources S :
1. rises if the mortality rate rises, the birth rate falls, or fertility responsiveness falls2. falls if there is technological progress in harvesting;3. is unaffectedby changes in the intrinsic resource regeneration rate, r , or carrying capacity,
K .
37 / 51

2. A Model for the dynamics of Easter IslandInterior Steady State (2)
{S = d−b
φαβ
L = rαβ
(1− d−b
φαβK
)Proposition 3
At the interior steady state, population L:
1. rises equiproportionately with an increase in the intrinsic rate of resource growth,r ;
2. falls when harvesting technology improves if S < K/2 and rises if S > K/2;
3. falls when the taste for the resource good rises if S < K/2 and rises if S > K/2;
4. rises if the carrying capacity of the environment rises.
38 / 51

2. A Model for the dynamics of Easter IslandInterior Steady State (3)
{S = d−b
φαβ
L = rαβ
(1− d−b
φαβK
)I The interior steady state exists only if S < K , as the level of resource cannot
exceeds K
I The condition on parameters for existence is therefore
d − b
φαβ< K
39 / 51

2. A Model for the dynamics of Easter IslandGlobal dynamics
I We will not prove this result:
Proposition 4
When an interior steady state exists, the global behavior of the system is as follows :
1. if L > 0 and S = 0, the system approaches the steady state with L = 0 and S = 0;2. if L = 0 and S > 0 ,the system approaches the steady state with S = K and L = 0;3. if S > 0 and L > 0, then the system converges to the interior steady state.
40 / 51

3. Applying the Model to Easter IslandDiscretization
{dS(t)dt = rS(t)
(1− S(t)
K
)− αβS(t)L(t) (A)
dL(t)dt = (b − d + φαβS(t))× L(t) (B)
I We first rewrite the differential system in discrete time.
I Note that it is also possible to simulate differential equations{S(t+∆)−S(t)
∆ = rS(t)(
1− S(t)K
)− αβS(t)L(t) (A)
L(t+∆)−L(t)∆ = (b − d + φαβS(t))× L(t) (B)
41 / 51
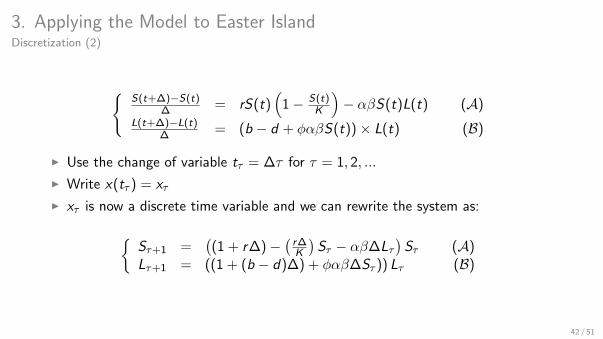
3. Applying the Model to Easter IslandDiscretization (2)
{S(t+∆)−S(t)
∆ = rS(t)(
1− S(t)K
)− αβS(t)L(t) (A)
L(t+∆)−L(t)∆ = (b − d + φαβS(t))× L(t) (B)
I Use the change of variable tτ = ∆τ for τ = 1, 2, ...
I Write x(tτ ) = xτI xτ is now a discrete time variable and we can rewrite the system as:
{Sτ+1 =
((1 + r∆)−
(r∆K
)Sτ − αβ∆Lτ
)Sτ (A)
Lτ+1 = ((1 + (b − d)∆) + φαβ∆Sτ )) Lτ (B)
42 / 51

3. Applying the Model to Easter IslandParameter choice
I The unit of time is a decade (10 years)
I K = 12000 units (arbitrary)
I K is chosen as the initial resource size : S0 = K (The forest has been in place foraround 37000 years before the Polynesian colonization)
I Length of a period: ∆ = 10, meaning that one simulation period corresponds to∆ decades, i.e. 100 years.
I Labor productivity: α = 0.00001 : if S = K , a household could provide itssubsistence consumption (the amount just necessary to reproduce itself) in about20 percent of its available labor time. Accordingly, there is considerable surplus onthe island when the resource stock is large.
I Taste for food: β = 0.4 : also equal to the share of labor devoted to harvesting.
43 / 51

3. Applying the Model to Easter IslandParameter choice (2)
I Intrinisc growth of the resource r = 0.04 : 4% per decade when the stock ofresource is small (no congestion)
I Demographics : b − d = −0.1 : Absent of resource, population declines by 10%per decade.
I Demographics : φ = 4 : Population grows if S > K/2 and decreases otherwise.
I Initial population: L0 = 40
44 / 51

3. Applying the Model to Easter IslandSimulation 1
Figure 12: The dynamics of population and resource
400 600 800 1000 1200 1400 1600 18000
2000
4000
6000
8000
10000
12000
Time
Popu
latio
n an
d re
sour
ce
ResourcePopulation
45 / 51

3. Applying the Model to Easter IslandWhat is different in Easter Island?
I Easter Island is not different than other islands in terms of tastes, demographicsor technology.
I One difference with other islands: the palm tree that grew on Easter Islandhappened to be a very slow-growing palm.
I Coconut trees, that one finds on other polynesian islands, grow faster.
I Assume that the renovation rate is r = 0.3 (instead of 0.04)
46 / 51

3. Applying the Model to Easter IslandSimulation 2 : Fast growing trees
Figure 13: The dynamics of population and resource
0 1000 2000 3000 4000ï1
0
1
2
3
4 x 10⁴
Time
Popu
latio
n an
d re
sour
ce
ResourcePopulation
47 / 51

3. Applying the Model to Easter IslandThe 12 “mystery islands”
I There are 12 so-called ”mystery islands” in Polynesia.
I These islands were once settled by Polynesians but were unoccupied at the time ofEuropean discovery.
I Assume that an island has a small carrying capacity K : there is not enoughresources to maintain population.
I Poulation is driven to 0.
I Let’s simulate the model with K = 4000 instead of 12000.
I In such a case, an interior steady state does not exist. Population converges tozero and the island becomes again a virgin island.
48 / 51

3. Applying the Model to Easter IslandSimulation 3 : “A Mystery Island”
Figure 14: The dynamics of population and resource
400 600 800 1000 1200 1400 1600 18003992
3993
3994
3995
3996
3997
3998
3999
4000
Time
Res
ourc
e
Resource
400 600 800 1000 1200 1400 1600 18000
5
10
15
20
25
30
35
40
TimePo
pula
tion
Population
49 / 51

4. Summary
I Complex dynamics of population and resources
I Growth is not always sustainable in the long run with limited resources
I We have developed a model of the joint dynamics of population and resources
I The model can explain collapses, disparition of population or sustained positivepopulation.
50 / 51

5. References
I Paul Bahn and John Flenley, 1992, “Easter Island, Earth Island ”, Thames &Hudson Ltd.
I James A. Brander and M. Scott Taylor, 1998, “The Simple Economics of EasterIsland: A Ricardo-Malthus Model of Renewable Resource Use,” The AmericanEconomic Review, 88(1), pages 119-138.
I Jarred Diamond, 2005. “Collapse: How Societies Choose to Fail or Succeed, ”Viking Press.
51 / 51