2016–2017 winter reliability assessment assessments dl/wra 2016_201… · 2016–2017 winter...
TRANSCRIPT

2016–2017 Winter Reliability Assessment

Table of ContentsPreface 3
Key Findings 5
FRCC 9
MISO 10
MRO-Manitoba Hydro 11
MRO-SaskPower 12
NPCC-Maritimes 13
NPCC-New England 14
NPCC-New York 15
NPCC-Ontario 16
NPCC-Québec 17
PJM 18
SERC 19
SPP 20
Texas RE-ERCOT 21
WECC 22
Data Concepts and Assumptions Guide 23

2016–2017 Winter Reliability Assessment 3
Preface The North American Electric Reliability Corporation (NERC) is a not-for-profit international regulatory authority whose mission is to assure the reliability of the bulk power system (BPS) in North America. NERC develops and enforces Reliability Standards; annually assesses seasonal and long-term reliability; monitors the BPS through system awareness; and educates, trains, and certifies industry personnel. NERC’s area of responsibility spans the continental United States, Canada, and the northern portion of Baja California in Mexico. NERC is the electric reliability organization (ERO) for North America, subject to oversight by the Federal Energy Regulatory Commission (FERC) and governmental authorities in Canada. NERC’s jurisdiction includes users, owners, and operators of the BPS, which serve more than 334 million people. The North American BPS is divided into eight Regional Entity (RE) boundaries as shown in the map below. The assessment areas are shown on page 4. Refer to the Data Concepts and Assumptions Guide for more information.

2016–2017 Winter Reliability Assessment 4
MISO
SERCNorth SERC
East
SERCSoutheast
WECCNWPP-US
WECCAB
WECCBC
WECCSRSG
WECCRMRG
Texas REERCOT
WECCCA/MX
FRCC
NPCCNew York
NPCCNew England
NPCCQuebec
NPCCOntario
MROManitoba Hydro
MROSaskPower
SPPPJM
FRCC—Florida Reliability Coordinating Council FRCC
MRO—Midwest Reliability Organization MRO-SaskPower MRO-Manitoba Hydro MISO
SPP RE—Southwest Power Pool Regional Entity SPP
Texas RE–Texas Reliability Entity ERCOT
NPCC—Northeast Power Coordinating Council NPCC-New England NPCC-Maritimes NPCC-New York NPCC-Ontario NPCC-Québec
RF—ReliabilityFirst PJM
WECC—Western Electricity Coordinating Council WECC-BC WECC-AB WECC-RMRG WECC-CA/MX WECC-SRSG WECC-NWPP-US
SERC—SERC Reliability Corporation SERC-East SERC-North SERC-Southeast

2016–2017 Winter Reliability Assessment 5
Key FindingsNERC’s annual winter reliability assessment covers the three-month (December–February) winter period. The assessment provides an overall perspective on the adequacy of the generation resources and the transmission systems necessary to meet projected winter peak demands. The assessment monitors and identifies potential reliability issues of interest and regional areas of concern in meeting projected customer demands. The following key findings represent NERC’s independent evaluation of electric generation capacity and potential operational concerns that may need to be addressed.
Supply AdequacyAnticipated resources meet the reference margin level in all assessment areas for Winter 2016–17 as illustrated below. Refer to the Data Concepts and Assumptions Guide for additional information.
2016–17 Anticipated/Prospective Reserve Margins Compared to Reference Margin Level
0%
5%
10%
15%
20%
25%
30%
35%
40%
45%
50%
Anticipated Reserve Margin (%) Prospective Reserve Margin (%) Reference Margin Level (%)

2016–2017 Winter Reliability Assessment 6
Fuel SupplyNERC anticipates adequate levels of fuel supply for all assessment areas and Regions. Natural gas continues to be the predominant fuel of choice for most locations in winter. While the supply of natural gas is vast and not expected to cause any supply shortages, transportation and delivery challenges may impact the ability for some natural-gas-fired generation to receive fuel to serve on-peak demand. For example, ISO-NE developed procedures, called Winter Reliability Solutions, that enable generators to address challenges posed by natural gas restrictions by using dual-fuel capabilities that employ alternative resources, like fuel oil.1 Coal inventories in the U.S. are relatively high compared to previous years due to a mild 2015–16 winter and more reliance on natural gas as fuel for generation.2
For the 2016–17 winter capacity period, ISO-NE forecasts that nearly 3,450 MW of capacity could be at risk when natural gas pipelines become constrained. New England expects increased pipeline capacity from Spectra Energy’s Algonquin Incremental Market (AIM) project. However, while this project expands the pipeline capacity of the existing Algonquin Gas Transmission system by roughly 340,000 dekatherms of natural gas per day, ISO-NE anticipates this relief to be short lived as local distribution companies expand their infrastructure and retiring non-gas-fired resources are replaced with new gas-fired generation. ISO-NE’s outage coordination and real-time efforts evaluate at-risk gas-fired generation in determining sufficient capacity margins. ISO-NE would mitigate these scenarios with real-time supplemental unit commitment and the use of emergency procedures as needed.
In Texas, ERCOT assumes that about 1,500 MW of gas curtailment outages/derates occur for typical temperatures at the time of the winter peak load hour. An additional 1,060 MW of outages/derates also occur, assuming that extreme cold temperatures happen during the peak load hour. Even with extreme temperatures and associated loads, ERCOT projects sufficient generation for its system.3
In WECC, the staff of the California Public Utilities Commission, the California Energy Commission, the California Independent System Operator, the Los Angeles Department of Water and Power, and Southern California Gas performed analysis and generated the Aliso Canyon Winter Risk Assessment Technical Report.4 This study analyzed the possible impacts to electric reliability due to the reduced natural gas availability associated with the Aliso Canyon storage facility leak. The LADWP/California ISO joint power-flow study found that, under most gas supply and demand conditions, electric reliability can be satisfied for colder than normal weather, such as 1-in-10 year winter peak electric demand. At the time of this report, Aliso Canyon holds 15 Bcf of natural gas, and under normal winter weather conditions, withdrawals for electric generation are not likely.
Transmission System ReliabilityOverall, the transmission system is projected to be adequate for the upcoming winter season. Assessment areas with large footprints, such as the Western Interconnection, do not predict any operational flow challenges. However, some assessment areas will be very reliant on the transmission system to offset generation capacity reduction; the LA Basin in southern California may be dependent on interstate transfers to balance demand, and for stability of the system, in the event of supply constraints.
1 https://www.iso-ne.com/committees/key-projects/winter-reliability-solutions 2 https://www.eia.gov/electricity/monthly/update/fossil_fuel_stocks.cfm3 http://www.ercot.com/content/wcm/lists/91620/SARA_PreliminaryWinter2016_2017.pdf4 http://docketpublic.energy.ca.gov/PublicDocuments/16-IEPR-02/TN212913_20160823T090035_Aliso_Canyon_Winter_Risk_Assessment_Technical_Report.pdf

2016–2017 Winter Reliability Assessment 7
Total Internal DemandPeak demand forecast for most assessment areas has decreased or remained flat from prior assessments. Some assessment areas, such as SERC and Texas RE-ERCOT, are forecasting growth in total internal demand. The increases in forecasted demand for each assessment area are explained below:
SERC-SE: For the upcoming season, some entities in the SERC Region switched from using a 10-year period for normal weather to a historical 20–30 year period. Given that the winters are slightly more extreme on average in the 30 year period, the effect was an increase in forecasted winter peak demand. For example, the change in the “normal weather” period had the effect of raising the winter peak forecast by approximately 200 MW by 2020.
MRO Manitoba–Hydro: The change in Manitoba Hydro’s demand is due to a change in the method for reporting; specifically, Manitoba Hydro reported January peak load for the 2015–16 winter and they reported winter peak load for the 2016–17 winter. Texas RE-ERCOT: The nine percent growth in Texas RE-ERCOT is attributable to both strong customer growth and a refinement to ERCOT’s forecast model for the winter months. ERCOT’s winter peaks experience relatively high volatility, so year-on-year changes of such magnitude are not uncommon.
Net Demand Change from 2015–16 Winter to 2016/17
-3.40% -2.75%
-1.07% -1.07% -1.00% -0.84%
-0.80% -0.29% -0.17% -0.08%
0.58% 0.93%1.09% 1.25% 1.73% 1.73%
2.61%
3.81%
7.56%9.07%
-6.00%
-4.00%
-2.00%
0.00%
2.00%
4.00%
6.00%
8.00%
10.00%

2016–2017 Winter Reliability Assessment 8
Wind, Solar, and Hydro Resources Wind and solar power generation are projected to grow in most North American areas. On-peak available wind capacity is projected to be 16.5 percent of the total nameplate capacity, on-peak available solar capacity is projected to be 4.2 percent of the total nameplate capacity, and hydro on-peak available capacity is projected to be 77.3 percent of the total nameplate capacity.
200,000
150,000
100,000
50,000
0Wind Solar Hydro
On-Peak Expected Capacity Derated CapacityRenewable Nameplate Capacity

2016–2017 Winter Reliability Assessment 9
FRCC The Florida Reliability Coordinating Council’s (FRCC) membership includes 30 Regional Entity Division members and 23 Member Services Division members composed of investor-owned utilities (IOUs), cooperatives, municipal utilities, power marketers, and independent power producers. FRCC is divided into 10 Balancing Au-thorities with 47 registered entities (both members and non-members) performing the functions identified in the NERC Reliability Functional Model and defined in the NERC Reliability Standards. The Region contains a pop-ulation of over 16 million people and has a geographic coverage of about 50,000 square miles over Florida.
0
100
200
300
400
Wind Solar Hydro
Meg
awat
ts
Renewable Nameplate Capacity
On-Peak Expected Capacity Derated Capacity68%
14%
11%
6% 1%
On-Peak Expected Capacity: Generation Mix
GasCoalPetroleumNuclearBiomass
• The anticipated reserve margins is forecasted to be 39.7 percent, which is above the reference margin level of 15 percent.
• The FRCC Region does not anticipate any issues that could lead to a large-scale impact to generator availability during the winter season and expects the BES to perform adequately throughout various system operating conditions.
Highlights

2016–2017 Winter Reliability Assessment 10
MISO The Midcontinent Independent Sys-tem Operator, Inc. (MISO) is a not-for-profit, member-based organization administering wholesale electricity markets that provide customers with valued service; reliable, cost-effective systems and operations; depend-able and transparent prices; open access to markets; and planning for long-term efficiency. MISO manages energy, reliability, and operating re-serve markets that consist of 36 local Balancing Authorities and 394 market participants, serving approximately 42 million customers. Although parts of MISO fall in three NERC Regions, MRO is responsible for coordinating data and information submitted for NERC’s reliability assessments.
The load and resources in the MRO-MAPP As-sessment Area has been integrated primarily into SPP, with smaller portions integrated into MISO and WECC (WAPA). This development was considered when comparing 2015-16 and 2016-17 WRA data.
Highlights
44%
41%
9%3% 2% 1%
On-Peak Expected Capacity: Generation Mix
Coal
Gas
Nuclear
Hydro & PumpedStoragePetroleum
Renewable
0
5,000
10,000
15,000
20,000
Wind Solar Hydro
Meg
awat
ts
Renewable Nameplate Capacity
On-Peak Expected Capacity Derated Capacity
• The anticipated reserve margin is forecasted to be 44 percent, which is above the reference margin level of 15.2 percent.
• Lessons learned from the polar vortex resulted in the implementation of new operational tools and reports and an increase in communication with gas entities. This resulted in improved situational awareness for system operators and Generator Operators, particularly during extreme events. These actions also include holding the winter readiness workshop that reviews resource and transmission adequacy, operating procedures, and overall reliability of the BPS.

2016–2017 Winter Reliability Assessment 11
MRO-Manitoba HydroManitoba Hydro is a provincial crown corporation that provides electric-ity to 556,000 customers through-out Manitoba and natural gas ser-vice to 272,000 customers in various communities throughout southern Manitoba. The Province of Manitoba is 250,946 square miles. Manitoba Hydro is winter peaking. No change in the footprint area is expected dur-ing the assessment period. Manitoba Hydro is its own Planning Coordinator and Balancing Authority. Manitoba Hydro is a coordinating member of MISO. MISO is the Reliability Coordi-nator for Manitoba Hydro.
0
2,000
4,000
6,000
Wind Solar Hydro
Meg
awat
ts
Renewable Nameplate Capacity
On-Peak Expected Capacity Derated Capacity
91%
5%2% 2%
On-Peak Expected Capacity: Generation Mix
HydroGasWindCoal
• The anticipated reserve margin is forecasted to be 14 percent, which is above the reference margin level of 12 percent. This change from the prior year is primarily due to a forecasted increase in net internal demand by 7.6 percent.
• No significant operational challenges are anticipated that would impact BPS reliability for 2016–17 winter season.
Highlights

2016–2017 Winter Reliability Assessment 12
MRO-SaskPowerSaskatchewan is a province of Canada and comprises a geographic area of 651,900 square kilometers (251,700 square miles) with approximately 1.1 million people. Peak demand is expe-rienced in the winter. The Saskatch-ewan Power Corporation (SaskPower) is the Planning Coordinator and Reli-ability Coordinator for the province of Saskatchewan and is the principal supplier of electricity in the province. SaskPower is a provincial crown cor-poration and, under provincial legisla-tion, is responsible for the reliability oversight of the Saskatchewan bulk electric system and its interconnec-tions.
43%
36%
20%
1%
On-Peak Expected Capacity: Generation Mix
GasCoalHydroRenewable0
500
1,000
Wind Solar Hydro
Meg
awat
ts
Renewable Nameplate Capacity
On-Peak Expected Capacity Derated Capacity
Highlights• The anticipated reserve margin is forecasted to be 21.2 percent, above the reference margin level of 11 percent.• The seasonal operating reserve margins for 2016–17 winter will be adequate with no significant seasonal
constraints identified at this time.

2016–2017 Winter Reliability Assessment 13
NPCC-MaritimesThe Maritimes Assessment Area is a winter-peaking NPCC subregion that contains two Balancing Authorities. It is comprised of the Canadian prov-inces of New Brunswick, Nova Scotia, and Prince Edward Island, and the northern portion of Maine, which is radially connected to the New Bruns-wick power system. The area covers 58,000 square miles, with a total pop-ulation of 1.9 million people.
0
500
1,000
1,500
Wind Solar Hydro
Meg
awat
ts
Renewable Nameplate Capacity
On-Peak Expected Capacity Derated Capacity
28%
25%19%
13%
10%
3% 2%
On-Peak Expected Capacity: Generation Mix
PetroleumCoalHydroGasNuclearBiomassWind
Highlights• The anticipated reserve margin is forecasted to be 22.2 percent, which is above the reference margin level of
20 percent. This change from the prior year is primarily due to a forecasted decrease in anticipated resources by 5.1 percent.
• The Maritime area does not expect any interruption to the supply to its gas-fired generation facilities.

2016–2017 Winter Reliability Assessment 14
NPCC-New EnglandISO New England (ISO-NE) Inc. is a regional transmission organization that serves Connecticut, Maine, Mas-sachusetts, New Hampshire, Rhode Island, and Vermont. It is responsible for the reliable day-to-day operation of New England’s bulk power gen-eration and transmission system and also administers the area’s wholesale electricity markets and manages the comprehensive planning of the re-gional BPS. The New England regional electric power system serves ap-proximately 14.5 million people over 68,000 square miles.
46%
22%
12%
6%
5%5%
3% 1%
On-Peak Expected Capacity: Generation Mix
GasPetroleumNuclearCoalPumped StorageHydroBiomassWind
0
500
1,000
1,500
2,000
Wind Solar Hydro
Meg
awat
ts
Renewable Nameplate Capacity
On-Peak Expected Capacity Derated Capacity
Highlights• The anticipated reserve margin is forecasted to be 28.7 percent for the winter season, which is above the
reference margin level of 17.6 percent.• ISO-NE’s long- and short-term outage coordination efforts evaluate and account for gas-fired generation at risk
in determining sufficient capacity margins.• For the 2016–17 winter capacity period, ISO-NE forecasts approximately 3,450 MW of capacity could be at risk
when natural gas pipelines become constrained.• NERC conducted an operational risk analysis that studied an extreme case scenario in NERC’s Short-Term Special
Assessment.

2016–2017 Winter Reliability Assessment 15
NPCC-New YorkThe New York Independent System Operator (NYISO) is the only Balanc-ing Authority (NYBA) within the state of New York. NYISO is a single-state ISO that was formed as the successor to the New York Power Pool—a con-sortium of the eight IOUs—in 1999. NYISO manages the New York State transmission grid, encompassing ap-proximately 11,000 miles of transmis-sion lines, over 47,000 square miles, and serving the electric needs of 19.5 million people. New York experienced its all-time peak load of 33,956 MW in the summer of 2013.
0
2,000
4,000
6,000
Wind Solar Hydro
Meg
awat
ts
Renewable Nameplate Capacity
On-Peak Expected Capacity Derated Capacity
43%
22%
13%
10%
4%4%
3% 1%
On-Peak Expected Capacity: Generation Mix
GasPetroleumNuclearHydroCoalWindPumped StorageRenewable
43%
22%
13%
10%
4%4%
3% 1%
On-Peak Expected Capacity: Generation Mix
GasPetroleumNuclearHydroCoalWindPumped StorageRenewable
Highlights• The anticipated reserve margin is forecasted to be 77.7 percent, which is above the reference margin level of
17.5 percent.• There no concerns are anticipated for the reliable operation of the bulk power system for the winter period.
2016–2017 Winter Reliability Assessment 16
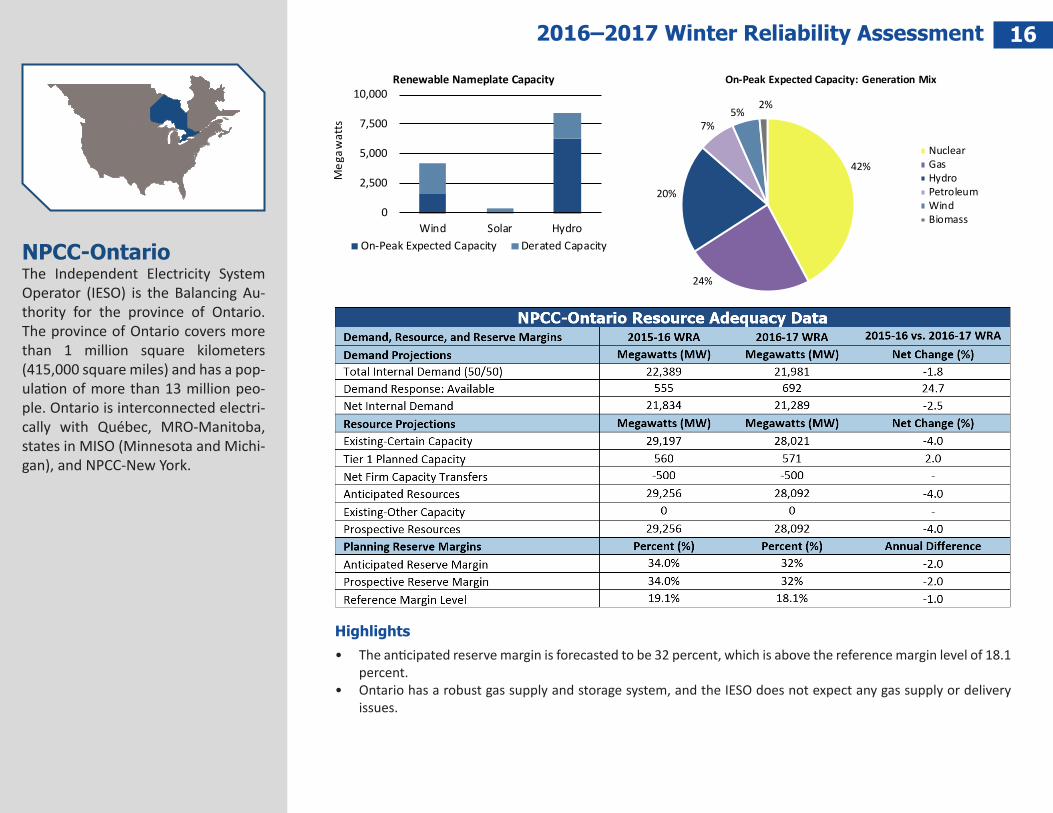
NPCC-OntarioThe Independent Electricity System Operator (IESO) is the Balancing Au-thority for the province of Ontario. The province of Ontario covers more than 1 million square kilometers (415,000 square miles) and has a pop-ulation of more than 13 million peo-ple. Ontario is interconnected electri-cally with Québec, MRO-Manitoba, states in MISO (Minnesota and Michi-gan), and NPCC-New York.
42%
24%
20%
7%5%
2%
On-Peak Expected Capacity: Generation Mix
NuclearGasHydroPetroleumWindBiomass
Highlights• The anticipated reserve margin is forecasted to be 32 percent, which is above the reference margin level of 18.1
percent.• Ontario has a robust gas supply and storage system, and the IESO does not expect any gas supply or delivery
issues.
0
2,500
5,000
7,500
10,000
Wind Solar Hydro
Meg
awat
ts
Renewable Nameplate Capacity
On-Peak Expected Capacity Derated Capacity

2016–2017 Winter Reliability Assessment 17
NPCC-QuébecThe Québec Assessment Area (Prov-ince of Québec) is a winter-peaking NPCC sub region that covers 595,391 square miles with a population of eight million. Québec is one of the four NERC interconnections in North America, with ties to Ontario, New York, New England, and the Mari-times, consisting of either HVDC ties or radial generation or load to and from neighboring systems.
Highlights• The anticipated reserve margin is forecasted to be 14.5 percent, which is above the reference margin level of
11.9 percent
96%
2% 1%1%
On-Peak Expected Capacity: Generation Mix
HydroWindPetroleumBiomass0
20,000
40,000
60,000
Wind Solar Hydro
Meg
awat
ts
Renewable Nameplate Capacity
On-Peak Expected Capacity Derated Capacity

2016–2017 Winter Reliability Assessment 18
PJMPJM Interconnection is a regional transmission organization (RTO) that coordinates the movement of whole-sale electricity in all or parts of Dela-ware, Illinois, Indiana, Kentucky, Mary-land, Michigan, New Jersey, North Carolina, Ohio, Pennsylvania, Tennes-see, Virginia, West Virginia, and the District of Columbia. PJM serves 61 million people and covers 243,417 square miles. PJM is a Balancing Au-thority, Planning Coordinator, Trans-mission Planner, Resource Planner, Interchange Authority, Transmission Operator, Transmission Service Pro-vider, and Reliability Coordinator.
0
2,000
4,000
6,000
8,000
Wind Solar Hydro
Meg
awat
ts
Renewable Nameplate Capacity
On-Peak Expected Capacity Derated Capacity
34%
34%
19%
7%5% 1%
On-Peak Expected Capacity: Generation Mix
Coal
Gas
Nuclear
Petroleum
Hydro & PumpedStorageRenewable
Highlights• The anticipated reserve margin is forecasted to be 39.7 percent, which is above the reference margin level of
16.4 percent.• With the implementation of the capacity performance initiatives, PJM anticipates that the amount of natural
gas interruptions on an extreme cold weather day or extended period of extreme cold weather would be less than 4% of total installed capacity.

2016–2017 Winter Reliability Assessment 19
SERCSERC is a summer-peaking assess-ment area that covers approximately 308,900 square miles and serves a population estimated at 39.4 million. SERC is divided into three assessment areas: SERC-E, SERC-N, and SERC-SE. The SERC Region includes 11 Balanc-ing Authorities: Alcoa Power Gener-ating, Inc.–Yadkin Division (Yadkin), Associated Electric Cooperative, Inc. (AECI), Duke Energy Carolinas and Duke Energy Progress (Duke), Electric Energy, Inc. (EEI), LG&E and KU Ser-vices Company (as agent for Louisville Gas and Electric (LG&E) and Kentucky Utilities (KU)), PowerSouth Energy Co-operative (PowerSouth), South Caro-lina Electric & Gas Company (SCE&G), South Carolina Public Service Author-ity (Santee Cooper, SCPSA), Southern Company Services, Inc. (Southern), and Tennessee Valley Authority (TVA).
40%
32%
15%
6%4% 2% 1%
On-Peak Expected Capacity: Generation Mix
GasCoalNuclearHydroPumped StoragePetroleumRenewable
0
5,000
10,000
15,000
Wind Solar Hydro
Meg
awat
ts
Renewable Nameplate Capacity
On-Peak Expected Capacity Derated Capacity
Highlights• Anticipated reserve margins for all areas are forecasted to be above the reference margin level of 15 percent• Dual fuel units are exercised on a regular schedule, and adequate supplies of alternative fuel are generally
stored on-site• Some natural-gas-fired units use secondary or interruptible pipeline transportation capacity and fuel oil.• Salt dome storage facilities are available to mitigate gas supply interruptions

2016–2017 Winter Reliability Assessment 20
SPPSouthwest Power Pool (SPP) Planning Coordinator footprint covers 575,000 square miles and encompasses all or parts of Arkansas, Iowa, Kansas, Loui-siana, Minnesota, Missouri, Montana, Nebraska, New Mexico, North Da-kota, Oklahoma, South Dakota, Texas and Wyoming. The SPP Long-Term Assessment is reported based on the Planning Coordinator footprint, which touches parts of the Southwest Pow-er Pool Regional Entity, Midwest Re-liability Organization Regional Entity, and Western Electricity Coordinating Council. The SPP Assessment Area footprint has approximately 61,000 miles of transmission lines, 756 gen-erating plants, and 4,811 transmis-sion-class substations, and it serves a population of 18 million people.
The load and resources in the MRO-MAPP As-sessment Area has been integrated primarily into SPP, with smaller portions integrated into MISO and WECC (WAPA). This development was considered when comparing 2015-16 and 2016-17 WRA data.
Highlights• The anticipated reserve margin is forecasted to be 62 percent, which is above the reference margin level of
13.6 percent.• SPP members monitor their fuel supplies and inventories and keep the SPP RTO informed of any generation
experiencing (or projected to experience) impacts due to fuel limitations.
0
5,000
10,000
15,000
Wind Solar Hydro
Meg
awat
ts
Renewable Nameplate Capacity
On-Peak Expected Capacity Derated Capacity
45%
39%
7%4%
3% 2%
On-Peak Expected Capacity: Generation Mix
Gas
Coal
Hydro & PumpedStorageNuclear
Renewable
Petroleum

2016–2017 Winter Reliability Assessment 21
Texas RE-ERCOTThe Electric Reliability Council of Tex-as (ERCOT) is the ISO for the ERCOT In-terconnection and is located entirely in the state of Texas; it operates as a single Balancing Authority. ERCOT is a summer-peaking Region that covers approximately 200,000 square miles, connects 40,530 miles of transmis-sion lines, and 566 generation units, and serves 23 million customers. The Texas Reliability Entity (Texas RE) is responsible for the RE functions de-scribed in the Energy Policy Act of 2005 for the ERCOT Region.
62%
24%
7%
6% 1%
On-Peak Expected Capacity: Generation Mix
GasCoalNuclearRenewableHydro
0
10,000
20,000
30,000
Wind Solar Hydro
Meg
awat
ts
Renewable Nameplate Capacity
On-Peak Expected Capacity Derated Capacity
Highlights• The anticipated reserve margin is forecasted to be 37.1 percent, which is above the reference margin level of
13.75 percent. This change from the prior year is primarily due to a forecasted increase in net internal demand by 9.2 percent and a forecasted decrease in anticipated resources by 1.6 percent.
• Since May 2016, about 660 MW of installed gas-fired capacity have begun commercial operation in ERCOT as well as over 700 MW of nameplate wind capacity.

2016–2017 Winter Reliability Assessment 22
WECCThe Western Electricity Coordinating Council (WECC) is responsible for coordinating and promoting Bulk Electric System reliability in the Western Interconnection. WECC’s 329 members, which include 38 Balancing Au-thorities, represent a wide spectrum of orga-nizations with an interest in the BES. Serving an area of nearly 1.8 million square miles and approximately 82.2 million people, it is geo-graphically the largest and most diverse of the NERC Regional Entities. WECC’s service territory extends from Canada to Mexico. It includes the provinces of Alberta and British Columbia in Canada, the northern portion of Baja California in Mexico, and all or portions of the 14 western states in between. The WECC Assessment Area is divided into five subregions: Rocky Mountain Reserve Group (RMRG), Southwest Reserve Sharing Group (SRSG), California/Mexico (CA/MX), and the Northwest Power Pool (NWPP), which is fur-ther divided into the NW-Canada and NW-US areas. These subregional divisions are used for this study, as they are structured around reserve sharing groups that have similar an-nual demand patterns and similar operating practices.
The load and resources in the MRO-MAPP Assess-ment Area has been integrated primarily into SPP, with smaller portions integrated into MISO and WECC (WAPA). This development was considered when comparing 2015-16 and 2016-17 WRA data.
Highlights• The Aliso Canyon Winter Risk Assessment Technical Report was developed through coordination between the CPUC, CEC,
CAISO, LADWP, and SoCalGas. This report provides a more detailed analysis of the storage facility and the possible impacts to reliability in the LA Basin.
• The anticipated reserve margins for all WECC subregions will remain above their respective reference margin levels throughout the 2016–17 winter.
0
20,000
40,000
60,000
80,000
Wind Solar Hydro
Meg
awat
ts
Renewable Nameplate Capacity
On-Peak Expected Capacity Derated Capacity
49%
22%
19%
4%2% 2% 1% 1%
On-Peak Expected Capacity: Generation Mix
GasHydroCoalNuclearOtherWindBiomassGeothermal

2016–2017 Winter Reliability Assessment 23Data Concepts and Assumptions GuideThe table below explains data concepts and important assumptions used throughout this assessment.
Glossary of Terms Used in NERC Reliability StandardsThe summer season represents June–September and the winter season represents December–February.Essentially, this means that there is a 50% probability that actual demand will be higher and a 50% probability that actual demand will be lower than the value provided for a given season/year.Coincident: The sum of two or more peak loads that occur in the same hour. Noncoincident: The sum of two or more peak loads on individual systems that do not occur in the same time interval. Meaningful only when considering loads within a limited period of time, such as a day, a week, a month, a heating or cooling season, and usually for not more than one year. SERC and FRCC calculate total internal demand on a noncoincidental basis.
5
6
7
8

2016–2017 Winter Reliability Assessment 24