2016/17 annual report and accounts - pension protection … · pension protection fund | annual...
TRANSCRIPT

Pension Protection FundANNUAL REPORT & ACCOUNTS 2016/2017
PROTECTING PEOPLE’S FUTURES
HC147


Annual report presented to Parliament pursuant to Section 119(5) of the Pensions Act 2004 and Accounts presented to Parliament pursuant to paragraph 22(6) (b) of Schedule 5 to the Pensions Act 2004.
Ordered by the House of Commons to be printed on 6 July 2017.
HC147
Pension Protection FundANNUAL REPORT & ACCOUNTS 2016/2017

P E N S I O N P R O T E C T I O N F U N D | ANNUAL REPORT AND ACCOUNTS 20 16 / 1 7 | 5
© Pension Protection Fund 2017
The text of this document (this excludes, where present, the Royal Arms and all departmental and agency logos) may be reproduced free of charge in any format or medium providing that it is reproduced accurately and not in a misleading context.
The material must be acknowledged as Pension Protection Fund copyright and the document title specified. Where third party material has been identified, permission from the respective copyright holder must be sought.
Any enquiries regarding this publication can be referred to us at 0845 600 2541.
This publication is also available for download from our website at www.pensionprotectionfund.org.uk
Print ISBN: 978-1-47414-721-7
Web ISBN: 978-1-47414-722-4
ID: 26061711 07/17
Printed on paper containing 75% recycled fibre content minimum.
Printed in the UK for the Williams Lea Group on behalf of the Controller of Her Majesty’s Stationery Office.

P E N S I O N P R O T E C T I O N F U N D | ANNUAL REPORT AND ACCOUNTS 20 16 / 1 7 | 5
Page
Senior management 8
Chairman’s statement 10
The Performance Report
Chief Executive’s review 12
Overview 14
Performance analysis 18
Managing our balance sheet 22
Risk management 26
Strategy, levy and legal 28
Scheme and member services 32
HR, organisational development and communications 36
General information 39
Statement on going concern 41
The Accountability Report
The Board of the Pension Protection Fund 44
Governance statement 48
Remuneration and staff report 59
Parliamentary accountability 65
Statement of Accounting Officer’s responsibilities 66
The certificate and report of the Comptroller and Auditor General 67
Financial Statements 69
Actuarial reports 107
Commonly abbreviated terms 151
ContentsANNUAL REPORT & ACCOUNTS 2016/2017

P E N S I O N P R O T E C T I O N F U N D | ANNUAL REPORT AND ACCOUNTS 20 16 / 1 7 | 76 | P E N S I O N P R O T E C T I O N F U N D | ANNUAL REPORT AND ACCOUNTS 20 16 / 1 7

P E N S I O N P R O T E C T I O N F U N D | ANNUAL REPORT AND ACCOUNTS 20 16 / 1 7 | 76 | P E N S I O N P R O T E C T I O N F U N D | ANNUAL REPORT AND ACCOUNTS 20 16 / 1 7
Who we are
Our values
We protect millions of people throughout the UK who belong to defined benefit pension schemes.
Our mission is to pay the right people the right amount at the right time.
The Pension Protection Fund is a public corporation, set up by the Pensions Act 2004, and run by an independent board. We report to
Parliament through the Secretary of State for Work and Pensions.
Integrity: Doing the right thing
Collaboration: Working as one
Accountability: Owning our actions
Respect: Valuing every voice
Excellence: Being our best
Pension Protection FundANNUAL REPORT & ACCOUNTS 2016/2017

8 | P E N S I O N P R O T E C T I O N F U N D | ANNUAL REPORT AND ACCOUNTS 20 16 / 1 7 P E N S I O N P R O T E C T I O N F U N D | ANNUAL REPORT AND ACCOUNTS 20 16 / 1 7 | 9
Senior managementTHE PENSION PROTECTION FUND
SENIO
R MA
NA
GEM
ENT
Back row, from left to right:
Alan Jenkins • Alan Rubenstein • Kate Jones • Tom Joy • Jayne Nickalls Andy McKinnon • Sharmila Nebhrajani OBE
Front row, from left to right:
Rosemary Hilary • Baroness Warwick of Undercliffe Arnold Wagner OBE • David Taylor
The Board

8 | P E N S I O N P R O T E C T I O N F U N D | ANNUAL REPORT AND ACCOUNTS 20 16 / 1 7 P E N S I O N P R O T E C T I O N F U N D | ANNUAL REPORT AND ACCOUNTS 20 16 / 1 7 | 9
SENIO
R MA
NA
GEM
ENT
Senior managementTHE PENSION PROTECTION FUND
Back row, from left to right:
David Taylor • Sara Protheroe • Hans den Boer • Barry Kenneth
Front row, from left to right:
Katherine Easter • Alan Rubenstein • Andy McKinnon
The Executive Committee

1 0 | P E N S I O N P R O T E C T I O N F U N D | ANNUAL REPORT AND ACCOUNTS 20 16 / 1 7 P E N S I O N P R O T E C T I O N F U N D | ANNUAL REPORT AND ACCOUNTS 20 16 / 1 7 | 1 1
CH
AIRM
AN
’S STATEMEN
T
Chairman’s statementARNOLD WAGNER OBE | CHAIRMAN
I want to start this statement by thanking Lady Barbara Judge CBE, my predecessor, for her excellent service to the PPF over the previous six years. Barbara built a strong Board and played a key role in empowering the PPF’s top class executive team.I’ve been Chairman of the PPF for a year now, and it could hardly have been a more eventful 12 months. After a year which saw the collapse of BHS, the debate on the future of British Steel pensions, two Work and Pensions Select Committee inquiries on defined benefit (DB) pensions and a Green Paper on the future of DB, pensions can certainly not be described as dull.
The PPF has been involved in each of these, to a greater or lesser extent. We have never been an organisation to court publicity but have found ourselves in the spotlight more than ever. In my view, the organisation has succeeded in not allowing innovation and creativity to be compromised by concerns around external perceptions. Issues presented by the environment require us to adapt, but they have not affected our ability to deliver on our mission.
There are many uncertainties in the world we operate in, but our mission is the same as it always has been: to pay the right people the right amount at the right time. We are succeeding in this mission and we are delivering on our strategic objectives to meet our funding target and deliver excellent customer service within our risk framework. But we must never be complacent and we never stop looking for better ways of doing things.
The PPF is an established part of the pensions landscape and it is easy to forget the situation that led to our creation. People who had worked all their lives to build up their pension pot could have been left with nothing when their employer went bust. It worries me when people talk about ‘falling into’ or ‘avoiding’ the PPF. When a company goes bust and its scheme is significantly underfunded, the scheme comes to the PPF because it simply cannot afford to pay what the PPF provides. If a scheme enters the PPF, its members will get more than the scheme’s assets could have otherwise provided. They may not receive 100 per cent of what they were originally promised by their employer, but PPF compensation is almost always substantially more than they would have received if the PPF were not there. In all the circumstances facing pension scheme members whose sponsors go bust, if a buyout can provide higher than PPF levels then that is an excellent outcome – but if members receive PPF compensation, that should not be described as a bad pension result.
In the recent and ongoing debate about the future of the DB system we have made clear that we don’t believe that a radical overhaul is necessary, nor have we found any evidence of a systemic affordability crisis. Of course there are considerable risks in the system, as we have seen recently, and some schemes undoubtedly face severe difficulty.

1 0 | P E N S I O N P R O T E C T I O N F U N D | ANNUAL REPORT AND ACCOUNTS 20 16 / 1 7 P E N S I O N P R O T E C T I O N F U N D | ANNUAL REPORT AND ACCOUNTS 20 16 / 1 7 | 1 1
CH
AIRM
AN
’S STATEMEN
T
Given our recent experience, we believe that certain aspects of the system could be developed to improve outcomes for all stakeholders through better management of risk.
For example, we would welcome measures to encourage clearance applications in those instances where there might be cause for concern, and we have suggested the introduction of punitive fines for employers who are found to have avoided their responsibilities in this regard.
We also recognise that many small employers face particular challenges with the costs of running their pension schemes. As we have previously said, consolidation could be the best long-term solution and we support further investigation to help find a practical way of doing this.
Having served as a pension scheme trustee myself, I am well aware of the challenges trustees face in carrying out the enormous task of serving their members. Trustees are often volunteers who give up significant hours of their own time to take on the serious responsibility of looking after a pension scheme. The importance of the role of trustee cannot be underestimated. If things go wrong, the buck stops with them. Accountability is one of the PPF’s five values, and rarely is this quality more important than when acting as a trustee. I am particularly keen to do what I can to work with interested parties in encouraging all trustees, lay and professional, to become better equipped by increasing their own capability through continuing development.
Confident, capable trustees who are able to engage well with their advisors and the sponsoring employer, and to challenge effectively when necessary, are critical to helping ensure scheme members ultimately receive the pensions promised to them.
Finally, I want to extend a big thank you to Alan Rubenstein for his outstanding leadership, to my fellow Board members and to the members of our Executive Committee for their hard work and dedication, as well as the support they have given me during the past year. Last but not least, my thanks go to every PPF employee. You have all worked exceptionally hard to make the PPF the successful organisation it is today and have risen admirably to the recent challenges we have faced. The coming year will no doubt bring new challenges for us to address. I am confident we will, together, face them with the same professional commitment and dedication as always and I believe all our stakeholders should continue to share that confidence.
Arnold Wagner OBE
THERE ARE MANY UNCERTAINTIES IN THE WORLD WE OPERATE IN, BUT OUR MISSION IS THE SAME AS IT ALWAYS HAS BEEN: TO PAY THE RIGHT PEOPLE THE RIGHT AMOUNT AT THE RIGHT TIME. WE ARE SUCCEEDING IN THIS
MISSION AND WE ARE DELIVERING ON OUR STRATEGIC OBJECTIVES TO MEET OUR FUNDING TARGET AND DELIVER EXCELLENT CUSTOMER SERVICE WITHIN OUR RISK FRAMEWORK.

1 2 | P E N S I O N P R O T E C T I O N F U N D | ANNUAL REPORT AND ACCOUNTS 20 16 / 1 7 P E N S I O N P R O T E C T I O N F U N D | ANNUAL REPORT AND ACCOUNTS 20 16 / 1 7 | 1 3
PERFORM
AN
CE REPO
RT
Chief Executive’s reviewALAN RUBENSTEIN | CHIEF EXECUTIVE
The last year has been one full of significant developments in the world around the PPF. From the Brexit vote to the election of President Trump, from the Work and Pensions Select Committee inquiry into the collapse of BHS to the publication of the Government’s Green Paper on the future of defined benefit (DB) pensions, there have been many events which we can expect to have a long-term impact on how we operate and how we invest.
However we have not allowed these events to distract us from our mission to pay the right people the right amount at the right time and have continued to make steady progress towards our strategic objectives over the last twelve months.
Over the year, we completed the transfer of a further 12,000 members into the PPF, bringing the total number of people who have transferred to 235,000. Of those, just over half, 128,000 are currently in receipt of compensation. Following the closure of the Financial Assistance Scheme (FAS) to new applications in September, more than 1,000 schemes covering 154,000 members, are receiving or can expect to receive compensation from FAS in due course.
We enjoyed an equally successful financial year in financial markets. Over the period, our directly invested assets grew from £23.4 billion to £28.7 billion, while after allowing for schemes in assessment and the impact of our hedging programme, our total balance sheet assets grew to £34.1 billion. This is equivalent to an overall funding ratio of 121.6 per cent, up from 116.3 per cent last year. Whilst this might seem a comfortable margin,
it is important to remember that our reserves in excess of our current liabilities, at £6.1 billion, remain a small fraction of the total deficit of £226.5 billion at the end of the March 2017 (as measured by the PPF 7800 Index) for the schemes we protect.
As noted, our investment strategy has performed well over the year, delivering absolute returns of 16.0 per cent. Once allowance is made for the impact of our successful liability-driven investment (LDI) programme, which protects the Fund from fluctuations in inflation and interest rates, our assets excluding LDI returned 3.9 per cent, 1.6 per cent above our benchmark. We are very pleased with this performance, particularly in light of the Fund’s long-term, low-risk investment strategy.
Insourcing part of our asset management has been one of our priorities during the course of the year, and we now manage a significant proportion of our LDI trading in-house. The trend to insource resources is becoming ever more common among funds of our size and we believe delivers better control of costs and greater flexibility in implementation to the PPF.

1 2 | P E N S I O N P R O T E C T I O N F U N D | ANNUAL REPORT AND ACCOUNTS 20 16 / 1 7 P E N S I O N P R O T E C T I O N F U N D | ANNUAL REPORT AND ACCOUNTS 20 16 / 1 7 | 1 3
PERFORM
AN
CE REPO
RT
We have continued to progress towards our funding objective, which is to be self-sufficient by our funding horizon, currently 2030, by which time we expect new claims to be low in relation to our liabilities. Our long-term risk model predicts that we will achieve this objective in 93 per cent of scenarios. We are confident that our funding strategy remains appropriate to enable us to achieve our objectives, though we do of course continue to review the strategy regularly.
Looking forward, two major announcements we made in the last year related to changes to how we expect to calculate future PPF levies.
Firstly, we consulted on and introduced a new rule for charging a levy to schemes which cease to have a substantive sponsoring employer. This will typically be after an insolvency event and will result in a Special Purpose Vehicle standing in the place where a substantive employer previously stood as sponsor. Such schemes present a different risk to the PPF to that originally envisaged by Parliament, as the primary risk becomes the failure of their investment strategies, as opposed to normal schemes where failure is triggered by insolvency of the sponsor. Currently, the new BHS scheme is the only scheme to which the new rules are expected to apply, but we may see more in future, depending on the outcome of the Government’s Green Paper consultation.
Secondly, and perhaps more significantly, we published a consultation on proposed new rules for the next levy triennium, starting in 2018. Alongside a number of wider suggested developments, the proposals focused on two ways in which we plan to develop the approach to measuring insolvency risk, including the use of credit ratings and some improvements to the scorecards’ predictiveness. We have been pleased with the initial response from stakeholders to this consultation and intend to open a second consultation on the 2018-21 triennium, including a number of refinements to our methodology, later in 2017.
We also recently announced our intention to bring FAS member services in-house during 2018. This will enable us to deliver the same great service to FAS members as we currently deliver to PPF members and, through using a common platform, will enable us to make further efficiency savings.
Finally, I want to say a big thank you to everyone at the PPF. It is only through their talents, commitment and integrity that we continue to deliver certainty to our members and the millions of others who are members of defined benefit pension schemes. They are inspiring and because of them, we are in a strong position to face the future.
Alan Rubenstein
THE TREND TO INSOURCE RESOURCES IS BECOMING EVER MORE COMMON AMONG FUNDS OF OUR SIZE AND WE BELIEVE DELIVERS BETTER CONTROL OF COSTS AND GREATER FLEXIBILITY
IN IMPLEMENTATION TO THE PPF.

1 4 | P E N S I O N P R O T E C T I O N F U N D | ANNUAL REPORT AND ACCOUNTS 20 16 / 1 7 P E N S I O N P R O T E C T I O N F U N D | ANNUAL REPORT AND ACCOUNTS 20 16 / 1 7 | 1 5
The following overview sets out the PPF’s purpose, the key risks it faces in achieving its objectives and how it performed during the year.
What we doWe protect millions of people throughout the United Kingdom who belong to defined benefit, e.g. final salary, pension schemes.
If their employers become insolvent, and their pension schemes cannot afford to pay people their promised pensions, we will compensate them financially for the money they have lost. We take over responsibility for payments once we have assessed that a scheme can’t afford to buy benefits from an insurance company which are equal to, or more than, the PPF would pay.
More than 125,000 people now receive compensation from the PPF and hundreds of thousands more will do so in the future. Without us, these people could face significant financial uncertainty and hardship.
Our vision to protect people’s futures is as strong now as it was when the PPF first opened its doors in 2005. We remain resolutely committed to paying the right amount to the right people at the right time.
We get the money we need to pay compensation and the cost of running the PPF in a number of ways. We:
• charge a levy on eligible pension schemes
• take on the assets of schemes that transfer to the PPF
• recover money, and other assets, from the insolvent employers of the schemes we take on, and
• invest all income and assets, as part of a prudent yet innovative strategy, with the aim of making sure we can pay members’ compensation for as long as they are entitled to it.
PERFORM
AN
CE REPO
RT We are also responsible for:
OverviewWHAT WE DO
Financial Assistance SchemeWe are responsible for the day-to-day running of the Financial Assistance Scheme (FAS) on behalf of the Government. FAS activities are funded by the tax payer rather than a levy.
FAS pays financial assistance to people who were members of certain defined benefit pension schemes which are ineligible for compensation from the PPF – in particular, those schemes which started winding up between January 1997 and April 2005.
Fraud Compensation FundWe also pay compensation to eligible work-based pension schemes – including defined contribution schemes – whose employers become insolvent and whose schemes have lost out financially due to dishonesty. Fraud compensation is paid for through a separate levy on all pension schemes.

1 4 | P E N S I O N P R O T E C T I O N F U N D | ANNUAL REPORT AND ACCOUNTS 20 16 / 1 7 P E N S I O N P R O T E C T I O N F U N D | ANNUAL REPORT AND ACCOUNTS 20 16 / 1 7 | 1 5
PERFORM
AN
CE REPO
RT
1
3
2
OverviewOUR STRATEGIC OBJECTIVES
Meet our funding target through prudent and effective management of our balance sheet
Pursue our mission within a high calibre framework of risk management
Deliver excellent customer services to our members, levy payers and other stakeholders
Fundamental to our mission is that we have enough money to pay our members compensation, both now and in the future. Our strategic ambition is to be financially self-sufficient by 2030, when we aim to be confident about being sufficiently funded to meet our long-term liabilities. We had a strong financial performance this year, with our funding ratio increasing to 121.6 per cent.
Assessing and managing our risks is crucial if we are to succeed in our mission. While we remain in a strong funding position, the external environment poses significant risks. We have embedded a robust risk management framework to enable us to do this. We have a broad understanding of our risks, in part using data that we publish in the PPF 7800 Index and The Purple Book. Furthermore, we are committed to pursuing best practice risk management.
Excellent customer service is at the heart of everything we do and we strive to meet our members’ and levy payers’ highest expectations. We are proud to have embedded our in-house member services function and we aim to provide our members with a service that would make them want to choose us if they could. Our customer satisfaction results confirm that we are succeeding in providing a great service. Our other stakeholders, including our levy payers, also continue to show satisfaction with the PPF and feedback for our insolvency risk model remains broadly supportive.
1 6 | P E N S I O N P R O T E C T I O N F U N D | ANNUAL REPORT AND ACCOUNTS 20 16 / 1 7 P E N S I O N P R O T E C T I O N F U N D | ANNUAL REPORT AND ACCOUNTS 20 16 / 1 7 | 1 7
PERFORM
AN
CE REPO
RT
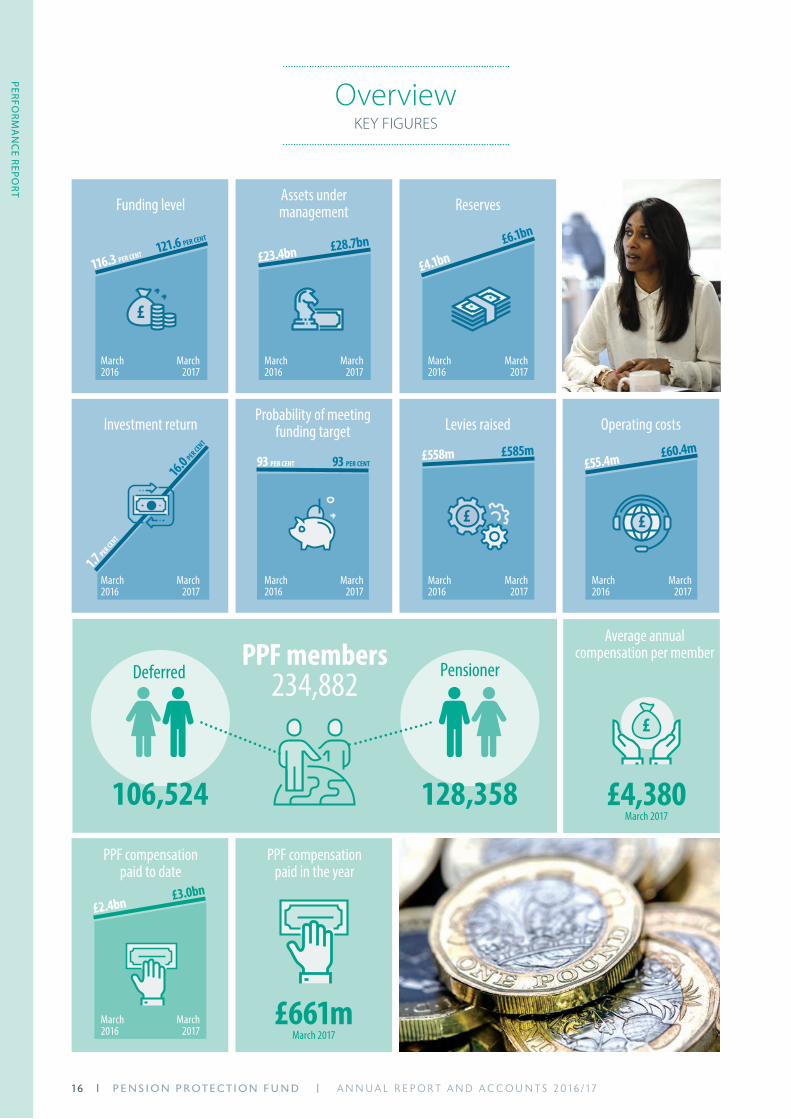
OverviewKEY FIGURES
Funding level Assets under management
Probability of meeting funding target
Reserves
Levies raised Operating costs
£
116.3 PER CENT
93 PER CENT
121.6 PER CENT
93 PER CENT
£23.4bn£4.1bn
£558m£55.4m
£28.7bn £6.1bn
£585m £60.4m
March2016
March2016
March2017
March2017
March2016
March2016
March2016
March2016
March2016
March2017
March2017
March2017
March2017
March2017
Investment return
1.7 PER CENT
16.0 PER CENT
£ £
234,882
128,358106,524
PPF members PensionerDeferred
PPF compensation paid to date
PPF compensation paid in the year
Average annual compensation per member
£2.4bn £3.0bn
£
£661m
£4,380
March 2017
March 2017
March2016
March2017

1 6 | P E N S I O N P R O T E C T I O N F U N D | ANNUAL REPORT AND ACCOUNTS 20 16 / 1 7 P E N S I O N P R O T E C T I O N F U N D | ANNUAL REPORT AND ACCOUNTS 20 16 / 1 7 | 1 7
PERFORM
AN
CE REPO
RT
OverviewKEY FIGURES
Schemes transferred during the year
Value of new claims from schemes entering
PPF assessment
Schemes in assessment at the end
of the year
Total assets from transferred schemes
Assets of schemes in assessment at the end
of the year
Schemes transferred to date
Liabilities of schemes in assessment at the end
of the year
33
62
£0.6bn£252m
£1.3bn
£
£
Schemes qualified for FAS to date
FAS compensation paid to date
£1.1bn
Schemes transferred to FAS in the year
FAS members
150,747 153,920
Scheme assets transferred to the
Government in the year
FAS compensation paid in the year
894March 2017
103March 2017
£5.4bnMarch 2017
1,078March 2017
£88mMarch 2017
£195mMarch 2017
11March 2017
£6.1bnMarch 2017
March 2017
March2016
March2016
March2016
March2016
March2017
March2017
March2017
March2017
£476m
£

1 8 | P E N S I O N P R O T E C T I O N F U N D | ANNUAL REPORT AND ACCOUNTS 20 16 / 1 7 P E N S I O N P R O T E C T I O N F U N D | ANNUAL REPORT AND ACCOUNTS 20 16 / 1 7 | 1 9
The PPF’s work is focused on three strategic objectives which will enable us to fulfil our mission of paying the right amount to the right people at the right time. One of these three objectives is to meet our funding target through prudent and effective management of our balance sheet.
We finished the financial year in a robust position. Our funding ratio improved markedly from 116.3 per cent to 121.6 per cent, and we now manage £28.7 billion of assets, including £6.1 billion in reserves.
Our reserves increased by £2 billion over the year as a result of our strong investment performance and lower than expected claims volumes. Although building a reserve helps to protect the long-term sustainability of the fund, allowing us to meet future claims, the current figure remains modest relative to the net deficit of the schemes we protect, which stood at £226.5 billion, £295.4 billion excluding schemes in surplus, at the end of March 2017.
We have invested according to our investment strategy and our target level of risk. Our hedging programme has continued to perform successfully, ensuring our liability-driven investments have kept pace with highly volatile markets over the year and protecting us from fluctuations in interest rates and inflation. Our growth portfolio has also performed very well this year, adding significant returns to the fund.
Our operating costs have again been under budget this year, mainly owing to lower staff costs, legal fees and the timing of some project spend. Overall, we have maintained a healthy financial performance, we continue to be resilient against economic uncertainty and we are well-positioned to face continuing uncertainty from our operating environment.
Performance analysisANDY MCKINNON | CHIEF FINANCIAL OFFICER
PERFORM
AN
CE REPO
RT

1 8 | P E N S I O N P R O T E C T I O N F U N D | ANNUAL REPORT AND ACCOUNTS 20 16 / 1 7 P E N S I O N P R O T E C T I O N F U N D | ANNUAL REPORT AND ACCOUNTS 20 16 / 1 7 | 1 9
Our funding strategyOur funding strategy guides us in our financial decisions, to help ensure that we can meet our funding objective. We review the strategy annually, in consideration of our progress towards the objective, which is to become financially self-sufficient at a point where future claims are low relative to our liabilities, as fewer defined benefit schemes remain.
The strategy remains on track, but we review our funding objective from time to time and this may need to evolve in future in light of the fact that deficits in the schemes we protect are not closing as quickly as anticipated. We are currently developing our thinking on this, working through a range of possible options and scenarios to determine whether the current definition of our funding horizon remains appropriate as we start to approach it.
How the PPF is fundedThe compensation we pay to members, and our operating costs, are funded by levies on eligible pension schemes, our investment returns, assets from the schemes we take on and recoveries from insolvent employers.
62 schemes transferred over the course of the year, bringing new assets of £1.3 billion. Investment returns contributed a further £1 billion and we collected £585 million in levies.
In this respect we believe the Pension Protection Levy represents excellent value for money. We are continuously striving to ensure that the levy is as reflective of risk as possible and to strike the right balance between protecting future member benefits and keeping the levy at acceptable levels.
PERFORM
AN
CE REPO
RT
Schemes transferred
Retained earnings
Recoveries
Levy
7%
23%
37%
33%
Composition of assets by source since inception
£6.1bn
£295.4bn
PPF reserves v deficits of PPF-eligible schemes
Source: PPF 7800 index at 31 March 2017 - aggregate deficit, not to scale.

2 0 | P E N S I O N P R O T E C T I O N F U N D | ANNUAL REPORT AND ACCOUNTS 20 16 / 1 7
PERFORM
AN
CE REPO
RT
Performance analysisANDY MCKINNON | CHIEF FINANCIAL OFFICER
Probability of successOur funding ratio at the end of the year shows that we have sufficient assets to pay compensation to all members of the PPF to the end of their lives plus a reserve towards the cost of future claims. The stability of the funding ratio over time helps to demonstrate the PPF’s robust financial position and the strength of our approach to managing the risks we face.
To ensure we are on-track to achieve our long-term goal we also need to consider what will happen in the future. In our annual Funding Strategy Update, we assess our long-term risks and our progress towards our funding objective. We do this using our Long-Term Risk Model which calculates the impact of one million economic scenarios on our probability of success. At the end of the year, the probability of success remains at 93 per cent, confirming that we continue on the right path.
Developing a sustainable operating modelWe continue to focus on bringing parts of our investment capability in-house. Now that the PPF is equivalent to one of the largest pension funds in the UK, it is essential that we have greater flexibility
and control over our assets. Since fund management fees represent the largest proportion of our costs, insourcing brings significant cost-saving benefits.
Also, following the success of bringing PPF member services in-house, we announced in our 2017 Strategic Plan our intention to do the same with the Financial Assistance Scheme (FAS). We believe this will bring further efficiencies, as PPF member services insourcing has done, and will help us continue to provide excellent customer service to all those we protect.
The PPF is in a state of evolution, as we continually seek ways of doing things better as we grow. When we make changes to our business model, such as insourcing some of our services, we do so only when there are clear benefits to our members and levy payers and when we are satisfied that the additional risks and responsibilities are within our control.
Further developments to the way we operate have included progressing our digital workplace strategy to enable us to improve the efficiency and effectiveness of our day-to-day operations; investing in our compliance function and organisation-wide compliance activities; and focusing on attracting and retaining skilled people.
Year
Mar-08
Mar-09
Mar-10
Mar-11
Mar-12
Mar-13
Mar-14
Mar-15
Mar-16
Mar-17
Aggr
egate
Balan
ce
Fund
ing Ra
tio
0
-150
-300
-50
-200
-350
-100
-250
-400
-450
-500
140%
120%
100%
80%
60%
40%
20%
0%
PPF funding ratio vs aggregate deficit of PPF-eligible schemes
Aggregate balance (LHS) Funding ratio (RHS)

2 0 | P E N S I O N P R O T E C T I O N F U N D | ANNUAL REPORT AND ACCOUNTS 20 16 / 1 7
PERFORM
AN
CE REPO
RT
Performance analysisANDY MCKINNON | CHIEF FINANCIAL OFFICER
Fundamental to our success is our ability to keep the Fund sustainable in the long term, in order to meet our obligations to current and future members for as long as necessary. Sustainability for us means making the best use of available resources and considering the long term in everything we do – from controlling our costs, through investing in assets with a long time horizon to occupying a building that has a sustainability rating of ‘Excellent’ under the Building Research Establishment Environmental Assessment Method.
Long-term expenditure trendsOur costs are accounted for in three funds as explained on page 76 and further analysed on note 11 on pages 100-101. Total expenditure over the last five years, and planned over the next two, is shown in the table below.
The Protection Fund includes the costs of administering member payments and managing the Fund assets. External management fees grow with the size of the Fund and this drove a significant uplift in 2017, also reflecting a greater focus on longer-term alternative asset classes in line with our SIP and increased by payments to some fund managers which delivered significant excess value and are remunerated on a performance basis. Insourcing investment activity in 2017 has helped to contain the growth in fees and that effect will be greater as we start to scale the operation in 2018 and 2019.
Whilst the Fund continues to grow, Administration Fund costs have been contained and have fallen in 2017, benefiting from the insourced activity in the Fund which absorbs a greater share of fixed overhead. The increase next year reflects the planned development of the third levy triennium.
The costs of administering FAS continue to be well-controlled. The increase from 2017 is due to our investment to bring FAS member services in-house and will revert to a lower level from summer 2018.
Planned Planned
2013£m
2014£m
2015£m
2016£m
2017£m
2018£m
2019£m
PPF 103.7 108.2 128.8 144.9 191.0 186.3 180.0
PPF Administration Fund 18.9 18.3 20.8 17.6 14.2 16.5 16.2
FAS Administration Fund 8.5 8.4 8.2 6.4 7.9 9.3 10.6
Total 131.1 134.9 157.8 168.9 213.1 212.11 206.81
¹ excludes investment transaction fees (2017: £10.5m)
P E N S I O N P R O T E C T I O N F U N D | ANNUAL REPORT AND ACCOUNTS 20 16 / 1 7 | 2 1

2 2 | P E N S I O N P R O T E C T I O N F U N D | ANNUAL REPORT AND ACCOUNTS 20 16 / 1 7 P E N S I O N P R O T E C T I O N F U N D | ANNUAL REPORT AND ACCOUNTS 20 16 / 1 7 | 2 3
In meeting our long-term commitment to our members, to ensure we have sufficient funds to pay their compensation for as long as we are needed, our investment strategy incorporates a diversified portfolio of assets within a clearly defined liability-driven investment programme.
Our investment objective, directed by the Board’s strategy to ensure we are financially self-sufficient by 2030, requires our assets to outperform our liabilities by an annualised 1.8 per cent, on a three-year rolling basis. Over the last three years, we have done better than this, with an average return of 3.3 per cent each year, representing an annualised outperformance of 1.0 per cent over our investment target. This investment performance has seen our reserves rise year-on-year from £4.1bn to £6.1bn, continuing to support the likelihood (93 per cent at the end of March 2017) of achieving our aspiration to be fully-funded by 2030.
Our strategic asset allocation, which we believe to be the best strategy to meet our funding objectives, is unchanged from last year. However, we are considering what regulatory requirements for central clearing and bilateral margining of over-the-counter derivatives will mean for our investment operations. A larger cash reserve will be needed to account for potential rapid changes in associated margin payments and we may have to alter our asset allocation in light of this. Any changes we make will be published in an updated Statement of Investment Principles.
Managing our balance sheetBARRY KENNETH | CHIEF INVESTMENT OFFICER
Strategic Asset Allocation
12.5%
58%22.5%
7%
Cash and bonds Alternatives Equities Hybrid assets
PERFORM
AN
CE REPO
RT

2 2 | P E N S I O N P R O T E C T I O N F U N D | ANNUAL REPORT AND ACCOUNTS 20 16 / 1 7 P E N S I O N P R O T E C T I O N F U N D | ANNUAL REPORT AND ACCOUNTS 20 16 / 1 7 | 2 3
Return-seeking assetsWe regard our strong outperformance of target returns as a significant achievement given our conservative risk appetite and our focus on long-term investments. We were successful in adding positive returns to the Fund over and above our liabilities and have been able to build a reserve while other pension funds are reporting deficits.
The asset classes with the biggest contributions to the Fund in 2016/17 were Alternative Credit (11.75 per cent return) and Minimum Variance Equities (12.33 per cent return).
Alternatives and hybrid investments are a distinctive feature of our investment strategy. As well as providing diversification, illiquid assets bring an attractive risk-adjusted return and are well-suited to the long-term nature of our liabilities, enabling us to generate a higher return than we would through other types of asset.
Alternative investments are a key component of our return-seeking assets and this element has continued to evolve. In partnership with leading managers we have made a number of large direct investments this year across private companies, energy, farmland and real estate assets. The PPF has established itself as a credible partner that is able to execute these complex transactions and hence we are being presented with an increasing number of opportunities to review.
We continue to work with other pension providers and institutions where we see opportunities to collaborate, and will therefore be part of consortia seeking to buy assets or provide debt. During the year we were reported as being involved in the sale process for a number of major assets. We do not normally comment where unsuccessful or when the process has not concluded, given the commercial sensitivity.
Hedging programmeThe decline of gilt yields and long-term interest rates have led to a significant increase in the present value of our liabilities over the last few years. However, our liability-driven investment (LDI) programme largely protects us from these movements as it aims to match the interest rate and inflation sensitivity of our liabilities – effectively neutralising these fluctuations.
Investment insourcingDuring the course of the year we successfully completed the second phase of our investment insourcing project. Having laid the necessary groundwork for our investment operations, including bringing in BlackRock Aladdin, appointing a Head of LDI and ensuring we had the right compliance framework in place, we now operate the majority of our LDI trading in-house. This gives us added control, flexibility and efficiency, which has transformed the capability of our investment operation. Previously, there were situations where there was a significant time lag between trades being executed and being accurately reflected in our risk analysis. Now we can model and build ‘what if ’ trades in advance of transacting them directly in the market, and see the new position updated immediately. The time between originating a transaction to execution has been dramatically reduced, from hours to minutes, and we can fully control the pricing of each trade and our exposure to individual counterparties.
Over the next two years, we plan to insource a number of other investment activities that are currently being undertaken by external parties, including cash, foreign exchange and certain elements of our credit portfolio. We see insourcing as a way of increasing our ability to meet the specific nuances of the PPF portfolio, rather than solely a cost saving measure. As such, we will continue to look for opportunities but will only insource where we believe we can improve our performance compared to external fund managers.
Assets
Gilts/Synthetic Gilts
Schemes In Assessment/Annuities
Hybrid and Illiquid Assets (HAIL)
Interest Rate / Inflation Swaps
Fixed cash flows to current pensioners
Fixed cash flows to future pensioners
Inflation linked cash flows to future pensioners
Inflation linked cash flows to current
pensioners
Liabilities
PERFORM
AN
CE REPO
RT

24 | P E N S I O N P R O T E C T I O N F U N D | ANNUAL REPORT AND ACCOUNTS 20 16 / 1 7
RecoveriesOur Restructuring and Insolvency team has had a particularly active year, being involved in a number of high profile cases and instrumental in securing recoveries of £72 million from insolvent employers. This continues to be an important source of our income which reduces the call on our levy payers.
The media attention on the BHS pension schemes has led to heightened interest in employer governance in relation to their pension promises. Almost a year after BHS entered administration, a settlement was reached at the beginning of March 2017 in relation to regulatory action taken by the Pensions Regulator (TPR) which relieves the PPF’s levy payers of the burden of meeting the initially reported shortfall; consequently we do not expect any material claim on us from this scheme. Members will be given the choice of moving to a new scheme or staying in the existing scheme which is likely to transfer to the PPF. TPR will be monitoring the new scheme, which will provide members with the equivalent or better than PPF levels of compensation, and retain PPF protection. Throughout negotiations, in which the PPF played a significant part, we have worked in the best interests of our levy payers.
We instigated the appointment of an additional administrator and subsequent liquidator to work alongside the existing appointee to expedite the investigatory work in an attempt to maximise realisations for the scheme.
There were a number of other cases which attracted attention and represented significant achievements by our team. Subject to strict criteria being met, we may take part in the restructuring or rescue of an insolvent business, which can result in a compromise of the pension debt and its separation from its employer. For example, we worked with TPR and the trustees of the Halcrow Pension Scheme to implement a solution which best served the interests of scheme members and our levy payers.
After eight years in the assessment period, the Nortel Networks UK Pension Plan came closer to reaching a conclusion when a settlement was agreed with the parties to the global litigation. It is hoped that the settlement will assist the trustee in securing benefits for members in excess of PPF levels of compensation without a call on PPF levy payers.
Another high-profile success was achieved with the rescue of the Coventry Presswork Pension Scheme, which exited the PPF assessment period in February. The scheme rescue was made possible by the administrator of the employer company incorporating the pension obligation as part of the business sale transaction. This unusual solution benefits over 330 scheme members and avoids a £5.4 million scheme deficit from entering the PPF. It is indicative of the strong lines of communication we have developed with the insolvency industry over the past few years and our attempts to educate insolvency practitioners to consider our interests where defined benefit (DB) schemes are involved.
Managing our balance sheetBARRY KENNETH | CHIEF INVESTMENT OFFICER
PERFORM
AN
CE REPO
RT
P E N S I O N P R O T E C T I O N F U N D | ANNUAL REPORT AND ACCOUNTS 20 16 / 1 7 | 2 5

24 | P E N S I O N P R O T E C T I O N F U N D | ANNUAL REPORT AND ACCOUNTS 20 16 / 1 7
PERFORM
AN
CE REPO
RT
P E N S I O N P R O T E C T I O N F U N D | ANNUAL REPORT AND ACCOUNTS 20 16 / 1 7 | 2 5

2 6 | P E N S I O N P R O T E C T I O N F U N D | ANNUAL REPORT AND ACCOUNTS 20 16 / 1 7 P E N S I O N P R O T E C T I O N F U N D | ANNUAL REPORT AND ACCOUNTS 20 16 / 1 7 | 2 7
As an organisation with obligations to its members potentially stretching into the next century, which operates in an environment of significant uncertainty, assessing and managing our risks is crucial. One of our three strategic objectives is to pursue our mission within a high calibre framework of risk management. Our risks include financial, operational, funding and strategic risks and we monitor them closely. The Board of the PPF has a set level of risk appetite, which allows us to manage our risk-taking to an acceptable level while maintaining sufficient agility to operate and innovate.
The risk universeWe monitor external risks, such as funding levels in the universe of schemes we protect, and economic factors, through our PPF 7800 Index and Long-Term Risk Model. The PPF 7800 Index, which we publish monthly using data which schemes provide to TPR, has been particularly volatile over the last year and has attracted a great deal of attention in the media, amid renewed public interest in the sustainability of the DB pensions system. The aggregate deficit of DB schemes reached an all-time high of £413 billion at the end of August 2016. While this figure has reduced significantly since then, low gilt yields and interest rates continue to impact scheme funding levels.
Although our funding position remains strong in relation to our compensation liabilities, the risks to the PPF are real. The average recovery plan length has not reduced in the last decade, and the fact that deficits are not being closed presents a significant risk to the PPF by increasing the potential for future claims. We work closely with TPR and others to reduce their impact but we believe some targeted improvements to TPR’s powers are appropriate, as we set out in our response to the Government’s Green Paper on the DB pension system.
Risk managementHANS DEN BOER | CHIEF RISK OFFICER
PERFORM
AN
CE REPO
RT

2 6 | P E N S I O N P R O T E C T I O N F U N D | ANNUAL REPORT AND ACCOUNTS 20 16 / 1 7 P E N S I O N P R O T E C T I O N F U N D | ANNUAL REPORT AND ACCOUNTS 20 16 / 1 7 | 2 7
The Purple Book, which we publish annually towards the end of the year, gives a longer-term picture of the DB universe. The 11th edition, published on 8 December 2016, showed that trends have stabilised after a decade of major changes in the DB landscape. Scheme funding ended the year in a similar position to where it began, despite the volatility during the year.
Asset allocation showed a more marked change, with the average allocation invested in bonds rising to over 50 per cent for the first time, reflective of schemes’ desire to diversify and de-risk. In summary, the Purple Book highlights the necessity of schemes undertaking effective risk management, and reaffirms the importance of the PPF safety net for members of schemes that fail to pay what they promised.
Risk management frameworkOur risk framework provides the structure for all our work into assessing and managing our risks. We continued to develop this over the year, with a key part being the Risk and Control Self Assessments (RCSAs). Every team at the PPF owns their own RCSA, which strengthens our bottom-up view of risks and allows us to improve the way in which we manage risk. RCSAs are now well embedded into the organisation and all teams use them to conduct quarterly reviews of their risks, alongside more regular reporting.
We completed our Own Risk and Solvency Assessment (ORSA) and started on our action plan to address the issues it highlighted. The ORSA process is a tool which we are developing to analyse our risks collectively and provide the Board with a strategic overview of risk exposure. Risks are analysed in relation to their short and long-term impact across a range of scenarios.
The outcome of this exercise has given us assurance that material risks across our business are identified and managed within our risk appetite. The ORSA is a requirement for organisations subject to Solvency II so the PPF is not obliged to do this but we choose to do so as we seek to emulate regulatory good practice.
Related to this, we have this year introduced a new stress testing framework. This includes sensitivity and instantaneous shock testing, which allows us to overlay single variables to our portfolio; scenario testing and analysis, which examines the possible outcomes of events such as Brexit or a cyber attack; and reverse stress testing, which seeks to identify circumstances which could cause the PPF to fail in its mission.
Risk Strategy
Financial Position
Risk Governance
Risk Framework
Risk Training and Comms
Risk Operating
Model
Risk Appetite
Risk MI and Reporting
PERFORM
AN
CE REPO
RT

2 8 | P E N S I O N P R O T E C T I O N F U N D | ANNUAL REPORT AND ACCOUNTS 20 16 / 1 7 P E N S I O N P R O T E C T I O N F U N D | ANNUAL REPORT AND ACCOUNTS 20 16 / 1 7 | 2 9
Strategy and policy
High profile cases such as BHS and British Steel have contributed to a developing debate on DB scheme funding, regulation and protection over the last year. Heightened public concern about employers seeking to sidestep their pension promises led to two inquiries by the Work and Pensions Select Committee and a Government Green Paper on the future of the DB pension system.
We welcomed this timely spotlight being thrown on the DB universe, as there are indeed risks which pose a threat to the PPF achieving its strategic objectives. Funding in the universe of schemes we protect remains low, owing to record low gilt yields and interest rates: the PPF 7800 Index remains volatile and the aggregate deficit of schemes reached a record high in 2016. As seen in The Purple Book 2016, the average length of recovery plans is the same as it was a decade ago. We have also seen new challenges arising from particular schemes in the last year, and from new business models being presented which could undermine the current system.
Most schemes will succeed in fulfilling their pension promises. However, there is a small segment of stressed schemes which will not make it. As we said in our written evidence to the Select Committee in September 2016, we believe the system remains broadly appropriate, and the pre-2005 position where scheme members could be left with nothing if their employer went bust is now unimaginable.
However, there are certain improvements we would like to see made to the current DB system and we continue to engage with the Government, the Select Committee and the Pensions and Lifetime Savings Association in their respective work on this.
Strategy, levy and legalDAVID TAYLOR | GENERAL COUNSEL
PERFORM
AN
CE REPO
RT

2 8 | P E N S I O N P R O T E C T I O N F U N D | ANNUAL REPORT AND ACCOUNTS 20 16 / 1 7 P E N S I O N P R O T E C T I O N F U N D | ANNUAL REPORT AND ACCOUNTS 20 16 / 1 7 | 2 9
The Pension Protection LevyThe tool we have at our disposal for reflecting the risks we face is the Pension Protection Levy. It remains a key element of our funding, allowing us to pay compensation to members. Usually, the amount of levy a scheme has to pay is based on its funding level and its risk of the employer becoming insolvent, and therefore making a claim on the PPF. This is calculated using our insolvency risk model, which we introduced in 2015. The only exceptions are schemes with no substantive sponsoring employer.
Feedback for the model remains broadly positive. Where appropriate, we continue to make small changes to the levy rules each year, and more significant changes with each three year period, or triennium.
2017/18 Levy rulesIn September we launched a consultation on the proposed rules, and communicated our intent to develop for 2017/18 a new rule for schemes which cease to have a substantive sponsor after a restructuring.
In December we confirmed that the final rules were largely unchanged, pending this further new rule. The total amount we intend to collect is £615 million, which is the same target as for 2016/17. The changes for 2017/18 include a mechanism for stakeholders to notify Experian, the PPF’s insolvency risk services partner, where the move to new UK accounting
standard FRS102 would otherwise cause an artificial movement in their rating. The rules extend the opportunity to certify impacts from FRS102 where accounts from different years are compared but have been calculated on different bases.
In February we launched a consultation for schemes with no substantive employer. This was the crystallisation of the approach we had developed over the year. As we said in our response to the Government’s consultation on the future of the British Steel Pension Scheme in June 2016, such schemes pose a unique risk to the PPF as they put us in the position of being the first line of defence if their investment strategy fails, when normally there would be an employer backstop. Given this emerging risk, it was necessary for us to get ahead of developments by ensuring we could price this risk.
Our standard methodology for calculating levies, a key element of which is the insolvency risk posed by the sponsor, would not be appropriate for such a scheme. Therefore we proposed a charging methodology based on a commonly used pricing model for valuing put options. This ensures that such a scheme will be charged an appropriate levy, reflecting the true risk it poses, and removing any in-built cross-subsidy from other schemes. The methodology also recognises that a scheme with no sponsor will always pose a bigger risk than an identical scheme which has a sponsor, however weak and should, therefore, always pay at least the same levy.
PERFORM
AN
CE REPO
RT

3 0 | P E N S I O N P R O T E C T I O N F U N D | ANNUAL REPORT AND ACCOUNTS 20 16 / 1 7 P E N S I O N P R O T E C T I O N F U N D | ANNUAL REPORT AND ACCOUNTS 20 16 / 1 7 | 3 1
Third levy triennium2018/19 will be the first year of the third levy triennium. In July 2016 we published an update on our thinking, developed over three years with ongoing help from our Industry Steering Group. This update communicated that we were looking into the use of credit ratings where applicable, making some changes to scorecards and measuring the impact of accounting standard changes. Three years of work culminated in a consultation, launched in March, proposing to introduce some changes to our insolvency risk model and other aspects of the levy.
One of the more significant proposals was to adopt the use of credit ratings for some of the largest employers and a specific methodology for regulated financial services entities. We believe this will ensure the best possible assessment of insolvency risk for some of the largest levy payers.
Secondly, the consultation outlined proposals to revise how employers are allocated to scorecards, to introduce two new scorecards and to rebuild existing scorecards where the predictive power has been less strong. These changes aim to improve the predictive power and ensure scorecards are better tailored to company size resulting in SMEs and ‘not-for-profits’ paying levies that better reflect their risks.
The consultation also invited responses on two areas which the Work and Pensions Select Committee asked us to look at, which were a levy discount for good governance, and easing the administrative burden for SMEs. A second consultation on the triennium will open in the autumn, and will include the total amount we propose to collect in 2018/19.
Evolution of the PPF Levy
Strategy, levy and legalDAVID TAYLOR | GENERAL COUNSEL
Initial Levy
2005 2006 2012
Parameters: floating Fixed Fixed Fixed
T1 T2 T3
2015 2018 2021
Off-the-shelf insolvency model
+ Investment risk+ Smoothing
+ Credit ratings?+ Other improvements?
PPF-specific model (Experian)
PERFORM
AN
CE REPO
RT

3 0 | P E N S I O N P R O T E C T I O N F U N D | ANNUAL REPORT AND ACCOUNTS 20 16 / 1 7 P E N S I O N P R O T E C T I O N F U N D | ANNUAL REPORT AND ACCOUNTS 20 16 / 1 7 | 3 1
Fraud Compensation FundAs well as the Pension Protection Levy, we also have responsibility for the Fraud Compensation Fund (FCF) and its associated levy. The FCF protects members of schemes – both defined benefit and defined contribution – who have suffered loss to their pensions as a result of dishonesty. Throughout the year we have been in regular discussions with TPR, the Financial Services Compensation Scheme and a number of trustees to gather intelligence on the level and timings of future claims on the FCF. We have identified a number of potential claims, and have therefore taken the decision to raise a levy in 2017/18, for the first time in five years. While it is not yet clear whether and to what extent claims would be eligible for FCF compensation, with prudent forward planning in mind, the levy will be set at 25p per member. It is expected that this will raise £5 million, to ensure we are prepared for these potential claims while smoothing the costs over time. We are considering what these potential claims could mean for the long-term future of the FCF.
Compliance and ethicsIn the past year we have made significant progress in embedding our new Compliance and Ethics function. While we have always ensured we are compliant with our obligations, the insourcing of part of our investment management gave us an opportunity to formalise all of our compliance activities within one dedicated team. This team brings a consistent, best practice approach to compliance through embedding policies, procedures and practices. Its first priorities included laying the groundwork for our in-house trading, and introducing a set of new policies that affect all teams throughout the organisation.
Promoting a culture of ethics is also critical to this endeavour. True compliance can only exist if there is a strong ethical culture where people want to do the right thing. This chimes with one of the PPF’s ‘ICARE values’ – Integrity. By supporting this ethos we try to ensure that compliance becomes more than just a box-ticking exercise.
PERFORM
AN
CE REPO
RT

3 2 | P E N S I O N P R O T E C T I O N F U N D | ANNUAL REPORT AND ACCOUNTS 20 16 / 1 7 P E N S I O N P R O T E C T I O N F U N D | ANNUAL REPORT AND ACCOUNTS 20 16 / 1 7 | 3 3
Providing excellent serviceIt’s been a year and a half since we completed the project to bring our member services in-house. We’ve continued to put our 235,000 members at the heart of everything we do and I am pleased to say that our insourced function has been a success. In fact, we were delighted to have our member services recognised by the Institute of Customer Service at the UK Customer Satisfaction Awards in March this year, where we won the trophy for Best Customer Experience.
Our reasons for insourcing were simple: we wanted to give our members the best possible experience, and providing the service directly would give us the flexibility to do this. The direct control of this function would also lead to efficiencies.
Feedback from our members tells us that we are achieving our objectives. In addition to some wonderful comments that we’ve received from individual members, which you can see on this page, our customer satisfaction levels have averaged in excess of 95 per cent each month since the in-house service went live in August 2015. In our 2016 stakeholder perception survey, 86 per cent of the PPF members surveyed described the PPF’s performance as good – up from 76 per cent the previous two years running.
Scheme and member servicesSARA PROTHEROE | CHIEF CUST OMER OFFICER
“ I am so impressed by this organisation, I can’t tell you. Your advisor answered the telephone on the first ring. He was able to identify me and everything, almost immediately. I was so impressed and the system, it worked brilliantly. I am absolutely super impressed by the whole thing. I cannot tell you how delighted I am I made this phone call this morning. It’s absolutely impressive beyond belief. I am full of superlatives.” Adrian, Cheshire.
“Anytime that I’ve phoned the PPF it has been really, really helpful. Actually 200 per cent. It has been a great service and I hope it continues like that. So thank you very much for everything.” John, Glasgow.
“I thought your service was one of the best I’ve used on the telephone for such a long time.” Crea, Northamptonshire.
“The entire service from the PPF has been absolutely magnificent and the people I have dealt with have been absolutely top rate. I couldn’t have asked for more. So thank you very much for all that you have done for me.” Gregory, Lincolnshire.
PERFORM
AN
CE REPO
RT

3 2 | P E N S I O N P R O T E C T I O N F U N D | ANNUAL REPORT AND ACCOUNTS 20 16 / 1 7 P E N S I O N P R O T E C T I O N F U N D | ANNUAL REPORT AND ACCOUNTS 20 16 / 1 7 | 3 3
The service we are providing is a clear improvement on where we were a few years ago. Members’ queries are dealt with more quickly and effectively, and we track their correspondence more easily and accurately through the use of barcodes. When we write to our members we aim to send them clear, jargon-free letters. When people call us they don’t have to listen to a long phone message; they speak to someone right here in the PPF office and they receive the same high level of service regardless of who they talk to. We pay members directly – paying over £55 million per month to around 128,000 members – and we administer their benefits directly, clearing an average of 400 member cases every day.
But we are not complacent; we are constantly looking for ways to make our service even better and we have a dedicated Performance Improvement function to enable us to make this happen. One of the ways we are looking to enhance our members’ experience is through our member website, which now has more than 22,500 registered members. Members can ‘self-serve’ online and see their changes in real time. In 2016 we launched our benefit modeller, which allows users to plan their retirement by seeing what their compensation would be at different retirement ages and with different lump sums. We are currently working on functionality which will allow people to ‘retire online’ at the click of a button – significantly reducing the time and paperwork involved in this process.
Ensuring accurate dataWe’ve also been doing more work than ever in ensuring our member data is of the highest quality. We aim to exceed the requirements of TPR, the data protection legislation and the National Fraud Initiative by ensuring that we know people are living at the address we hold for them.
Maintaining accurate data about our members, particularly when some of them do not need to contact us for long periods, is one of the biggest challenges we face in relation to our member services. Accurate data enables us to pay the right people the right amount at the right time, and to have a clear view of our future liabilities – so that we can invest to match these.
Over the last 12 months we have been working with our data specialist partners, Target, on an extensive piece of work to trace members with whom we’d lost contact. After taking significant steps to try to locate people, we had to resort to suspending payments to 238 UK members. We have a responsibility to use our funds efficiently, to comply with the Data Protection Act and to prevent fraud. For example, we need to make sure that we are not making payments to deceased members’ bank accounts. After these suspensions, 17 members then got in touch with us to verify their contact details and we got them back into payment within a few days, if not the same day.
PERFORM
AN
CE REPO
RT

3 4 | P E N S I O N P R O T E C T I O N F U N D | ANNUAL REPORT AND ACCOUNTS 20 16 / 1 7 P E N S I O N P R O T E C T I O N F U N D | ANNUAL REPORT AND ACCOUNTS 20 16 / 1 7 | 3 5
Scheme DeliveryOur Scheme Delivery team have also been doing a lot of great work this year. This team runs the assessment period, the process of validating schemes following employer insolvency, assessing their eligibility for PPF compensation and ensuring a smooth transition.
During this time, the trustees continue to administer the scheme and pay members using assets from the scheme. We aim to get schemes through assessment within two years – on average it takes 18 months. 62 schemes transferred to the PPF last year, bringing 12,229 members, and there are currently 98 schemes in assessment which we expect to transfer.
This year we have continued to use our panels – small groups of firms that have expertise in the PPF processes needed to move schemes through assessment quickly and efficiently. The panels are:
• Trustee Advisory Panel• Specialist Administration and Actuarial Services Panel• Assessment Period Legal Panel• Audit Panel• PPF Data Specialist (Target)
The previous administration and actuarial panels were combined into one through a successful procurement process in August 2016 as a means to manage costs and increase transparency.
As these firms are PPF specialists we continue to see some real successes, such as collaboration between panel firms, the controlling of costs, systems improvements and process efficiencies. Perhaps more importantly, when working with our panel firms we can quickly identify real problems which may affect members of schemes in assessment and resolve them promptly. An example of this is where there are potential risks to members not being paid their pension as usual, as a result of the sponsoring employer’s insolvency. Fast action from our team has enabled us to identify these issues and find ways to resolve them before they occur.
Scheme and member servicesSARA PROTHEROE | CHIEF CUSTOMER OFFICER
Overview of the PPF Assessment Process
Validation
Exit (e.g. over funded)
Transfer
Rescue
Rejection
AssessmentInsolvency
PERFORM
AN
CE REPO
RT

3 4 | P E N S I O N P R O T E C T I O N F U N D | ANNUAL REPORT AND ACCOUNTS 20 16 / 1 7 P E N S I O N P R O T E C T I O N F U N D | ANNUAL REPORT AND ACCOUNTS 20 16 / 1 7 | 3 5
Scheme and member servicesSARA PROTHEROE | CHIEF CUSTOMER OFFICER
Financial Assistance Scheme Last September we closed FAS to new applications, after having kept it open for 10 years longer than the original deadline set. 1,078 schemes have qualified for FAS assistance, including 9 of the 18 applications received after we began to communicate the closing date. The deadline was extensively communicated and no further potentially FAS-eligible schemes have contacted us since.
One of the key challenges we face with regard to FAS is the provision and quality of member data. Often the data is incomplete, very out-of-date or in hard copy format. We aim to overcome this challenge as far as possible by working with incumbent administrators, our panel firms and our data partner, Target.
Now that we have succeeded in bringing PPF member services in-house, we want to offer the same great service to FAS members. Together with the Department for Work and Pensions (DWP), we have made the decision to bring FAS member services in-house over the next three years.
In doing so we can make the FAS member experience consistent with that of PPF members, and ensure that FAS is operated as efficiently as possible. As for PPF, we want FAS members to feel that they would choose us if they could. We will administer FAS members’ assistance and pay them directly, and they will be able to speak to our in-house contact centre team. We also plan to improve the FAS member website to provide members with the same self-service opportunities that PPF members have. We have a lot of work to do but the preparatory stage is well underway and I know our fantastic team is up to the challenge.
PERFORM
AN
CE REPO
RT

3 6 | P E N S I O N P R O T E C T I O N F U N D | ANNUAL REPORT AND ACCOUNTS 20 16 / 1 7 P E N S I O N P R O T E C T I O N F U N D | ANNUAL REPORT AND ACCOUNTS 20 16 / 1 7 | 3 7
The organisation continues to mature and grow, with respect to numbers of members receiving compensation, assets under management and in turn employee numbers and the level of interest in the work the organisation does.Our people are proud of the work we do. Not just because of the safety net we provide for those members who may have been left with nothing, but also the way we do that work.
The ICARE values have provided a constant as we have evolved as an organisation. We recruit people not just for their technical skills but also their ability to behave in a way that is consistent with the PPF culture.
HR, organisational development and communications
KATHERINE EASTER | CHIEF PEOPLE OFFICER
THE ICARE VALUES
INTEGRITY DOING THE RIGHT THING
COLLABORATION WORKING AS ONE
ACCOUNTABILITY OWNING OUR ACTIONS
RESPECT VALUING EVERY VOICE
EXCELLENCE BEING OUR BEST
PERFORM
AN
CE REPO
RT

3 6 | P E N S I O N P R O T E C T I O N F U N D | ANNUAL REPORT AND ACCOUNTS 20 16 / 1 7 P E N S I O N P R O T E C T I O N F U N D | ANNUAL REPORT AND ACCOUNTS 20 16 / 1 7 | 3 7
We have a range of stakeholders but we are particularly keen to ensure our members and levy payers are confident we are making the best use of all of our resources. As we have insourced more activity we have brought different skills and expertise to the organisation. We offer a challenging and stimulating environment that attracts experienced professionals and those at the start of their careers. We are proud of the development opportunities we provide and this is evidenced by seeing people progress their careers, be that the contact centre team members who have become pension administrators or the interns who have returned to become investment analysts.
There is much evidence to support our view that the PPF is a great place to work and the impact that our high levels of employee engagement have on organisational performance. Our employee engagement survey returned strong results, such as 81 per cent agreeing they would recommend the PPF as a place to work. We also continue to receive positive feedback about the service we provide to our members, attested by our recent Best Customer Experience award from the Institute of Customer Service, alongside achieving excellent investment performance against a difficult backdrop.
CommunicationsOur Communications objective continues to be “To promote and protect the reputation of the PPF through active engagement and building understanding”.
The PPF has been in the public eye more than ever in the last year, and our communications strategy has been of the utmost importance. Certain high-profile schemes have brought debates on the future of the DB system to the fore. The PPF has played a part in this, ensuring that its role is portrayed as accurately as possible and contributing to the debate in the long-term interests of our members and levy payers. This can be resource-intensive but we believe our communications agency provides good value for money when measured against the public interest in the work we do and the importance of maintaining the confidence of our members and levy payers, and our wider stakeholders, in the protection we provide.
Managing our reputation and our relationships with our stakeholders is a key element of our risk management. Through our reverse stress testing we see that in the majority of the extreme scenarios which would see the PPF fail, the loss of our good reputation is a critical factor. From our perception audit, media coverage and interactions with stakeholders we know that the PPF is held in high regard and seen as a key part of the DB system. We are succeeding in maintaining our good reputation, but we are always conscious that we can never take this for granted.
Communicating effectively is essential to giving our stakeholders confidence in us, and providing assurance to members that their financial futures are safe. Our evaluation measures help us to ensure that we are delivering the right messages to the right people at the right time.
PERFORM
AN
CE REPO
RT

3 8 | P E N S I O N P R O T E C T I O N F U N D | ANNUAL REPORT AND ACCOUNTS 20 16 / 1 7 P E N S I O N P R O T E C T I O N F U N D | ANNUAL REPORT AND ACCOUNTS 20 16 / 1 7 | 3 9
HR, organisational development and communications
KATHERINE EASTER | CHIEF PEOPLE OFFICER
Employee Liaison CommitteeAs we progress on our journey to being a high-performing customer-focused financial institution, it is of critical importance that we bring our employees along with us. Our internal communications are a fundamental way of doing this. In addition, in 2016 we decided to create a new Employee Liaison Committee to ensure our people are consulted on major changes effecting them, and to make sure we are listening to them at every level. A group of elected representatives from every directorate meets quarterly to discuss topical issues, seeking feedback from their constituents and cascading information back to them.
Charity CommitteeOur Charity Committee leads on our volunteering and fundraising activity, which allows us to play both an active part in our local community and, at the same time, raise funds for a national charity which is chosen by our people.
For local community activity in 2016/17 we retained our partnership with Croydon Commitment and offered a programme of volunteering opportunities including conservation in local woodland and preparing and serving Christmas dinner at a community centre. Together our people contributed 346 volunteering hours in 2016/17 – well above our target of 100 hours.
All of our people can take up to five days’ pro rata volunteering leave, either to take part in these events or to pursue their own volunteering interests.
For our 2016/17 our employee-chosen national charity, Dementia UK, we raised more than £2,000 through events such as bake sales and quizzes – double our target.
Our new charity partner for 2017/18 is Mind and we hope to achieve our funding target for them through a series of events over the year ahead.
Sheila Devaney, Katrina Carney and Janet Vandrine from the Charity Committee present a cheque to Helen Collins from Dementia UK.
PERFORM
AN
CE REPO
RT

3 8 | P E N S I O N P R O T E C T I O N F U N D | ANNUAL REPORT AND ACCOUNTS 20 16 / 1 7 P E N S I O N P R O T E C T I O N F U N D | ANNUAL REPORT AND ACCOUNTS 20 16 / 1 7 | 3 9
PERFORM
AN
CE REPO
RT
During the year, we handled a number of appeals, complaints and requests for information.
Reviewable mattersWe run a statutory appeals process in respect of ‘reviewable matters’ listed in the Pensions Act 2004. The majority of appeals under this process relate to the Pension Protection Levy.
Levy appeals2016/17 2015/16
Review decisions issued 60 98of which the scheme was found to be levied correctly 39 67 we agreed with some or all of the scheme’s appeal 21 31
Review decisions appealed to the Reconsideration Committee by applicants 13 16
During 2016/17 we also reviewed 1,612 invoices (relating to 361 schemes) from previous years, following an analysis of those schemes’ rules. 18 decisions (relating to 4 schemes) were appealed to the Reconsideration Committee.
General information
Maladministration complaints2016/17 2015/16
Formal complaints of maladministration considered 3 7of which maladministration was found to have occurred 2 0
Maladministration decisions appealed to the Reconsideration Committee by applicants 2 3
of which
maladministration was found to have occurred 0 0
Other levy reviewable matters2016/17 2015/16
Review decisions issued 4 6Review decisions appealed to the Reconsideration Committee by applicants 1 0
Non-levy related reviewable matters 2016/17 2015/16
Review decisions issued 10 35Review decisions appealed to the Reconsideration Committee by applicants 6 13

4 0 | P E N S I O N P R O T E C T I O N F U N D | ANNUAL REPORT AND ACCOUNTS 20 16 / 1 7
We declined to disclose information in ten instances by applying statutory exemptions because the information was either restricted information, personal data, commercially sensitive, already published, provided to the PPF in confidence, too costly to disclose or its release would prejudice the effective conduct of PPF business.
In line with the cost allocation and charging requirements set out in the relevant HM Treasury and Office of Public Sector Information Guidance, we do not charge for disclosing information.
General complaints
Guidance on how we handle complaints and appeals can be found on our website www.pensionprotectionfund.org.uk/About-Us/complaintsandconcerns
PPF complaints FAS complaints
PPF complaint categories FAS complaint categories
2016/17
Complaints brought forward from previous year 44
Complaints received 469
of which
resolved at stage one 489 resolved at stage two 14 resolved at stage three 1 Carried forward 9
2016/17
Complaints brought forward from previous year 19
Complaints received 218
of which
resolved at stage one 216 resolved at stage two 11 resolved at stage three 1 Carried forward 9
2016/17Process/regulation 84Delay 74Communication 68Entitlement 67Overpayment 58Tracing 36Website 33Tax 27Other 21New complaint/possible review 1
2016/17Overpayment 64Entitlement 52Delay 27Process/ regulations 23Tracing 21Communication 15Other 10Tax 4Website 2
General information
Freedom of Information requests2016/17 2015/16
FoI requests received 35 54of which we fully disclosed the information 14 37 we partially disclosed the information 6 5
we did not hold the information 3 4
the request was withdrawn 2 2 we declined to disclose the information 10 6
PERFORM
AN
CE REPO
RT
P E N S I O N P R O T E C T I O N F U N D | ANNUAL REPORT AND ACCOUNTS 20 16 / 1 7 | 4 1

4 0 | P E N S I O N P R O T E C T I O N F U N D | ANNUAL REPORT AND ACCOUNTS 20 16 / 1 7 P E N S I O N P R O T E C T I O N F U N D | ANNUAL REPORT AND ACCOUNTS 20 16 / 1 7 | 4 1
In order to comply with the Government Financial Reporting Manual when preparing this annual report and accounts, we have to explain why we have adopted a ‘going concern’ basis for the organisation. An organisation deems itself a going concern if its management believe that the organisation will continue to operate and there is no intention, nor need, to close down its functions. After reviewing the three funds which we operate, cash flow forecasts and our powers to raise levies and control outgoings, we believe it appropriate to adopt a going concern basis for the PPF as a whole because we believe we have enough resources to continue operating for the foreseeable future.
Pension Protection FundFor the PPF, we considered the following factors when forming this view:• our cash flow forecasts, which indicate that cash
and other asset inflows will significantly exceed outflows for the foreseeable future, supported by:
- our levy raising powers – see (www. pensionprotectionfund.org.uk/levy/ aboutlevy/Pages/AbouttheLevy. aspx) and
- our reserve powers on compensation levels – see (www. pensionprotectionfund.org.uk/ Pages/Compensation.aspx).
Fraud Compensation FundThe volume of claims on the FCF remains at relatively low levels so we do not have enough statistics to forecast the level of future claims accurately. We therefore remain vulnerable to an unexpected rise in the volume of claims or unusually large or urgent claims.
However we have reviewed our powers and obligations and decided that the going concern basis remains appropriate for the FCF for the following reasons:• none of the claims which the FCF has received
and which it will probably have to pay out on are from schemes that have immediate cash flow requirements
• claims take some time to investigate and validate, which gives us time to plan how we will settle them
• we have powers to settle claims in instalments in order to ease any strain on the Fund’s cash flow, and
• during the year, the Board maintained its funding strategy for the FCF which is to build up a small reserve in the Fund by raising a levy where necessary.
Administration FundIn considering the going concern status of the Administration Fund, we took into account the status of the Board as an independent statutory corporation, while also recognising that the Board receives funding from its sponsor department, the DWP, in the form of grant-in-aid, to cover all of its expenditure on its functions as FAS scheme manager, and its expenditure on certain PPF administration functions. We also considered the regulations under which DWP finances its payments to the Board on grant-in-aid for PPF administration functions by raising a PPF Administration Levy from eligible pension schemes. We decided that the going concern basis for the Administration Fund remains appropriate because of the robust financial procedures governing:
• the setting of operating budgets, including administration budgets which inform the setting by DWP of the rates of the PPF Administration Levy
• in-year reviews and forecasts of administration expenditure
• controls over applying for grant-in-aid from DWP, and
• the segregation of levy payer-funded PPF activities and Government-funded FAS-related activities.
Statement on going concern
PERFORM
AN
CE REPO
RT
Alan Rubenstein Accounting Officer
22 June 2017

4 2 | P E N S I O N P R O T E C T I O N F U N D | ANNUAL REPORT AND ACCOUNTS 20 16 / 1 7 P E N S I O N P R O T E C T I O N F U N D | ANNUAL REPORT AND ACCOUNTS 20 16 / 1 7 | 4 3
AC
CO
UN
TAB
ILITY REPOR
T

4 2 | P E N S I O N P R O T E C T I O N F U N D | ANNUAL REPORT AND ACCOUNTS 20 16 / 1 7
Page
The Board of the Pension Protection Fund 44
Governance statement 48
Remuneration and staff report 59
Parliamentary accountability 65
Statement of Accounting Officer’s responsibilities 66
The certificate and report of the Comptroller and Auditor General 67
AC
CO
UN
TAB
ILITY REPOR
T
The Accountability Report
P E N S I O N P R O T E C T I O N F U N D | ANNUAL REPORT AND ACCOUNTS 20 16 / 1 7 | 4 3

4 4 | P E N S I O N P R O T E C T I O N F U N D | ANNUAL REPORT AND ACCOUNTS 20 16 / 1 7 P E N S I O N P R O T E C T I O N F U N D | ANNUAL REPORT AND ACCOUNTS 20 16 / 1 7 | 4 5
AC
CO
UN
TAB
ILITY REPOR
T
The Board of the Pension Protection Fund
ARNOLD WAGNER OBE
Chairman of the BoardChair of the Nomination Committee
Member of the Remuneration Committee
Arnold was appointed Chairman of the PPF in July 2016 having been on the Board since
2011. After an initial background in academia, Arnold’s career has been in human resources. He is a former Director of Human Resources at Smiths Group PLC. He has also served as a non-executive director at the UK Atomic
Energy Authority, where he chaired the Remuneration Committee; and is a member
of the Board of the Institute of Directors and is a senior independent director at Cifas.
Arnold has had extensive involvement in pensions throughout his career. He has
also been active in voluntary and charitable work in the social care and education sectors,
and was awarded an OBE in 2002 for his services to education.
ALAN RUBENSTEIN
Chief ExecutiveMember of the Decision Committee and of the Investment Committee
Alan joined the PPF as Chief Executive in April 2009.
Alan qualified as an actuary with Scottish Widows before moving into senior positions
with BZW Asset Management, Morgan Stanley and Lehman Brothers.
Alan is a non-executive member of the Board of esure Group plc and is an
investment adviser to the Trustees of the British Coal Staff Superannuation Scheme.
He is a former Vice-Chairman of the National Association of Pension Funds; and a former member of the Council of
the Institute & Faculty of Actuaries and the Takeover Panel.
ROSEMARY HILARY
Non-executive Board memberChair of the Risk and Audit CommitteeMember of the Decision Committeeand of the Investment Committee
Rosemary has held a number of senior financial services regulatory roles, at the Bank of England, FSA and then the FCA.
Most recently she was Chief Audit Officer at TSB Bank.
Rosemary’s early career was in insurance at Sun Alliance and in banking at Girobank.
She is a qualified accountant.
Rosemary is also a non-executive director of Willis; of Vitality Life and Vitality Health;
and of Record plc. She is a member of the MBA Advisory Board at Cass Business
School. She was also on the Board of Shelter, the national homelessness charity, from
2010 to 2016.

4 4 | P E N S I O N P R O T E C T I O N F U N D | ANNUAL REPORT AND ACCOUNTS 20 16 / 1 7 P E N S I O N P R O T E C T I O N F U N D | ANNUAL REPORT AND ACCOUNTS 20 16 / 1 7 | 4 5
AC
CO
UN
TAB
ILITY REPOR
T
The Board of the Pension Protection Fund
ALAN JENKINS
Senior Independent DirectorChair of the Decision Committee
Member of the Reconsideration Committee and of the Remuneration Committee
Alan started his career as a solicitor with Frere Cholmeley Bischoff, rising to Managing
Partner in 1996. In 1998 the firm merged with Eversheds where Alan spent two terms
as Global Chairman.
Alan was formerly a non-executive director at UKTI and a member of the Council of the Institute of Directors.
He currently holds non-executive appointments at the Financial Ombudsmen
Service, the Crown Prosecution Service, a number of private companies and
charities. He is also Chairman of the Board of Directors at Mencap Trust Company Ltd.
TOM JOY
Non-executive Board memberChair of the Investment Committee
Member of the Remuneration Committee and of the Risk and Audit Committee
Tom has been Director of Investments at the Church Commissioners
for England since 2009.
Prior to this, Tom worked at Royal Sun Alliance Investment Management,
Schroders and as Chief Investment Officer at RMB Asset Management. He is an
associate member of the CFA Society of the UK.
Tom is also a member of the Board of Trustees and the Chair of
the Investment Committee for Guy’s and St Thomas’ Charity.
KATE JONES
Non-executive Board memberMember of the Investment Committee and
of the Reconsideration Committee
Kate’s career spans senior investment roles in the financial services industry, including
BlackRock, Schroders and M&G.
She played an instrumental role in the growth of BlackRock’s LDI business
where she built and led the portfolio management function with responsibility
for over £300bn of assets.
Kate now works as a consultant with the senior leaders of asset
management organisations, and she is also an executive coach with a focus on
female leaders in the financial sector. She is a CFA charterholder.

4 6 | P E N S I O N P R O T E C T I O N F U N D | ANNUAL REPORT AND ACCOUNTS 20 16 / 1 7 P E N S I O N P R O T E C T I O N F U N D | ANNUAL REPORT AND ACCOUNTS 20 16 / 1 7 | 4 7
ANDY MCKINNON
Chief Financial OfficerMember of the Investment Committee
Andy has been Chief Financial Officer at the PPF since September 2012. Prior to this, he held a variety of senior positions at Legal & General plc including Finance Director (Retail Investments), Commercial Director
(Investment Platforms) and Product Director (Retail Savings). He is a qualified accountant.
Andy’s earlier roles include positions at BAE Systems, Ernst & Young, Swiss Re
and JP Morgan.
SHARMILA NEBHRAJANI OBE
Non-executive Board memberChair of the Remuneration Committee
Member of the Risk and Audit Committee
Sharmila has had a varied career spanning business, media, technology and health. She is Chair of the Human Tissue Authority, and Director of External Affairs for the Medical Research Council. She is a non-executive director at NS&I, and a Board member of
the BMJ and of the General Council of the University of Sussex. She is an Independent
Trustee-director of the Towers Watson Master Trust pension scheme.
Sharmila was previously Chief Executive of the Association of Medical Research
Charities (AMRC), spent 12 years at the BBC - latterly as COO of BBC Future Media and
Technology – and was Executive Director of Finance and Performance for NHS Sussex.
JAYNE NICKALLS
Non-executive Board memberMember of the Risk and Audit Committee
Jayne has an extensive level of digital, IT and change experience. She was also VP Consulting Services (Northern Europe)
of US company Chordiant Software, during its start-up phase for the UK, and
CEO of Directgov, the Government’s central public services website.
Jayne is a non-executive director at the Financial Services Compensation
Scheme and at UK-based web experience supplier Jadu.
The Board of the Pension Protection Fund
AC
CO
UN
TAB
ILITY REPOR
T

4 6 | P E N S I O N P R O T E C T I O N F U N D | ANNUAL REPORT AND ACCOUNTS 20 16 / 1 7 P E N S I O N P R O T E C T I O N F U N D | ANNUAL REPORT AND ACCOUNTS 20 16 / 1 7 | 4 7
Further information about Board Members, including their registered interests, is available on the PPF website. www.pensionprotectionfund.org.uk/About-Us/TheBoard/Pages/BoardMembers.aspx
BARONESS WARWICK OF UNDERCLIFFE
Non-executive Board memberChair of the Reconsideration Committee
Diana is Chair of the National Housing Federation. She was previously Chair of the Human Tissue Authority and of the charity
Voluntary Service Overseas. Diana was Chief Executive of Universities UK for 14 years
and held the same role at the Westminster Foundation for Democracy.
Diana’s career includes roles as a leading trade unionist, and
non-executive roles at pension schemes, listed companies and public interest bodies.
She was a member of the Nolan/Neill Committee on standards in public life.
Diana was awarded a life peerage in 1999 in recognition for her public service.
HANS DEN BOER Chief Risk Officer
KATHERINE EASTERChief People Officer
BARRY KENNETH Chief Investment Officer
SARA PROTHEROEChief Customer Officer
DAVID TAYLOR
General CounselMember of the Decision Committee
David Taylor was appointed to the PPF Board as an Executive Director and General
Counsel in June 2015. David joined the PPF shortly after its establishment in 2005, becoming Head of Legal in 2007 and, from 2012, Director of Strategy and Legal Affairs.
He is a qualified solicitor.
Earlier in his career, David specialised in corporate and commercial law. He spent ten years in private practice, at Linklaters and US
firm WilmerHale.
MEMBERS OF THE EXECUTIVE COMMITTEE
The Board of the Pension Protection Fund
AC
CO
UN
TAB
ILITY REPOR
T

4 8 | P E N S I O N P R O T E C T I O N F U N D | ANNUAL REPORT AND ACCOUNTS 20 16 / 1 7 P E N S I O N P R O T E C T I O N F U N D | ANNUAL REPORT AND ACCOUNTS 20 16 / 1 7 | 4 9
Governance FrameworkThe Board has eight non-executive members, including the Chairman. On 30 June 2016 Lady Barbara Judge’s term as Chairman ended and she was succeeded by Arnold Wagner OBE. There are three executive members of the Board, including the Chief Executive. There were no changes in executive Board members in 2016/17.
The Board has established a number of committees so that it can conduct its business in line with its Statement of Operating Principles.
The Board has also given the Chief Executive delegated powers so he can take decisions to ensure operational effectiveness and provide regular updates to the Board on performance, risks and strategy. The Chief Executive has established a number of internal committees to oversee operations.
Further details of the governance framework are provided in Appendix 1.
Board PerformanceThe Board met nine times in 2016/17 and also held Board training sessions on Own Risk and Solvency Assessment (ORSA) and Investment benchmarking.
Board members’ attendance at Board and committee meetings is set out in Appendix 2.
Board decisionsA number of decisions that fall within the Board’s normal cycle of work were taken, including:
• approved the Levy Consultation and Levy Determination for 2017/18
• approved the audited 2015/16 Annual Report and Accounts
• reviewed the Board Risks and approved the Risk Appetite statement
• approved the 2017-2020 Strategic Plan
• approved the 2016/17 valuation assumptions
• approved the modelling assumptions for the long-term funding strategy
• approved a change in the Investment Liability Benchmark and a new strategic asset allocation
• approved the levy estimate of £615 million for 2017/18
• approved the ORSA
• approved the PPF’s first statement of compliance with the Modern Slavery Act, and
• approved the appointment of the Appointed Actuary for the 2016/17 valuation.
AC
CO
UN
TAB
ILITY REPOR
T
Governance statement

4 8 | P E N S I O N P R O T E C T I O N F U N D | ANNUAL REPORT AND ACCOUNTS 20 16 / 1 7 P E N S I O N P R O T E C T I O N F U N D | ANNUAL REPORT AND ACCOUNTS 20 16 / 1 7 | 4 9
Highlights of ReportsThe Board and its committees considered a number of matters during the year, including:
• funding strategy review
• the decision to raise a Fraud Compensation Fund levy in 2017/18
• the PPF’s Statement of Investment Principles
• the PPF’s Restructuring and Insolvency Principles
• the establishment of a Compliance and Ethics function
• annual Health and Safety and Bribery Act reports
• closure reports on the insourcing of member services project, and regular progress reports on the project to insource aspects of our investment portfolio
• insourcing of the PPF’s internal audit function
• insourcing of the administration of member services for members of the Financial Assistance Scheme (FAS)
• performance against the 2015/16 KPIs, and updates on performance during 2016/17
• updates to the Board Manual
• actions from the Board and Committee effectiveness review
• succession planning and talent management
• staff survey results
• plans for the consultation for the third levy triennium (2018-21)
• the Department for Work and Pensions’ consultations on the British Steel Pension Scheme and on Security and Sustainability in Defined Benefit Pension Schemes
• the House of Commons Work and Pensions Select Committee’s inquiry and report on Defined Benefit pension schemes, and the joint Select Committee inquiry and report into BHS, and
• possible impacts on the PPF’s long-term funding strategy of the United Kingdom’s decision to leave the European Union.
Further reports from the Board’s committees are in Appendix 3.
Account of Corporate GovernanceThe Board is committed to adhering to high standards of corporate governance and reviews its compliance against the UK Corporate Governance Code and the HM Treasury/Cabinet Office Corporate governance in central government departments: Code of good practice. Formal reporting of compliance with the HM Treasury/Cabinet Office Code on a ‘comply or explain’ basis is a requirement and is set out in this statement.
The latest review of compliance with the Code was considered by the Chairman, the Senior Independent Director and the Chair of the Risk and Audit Committee in March 2016. The Board meets the provisions of the Code where they apply to the PPF. The next review of the PPF’s compliance against the Code will be carried out in 2017/18. The Board’s corporate governance arrangements were audited by the internal auditors, Grant Thornton LLP, in 2015.
Full details of the review can be found in Appendix 4.
The risk and control environmentThe PPF’s approach to management of risk follows the guidelines provided by HM Treasury in their document ‘Orange Book: Management of Risk – Principles and Concepts.’
During the period under review, the Board agreed that the following categories remain the most significant sources of risk to the achievement of its objectives:
• strategic
• funding, and
• operational (including financial).
The Board determines its risk appetite on an annual basis, which is then passed down to risk owners within the PPF who report annually about how they are adhering to the risk appetite. The risk appetite can be found on the PPF website www.pensionprotectionfund.org.uk/About-Us/Documents/Risk_Appetite_Statement.pdf.
AC
CO
UN
TAB
ILITY REPOR
T
Governance statement

5 0 | P E N S I O N P R O T E C T I O N F U N D | ANNUAL REPORT AND ACCOUNTS 20 16 / 1 7 P E N S I O N P R O T E C T I O N F U N D | ANNUAL REPORT AND ACCOUNTS 20 16 / 1 7 | 5 1
Governance statement
Significant risksWe have identified the following risks, which have the potential to adversely impact our ability to deliver our strategic aims and may jeopardise the achievement of the three-year business plan or the long-term funding objective:
• changes in the PPF’s environment arising from adverse economic conditions and/or a failure of the regulatory system (in either its design or operation) may mean the probability of success falls below tolerance
• political intervention resulting in legislative or policy change in UK or Europe may weaken PPF effectiveness and/or result in higher calls on the Fund
• the PPF organisational structure and operating model is evolving rapidly and failure to oversee this transformation at a Board and Executive level may have an adverse impact on our ability to deliver our objectives
• PPF policy and/or operational decisions may adversely impact the external perception of the organisation which may limit our ability to complete our mission
• failure to protect data within the PPF or held by one of our third parties means that data could be lost, stolen or inappropriately used
• failure to maintain data quality within the PPF or received from external parties means that process objectives are not achieved
• failure to deliver excellent customer service leading to member (PPF & FAS) and/or stakeholder dissatisfaction
• failure to effectively procure and manage third party suppliers including change in our strategic suppliers may result in poor value for money and/or lower than expected investment returns, member/stakeholder dissatisfaction
• unexpected material off balance sheet (DB liabilities) risk materialises that may significantly and adversely impact PPF’s funding plan
• PPF investment strategy could be inappropriate and/or implemented ineffectively leading to the returns we are targeting not being enough to fund compensation over the long term
• failure to manage our liquidity and collateral requirements undermines our professional management of our investment strategy, and questions our mandate to operate
• failures in our risk management and control framework lead to unexpected losses and or stakeholder dissatisfaction
• failure to create an ‘Employer of Choice’ will adversely impact our ability to achieve our strategic objectives, and
• ineffective management of the PPF’s reputation may result in adverse stakeholder criticism and erode support and confidence in the PPF.
The risks above are maintained and managed as part of the normal course of business. Further details of our risk and control environment can be found in Appendix 5.
Ministerial directionsNo directions have been issued.
Personal data related incidentsNo material data incidents to disclose.
Significant control issuesThere are no significant control issues to disclose.
AC
CO
UN
TAB
ILITY REPOR
T

5 0 | P E N S I O N P R O T E C T I O N F U N D | ANNUAL REPORT AND ACCOUNTS 20 16 / 1 7 P E N S I O N P R O T E C T I O N F U N D | ANNUAL REPORT AND ACCOUNTS 20 16 / 1 7 | 5 1
Governance statement
Review of effectivenessAs Accounting Officer, I also have responsibility for reviewing the effectiveness of the system of internal control. My review has been informed by:
• the assurances I sought and received from other Board members and senior staff of the PPF which detailed the work carried out to make sure management of risk and control is addressed in their areas of responsibility
• the work of the executive directors and senior managers within the PPF who have responsibility for the development and maintenance of the internal control framework
• comments made by the external auditor in his management letter and other reports, and
• the opinion of the Head of Internal Audit on the overall adequacy and effectiveness of PPF’s framework of governance, management of risk and control. This states that the PPF’s risk management, control and governance processes are effective on the assumption that recommendations from audit reviews are implemented.
I have been advised in my review of the effectiveness of the system of internal control by the Risk and Audit Committee, the Investment Committee, the Executive Committee, the Asset and Liability Committee and the Risk Management Committee.
AC
CO
UN
TAB
ILITY REPOR
T

5 2 | P E N S I O N P R O T E C T I O N F U N D | ANNUAL REPORT AND ACCOUNTS 20 16 / 1 7 P E N S I O N P R O T E C T I O N F U N D | ANNUAL REPORT AND ACCOUNTS 20 16 / 1 7 | 5 3
Appendix 1 - Governance Framework
The Pensions Act 2004 requires that the Board has a majority of non-executive members, including a non-executive Chairman.
All non-executive members were independent at first appointment having no current or previous material relationship with the organisation as an employee, officer or contractor.
The Board must, under section 108 of the Pensions Act 2004, appoint a Chief Executive and at least two further executive Board members. There are currently three executive members: the Chief Executive, the Chief Financial Officer and the General Counsel.
The Board is required under the Pensions Act 2004 to have a Non-Executive Committee. The functions of the Non-Executive Committee are set out under section 112 of the Pensions Act 2004:
• the duty to keep under review the question of whether the Board’s internal financial controls secure the proper conduct of its financial affairs
• the duty to determine under sub-paragraph (5)(a) of paragraph 12 of Schedule 5, subject to the approval of the Secretary of State, the terms and conditions as to remuneration of any Chief Executive appointed under sub-paragraph (4) of that paragraph
• the duty to determine under paragraph 13(3)(a) of that Schedule, subject to the approval of the Secretary of State, the terms and conditions as to remuneration of any member of staff who is also to be an executive member of the Board, and
• the duty to determine under paragraph 13(3) (b) of that Schedule, the terms and conditions as to the remuneration of any member of staff of a description prescribed for the purposes of that provision.
The Board is also required to have a Reconsideration Committee to reconsider reviewable matters, cases and maladministration complaints.
The Board has also established a Risk and Audit Committee and a Remuneration Committee as the sub-committees of the Non-Executive Committee. Investment, Nomination and Decision Committees have been established as committees of the Board.
Each committee has a majority of non-executive members. The terms of reference for these committees can be accessed at www.pensionprotectionfund.org.uk/About-Us/TheBoard/Pages/TheBoard.aspx and their activities during the 2016/17 financial year are reported in Appendix 3.
Board procedures are governed by its Statement of Operating Principles and its decision making role by the Schedule of Delegations and Matters Reserved to the Board. The Chief Executive reports to the Board monthly on performance against strategic objectives, and provides a Chief Executive’s report and other briefings as required. Papers are circulated a week in advance of meetings.
The roles of internal committees established by the Chief Executive and those of individual post holders are set out in the Authorisations from the Chief Executive document.
AC
CO
UN
TAB
ILITY REPOR
T
Governance statement

5 2 | P E N S I O N P R O T E C T I O N F U N D | ANNUAL REPORT AND ACCOUNTS 20 16 / 1 7 P E N S I O N P R O T E C T I O N F U N D | ANNUAL REPORT AND ACCOUNTS 20 16 / 1 7 | 5 3
Appendix 2 - Attendance at Board and Committee meetings during 2016/17
Board member details are shown in the table on pages 44-47. Committee memberships and attendance at Board and committee meetings are set out below and in the Remuneration and staff report on page 59.
¹ The Reconsideration Committee forms a panel of non-executive members of the Board without prior involvement in the matter. When a matter is remitted from the Pension Protection Fund Ombudsman the panel does not include the same members as were previously involved.
2 Appointed Chairman of the Board on 1 July 20163 Stepped down from the Board on 30 June 20164 Joined the Board on 1 July 2016o Attended meetings as an observer‡ Attended two meetings as an observer, one meeting as a member
Boar
d
Rem
uner
atio
n Co
mm
ittee
Risk
and
Aud
it Co
mm
ittee
Inve
stm
ent
Com
mitt
ee
Reco
nsid
erat
ion
Com
mitt
ee1
Dec
isio
n Co
mm
ittee
Nom
inat
ion
Com
mitt
ee
Arnold Wagner OBE2 9 of 9 2 of 2 n/a n/a n/a 3 of 3 1 of 1
Rosemary Hilary 8 of 9 n/a 4 of 4 2 of 4 n/a 3 of 3 n/a
Alan Jenkins 6 of 9 1 of 2 n/a n/a 9 of 9 3 of 3 n/a
Kate Jones 8 of 9 n/a n/a 4 of 4 9 of 9 n/a n/a
Tom Joy 6 of 9 2 of 2 4 of 4 4 of 4 n/a n/a n/a
Lady Judge CBE3 3 of 3 1 of 1 n/a n/a n/a n/a 1 of 1
Andy McKinnon 9 of 9 n/a 4 of 4º 4 of 4 n/a 2 of 2º n/a
Sharmila Nebhrajani OBE 9 of 9 1 of 1 4 of 4 n/a n/a n/a n/a
Jayne Nickalls4 6 of 6 n/a 3 of 3 1 of 1º n/a n/a n/a
Alan Rubenstein 8 of 9 2 of 2º 4 of 4º 3 of 4 n/a 3 of 3 n/a
David Taylor 9 of 9 n/a 4 of 4º 4 of 4º n/a 3 of 3‡ n/a
Baroness Warwick of Undercliffe 7 of 9 n/a 0 of 1 n/a 9 of 9 n/a n/a
AC
CO
UN
TAB
ILITY REPOR
T
Governance statement

5 4 | P E N S I O N P R O T E C T I O N F U N D | ANNUAL REPORT AND ACCOUNTS 20 16 / 1 7 P E N S I O N P R O T E C T I O N F U N D | ANNUAL REPORT AND ACCOUNTS 20 16 / 1 7 | 5 5
Remuneration Committee
The Remuneration Committee is chaired by Sharmila Nebhrajani OBE, who took over as Chair from Arnold Wagner OBE in July 2016. The Committee met twice during the year and agreed objectives for executive directors for the 2016/17 financial year. The Committee also undertook yearly and half-yearly performance reviews of executive directors and approved bonus payments for them based on performance against the objectives set.
The Committee discussed the development of the overall reward strategy of the PPF and received some training on best practice approaches of Remuneration Committees.
Risk and Audit Committee
The Risk and Audit Committee is chaired by Rosemary Hilary, who took over as Chair from Sharmila Nebhrajani OBE in September 2016. The Committee met four times during the year. The scope of the Committee covers risk, including monitoring compliance with the Board’s risk appetite, and the effectiveness of internal controls. Eighteen internal audit reports and one thematic review, on supplier management, were presented. In addition, the Committee reviewed the management response to a review of the process to update the benchmark used to calculate the PPF’s hedging requirements.
Information security was a particular focus during the year; discussions in the Committee were supported by a number of internal audit reports including the IT change framework and data security, and by reports from the business on user access controls. In the first half of the year the Committee also monitored the planning for the insourcing of some of the PPF’s investment activities.
The Committee discussed developments in risk management including drafts of the ORSA prior to its consideration by the Board, and the framework for stress testing and monitoring scenario risk. The Committee continued to receive quarterly reports on the management and progress of major change programmes in the organisation. In addition, the Committee started to receive a series of reports from directors on key risks and controls within their Directorate. The first reports were from Andy McKinnon, Chief Financial Officer, and Katherine Easter, Chief People Officer. As part of its normal cycle of work, the Committee reviewed the risk management policy and risk appetite, the Key Risk Indicators, the Governance Statement, the annual Actuarial Valuation, the whistleblowing policy and the internal audit reports. The Committee also reviewed and recommended the 2015/16 Annual Report and Accounts for approval by the Board. A new style Management Information pack was also developed during the year.
The whistleblowing policy applies widely in the PPF, including employees, agency workers, contractors, consultants, volunteers, secondees, interns, non-executives, suppliers and members of the public. The PPF encourages staff to raise serious concerns which are in the public interest, without fear of reprisal or victimisation. The policy was reviewed by the Committee; no matters were raised in the year. All staff affirmed awareness and understanding of the policy during the year.
AC
CO
UN
TAB
ILITY REPOR
T
Governance statement
Appendix 3 - Highlights of reports

5 4 | P E N S I O N P R O T E C T I O N F U N D | ANNUAL REPORT AND ACCOUNTS 20 16 / 1 7 P E N S I O N P R O T E C T I O N F U N D | ANNUAL REPORT AND ACCOUNTS 20 16 / 1 7 | 5 5
Following the establishment of a Compliance and Ethics function within the organisation, the Committee now receives a regular report from the Head of Legal, Compliance and Ethics. The Committee provided guidance on the development of the function, which mirrors that of a regulated body, and approved the Compliance Monitoring Plan for 2017/18.
Grant Thornton LLP, PPF’s internal auditors, continued to provide the internal audit service. During the year the PPF agreed to bring the internal audit function in-house, and appointed a Head of Internal Audit. The Committee reviewed the new internal audit strategy and mission and approved the internal audit plan for 2017/18.
Colin Smith was reappointed as co-opted specialist member of the Committee to provide additional independent risk management knowledge and experience on the Committee.
Investment Committee
The Investment Committee is chaired by Tom Joy. The Committee met four times during the year and the Committee agreed a number of key proposals including: an approach to procuring new investment managers in line with EU Directive 2014/24/EU; a review of the strategic asset allocation; updates on insourcing parts of the credit portfolio; and reviews of the global equities and equity risk, emerging markets, and liability-driven investments. The requirement under section 114 of the Pensions Act 2004 for the Committee to prepare and maintain a Statement of Investment Principles was fulfilled. The Committee worked with the Board to provide training on investment benchmarking in order for the strategic assessment allocation to be considered.
As part of its normal cycle of work, the Investment Committee reviewed:
• four investment update reports including investment activities and the implementation of investment policies
• formal and informal reports from the investment advisor
• two reports on the markets and investment strategy
• an asset class review of emerging markets
• an asset class review of global equities and equity risk
• a thematic review of liability-driven investments
• the investment risk appetite for review by the Board, and
• the Statement of Investment Principles.
Michael O’Brien, co-opted specialist member of the Investment Committee, continued to provide additional independent investment knowledge and experience on the Committee.
AC
CO
UN
TAB
ILITY REPOR
T
Governance statement
Appendix 3 - Highlights of reports

5 6 | P E N S I O N P R O T E C T I O N F U N D | ANNUAL REPORT AND ACCOUNTS 20 16 / 1 7 P E N S I O N P R O T E C T I O N F U N D | ANNUAL REPORT AND ACCOUNTS 20 16 / 1 7 | 5 7
Reconsideration Committee
Decision Committee
The Reconsideration Committee is chaired by Baroness Warwick of Undercliffe. Christopher Hughes, co-opted member of the Reconsideration Committee, continued to provide input based on his considerable experience to support robust decision making. The Committee met on nine occasions during the year and considered, and issued decisions relating to 17 cases where levy payers challenged their levy. Of these 17, four were referred to the Pension Protection Fund Ombudsman.
The Committee also considered seven non-levy review cases relating to compensation payments, six in relation to compensation entitlement, and two maladministration complaints. Four cases were referred to the Pension Protection Fund Ombudsman.
The Decision Committee is chaired by Alan Jenkins. The Committee met three times during the year.
The Decision Committee takes decisions on matters which are normally delegated to the Chief Executive which he refers back to the Committee, as well as any specific cases assigned to it by the Board. This may be due to the particular circumstances of the matter, where additional Board member input is thought valuable, or where it is judged necessary in the light of the possibility of future review or complaint.
Nomination Committee
The Nomination Committee met once during the year as one non-executive appointment was made. The Chair of the Nomination Panel was Lady Barbara Judge CBE. The Committee used the outcomes of previous Board effectiveness reviews to evaluate the balance of skills of Board members, and the Chair of the Committee agreed the draft role description in line with the Board’s needs.
Board appointments
The Secretary of State for Work and Pensions is responsible for appointing the Chairman of the PPF and as a ministerial appointment this is governed by the Code of Practice for Ministerial Appointments to public bodies. All other Board appointments are made by the Board on the recommendation of the Nomination Committee. However, the Secretary of State must approve the appointment, remuneration and terms and conditions for the Chief Executive and the remuneration for other executive Board members. The Secretary of State also determines the fee for non-executive members.
The appointment of ‘ordinary’ members to the Board is governed by regulations under which the Board must include an independent member as part of its appointment panel.
AC
CO
UN
TAB
ILITY REPOR
T
Governance statement
Appendix 3 - Highlights of reports

5 6 | P E N S I O N P R O T E C T I O N F U N D | ANNUAL REPORT AND ACCOUNTS 20 16 / 1 7 P E N S I O N P R O T E C T I O N F U N D | ANNUAL REPORT AND ACCOUNTS 20 16 / 1 7 | 5 7
As stated, the Board is committed to adhering to high standards of corporate governance and annually reviews its compliance against the UK Corporate Governance Code and the HM Treasury/Cabinet Office Corporate governance in central government departments: Code of good practice.
The principal areas of compliance are met as follows:
Board leadershipThe structure of the Board is underpinned by the framework set out in the Pensions Act 2004 as well as governance and operational requirements. Committees have been established to serve particular needs. The composition of the Board is determined by the skills, experience and diversity needed to deliver the PPF’s statutory functions and is supported by its members’ financial, investment, legal, risk management, operational and member representation knowledge.
The Board focuses on strategic issues, and provides leadership and challenge to the executive. The Board considers the PPF’s performance against its strategic objectives as well as risk management in the organisation, and ensures these support the long-term success of the organisation.
The Board believes that effective behaviours and culture support organisational delivery and management of risk. The Board discuss their views in relation to organisational culture and behaviours regularly, and monitors this closely using the staff survey and other measures. The Board operates in accordance with its Board Manual which identifies how meetings should be conducted. Individual members also adhere to the code of conduct, guidance on dealing with potential conflicts of interest and guidance on expenses and hospitality.
All non-executive directors were independent at first appointment. The Board has a Non-executive Committee chaired by the Chairman of the Board. The Board has appointed a Senior Independent Director who meets with the non-executives without the Chairman present on an at least an annual basis.
Board effectivenessThe Board has an operational framework in place and has determined its behavioural values. The actual operation of this framework and these values as well as Board balance is reviewed through annual Board effectiveness evaluations. These evaluations are conducted internally
with facilitation by external consultants every three years. Independent Audit Limited facilitated the review in 2016/17 and the Board concluded that it and its sub-committees continue to be effective and operate well. The Board Secretary will take forward any outstanding recommendations for improvements to the Board’s operations as part of the Board’s regular cycle of work.
The Board has regulations in place for the appointment of ‘ordinary’ Board members and both the Board and its Nomination Committee consider the current and future needs of the Board in order to facilitate the Board appointment process. New Board members receive induction training, and ongoing briefings and opportunities to visit business areas are provided to support non-executive members’ understanding of the organisation’s operations and key risks.
The Board is provided with detailed, appropriate information as part of their decision making processes. The financial and performance data provided to the Board is extracted from the PPF’s accounting and operational systems. This means it is subject to regular, planned, internal assurance checks and independent audits. As part of the Board effectiveness review the Board were asked about the quality and sufficiency of information received and no concerns were raised.
Board and committee papers are circulated a week in advance of meetings and the Board is supported by a dedicated secretariat.
Management of riskThe Board has set its risk appetite which it reviews at least annually. An ORSA has been agreed by the Board and will continue to be developed during 2017/18. The Board is supported in its risk management role by its Risk and Audit Committee, which is chaired by a non-executive member with audit and risk management experience, its internal and external auditors, and its Investment Committee.
Risk management is embedded throughout the organisation, working up from team-level Risk and Control Self Assessments (RCSAs) and issues logs through to Board risks. Regular reports are received from members of the Executive Committee. The Chief Executive has established a Risk Management Committee and an Asset and Liability Committee to ensure effective day-to-day oversight of operational and financial risks. Information on risks and risk management processes is provided in Appendix 5.
AC
CO
UN
TAB
ILITY REPOR
T
Governance statement
Appendix 4 - Account of Corporate Governance

5 8 | P E N S I O N P R O T E C T I O N F U N D | ANNUAL REPORT AND ACCOUNTS 20 16 / 1 7 P E N S I O N P R O T E C T I O N F U N D | ANNUAL REPORT AND ACCOUNTS 20 16 / 1 7 | 5 9
Our system of internal control is designed to manage risk within our risk appetite rather than to eliminate all risk of failure to achieve policies, aims and objectives.
The system of internal control is based on an ongoing process designed to identify and prioritise the management of risks to the achievement of the Board of the PPF’s policies, aims and objectives. This process is also designed to evaluate the likelihood of those risks being realised and their impact should they be realised and to manage them efficiently, effectively and economically.
The system of internal control has been in place within the Board of the PPF for the year ending 31 March 2017 and up to the date of signing of this annual report and accounts, and accords with HM Treasury guidance.
Internal audit services have been provided on an outsourced basis in accordance with ‘Public Sector Internal Audit Standards’. Audits are undertaken in accordance with an internal audit plan approved by the Risk and Audit Committee. Grant Thornton LLP, PPF’s internal auditors, have continued to provide internal audit services.
The risk and control environmentAs stated, our approach to management of risk follows the guidelines provided by HM Treasury in their document ‘Orange Book: Management of Risk – Principles and Concepts.’
Risk processes are embedded throughout the organisation and individuals’ responsibilities are reinforced through an annual communication. During 2016/17, we have delivered a number of improvements to the management of risk, including:• risk appetite statement enhanced with
greater degree of quantification• embedding of the RCSAs process across the
organisation• development of a risk management MI pack and
RCSA dashboard• refinement of the directors and senior managers
attestation process, with the latter now taking place six-monthly
• development of an ORSA• formalised the stress-testing framework• review of our risk taxonomy, and• review of the risk management policy.
We undertake thematic reviews of particular risks which are presented at Board and executive committees to ensure that we are managing all the risks we face and that the controls we have in place are appropriate.
The PPF relies on various models of which some are identified as critical. There is an appropriate quality assurance framework (as defined in the Macpherson Report of March 2014) in place for these models. The quality assurance framework includes, but is not limited to, external audit, internal and external review, governance structures for review and challenge of model assumptions and outputs, developer testing and consideration of the relevant actuarial standards where appropriate.
The PPF recognises the importance of managing information effectively. We therefore operate in accordance with the Security Policy Framework and related Data Security guidance issued by the UK Government. To help achieve this we gained certification to the ISO27001 Information Security standard in 2009 (successfully recertified in 2016) and carry out annual ISO27001 surveillance audits to ensure we maintain compliance with the standard.
AC
CO
UN
TAB
ILITY REPOR
T
Governance statement
Appendix 5 - The risk and control environment

5 8 | P E N S I O N P R O T E C T I O N F U N D | ANNUAL REPORT AND ACCOUNTS 20 16 / 1 7 P E N S I O N P R O T E C T I O N F U N D | ANNUAL REPORT AND ACCOUNTS 20 16 / 1 7 | 5 9
AC
CO
UN
TAB
ILITY REPOR
T
The remuneration and staff report sets out the remuneration policy for directors, how that policy was implemented and the amounts awarded to those directors, along with details of the composition of staff employed by the PPF and measures relating to fair pay.
Remuneration PolicyOur remuneration policy outlines our approach to reward across the entire organisation. We aim to pay market rate for those that are achieving full performance within their role. We set a basic set salary to reflect an employee’s professional experience and organisational responsibility. We set variable remunerations to reflect performance in excess of that required to fulfil the employee’s job description and terms of employment.
Remuneration and bonuses of directorsExecutive directors receive a salary which is reviewed annually by the Remuneration Committee. Their contracts allow for the payment of an annual performance related bonus.
The Chairman was paid a fixed fee and was contracted to work for the PPF for two days a week. All other non-executive directors received a fixed fee, based on working 26 days a year. This fee was not performance-related and there was no provision for compensation if a contract was terminated.
ContractsExecutive directors are employed on a fixed term contract and non-executive directors are appointed for a fixed term of office.
1 Arnold Wagner was previously a non-executive member of the Board, first appointed on 4 January 2011.
Name Contract type Start date End date
Arnold Wagner OBE (Chairman)
Term of office (first1) 1 July 2016 30 June 2021
Lady Judge CBE (Chairman) Term of office (second) 1 July 2013 30 June 2016
Alan Rubenstein Fixed Term Contract (third) 1 July 2015 30 June 2018
Andy McKinnon Fixed Term Contract (second) 1 January 2016 31 December 2018
David Taylor Fixed Term Contract (first) 1 June 2015 31 May 2018
Rosemary Hilary Term of office (first) 4 January 2016 3 January 2019
Alan Jenkins Term of office (second) 7 August 2016 6 August 2019
Kate Jones Term of office (first) 15 February 2016 14 February 2019
Tom Joy Term of office (second) 7 August 2016 6 August 2019
Sharmila Nebhrajani OBE Term of office (second) 27 June 2015 26 June 2018
Jayne Nickalls Term of office (first) 1 July 2016 30 June 2019
Baroness Warwick of Undercliffe
Term of office (third) 7 March 2017 6 March 2020
Remuneration and staff report

6 0 | P E N S I O N P R O T E C T I O N F U N D | ANNUAL REPORT AND ACCOUNTS 20 16 / 1 7 P E N S I O N P R O T E C T I O N F U N D | ANNUAL REPORT AND ACCOUNTS 20 16 / 1 7 | 6 1
Notice periodsThe executive directors have notice periods of six months. Non-executive directors’ appointments can be terminated with one month’s notice by either the Board or the individual member. The Chairman’s appointment is subject to a six month notice period by either the Secretary of State for Work and Pensions or by the postholder. This can be waived by either party and the postholder can accept payment in lieu of notice.
Executive directors – outside appointmentsWe recognise the benefits to the individual, and to the organisation, of executive directors of the PPF serving as non-executive directors of other organisations and companies. These roles are undertaken outside of PPF working hours through a combination of paid and unpaid leave. Fees, where applicable, are retained by the executive director for current appointments. External non-executive appointments held by executive directors during the year were:Alan Rubenstein, non-executive member of the Supervisory board of Robeco Groep NV, a Netherlands based asset manager (to 31 October 2016); non-executive director of esure Group plc (from 8 March 2017); investment advisor to the British Coal Staff Superannuation Scheme.
Cash equivalent transfer valuesThis is the actuarially-assessed capitalised value of the pension scheme benefits accrued by a member at a particular point in time. The benefits valued are the member’s accrued benefits and any contingent spouse’s pension payable from the scheme.
Cash equivalent transfer values (CETVs) are calculated within the guidelines and framework prescribed by the Institute and Faculty of Actuaries and do not take account of any actual or potential reduction to benefits resulting from Lifetime Allowance Tax which may be due when pension benefits are taken.
Remuneration and staff report
AC
CO
UN
TAB
ILITY REPOR
T

6 0 | P E N S I O N P R O T E C T I O N F U N D | ANNUAL REPORT AND ACCOUNTS 20 16 / 1 7 P E N S I O N P R O T E C T I O N F U N D | ANNUAL REPORT AND ACCOUNTS 20 16 / 1 7 | 6 1
Directors’ salary and pension entitlements*Year ending 31 March 2017 Salary
(in bands of £5,000)
Bonus1
(in bands of £5,000)
Pension benefits
(to nearest £1,000)
Total (in bands of
£5,000)
£’000 £’000 £’000 £’000Executive directorsAlan Rubenstein, Chief Executive 200-205 40-45 - 240-245Andy McKinnon, Chief Financial Officer 155-160 10-15 - 170-175David Taylor, General Counsel 130-135 10-15 61 205-210Non-executive directorsArnold Wagner OBE, Chairman (appointed Chairman from1 July 2016)
45-50 (55-60)2
- - 45-50
Lady Judge CBE, Chairman (until 30 June 2016)
10-15(55-60)2
- - 10-15
Rosemary Hilary 15-20 - - 15-20Alan Jenkins 15-20 - - 15-20Kate Jones 15-20 - - 15-20Tom Joy 15-20 - - 15-20Sharmila Nebhrajani OBE 15-20 - - 15-20Jayne Nickalls (from 1 July 2016)
10-15(15-20)2
- - 10-15
Baroness Warwick of Undercliffe 15-20 - - 15-20
Year ending 31 March 2016Executive directorsAlan Rubenstein, Chief Executive 200-205 40-45 - 240-245Andy McKinnon, Chief Financial Officer 155-160 15-20 61 230-235David Taylor, General Counsel (from 1 June 2015)
110-115 (130-135) 2
10-15 100 225-230
Non-executive directorsLady Judge CBE, Chairman 55-60 - - 55-60Dick Barfield (until 30 September 2015)
5-10(15-20)2
- - 5-10
John Bevington (until 18 October 2015)
5-10 (15-20)2
- - 5-10
Rosemary Hilary (from 4 January 2016)
0-5 (15-20)2
- - 0-5
Alan Jenkins 15-20 - - 15-20Kate Jones (from 15 February 2016)
0-5 (15-20)2
- - 0-5
Tom Joy 15-20 - - 15-20Sharmila Nebhrajani OBE 15-20 - - 15-20Arnold Wagner OBE 15-20 - - 15-20Baroness Warwick of Undercliffe 15-20 - - 15-20
There were no benefits-in-kind paid to directors in the current or prior year1 The bonus values disclosed here relate to the executive directors’ performance in the year2 Full year equivalent*Subject to audit
Remuneration and staff report
AC
CO
UN
TAB
ILITY REPOR
T

6 2 | P E N S I O N P R O T E C T I O N F U N D | ANNUAL REPORT AND ACCOUNTS 20 16 / 1 7 P E N S I O N P R O T E C T I O N F U N D | ANNUAL REPORT AND ACCOUNTS 20 16 / 1 7 | 6 3
Staff Report
Salary multiples*Reporting bodies are required to disclose the relationship between the remuneration of the highest paid Board member in their organisation and the median remuneration of the organisation’s workforce.
In 2016/17 three employees (2015/16: three) received remuneration in excess of the highest paid Board member. Remuneration ranged from £20k to £525-£530k (2015/16: £18k to £565-570k).
Total remuneration includes salary, non-consolidated performance-related pay and benefits-in-kind. It does not include severance payments, employer pension contributions and the cash equivalent transfer value of pensions.
*Subject to audit
2016/17 2015/16
Band of highest paid Board member’s total remuneration £240-£245k £240-£245kMedian remuneration of the workforce £49k £49kRatio 4.9 5.0
Directors’ pension benefits*
Total accrued pension at
pension age as at 31 March 2017 (in bands of
£5,000)
Real increase in pension at pension age (in bands of
£2,500)
Cash equivalent
transfer value as at 31
March 2017
Cash equivalent
transfer value as at 31
March 2016Real increase
in CETV
Employer Contribution
to partnership pension account
(to nearest £100)
£’000 £’000 £’000 £’000 £’000 £Alan Rubenstein1, Chief Executive
- - - - - -
Andy McKinnon2, Chief Financial Officer
- - - 136 - 24,100
David Taylor, General Counsel
30-35 2.5-5 412 358 24 -
1 Alan Rubenstein chose not to be covered by the Civil Service pension arrangement as he has reached the maximum lifetime allowance. PPF paid £918 to provide insurance cover.
2 Andy McKinnon opted out of the defined benefit ‘Alpha Pension Scheme’ from 31 March 2016 in favour of the defined contribution Partnership pension account. Pension benefit disclosures have been made in accordance with the guidance set out in EPN 492.
Remuneration and staff report
AC
CO
UN
TAB
ILITY REPOR
T

6 2 | P E N S I O N P R O T E C T I O N F U N D | ANNUAL REPORT AND ACCOUNTS 20 16 / 1 7 P E N S I O N P R O T E C T I O N F U N D | ANNUAL REPORT AND ACCOUNTS 20 16 / 1 7 | 6 3
*Subject to audit
Staff numbers and costs*The average number of staff employed, including seconded and temporary staff was:
Staff compositionAs at 31 March we had:
Disabled employeesApplications for employment by disabled persons are always fully considered, bearing in mind the aptitudes of the applicant concerned. In the event of members of staff becoming disabled every effort is made to ensure that their employment with the PPF continues and that appropriate adjustments are made. It is the policy of the PPF that the training, career development and promotion of disabled persons should, as far as possible, be identical to that of other employees. Five of our staff have registered themselves as disabled. We are a level 2 employer under the Disability Confident Employer scheme which recognises that we take action to meet five commitments regarding employment, retention, training and career development of disabled employees.
Sickness, absence and staff turnoverThe number of days we lost to sickness during the year averaged 4.9 days per person. This included long-term absences of more than 28 days of which we had two cases of over six months for serious health issues. Excluding long-term absences, we only lost 3.1 days per person.
Staff turnover fell from 14.2 per cent in 2015/16 to 13.9 per cent in 2016/17.
2017 2016
Average No. Employees
Staff costs £m
Average No. Employees
Staff costs £m
Permanent employees and fixed term contracts 333 25.8 297 22.9Short term, seconded and temporary staff 14 2.2 31 4.5Total 347 28.0 328 27.4
2017 2016
Men Women Men Women
Total employees 180 169 153 159Senior management 8 7 8 7Other management 34 20 30 21
Remuneration and staff report
AC
CO
UN
TAB
ILITY REPOR
T

6 4 | P E N S I O N P R O T E C T I O N F U N D | ANNUAL REPORT AND ACCOUNTS 20 16 / 1 7 P E N S I O N P R O T E C T I O N F U N D | ANNUAL REPORT AND ACCOUNTS 20 16 / 1 7 | 6 5
Off-payroll staffFor all off payroll engagements as of 31 March for more than £220 per day and that last for longer than six months:
Staff exit packages*Exit package payments agreed to former staff are summarised as follows:
All of these engagements have been subject to a risk-based assessment as to whether assurance was required for the individual paying the right amount of tax. In no instance did we consider it necessary to seek such assurance. All contracts for new engagements contain the right for the PPF to seek this assurance. In addition to the above engagements, seven positions within the PPF have been filled on an interim basis by an external consultancy firm as part of a transformation programme.
All senior managers are on the payroll.
2017 2016
Number of existing engagements 10 17Number that have existed for less than one year 8 12Number that have existed for between one and two years 2 5Number that have existed for more than two years - -Number of new engagements, or those that reached six months in duration, between 1 April and 31 March 10 9
Number of compulsory
redundanciesNumber of other
departures agreedTotal number of exit packages by
cost band
Exit package cost band 2017 2016 2017 2016 2017 2016£10,000 - £25,000 - - 1 1 1 1£25,000 - £50,000 - - - 4 - 4£50,000 - £100,000 - - - 2 - 2Total number of exit packages - - 1 7 1 7Total cost - - £10,961 £275,332 £10,961 £275,332
Consultancy costsWe occasionally use professional service providers to help with specialist work including consultancy and contingent labour where it is necessary and prudent to do so. Total expenditure on consultancy during the year amounted to £7.6m (2016: £5.3m).
Remuneration and staff report
AC
CO
UN
TAB
ILITY REPOR
T
*Subject to audit

6 4 | P E N S I O N P R O T E C T I O N F U N D | ANNUAL REPORT AND ACCOUNTS 20 16 / 1 7 P E N S I O N P R O T E C T I O N F U N D | ANNUAL REPORT AND ACCOUNTS 20 16 / 1 7 | 6 5
The disclosures in this Parliamentary Accountability Report along with the Statement of Accounting Officer’s Responsibilities and the Certificate and Report of the Comptroller and Auditor General to the Houses of Parliament bring together the key documents demonstrating the PPF’s accountability to Parliament in relation to the Annual Report and Accounts.
The Chairman and Chief Executive meet regularly with Ministers and Senior Officials from the Department for Work and Pensions in addition to quarterly accountability review meetings. The Department approves the Board’s Strategic Plan and the Board delivers its Annual Report and Accounts to Parliament through the Secretary of State.
The Chief Executive of the PPF is also its Accounting Officer. Compliance with Accounting Officer responsibilities is supported through the Board’s risk management procedures and through a shared objective for senior management to support the Accounting Officer in fulfilling his responsibilities.
Losses and special payments*Our mission is to pay the right amount of PPF compensation to the right people at the right time. To do this we rely on complete and accurate data being available, as well as our own administrative processes working effectively.
Incorrect payments do occasionally arise. Sometimes we will pay the best estimate of compensation at the correct time, based on inaccurate or incomplete data from scheme trustees. We may occasionally make errors ourselves in the administration of compensation. When more accurate information is made available, or an error has occurred and is subsequently identified, we will reassess the compensation calculation. This can lead to us making additional compensation payments or to reclaim overpaid compensation from members. We also have to make similar adjustments where amounts have in the past been paid incorrectly by schemes which subsequently transferred into the PPF.
Our policy for overpayments is to seek recovery by offset against future compensation payments or by immediate settlement where this is not possible (or if the member prefers to do so). If the amount is below the level deemed uneconomic to recover, or where the member can demonstrate financial hardship, the overpaid amount will be written off. During the year 371 overpayments totalling £243,479 (2016: 828 totalling £375,496) were written off.
Where members’ compensation is found to have been underpaid we pay interest on the backdated amounts. £2,597 (2016: £340,789) of interest on recalculated compensation was paid to 39 members (2016: 3,205 members).
Remote Contingent LiabilitiesThe theoretical value of potential claims on the PPF is measured by the PPF 7800 index, which estimates on a section 179 basis the funding levels of the schemes we protect. The PPF 7800 is published by the PPF each month and is discussed in the Risk Management section of the Performance Report. The aggregate value of all possible claims at 31 March 2017 is £290bn on a section 179 basis excluding those separately disclosed as types 1 to 4 contingent liabilities by the Appointed Actuary in Annex S6 of the Actuarial Valuation.
REMU
NER
ATION
AN
D STA
FF REPOR
T
Parliamentary accountability
AC
CO
UN
TAB
ILITY REPOR
T
*Subject to audit

6 6 | P E N S I O N P R O T E C T I O N F U N D | ANNUAL REPORT AND ACCOUNTS 20 16 / 1 7 P E N S I O N P R O T E C T I O N F U N D | ANNUAL REPORT AND ACCOUNTS 20 16 / 1 7 | 6 7
Statement of Accounting Officer’s responsibilities
Under the Pensions Act 2004, the Board of the PPF is required to prepare for each financial year a statement of accounts in the form and on the basis directed by the Secretary of State for Work and Pensions with the consent of the Treasury. The accounts are prepared on an accruals basis and must give a true and fair view of the state of affairs of the Board and of its income and expenditure, gains and losses and cash flows for the financial year.
In preparing the accounts, the Board is required to comply with the requirements of the Government Financial Reporting Manual and in particular to:
• observe the Accounts Direction issued by the Secretary of State, including the relevant accounting and disclosure requirements, and apply suitable accounting policies on a consistent basis
• make judgements and estimates on a reasonable basis
• state whether applicable accounting standards as set out in the Government Financial Reporting Manual have been followed, and disclose and explain any material departures in the accounts, and
• prepare the accounts on a going concern basis.
The Secretary of State for Work and Pensions has appointed the Chief Executive as the Accounting Officer for the Board. The responsibilities of an Accounting Officer, including responsibility for the propriety and regularity of the public finances for which the Accounting Officer is answerable, for keeping proper records and for safeguarding the Board’s assets, are set out in Managing Public Money published by HM Treasury.
The Accounting Officer confirms:
• as far as he is aware, there is no relevant audit information of which the auditors are unaware
• he has taken all the steps that he ought to have taken to make himself aware of any relevant audit information and to establish that the auditors are aware of that information
• the Annual Report and Accounts as a whole is fair, balanced and understandable, and
• he takes personal responsibility for the Annual Report and Accounts and the judgments required for determining that it is fair, balanced and understandable.
Alan Rubenstein Accounting Officer 22 June 2017
AC
CO
UN
TAB
ILITY REPOR
T

6 6 | P E N S I O N P R O T E C T I O N F U N D | ANNUAL REPORT AND ACCOUNTS 20 16 / 1 7 P E N S I O N P R O T E C T I O N F U N D | ANNUAL REPORT AND ACCOUNTS 20 16 / 1 7 | 6 7
The certificate and report of the Comptroller and Auditor General
to the Houses of ParliamentI certify that I have audited the financial statements of the Board of the Pension Protection Fund for the year ended 31 March 2017 under the Pensions Act 2004. The financial statements comprise: the Consolidated Statements of Comprehensive Net Income, Financial Position, Cash Flows, Changes in Reserves, and the related notes. These financial statements have been prepared under the accounting policies set out within them. I have also audited the information in the Remuneration and Staff Report and the Parliamentary Accountability disclosures that are described in that report as having been audited.
Respective responsibilities of the Board of the Pension Protection Fund, the Chief Executive and auditorAs explained more fully in the Statement of Accounting Officer’s Responsibilities, the Board of the Pension Protection Fund and the Chief Executive as Accounting Officer are responsible for the preparation of the financial statements and for being satisfied that they give a true and fair view. My responsibility is to audit, certify and report on the financial statements in accordance with the Pensions Act 2004. I conducted my audit in accordance with International Standards on Auditing (UK and Ireland). Those standards require me and my staff to comply with the Auditing Practices Board’s Ethical Standards for Auditors.
Scope of the audit of the financial statementsAn audit involves obtaining evidence about the amounts and disclosures in the financial statements sufficient to give reasonable assurance that the financial statements are free from material misstatement, whether caused by fraud or error. This includes an assessment of: whether the accounting policies are appropriate to the Board of the Pension Protection Fund’s circumstances and have been consistently applied and adequately disclosed; the reasonableness of significant accounting estimates made by the Board of the Pension Protection Fund; and the overall presentation of the financial statements. In addition I read all the financial and non-financial information in the Annual Report to identify material inconsistencies with the audited financial statements and to identify any information that is apparently materially incorrect based on, or materially inconsistent with, the knowledge acquired by me in the course of performing the audit. If I become aware of any apparent material misstatements or inconsistencies I consider the implications for my certificate.
I am required to obtain evidence sufficient to give reasonable assurance that the expenditure and income recorded in the financial statements have been applied to the purposes intended by Parliament and the financial transactions recorded in the financial statements conform to the authorities which govern them.
Opinion on regularityIn my opinion, in all material respects the expenditure and income recorded in the financial statements have been applied to the purposes intended by Parliament and the financial transactions recorded in the financial statements conform to the authorities which govern them.
Opinion on financial statements In my opinion:• the financial statements give a true and fair view of the state of the Board of the Pension Protection Fund’s
affairs as at 31 March 2017 and of the net income for the year then ended; and
• the financial statements have been properly prepared in accordance with the Pensions Act 2004 and Secretary of State directions issued thereunder.
REMU
NER
ATION
AN
D STA
FF REPOR
TA
CC
OU
NTA
BILITY REPO
RT

6 8 | P E N S I O N P R O T E C T I O N F U N D | ANNUAL REPORT AND ACCOUNTS 20 16 / 1 7
AC
CO
UN
TAB
ILITY REPOR
T
The certificate and report of the Comptroller and Auditor General
to the Houses of Parliament
Opinion on other mattersIn my opinion:
• the parts of the Remuneration and Staff Report and the Parliamentary Accountability disclosures to be audited have been properly prepared in accordance with Secretary of State directions made under the Pensions Act 2004; and
• the information given in the Performance Report and Accountability Report for the financial year for which the financial statements are prepared is consistent with the financial statements.
Matters on which I report by exceptionI have nothing to report in respect of the following matters which I report to you if, in my opinion:
• adequate accounting records have not been kept; or
• the financial statements and the parts of the Remuneration and Staff Report and the Parliamentary Accountability disclosures to be audited are not in agreement with the accounting records and returns; or
• I have not received all of the information and explanations I require for my audit; or
• the Governance Statement does not reflect compliance with HM Treasury’s guidance.
ReportI have no observations to make on these financial statements.
Sir Amyas C E Morse Comptroller and Auditor General
National Audit Office157-197 Buckingham Palace RoadVictoriaLondonSW1W 9SP
26 June 2017

P E N S I O N P R O T E C T I O N F U N D | ANNUAL REPORT AND ACCOUNTS 20 16 / 1 7 | 6 96 8 | P E N S I O N P R O T E C T I O N F U N D | ANNUAL REPORT AND ACCOUNTS 20 16 / 1 7
FINA
NC
IAL STATEM
ENTS
The Board of the Pension Protection Fund
Note Ref Page
Financial Statements
Chief Financial Officer’s Review 70
Consolidated Statement of Comprehensive Net Income 73
Consolidated Statement of Financial Position 74
Consolidated Statement of Changes in Reserves 75
Consolidated Statement of Cash Flows 75
Notes to the financial statements
Funds for which the Board is responsible 76
Core accounting policies 77
Paying compensation 79
Liabilities to pay compensation to members 1 79
Provisions for claims on the PPF and the FCF 2 81
Funding compensation – levy income , grant-in-aid and investment management 84
Operating income 3 84
Financial instruments 4 86
Investment return 5 93
Financial risk management 94
PPF credit risk 6 94
PPF liquidity risk 7 96
PPF market risk 8 97
FCF financial risks 9 99
Administration Funds financial risks 10 99
Operating the business 100
Operating expenses 11 100
Property, equipment and intangible assets 12 102
Operating lease commitments 13 103
Segmental analysis 14 103
Subsidiaries 15 105
Related party transactions 16 105
Events after the reporting period 17 105

7 0 | P E N S I O N P R O T E C T I O N F U N D | ANNUAL REPORT AND ACCOUNTS 20 16 / 1 7 P E N S I O N P R O T E C T I O N F U N D | ANNUAL REPORT AND ACCOUNTS 20 16 / 1 7 | 7 1
FINA
NC
IAL STATEM
ENTS
SummaryThe excess of our assets over our liabilities is a measure at a point in time of our progress towards building sufficient reserves to allow for future claims. This can be expressed in terms of the absolute amount of our reserves (£6.1bn) or as a percentage in the form of our funding ratio (121.6 per cent).
The reserves of the PPF have increased from £4.1bn to £6.1bn this year, driven by strong performance from our investment growth portfolio, low levels of claims and the impact of refreshed actuarial assumptions and data.
The investment growth portfolio returned 3.9 per cent for the year. This is above our stated objective of 1.8 per cent above LIBOR and our target to achieve this on a rolling three year basis was exceeded by 1.0 per cent, annualised. Total investment return was 16.0 per cent compared to 1.7 per cent in 2015/16 and 25.9 per cent in 2014/15.
Claim volumes continue to be low with similar volumes to last year although the value of £252.4m is lower than in 2015/16. This is mainly attributable to the two BHS schemes which made up over half of last year’s figure. However, type 2 contingent liabilities (where insolvency events are predicted to happen soon after the year end) remain high and increased from £1.0bn in 2015/16 to £1.3bn in 2016/17 and the claims risk, as measured by the aggregate deficits of all defined benefit schemes in deficit, remains high at £295.4bn.
Note disclosures and commentaryAlongside the principal financial statements and accompanying notes, we present a commentary to highlight and explain important points in a number of the notes. These are identified by a shaded background and are not audited by the Comptroller and Auditor General, but have been reviewed for consistency. These notes comprise an introductory comment (identified by a shaded background and not subject to audit), a summary of accounting policies specific to individual financial statement items (included in a box) and the disclosures.
The report from the Comptroller and Auditor General on pages 67-68 confirms that there are no matters that need to be brought to readers’ attention.
Andy McKinnonChief Financial Officer
Chief Financial Officer’s Review

7 0 | P E N S I O N P R O T E C T I O N F U N D | ANNUAL REPORT AND ACCOUNTS 20 16 / 1 7 P E N S I O N P R O T E C T I O N F U N D | ANNUAL REPORT AND ACCOUNTS 20 16 / 1 7 | 7 1
FINA
NC
IAL STATEM
ENTS
Movement in reserves 2017 (£bn)
The reserves have increased by £2bn in the year. Actuarial assumption changes and corrections to scheme data, net of the impact of changes to the compensation cap for members with long service, have contributed £0.7bn to the increase in reserves.
Net operating surplus, being levy receipts after operating expenses, remains at the same level as last year, is sufficient to cover current year claims of £252.4m. Current year levy income was £569.6m, lower than the forecast of £615m due to lower scheme deficits and improved deficit reduction contributions. Operating expenses were £60.4m, a rise of £5.0m on 2015/16 which arises from investing in technology to support our insourcing strategy. Claim levels continue to be low in number (44 in 2016/17, 47 in 2015/16).
The aim of our liability-driven investment (LDI) hedging strategy is that revaluation of actuarial liabilities is offset by the investment return of the LDI portfolio. This is demonstrated in the chart above were the return on the LDI portfolio broadly matches the revaluation of liabilities. The net investment return on the growth portfolio was £1.0bn.
Review of the Consolidated Statement of Comprehensive Net IncomeThe consolidated statement of comprehensive net income together with the consolidated statement of changes in reserves shows the movement in reserves during the reporting year. These are summarised in the following diagram and further explained in the subsequent commentary.
Chief Financial Officer’s Review
Reserves at March 2016
Assumption and data changes
Net operating surplus
Current year claims
Revaluation of PPF liabilities
and schemes in assessment
Net investment return - LDI
portfolio
Net investment return - growth
portfolio
Reserves at March 2017
6.0
7.0
5.0
4.0
3.0
2.0
1.0
0.0
4.1
0.7
0.5 (0.3)
(2.9) 3.0
1.0
6.1

7 2 | P E N S I O N P R O T E C T I O N F U N D | ANNUAL REPORT AND ACCOUNTS 20 16 / 1 7 P E N S I O N P R O T E C T I O N F U N D | ANNUAL REPORT AND ACCOUNTS 20 16 / 1 7 | 7 3
Movement in actuarial liabilities and claims provisions for schemes in assessment (£bn)
Total liabilities 2016
Benefits paid New claims Exits from SIA
Transfers to PPF
Revaln and other
Total liabilities 2017
27.0
29.0
25.0
23.0
21.0
19.0
17.0
15.0
24.9
(0.7) 0.8(1.8) 1.8
3.1
28.1
FINA
NC
IAL STATEM
ENTS
Chief Financial Officer’s Review
The consolidated statement of financial positionThe consolidated statement of financial position sets out the details at 31 March 2017 of the assets and liabilities held in all the funds for which the Board is responsible.
For schemes in assessment, although the claim has been recognised, the assets and liabilities remain outside of the PPF and the accounting treatment is to include a provision for the net deficit. However, we include the assets and liabilities (calculated on the PPF valuation basis) in full when calculating the funding ratio.
Consolidated reserves at 31 March 2017
Consolidated Statement of Financial Position
excluding claims provisions for schemes
in assessmentClaims provisions for
schemes in assessment Total£m £m £m
Total assets 47,092.8 5,405.8 52,498.6Investment and other liabilities (18,366.8) - (18,366.8)Net assets 28,726.0 5,405.8 34,131.8Actuarial estimate of liabilities (21,979.0) (6,080.2) (28,059.2)Total reserves 6,747.0 (674.4) 6,072.6
The following graph summarises the movements in actuarial liabilities, including those schemes included in the provision for schemes in assessment, from £24.9bn at the beginning of the year to the closing figure of £28.1bn. The actuarial liabilities comprise £28.1bn (2016: £24.9bn) for the PPF and £1.3m (2016: £0.7m) for the FCF.

7 2 | P E N S I O N P R O T E C T I O N F U N D | ANNUAL REPORT AND ACCOUNTS 20 16 / 1 7 P E N S I O N P R O T E C T I O N F U N D | ANNUAL REPORT AND ACCOUNTS 20 16 / 1 7 | 7 3
Consolidated Statement of Comprehensive Net Income
For the year ended 31 March Notes
2017£m
2016£m
Restated*
Operating incomeIncome from levies 3 585.2 558.1Income from grant-in-aid 3 24.9 23.4Total operating income 610.1 581.5
Operating expensesStaff costs 11 (28.0) (27.4)Other costs 11 (32.4) (28.0)Total operating expenses (60.4) (55.4)
Net operating surplus 549.7 526.1
Investment activitiesInvestment income 5 701.8 733.4Change in fair value of investments 5 3,414.8 (296.7)Investment expenses 5 (152.7) (113.5)Net investment return 3,963.9 323.2
Claims activitiesCurrent year claims for compensation 2 (252.4) (475.9)Revaluation of claims for compensation 2 325.5 386.7Losses on actuarial liabilities 1 (2,578.2) (331.7)Net cost of claims (2,505.1) (420.9)
Comprehensive net income for the year 2,008.5 428.4
The Board has no comprehensive income or expenditure other than the comprehensive net income disclosed above. There were no discontinued operations, acquisitions or disposals during this period.
*See Note 3, Income from grant-in-aid.
The accounting policies and notes on pages 76 to 105 form part of these financial statements.
FINA
NC
IAL STATEM
ENTS
The Board of the Pension Protection Fund

74 | P E N S I O N P R O T E C T I O N F U N D | ANNUAL REPORT AND ACCOUNTS 20 16 / 1 7 P E N S I O N P R O T E C T I O N F U N D | ANNUAL REPORT AND ACCOUNTS 20 16 / 1 7 | 7 5
FINA
NC
IAL STATEM
ENTS
Consolidated Statement of Financial Position
As at 31 MarchNotes
2017£m
2016£m
AssetsCash and cash equivalents 43.1 215.4Investment assets 4a 46,957.9 40,488.7
Levy receivables 16.3 4.7
Transfer-in receivables 21.1 25.1
Other assets 45.2 5.1
Property, equipment and intangible assets 12 9.2 9.8Total assets 47,092.8 40,748.8
LiabilitiesInvestment liabilities 4a (18,295.5) (17,089.4)
Other liabilities (70.0) (47.7)
Actuarial liabilities 1 (21,979.0) (18,284.0)Claims provisions 2 (675.7) (1,263.6)Total liabilities (41,020.2) (36,684.7)
Total assets less total liabilities 6,072.6 4,064.1
Represented byTotal levy and tax payer funds 6,072.6 4,064.1
The Board of the PPF approved the accounts on 21 June 2017 and authorised the Accounting Officer to sign this Consolidated Statement of Financial Position on the same date.
Alan Rubenstein Accounting Officer 22 June 2017
The accounting policies and notes on pages 76 to 105 form part of these financial statements.
The Board of the Pension Protection Fund

74 | P E N S I O N P R O T E C T I O N F U N D | ANNUAL REPORT AND ACCOUNTS 20 16 / 1 7 P E N S I O N P R O T E C T I O N F U N D | ANNUAL REPORT AND ACCOUNTS 20 16 / 1 7 | 7 5
FINA
NC
IAL STATEM
ENTS
Consolidated Statement of Changes In Reserves
For the year ended 31 March Levy payer funds
£m
Tax payer funds
£m
Total Reserves
£m
At 1 April 2015 3,636.4 (0.7) 3,635.7Total recognised net income for 2015/16 (Restated)* 429.0 (0.6) 428.4Balance at 31 March 2016 4,065.4 (1.3) 4,064.1Total recognised net income for 2016/17 2,004.7 3.8 2,008.5Balance at 31 March 2017 6,070.1 2.5 6,072.6
The Board of the Pension Protection Fund
Consolidated Statement of Cash Flows
For the year ended 31 March 2017£m
2016£m
Restated*
Cash flows from operating activitiesNet operating surplus 549.7 526.1Compensation payments (661.3) (616.0)Cash receivable from schemes transferring into the PPF 398.3 313.0Items reported in investment return but settled through operating bank accounts
(18.4) (9.1)
Purchase of property, equipment and intangible assets (3.0) (1.0)Depreciation, amortisation and impairment charges 3.6 3.5Movement in current liabilities 22.3 (3.0)Movement in receivables (47.7) 5.2
Net cash inflow from operating activities 243.5 218.7
Cash flows to investment activitiesCash transfers to investment managers (796.1) (2,932.1)Cash transfers from investment managers 380.3 2,751.9
Net cash outflow to investing activities (415.8) (180.2)
Net (decrease)/increase in cash and cash equivalents in the year (172.3) 38.5
Cash and cash equivalents at beginning of the year 215.4 176.9
Cash and cash equivalents at end of the year 43.1 215.4
Cash and cash equivalents are comprised of cash and short term cash deposits.
*See Note 3, Income from grant-in-aid.
The accounting policies and notes on pages 76 to 105 form part of these financial statements.

76 | P E N S I O N P R O T E C T I O N F U N D | ANNUAL REPORT AND ACCOUNTS 20 16 / 1 7 P E N S I O N P R O T E C T I O N F U N D | ANNUAL REPORT AND ACCOUNTS 20 16 / 1 7 | 7 7
Funds for which the Board is responsibleThe Board is a statutory public corporation, sponsored by the Department for Work and Pensions (DWP), incorporated on 6 April 2005 under the Pensions Act 2004. The Act requires the Board to hold and apply statutory funds which constitute the three broad streams in which the financial activities of the Board are accounted for:
• the Pension Protection Fund itself
• the Fraud Compensation Fund
• the Administration Funds.
The Pension Protection Fund (PPF) holds substantially all the Board’s assets and liabilities, receives protection levy income and incurs much of the Board’s costs. Its assets arise from levy income collected, the investment return and assets transferred from schemes for which the PPF has assumed responsibility. The PPF’s principal liabilities are to pension scheme members for whom it has assumed responsibility and a provision for the total estimated value of the deficits of schemes where eventual entry to the PPF is judged probable.
The Fraud Compensation Fund (FCF) receives fraud compensation levies and holds a fund to compensate schemes which have suffered loss due to acts of dishonesty.
The Administration Funds record some of the Board’s administrative expense and the related funding. In its role as manager of the Financial Assistance Scheme (FAS) it administers payments to members of certain defined benefit pension schemes which are ineligible for PPF compensation and manages the transition of these schemes to our administrator and the transfer of the schemes’ assets to the Government.
FINA
NC
IAL STATEM
ENTS
The Board of the Pension Protection Fund

76 | P E N S I O N P R O T E C T I O N F U N D | ANNUAL REPORT AND ACCOUNTS 20 16 / 1 7 P E N S I O N P R O T E C T I O N F U N D | ANNUAL REPORT AND ACCOUNTS 20 16 / 1 7 | 7 7
FINA
NC
IAL STATEM
ENTS
Core accounting policies
This section sets out the core accounting policies which apply throughout the financial statements. Accounting policies specific to particular elements of the financial statements are set out in boxes within the relevant note disclosures. The Board’s core and specific accounting policies have been consistently applied in the current and preceding year.
Basis of preparationThese accounts have been prepared in accordance with an Accounts Direction dated 18 February 2010 issued by the Secretary of State for the Department for Work and Pensions, with the approval of the Treasury, in line with the Pensions Act 2004. The Accounts Direction stipulates compliance with the 2016/17 Government Financial Reporting Manual (FReM), which requires accounts to follow, as far as appropriate, private sector practice based on International Financial Reporting Standards (IFRS).
The accounts have been prepared on the going concern basis under the historical cost convention, except for the measurement at fair value through profit and loss of financial instruments and investment property, deposits with banks at amortised cost and the measurement of compensation benefits and associated provisions at the present value of the obligation.
Accounting standards which are particularly relevant to reporting on the Board’s responsibilities and activities include:• IFRS 7 Financial Instruments: Disclosures• IFRS 13 Fair Value Measurement• IAS 20 Accounting for Government Grants and Disclosure of Government Assistance• IAS 32 Financial Instruments: Presentation• IAS 37 Provisions, Contingent Liabilities and Contingent Assets• IAS 39 Financial Instruments: Recognition and Measurement• IAS 40 Investment Property
Standards which are likely to affect future financial statements include:• IFRS 9 Financial Instruments (currently expected to be effective for periods beginning on or after 1 January 2018).
Among other changes IFRS 9 introduces an expected credit loss model for impairment which will replace the current incurred loss model in IAS 39. An impairment loss may now be recognised prior to a loss event occurring.
• IFRS 16 Leases (effective for the periods beginning on or after 1 January 2019). The new standard replaces IAS 17 Leases and introduces a new single accounting approach for lessees for all leases (with limited exceptions). As a result there is no longer a distinction between operating leases and finance leases, and lessees will recognise a liability to make lease payments and an asset representing the right to use the underlying asset during the lease term. The Board leases a property for use as office space which is currently classified as an operating lease.
It is not practical to provide a reasonable estimate of the impact of these standards until a detailed review has been completed.
Consolidated financial statementsThe financial statements consolidate the financial positions and results of the PPF, the FCF and the Administration Funds. The Board holds some investment assets through subsidiaries formed solely for that purpose. The underlying investments, income and gains and losses are recorded in the total investment portfolio. The subsidiaries are listed in note 15.
Segmental reportingTo comply with IFRS 8 Operating Segments, note 14 summarises the financial transactions and balances of the three separate streams of activity described in the introduction above: the PPF, the FCF and the Administration Funds. Further information is available in the notes on provisions for claims, levy income and operating expenses.

7 8 | P E N S I O N P R O T E C T I O N F U N D | ANNUAL REPORT AND ACCOUNTS 20 16 / 1 7 P E N S I O N P R O T E C T I O N F U N D | ANNUAL REPORT AND ACCOUNTS 20 16 / 1 7 | 7 9
Foreign currency translationThese financial statements are presented in sterling, which is the functional currency of the Board.
Transactions denominated in foreign currency are recorded at the exchange rates prevailing on the dates of the transactions. All assets and liabilities denominated in foreign currencies are translated into sterling at the rates prevailing at the year end. Exchange differences arising on settlement and on retranslation are recognised in change in fair value. Forward foreign exchange contracts are valued at rates prevailing at the year end.
Impact of the Board assuming responsibility for schemesBefore entering the PPF, schemes go through an Assessment Period described at: www.pensionprotectionfund.org.uk/ AssessmentPeriod/Pages/AssessmentPeriod.aspx. Schemes which satisfy the criteria for transfer to the PPF (in particular that they have insufficient assets to meet their protected liabilities) receive a Transfer Notice under section 160 of the Pensions Act 2004, under which all their property, rights and liabilities are transferred to the Board. At the effective date of the Transfer Notice the scheme’s net financial assets are transferred at fair value and its actuarial liabilities are valued using the same policies as apply to the Board’s existing actuarial liabilities. Where the net deficit of a transferring-in scheme has been provided for at the end of the previous reporting period, changes in the value of the deficit due to changes in the value of the scheme’s assets and liabilities from the previous accounting date up to the effective date of the Transfer Notice are accounted for as revaluation of claims.
TaxationBy virtue of the Pension Protection Fund (Tax) Regulations 2006, SI 2006/575, the Board is treated in the same way as UK registered pension schemes. Income from which recoverable withholding tax has been deducted is recorded gross, and the tax recoverable is included in receivables. Where tax withheld cannot be recovered, income is recorded net. The Board does not have to pay tax on its surplus or gains. VAT is normally irrecoverable in the European Union and is recognised as part of the expenditure to which it relates.
Significant estimates and judgementsThe preparation of financial statements requires management to make estimates and assumptions. Actual results could differ from estimates. Information about these judgements and estimates is contained in the relevant accounting policies and notes to the accounts. The key areas of estimation uncertainty are:• actuarial liabilities and gains or losses on actuarial liabilities (note 1)• claims provisions and contingent liabilities (note 2), and• techniques for valuing financial instruments for which there is not a quoted price (note 4).
Core accounting policies
FINA
NC
IAL STATEM
ENTS

7 8 | P E N S I O N P R O T E C T I O N F U N D | ANNUAL REPORT AND ACCOUNTS 20 16 / 1 7 P E N S I O N P R O T E C T I O N F U N D | ANNUAL REPORT AND ACCOUNTS 20 16 / 1 7 | 7 9
Paying compensation
This section describes:
• the PPF’s liabilities to pay compensation to members, and
• provisions and contingent liabilities made for potential claims for schemes to enter the PPF and for schemes to be compensated by the FCF for losses caused by dishonesty.
1. Liabilities to pay compensation to members
The consolidated statement of financial position shows that at 31 March 2017 the PPF estimated the value of existing liabilities to pay compensation to members at £21,979.0m. During the year the PPF paid members compensation of £661.3m. After the Actuarial Valuation as at March 31 2017 was completed, a net loss of £2,578.2m to the income statement was recognised to increase estimated liabilities to the amount needed to pay compensation to members.
The amount of the PPF’s liabilities to pay compensation to members (actuarial liabilities) is calculated by the Appointed Actuary – see the Actuarial Valuation starting on page 107.
The value is impacted by changes in actuarial assumptions, discount rates, operating expenses and other relevant factors, including the payment of benefits during the period.
Accounting policyIn accordance with IAS 37, the Board recognises its best estimate of the expenditure required to pay compensation to members in the future as disclosed in the Actuarial Valuation. This includes:• the present value of the liability to pay compensation to the members, both deferred and retired, of all
pension schemes for which the Board has assumed responsibility, valued on the assumptions set out in the Actuary’s Report
• an allowance for operating expenses permitted to be charged against the PPF, and• a provision for the cost of eliminating inequalities caused by Guaranteed Minimum Pensions (GMPs).Where a member retires before the year end but has not received compensation, the transaction is accounted for as a decrease in the actuarial liabilities on a cash basis.
Key judgements and estimatesThe calculation of the actuarial liabilities of the PPF relies on assumptions about a number of financial and demographic factors, explained in Annex M2 of the Actuarial Valuation. In particular, attention is drawn to the method used to compute a market-consistent discount rate.
FINA
NC
IAL STATEM
ENTS

8 0 | P E N S I O N P R O T E C T I O N F U N D | ANNUAL REPORT AND ACCOUNTS 20 16 / 1 7 P E N S I O N P R O T E C T I O N F U N D | ANNUAL REPORT AND ACCOUNTS 20 16 / 1 7 | 8 1
The change in the total value of actuarial liabilities can be analysed as follows:
The amount of the total actuarial liabilities expected to be settled within 12 months is £624m (2016: £549m). Further details can be found in the Actuarial Valuation on page 115.
Actuarial losses are the net adjustment required to the outstanding amount of actuarial liabilities after accounting for schemes which have transferred into the PPF and the amount of benefits paid during the year. Actuarial losses can be analysed as follows:
Actuarial liabilities 2017 £m
2016 £m
Opening value of actuarial liabilities 18,284.0 17,812.2Actuarial liabilities of schemes which transferred to the PPF during the year 1,778.1 757.0
Decrease in AVCs to be discharged - (0.8)Actuarial losses 2,578.2 331.7Benefits paid to members (661.3) (616.0)Other - (0.1)Total actuarial liabilities 21,979.0 18,284.0
Paying compensation
Actuarial losses 2017 £m
2016 £m
Effect of passage of time on discounting 89.5 92.9Change in assumptions 2,515.2 457.6Change in experience (80.6) (219.7)Other 54.1 0.9Total actuarial losses 2,578.2 331.7
FINA
NC
IAL STATEM
ENTS
8 0 | P E N S I O N P R O T E C T I O N F U N D | ANNUAL REPORT AND ACCOUNTS 20 16 / 1 7 P E N S I O N P R O T E C T I O N F U N D | ANNUAL REPORT AND ACCOUNTS 20 16 / 1 7 | 8 1
Paying compensation
2. Provisions for claims on the PPF and the FCF
The consolidated statement of financial position shows total provisions of £675.7m for claims from pension schemes with £674.4m being for the PPF (see page 82) and £1.3m for the FCF (see page 83). The consolidated statement of comprehensive net income shows net cost of claims of £2,505.1m, £2,504.5m being the PPF and £0.6m being the FCF, and also showed a benefit in a net decrease to the values of claims previously recorded of £325.5m all in relation to the PPF.
The PPF provision relates to schemes in assessment and is calculated by the Appointed Actuary as the present value of estimated future compensation payments to be made by the PPF, less the value of existing assets in such pension schemes. The consolidated statement of comprehensive net income is affected by two elements of claims: the amount of new claims received in the year, and the effect of re-assessing the value of previously reported claims.
The FCF maintains a provision for claims that a pension scheme, with an insolvent sponsor, has lost money through dishonesty.
Accounting policiesThe PPF considers all eligible pension schemes whose sponsoring employers have experienced a qualifying insolvency event before the end of the accounting period. Where eventual entry of the scheme into the PPF is judged probable, the Board recognises a provision.
Where the Board believes no qualifying insolvency event has occurred before the end of the accounting period but nonetheless the event could possibly occur and where it has sufficient information, a contingent liability will be disclosed.
The provision or contingent liability is valued at the net deficit impacting the PPF, that is:• scheme liabilities calculated on the same basis as actuarial liabilities, less• assets under the trustees’ control, including asset recoveries from insolvent employers.
Within the FCF, the Board recognises provisions for claims where it is probable that an eligible pension scheme has suffered a loss due to an act of dishonesty. Where the success of a claim is judged possible, but less than probable, a contingent liability is disclosed.
Key judgements and estimatesThe calculation of the costs of claims on both the PPF and the FCF relies on actuarial assumptions for the valuation of scheme liabilities and techniques such as rolling forward asset values as at a prior date to the Board’s accounting date using investment indices (see page 114 for the PPF).
Claims on the PPFClaims provisions, current year claims for compensation, the revaluation of claims for compensation and the total estimate of contingent liabilities relating to the PPF are summarised on the next page.
FINA
NC
IAL STATEM
ENTS

8 2 | P E N S I O N P R O T E C T I O N F U N D | ANNUAL REPORT AND ACCOUNTS 20 16 / 1 7 P E N S I O N P R O T E C T I O N F U N D | ANNUAL REPORT AND ACCOUNTS 20 16 / 1 7 | 8 3
Claims on the PPF Number of schemes
2017 £m
Number of schemes
2016 £m
Claims provisions at start of year 120 1,262.9 113 1,308.3Current year claims for compensationProtected liabilities 837.4 1,535.9Scheme assets including recoveries (585.6) (1,060.0)Total current year claims for compensation 44 251.8 47 475.9Revaluation of claims for compensationRelease of provision for schemes no longer considered probable for entry
(4) (5.0) (7) (8.5)
Revaluation of provisions brought forward from previous year end
(285.8) (329.4)
Change in provisions for schemes transferring into the Protection Fund during the year
(34.7) (46.7)
Revaluation of claims (325.5) (384.6)Release of provisions for claims transferred to the PPF (62) (514.8) (33) (136.7)Claims provisions at end of year 98 674.4 120 1,262.9
The claims provisions are calculated as the total estimated actuarial liabilities less the total value of assets reported as owned by schemes in assessment at 31 March:
2017 £m
2016 £m
Total estimated actuarial liabilities for schemes in assessment
(6,080.2) (6,664.3)
Total assets owned by schemes in assessment 5,405.8 5,401.4Total net deficits of schemes in assessment (674.4) (1,262.9)
Current year claims for compensation on the PPFCurrent year claims totalled £251.8m (2016: £475.9m) in respect of 44 (2016: 47) schemes. Provisions were made for 42 new schemes (or individual sections of schemes) (2016: 44 schemes) where eventual entry into the PPF is considered probable, and where reliable estimates can be made of the impact on the PPF. Also included are claims in respect of a further 2 schemes (2016: 3 schemes) in assessment estimated to be in surplus at the prior year end but now estimated to be in deficit.
Protected liabilities include provisions for equalisation of GMPs and expenses. The Appointed Actuary’s Supplementary Report, in particular Annex S6, gives further information on these provisions.
Paying compensation
FINA
NC
IAL STATEM
ENTS

8 2 | P E N S I O N P R O T E C T I O N F U N D | ANNUAL REPORT AND ACCOUNTS 20 16 / 1 7 P E N S I O N P R O T E C T I O N F U N D | ANNUAL REPORT AND ACCOUNTS 20 16 / 1 7 | 8 3
Revaluation of claims for compensation on the PPFIn the PPF, of the 120 (2016: 113) schemes for which provisions were made as at the end of the previous year:
• 62 (2016: 32) schemes were transferred into the PPF during the year
• 4 (2016: 7) schemes’ provisions have been released because the Board no longer considers it probable that the schemes will eventually transfer to the PPF, and
• the remaining 54 schemes, or scheme sections, (2016: 74) are judged likely to enter the PPF. The associated provisions have been retained and revalued.
The revaluation of provisions brought forward from the previous year for 2017 includes a write down of the provision for the BHS Pension Schemes. This write down reflects that the schemes remain in assessment but any funding shortfall taken on by the PPF is expected to be reduced under the terms of the settlement agreement.
Release of provisions for claims transferred to the PPFDuring the year 62 schemes (2016: 33) transferred into the PPF. Provisions had been created as at 31 March 2016 in respect of all of these schemes (2016: 32). No schemes which entered assessment during the prior year completed the assessment process during the year and transferred into the PPF (2016: 1).
Contingent liabilities for possible claims on the PPFThe total value of claims on the PPF identified by the Appointed Actuary as reasonably foreseeable at 31 March 2017, net of the value of related scheme assets, was estimated as £1,869.9m (2016: £1,585.1m). This includes an allowance for the impact of changes to the way the PPF compensation cap operates. Further analysis is given in Annex S6 of the Actuarial Valuation.
Claims on the FCFClaims provisions, current year claims for compensation, the revaluation of claims for compensation and the total estimate of contingent liabilities relating to the FCF are summarised below. There was one new claim and no claims were settled.
Number of schemes
2017 £m
Number of schemes
2016 £m
Claims provisions at start of year 2 0.7 2 2.8
Revaluation of claims for compensation - 0.1
New claims 1 0.6 1 -
Release of provisions no longer needed - - (1) (2.2)
Claims provisions at end of year 3 1.3 2 0.7
Contingent liabilities for possible claims on the FCFThe value of possible future claims on the FCF at 31 March 2017 was estimated at £2.5m relating to two schemes (2016: £2.3m relating to one scheme). In addition to these, we are aware of a number of possible claims which may present themselves to the FCF in future but insufficient data is available to asses the potential impact of these claims.
Paying compensation
FINA
NC
IAL STATEM
ENTS

8 4 | P E N S I O N P R O T E C T I O N F U N D | ANNUAL REPORT AND ACCOUNTS 20 16 / 1 7 P E N S I O N P R O T E C T I O N F U N D | ANNUAL REPORT AND ACCOUNTS 20 16 / 1 7 | 8 5
Funding compensation LEVY INCOME, GRANT-IN-AID AND INVESTMENT MANAGEMENT
This section describes how the PPF and the FCF fund their obligations to pay compensation to members.
The PPF’s Statement of Investment Principles (SIP) describes the primary objective as to have sufficient funds to pay compensation to members of eligible pension schemes. The PPF’s funding objective, and managing the financial risks associated with it, is designed to achieve a balance between protecting and securing the compensation payments for current and potential members of schemes that come into the PPF while setting a fair and proportionate levy.
The PPF is funded principally from three main sources:
• private sector defined benefit schemes are charged a protection levy
• certain costs are covered by an administration levy, invoiced by the Pensions Regulator to schemes, which funds payments of grant-in-aid by the DWP to the PPF, and
• funds to pay compensation in the future are invested to earn an investment return.
The FCF is mainly funded by the fraud compensation levy and it has its own SIP.
3. Operating income Opererating income consists of income from levies and income from grant-in-aid.
Income from leviesThe consolidated statement of comprehensive net income shows that total levy income increased by £27.1m to £585.2m, £585.2m for the PPF itself and less than £0.1m for the FCF. The current year PPF levy of £569.6m was £45.4m less than the estimate of £615.0m primarily due to new scheme data showing an improved funding position and the impact of deficit reduction contributions and other risk reduction measures such as contingent assets being greater than assumed. This was offset to a certain extent by higher than anticipated employer insolvency risk as measured by the Experian scores.
The principles, policies and procedures for levy assessment and invoicing are explained at www.pensionprotectionfund.org.uk/levy/Pages/ PensionProtectionLevy.aspx.
Accounting policyProtection levy and fraud compensation levy income is recognised on an accruals basis.
Provisions are made for amounts which may have to be credited or repaid following levy payers’ appeals. Movements on these provisions are accounted for as adjustments to levy income. Invoiced amounts which cannot be collected from schemes are written off to operating expenses.
The Board did not raise a fraud compensation levy in 2016/17 (2015/16: no levy raised). Any levy is collected by the Pensions Regulator on the Board’s behalf.
FINA
NC
IAL STATEM
ENTS

8 4 | P E N S I O N P R O T E C T I O N F U N D | ANNUAL REPORT AND ACCOUNTS 20 16 / 1 7 P E N S I O N P R O T E C T I O N F U N D | ANNUAL REPORT AND ACCOUNTS 20 16 / 1 7 | 8 5
FINA
NC
IAL STATEM
ENTS
Levy income for the year ended 31 March is summarised as follows:
2017 £m
2016 £m
Risk-based levies in respect of the current year 542.8 536.7Scheme-based levies in respect of the current year 26.8 24.2Total protection levies in respect of the current year 569.6 560.9Risk-based levies in respect of prior years 15.5 (3.2)Scheme-based levies in respect of prior years 0.1 0.4Total protection levies in respect of prior years 15.6 (2.8)Income from protection levies 585.2 558.1Income from fraud compensation levy - -Total income from levies 585.2 558.1
Risk-based levies in respect of prior years include £20.4m relating to a review of prior year invoices for schemes where there is a question about whether they have a last man standing scheme structure. Last man standing schemes are multi-employer schemes with rules that do not include an option or requirement to segregate assets if an employer ceases to participate but are not centralised schemes.
Income from grant-in-aidThe consolidated statement of comprehensive net income shows that income from grant-in-aid increased by £1.5m to £24.9m. Grant-in-aid is received from the DWP to fund operational expenses of the PPF and FAS. Grant-in-aid from the DWP relating to the PPF is funded by an administration levy applied to eligible UK pension schemes.
Accounting policyIncome from grant-in-aid is recognised in the period in which the grant-in-aid is received in accordance with IAS 20 as directed by the FReM.
Grant-in-aid income for the year ended 31 March is summarised as follows:
2017 £m
2016 £m
Levy payer funds 13.2 17.5Tax payer funds 11.7 5.9Total 24.9 23.4
Following the PPF’s classification as a public corporation, income from grant-in-aid is now shown as operating income in accordance with the FReM. In previous years grant-in-aid was shown as an increase in reserves. As a result of this restatement the net operating surplus and comprehensive net income for the year ended 31 March 2016 have increased by £23.4m from the previously disclosed values of £502.7m and £405.0m respectively. This change had a nil effect on the balance of reserves as at 31 March 2016.
Funding compensation LEVY INCOME, GRANT-IN-AID AND INVESTMENT MANAGEMENT

8 6 | P E N S I O N P R O T E C T I O N F U N D | ANNUAL REPORT AND ACCOUNTS 20 16 / 1 7 P E N S I O N P R O T E C T I O N F U N D | ANNUAL REPORT AND ACCOUNTS 20 16 / 1 7 | 8 7
Funding compensation LEVY INCOME, GRANT-IN-AID AND INVESTMENT MANAGEMENT
4. Financial instrumentsFinancial instruments are categorised as financial assets and financial liabilities. Financial assets are a contractual right to receive cash or another financial asset from another entity. Financial liabilities are a contractual obligation to deliver cash or another financial asset to another entity. Financial instruments comprise investments, cash and cash equivalents, levy receivables, transfer-in receivables and, other assets and liabilities.
Accounting policyClassificationFinancial instruments are classified at initial recognition as one of:• Financial assets or liabilities at fair value through profit or loss, separated by:
(a) those designated at fair value through profit or loss upon initial recognition and(b) those classified as held for trading (mainly derivatives - interest rate swaps, inflation rate swaps, options,
credit default swaps and forward foreign exchange contracts to support liability-driven investment)• Other financial assets or liabilities categorised as:
(a) Loans and receivables(b) Financial liabilities held at amortised cost
Recognition and derecognitionFinancial assets and liabilities at fair value through profit and loss are recognised initially on trade date. Other financial assets and liabilities are recognised on the date they are originated. Financial assets are derecognised when the right to receive cash flows has expired or the Board has transferred substantially all the risks and rewards of ownership or control of the asset. Financial liabilities are derecognised when the obligation to deliver cash or another financial asset is discharged or cancelled, or expires.
Securities sold subject to repurchase agreements remain on the consolidated statement of financial position and a liability is recorded for the consideration received.
MeasurementFinancial assets and liabilities at fair value through profit and loss are measured at fair value, defined as the price that would be received to sell an asset or paid to transfer a liability in an orderly transaction between market participants at the measurement date.
Quoted securities and other exchange-traded assets, including derivative contracts, are valued at closing prices at the end of the reporting period. Prices used are the bid price or last traded price depending on the convention of the stock exchange or other market on which they are quoted. Pooled investment vehicles are valued at closing bid or single prices as appropriate. Assets for which a recognised investment exchange does not exist are valued at a fair value estimated by the Board’s appointed fund managers or other appropriately qualified professional adviser. Some bond and other debt assets are designated at fair value through profit and loss upon initial recognition but use amortised cost as a proxy for fair value. Where possible, the resulting valuations are validated by the Board’s custodian. Derivative contracts which are not exchange-traded (often referred to as over-the-counter contracts) are valued at prices calculated by a pricing agent (and compared to the fund managers’ own valuations) using valuation methodologies based on market sources as described below.
Other financial assets and liabilities are measured on an historic cost basis.
Key judgements and estimatesThe choice of valuation technique and inputs to the valuation methodology (whether based on observable market data or not) are matters of judgment and involve the use of estimates. The amounts eventually realised from these financial instruments may differ from the estimated values disclosed in these accounts.
FINA
NC
IAL STATEM
ENTS

8 6 | P E N S I O N P R O T E C T I O N F U N D | ANNUAL REPORT AND ACCOUNTS 20 16 / 1 7 P E N S I O N P R O T E C T I O N F U N D | ANNUAL REPORT AND ACCOUNTS 20 16 / 1 7 | 8 7
Funding compensation LEVY INCOME, GRANT-IN-AID AND INVESTMENT MANAGEMENT
FINA
NC
IAL STATEM
ENTSClassification of financial instruments at 31 March 2017
Financial instruments designated at fair value
through profit and
loss
Financial instruments
held for trading
Total financial
instruments measured at
fair value
Loans and receivables
Financial liabilities
held at amortised
cost
Total financial
instruments
£m £m £m £m £m £mNet investment portfolio 26,937.4 (1,039.8) 25,897.6 3,097.9 (333.1) 28,662.4Cash and cash equivalents - - - 43.1 - 43.1Levy receivables - - - 16.3 - 16.3Transfer-in receivables - - - 21.1 - 21.1Other assets - - - 0.5 - 0.5Other liabilities - - - - (68.0) (68.0)
26,937.4 (1,039.8) 25,897.6 3,178.9 (401.1) 28,675.4
Classification of financial instruments at 31 March 2016
Financial instruments designated at fair value
through profit and
loss
Financial instruments
held for trading
Total financial
instruments measured at
fair value
Loans and receivables
Financial liabilities
held at amortised
cost
Total financial
instruments
£m £m £m £m £m £mNet investment portfolio 21,484.5 (1,061.2) 20,423.3 3,320.8 (344.8) 23,399.3Cash and cash equivalents - - - 215.4 - 215.4Levy receivables - - - 4.7 - 4.7Transfer-in receivables - - - 25.1 - 25.1Other assets - - - 3.6 - 3.6Other liabilities - - - - (45.2) (45.2)
21,484.5 (1,061.2) 20,423.3 3,569.6 (390.0) 23,602.9

8 8 | P E N S I O N P R O T E C T I O N F U N D | ANNUAL REPORT AND ACCOUNTS 20 16 / 1 7 P E N S I O N P R O T E C T I O N F U N D | ANNUAL REPORT AND ACCOUNTS 20 16 / 1 7 | 8 9
4a. Net investment portfolio
The consolidated statement of financial position shows that at the year end the PPF and the FCF together had gross investment assets valued at £46,957.9m and investment liabilities of £18,295.5m, a net investment portfolio of £28,662.4m. The consolidated statement of comprehensive net income shows a net investment return (income and gains less investment expenses) of £3,963.9m.
The Board’s approach to investment is summarised in the Statement of Investment Principles (http://www.pensionprotectionfund.org.uk/DocumentLibrary/Documents/SIP_December_2016.pdf) (SIP) which summarises investment management governance, objectives, risk management, strategy, fund management and custody. The FCF has its own SIP. The day to day fund management of the assets is performed by external fund managers and an in-house team of investment professionals.
The Board holds a wide range of investment assets and liabilities including UK Government bonds, bonds issued by other governments and corporate entities, public equity and alternative investments. To help manage the risks associated with its long-term liabilities to pay compensation to members, the Board has a programme of UK Government bonds sale and repurchase agreement transactions and derivatives (principally interest rate and inflation swaps). The Performance Report ‘Managing our balance sheet’ section (pages 22-24) comments on the PPF’s investment performance.
Funding compensation LEVY INCOME, GRANT-IN-AID AND INVESTMENT MANAGEMENT
FINA
NC
IAL STATEM
ENTS

8 8 | P E N S I O N P R O T E C T I O N F U N D | ANNUAL REPORT AND ACCOUNTS 20 16 / 1 7 P E N S I O N P R O T E C T I O N F U N D | ANNUAL REPORT AND ACCOUNTS 20 16 / 1 7 | 8 9
Funding compensation LEVY INCOME, GRANT-IN-AID AND INVESTMENT MANAGEMENT
FINA
NC
IAL STATEM
ENTSThe change over the year in the net investment portfolio is summarised as follows:
2016 Assets transferred
from schemes in assessment
Net purchases/
(sales)
Net gains/ (losses)
Other movements
2017
£m £m £m £m £m £mAnnuities 353.6 40.2 (0.1) (5.1) (0.5) 388.1Corporate Bonds 2,374.2 30.5 302.7 327.9 (142.4) 2,892.9Index-linked Corporate Bonds 256.5 - 91.3 47.3 (11.2) 383.9Government Bonds 11,895.5 284.4 1,348.1 1,330.5 (110.3) 14,748.2Index-linked Government Bonds 1,870.2 217.6 (334.1) 448.9 7.3 2,209.9Other debt 2,691.2 16.0 278.1 607.6 84.2 3,677.1Equities 1,939.1 22.4 (182.3) 363.2 (20.3) 2,122.1Private equity 796.0 2.0 62.0 187.8 (47.1) 1,000.7GTAA 597.4 - 10.5 (6.7) - 601.2Investment property funds 829.8 17.7 (38.0) 46.2 50.8 906.5Investment property held directly 637.6 - (20.5) 6.4 0.1 623.6Infrastructure 204.1 50.3 152.5 35.4 16.6 458.9Timberland & farmland 199.5 - 101.8 61.1 - 362.4
24,644.7 681.1 1,772.0 3,450.5 (172.8) 30,375.5
Other investment assetsUnsettled trades 63.1 117.7Derivatives 12,523.2 13,484.5Cash at fund managers 3,157.0 2,869.3Accrued income 100.7 110.9Total investment assets 40,488.7 46,957.9
Other investment liabilitiesUnsettled trades (344.8) (333.1)Derivatives (13,584.4) (14,524.3)Repurchase agreements (3,160.2) (3,438.1)Total investment liabilities (17,089.4) (18,295.5)Net investment portfolio 23,399.3 28,662.4
The 2016 categories have been expanded from that shown in prior years to provide further information.
Other movements include amortisation, corporate actions and minor reclassifications. Assets transferred are in specie movements from schemes coming into the PPF.
The amount of the net investment portfolio expected to be recovered or settled within 12 months are assets of £3,528.7m and liabilities of £4,013.2m (2016: assets of £3,491.8m and liabilities of £3,672.5m).

9 0 | P E N S I O N P R O T E C T I O N F U N D | ANNUAL REPORT AND ACCOUNTS 20 16 / 1 7 P E N S I O N P R O T E C T I O N F U N D | ANNUAL REPORT AND ACCOUNTS 20 16 / 1 7 | 9 1
4b. Financial instruments measured at fair valueThe following tables and disclosures analyses the financial instruments of the PPF and the FCF in accordance with IFRS 13 to reflect the significance of inputs used in assessing fair value.
Level 1 instruments are valued by reference to quoted prices in active markets for identical assets.
Level 2 instruments are valued using valuation techniques utilising inputs (other than quoted prices taken directly from markets) observable either directly (e.g. through market information price feeds) or indirectly (i.e. derived from market rates, prices and other data). Level 2 assets consist mainly of:• sovereign and corporate debt instruments• managed funds investing in securities and properties• derivatives, and• repurchase agreement liabilities.
Sovereign and corporate debt instruments are valued using prices provided by price aggregation services which source prices from authorised brokers and dealers. These debt instruments are readily realisable.
Holdings of managed funds are normally valued based on unit prices based on current net asset values of the underlying assets. Derivative assets and liabilities are valued using discounted cash flow and options pricing models. These models use as their basis independently sourced market parameters including, for example, interest rate yield curves, inflation rates, option volatilities and currency rates.
The valuation of repurchase agreement liabilities reflects amounts borrowed from counterparties.
Level 3 instruments are valued using valuation techniques utilising unobservable inputs. Level 3 assets are largely private equity funds and other funds not traded in active markets. These funds are asked to supply audited annual accounts which are mostly presented in accordance with IFRS or US generally accepted accounting principles. Insurance policy assets are valued by the PPF using actuarial models.Various valuation techniques are used to value Level 3 instruments. The diversity of instruments held and techniques used makes the disclosure of quantative information including the sensitivity of fair value measurement to significant unobservable inputs impractical.
Funding compensation LEVY INCOME, GRANT-IN-AID AND INVESTMENT MANAGEMENT
FINA
NC
IAL STATEM
ENTS

9 0 | P E N S I O N P R O T E C T I O N F U N D | ANNUAL REPORT AND ACCOUNTS 20 16 / 1 7 P E N S I O N P R O T E C T I O N F U N D | ANNUAL REPORT AND ACCOUNTS 20 16 / 1 7 | 9 1
Funding compensation LEVY INCOME, GRANT-IN-AID AND INVESTMENT MANAGEMENT
FINA
NC
IAL STATEM
ENTSFinancial instruments measured at fair value at 31 March 2017
Level 1 £m
Level 2 £m
Level 3 £m
Total £m
Annuities - - 388.1 388.1Corporate Bonds 1.8 2,276.8 614.3 2,892.9Index-linked Corporate Bonds - 285.7 98.2 383.9Government Bonds - 14,748.2 - 14,748.2Index-linked Government Bonds - 2,207.0 2.9 2,209.9Other debt 316.0 2,551.6 809.5 3,677.1Equities 1,583.7 528.3 10.1 2,122.1Private equity - - 1,000.7 1,000.7GTAA - 601.2 - 601.2Investment property funds 104.4 462.2 339.9 906.5Investment property held directly - - 623.6 623.6Infrastructure - - 458.9 458.9Timberland & farmland - - 362.4 362.4Derivatives (1.1) (1,038.7) - (1,039.8)Repurchase agreements - (3,438.1) - (3,438.1)Total 2,004.8 19,184.2 4,708.6 25,897.6
Financial instruments measured at fair value at 31 March 2016Level 1
£mLevel 2
£mLevel 3
£mTotal
£m
Annuities - - 353.6 353.6Corporate Bonds 9.0 2,122.1 243.1 2,374.2Index-linked Corporate Bonds 9.1 221.5 25.9 256.5Government Bonds - 11,895.5 - 11,895.5Index-linked Government Bonds - 1,866.3 3.9 1,870.2Other debt 301.4 1,875.7 514.1 2,691.2Equities 1,287.8 644.7 6.6 1,939.1Private equity - 20.2 775.8 796.0GTAA - 597.4 - 597.4Investment property funds - 600.1 229.7 829.8Investment property held directly - 637.6 - 637.6Infrastructure - - 204.1 204.1Timberland & farmland - - 199.5 199.5Derivatives (5.5) (1,055.7) - (1,061.2)Repurchase agreements - (3,160.2) - (3,160.2)Total 1,601.8 16,265.2 2,556.3 20,423.3

9 2 | P E N S I O N P R O T E C T I O N F U N D | ANNUAL REPORT AND ACCOUNTS 20 16 / 1 7 P E N S I O N P R O T E C T I O N F U N D | ANNUAL REPORT AND ACCOUNTS 20 16 / 1 7 | 9 3
The following table summarises the movement between opening and closing balances of Level 3 financial instruments: Level 3 financial instruments
2017 £m
2016 £m
Balance at start of year 2,556.3 1,314.1Gains included in the statement of comprehensive net income 583.2 152.0Purchases and assets transferred in 1,303.2 1,191.3Sales (328.8) (62.1)Transfers into Level 3 840.4 -Transfers out of Level 3 (245.7) (39.0)Balance at end of year 4,708.6 2,556.3
Transfers into Level 3 during the year relate to investment property held directly reclassified from Level 2. Transfers out of Level 3 during the year relate to corporate bonds and other debt reclassified to Level 2.
In addition to the above, £106.2m of assets previously shown as Level 2 were transfered to Level 1 in relation to corporate bonds and investment property funds.
4c. Investment property held directly
Accounting policyInvestment properties held directly are measured initially at cost, including transaction costs. The PPF follows the fair value model option in IAS 40 Investment Property. Investment properties are valued at their fair value by independent valuers with recognised and relevant qualifications and recent and relevant experience. Gains or losses arising from a change in the fair value are recognised in the consolidated statement of comprehensive net income for the period in which they arise.
At 31 March 2017, the Board owned 32 (2016: 31) commercial properties in the UK, with a total fair value of £623.6m (2016: £637.6m). Rental income recognised was £32.8m (2016: £30.3m). Direct operating expenses were not material. There were no restrictions on the realisability of property, income or disposal proceeds.
As at the year end total future rental income under the leases were:
2017 £m
2016 £m
Not later than one year 32.1 31.2Later than one year and not later than five years 127.0 125.8Later than five years 422.7 449.9Total 581.8 606.9
4d. Change of treatment for non-current assets held for saleThe Board received 25 per cent of the issued capital of Harworth Group plc in 2014/15. The Board is entitled to appoint a director at the company but does not consider it can exert significant influence over its operations. The Board disclosed this investment as a non-current asset held for sale as at 31 March 2016 but now considers that it is not probable that the investment will be sold within 12 months which is required by IFRS 5 for this classification. As such the investment is shown as an equity investment and valued at fair value in the financial statements.
Funding compensation LEVY INCOME, GRANT-IN-AID AND INVESTMENT MANAGEMENT
FINA
NC
IAL STATEM
ENTS

9 2 | P E N S I O N P R O T E C T I O N F U N D | ANNUAL REPORT AND ACCOUNTS 20 16 / 1 7 P E N S I O N P R O T E C T I O N F U N D | ANNUAL REPORT AND ACCOUNTS 20 16 / 1 7 | 9 3
Funding compensation LEVY INCOME, GRANT-IN-AID AND INVESTMENT MANAGEMENT
FINA
NC
IAL STATEM
ENTS5. Investment return
Accounting policyInvestment income is accounted for on an accruals basis, that is:• interest income arising from cash deposits, fixed and variable interest securities and similar investments is
accounted for using the effective interest rate method, and• dividends and distributions are accounted for when the dividend or distribution is declared.
Change in fair value of investments includes:• gains and losses realised on the disposal of investments• unrealised gains and losses on investments held at the accounting date, that is the difference between
acquisition cost and current fair value, and• gains and losses arising on the translation of investments (including cash, payables and receivables)
denominated in foreign currencies into sterling.
Investment expenses are accounted for on an accruals basis.
Net investment
income
Change in fair
value of investment
Total2017
Net investment
income
Change in fair
value of investment
Total2016
£m £m £m £m £m £mInvestment returnFinancial instruments designated at fair value through profit and loss
560.2 3,513.1 4,073.3 474.4 633.5 1,107.9
Financial instruments held for trading
95.4 (119.3) (23.9) 255.3 (892.6) (637.3)
Interest from loans and receivables 46.2 16.4 62.6 3.7 (32.1) (28.4)Financial liabilities held at amortised cost
- 4.6 4.6 - (5.5) (5.5)
Total investment return 701.8 3,414.8 4,116.6 733.4 (296.7) 436.7
Total investment expensesFund management fees (140.4) (105.5)Custody charges (1.8) (1.8)Transaction costs (10.5) (6.2)Total investment expenses (152.7) (113.5)Net investment return 3,963.9 323.2

9 4 | P E N S I O N P R O T E C T I O N F U N D | ANNUAL REPORT AND ACCOUNTS 20 16 / 1 7 P E N S I O N P R O T E C T I O N F U N D | ANNUAL REPORT AND ACCOUNTS 20 16 / 1 7 | 9 5
Managing the payment and funding of member compensation described in the previous sections involves financial risk. The most important categories of financial risk, and the ways in which the Board manages them, are described in Section 4 of the PPF SIP (www.pensionprotectionfund.org.uk/DocumentLibrary/Documents/SIP_December_2016.pdf).
A number of the risks described in the SIP come from holding financial instruments about which further disclosure is given below as required by IFRS 7
• PPF credit risk (which also includes SIP counterparty risk) – note 6
• PPF liquidity risk – note 7
• PPF market risk (which includes SIP valuation risk and currency risk) – note 8
These disclosures are followed by notes on:
• FCF financial risks – note 9
• Administration Funds financial risks – note 10
6. PPF credit riskCredit risk is the risk that an issuer or a counterparty to a financial instrument will cause a financial loss for the PPF by failing to discharge an obligation. The main exposure to credit risk in the PPF’s financial instruments arises from investments in government bonds, corporate bonds and other debt instruments. The PPF is also exposed to credit risk on derivatives, insurance policies, cash, transfer-in receivables and other receivables.
The principal elements of the PPF’s internal policy for managing credit risk include:• counterparties to derivative contracts are subject to overall exposure limits and where rated
below A- are subject to increased collateral requirements• a range of limits apply to counterparties to derivatives contracts and repurchase agreements• fund managers invest in credit-sensitive products within guidelines as set in the investment
management agreement• investment management agreements require fund managers to deal with the highest-rated
counterparties consistent with best execution, and• collateral is taken under the terms of the relevant CSA to the ISDA Master Agreement.
The Board is satisfied that credit exposure is in accordance with the risk appetite described in the SIP.
Financial risk management
FINA
NC
IAL STATEM
ENTS

9 4 | P E N S I O N P R O T E C T I O N F U N D | ANNUAL REPORT AND ACCOUNTS 20 16 / 1 7 P E N S I O N P R O T E C T I O N F U N D | ANNUAL REPORT AND ACCOUNTS 20 16 / 1 7 | 9 5
As at 31 March 2017, the rating distribution of the fixed income investment portfolio (excluding UK gilts and derivatives) was as follows:
Fixed Income Portfolio Allocation (£7.3bn) by Rating Category
Fixed Income Portfolio Allocation (£7.3bn) by Asset Type
Global SovereignGlobal CreditHybrid AssetsEmerging Market DebtAbsolute Return Bonds
18%
24%18%
8%
32%
4%
AAAAAABBBBelow BBB or not rated
26%
28% 18%
24%
Within fixed income, the Global Sovereign portfolio is further analysed below:
AAAAAABBB
Government Sovereign Allocation (£1.8bn) by Rating Category
USJapanFranceItalyGermanySpainRest of World
44%
23%
8%
7%
6%
8%4%
Global Sovereign Allocation (£1.8bn) by Country
A one basis point move in credit spread (CS01) across the Fund’s fixed income portfolio results in a change in market value of approximately £5.3m, the largest contributors to this being Hybrid Assets and Global Credit.
Levy receivables at 31 March are summarised below. ‘Past due’ is defined as older than 28 days, the time allowed to levy payers either to pay or to request a review of their levy invoice.
Not yet due
£m
Up to 3 months
past due£m
3-6 months past due
£m
Over 3-6 months
past due£m
Total
£m
2017 8.4 0.4 0.1 7.4 16.3
2016 1.2 1.1 0.6 1.8 4.7
FINA
NC
IAL STATEM
ENTS
Financial risk management
11%
23%
12%
54%

9 6 | P E N S I O N P R O T E C T I O N F U N D | ANNUAL REPORT AND ACCOUNTS 20 16 / 1 7 P E N S I O N P R O T E C T I O N F U N D | ANNUAL REPORT AND ACCOUNTS 20 16 / 1 7 | 9 7
7. PPF liquidity riskLiquidity risk is the possibility that the PPF has insufficient cash available to:• settle its financial liabilities including repurchase agreements when they fall due• pay compensation to members• pay for staff and other operating expenses• meet investment commitments to fund managers, for example, capital calls on private equity and
infrastructure investments, and purchases of investment property, or• meet collateral calls on the derivative portfolio.
Cash requirements and operational cash balances are forecast regularly. Significant amounts of financial instruments could readily be liquidated should the need arise. Additionally, we have a liquidity risk dashboard and contingency/action plans should the PPF be threatened by liquidity risk issues.
Financial liabilitiesFinancial liabilities are all due within one year, except for derivative financial instruments. The maturity profile of derivative financial instruments is as follows:
Within 1 year£m
1-5 years£m
5-10 years£m
Over 10 years£m
Total£m
2017 242.0 428.0 502.8 13,351.5 14,524.3
2016 197.9 355.8 599.3 12,431.4 13,584.4
Paying compensation to membersFuture payments to members are projected in estimating the actuarial liabilities reported in the consolidated statement of financial position – see note 1 and the Actuarial Valuation. Payments to members in the year totalled £661.3m (2016: £616.0m).
Collateral arrangementsAt 31 March, the following assets were subject to collateral and similar arrangements with counterparties:
2017 £m
2016 £m
UK Government securities subject to sale and repurchase agreements 6,091.2 6,634.0
Securities lent to market counterparties 550.6 190.6
Total assets provided subject to collateral and similar arrangements with counterparties 6,641.8 6,824.6
Funds received as collateral for sale and repurchase agreements 3,438.1 3,160.2
Collateral received from counterparties 571.5 198.1
Total assets received subject to collateral and similar arrangements from counterparties 4,009.6 3,358.3
Financial risk management
FINA
NC
IAL STATEM
ENTS

9 6 | P E N S I O N P R O T E C T I O N F U N D | ANNUAL REPORT AND ACCOUNTS 20 16 / 1 7 P E N S I O N P R O T E C T I O N F U N D | ANNUAL REPORT AND ACCOUNTS 20 16 / 1 7 | 9 7
Capital commitmentsCommitments to pay capital calls to fund managers at 31 March totalled:
2017 2017 £m
2016 2016 £m
Denominated in US dollars $2,054.7m 1,645.5 $1,730.1m 1,204.0
Denominated in Euros €652.8m 554.4 €265.5m 210.6
Denominated in Australian dollars A$149.4m 91.5 A$65.4m 35.0
Denominated in Sterling £56.1m 56.1 £80.8m 80.8
Total 2,347.5 1,530.4
8. PPF market riskMarket risk is the risk that the fair value future cash flows of a financial instrument will fluctuate due to changes in market prices, and includes price risk, interest rate risk and currency risk.
Overall exposure to market risk is managed and illustrated in a number of ways. Annex S5 of the Appointed Actuary’s Supplementary Report illustrates the sensitivity of the values of the the Protection Fund’s assets and liabilities to changes in the rates of a wide variety of financial and non-financial factors. The scenarios modelled in this analysis cover changes in interest rates, changes in inflation rates (including where CPI rates diverge from RPI), changes in UK Government bond yields and changes in mortality assumptions and other demographic factors.
We estimate the sensitivity of the Protection Fund’s financial position to adverse changes in financial markets using a value at risk analysis as part of calculating the risk-based levy. The approach is described in the document Pension Protection Fund Consultation: Guidance for the Bespoke Investment Risk Calculation (www.pensionprotectionfund.org.uk/DocumentLibrary/ Documents/1516_investment_risk_guidance.pdf).
Annexes S5 and S7 of the Actuary’s Supplementary Report models the sensitivity of the Protection Fund’s assets and liabilities to changes in the rates of a wide variety of financial and non-financial factors including interest rates, inflation rates, changes in market prices and mortality assumptions.
We measure, monitor and manage our market risk exposures using a combination of sensitivities, spread measures, tail risk measures and stress tests. Sensitivities we use encompass metrics such as PV01, IE01, convexity, CS01, CS1% and equity delta. For spread measures we typically use vol (i.e. standard deviation) and tracking error (standard deviation of differences of returns relative to benchmark) on a historical basis. For tail risk measures, we use measures such as VaR and expected shortfall, also on a historical basis, typically at a 95 per cent confidence level. Where we want to look at the potential impact of an event or specified shock on the portfolio as a whole, we run stress tests to enable us to quantify the net income impact.
Price risk
Price risk is the risk that the fair value or future cash flows of a financial instrument will fluctuate because of changes in market prices (other than those arising from interest rate risk or currency risk), whether those changes are caused by factors specific to the individual financial instrument or its issuer, or factors affecting similar financial instruments traded in the market. The PPF’s financial instruments are carried at fair value and fair value changes are recognised in the consolidated statement of comprehensive net income, therefore all changes in market conditions will directly affect total investment return.
The Board manages price risk by diversifying its investments across a range of asset types, both within the UK and globally, and sets asset allocation guidelines for the fund managers as per the table on the next page at 31 March.
Financial risk management
FINA
NC
IAL STATEM
ENTS

9 8 | P E N S I O N P R O T E C T I O N F U N D | ANNUAL REPORT AND ACCOUNTS 20 16 / 1 7 P E N S I O N P R O T E C T I O N F U N D | ANNUAL REPORT AND ACCOUNTS 20 16 / 1 7 | 9 9
Asset class 2017£m
Actual%
Tolerancerange
Global bonds 5,104.0
UK bonds and cash 12,607.1
Cash and bonds 17,711.1 63.0% 53%-70%
Public equity 2,094.2 7.5% 3%-12%
Alternatives (including property) 5,907.8 21.0% 15%-27%
Hybrid assets 2,376.1 8.5% 0%-15%
Total assets allocated per SIP 28,089.2 100.0%
Alongside the strategic allocation, the SIP permits tactical investment views to enhance return or to control risk, within the overall risk appetite set by the Board. The actual investment values disclosed above incorporate tactical positions held at 31 March 2017 but exclude assets and liabilities held solely for hedging purposes.
Interest rate riskInterest rate risk is the risk that the fair value or future cash flows of a financial instrument will fluctuate because of changes in market interest rates.
The valuation of the PPF’s liabilities is sensitive to movements in interest rates. This interest rate risk is hedged as part of the liability-driven investment (LDI) programme. The fixed income assets in which the PPF invests as part of its SIP are also sensitive to movements in interest rates.
Currency riskCurrency risk is the risk that the fair value or future cash flows of a financial instrument will fluctuate because of changes in foreign exchange rates. The PPF’s liabilities are in sterling. The PPF’s investment policy is to operate a currency management strategy to apply an optimal currency hedging ratio based on the characteristics of the related asset classes. At 31 March the residual unhedged foreign currency exposure is as follows:
Asset class 2017£m
2017%
2016£m
2016%
Euro 186.1 16.7% 173.4 20.8%
US dollar 331.9 29.9% 328.6 39.3%
Australian dollar 73.8 6.6% 44.4 5.3%
Other currencies 519.2 46.8% 288.8 34.6%
Total 1,111.0 100.0% 835.2 100.0%
Financial risk management
FINA
NC
IAL STATEM
ENTS

9 8 | P E N S I O N P R O T E C T I O N F U N D | ANNUAL REPORT AND ACCOUNTS 20 16 / 1 7 P E N S I O N P R O T E C T I O N F U N D | ANNUAL REPORT AND ACCOUNTS 20 16 / 1 7 | 9 9
Financial risk management
FINA
NC
IAL STATEM
ENTS9. FCF financial risks
The FCF has £11.3m (2016: £11.3m) of money market funds and provisions valued at £1.3m (2016: £0.7m). The Board’s policy is to build up a small reserve in the Fund by raising levies over a number of years. The FCF is at risk of a large and urgent claim, or a number of such claims occurring closely together. The Board considers this possibility unlikely however, and does not consider it proportionate to build up a large reserve, which would help to mitigate the risk, at the expense of levy payers.
Credit risk – The FCF’s funds are principally invested in units in liquidity funds managed by external fund managers.
Liquidity risk – The FCF is not exposed to significant liquidity risks as assets are readily realisable. Additionally, the time required to assess new claims would allow the FCF to raise any further levy income needed.
Market risk – The FCF’s holdings in money market funds are subject to some price risk and interest rate risk. Claims can include variable rate interest for the period between the effective date of loss and the date of compensation.
10. Administration Funds financial risksDue to the non-trading nature of the Board of the Pension Protection Fund’s administration activities and the way it is financed, the Board is not exposed in this area to the degree of financial risk faced by business entities.

1 0 0 | P E N S I O N P R O T E C T I O N F U N D | ANNUAL REPORT AND ACCOUNTS 20 16 / 1 7 P E N S I O N P R O T E C T I O N F U N D | ANNUAL REPORT AND ACCOUNTS 20 16 / 1 7 | 1 0 1
FINA
NC
IAL STATEM
ENTS This section explains the elements of the consolidated financial statements which relate to operating the PPF’s
business, including operating expenses and infrastructure, and gives other required disclosures.
11. Operating expenses Operating income consists of income from levies and income from grant-in-aid.
Operating expenses have increased by £5.0m to £60.4m. The insourcing of key functions has required an investment in IT support costs but lower spend on member services and a saving of 14 per cent on external fund managers fees in the LDI portfolio compared to a 30 per cent increase in LDI assets under management during the year.
Total operating expenses are allocated to three funds: the PPF itself, the PPF Administration Fund and the FAS Administration Fund. The PPF is charged with the costs of creating and maintaining records of members entitled to PPF compensation, running payrolls to pay compensation and verifying data for the purposes of creating and maintaining data and running payrolls, investment costs and insolvency costs. Other costs are charged, as appropriate, to the PPF Administration Fund or the FAS Administration Fund.
Total operating expenses are summarised as follows:
Pension Protection
Fund£m
PPFAdministration
Fund£m
FASAdministration
Fund£m
2017£m
Staff costsWages and salaries 13.5 4.9 1.6 20.0Social security costs 1.6 0.5 0.2 2.3Other pension costs 2.3 1.0 0.2 3.5Short term, seconded and temporary staff 1.5 0.6 0.1 2.2Total staff costs 18.9 7.0 2.1 28.0
Other costsMember payroll services 0.3 0.1 5.0 5.4Staff related and recruitment 0.5 0.6 - 1.1Advisory and other professional services 4.2 3.2 0.2 7.6Statutory audit costs 0.2 - - 0.2Accommodation and general office 2.0 0.8 0.1 2.9IT and telephony 8.6 2.5 0.5 11.6Depreciation and amortisation charges 3.6 - - 3.6Total other operating expenses 19.4 7.2 5.8 32.4Total operating expenses 38.3 14.2 7.9 60.4
Statutory audit costs were £170,000 (2016: £210,000).
Operating the business

1 0 0 | P E N S I O N P R O T E C T I O N F U N D | ANNUAL REPORT AND ACCOUNTS 20 16 / 1 7 P E N S I O N P R O T E C T I O N F U N D | ANNUAL REPORT AND ACCOUNTS 20 16 / 1 7 | 1 0 1
FINA
NC
IAL STATEM
ENTS
Operating the business
Pension Protection
Fund£m
PPFAdministration
Fund£m
FASAdministration
Fund£m
2016
£m
Staff costsWages and salaries 10.6 5.7 1.7 18.0Social security costs 1.0 0.6 0.1 1.7Other pension costs 1.8 1.2 0.2 3.2Short term, seconded and temporary staff 2.3 2.0 0.2 4.5Total staff costs 15.7 9.5 2.2 27.4
Other costsMember payroll services 3.7 0.3 3.5 7.5Staff related and recruitment 0.6 1.0 - 1.6Advisory and other professional services 3.4 1.9 - 5.3Statutory audit costs 0.2 - - 0.2Accommodation and general office 1.5 1.4 0.2 3.1IT and telephony 3.3 3.0 0.5 6.8Depreciation and amortisation charges 3.0 0.5 - 3.5Total other operating expenses 15.7 8.1 4.2 28.0Total operating expenses 31.4 17.6 6.4 55.4
Information on the staff numbers and exit packages can be found in the Remuneration and staff report on pages 59 to 64.
PensionsEmployees of the Board of the Pension Protection Fund are eligible for membership of the Principal Civil Service Pension Scheme (PCSPS) and can opt to join the defined benefit section, or to contribute to a stakeholder (defined contribution) arrangement.
The PCSPS is an unfunded multi-employer defined benefit salary related scheme and the Board is unable to identify its share of underlying assets and liabilities. Defined benefit contributions are therefore accounted for by the Board as if they were contributions to a defined contribution scheme. A full actuarial valuation of PCSPS was carried out as at 31 March 2012 and details can be found in the Cabinet Office: Civil Superannuation Resource Accounts (www.civilservicepensionscheme.org.uk/about-us/resource-accounts).
During the year to 31 March 2017, employer contributions of £3.4m (2016: £3.1m) were payable to the defined benefit section of the PCSPS at one of four rates in the range 20.0% to 24.5% (2016: 20.0% to 24.5%). Employer contributions for the year ended 31 March 2018 are expected to be approximately £3.9m. The scheme’s actuary reviews employer contributions every four years following a full scheme valuation. These contribution rates reflect the benefits as they are accrued, not when the costs are actually incurred, and reflect past experience of the scheme. Employees of the Board can opt to open a partnership pension account, which is a stakeholder pension with an employer contribution. Employer contributions of £51k (2016: £77k) were paid to one or more of a panel of three appointed stakeholder pension providers. Employer contributions were age-related and range from 8% to 14.75% (2016: 3% to 12.5%) of pensionable pay, and employers also match employee contributions up to 3% of pensionable pay. In addition, employer contributions were payable to the PCSPS to cover the cost of the future provision of lump sum benefits on death in service and ill health retirement of these employees. Accrued pension contributions at 31 March 2017 were £307k (2016: £280k) and were paid in April 2017.
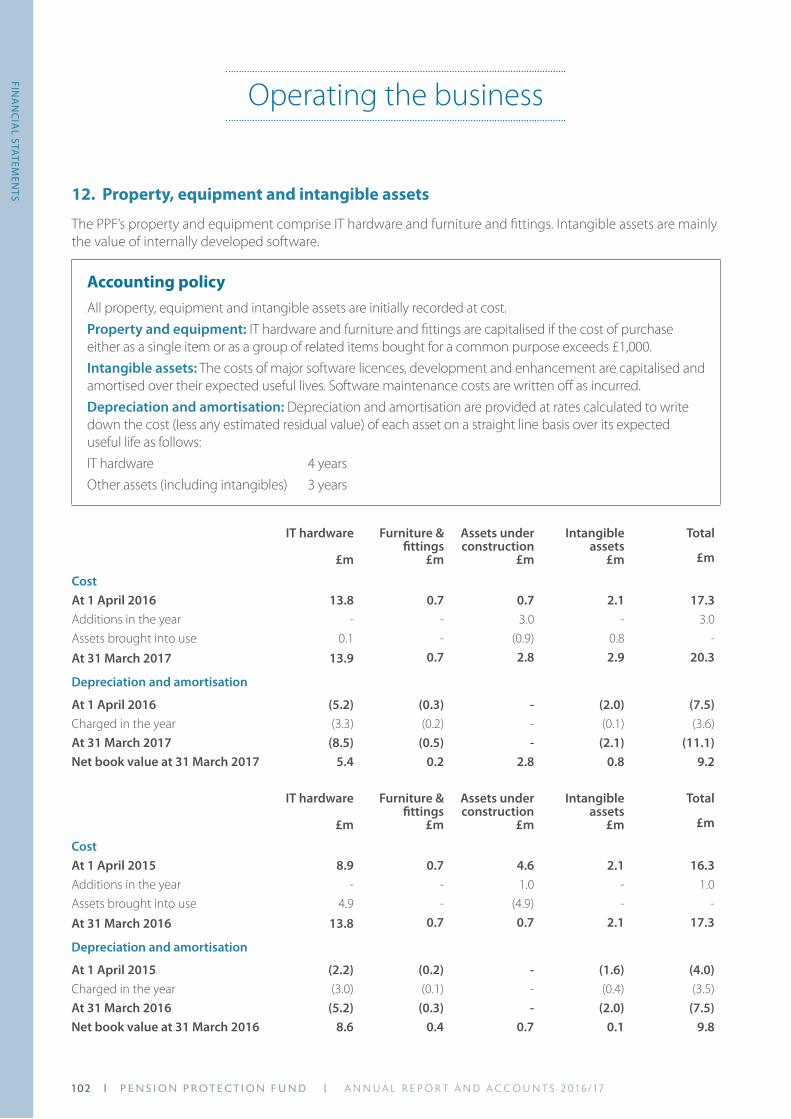
1 02 | P E N S I O N P R O T E C T I O N F U N D | ANNUAL REPORT AND ACCOUNTS 20 16 / 1 7 P E N S I O N P R O T E C T I O N F U N D | ANNUAL REPORT AND ACCOUNTS 20 16 / 1 7 | 1 0 3
12. Property, equipment and intangible assets
The PPF’s property and equipment comprise IT hardware and furniture and fittings. Intangible assets are mainly the value of internally developed software.
Accounting policyAll property, equipment and intangible assets are initially recorded at cost.Property and equipment: IT hardware and furniture and fittings are capitalised if the cost of purchase either as a single item or as a group of related items bought for a common purpose exceeds £1,000.Intangible assets: The costs of major software licences, development and enhancement are capitalised and amortised over their expected useful lives. Software maintenance costs are written off as incurred.Depreciation and amortisation: Depreciation and amortisation are provided at rates calculated to write down the cost (less any estimated residual value) of each asset on a straight line basis over its expected useful life as follows:IT hardware 4 yearsOther assets (including intangibles) 3 years
IT hardware
£m
Furniture & fittings
£m
Assets under construction
£m
Intangible assets
£m
Total
£m
CostAt 1 April 2016 13.8 0.7 0.7 2.1 17.3Additions in the year - - 3.0 - 3.0Assets brought into use 0.1 - (0.9) 0.8 -
At 31 March 2017 13.9 0.7 2.8 2.9 20.3
Depreciation and amortisation
At 1 April 2016 (5.2) (0.3) - (2.0) (7.5)Charged in the year (3.3) (0.2) - (0.1) (3.6)At 31 March 2017 (8.5) (0.5) - (2.1) (11.1)Net book value at 31 March 2017 5.4 0.2 2.8 0.8 9.2
IT hardware
£m
Furniture & fittings
£m
Assets under construction
£m
Intangible assets
£m
Total
£m
CostAt 1 April 2015 8.9 0.7 4.6 2.1 16.3Additions in the year - - 1.0 - 1.0Assets brought into use 4.9 - (4.9) - -
At 31 March 2016 13.8 0.7 0.7 2.1 17.3
Depreciation and amortisation
At 1 April 2015 (2.2) (0.2) - (1.6) (4.0)Charged in the year (3.0) (0.1) - (0.4) (3.5)At 31 March 2016 (5.2) (0.3) - (2.0) (7.5)Net book value at 31 March 2016 8.6 0.4 0.7 0.1 9.8
FINA
NC
IAL STATEM
ENTS
Operating the business
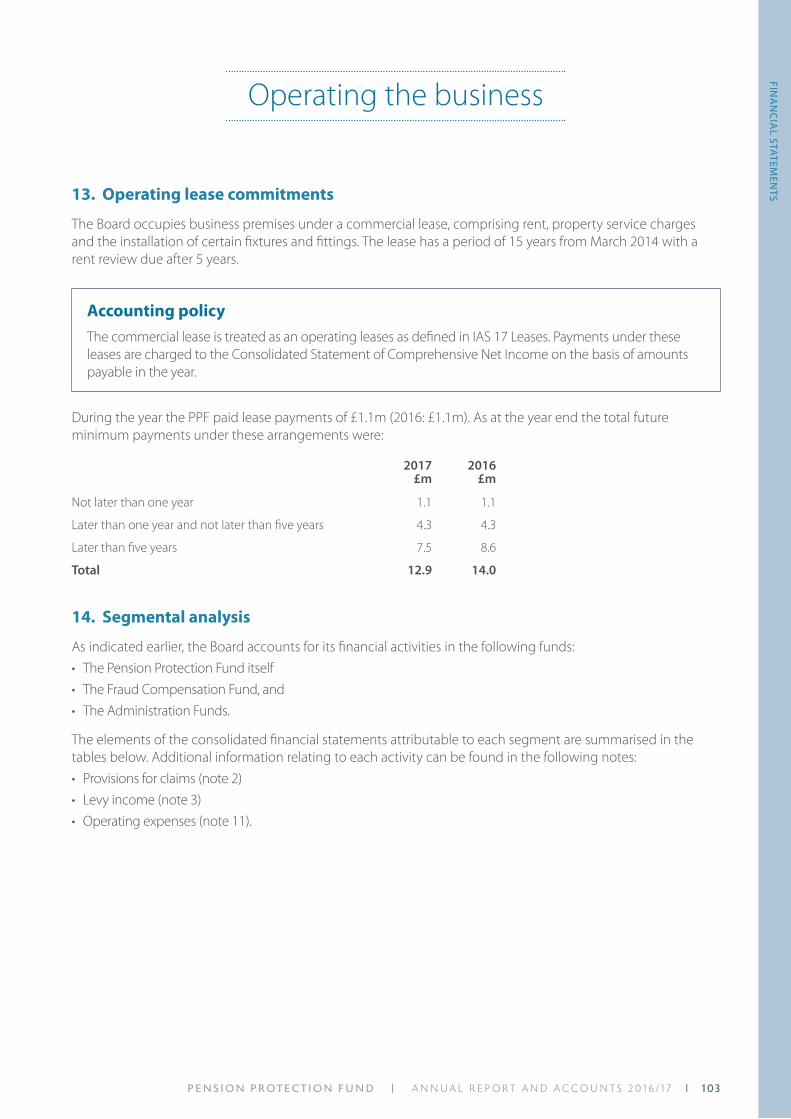
1 02 | P E N S I O N P R O T E C T I O N F U N D | ANNUAL REPORT AND ACCOUNTS 20 16 / 1 7 P E N S I O N P R O T E C T I O N F U N D | ANNUAL REPORT AND ACCOUNTS 20 16 / 1 7 | 1 0 3
FINA
NC
IAL STATEM
ENTS
Operating the business
13. Operating lease commitments
The Board occupies business premises under a commercial lease, comprising rent, property service charges and the installation of certain fixtures and fittings. The lease has a period of 15 years from March 2014 with a rent review due after 5 years.
Accounting policyThe commercial lease is treated as an operating leases as defined in IAS 17 Leases. Payments under these leases are charged to the Consolidated Statement of Comprehensive Net Income on the basis of amounts payable in the year.
During the year the PPF paid lease payments of £1.1m (2016: £1.1m). As at the year end the total future minimum payments under these arrangements were:
2017 £m
2016 £m
Not later than one year 1.1 1.1
Later than one year and not later than five years 4.3 4.3
Later than five years 7.5 8.6
Total 12.9 14.0
14. Segmental analysis
As indicated earlier, the Board accounts for its financial activities in the following funds:• The Pension Protection Fund itself• The Fraud Compensation Fund, and• The Administration Funds.
The elements of the consolidated financial statements attributable to each segment are summarised in the tables below. Additional information relating to each activity can be found in the following notes:• Provisions for claims (note 2)• Levy income (note 3) • Operating expenses (note 11).

P E N S I O N P R O T E C T I O N F U N D | ANNUAL REPORT AND ACCOUNTS 20 16 / 1 7 | 1 0 51 0 4 | P E N S I O N P R O T E C T I O N F U N D | ANNUAL REPORT AND ACCOUNTS 20 16 / 1 7
Consolidated statement of comprehensive net income
For the year ended 31 March 2017 £m
2016 £m
Restated*
Pension Protection FundNet operating surplus 546.9 526.7Net investment return 3,963.9 323.2Net cost of claims (2,504.5) (423.1)Net comprehensive income 2,006.3 426.8
Fraud Compensation FundNet comprehensive (expense)/income (0.6) 2.2
Administration FundsIncome from grant-in-aid 24.9 23.4Operating expenses (22.1) (24.0)Net comprehensive income/(expense) 2.8 (0.6)
Consolidated net comprehensive income 2,008.5 428.4
Consolidated statement of financial position
For the year ended 31 March 2017 £m
2016 £m
Total assets less total liabilitiesPension Protection Fund 6,062.3 4,056.0Fraud Compensation Fund 10.1 10.7Administration Funds 0.2 (2.6)Consolidated statement of financial position 6,072.6 4,064.1
*See note 3, Income from grant-in-aid
All of the Board’s operational activities are undertaken in the United Kingdom. The PPF’s investment portfolio is diversified across a wide variety of geographic locations.
FINA
NC
IAL STATEM
ENTS
Operating the business

P E N S I O N P R O T E C T I O N F U N D | ANNUAL REPORT AND ACCOUNTS 20 16 / 1 7 | 1 0 51 0 4 | P E N S I O N P R O T E C T I O N F U N D | ANNUAL REPORT AND ACCOUNTS 20 16 / 1 7
15. Subsidiaries
The Board holds a small proportion of its investment portfolio through subsidiaries. As at 31 March 2017 these were:
• PPF Nominee 1 B. V. (a company registered in the Netherlands)
• PPF Nominee 2 B. V. (a company registered in the Netherlands)
• Crown Secondary Placement Plc (a company registered in Ireland)
• PPF Real Estate Nominee 1 Limited (a company registered in the United Kingdom)
• PPF Real Estate Nominee 2 Limited (a company registered in the United Kingdom)
• PPF Real Estate Nominee 3 Limited (a company registered in the United Kingdom)
• PPF Real Estate Nominee 4 Limited (a company registered in the United Kingdom)
• Emso Opportunity Strategies Fund 2 Ltd (a company registered in the Cayman Islands)
The subsidiaries do not operate separately from the PPF’s overall investment management processes, and the relevant assets, liabilities, income and expenses are fully consolidated and recorded within the appropriate asset classes in the PPF’s accounting records. All subsidiaries are 100 per cent owned by the Board. The Cayman Island registered company has a 31 December year end and all the others have a 31 March year end.
16. Related party transactions
£24.9m (2016: £23.4m) was received from DWP in grant-in-aid. DWP is the sponsoring department of the PPF. There are no other related party transactions to disclose other than transactions with subsidiaries shown in note 15.
17. Events after the reporting period
There have been no material events after the reporting period.
The accounts were authorised for issue by the Accounting Officer on 26 June 2017, the date the Comptroller and Auditor General certified them. The accounts do not reflect events after this date.
FINA
NC
IAL STATEM
ENTS
Operating the business

P E N S I O N P R O T E C T I O N F U N D | ANNUAL REPORT AND ACCOUNTS 20 16 / 1 7 | 1 071 0 6 | P E N S I O N P R O T E C T I O N F U N D | ANNUAL REPORT AND ACCOUNTS 20 16 - 1 7

P E N S I O N P R O T E C T I O N F U N D | ANNUAL REPORT AND ACCOUNTS 20 16 / 1 7 | 1 071 0 6 | P E N S I O N P R O T E C T I O N F U N D | ANNUAL REPORT AND ACCOUNTS 20 16 - 1 7
AC
TUA
RIAL REPO
RTS
Summary of the Principal Findings of the Two Actuarial
Valuation Reports
The principal findings are:
• 62 schemes have transferred into the PPF since 31 March 2016, bringing the total number of schemes which have transferred into the PPF as at 31 March 2017 to 894.
• The number of members receiving compensation from the PPF increased from 119,442 as at 31 January 2016 to 128,793 as at 31 January 2017, and the number of future retirees who are due to receive compensation from the PPF increased from 107,831 as at 31 January 2016 to 109,645 as at 31 January 2017.
• The excess of assets over liabilities on the accounting basis in respect of those schemes that have transferred into the PPF has increased from £5,318.9m as at 31 March 2016 to £6,736.7m as at 31 March 2017, with the funding level increasing to 131 per cent.
• The number of schemes in the assessment process which contribute to the provisions figure (schemes considered likely to transfer) has decreased from 120 as at 31 March 2016 to 98 as at 31 March 2017.
• The shortfall of assets compared with liabilities on the accounting basis in respect of those schemes forming the provisions (which represents an allowance for those schemes in assessment which are considered most likely to transfer into the PPF) has decreased from £1,262.9m as at 31 March 2016 to £674.4m as at 31 March 2017 representing a funding level of 89 per cent.
The combined assets in respect of those schemes that have already transferred into the PPF, and those schemes forming the provisions, exceeds the combined liabilities on the accounting basis, resulting in an overall reserve of £6,062.3m as at 31 March 2017, as summarised below:
Assets £m
Liabilities £m
Schemes that have already transferred into the PPF 28,715.7 21,979.0
Estimated provisions in respect of schemes likely to transfer 5,405.8 6,080.2
Total 34,121.5 28,059.2
Excess of assets over liabilities 6,062.3
Funding Ratio (Assets / Liabilities) 121.6%
This compares with a funding ratio of 116.3 per cent as at 31 March 2016.

P E N S I O N P R O T E C T I O N F U N D | ANNUAL REPORT AND ACCOUNTS 20 16 / 1 7 | 1 0 91 0 8 | P E N S I O N P R O T E C T I O N F U N D | ANNUAL REPORT AND ACCOUNTS 20 16 / 1 7
AC
TUA
RIAL REPO
RTS
Summary of the Principal Findings of the Two Actuarial
Valuation Reports
The key factors affecting the funding position over the last year were as follows:
• Over the year to 31 March 2017 gilt yields fell, resulting in an increase in liabilities for both transferred schemes and provisions. The PPF’s hedging programme broadly provided protection against these movements; however the overall impact was to worsen the funding position.
• Non-hedging investments net of expenses held by the PPF performed positively over the year which improved the funding position.
• Over the year the size of new claims on the PPF was less than the levy collected during the year.
• The longevity assumptions have been updated, as well as the future assumed level of inflation; these changes have together acted to improve the funding position.
• The approach taken to the allowance made for the expense of running the PPF this year was updated. This had a negative impact on the funding position.
• Actual experience compared with expected, including updated data and inflation-linked increases to PPF compensation, has had a positive impact on the funding position.
• The compensation cap changed in the year for members with over 20 years of pensionable service. This had a negative impact on the funding position.
P E N S I O N P R O T E C T I O N F U N D | ANNUAL REPORT AND ACCOUNTS 20 16 / 1 7 | 1 0 91 0 8 | P E N S I O N P R O T E C T I O N F U N D | ANNUAL REPORT AND ACCOUNTS 20 16 / 1 7
AC
TUA
RIAL REPO
RTS
Actuarial valuation of the Pension Protection Fund
To: The Board of the Pension Protection Fund
From: Danny Wilding, Appointed Actuary
The actuarial valuation of the Pension Protection Fund as at 31 March 2017
1. IntroductionThe Board of the Pension Protection Fund (‘the Board’) is required by paragraph 22 of schedule 5 to the Pensions Act 2004 to prepare a statement of accounts in respect of each financial year. Each statement of accounts must contain an actuarial valuation of the assets and liabilities of the Pension Protection Fund prepared and signed by the Appointed Actuary.
This is the twelfth actuarial valuation of the PPF. The effective date of this valuation is 31 March 2017. The previous actuarial valuation was carried out as at 31 March 2016 by Stephen Rice, and the report on that valuation was dated 28 June 2016.
At its meeting on 25 January 2017, the Board appointed me to prepare this annual actuarial valuation of the assets and liabilities of the Pension Protection Fund for inclusion in its annual report and accounts as at 31 March 2017. As required by paragraph 22(5) of Schedule 5 to the Pensions Act 2004, the Board will be sending a copy of this report, as part of the statement of accounts, to the Secretary of State for Work and Pensions and also to the Comptroller and Auditor General. However, this report is not intended to assist any user other than the Board in making decisions or for any other purpose.
This report does not contain advice on the funding of compensation payable from the PPF. In particular, the results of this valuation are not used in the determination of the levy.
In my view, while the Actuaries’ Code issued by the Actuarial Profession applies to this valuation, there are no technical professional practice standards which directly apply to this work. However, this valuation has been prepared having regard to the principles set out in the Technical Actuarial Standard TAS 100 (“Principles for Technical Actuarial Work”). This report should be considered alongside my supplementary report dated 21 June 2017 and included below. Given the scope of the work, the process and calculations underlying the report, together with the report itself, should be subject to an independent peer review under the Actuarial Profession’s practice standard APS X2 (“Review of Actuarial Work”). This has been undertaken by the Government Actuary’s Department.
The methodology used for the valuation as at 31 March 2017 is broadly the same as that adopted for the valuation as at 31 March 2016. Consistent with last year’s approach, liabilities were initially calculated as at 28 February 2017 using membership data as at 31 January 2017 (or in a few cases, at an earlier date) and market conditions as at 28 February 2017, and then adjusted to reflect the passage of time, and changes to market conditions between 28 February 2017 and 31 March 2017. Based on the experience to 31 March 2017, adopting this approach does not materially affect the accuracy of the results compared with using data and market conditions as at 31 March 2017.

P E N S I O N P R O T E C T I O N F U N D | ANNUAL REPORT AND ACCOUNTS 20 16 / 1 7 | 1 1 11 1 0 | P E N S I O N P R O T E C T I O N F U N D | ANNUAL REPORT AND ACCOUNTS 20 16 / 1 7
AC
TUA
RIAL REPO
RTS
Actuarial valuation of the Pension Protection Fund
2. Membership dataAs at 31 March 2017, 894 schemes had transferred to the PPF. Compensation payments due in respect of the members of these schemes and their associated expenses form the liabilities reported on in this report. Data in respect of the 894 transferred schemes has been received from two sources:
• For the 884 schemes where responsibility for the administration transferred to the PPF on or before 31 January 2017, individual member data has been provided by the PPF’s internal administration team. The effective date of this data is 31 January 2017.
• For the 10 schemes transferring in February and March 2017 the liabilities were determined from the latest section 179 valuation provided as part of the scheme returns submitted to the Exchange database maintained by the Pensions Regulator. Liabilities calculated in this way account for about 0.6 per cent of the total liabilities in respect of schemes which have transferred to the PPF.
Owing to the timescale for providing valuation results, it was necessary to receive extracts of data as at a date before the effective date of the valuation. This is the same process as adopted for the valuation at 31 March 2016. Adjustments have been applied to ensure the data is consistent with the valuation date and that the accuracy of the valuation results is not materially affected.
Some overall checks have been carried out on this data for general reasonableness and to ensure that it is consistent with that used in the actuarial valuation at 31 March 2016 and no material concerns relating to the accuracy of the data provided have arisen.

P E N S I O N P R O T E C T I O N F U N D | ANNUAL REPORT AND ACCOUNTS 20 16 / 1 7 | 1 1 11 1 0 | P E N S I O N P R O T E C T I O N F U N D | ANNUAL REPORT AND ACCOUNTS 20 16 / 1 7
AC
TUA
RIAL REPO
RTS
Actuarial valuation of the Pension Protection Fund
A summary of the individual member data for the 884 schemes that transferred to the PPF prior to 31 January 2017 is as follows (figures in brackets are the corresponding figures used for the valuation at 31 March 2016):
Deferred pensioners
Sex Number Average age Total accrued compensation revalued
to 31 January 2017(uncapped)
£000s pa
Male 73,775 (72,690) 52.2 (51.8) 290,108 (283,782)
Female 35,870 (35,141) 50.7 (50.2) 78,798 (75,130)
Total 109,645 (107,831) 51.7 (51.3) 368,906 (358,912)
Pensioners
Status Sex Number Average age Total compensation at 31 January 2017
(capped where applicable)
£000s pa
MembersMale 79,265 (73,404) 69.9 (69.7) 432,821 (385,161)
Female 29,769 (27,907) 70.5 (70.3) 65,164 (58,772)
Dependants (excluding children)
Male 1,907 (1,724) 73.4 (73.2) 2,653 (2,374)
Female 17,438 (16,019) 75.5 (75.4) 53,672 (48,106)
ChildrenMale 214 (195) 15.6 (15.4) 319 (288)
Female 200 (193) 16.1 (16.2) 246 (261)
Total 128,793 (119,442) 70.7 (70.5) 554,874 (494,962)
Individuals who are already receiving one tranche of compensation but are entitled to a further tranche of compensation to be brought into payment after 31 January 2017 are included in both tables.

Actuarial valuation of the Pension Protection Fund
A summary of the data used for the 10 schemes that transferred to the PPF between 1 February 2017 and 31 March 2017, where individual data was not available is as follows:
Number of members Average age Estimated compensation as at 31
March 2017 £000s pa
Deferred pensioners 878 50.7 3,894
Pensioners 532 67.3 2,743
There are also around 2,000 pensioner members whose compensation payments had been suspended (and not put back into payment) by 31 January 2017. This suspension occurred because the PPF is uncertain about whether these members continue to be eligible to receive compensation. In practice, a small number of these members may have their compensation put back into payment after 31 January 2017.
A liability will be recognised for any such member if and when his or her entitlement to continuing compensation is established. This matches the approach taken in previous years.
Additionally, there are a presently unknown number of people whom HMRC have on record as having paid contracted-out rate National Insurance contributions in respect of membership of a scheme which has now transferred to the PPF, but who were not deemed by the trustees to be members of that scheme at the time of the transfer to the PPF. Schemes would have had a liability to pay a Guaranteed Minimum Pension (GMP) in respect of individuals who were contracted-out, unless this liability had been discharged. It is expected that these people will receive a letter in 2018 from HMRC to confirm that they paid contracted-out rate National Insurance contributions in respect of their former scheme. This letter may be evidence that they are entitled to PPF compensation.
A liability will be recognised for any such member if and when their entitlement to compensation is established.
3. CompensationCompensation for PPF members has been determined in accordance with the provisions of Schedule 7 to the Pensions Act 2004 and consequent regulations. A summary of the compensation provisions is shown in Annex M1.
4. Method for calculating liabilitiesThe approach to placing a value on the liabilities depends on whether individual membership data is available or not.
P E N S I O N P R O T E C T I O N F U N D | ANNUAL REPORT AND ACCOUNTS 20 16 / 1 7 | 1 1 31 1 2 | P E N S I O N P R O T E C T I O N F U N D | ANNUAL REPORT AND ACCOUNTS 20 16 / 1 7
AC
TUA
RIAL REPO
RTS

Actuarial valuation of the Pension Protection Fund
Method where individual membership data is available
The expected compensation cash flows have been estimated for PPF members for whom individual data was provided by the internal administration team or an external administrator. In estimating each yearly compensation cash flow for each member, account is taken of:• the initial amount of compensation or accrued pension• expected mortality• the Normal Pension Age (NPA) for deferred members• compensation increases• the PPF compensation cap (excluding the impact of the long service cap), and• the probability of survivors’ compensation being paid.
The resulting yearly compensation cash flows are discounted back to a present value, and summed to obtain the actuarial present value of each member’s liability.
Initially, liabilities were calculated as at 28 February 2017 and based on assumptions derived from market conditions as at 28 February 2017. The change in market conditions between 28 February 2017 and 31 March 2017 was then allowed for. The change in calculation date to 31 March 2017 was also allowed for by unwinding the discount rate for one month and deducting the benefit outgo in respect of March 2017.
The financial and demographic assumptions employed are described briefly in the next section of this report and set out more fully in Annex M2.
A further adjustment has been applied to the liabilities for the expected cost of GMP equalisation, the long service cap and future expenses. Details of the adjustment applied can be found in Annexes M1 and M2.
Method where individual membership data is not available
Individual membership data was not available for schemes which transferred to the PPF in February or March 2017. For these 10 schemes, the section 179 values of the liabilities and assets were rolled forward to 31 March 2017 based on market conditions at that date.
The methodology used to roll the section 179 liabilities and asset values forward to 31 March 2017, at the same time changing the valuation assumptions to those described in Annex M2, is broadly consistent with that to be applied for the calculation of levy in the financial year 1 April 2017 to 31 March 2018 (ignoring smoothing and stressing of assets and liabilities, and noting that no scheme for which this roll forward approach was adopted had any Asset-Backed Contributions). The methodology is available in the Pension Protection Levy section of the PPF website at: http://www.pensionprotectionfund.org.uk/LEVY/Pages/1718LevyDetermination.aspx.
An adjustment was also made to these rolled-forward assets and liabilities to allow for the payment of benefits from the effective date of the section 179 valuation up to the valuation date.
An additional adjustment was then applied to the resulting liabilities. The roll forward methodology ignores certain items that are expected to impact assets and liabilities by similar amounts, so that the calculated deficit is more reliable than the corresponding asset or liability values in isolation. The roll forward was therefore used to calculate the expected deficit for each of these schemes, and then the liabilities adjusted for each scheme by the difference between the actual value of assets that transferred to the PPF and the value of assets anticipated by the roll forward (after deduction of benefit outgo). By adjusting the liabilities in this way, the deficit recorded for each scheme remains unchanged from that calculated in the roll forward.
P E N S I O N P R O T E C T I O N F U N D | ANNUAL REPORT AND ACCOUNTS 20 16 / 1 7 | 1 1 31 1 2 | P E N S I O N P R O T E C T I O N F U N D | ANNUAL REPORT AND ACCOUNTS 20 16 / 1 7
AC
TUA
RIAL REPO
RTS

AC
TUA
RIAL REPO
RTS
Actuarial valuation of the Pension Protection Fund
A further adjustment has been applied to the liabilities for the expected cost of GMP equalisation, the long service cap and future expenses. Details on the adjustment applied can be found in Annexes M1 and M2.
5. AssumptionsThe approach to deriving the assumptions also depends on the availability of individual membership data. Where individual data was available, term-dependent financial assumptions were adopted and cash flows were generated. Also, mortality rates related to the circumstances of the individual member were adopted, taking into account the member’s sex, postcode and amount of compensation. Where individual data was not available, average assumptions were used. Annex M2 describes in more detail both approaches to deriving the assumptions.
In order to estimate cash flows in respect of future compensation payments to PPF members, assumptions have been made about:
• annual increases in payment to elements of compensation which were accrued after 5 April 1997
• revaluation of compensation in deferment for those whose compensation does not begin to be paid until after the valuation date, 31 March 2017
• future expected mortality and other demographic features, and
• whether the Secretary of State exercises his power under paragraph 30 of Schedule 7 of the Pensions Act 2004 to vary the 100 per cent level of compensation for those members in category 1 of Annex M1 and the 90 per cent level of compensation for those members in category 2 of Annex M1.
In order to determine the present value of the liabilities the compensation cash flows, estimated as described above, were discounted back to the valuation date 31 March 2017.
I, as Appointed Actuary, have responsibility for the assumptions used in the statutory valuation of the assets of the PPF and the transferred liabilities, which are the subject of this report. The Board has responsibility for the assumptions used to value the assets and liabilities for schemes forming the provisions, as well as contingent liabilities, which are the subject of my supplementary report. Since largely the same assumptions are required for both purposes, past practice has been to adopt the same assumptions, as far as possible, which are agreed by the Board.
In proposing the assumptions for the 2017 actuarial valuation, regard has been taken of the Accounts Direction which is given by the Secretary of State for Work and Pensions with the approval of HM Treasury in accordance with Schedule 5, Part 4 of the Pensions Act 2004.
Under this direction, the Board is required to prepare accounts in compliance with:
• the accounting principles and disclosure requirements of the current edition of the Government Financial Reporting Manual (the ‘FReM’) issued by HM Treasury which is in force for the financial year for which the accounts are being prepared,
• other guidance issued by HM Treasury in respect of accounts which are required to give a true and fair view, and
• the Framework document agreed between the Department for Work and Pensions and the PPF Board.
P E N S I O N P R O T E C T I O N F U N D | ANNUAL REPORT AND ACCOUNTS 20 16 / 1 7 | 1 1 51 1 4 | P E N S I O N P R O T E C T I O N F U N D | ANNUAL REPORT AND ACCOUNTS 20 16 / 1 7

AC
TUA
RIAL REPO
RTS
Actuarial valuation of the Pension Protection Fund
The existing Accounts Direction also states that the discount rate used to discount future cash flows and liabilities should be that advised by the PPF’s actuary (in accordance with Schedule 5 Part 4 section 22(4)(b) of the Pensions Act 2004 and the PPF valuation regulations 2005 and 2006).
None of the above provides specific direction on the choice of assumptions made for the valuation. However, in taking account of these documents and the Accounts Direction, the Board is required to place a value on the provisions which is best estimate, i.e. is equally likely to overstate as to understate the actual value.
This follows from IAS 37, which the Board is required to take into account in accordance with the FReM. As the same choices of assumptions are made as far as possible for this report as for valuing the provisions, the value placed on liabilities of the PPF is also a best estimate. This has been done using market pricing where possible. A full description of the assumptions made can be found in Annex M2.
A sensitivity analysis has also been carried out in which the effect on the assets and liabilities is shown of changes in certain key assumptions. The results of this analysis may be seen in Annex S7 of my supplementary report concerning provisions in respect of the PPF as at 31 March 2017.
6. Total cash flows expected after 31 March 2017The chart below summarises the expected cash flows for all schemes that had transferred to the PPF on or before 31 March 2017. It was initially calculated using the membership data, assumptions and valuation process set out in section 2 to section 5 for all the 884 schemes that had transferred to the PPF on or before 31 January 2017. The amounts were then scaled up to reflect the additional liabilities in respect of schemes that transferred in February and March 2017. In calculating the cash flows, deferred pensioners are assumed not to retire early or late, or commute any of their annual compensation for a lump sum.
2017
2022
2027
2032
2037
2042
2047
2052
2057
2062
2067
2072
2077
2082
2087
2092
0
100
200
300
400
500
600
700
800
900
Deferred Pensioners
Calendar Year
Tota
l Cas
hflow
s (£m
)
P E N S I O N P R O T E C T I O N F U N D | ANNUAL REPORT AND ACCOUNTS 20 16 / 1 7 | 1 1 51 1 4 | P E N S I O N P R O T E C T I O N F U N D | ANNUAL REPORT AND ACCOUNTS 20 16 / 1 7

AC
TUA
RIAL REPO
RTS
Actuarial valuation of the Pension Protection Fund
7. Value of assetsThe value of the PPF assets is determined in accordance with regulations 2, 4 and 5 of the Pension Protection Fund (Valuation of the Assets and Liabilities of the Pension Protection Fund) Regulations 2006 (SI 2006 / 597).
The value of the PPF assets has been adopted as stated in the relevant accounts prepared by the Board for the financial period ending on 31 March 2017. Neither of the adjustments made available by regulations 4 and 5 have been adopted.
Accordingly, the value of the PPF assets as at 31 March 2017 has been taken as £28,715.7m. This includes £0.5m in respect of AVC assets that match AVC liabilities yet to be discharged.
This compares with an asset value of £23,602.9m as at 31 March 2016.
An analysis of the change in the value of the assets of the PPF between 31 March 2016 and 31 March 2017 is as follows:
£m
Value of assets at the start of the year (31 March 2016) 23,602.9Assets for schemes entering the PPF during the year to 31 March 2017 (measured at their transfer dates) 1,250.7Assets received in respect of schemes transferred in prior years 12.6Income from Pension Protection Levies 585.2Compensation paid (661.3)Change in value of hedging assets 2,926.2Change in value of other invested assets 1,037.7Non investment expenses (38.3)Value of assets at the end of the year (31 March 2017) 28,715.7
8. Value of liabilitiesThe value of the PPF liabilities is determined in accordance with regulation 3 of the Pension Protection Fund (Valuation of the Assets and Liabilities of the Pension Protection Fund) Regulations 2006 (SI 2006 / 597). This requires that:
(a) the liabilities of the PPF shall be any sums or properties falling to be paid or transferred out of the Fund required to meet liabilities listed in section 173(3) of the Pensions Act 2004, and
(b) the value of a liability shall be the present value of that liability at the valuation date.
The actuarial liabilities in respect of PPF members, on the assumptions described in section 5 and Annex M2, are summarised in the table below:
Type of member £m
Deferred pensioners 11,005.8
Pensioners 10,267.8Administration expenses to be met by the PPF 704.9Current liabilities (AVCs to be discharged) 0.5Total 21,979.0
P E N S I O N P R O T E C T I O N F U N D | ANNUAL REPORT AND ACCOUNTS 20 16 / 1 7 | 1 1 71 1 6 | P E N S I O N P R O T E C T I O N F U N D | ANNUAL REPORT AND ACCOUNTS 20 16 / 1 7

AC
TUA
RIAL REPO
RTS
Actuarial valuation of the Pension Protection Fund
Accordingly the value of the liabilities of the PPF as at 31 March 2017 has been taken as £21,979.0m. This compares with £18,284.0m as at 31 March 2016.
An analysis of the change in the actuarial liabilities between 31 March 2016 and 31 March 2017 is as follows:
£m
Actuarial liabilities at the start of the year (31 March 2016) 18,284.0
Liabilities for schemes entering the PPF during the year to 31 March 2017 (measured at schemes’ transfer dates) 1,778.1
Compensation paid (661.3)
Actuarial (gain) / loss due to inflation being different from what was assumed (70.3)
Accumulated interest 89.5
Actuarial (gain) / loss due to changes in market yields 2,839.1
Actuarial (gain) / loss due to data changes (33.4)
Actuarial (gain) / loss due to changes in mortality assumptions (244.9)
Actuarial (gain) / loss due to changes in CPI assumptions (142.9)
Actuarial (gain) / loss due to other experience 23.1
Change in expense reserve 63.9
Impact of the long service cap 54.1
Actuarial liabilities at the end of the year (31 March 2017) 21,979.0
It should be noted that the exact values attributed to each driver of change would be slightly different if the order of calculation were different. This does not affect the total liabilities at 31 March 2017.
Although we seek to minimise our interest and inflation risk through our liability-driven investment (LDI) strategy, it should be noted that the actuarial (gain) / loss on the liabilities due to changes in market yields is not comparable to the equivalent items in the analysis of change in the assets, for a number of reasons. For example, for the purpose of our LDI strategy we assume a different rate of inflation than for this valuation. In addition, part of the LDI assets are used to hedge the interest and inflation risk in respect of some schemes in assessment or those expected to suffer an insolvency event in the near future.
P E N S I O N P R O T E C T I O N F U N D | ANNUAL REPORT AND ACCOUNTS 20 16 / 1 7 | 1 1 71 1 6 | P E N S I O N P R O T E C T I O N F U N D | ANNUAL REPORT AND ACCOUNTS 20 16 / 1 7

AC
TUA
RIAL REPO
RTS
Actuarial valuation of the Pension Protection Fund
9. ConclusionAs at 31 March 2017, the value of the PPF’s assets was £28,715.7m and the value of the liabilities was £21,979.0m. The excess of assets over liabilities was £6,736.7m as at 31 March 2017, which corresponds to a funding ratio of 130.7 per cent. These values have been determined in accordance with the Pension Protection Fund (Valuation of the Assets and Liabilities of the Pension Protection Fund) Regulations 2006 (SI 2006 / 597).
This excess of assets over liabilities needs to be understood in the context of additional pension schemes that had entered an assessment period, as defined in section 132 of the Pensions Act 2004, with effect from a date on or before 31 March 2017.
Therefore, in addition to this formal report on the assets and liabilities, provisions in respect of the assets, potential recoveries and liabilities of those schemes which, in the Board’s judgement, are likely to be transferred into the PPF have been estimated. These provisions are shown in my supplementary report to the Board dated 21 June 2017 and will be shown in the statement of accounts being prepared by the Board for the financial period ending on 31 March 2017.
Contingent liabilities as at 31 March 2017 have also been estimated. For contingent liabilities types I, II and III, the liabilities are in respect of other pension schemes which, in the Board’s judgement, may possibly enter an assessment period into the PPF in the near future. For contingent liabilities type IV, the liabilities represent the increase in PPF liabilities as a result of pending legislative changes. These contingent liabilities are shown in my supplementary report to the Board dated 21 June 2017 and will be disclosed in footnotes to the statement of accounts prepared by the Board for the financial period ending on 31 March 2017.
Signed:
Name: Danny Wilding, Appointed Actuary
Date: 21 June 2017
Job Title: Partner
Qualification: Fellow of the Institute and Faculty of Actuaries
Employer: Barnett Waddingham LLP
P E N S I O N P R O T E C T I O N F U N D | ANNUAL REPORT AND ACCOUNTS 20 16 / 1 7 | 1 1 91 1 8 | P E N S I O N P R O T E C T I O N F U N D | ANNUAL REPORT AND ACCOUNTS 20 16 / 1 7

AC
TUA
RIAL REPO
RTS
Compensation
Broadly speaking, the PPF provides two levels of compensation:
1. For individuals who have reached their scheme’s normal pension age before the assessment date or, irrespective of age, are in receipt of either a survivor’s pension or a pension on the grounds of ill health, the PPF pays a compensation level of 100 per cent.
In broad terms and in normal circumstances, this means a starting level of compensation that equates to 100 per cent of the pension in payment immediately before the start of the assessment period, as defined in section 132 of the Pensions Act 2004. This is subject to a review of the rules of the scheme by the Board.
2. For most people aged below their scheme’s normal pension age on the assessment date, the PPF pays a compensation level of 90 per cent.
In broad terms and in normal circumstances, this means 90 per cent of the pension an individual had accrued immediately before the assessment date (subject to a review of the rules of the scheme by the Board).
Compensation is revalued in line with the increase in the Retail Prices Index (RPI) between the assessment date and March 2011, and the increase in the Consumer Prices Index (CPI) between March 2011 and the commencement of compensation payments. This is subject to a minimum increase of zero over the whole period. The revaluation is also subject to a maximum increase over the whole period, this being 5 per cent a year for compensation accrued before 5 April 2009 and 2.5 per cent a year for compensation accrued thereafter.
Compensation is subject to an overall cap, which from 1 April 2017 equates to £38,505.61 a year at age 65 (the cap is adjusted according to the age at which compensation comes into payment). From 6 April 2017 the long service cap comes into effect for members who have 21 or more years’ service in their transferred scheme. For these members the cap will be increased by three per cent for each full year of pensionable service above 20 years, up to a maximum of double the standard cap. The liabilities include an allowance for this change, see Annex M2 for further details.
For both categories of members, once compensation is in payment, the part that derives from pensionable service on or after 6 April 1997 is increased on 1 January each year in line with increase in the CPI capped at 2.5 per cent and with a floor of 0 per cent.
After a member’s death, compensation is paid to any children who are under 18 years old, under 23 if they are in full-time education or at any age if they have a disability. Generally compensation will also be paid to any legal spouse, civil partner or other relevant partner. However, individual circumstances may differ in this regard depending on the rules of the former pension scheme.
Under the Pensions Act 2004, the Board has a duty to pay compensation on a basis that is no more or less favourable to a woman (or man) than it would be to a comparable man (or woman) in respect of pensionable service on or after 17 May 1990. In meeting this requirement, the Board must take into account any differences in scheme benefits that have arisen owing to differences in the calculation of Guaranteed Minimum Pensions (GMPs) for males and females, see Annex M2 for further details.
Under paragraphs 29 and 30 of Schedule 7 of the Pensions Act 2004, the Board:• has the power to alter the rates of revaluation and indexation, and• can recommend to the Secretary of State for Work and Pensions that the percentage of benefits paid as
compensation is varied.
It is expected that such provisions would only be used in exceptional circumstances, as the Board has other powers it could use if the financial position did deteriorate; for example, the ability to amend the amount of levy it collects.
Annex M1SUMMARY OF COMPENSATION PROVIDED BY THE PPF
P E N S I O N P R O T E C T I O N F U N D | ANNUAL REPORT AND ACCOUNTS 20 16 / 1 7 | 1 1 91 1 8 | P E N S I O N P R O T E C T I O N F U N D | ANNUAL REPORT AND ACCOUNTS 20 16 / 1 7

AssumptionsAssumptions in respect of schemes for which the Board assumed responsibility on or before 31 March 2017 will be either the same as, or derived in the same way as, those derived for the valuation as at 31 March 2016, unless stated otherwise.
a) Compensation levelsAs for previous valuations of the PPF, it has been assumed that the Secretary of State will not exercise his power under paragraph 30 of Schedule 7 of the Pensions Act 2004 to vary the 100 per cent level of compensation for those members in category 1 of Annex M1 and the 90 per cent level of compensation for those members in category 2 of Annex M1.
b) Future legislative changesRecent legislation introducing a service-related compensation cap has been allowed for as a current obligation of the PPF as described in Annex M1. No allowance for any other future legislative changes has been allowed for in this valuation.
c) Financial assumptions
Financial assumptions where individual membership data is availableFor the liabilities in respect of transferred schemes where individual data is available, the same rationale has been applied in setting the financial assumptions as for the valuation as at 31 March 2016. I consider that it is still appropriate for the financial assumptions to vary according to the term of the particular cash flow being estimated and discounted.
i) Discount ratesI consider that a notional portfolio of assets consisting of cash, appropriate zero-coupon interest rate swap contracts, nominal gilt strips (or notional gilt strips), and inflation swap contracts provides the most appropriate match to the PPF liability cash flows for the purposes of this valuation. Setting the financial assumptions equal to the returns on the elements of this notional portfolio represents a low-risk approach to the setting of the financial assumptions. If the PPF were fully funded (given these assumptions) and invested in the notional portfolio, then ignoring non-investment risks such as future claims on the PPF or demographic experience, the PPF would have a high probability of being able to pay full compensation to all current PPF members and their eligible dependants.
Since around August 2008, zero-coupon interest rate swap yields for longer durations have been lower than the gilts strip yields at the same duration. I therefore consider it reasonable to construct a notional portfolio so that it contains gilt strips (or more often notional gilt strips) at longer durations and cash and swaps contracts at shorter durations.
Because it is difficult to earn close to six month LIBOR interest on cash, a deduction is made from the zero-coupon interest rate swap yields of 15 basis points at each term.
For each term the notional portfolio is assumed to be invested in the higher yielding of the zero-coupon interest rate swaps yield less 15 basis points and gilt strips. In practice, at the valuation date this broadly leads to the use of swaps rate less 15 basis points for terms up to eight years and gilt strip yields thereafter.
P E N S I O N P R O T E C T I O N F U N D | ANNUAL REPORT AND ACCOUNTS 20 16 / 1 7 | 1 2 11 2 0 | P E N S I O N P R O T E C T I O N F U N D | ANNUAL REPORT AND ACCOUNTS 20 16 / 1 7
AC
TUA
RIAL REPO
RTS
Annex M2ASSUMPTIONS

A zero-coupon interest rate swaps yield curve constructed from cash rates, future strips and semi-annual swap rates as at 31 March 2017 was obtained from BlackRock who constructed the curve by seeking indicative prices from a combination of major counterparties and inter-dealer brokers.
A gilt strips yield curve as at 31 March 2017 was also obtained from BlackRock, which was derived from information available from the UK Debt Management Office. This curve shows gilt strips yields at terms of one year to 100 years inclusive. Yields at each of these terms are representative of bonds (or notional bonds) with similar maturities to the indicative terms.
In my opinion, this discount rate derivation is consistent over the long term with the PPF’s Statement of Investment Principles, despite the fact that the PPF currently takes some extra investment risk in the expectation of outperformance.
ii) Revaluation ratesIt has been assumed that the Board will not exercise its power under paragraph 29 of Schedule 7 of the Pensions Act 2004 to amend the maximum revaluation rate of 5 per cent a year in respect of compensation which derives from service before 6 April 2009 and 2.5 per cent a year in respect of compensation which derives from service thereafter.
Future revaluations of deferred compensation are linked to increases in the CPI. In considering what assumption would be appropriate for future CPI increases, it has been noted that at present there is no sufficient market in CPI swaps or indeed any other instruments from which CPI prices can reasonably be inferred. Such current market pricing information as is available from insurance companies would suggest an assumption of CPI increases being 0.6 per cent a year less than RPI increases, which is therefore the assumption that has been made. This compares with an assumption of 0.5 per cent a year less than RPI increases used for the 2016 valuation. Further, it has been assumed that the rate of future RPI increases, for the period from the valuation date to normal pension age, is derived from the RPI inflation swap curve (supplied as at 31 March 2017 by BlackRock).
There are other methods of deriving a CPI assumption and these include, for example, deducting a best estimate of the future gap between RPI and CPI from the market-implied measure of RPI. However, this method would be less consistent with the setting of the other financial assumptions. Should a deeper CPI market develop, the implied gap between RPI and CPI may further increase, although the actual gap that would apply in these circumstances is very uncertain. The sensitivity of the balance sheet has been shown to there being a gap of 1.0 per cent (compared with 0.6 per cent in the main results). This can be seen in Annex S7 of my supplementary report, which concerns the provisions of the PPF as at 31 March 2017.
The revaluation rate over a particular period of deferment is assumed to be equal to the increase in the CPI index over that period, restricted to the revaluation cap applied to that same period. The maximum revaluation rate of 5 per cent a year does not apply at any term, for compensation deriving from service before 6 April 2009. The maximum revaluation rate of 2.5 per cent a year applies for all terms greater than twelve years, for compensation deriving from service after 5 April 2009.
iii) Pension increase ratesIt is assumed that the Board will not exercise its power under paragraph 29 of Schedule 7 of the Pensions Act 2004 to amend the maximum annual increase rate of 2.5 per cent a year, for compensation accrued after 5 April 1997.
P E N S I O N P R O T E C T I O N F U N D | ANNUAL REPORT AND ACCOUNTS 20 16 / 1 7 | 1 2 11 2 0 | P E N S I O N P R O T E C T I O N F U N D | ANNUAL REPORT AND ACCOUNTS 20 16 / 1 7
AC
TUA
RIAL REPO
RTS
Annex M2ASSUMPTIONS

For this compensation increase, therefore, an assumption is needed for each term, for the increase in the CPI capped at 2.5 per cent and with a floor of 0 per cent (referred to as CPI[0, 2.5 per cent]). If there were a market in CPI[0, 2.5 per cent] inflation swaps then a curve of prices for each term would be derivable directly. However such a market does not exist. Therefore, as last year, a CPI[0, 2.5 per cent] curve has been used, which was derived using the Stochastic Alpha Beta Rho (SABR) model calibrated primarily on market price data from securities that are uncapped and those which are capped at 3 per cent and 5 per cent. This curve was supplied by BlackRock.
The table below shows the annualised average term-dependent rates of discount, inflation and increases to pensions in payment as at 31 March 2017 that have been assumed over the given term. The rates are presented as spot rates. Figures shown in brackets are as at 31 March 2016.
Term Discount rate pa
CPI revaluation rate pa
Post 1997 pension increase rate pa
1 0.385% (0.601%) 3.328% (1.490%) 2.285% (1.521%)
2 0.468% (0.645%) 3.122% (1.813%) 2.203% (1.721%)
3 0.549% (0.705%) 3.037% (1.991%) 2.165% (1.795%)
4 0.627% (0.774%) 2.982% (2.095%) 2.141% (1.835%)
5 0.703% (0.854%) 2.937% (2.181%) 2.124% (1.857%)
10 1.179% (1.533%) 2.893% (2.448%) 2.105% (1.935%)
15 1.568% (2.041%) 2.950% (2.630%) 2.121% (1.987%)
20 1.822% (2.352%) 2.945% (2.742%) 2.136% (2.027%)
30 1.779% (2.427%) 2.870% (2.773%) 2.168% (2.068%)
40 1.590% (2.116%) 2.765% (2.720%) 2.183% (2.091%)
50 1.524% (2.131%) 2.767% (2.758%) 2.206% (2.112%)
70 1.459% (2.131%) 2.794% (2.758%) 2.272% (2.112%)
90 1.422% (2.131%) 2.808% (2.758%) 2.343% (2.112%)
Source: BlackRock with, in some cases, additional PPF calculations.
P E N S I O N P R O T E C T I O N F U N D | ANNUAL REPORT AND ACCOUNTS 20 16 / 1 7 | 1 2 31 2 2 | P E N S I O N P R O T E C T I O N F U N D | ANNUAL REPORT AND ACCOUNTS 20 16 / 1 7
AC
TUA
RIAL REPO
RTS
Annex M2ASSUMPTIONS

Financial assumptions where individual membership data is not available
For these schemes it is not possible to use term-dependent rates, as individual member data is required to project cash flows. A roll forward methodology is therefore needed, together with assumptions about the following:• the discount rate in deferment net of revaluation increases in deferment – see Annex M1 for a description of
these increases• the discount rate in payment for non-increasing compensation for current pensioners• the discount rate in payment for non-increasing compensation for future pensioners• the discount rate in payment for increasing compensation for current pensioners net of increases
in payment – see Annex M1 for a description of these increases, and• the discount rate in payment for increasing compensation for future pensioners net of increases
in payment – see Annex M1 for a description of these increases.
Single rates of discount, inflation and pension increases were determined so that the present values placed on the cash flows for both the pensioners and the deferred pensioners were equal to the present value determined using term-dependent rates. To do this, cash flows were used of schemes for which individual member data is held by the PPF. These single rates of discount, inflation and pension increase were then used to determine the net discount rates as set out in the following table. The figures in brackets are those as at 31 March 2016.
Net discount rate pa
In deferment for compensation accrued before April 2009 -1.2% (-0.3%)
In deferment for compensation accrued after April 2009 -0.8% (-0.2%)
In payment for non-increasing compensation for current pensioners 1.5% (1.9%)
In payment for non-increasing compensation for deferred pensioners 1.7% (2.2%)
In payment for increasing compensation for current pensioners -0.5% (0.1%)
In payment for increasing compensation for deferred pensioners -0.5% (0.1%)
d) Demographic assumptions
i) MortalityThe assumption for mortality is in two parts. The first part is the assumption about baseline mortality. This reflects the assumed rates of mortality at the valuation date. The second part of the assumption is an estimate of how mortality rates will change over time. Taken together, these assumptions reflect a best estimate of the mortality that will be experienced by members of the PPF, i.e. that the assumption is equally likely to overstate as to understate actual experience.
P E N S I O N P R O T E C T I O N F U N D | ANNUAL REPORT AND ACCOUNTS 20 16 / 1 7 | 1 2 31 2 2 | P E N S I O N P R O T E C T I O N F U N D | ANNUAL REPORT AND ACCOUNTS 20 16 / 1 7
AC
TUA
RIAL REPO
RTS
Annex M2ASSUMPTIONS

Baseline mortality
For last year’s valuation as at 31 March 2016, a mortality analyst, Club Vita, provided 250 different mortality curves to apply to individual members based on:• member status, i.e. deferred pensioner, pensioner, or dependant• sex• lifestyle (based on postcode)• amount of compensation, and• whether allowance for ill-health retirement is included.
Club Vita has updated its experience dataset since the previous valuation and so has provided more up-to-date mortality curves to use this year. A total of 250 different mortality curves have been used for the valuation as at 31 March 2017.
These curves have been derived by analysing a large amount of data from Club Vita’s members (including the PPF). These curves are based on mortality experienced over the period 2012-2014.
Where individual life expectancy curves were not available (for example where individual member data was received after the mortality curves were mapped), Club Vita provided mortality curves which reflect average assumed mortality across the whole PPF membership. There were ten average mortality curves, which varied according to the factors set out above. The ten average curves are included in the count of the curves used in the valuations.
Allowance for changes in mortality over time
For the valuation as at 31 March 2016, the CMI 2014 core model of mortality projections was adopted, with a long-term improvement rate of 1.5 per cent a year for both men and women.
There is insufficient evidence to suggest that the long-term improvement rate should be changed from the assumption adopted last year, although I recommend that this assumption should be kept under review.
The CMI updates its model annually to reflect more up-to-date data. A feature of this additional data recently has been unusually heavy rates of mortality around 2015. These are influential in the CMI 2015 core model, and have been reinforced in the CMI 2016 model. I believe it would be appropriate to move to the CMI 2015 core model for this valuation and then to review the suitability of the CMI 2016 model and subsequent models at future valuations.
For this valuation, the CMI 2015 core mortality projection has therefore been adopted, with a long-term improvement rate of 1.5 per cent a year for both men and women.
It should be recognised that there is a substantial element of subjectivity about mortality improvement assumptions and that different actuaries will come to different conclusions. The appropriate assumption for future valuations should be kept under review and the sensitivity of the balance sheet has shown to both the assumed long-term rate of improvement and the use of the new CMI 2016 core projection model. These results may be seen in Annex S7 of my supplementary report which has been prepared concerning the provisions of the PPF as at 31 March 2017.
Life expectancies implied by the mortality assumptions
The following table illustrates the life expectancies of pensioners and dependants aged 65 on 31 March 2017, and life expectancies for members aged 40 on 31 March 2017 once they reach age 65 in 2042. These are based on the range of mortality assumptions being used for this valuation for different members, including the allowance for projected changes in mortality.
Annex M2ASSUMPTIONS
P E N S I O N P R O T E C T I O N F U N D | ANNUAL REPORT AND ACCOUNTS 20 16 / 1 7 | 1 2 51 24 | P E N S I O N P R O T E C T I O N F U N D | ANNUAL REPORT AND ACCOUNTS 20 16 / 1 7
AC
TUA
RIAL REPO
RTS

The figures in brackets show the life expectancies based on the assumptions adopted in the valuation as at 31 March 2016.
Men
Membership group Median life expectancy in
years
Minimum life expectancy in
years
Maximum life expectancy in
years
Range of life expectancies,
in years, which covers 75% of compensation
2017: - Male pensioners - Future widowers
22.2 (22.0) 20.5 (20.9)
14.7 (14.7) 14.7 (14.7)
24.7 (24.6) 21.1 (21.4)
20.4-24.2 (20.6-23.9) 18.4-21.1 (18.7-21.4)
2042: - Male pensioners - Future widowers
24.6 (24.8) 23.4 (23.8)
20.6 (20.9) 17.7 (17.7)
27.5 (27.5) 24.0 (24.4)
23.3-25.9 (23.0-26.0) 21.8-24.0 (21.7-24.4)
Women
Membership group Median life expectancy in
years
Minimum life expectancy in
years
Maximum life expectancy in
years
Range of life expectancies,
in years, which covers 75% of compensation
2017: - Female pensioners - Future widows
24.2 (24.4) 23.9 (23.9)
18.7 (19.0) 18.7 (19.0)
27.0 (27.3) 27.0 (27.3)
23.0-25.4 (22.7-25.5) 23.0-25.2 (23.0-25.4)
2042: - Female pensioners - Future widows
27.2 (27.5) 26.3 (26.6)
23.3 (24.2) 22.2 (22.4)
29.2 (29.1) 29.7 (30.0)
26.1-28.2 (26.2-28.3) 26.0-27.3 (25.8-27.4)
Note that the minimum life expectancy is the shortest life expectancy of the member in the particular category across the various Club Vita groupings (which vary according to postcode and pension amount). The maximum life expectancy is determined in a corresponding way.
Note also that some of the change in life expectancy from year to year will be due to the membership changing (for example, because of newly transferring schemes) and not solely due to changes in experience.
For deferred members, different Club Vita mortality curves are used before retirement and after retirement. In particular, the pre-retirement curves are based on data for members deemed to be in normal health whereas the pensioner curves also include data for members who have taken ill health early retirement.
ii) Commutation, early retirement and late retirement
No allowance is made for commutation of compensation, early retirement or late retirement. This is because the option terms are anticipated to be set (and monitored in future) such that the value of a member’s benefits is broadly unchanged by them exercising one of these options. Therefore, members exercising these options would only change the pattern of compensation cashflows and not the value placed on the liabilities for this purpose.
iii) Proportion married
For pensioners:Where there was provision in the former scheme for survivor pensions for relevant partners an assumption consistent with 85 per cent (males) or 75 per cent (females) at normal pension age.
Annex M2ASSUMPTIONS
P E N S I O N P R O T E C T I O N F U N D | ANNUAL REPORT AND ACCOUNTS 20 16 / 1 7 | 1 2 51 24 | P E N S I O N P R O T E C T I O N F U N D | ANNUAL REPORT AND ACCOUNTS 20 16 / 1 7
AC
TUA
RIAL REPO
RTS

Where there is no provision for survivor pensions for relevant partners other than legal spouses an assumption consistent with 75 per cent (males) or 65 per cent (females) at normal pension age.
For deferred pensioners:
Where there was provision in the former scheme for survivor pensions for relevant partners an assumption, at the assumed date of retirement or earlier death, of 85 per cent (males) or 75 per cent (females).
Where there is no provision for survivor pensions for relevant partners other than legal spouses an assumption, at the assumed date of retirement or earlier death, of 75 per cent (males) or 65 per cent (females).
These assumptions are the same as the assumptions adopted last year and are consistent with current market pricing information available from insurance companies.
iv) Age difference between member and dependant
Females assumed to be three years younger than males.
This assumption is the same as the assumption adopted last year and is consistent with current market pricing information available from insurance companies.
The assumed proportion married and age difference between member and dependant are broadly consistent with the recent experience of the PPF although some changes to these assumptions could be justified in the light of recent experience.
I recommend that these assumptions for future valuations should be kept under review and the sensitivity of the balance sheet has been shown to some alternative assumptions based on recent experience. These results may be seen in Annex S7 of my supplementary report which has been prepared concerning the provisions of the PPF as at 31 March 2017.
v) Children’s pensions
No specific additional allowance is included for prospective children’s pensions. Children’s pensions that are already in payment are allowed for. They are assumed to cease in accordance with the compensation entitlement, with no allowance for death prior to cessation. Compensation ceases at age 18, or until the person ceases full-time education (up to a maximum of age 23). Where an anticipated end date for full-time education is not held by the PPF, age 23 is assumed.
vi) Expenses
Certain administration expenses are met from the PPF rather than from the Administration Fund. These are the cost associated with paying members compensation and the investment management expenses.
An allowance equal to 3.3 per cent of the value of the liabilities in respect of members who have transferred into the PPF before 1 April 2017 has been made in respect of the expected future cost of these expenses.
When estimating the future cost associated with paying members the current expected cost of the relevant business areas (including an allowance for the relevant support functions) has been converted to a per member cost. This cost has been projected to increase in line with assumed inflation in each future year and then compared to the projected membership at the relevant time. The projected membership has been determined using the demographic assumptions set out above. Finally, the projected cost in each future year has then been discounted to a present value using the discount rates set out above.
Annex M2ASSUMPTIONS
P E N S I O N P R O T E C T I O N F U N D | ANNUAL REPORT AND ACCOUNTS 20 16 / 1 7 | 1 2 71 2 6 | P E N S I O N P R O T E C T I O N F U N D | ANNUAL REPORT AND ACCOUNTS 20 16 / 1 7
AC
TUA
RIAL REPO
RTS

The investment management expenses have been taken as the estimated current Annual Management Charge that would apply to a passive gilt fund as a proxy for the cost of investing the notional portfolio used to determine the appropriate discount rate.
This year’s approach to determine the cost associated with paying compensation is different to that adopted previously and has resulted in an allowance of 3.3 per cent of liabilities compares to an allowance of 3.0 per cent in the previous year’s valuation.
vii) GMP equalisation
Schemes for which the Board assumed responsibility on or after 1 June 2013 were required to equalise members’ compensation prior to transfer (with a small number of exceptions). For these schemes therefore, the data includes compensation amounts that have already been adjusted for any inequalities on account of GMP.
For former members of all other schemes, the Board has undertaken, although has not yet completed, work to adjust compensation that is unequal (between men and women) on account of inequalities in GMPs. For those members where the Board’s equalisation work is not yet complete, an allowance needs to be made for the expected cost of increasing compensation in order to achieve equalisation. This allowance has been calculated based on the cost of the compensation increases for that part of the transferred membership whose compensation increases in respect of GMP equalisation had been calculated by 1 July 2015.
The cost included is 0.6 per cent of the actuarial liabilities for deferred pensioners and 1.2 per cent of the actuarial liabilities for pensioners whose benefits had not been equalised at the valuation date.
This allowance was calculated by reference to:
• the proportion of the total membership (excluding schemes that were already equalised at the point of transfer to the PPF) eligible for GMP equalisation, and
• the actual impact of GMP equalisation implemented for around 160,000 eligible members (deferred pensioners and pensioners) in 2015 equating to around 90 per cent of the membership that will ultimately be assessed by or on behalf of the PPF for potential inequalities in their GMP entitlement.
The allowance is consistent with that used in the valuation as at 31 March 2016.
viii) The long service cap
From 6 April 2017 the long service cap comes into effect for members who have 21 or more years’ service in their transferred scheme. For these members the cap will be increased by three per cent for each full year of pensionable service above 20 years, up to a maximum of double the standard cap.
The data used for assessing the liabilities as at 31 January 2017 did not include the increase in compensation from 6 April 2017 that will apply to eligible members. Instead a separate extract was provided giving the uplifts that will apply. In order to allow for this additional liability, these uplifts were valued and expressed as a percentage increase to the pensioner liability. This was calculated as equivalent to an overall increase to pensioner liabilities of 0.25 per cent.
Work is currently ongoing to identify deferred members who will benefit in future from this change in compensation. For the purpose of this valuation it has been assumed that the impact on the deferred liabilities will be the same as for pensioners.
Annex M2ASSUMPTIONS
P E N S I O N P R O T E C T I O N F U N D | ANNUAL REPORT AND ACCOUNTS 20 16 / 1 7 | 1 2 71 2 6 | P E N S I O N P R O T E C T I O N F U N D | ANNUAL REPORT AND ACCOUNTS 20 16 / 1 7
AC
TUA
RIAL REPO
RTS

To: The Board of the Pension Protection Fund
From: Danny Wilding, Appointed Actuary to the Board of the Pension Protection Fund
Actuarial liabilities, provisions and contingent liabilities of the Pension Protection Fund as at 31 March 2017
1. IntroductionThe Board of the Pension Protection Fund (the Board) is required by paragraph 22 of schedule 5 to the Pensions Act 2004 to prepare a statement of accounts in respect of each financial year. Each statement of accounts must contain an actuarial valuation of the assets and liabilities of the PPF. This actuarial valuation is set out in my report to the Board dated 21 June 2017.
The statement of accounts also contains provisions and discloses contingent liabilities that require actuarial estimation. This supplementary report contains these estimates. This supplementary report also contains actuarial balance sheets for the PPF showing actuarial liabilities and provisions in comparison with the corresponding assets.
The Board is responsible for the accounting policies, and this report has been prepared within the framework which it has determined. Although this report has not been explicitly commissioned, it has, nevertheless, been prepared for the Board to assist with the preparation of the Annual Report and Accounts as at 31 March 2017. I therefore see the Board as the user of this report and no other party should rely on any part of this report.
This report does not contain advice on the funding of compensation payable by the PPF. In particular, the results of this valuation are not used in the determination of the levy.
In my view, while the Actuaries’ Code issued by the Actuarial Profession applies to this valuation, there are no technical professional practice standards which directly apply. However, this valuation has been prepared having regard to the principles set out in the Technical Actuarial Standard TAS 100 (“Principles for Technical Actuarial Work”). This report should be considered alongside my report to the Board dated 21 June 2017. Given the scope of the work, the process and calculations underlying the report, together with the report itself, should be subject to an independent peer review under the Actuarial Profession’s practice standard APS X2 (“Review of Actuarial Work”). This has been undertaken by the Government Actuary’s Department.
2. ProvisionsUnder International Accounting Standard 37 (IAS 37) of the International Accounting Standards Board a provision should be recognised when:
• an entity has a present obligation (legal or constructive) as a result of a past event
• it is probable that a transfer of economic benefits will be required to settle the obligation, and
• a reliable estimate can be made of the amount of the obligation.
The application of this requirement in the accounting standard to the Board’s statement of accounts as at 31 March 2017 is set out in Annex S1.
P E N S I O N P R O T E C T I O N F U N D | ANNUAL REPORT AND ACCOUNTS 20 16 / 1 7 | 1 2 91 2 8 | P E N S I O N P R O T E C T I O N F U N D | ANNUAL REPORT AND ACCOUNTS 20 16 / 1 7
AC
TUA
RIAL REPO
RTS
Actuary’s supplementary report as at 31 March 2017

3. Contingent liabilitiesUnder IAS 37, a contingent liability is not recognised as a liability because it is either:
• a possible obligation (it has not yet been confirmed whether there is an obligation that could lead to a transfer of economic benefits), or
• a present obligation that does not meet the recognition criteria in IAS 37, i.e. it is not probable that a transfer of economic benefits will be required to settle the obligation, or a sufficiently reliable estimate of the amount of the obligation cannot be made.
A contingent liability should, however, be disclosed if the possibility of an outflow of economic benefit to settle an obligation is more than remote. The application of this requirement in the accounting standard to the Board’s statement of accounts for the financial period ending on 31 March 2017 is set out in Annex S2.
The schemes forming the contingent liabilities of types I, II and III (as defined in Annex S2) are determined by the Board and the values have been calculated accordingly. However, it should be noted that claims arising after 31 March 2017 could arise from sources other than those described in the definitions for these contingent liabilities. For the avoidance of doubt, the contingent liabilities of types I, II and III are not meant to represent the expected level of claims in the coming year.
The FReM also requires the PPF’s material remote contingent liabilities to be disclosed and, where practical, the financial impact of these. The schemes forming these are those remaining defined benefit schemes which may in the future make a claim on the PPF but which are not included in the provisions or contingent liabilities. The Board and I consider it impractical to calculate this liability accurately and reasonable to make no allowance in the valuation.
4. DataThe data used for this valuation is summarised in Annex S3.
5. Compensation provided by the PPFThe compensation provided by the PPF is summarised in Annex M1 of my report to the Board dated 21 June 2017.
6. AssumptionsThe assumptions used to calculate the actuarial liabilities are set out in full in Annex M2 of my report to the Board dated 21 June 2017.
The set of assumptions used in order to calculate the provisions and contingent liabilities as at 31 March 2017 are in most respects the same as those used to calculate the actuarial liabilities. The differences are shown in Annex S4.
A sensitivity analysis has been performed by amending the valuation basis in key areas. The assumptions adopted for the sensitivity analysis are shown in Annex S5.
P E N S I O N P R O T E C T I O N F U N D | ANNUAL REPORT AND ACCOUNTS 20 16 / 1 7 | 1 2 91 2 8 | P E N S I O N P R O T E C T I O N F U N D | ANNUAL REPORT AND ACCOUNTS 20 16 / 1 7
AC
TUA
RIAL REPO
RTS
Actuary’s supplementary report as at 31 March 2017

7. Method to calculate the assets, actuarial liabilities, provisions and contingent liabilities
a) Actuarial liabilities
The method of calculating the actuarial liabilities is set out in my report to the Board dated 21 June 2017.
b) Provisions
To determine whether a provision is required for a scheme it is necessary to determine whether as at the insolvency date the value of the assets was less than the amount of Protected Liabilities (see Annex S1). This is determined in the first instance from consideration of any notice issued in respect of the scheme under section 144 or 145 of the Pensions Act 2004. Where no such notice has been issued, consideration is then given to any internal reports indicating the likely funded status of the scheme at the insolvency date. For all schemes not already categorised under the two preceding steps, assumptions to determine the funded status at the insolvency date are derived from market conditions as at the insolvency date following the published guidance on undertaking a valuation in accordance with section 179 of the Pensions Act 2004 (version as in force as at the insolvency date). This guidance is available on the PPF website:
www.pensionprotectionfund.org.uk/TechnicalGuidance/Pages/ValuationGuidance.aspx
In addition to the steps above, if more recent information is available that gives a better indication of the likelihood of the scheme transferring this is used to determine whether a provision is required. This approach has been used for 28 schemes.
The method of calculating the provisions varied according to the data that the Board was holding about the relevant schemes as at 31 March 2017.
1. Updated asset value information and recent membership data
This information was obtained from certain schemes classified as ‘material schemes’. These are schemes which:
(i) satisfy the definition of a provision as set out in Annex S1;
(ii) are sufficiently large (broadly those which were included as material schemes in the valuation as at 31 March 2016 and are still in assessment and expected to transfer, plus new schemes which entered assessment since 31 March 2016 and have estimated liabilities of at least £75m); and
(iii) actually did provide individual membership data and updated asset information when requested.
For ten of the thirteen material schemes, membership data and updated asset information were provided at effective dates between 2 September 2016 and 22 November 2016. No further membership data was provided for the remaining three schemes as no material changes to the data had occurred since the previous valuation; for these schemes the membership data was taken to be the same as that used for the 2016 valuation and, after investigation, the asset figures and splits were updated.
For all material schemes, the asset value at 31 March 2017 was determined by rolling forward the latest available asset value in line with the change in a total return index of an appropriate kind for each asset class and making an adjustment for benefits paid between the effective date of the assets and 31 March 2017. For material schemes where no updated asset information was requested, the roll forward value of the assets was checked against updated asset information available for other purposes. These comparisons disclosed no material differences.
P E N S I O N P R O T E C T I O N F U N D | ANNUAL REPORT AND ACCOUNTS 20 16 / 1 7 | 1 3 11 3 0 | P E N S I O N P R O T E C T I O N F U N D | ANNUAL REPORT AND ACCOUNTS 20 16 / 1 7
AC
TUA
RIAL REPO
RTS
Actuary’s supplementary report as at 31 March 2017

In a similar way as for transferred schemes, liabilities were initially calculated as at 28 February 2017, based on assumptions derived from market conditions as at 28 February 2017. The change in market conditions to 31 March 2017 was then allowed for by applying a ratio of the discounted projected cash flows for transferred schemes payable after 28 February 2017, calculated using the assumptions at the respective dates. The change in calculation date to 31 March 2017 is also allowed for by unwinding the discount rate for one month and deducting the benefit outgo in respect of March 2017.
Allowance has been made for expected member movements between the effective date of the data and the valuation date.
Material schemes in assessment and schemes which have already transferred to the PPF (excluding those valued by rolling forward a section 179 valuation) account for approximately 96 per cent of the total liabilities and provisions.
Note that there was one scheme which entered assessment in December which would have been treated as ‘material’ were individual member data obtained in time. This scheme was valued in the same way as all the other schemes, as noted below.
2. A section 179 valuation or a section 143 valuation, but not updated asset and membership data
If the scheme was to be included in the provisions, the section 179 or section 143 valuation was rolled forward to 31 March 2017 on the valuation basis.
The methodology used to roll the section 179 or a section 143 valuation results forward to 31 March 2017, at the same time changing the valuation assumptions to those described in Annex S4, is consistent with that to be applied for the calculation of levy in the financial year 1 April 2017 to 31 March 2018 (ignoring smoothing and stressing of assets and liabilities and noting that no scheme for which this roll forward approach was adopted had any Asset-Backed Contributions). The methodology is available in the Pension Protection Levy section of the PPF website at:
http://www.pensionprotectionfund.org.uk/LEVY/Pages/1718LevyDetermination.aspx
3. A Minimum Funding Requirement (MFR) valuation, but not updated asset and membership data, nor a section 179 valuation nor a section 143 valuation
The MFR valuation was initially transformed to a section 179 valuation (guidance version G3/A3) at the MFR valuation date using a methodology consistent with that available in the Pension Protection Levy section of the PPF website using the link above.
In practice only one scheme was assessed based on an MFR valuation and the transformed section 179 valuation has been used for the purpose of the calculations.
• The resulting section 179 valuation was rolled forward to the insolvency date and used as a proxy for a section 143 valuation to determine whether the scheme was in deficit at the insolvency date and hence whether it should be included in the provisions.
• If the scheme were to be included in the provisions, the resulting section 179 valuation was then rolled forward to 31 March 2017 on the valuation basis using the same methodology.
P E N S I O N P R O T E C T I O N F U N D | ANNUAL REPORT AND ACCOUNTS 20 16 / 1 7 | 1 3 11 3 0 | P E N S I O N P R O T E C T I O N F U N D | ANNUAL REPORT AND ACCOUNTS 20 16 / 1 7
AC
TUA
RIAL REPO
RTS
Actuary’s supplementary report as at 31 March 2017

4. Schemes withdrawn from assessment (as overfunded on a section 143 valuation)
For schemes where it is considered probable that they will ultimately transfer to the PPF, an allowance has been made based on a roll forward of the assets and liabilities. The roll forward is typically based on the latest available s179 valuation.
5. No updated asset and membership information, nor a section 179 valuation, nor a section 143 valuation, nor an MFR valuation.
It was assumed that the scheme was in deficit at the insolvency date. The scheme’s provision was estimated as the median provision for schemes where data was available. In total six schemes have been valued in this way.
In a similar way as for schemes that have transferred to the PPF, a provision has been included for the cost of GMP equalisation and future expenses; see Annex S4 for further details.
c) Contingent liabilities
The method adopted for contingent liabilities of type I, II or III was the same as that for the provisions where the Board was in possession of a section 179 valuation. This was the same method as adopted last year. The method adopted for type IV contingent liabilities is set out in Annex S2.
Additionally, loadings to reflect the impact of GMP equalisation and future expenses were applied to the liabilities forming the contingent liabilities of type I, II or III. These loadings were equal to the loadings applied to the provisions, as set out in Annex S4.
The valuation of schemes based on the roll forward method will not be as accurate as one undertaken using individual or grouped membership data for each scheme. Generally there is no reason to doubt the quality of the information provided within a particular scheme’s valuation report. It is important, however, to note that any errors contained within the original scheme valuation will carry through to this valuation.
8. Results of the calculationsThe results of the calculations of the actuarial liabilities, provisions and contingent liabilities are set out in Annex S6. The results as at 31 March 2016 are also shown using the assumptions set out in the Report and Accounts as at 31 March 2016.
It is my opinion that the data collection processes and calculation methods described in Section 7 have resulted in calculations that represent a reasonable estimate of provisions and contingent liabilities in aggregate for the PPF. It should be recognised that the use of summary data and roll forward methodologies inevitably introduce approximations into the calculations, but I consider they remain appropriate for calculating aggregate provisions and contingent liabilities for the purposes of this supplementary report.
Actuary’s supplementary report as at 31 March 2017
P E N S I O N P R O T E C T I O N F U N D | ANNUAL REPORT AND ACCOUNTS 20 16 / 1 7 | 1 3 31 3 2 | P E N S I O N P R O T E C T I O N F U N D | ANNUAL REPORT AND ACCOUNTS 20 16 / 1 7
AC
TUA
RIAL REPO
RTS

9. Actuarial Balance SheetsAnnex S7 sets out the actuarial balance sheet for the PPF as at 31 March 2017, including the liabilities of the schemes forming the provisions. For this purpose the liabilities are taken to be:
(a) the present value of the liabilities of the PPF to pay sums or transfer property, as required under section 173(3) of the Pensions Act 2004. This includes the liabilities in respect of compensation to members of schemes for which the Board has assumed responsibility. The total value is taken as £21,979.0m, the same figure as was used in my actuarial valuation report of 21 June 2017, and
(b) an estimate of the present value of the liabilities of the schemes forming the provisions, as set out in Annex S6 of this report, which amounts to £6,080.2m.
Accordingly the total liabilities including provisions of the Pension Protection Fund as at 31 March 2017 have been taken as £28,059.2m.
In the actuarial balance sheets for the PPF as at 31 March 2017, the assets are:
(a) the value of the Pension Protection Fund assets determined in accordance with regulations 2, 4 and 5 of the Pension Protection Fund (Valuation of the Assets and Liabilities of the Pension Protection Fund) Regulations 2006 (SI 2006/597) - this value is taken as £28,715.7m, the same figure as was used in my actuarial valuation report of 21 June 2017, and
(b) the sum of the estimated values of the assets in the schemes that generated the provisions described in Section 2 of this report, plus any anticipated recoveries estimated on a prudent basis (£777.5m) - this figure amounts to £5,405.8m. Annex S1 provides further details on adjustments made to the asset values for three schemes with non-standard circumstances.
Accordingly the value of the assets of the Pension Protection Fund as at 31 March 2017 has been taken as £34,121.5m.
10. Reconciliation of the change in the funding positionAnnex S8 shows a reconciliation of the opening and closing net funding position in the actuarial balance sheet for the Pension Protection Fund, including the schemes that generate the provisions.
Signed:
Name: Danny Wilding, Appointed Actuary
Date: 21 June 2017
Job Title: Partner
Qualification: Fellow of the Institute and Faculty of Actuaries
Employer: Barnett Waddingham LLP
Actuary’s supplementary report as at 31 March 2017
P E N S I O N P R O T E C T I O N F U N D | ANNUAL REPORT AND ACCOUNTS 20 16 / 1 7 | 1 3 31 3 2 | P E N S I O N P R O T E C T I O N F U N D | ANNUAL REPORT AND ACCOUNTS 20 16 / 1 7
AC
TUA
RIAL REPO
RTS

P E N S I O N P R O T E C T I O N F U N D | ANNUAL REPORT AND ACCOUNTS 20 16 / 1 7 | 1 3 51 3 4 | P E N S I O N P R O T E C T I O N F U N D | ANNUAL REPORT AND ACCOUNTS 20 16 / 1 7
AC
TUA
RIAL REPO
RTS
ProvisionsThe Statement of Accounts as at 31 March 2017 contains provisions in respect of eligible schemes as defined in section 126 of the Pensions Act 2004 in relation to which:• an insolvency event notice under section 120 of the Pensions Act 2004 had been received by the Board from an
insolvency practitioner on or before 31 March 2017• the Board had not stated on or before 31 March 2017 that the insolvency event was not a qualifying insolvency
event• the insolvency date was on or before 31 March 2017• a withdrawal notice under section 122(2)(b) of the Pensions Act 2004 had not been received on or before 31
March 2017 (and, in the Board’s judgement, is unlikely to be received) from the insolvency practitioner• as at the insolvency date, the value of the assets was, in the Board’s judgement, likely to have been less than the
amount of the Protected Liabilities as defined in section 131 of the Pensions Act 2004 (determined on the section 143 basis as at the insolvency date), and
• transfer to the PPF had not taken place on or before 31 March 2017.
It also contains provisions in respect of schemes which have completed an assessment period and which are expected to enter the PPF in due course. For these schemes, a section 143 valuation (or funding determination) has already been completed by the trustees and this showed an excess of assets over Protected Liabilities. They are included as provisions if there is an expectation that they will successfully reapply for PPF entry, either before expiry of the section 143 six month period during which the trustees can attempt to secure a buyout, or after a period of time running as a closed scheme. There are 14 such schemes included in the provisions.
The Board has also considered the following in the provisions:• Schemes which had, in the Board’s judgement, a surplus of assets over the value of the Protected Liabilities at the
insolvency date, but which may ultimately enter the PPF. 7 schemes were identified as meeting this criteria and a provision has been calculated as set out above.
There are two schemes with the same sponsor currently in an assessment period which in aggegrate have a material deicit. An agreement has recently been reached with the Pensions Regulator which will ensure that there is no material claim on the PPF for these schemes. I understand that under the terms of the agreement members will be given the option to transfer to a new scheme outside the PPF. At this stage it is difficult to determine what proportion of the scheme will ultimately transfer and therefore what additional funds will be made available to the PPF. For the purpose of this valuation the liabilities of both schemes have been valued in their entirety and the assets (including assumed recoveries) have been restricted to the value of liabilities.
Schemes which as a result of the valuation process set out in Annex S3, have a surplus of assets over the estimated value of the Protected Liabilities at the valuation date, and therefore would contribute a negative amount to the provisions. In total there were 21 schemes that have a surplus of assets at the valuation date. One of these was significant since the scheme is very large and, again the assets (including assumed recoveries) have been restricted to the value of the liabilities to avoid the risk of overstating the funding position for this scheme.
When carrying out the sensitivity analysis as set out in Annex S5 for the three schemes discussed above that have been assumed to contribute a nil amount to the provisions, the assets have been unchanged from the main valuation results, meaning the assets will not exactly match the liabilities for these alternative scenarios.
Some schemes may have experienced insolvency events that occurred on or before 31 March 2017 but which have not yet been reported. It might be appropriate to set up an ‘IBNR’ (Incurred But Not Reported) reserve to cover these schemes. Analysis of recent years’ claim patterns suggests that there will be very few, if any such schemes, and that such schemes are likely to be immaterial and in any case almost impossible to place a reliable value on. Therefore consistent with the approach adopted last year, an IBNR reserve has not been set up.
Annex S1 PROVISIONS IN THE STATEMENT OF ACCOUNTS
FOR THE FINANCIAL PERIOD ENDING ON 31 MARCH 2017

P E N S I O N P R O T E C T I O N F U N D | ANNUAL REPORT AND ACCOUNTS 20 16 / 1 7 | 1 3 51 3 4 | P E N S I O N P R O T E C T I O N F U N D | ANNUAL REPORT AND ACCOUNTS 20 16 / 1 7
AC
TUA
RIAL REPO
RTS
Contingent LiabilitiesFour types of contingent liabilities are disclosed in footnotes to the Statement of Accounts. The definitions of the four categories are given below.
1. Type I contingent liabilities are in respect of eligible schemes where:• an insolvency event notice under section 120 of the Pensions Act 2004 was received by the Board from an
insolvency practitioner on or before 31 March 2017
• the Board had stated on or before 31 March 2017 that the insolvency event was NOT a qualifying insolvency event
• in the Board’s judgement, a subsequent insolvency event which will be a qualifying insolvency event is likely
• the Board has sufficient data about the scheme to be able to make an estimate of a contingent liability, and
• as at 28 February 2017, the value of the assets was, in the Board’s judgement, likely to have been less than the amount of the Protected Liabilities, as defined in section 131 of the Pensions Act 2004.
2. Type II contingent liabilities are in respect of eligible schemes where:• in the Board’s judgement, as at 31 March 2017, no insolvency event has taken place, but the Board is
nonetheless expecting to receive an insolvency event notice under section 120 of the Pensions Act 2004 from an insolvency practitioner in the future
• the Board has sufficient data about the scheme to be able to make an estimate of a contingent liability, and
• as at 28 February 2017, the value of the assets was, in the Board’s judgement, likely to have been less than the amount of the Protected Liabilities, as defined in section 131 of the Pensions Act 2004.
3. Type III contingent liabilities are in respect of eligible schemes where:• Either:
i. the Experian insolvency scores at 31 January 2017 would place the schemes in Levy Band 10 as set out in the Levy Rate Table in the Insolvency Risk Appendix to the Board’s Determination for levy year 2017/18. A link to this page can be found in secton 7 of my supplementary report, or
ii. the employer has a credit rating in the lowest category, and the scheme is estimated to be one of the 500 largest risks to the PPF (as measured by the liabilities) and
• the Board has sufficient data about the scheme to be able to make an estimate of a contingent liability, and
• as at 28 February 2017, the value of the assets was, in the Board’s judgement, likely to have been less than the amount of the Protected Liabilities as defined in section 131 of the Pensions Act 2004.
For the purpose of (ii) above the employers’ credit ratings are determined using either actual or market-implied ratings.
Type III contingent liabilities exclude any scheme already within the provisions or type I or type II contingent liabilities.
Out of a population of around 6,000 schemes considered as part of (i) above, 185 which had not already been included in the allowance for type II contingent liabilities had an insolvency score which placed them in Levy Band 10. Of these 185 schemes, 133 were in deficit on the assumptions used to assess entry to the PPF.
Annex S2 CONTINGENT LIABILITIES IN THE STATEMENT OF ACCOUNTS
FOR THE FINANCIAL PERIOD ENDING ON 31 MARCH 2017

P E N S I O N P R O T E C T I O N F U N D | ANNUAL REPORT AND ACCOUNTS 20 16 / 1 7 | 1 3 71 3 6 | P E N S I O N P R O T E C T I O N F U N D | ANNUAL REPORT AND ACCOUNTS 20 16 / 1 7
AC
TUA
RIAL REPO
RTS
Out of the top 500 risks considered as part of (ii) above, no employer had the lowest credit rating available and had not already been included in the 185 schemes identified as part of (i) above.
It should be noted that, in practice, the schemes contributing to the type III contingent liabilities often change considerably from one year to the next.
4. Type IV contingent liabilities relate to legislative changes anticipated to be passed by Parliament, where such changes will impact PPF compensation.
The provisions in the Pensions Act 2014 to increase the PPF compensation cap for members with long service has been allowed for as a current obligation of the PPF.
Therefore, no allowance for any future legislative changes has been allowed for in this assessment.
Annex S2 CONTINGENT LIABILITIES IN THE STATEMENT OF ACCOUNTS
FOR THE FINANCIAL PERIOD ENDING ON 31 MARCH 2017

P E N S I O N P R O T E C T I O N F U N D | ANNUAL REPORT AND ACCOUNTS 20 16 / 1 7 | 1 3 71 3 6 | P E N S I O N P R O T E C T I O N F U N D | ANNUAL REPORT AND ACCOUNTS 20 16 / 1 7
AC
TUA
RIAL REPO
RTS
Annex S3 DATA
Data
a) Data in respect of PPF membersThis data was shown in my report to the Board dated 21 June 2017.
b) Data in respect of provisions and contingent liabilitiesThere are 98 schemes which contribute to the provisions figure in the statement of accounts for the financial period ending on 31 March 2017. Liabilities in respect of another 5 schemes have not been recognised, i.e. not included in the provisions, because the value of their assets was, in the Board’s judgement, likely to have exceeded the amount of the Protected Liabilities at their insolvency date. For type I, type II and type III contingent liabilities the recognition test assessment was undertaken at 28 February 2017 since a qualifying insolvency event had not occurred.
A database is maintained for schemes forming the provisions. Data used to identify these schemes is obtained from information sent to the PPF on an employer’s insolvency. This data is updated when new information arises. For instance, when a claim is rejected by the PPF, the database is updated to reflect this information and the scheme is no longer included in the provisions calculations.
For material schemes, the PPF actively seeks from trustees up-to-date individual member data and current asset values where appropriate. For all other schemes the latest section 179 valuation provided for levy purposes or section 143 valuation is used to assess asset and liability values. The section 179 valuation used will be that held on Exchange at the 31 March preceding insolvency. This year individual member data could not be obtained for one scheme that came into assessment in December which would usually be deemed material in time for the valuation calculations. These were valued using section 179 data.
In order to identify the schemes to be included in the type I, II and III contingent liabilities, information is used that the PPF has gathered from sources such as Experian, negotiations with companies and information submitted by the Pensions Regulator. The data used to place a value on their assets and liabilities is taken from the latest section 179 valuation provided for levy invoicing purposes. Type IV contingent liabilities relate to generic legislative changes rather than specific individual schemes, as detailed in Annex S2.

The numbers of schemes contributing to the various types of provisions and contingent liabilities of type I, II and III are given in the table below. Figures in brackets relate to the total number of schemes considered for inclusion, i.e. it includes schemes where the value of their assets was, in the Board’s judgement, likely to have exceeded the amount of the Protected Liabilities at their insolvency date for provisions and the calculation date for contingent liabilities. All of the figures seek to recognise all segregated parts of schemes as separate schemes. This is the same treatment as was adopted at 31 March 2016.
Liability Number of schemes
recognised
Number of pensioners *
Number of deferred
pensioners *
Provision 20172016
98 (103 in total)120 (129 in total)
40,03742,153
42,46749,975
Provision – IBNR 20172016
0 (0 in total) 0 (0 in total)
00
00
Type I contingent liability 20172016
0 (0 in total) 0 (0 in total)
00
00
Type II contingent liability 20172016
9 (9 in total)9 (9 in total)
100,007101,071
63,29366,064
Type III contingent liability 20172016
133 (185 in total)161 (215 in total)
9,80212,011
13,30717,083
* Data in respect of recognised schemes only.
Information regarding membership splits by sex, category and benefit amounts are not generally collected for the schemes forming the provisions and contingent liabilities; hence it has not been possible to provide such summary data about schemes in the various liability categories.
As the PPF does not hold member-by-member data for all the schemes forming the provisions, it is not possible to indicate the incidence of cash flows relating to the schemes forming the provisions. However, when collecting data for material schemes information was obtained relating to the individual pensioners in payment and deferred pensioners. This indicated that the shape of the cash flows for schemes forming the provisions is not dissimilar to that for transferred schemes.
Annex S3 DATA
P E N S I O N P R O T E C T I O N F U N D | ANNUAL REPORT AND ACCOUNTS 20 16 / 1 7 | 1 3 91 3 8 | P E N S I O N P R O T E C T I O N F U N D | ANNUAL REPORT AND ACCOUNTS 20 16 / 1 7
AC
TUA
RIAL REPO
RTS

Annex S4 ASSUMPTIONS
P E N S I O N P R O T E C T I O N F U N D | ANNUAL REPORT AND ACCOUNTS 20 16 / 1 7 | 1 3 91 3 8 | P E N S I O N P R O T E C T I O N F U N D | ANNUAL REPORT AND ACCOUNTS 20 16 / 1 7
AC
TUA
RIAL REPO
RTS
AssumptionsAll assumptions will be either the same as, or derived in the same way as, those derived for the valuation as at 31 March 2016, unless stated otherwise.
a) Actuarial liabilitiesThe assumptions adopted were described in my report to the Board dated 21 June 2017.
b) Basis adopted for Provisions and Contingent Liabilities
1. Financial and demographic assumptions
In general, the same financial and demographic assumptions have been used to assess the provisions and contingent liabilities as for the liabilities. These assumptions relate to:• Discount rates• Revaluation rates• Pension increase rates• Mortality rates• The proportion married• The age difference between members and dependant, and• The long service cap.
Full details can be found in Annex M2. The assumptions used for GMP equalisation and expenses have been derived in a consistent way and are discussed further below.
2. GMP equalisation
Allowance has been made for the cost of equalising compensation that is unequal on account of inequalities in GMPs accrued between 17 May 1990 and 5 April 1997. This provision is to cover the cost of equalisation on the liabilities of schemes forming the provisions. A single loading was applied to the liabilities forming the provisions (with the exception of 7 material schemes that provided equalised individual member data), representing 0.6 per cent of the relevant liabilities. This loading includes allowance for backdated arrears on all schemes forming the provisions, other than the material schemes that have already equalised.
The allowance for GMP equalisation is unchanged from the valuation as at 31 March 2016.

3. Expenses
Allowance has been made for expenses incurred by the trustees prior to transfer into the PPF. It has been assumed that these will be the same as the wind-up expenses calculated in accordance with the section 179 methodology. Schemes are assumed to be, on average, midway through the assessment period. Allowance is therefore made only for 50 per cent of the full section 179 wind-up expense cost and, for schemes where the asset value is based on a roll forward of a valuation that pre-dates the insolvency, 50 per cent of the full section 179 wind-up cost is also deducted from the asset value.
In addition, allowance has been made for costs incurred by the PPF of transitioning members across to the PPF. This cost has been calculated as a per member cost and has been determined by dividing the cost to the PPF of transitioning members over the year to 31 March 2017 divided by the number of members that transitioned over the same period.
Allowance has also been made for certain expenses incurred after transfer to the PPF, in respect of schemes which are likely to transfer to the PPF (see Annex M2 of my report to the Board dated 21 June 2017 for an explanation of the expenses that are to be met from the Fund after a scheme transfers to the PPF). The same allowance is used as for transferred schemes (3.3 per cent). Expressed as a percentage of the provisions, the aggregate allowance for expenses incurred during the assessment process, during transition to the PPF and then after transfer is 4.1 per cent. The equivalent figure from last year is 3.7 per cent.
Annex S4 ASSUMPTIONS
P E N S I O N P R O T E C T I O N F U N D | ANNUAL REPORT AND ACCOUNTS 20 16 / 1 7 | 1 4 11 4 0 | P E N S I O N P R O T E C T I O N F U N D | ANNUAL REPORT AND ACCOUNTS 20 16 / 1 7
AC
TUA
RIAL REPO
RTS

P E N S I O N P R O T E C T I O N F U N D | ANNUAL REPORT AND ACCOUNTS 20 16 / 1 7 | 1 4 11 4 0 | P E N S I O N P R O T E C T I O N F U N D | ANNUAL REPORT AND ACCOUNTS 20 16 / 1 7
AC
TUA
RIAL REPO
RTS
Sensitivity analysisResults have been calculated on the basis described in Annex S4. However, the future is never certain, and a wide range of factors could affect the future finances of the PPF. It is possible to capture some measure of how different possible outcomes for these factors affect the PPF by showing different valuation results using different values for the assumptions set out in Annexes M2 and S4. For instance, if recipients of PPF compensation were to live longer than expected, the cash flows out of the PPF would rise, other things being equal. The risks that such a change pose to the PPF can be investigated by showing the results of the PPF valuation modified to reflect different assumptions about mortality rates and longevity. It should be noted that in some cases the results of the scenarios shown below are calculated in a more approximate manner than the results set out earlier in the report.
Ten scenarios have been considered covering the main uncertainties.
Scenario 1: Assumptions based on 25 per cent of the swaps curve at 31 March 2017 but with a deduction of 15 basis points at each term, and 75 per cent on the gilts curve at 31 March 2017.
Scenario 2: Assumptions based purely on the gilts curve at 31 March 2017.
Under scenarios 1 and 2 the effect of the basis change is on the actuarial liabilities and on the liabilities forming the provisions.
Scenario 3: Nominal yields are assumed to increase by 0.5 per cent per annum at each term.
Scenario 4: Inflation is assumed to increase by 0.5 per cent per annum at each term.
In scenarios 3 and 4, the effect on the invested assets and assets in respect of schemes forming the provisions has been looked at, as well as the effect on the liabilities. The PPF aims to adopt a substantially hedged position with regard to interest and inflation. As a result, the funding position is less sensitive to changes in these rates. This is illustrated by the results of scenario 3 and 4 shown in Annex S7.
Scenario 5: Increases in the Consumer Prices Index (CPI) are assumed to be 1.0 per cent lower than increases in the Retail Prices Index (RPI), i.e. assuming that a market had developed in CPI and that it was priced at 1.0 per cent below RPI.
Scenario 6: Assuming 5 per cent fewer of the female members have an eligible spouse; and also that widows are four years younger than male members, and widowers are one year older than female members.
Scenario 7: The long-term projection of mortality improvements is assumed to be increased by 0.25 per cent to 1.75 per cent a year.
Scenario 8: Mortality projections are assumed to be in line with the CMI 2016 model. The core model parameters have been used with the exception of the smoothing factor, Sk, which has been set at 8. This has been used in conjunction with a long-term projection rate of 1.75 per cent a year.
Scenario 9: The value of return seeking assets (excluding those which are used to hedge against liabilities) is assumed to decrease by 10 per cent at 31 March 2017. The asset value would be expected to change by a similar order of magnitude in the opposite direction if instead these assets are assumed to increase by 10 per cent.
Scenario 10: Assumptions and expense calculation based on s143 entry valuation basis (effective from 1 December 2016).
Annex S5 SENSITIVITY ANALYSIS

A summary of the assumptions is shown below:
Main Basis and Scenarios 1-5
Main Basis Scenario 1 Scenario 2 Scenario 3 Scenario 4 Scenario 5
Discount rate in deferment for compensation accrued before April 2009
-1.2% -1.3% -1.2% -0.7% -1.7% -0.8%
Discount rate in deferment for compensation accrued after April 2009
-0.8% -1.0% -0.8% -0.4% -0.8% -0.8%
Discount rate in payment for non-increasing compensation for current pensioners
1.5% 1.4% 1.4% 2.0% 1.5% 1.5%
Discount rate in payment for non-increasing compensation for future pensioners
1.7% 1.5% 1.7% 2.2% 1.7% 1.7%
Discount rate in payment for increasing compensation for current pensioners
-0.5% -0.7% -0.6% -0.1% -0.6% -0.5%
Discount rate in payment for increasing compensation for future pensioners
-0.5% -0.6% -0.5% -0.0% -0.6% -0.4%
Non-LDI assets Market value
Market value
Market value
Market value
Market value
Market value
Proportion married and assumed age difference between spouses
As in Annexes S4
and M2
As in Annexes S4
and M2
As in Annexes S4
and M2
As in Annexes S4
and M2
As in Annexes S4
and M2
As in Annexes S4
and M2
MortalityAs in
Annexes S4 and M2
As in Annexes S4
and M2
As in Annexes S4
and M2
As in Annexes S4
and M2
As in Annexes S4
and M2
As in Annexes S4
and M2
Annex S5 SENSITIVITY ANALYSIS
P E N S I O N P R O T E C T I O N F U N D | ANNUAL REPORT AND ACCOUNTS 20 16 / 1 7 | 1 4 31 4 2 | P E N S I O N P R O T E C T I O N F U N D | ANNUAL REPORT AND ACCOUNTS 20 16 / 1 7
AC
TUA
RIAL REPO
RTS

Main Basis and Scenarios 6-10
Scenario 6 Scenario 7 Scenario 8 Scenario 9 Scenario 10
Discount rate in deferment for compensation accrued before April 2009
-1.2% -1.2% -1.2% -1.2% -2.0%
Discount rate in deferment for compensation accrued after April 2009
-0.8% -0.8% -0.8% -0.8% -0.9%
Discount rate in payment for non-increasing compensation for current pensioners
1.5% 1.5% 1.5% 1.5% 1.4%
Discount rate in payment for non-increasing compensation for future pensioners
1.7% 1.7% 1.7% 1.7% 1.4%
Discount rate in payment for increasing compensation for current pensioners
-0.5% -0.5% -0.5% -0.5% -0.5%
Discount rate in payment for increasing compensation for future pensioners
-0.5% -0.5% -0.5% -0.5% -0.8%
Non-LDI assets Market value Market value Market value Fall by 10% Market value
Proportion married and assumed age difference between spouses
As in Annexes S4 and M2
but with a 5% reduction to
the proportion married
for female members
and male/female spouses assumed to be aged 4/1 years older/younger
As in Annexes S4 and M2
As in Annexes S4 and M2
As in Annexes S4 and M2
As in s143 guidance (B7)
Mortality As in Annexes S4 and M2
As in Annexes S4 and M2 but
with 1.75% long-term mortality
improvement
As in Annexes S4 and M2 but using the CMI
2016 model for future mortality improvements
with a smoothing
factor of 8 and a 1.75% long-term mortality improvement
As in Annexes S4 and M2
As in s143 guidance (B7)
Annex S5 SENSITIVITY ANALYSIS
P E N S I O N P R O T E C T I O N F U N D | ANNUAL REPORT AND ACCOUNTS 20 16 / 1 7 | 1 4 31 4 2 | P E N S I O N P R O T E C T I O N F U N D | ANNUAL REPORT AND ACCOUNTS 20 16 / 1 7
AC
TUA
RIAL REPO
RTS

Calculation results
a) Calculation of actuarial liabilities for members who have transferred into the PPFThe actuarial liabilities in respect of PPF members plus the cost of equalising compensation for GMPs on those liabilities plus a sum required to meet the remaining liabilities under Regulation 3 of the Pension Protection Fund (Valuation of the Assets and Liabilities of the Pension Protection Fund) Regulations 2006 amount to £21,979.0m.
b) Calculation of provisions98 schemes were included in the provisions in the statement of accounts for the financial period ending on 31 March 2017. The table below shows the estimated assets held at 31 March 2017 in respect of the 98 schemes forming the provisions. It also shows the outstanding anticipated recoveries, the resulting total assets and estimated funding position in respect of those 98 schemes. A comparison is shown with the equivalent figures for the year to 31 March 2016 using the assumptions described in that report):
31 March 2017£m
31 March 2016£m
Assets excluding anticipated recoveries 4,628.3 4,752.1
Anticipated recoveries 777.5 649.3
Total assets 5,405.8 5,401.4
Provisions 6,080.2 6,664.3
Excess of liabilities over assets 674.4 1,262.9
The liabilities recognised as provisions are the present value of the liabilities calculated at each valuation date on the relevant basis.
The provision assets have increased by £4.4m and this can be reconciled as follows:
£m
Assets as at 31 March 2016 5,401.4
New claims arising in the year (includes new schemes in assessment and schemes now thought to be in deficit)
585.6
Claims no longer considered probable (exits or schemes estimated to be in surplus at their assessment date)
(44.9)
Schemes accepted into the PPF (assets as at transfer date) (1,250.7)
Changes in schemes’ assets due to benefits paid out (163.6)
Investment return 338.5
Change to adjust the asset value to equal liabilities for 3 specific schemes (see Annex S1 for details)
486.5
Data changes (including updated valuation information) 6.8
Recovery changes 26.0
Miscellaneous 20.2
Assets as at 31 March 2017 5,405.8
Annex S6CALCULATION RESULTS
P E N S I O N P R O T E C T I O N F U N D | ANNUAL REPORT AND ACCOUNTS 20 16 / 1 7 | 1 4 51 4 4 | P E N S I O N P R O T E C T I O N F U N D | ANNUAL REPORT AND ACCOUNTS 20 16 / 1 7
AC
TUA
RIAL REPO
RTS

The provision liabilities have decreased by £584.1m and this can be reconciled as follows:
£m
Provision liabilities at 31 March 2016 6,664.3
New Claims arising in the year (includes new schemes entering assessment and schemes now thought to in deficit), valued at month of entry
837.4
Claims no longer considered probable (exits or schemes estimated to be in surplus at their assessment date)
(49.9)
Schemes accepted into the PPF (liabilities as at transfer date) (1,778.1)
Change in schemes’ liabilities due to benefits paid out (163.6)
Actual inflation experience being different from that assumed (18.2)
Accumulated interest 57.7
Actuarial (gain) / loss due to changes in market yields 967.1
Actuarial (gain) / loss due to data changes (363.6)
Actuarial (gain) / loss due to changes in CPI assumptions (41.6)
Actuarial (gain) / loss due to changes in mortality assumptions (68.0)
Actuarial (gain) / loss due to other experience 3.9
Change in expense reserve 17.6
Impact of the long service cap 15.2
Provision liabilities at 31 March 2017 6,080.2
Please note that the exact values attributed to each driver of change would be slightly different if the order of calculation were different. This does not affect the total liabilities at 31 March 2017.
c) Calculation of contingent liabilities The estimated amounts for the various types of contingent liabilities were as follows (a comparison is shown with the equivalent figures from the 2015/16 Annual Report and Accounts under the Main Assumptions basis as described in that report):
Type of contingent liability Estimated net liability as at 31 March 2017
£m
Estimated net liability as at 31 March 2016
£m
I 0 0
II 1,262.9 957.1
III 607.0 588.0
IV 0 40.0
Total 1,869.9 1,585.1
Annex S6 CALCULATION RESULTS
P E N S I O N P R O T E C T I O N F U N D | ANNUAL REPORT AND ACCOUNTS 20 16 / 1 7 | 1 4 51 4 4 | P E N S I O N P R O T E C T I O N F U N D | ANNUAL REPORT AND ACCOUNTS 20 16 / 1 7
AC
TUA
RIAL REPO
RTS

The net liabilities recognised as contingent liabilities are the present value of the aggregate scheme deficits (for types I, II and III) or the present value of the additional liability (for type IV) calculated at each valuation date on the relevant basis.
Shown below are the total assets and total liabilities that correspond to the above net liabilities. A comparison is shown with the equivalent figures for the year to 31 March 2016 under the Main Assumptions basis.
Type of contingent liability
31 March 2017 Assets
£m
31 March 2017 Liabilities
£m
31 March 2016 Assets
£m
31 March 2016 Liabilities
£m
I 0 0 0 0
II 15,697.9 16,960.8 14,702.0 15,659.1
III 1,750.4 2,357.4 2,406.0 2,994.0
IV 0 0 0 40.0
Total 17,448.3 19,318.2 17,108.0 18,693.1
At this stage it is too early to assess whether any recovery is available for type II or III contingent liability so none has been assumed. Type IV contingent liabilities do not relate to an insolvency event and hence no recovery would apply.
P E N S I O N P R O T E C T I O N F U N D | ANNUAL REPORT AND ACCOUNTS 20 16 / 1 7 | 1 4 71 4 6 | P E N S I O N P R O T E C T I O N F U N D | ANNUAL REPORT AND ACCOUNTS 20 16 / 1 7
AC
TUA
RIAL REPO
RTS
Annex S6 CALCULATION RESULTS

Actuarial balance sheet
On the main 31 March 2017 basis the Pension Protection Fund actuarial balance sheet is as follows:
Assets £m Liabilities £m
The value of the Pension Protection Fund assets determined in accordance with the Pension Protection Fund (Valuation of the Assets and Liabilities of the Pension Protection Fund) Regulations 2006*
28,715.7 The present value of the liabilities of the Pension Protection Fund to pay
sums or transfer property as required under section 173(3)
of the Pensions Act 2004*
21,979.0
The sum of the estimated values of the assets in the schemes that generated the provisions, plus any anticipated recoveries***
5,405.8 The present value of the liabilities of the schemes
forming the provisions **
6,080.2
Total assets 34,121.5 Total liabilities 28,059.2
Excess of assets over liabilities 6,062.3
Funding Ratio (Assets / Liabilities) 121.6%
* Inclusive of £0.5m in respect of AVC assets that match AVC liabilities yet to be discharged** Includes a nil allowance for IBNR *** Inclusive of anticipated recoveries of £777.5m
The actuarial liabilities and the liabilities of the schemes forming the provisions have also been calculated using the bases set out in Annex S5.
Annex S7ACTUARIAL BALANCE SHEET
P E N S I O N P R O T E C T I O N F U N D | ANNUAL REPORT AND ACCOUNTS 20 16 / 1 7 | 1 4 71 4 6 | P E N S I O N P R O T E C T I O N F U N D | ANNUAL REPORT AND ACCOUNTS 20 16 / 1 7
AC
TUA
RIAL REPO
RTS
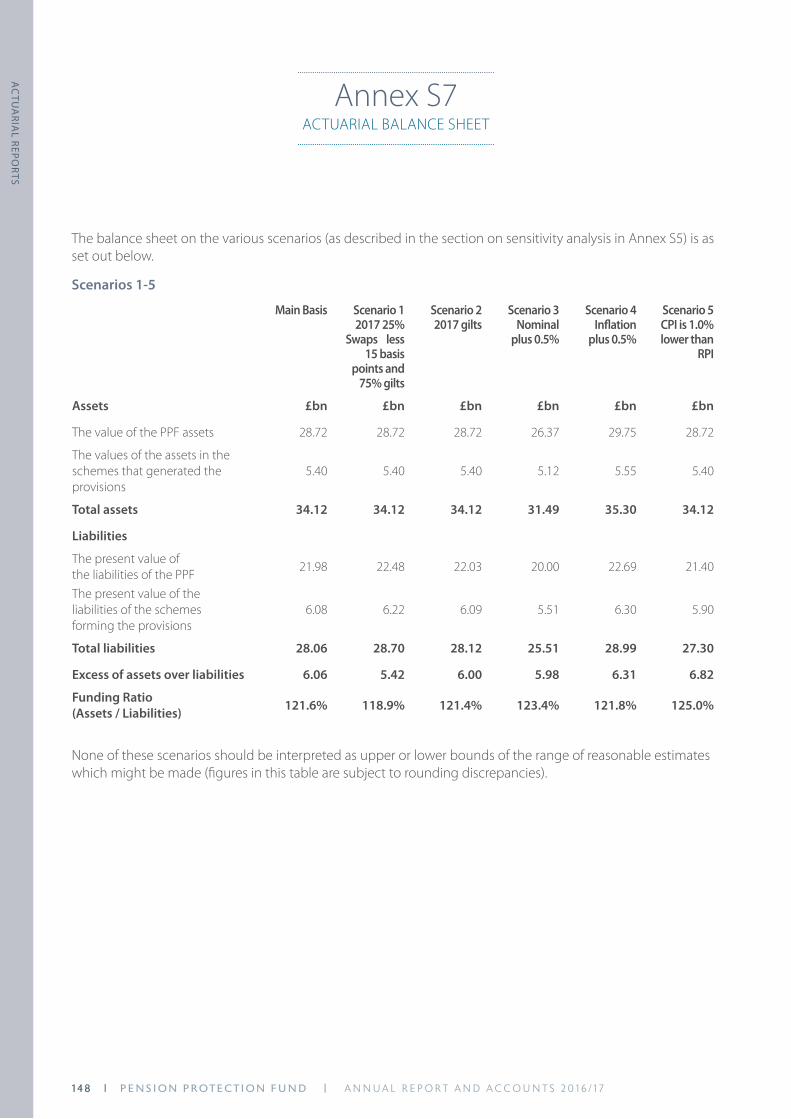
P E N S I O N P R O T E C T I O N F U N D | ANNUAL REPORT AND ACCOUNTS 20 16 / 1 7 | 1 4 91 4 8 | P E N S I O N P R O T E C T I O N F U N D | ANNUAL REPORT AND ACCOUNTS 20 16 / 1 7
AC
TUA
RIAL REPO
RTS
The balance sheet on the various scenarios (as described in the section on sensitivity analysis in Annex S5) is as set out below.
Scenarios 1-5
Main Basis Scenario 12017 25%
Swaps less 15 basis
points and 75% gilts
Scenario 22017 gilts
Scenario 3 Nominal
plus 0.5%
Scenario 4Inflation
plus 0.5%
Scenario 5 CPI is 1.0% lower than
RPI
Assets £bn £bn £bn £bn £bn £bn
The value of the PPF assets 28.72 28.72 28.72 26.37 29.75 28.72
The values of the assets in the schemes that generated the provisions
5.40 5.40 5.40 5.12 5.55 5.40
Total assets 34.12 34.12 34.12 31.49 35.30 34.12
Liabilities
The present value of the liabilities of the PPF
21.98 22.48 22.03 20.00 22.69 21.40
The present value of the liabilities of the schemes forming the provisions
6.08 6.22 6.09 5.51 6.30 5.90
Total liabilities 28.06 28.70 28.12 25.51 28.99 27.30
Excess of assets over liabilities 6.06 5.42 6.00 5.98 6.31 6.82
Funding Ratio (Assets / Liabilities) 121.6% 118.9% 121.4% 123.4% 121.8% 125.0%
None of these scenarios should be interpreted as upper or lower bounds of the range of reasonable estimates which might be made (figures in this table are subject to rounding discrepancies).
Annex S7 ACTUARIAL BALANCE SHEET

P E N S I O N P R O T E C T I O N F U N D | ANNUAL REPORT AND ACCOUNTS 20 16 / 1 7 | 1 4 91 4 8 | P E N S I O N P R O T E C T I O N F U N D | ANNUAL REPORT AND ACCOUNTS 20 16 / 1 7
AC
TUA
RIAL REPO
RTS
Scenarios 6-10
Scenario 6 Alternative
spouse assumptions
Scenario 7Long-term
mortalityimprove-
ment plus 0.25%
Scenario 8CMI-2016 mortality
projection model
Scenario 9Non LDI
assets fall by 10%
Scenario 10S143 Basis
Assets £bn £bn £bn £bn £bn
The value of the PPF assets 28.72 28.72 28.72 27.15 28.72
The values of the assets in the schemes that generated the provisions
5.40 5.40 5.40 5.32 5.40
Total assets 34.12 34.12 34.12 32.47 34.12
Liabilities
The present value of the liabilities of the PPF
22.19 22.37 21.99 21.98 23.09
The present value of the liabilities of the schemes forming the provisions
6.14 6.19 6.08 6.08 6.34
Total liabilities 28.33 28.56 28.07 28.06 29.43
Excess of assets over liabilities 5.79 5.56 6.05 4.41 4.69
Funding Ratio (Assets / Liabilities) 120.5% 119.5% 121.6% 115.7% 115.9%
None of these scenarios should be interpreted as upper or lower bounds of the range of reasonable estimates which might be made (figures in this table are subject to rounding discrepancies).
Annex S7 ACTUARIAL BALANCE SHEET

Comparison with the funding position as at 31 March 2016Under IAS 37 a reconciliation is required of the opening and closing net funding position on the actuarial balance sheet, including schemes that generate the provisions. This is shown in the table below:
Reconciling item £m
Excess of assets over liabilities on the actuarial balance sheet at 31 March 2016 4,056.0
Change in actuarial liabilities (this is further broken down in section 8 of my report on the actuarial valuation of the Pension Protection Fund)
(3,695.0)
Change in liabilities for schemes forming the Provisions (this is further broken down in Annex S6) 584.1
Change in Pension Protection Fund assets (this is further broken down in section 7 of my report on the actuarial valuation of the Pension Protection Fund)
5,112.8
Change in assets for schemes forming the provisions (this is further broken down in Annex S6) 4.4
Excess of assets over liabilities on the actuarial balance sheet at 31 March 2017 6,062.3
Annex S8 COMPARISON WITH THE FUNDING POSITION AS AT 31 MARCH 2016
P E N S I O N P R O T E C T I O N F U N D | ANNUAL REPORT AND ACCOUNTS 20 16 / 1 7 | 1 5 11 5 0 | P E N S I O N P R O T E C T I O N F U N D | ANNUAL REPORT AND ACCOUNTS 20 16 / 1 7
AC
TUA
RIAL REPO
RTS

AVC – Additional Voluntary Contribution
CETV – Cash Equivalent Transfer Value
CMI – Continuous Mortality Investigation
CPI – Consumer Prices Index
CS01 - Sensitivity of a position or portfolio to a 1bp move in credit spreads
CS1% - Sensitivity of a position or portfolio to a 1% move in credit spreads
CSA – Credit Support Annex
DB – Defined Benefit
DWP – Department for Work and Pensions
FAS – Financial Assistance Scheme
FCF – Fraud Compensation Fund
FReM – Government Financial Reporting Manual
GMP – Guaranteed Minimum Pension
GTAA - Global Tactical Asset Allocation
HAIL - Hybrid and Illiquid Assets
IAS - International Accounting Standard
IBNR – Incurred But Not Reported
IE01 – Sensitivity of a position or portfolio to a 1bp move in rates inflation
IFRS – International Financial Reporting Standard
ISDA – International Swaps and Derivatives Association
ISO – International Organization for Standardization
IT – Information Technology
KPI – Key Performance Indicator
LDI – Liability-Driven Investments
LIBOR - London Inter Bank Offered Rate
MFR – Minimum Funding Requirement
MI - Management Information
ORSA - Own Risk and Solvency Assessment
PPF - Pension Protection Fund
PV01 - Sensitivity of a position or portfolio to a 1bp move in interest rates
RCSA – Risk and Control Self Assessment
RPI – Retail Prices Index
SIA – Schemes In Assessment
SIP – Statement of Investment Principles
TAS – Technical Actuarial Standard
TPR - The Pensions Regulator
VaR - Value at Risk
Commonly abbreviated terms
P E N S I O N P R O T E C T I O N F U N D | ANNUAL REPORT AND ACCOUNTS 20 16 / 1 7 | 1 5 11 5 0 | P E N S I O N P R O T E C T I O N F U N D | ANNUAL REPORT AND ACCOUNTS 20 16 / 1 7
AC
TUA
RIAL REPO
RTS

1700
96 -
Des
igne
d by
Cro
ydon
Des
ign
Renaissance, 12 Dingwall Road, Croydon CR0 2NA
T: 0845 600 2541F: 020 8633 4910
www.pensionprotectionfund.org.uk