2016 software-development-salary-survey-report
TRANSCRIPT

John King & Roger Magoulas
Tools, Trends, Titles: What Pays (and What Doesn’t) for Programming Professionals2016 Software Development Salary Survey

ISBN: 978-1-491-95950-3
EARLY THIS YEAR, more than 5000 software engineers, developers, and other programming professionals participated in O’Reilly Media’s first Software Development Salary Survey. Participants included professionals from large and small companies in a variety of industries across 51 countries and all 50 US states. With the complete survey results in this in-depth report, you’ll be able to explore the world of software development—and the careers that propel it—in great detail.
With this report, you’ll learn:
n The top programming languages that respondents currently use professionally
n Where programmers make the highest salaries—by country and by regions in the US
n Salary ranges by industry and by specific programming language
n The difference in earnings between programmers who work on tiny teams vs those work on larger teams
n The most common programming languages that respondents no longer use in their work
n The most common languages that respondents intend to learn within the next couple of years
Pick up a copy of this report and find out where you stand in the programming world. We encourage you to plug in your own data points to our survey model to see how you compare to other programming professionals in your industry.
John King is a data analyst at O’Reilly Media.
Roger Magoulas is O’Reilly’s Research Director.
To stay up to date on this research, your participation is critical. The survey is now open for the 2017 report, and if you can spare just 10 minutes of your time, we encourage you to go to:
http://www.oreilly.com/ programming/2017-programming- salary-survey.html.

2016 SOFTWARE DEVELOPMENT SALARY SURVEY
Take the Software Development Salary Survey
SOFTWARE DEVELOPMENT IS A THRIVING FIELD
with plenty of opportunities for growth and
learning. But because it’s moving so quickly, it
can be tough to keep pace with rapidly evolving
technologies. Choosing the right ones to focus
your energy on can lead to bigger paychecks and
more career opportunities.
We’re setting out to help make more sense of it all by
putting a stake in the ground with our annual Software
Development Salary Survey. Our goal in producing the
survey is to give you a helpful resource for your career,
and to keep insights and understanding flowing.
But to provide you with the best possible information
we need one thing: participation from you and other
members of the programming community.
Anonymous and secure, next year’s survey will
provide more extensive information and insights
into the demographics, roles, compensation,
work environments, educational requirements,
and tools of practitioners in the field.
Take the 2017 O’Reilly Software Development
Salary Survey today. (And don’t forget to ask your
colleagues to take it, too. The more data we collect,
the more information we’ll be able to share.)
oreilly.com/programming/2017-programming-salary-survey.html


2016 Software Development Salary Survey
Tools, Trends, Titles: What Pays (and What Doesn’t) for Programming Professionals
John King & Roger Magoulas
2016 SOFTWARE DEVELOPMENT SALARY SURVEY
by John King and Roger Magoulas
Editors: Dawn Schanafelt, Susan Conant Designer: Ellie Volckhausen Production Manager: Dan Fauxsmith
Copyright © 2016 O’Reilly Media, Inc. All rights reserved.
Printed in Canada.
Published by O’Reilly Media, Inc., 1005 Gravenstein Highway North, Sebastopol, CA 95472.
O’Reilly books may be purchased for educational, business, or sales promotional use. Online editions are also available for most titles (http://safaribooksonline.com). For more information, contact our corporate/institutional sales department: 800-998-9938 or [email protected].
April 18, 2016: First Edition
ISBN: 978-1-491-95950-3
REVISION HISTORY FOR THE FIRST EDITION
2016-04-18: First Release
While the publisher and the author(s) have used good faith efforts to ensure that the information and instructions contained in this work are accurate, the publisher and the author(s) disclaim all responsibility for errors or omissions, including without limitation responsibility for damages resulting from the use of or reliance on this work. Use of the information and instructions contained in this work is at your own risk. If any code samples or other technology this work contains or describes is subject to open source licenses or the intellectual property rights of others, it is your responsibility to ensure that your use thereof complies with such licenses and/or rights.

2016 Software Development Salary Survey ....................................... i
Executive Summary ............................................................................... 1
Introduction ......................................................................................... 2
Geography ........................................................................................... 5
Company Types .................................................................................... 9
Team Structure ................................................................................... 14
Individual Background: Gender, Age, Education .................................... 16
Title, Role, Tasks .................................................................................. 18
Tools .................................................................................................. 24
Past/Future Languages ........................................................................ 38
Work Week, Bargaining, and Ease of Finding Work ............................... 45
The Model in Full ................................................................................ 48
Conclusion ......................................................................................... 50
2016 SOFTWARE DEVELOPMENT SALARY SURVEY
Table of Contents
V

OVER 5,000 RESPONDENTS
FROM A VARIETY OF INDUSTRIES
COMPLETED THE SURVEY
YOU CAN PRESS ACTUAL BUTTONS (and earn our sincere
gratitude) by taking the 2017 survey—it only takes about 5 to 10 minutes,
and is essential for us to continue to provide this kind of research.
oreilly.com/programming/2017-programming-salary-survey.html
2016 SOFTWARE DEVELOPMENT SALARY SURVEY
2016 SOFTWARE DEVELOPMENT SALARY SURVEY
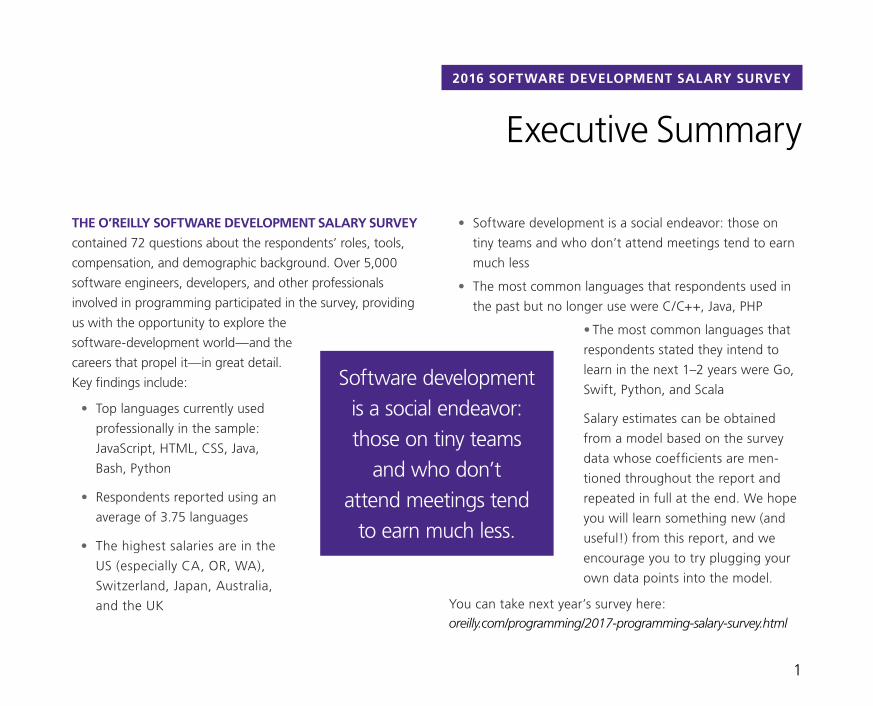
THE O’REILLY SOFTWARE DEVELOPMENT SALARY SURVEY
contained 72 questions about the respondents’ roles, tools,
compensation, and demographic background. Over 5,000
software engineers, developers, and other professionals
involved in programming participated in the survey, providing
us with the opportunity to explore the
software-development world—and the
careers that propel it—in great detail.
Key findings include:
• Top languages currently used
professionally in the sample:
JavaScript, HTML, CSS, Java,
Bash, Python
• Respondents reported using an
average of 3.75 languages
• The highest salaries are in the
US (especially CA, OR, WA),
Switzerland, Japan, Australia,
and the UK
Executive Summary
Software development is a social endeavor: those on tiny teams
and who don’t attend meetings tend
to earn much less.
• Software development is a social endeavor: those on
tiny teams and who don’t attend meetings tend to earn
much less
• The most common languages that respondents used in
the past but no longer use were C/C++, Java, PHP
• The most common languages that
respondents stated they intend to
learn in the next 1–2 years were Go,
Swift, Python, and Scala
Salary estimates can be obtained
from a model based on the survey
data whose coefficients are men-
tioned throughout the report and
repeated in full at the end. We hope
you will learn something new (and
useful!) from this report, and we
encourage you to try plugging your
own data points into the model.
You can take next year’s survey here:oreilly.com/programming/2017-programming-salary-survey.html
1

2016 SOFTWARE DEVELOPMENT SALARY SURVEY
In addition to simply reporting the salaries of specific groups of
respondents, such as those from a certain industry or who use
a certain language, we also present coefficients corresponding
to these groups from a simple, linear model based on the survey
data. The coefficients are contribution components: by summing
the coefficients corresponding to variables that apply to some-
one working in software development, we obtain an estimate
for their salary. Note that not all variables get included in the
model, since the method used to generate the model penalizes
complexity to avoid overfitting and thus deems many variables
THE FIRST O’REILLY SOFTWARE DEVELOPMENT SALARY
SURVEY was conducted online using Google Forms. Between
January and February 2016, 5,081 respondents submitted
responses, from 51 countries and all 50 US states, from
companies both large and small, and from a wide variety of
industries. Respondents were mostly software developers, but
other professionals who program also participated.
The median salary of the entire sample was $90,000
($110,000 for US respondents only), with the middle half
of all respondents earning between $60K and $125K. (The
latter statistic is called the interquartile range (IQR)—the
middle 50%—and is used to describe the salaries of particular
subsets of the sample in the text below and in the accompa-
nying graphs. The IQR is useful for showing the middle of the
salary range without the distortion of outliers in the lowest
and highest quartiles). Much of the variation in salary can be
described using other variables gathered via the survey.
Introduction
In the horizontal bar charts throughout this report, we include
the interquartile range (IQR) to show the middle 50% of
respondents’ answers to questions such as salary. One quarter
of the respondents has a salary below the displayed range,
and one quarter has a salary above the displayed range.
2

Share of Respondents
0% 5% 10% 15% 20%
>$200K
$200K
$180K
$160K
$140K
$120K
$100K
$80K
$60K
$40K
$20K
<$20K
TOTAL SALARY
Tota
l Sal
ary
(US
DO
LLA
RS)
SHARE OF RESPONDENTS
2016 SOFTWARE DEVELOPMENT SALARY SURVEY
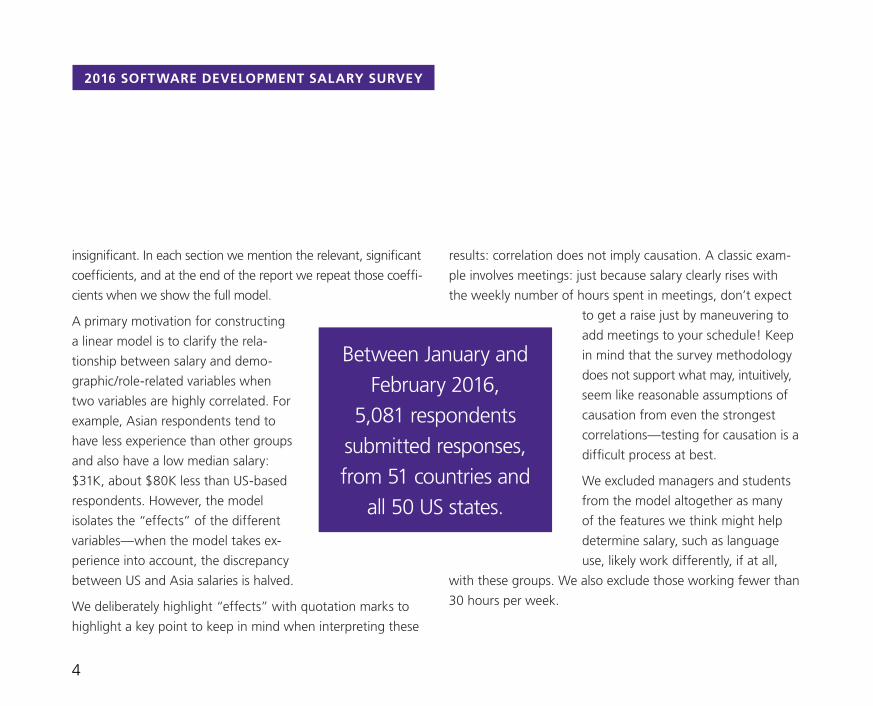
insignificant. In each section we mention the relevant, significant
coefficients, and at the end of the report we repeat those coeffi-
cients when we show the full model.
A primary motivation for constructing
a linear model is to clarify the rela-
tionship between salary and demo-
graphic/role-related variables when
two variables are highly correlated. For
example, Asian respondents tend to
have less experience than other groups
and also have a low median salary:
$31K, about $80K less than US-based
respondents. However, the model
isolates the “effects” of the different
variables—when the model takes ex-
perience into account, the discrepancy
between US and Asia salaries is halved.
We deliberately highlight “effects” with quotation marks to
highlight a key point to keep in mind when interpreting these
results: correlation does not imply causation. A classic exam-
ple involves meetings: just because salary clearly rises with
the weekly number of hours spent in meetings, don’t expect
to get a raise just by maneuvering to
add meetings to your schedule! Keep
in mind that the survey methodology
does not support what may, intuitively,
seem like reasonable assumptions of
causation from even the strongest
correlations—testing for causation is a
difficult process at best.
We excluded managers and students
from the model altogether as many
of the features we think might help
determine salary, such as language
use, likely work differently, if at all,
with these groups. We also exclude those working fewer than
30 hours per week.
Between January and February 2016,
5,081 respondents submitted responses, from 51 countries and
all 50 US states.
4
2016 SOFTWARE DEVELOPMENT SALARY SURVEY
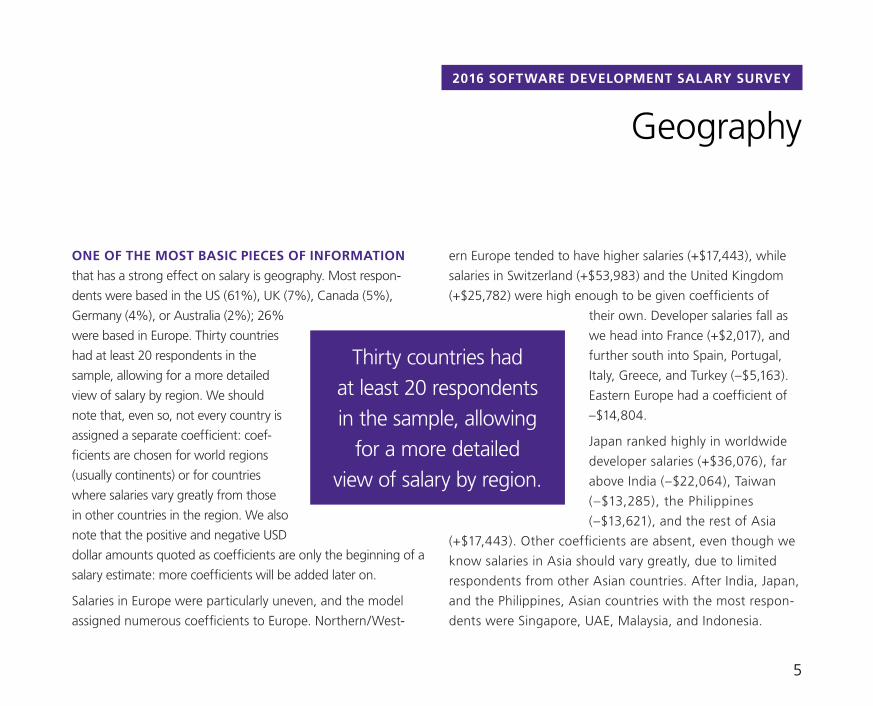
ONE OF THE MOST BASIC PIECES OF INFORMATION
that has a strong effect on salary is geography. Most respon-
dents were based in the US (61%), UK (7%), Canada (5%),
Germany (4%), or Australia (2%); 26%
were based in Europe. Thirty countries
had at least 20 respondents in the
sample, allowing for a more detailed
view of salary by region. We should
note that, even so, not every country is
assigned a separate coefficient: coef-
ficients are chosen for world regions
(usually continents) or for countries
where salaries vary greatly from those
in other countries in the region. We also
note that the positive and negative USD
dollar amounts quoted as coefficients are only the beginning of a
salary estimate: more coefficients will be added later on.
Salaries in Europe were particularly uneven, and the model
assigned numerous coefficients to Europe. Northern/West-
ern Europe tended to have higher salaries (+$17,443), while
salaries in Switzerland (+$53,983) and the United Kingdom
(+$25,782) were high enough to be given coefficients of
their own. Developer salaries fall as
we head into France (+$2,017), and
further south into Spain, Portugal,
Italy, Greece, and Turkey (–$5,163).
Eastern Europe had a coefficient of
–$14,804.
Japan ranked highly in worldwide
developer salaries (+$36,076), far
above India (–$22,064), Taiwan
(–$13,285), the Philippines
(–$13,621), and the rest of Asia
(+$17,443). Other coefficients are absent, even though we
know salaries in Asia should vary greatly, due to limited
respondents from other Asian countries. After India, Japan,
and the Philippines, Asian countries with the most respon-
dents were Singapore, UAE, Malaysia, and Indonesia.
Thirty countries had at least 20 respondents in the sample, allowing
for a more detailed view of salary by region.
Geography
5

Range/Median
Regi
on
UNITED STATES
61%
LATIN AMERICA
3%
UK/IRELAND
7%EUROPE (EXCEPT UK/I)
18%
ASIA
3%
AUSTRALIA/NZ
3%
AFRICA (ALL FROM SOUTH AFRICA)
1%
CANADA
5%
WORLD REGION SHARE OF RESPONDENTS
SALARY MEDIAN AND IQR (US DOLLARS)
$0K $30K $60K $90K $120K $150K
Africa
Asia
Australia/NZ
Latin America
Canada
UK/Ireland
Europe (except UK/I)
United States

US REGION
$0K $50K $100K $150K $200K
Texas
SW/Mountain
Mid-Atlantic
Paci�c NW
South
Northeast
Midwest
California
CALIFORNIA
20%
PACIFIC NW
10%
SOUTH
12%SW/MOUNTAIN
9%
TEXAS
6%
MIDWEST
18% MID-ATLANTIC
10%NORTHEAST
15%
Range/Median
Regi
on
SHARE OF RESPONDENTS
SALARY MEDIAN AND IQR (US DOLLARS)

2016 SOFTWARE DEVELOPMENT SALARY SURVEY
A few differences in language use by country or region are
worth pointing out. Many involve languages developed by
Microsoft: ASP/ASP.NET, Visual Basic, and C#. Washington state
had higher rates than average for C# (33%)—unsurprising,
since this is where Microsoft is based— but so did the Midwest
(28%), Florida (35%), and the UK (28%). Midwest respondents
were also more likely to be ASP/ASP.NET users (17%) and Visual
Basic users (8%). C#/ASP.NET/Visual Basic users were sparser
among respondents from Califor-
nia (13%/6%/2%), the Northeast
US (15%/8%/4%), and Germany
(11%/3%/1%).
Aside from its lower rates of Microsoft-
developed languages, California
stood out for its high usage of
Python (35% vs. the sample-wide
average of 28%), Objective-C (9%
vs. 6%), and Go (7% vs. 4%)—interestingly, the original
developers of all three languages are based in California.
PHP was used relatively little by the CA cohort (13%),
compared to, for example, 21% among respondents from
Continental Europe. In contrast, Ruby was much more
common among US respondents (16%) than non-US DS
respondents (11%).
After the US, Switzerland, and Japan, the highest geograph-
ical coefficient was Australia’s, at +$29,636. New Zealand
and Canada were lower (+$17,433 each), while Latin Amer-
ica (chiefly Brazil, Mexico, Argentina, and Colombia) had a
coefficient of –$9,057, below Asia but above Eastern Europe.
South Africa (the only African country represented in the
sample) had a relatively high median salary—$46K (com-
pared to $31K for Asia)—but the South African respondents
also tended to be among the most
experienced in the sample, so their
coefficient was only –$3,766. This is
likely just a quirk of the sample and
is another good example of why
the linear-model coefficients are a
better lens to compare features than
median salary.
Within the US, a disproportionate
number of respondents came from the West, in particular
from California, Oregon, and Washington: these three states
made up 30% of all US respondents, even though they
account for only 16% of the US population. They also had
among the highest salaries (+$76,671 for CA, +$57,838 for
OR/WA). Salaries in the Northeast US were higher (+$60,453)
and in the Midwest lower (+$48,060) than the default US
coefficient (+$52,778) that applies to the rest of the country.
Ruby was much more common among US
respondents (16%) than non-US respondents (11%).
8
2016 SOFTWARE DEVELOPMENT SALARY SURVEY
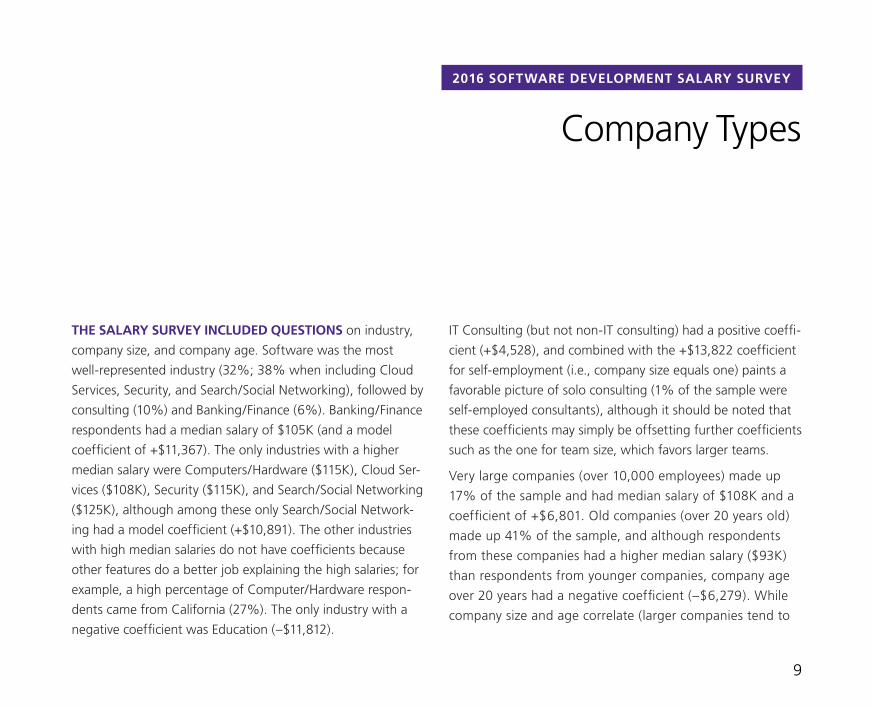
IT Consulting (but not non-IT consulting) had a positive coeffi-
cient (+$4,528), and combined with the +$13,822 coefficient
for self-employment (i.e., company size equals one) paints a
favorable picture of solo consulting (1% of the sample were
self-employed consultants), although it should be noted that
these coefficients may simply be offsetting further coefficients
such as the one for team size, which favors larger teams.
Very large companies (over 10,000 employees) made up
17% of the sample and had median salary of $108K and a
coefficient of +$6,801. Old companies (over 20 years old)
made up 41% of the sample, and although respondents
from these companies had a higher median salary ($93K)
than respondents from younger companies, company age
over 20 years had a negative coefficient (–$6,279). While
company size and age correlate (larger companies tend to
THE SALARY SURVEY INCLUDED QUESTIONS on industry,
company size, and company age. Software was the most
well-represented industry (32%; 38% when including Cloud
Services, Security, and Search/Social Networking), followed by
consulting (10%) and Banking/Finance (6%). Banking/Finance
respondents had a median salary of $105K (and a model
coefficient of +$11,367). The only industries with a higher
median salary were Computers/Hardware ($115K), Cloud Ser-
vices ($108K), Security ($115K), and Search/Social Networking
($125K), although among these only Search/Social Network-
ing had a model coefficient (+$10,891). The other industries
with high median salaries do not have coefficients because
other features do a better job explaining the high salaries; for
example, a high percentage of Computer/Hardware respon-
dents came from California (27%). The only industry with a
negative coefficient was Education (–$11,812).
Company Types
99

INDUSTRY
SOFTWARE (INCL. SAAS, WEB, MOBILE)
32%
CONSULTING10%
BANKING / FINANCE6%
EDUCATION5%
HEALTHCARE / MEDICAL5%
RETAIL / E-COMMERCE4% GOVERNMENT
4% PUBLISHING / MEDIA
3%COMPUTERS / HARDWARE3%
ADVERTISING / MARKETING / PR
3%
CLOUD SERVICES / HOSTING / CDN
3%
MANUFACTURING (NON-IT)
2%
CARRIERS / TELECOMMUNICATIONS
2%
INSURANCE2%
SECURITY (COMPUTER / SOFTWARE)
2%
SEARCH / SOCIAL NETWORKING
1%NONPROFIT /
TRADE ASSOCIATION
1%
OTHER10%
SHARE OF RESPONDENTS
INDUSTRY
SALARY MEDIAN AND IQR (US DOLLARS)
$0K $50K $100K $150K $200K
Other
Nonpro�t / Trade Association
Search / Social Networking
Security (computer / software)
Insurance
Carriers / Telecommunications
Manufacturing (non-IT)
Cloud Services / Hosting / CDN
Advertising / Marketing / PR
Computers / Hardware
Publishing / Media
Government
Retail / E-Commerce
Healthcare / Medical
Education
Banking / Finance
Consulting
Software (incl. SaaS, Web, Mobile)
Range/Median
Indu
stry

2016 SOFTWARE DEVELOPMENT SALARY SURVEY
COMPANY AGE
2 - 5 YEARS13%
6 - 10 YEARS18%
11 - 20 YEARS24%
SALARY MEDIAN AND IQR (US DOLLARS)
Com
pany
Age
Range/Median
SHARE OF RESPONDENTS
>2041%
<2 YEARS4%
$0K $30K $60K $90K $120K $150K
>20 years
11 - 20 years
6 - 10 years
2 - 5 years
<2 years
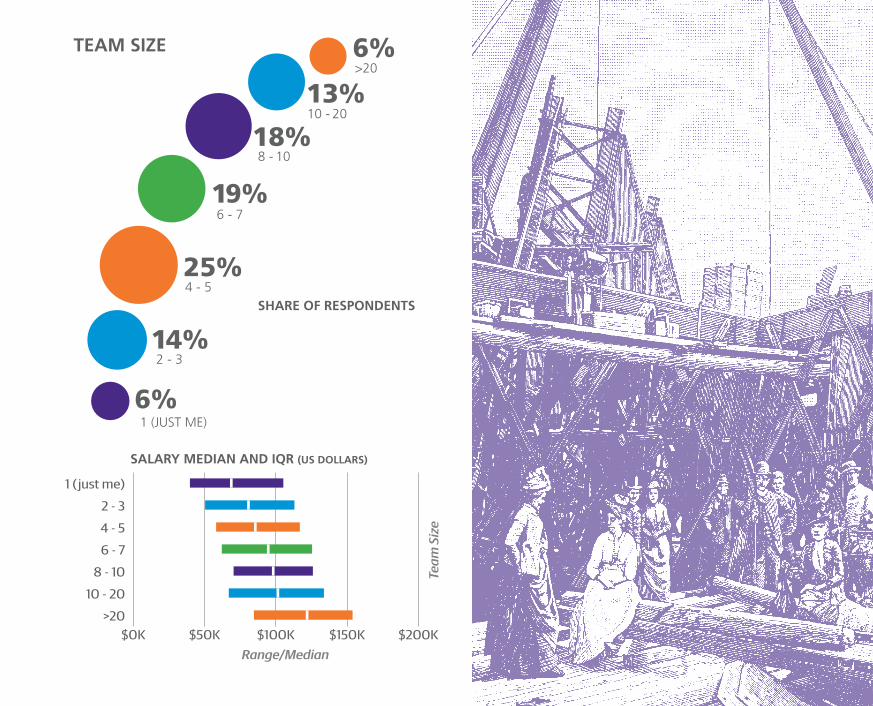
TEAM SIZE
Team
Siz
e
SHARE OF RESPONDENTS
2 - 314%
4 - 525%
6 - 719%
8 - 1018%
10 - 2013%
>206%
1 (JUST ME)6%
SALARY MEDIAN AND IQR (US DOLLARS)
Range/Median$0K $50K $100K $150K $200K
>20
10 - 20
8 - 10
6 - 7
4 - 5
2 - 3
1 ( just me)
be older), the exceptions to this pattern highlight why the
above coefficients were chosen: respondents from large,
young companies had a median salary of $114K (2% of
the sample), while respondents from small, old companies
had a median salary of $86K (26% of the sample). Further
salary distinctions among companies by age (e.g., early
vs. mature startups) were subtle enough to be ignored by
the model. One hypothesis to test is whether large, young
companies in the sample are more software driven than
older companies, and, therefore, willing to pay a premium
for developer resources.
Some language differences were present with company size and
age. Respondents from large companies (>10K employees) had
higher usage rates of Perl 5 (10% vs. 5% among respondents of
smaller companies), Java (45% vs. 32%), and C/C++ (23% vs.
17%). In contrast, respondents from very small companies (2–25
employees) had higher rates of Objective-C (8% vs. 5% at larger
companies), JavaScript (63% vs. 54%), HTML (60% vs. 50%),
and PHP (26% vs. 15%). Respondents from startups (company
age less than 2 years) were more likely to use Clojure (5% vs.
2%), and respondents from old companies were more likely to
use ASP/ASP.NET (14% for companies over 10 years old vs. 6%
for companies younger than 6 years).
12

2 - 25 EMPLOYEES16%
26 - 100 EMPLOYEES
16%
101 - 500 EMPLOYEES21%
501 - 1,000 EMPLOYEES
8%1,001 - 2,500EMPLOYEES
8% 2,501 - 10,000EMPLOYEES
11%10,000+EMPLOYEES
17%
1 EMPLOYEE2%
SALARY MEDIAN AND IQR (US DOLLARS)
COMPANY SIZE
$0K $30K $60K $90K $120K $150K
>10,000
2,501 - 10,000
1,001 - 2,500
501 - 1,000
101 - 500
26 - 100
2 - 25
1
Range/Median
Com
pany
Siz
e
SHARE OF RESPONDENTS

4, with 29% of the sample reporting their typical project
team size to be over 5 people. No variables based on an-
swers to this question were significant in the model.
Another question about team structure was whether the
respondent worked with people in various roles. Most
respondents reported that they
work with (other) programmers
(88%), product managers (74%),
and designers (61%), while 33%
said they work with salespeople.
The only variable from this ques-
tion with a positive coefficient
was data scientists/analysts: the
34% of the sample who worked
with data scientists/analysts
earned a median salary of $101K,
motivating a coefficient of +$2,365. The small share of
respondents (4%) who did not work with people in any
of the above roles had a median salary of $68K, and
this also is expressed in a coefficient, of –$6,995. In
other words, people in roles that require less communi-
cation, and particularly interdisciplinary communication,
are expected to earn significantly less.
2016 SOFTWARE DEVELOPMENT SALARY SURVEY
Team StructureSEVERAL QUESTIONS ON THE SURVEY FOCUSED ON
THE TEAM STRUCTURE, the most basic of which was how
many people work on the respondent’s team. Salary appears
to steadily increase with team size, and with this variable the
coefficient is not binary but multiplicative, equal to +$445
times the number of team members. Since team size correlates
with company size,1 this further accen-
tuates the expected salary boost for
large-company employees, but, as with
company age, it is instructive to look
at the exceptions to this pattern. Two
subsamples suffice as an illustration:
the 437 respondents at companies
with more than 500 employees and on
teams with fewer than 5 members had
a median salary of $87K; in contrast,
the 119 respondents at companies
with fewer than 500 employees and on teams with at least 15
members had a median salary of $119K.
A slightly different team metric is the size of a team for a
typical coding project. The median project team size was
1 Team size (number of members) and company size (number of employees at the company) correlates with a linear correlation coefficient of .25.
The 119 respondents at
companies with fewer than
500 employees and on teams
with at least 15 members had
a median salary of $119K.
14
COMPANY AGE
2 - 5 YEARS13%
6 - 10 YEARS18%
11 - 20 YEARS24%
SALARY MEDIAN AND IQR (US DOLLARS)
Com
pany
Age
Range/Median
SHARE OF RESPONDENTS
>2041%
<2 YEARS4%
$0K $30K $60K $90K $120K $150K
>20 years
11 - 20 years
6 - 10 years
2 - 5 years
<2 years
TEAM SIZE
Team
Siz
e
SHARE OF RESPONDENTS
2 - 314%
4 - 525%
6 - 719%
8 - 1018%
10 - 2013%
>206%
1 (JUST ME)6%
SALARY MEDIAN AND IQR (US DOLLARS)
Range/Median$0K $50K $100K $150K $200K
>20
10 - 20
8 - 10
6 - 7
4 - 5
2 - 3
1 ( just me)

2016 SOFTWARE DEVELOPMENT SALARY SURVEY
Individual Background: Gender, Age, EducationWE NOW MOVE ON TO DETAILS ABOUT INDIVIDUAL
RESPONDENTS. The sample was overwhelmingly male (91%), and
women in the sample earned less than men: women had a median
salary of $80K, compared to $93K for men. The fact that the $13K
gap is reduced to a coefficient of –$5,256K is not necessarily an
improvement. The coefficient means that, all else held equal (role, lo-
cation, experience), women earn approximately $5K less than men.
The rest of the difference (about $8K) is at least partly attributable to
the women in the sample tending to have fewer favorable variables
associated with them: for example, only 10% of female respondents
were “Senior” engineers or developers (17% of male respondents
were). The difference in pay between men and women in this survey
sample is similar to what we have seen in other salary surveys.
Over 60% of the sample was under 40, and salary did increase
with age—the most well-paid demographic being the 46–50 co-
hort, earning a median of $112K (followed closely by those aged
56–60, who earned $111K). However, we asked about years of
experience as well, and this appeared to be the actual predictor
of salary: given a certain level of experience, age is no longer a
factor and thus did not have any associated coefficients. Accord-
ing to the model, developers can expect an additional +$1,194 of
pay per year, independent of title, role, and tasks—factors that
the model shows affecting salary in different ways (see below).
As for education, a majority of respondents (52%) had an academic
specialization in computer science, and 13% had a background in
mathematics, statistics, or physics, but no particular specialization
was significant in the model. Having a Master’s degree (of any
discipline, but we assume most were in computer science or some-
thing technical) gives an estimated +$3,101 boost, and a PhD adds
+$9,041 (which is potentially in addition to the Master’s coefficient).
Respondents with a PhD were more likely to use Python (48% vs.
27% among non-PhD holders) and C/C++ (34% vs. 17%).
GENDER
Gen
der
FEMALESHARE OF RESPONDENTS
8%
92%MALE
SALARY MEDIAN AND IQR (US DOLLARS)
Range/Median0
$30K $60K $90K $120K $150K
MaleFemale
16

SALARY MEDIAN AND IQR (US DOLLARS)
$0K $30K $60K $90K $120K $150K
Over 6051 - 60
41 - 50
31 - 40
30 or younger
AGE
31 - 4041%
41 - 5025%
51 - 6010%
YEARS OF EXPERIENCE (IN YOUR FIELD)
Age
Year
s of E
xper
ienc
e
Range/Median
SHARE OF RESPONDENTS
SHARE OF RESPONDENTS
OVER 603%
30 OR YOUNGER
21%5 - 818%
9 - 1218%
13 - 1615%
17 - 207%
>2024%
<515%
SALARY MEDIAN AND IQR (US DOLLARS)
$0K $30K $60K $90K $120K $150K
>20
17 - 20
13 - 16
9 - 12
5 - 8
< 5
Range/Median
17

2016 SOFTWARE DEVELOPMENT SALARY SURVEY
Title, Role, Tasks
TWO DISTINCT APPROACHES WERE TAKEN to defining
the roles of respondents. The first was a text field for job
title, which we parsed to assign respondents to a category.
The most common (cleaned) title was Engineer/Developer/
Programmer, with 40% of the sample. Engineers or develop-
ers with “Senior” in their title made up a further 16% of the
sample and also earned an estimated +$9,147 more than
their junior counterparts. Three other titles were also given
positive coefficients: Principal/Lead (8% of the sample,
+$11,936), Architect (7%, +$15,488), and Consultant (3%,
+$11,867). As mentioned above, managers and students
were excluded from the model, so there were no coeffi-
cients associated with them (the median salary of respon-
dents in upper management was $123K).
The second approach to capture respondents’ roles was
to ask whether they engaged in specific tasks. The three
possible answers to each of the 16 task questions were
“no involvement”, “minor involvement”, and “major involve-
ment”, which was defined as a task that “is essential to most
or all of your projects and responsibilities”.
The two tasks with the greatest involvement were writing
code for collaborative projects (70% major, 22% minor)
and reading/editing code originally written by others (63%
major, 31% minor). Even though neither of these tasks had
associated coefficients, their high engagement rates high-
light the importance of collaboration in software develop-
ment: it is often a very social activity.
Backend web development was also very common (52%
major, 28% minor), more than frontend web development
(34% major, 37% minor) or mobile development (11%
major, 27% minor), while only 13% of the sample had no
involvement in web or mobile development. The single
coefficient related to the above development distinctions
was a penalty for frontend: minor and major involvement
in frontend development had coefficients of –$4,194 or
–$6,305, respectively.
“Planning large software projects” was a task that may seem
to be synonymous with architect (a job title category), but the
fact that more than one task could be chosen meant that the
tasks appeared to be interpreted quite broadly: a full 49% of the
JOB TITLE
ENGINEER / DEVELOPER /PROGRAMMER
40%
SENIOR ENGINEER / DEVELOPER
16%
PRINCIPAL / LEAD8%
ARCHITECT7%
UPPER MANAGEMENT7% MANAGER
5% DATA SCIENTIST4%
OTHER8%3%
CONSULTANT
SALARY MEDIAN AND IQR (US DOLLARS)
SHARE OF RESPONDENTS
$0K $50K $100K $150K $200KOther
Consultant
Data Scientist
Manager
Upper Management
Architect
Principal / Lead
Senior Engineer/Developer
Engineer/Developer/Programmer
Range/Median
Job
Title
18

JOB TITLE
ENGINEER / DEVELOPER /PROGRAMMER
40%
SENIOR ENGINEER / DEVELOPER
16%
PRINCIPAL / LEAD8%
ARCHITECT7%
UPPER MANAGEMENT7% MANAGER
5% DATA SCIENTIST4%
OTHER8%3%
CONSULTANT
SALARY MEDIAN AND IQR (US DOLLARS)
SHARE OF RESPONDENTS
$0K $50K $100K $150K $200KOther
Consultant
Data Scientist
Manager
Upper Management
Architect
Principal / Lead
Senior Engineer/Developer
Engineer/Developer/Programmer
Range/Median
Job
Title

TASKS (MAJOR INVOLVEMENT ONLY)
SHARE OF RESPONDENTS
Share of Respondents
Task
s (m
ajor
invo
lvem
ent o
nly)
0% 10% 30%20% 40% 50% 60% 70%
Developing hardware (or working on softwareprojects that require expert knowledge of hardware)
Mobile development
Developing products thatrely on real-time data analytics
Managing engineers
Communicating with people outside your company
Project management
Design work
Creating documentation
Teaching/training others
Writing code for non-collaborative projects(no one else will work on this code)
Frontend web development
Communicating with other lessor non-technical departments
Planning large software projects
Backend web development
Reading/editing code originallywritten by others (e.g., using git)
Writing code for collaborative projects

2016 SOFTWARE DEVELOPMENT SALARY SURVEYSALARY MEDIAN AND IQR (US DOLLARS)
Range/Median
TASKS (MAJOR INVOLVEMENT ONLY)
$0K $30K $60K $90K $120K $150K
Developing hardware (or working on softwareprojects that require expert knowledge of hardware)
Mobile development
Developing products thatrely on real-time data analytics
Managing engineers
Communicating with people outside your company
Project management
Design work
Creating documentation
Teaching/training others
Writing code for non-collaborative projects(no one else will work on this code)
Frontend web development
Communicating with other lessor non-technical departments
Planning large software projects
Backend web development
Reading/editing code originallywritten by others (e.g., using git)
Writing code for collaborative projects
Task
s (m
ajor
invo
lvem
ent o
nly)
2016 SOFTWARE DEVELOPMENT SALARY SURVEY
sample (most of whom were not architects) reported major in-
volvement in planning large software projects. These respondents
did earn more than the rest of the sample: major involvement in
planning large software projects had a coefficient of +$5,868.
Even though managers were excluded from the model, this
was determined through job title, not tasks. A large num-
ber of respondents who said they have major involvement
in managing engineers were among those excluded, but
many software professionals with a management component
(especially minor involvement) were kept in the model calcula-
tions. A modest coefficient was produced for (minor or major)
involvement in managing engineers: +$3,706.
Even with questions about management, title, and years of
experience, it is difficult to obtain a reliable metric of “level,”
the track of vertical career advancement that, we assume,
plays an integral part in determining salary. Variations in team
and management structure, and inconsistencies in title dis-
tinctions (e.g., “senior”, “staff”, “principal”) contribute to this.
One variable that we have found to serve as a decent proxy
for level is the number of hours spent in meetings. The coeffi-
cient of +$237 per weekly meeting hour is (as usual) in addi-
tion to any other management- or level-related features. If we
consider those professionals who spend somewhere around
half of their time in meetings (2% spent over 20 hours/week
in meetings), this coefficient can easily dwarf most other coef-
ficients as a contribution to salary estimate.
22

NONE2%
1 - 3 HRS / WEEK31%
4 - 8 HRS / WEEK44%
9 - 20 HRS / WEEK19%
20+ HRS / WEEK4%
NONE3%
1 - 3 HRS / WEEK7%
4 - 8 HRS / WEEK10%
9 - 20 HRS / WEEK27%
20+ HRS / WEEK54%
SALARY MEDIAN AND IQR (US DOLLARS)
TIME SPENT CODING (HOURS PER WEEK)
TIME SPENT IN MEETINGS (HOURS PER WEEK)
Range/Median
SHARE OF RESPONDENTS
Tim
e Sp
ent
SHARE OF RESPONDENTS
TASK COUNTS
$30K $60K $90K $120K $150KOver 20 hours / week
9 - 20 hours / week4 - 8 hours / week1 - 3 hours / week
None
SALARY MEDIAN AND IQR (US DOLLARS)
Range/Median
Tim
e Sp
ent
$0K $50K $100K $150K $200K20+ hours / week
9 - 20 hours / week4 - 8 hours / week1 - 3 hours / week
None
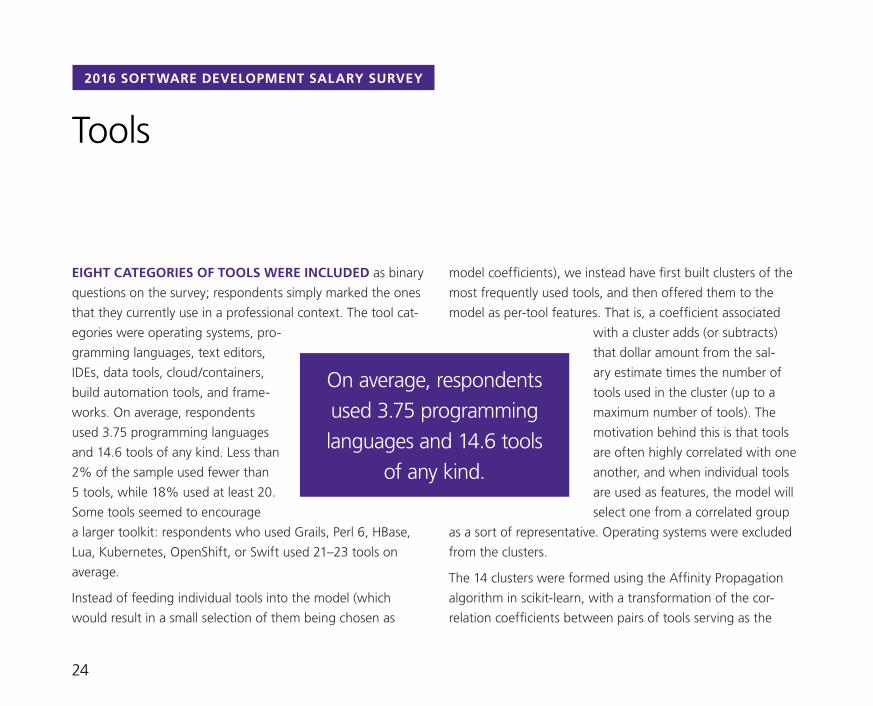
2016 SOFTWARE DEVELOPMENT SALARY SURVEY
Tools
EIGHT CATEGORIES OF TOOLS WERE INCLUDED as binary
questions on the survey; respondents simply marked the ones
that they currently use in a professional context. The tool cat-
egories were operating systems, pro-
gramming languages, text editors,
IDEs, data tools, cloud/containers,
build automation tools, and frame-
works. On average, respondents
used 3.75 programming languages
and 14.6 tools of any kind. Less than
2% of the sample used fewer than
5 tools, while 18% used at least 20.
Some tools seemed to encourage
a larger toolkit: respondents who used Grails, Perl 6, HBase,
Lua, Kubernetes, OpenShift, or Swift used 21–23 tools on
average.
Instead of feeding individual tools into the model (which
would result in a small selection of them being chosen as
model coefficients), we instead have first built clusters of the
most frequently used tools, and then offered them to the
model as per-tool features. That is, a coefficient associated
with a cluster adds (or subtracts)
that dollar amount from the sal-
ary estimate times the number of
tools used in the cluster (up to a
maximum number of tools). The
motivation behind this is that tools
are often highly correlated with one
another, and when individual tools
are used as features, the model will
select one from a correlated group
as a sort of representative. Operating systems were excluded
from the clusters.
The 14 clusters were formed using the Affinity Propagation
algorithm in scikit-learn, with a transformation of the cor-
relation coefficients between pairs of tools serving as the
On average, respondents used 3.75 programming languages and 14.6 tools
of any kind.
24
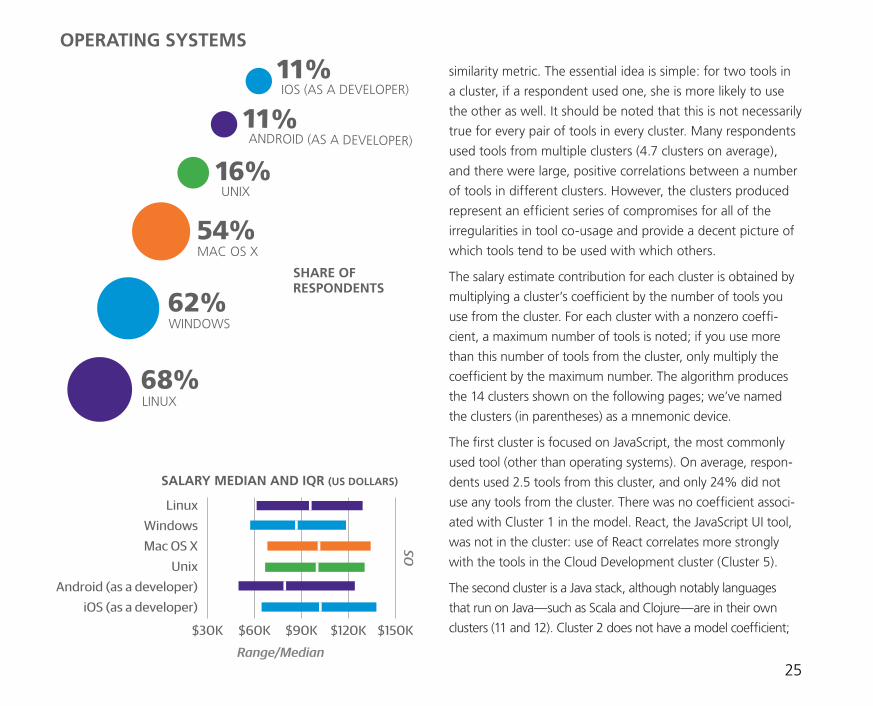
similarity metric. The essential idea is simple: for two tools in
a cluster, if a respondent used one, she is more likely to use
the other as well. It should be noted that this is not necessarily
true for every pair of tools in every cluster. Many respondents
used tools from multiple clusters (4.7 clusters on average),
and there were large, positive correlations between a number
of tools in different clusters. However, the clusters produced
represent an efficient series of compromises for all of the
irregularities in tool co-usage and provide a decent picture of
which tools tend to be used with which others.
The salary estimate contribution for each cluster is obtained by
multiplying a cluster’s coefficient by the number of tools you
use from the cluster. For each cluster with a nonzero coeffi-
cient, a maximum number of tools is noted; if you use more
than this number of tools from the cluster, only multiply the
coefficient by the maximum number. The algorithm produces
the 14 clusters shown on the following pages; we’ve named
the clusters (in parentheses) as a mnemonic device.
The first cluster is focused on JavaScript, the most commonly
used tool (other than operating systems). On average, respon-
dents used 2.5 tools from this cluster, and only 24% did not
use any tools from the cluster. There was no coefficient associ-
ated with Cluster 1 in the model. React, the JavaScript UI tool,
was not in the cluster: use of React correlates more strongly
with the tools in the Cloud Development cluster (Cluster 5).
The second cluster is a Java stack, although notably languages
that run on Java—such as Scala and Clojure—are in their own
clusters (11 and 12). Cluster 2 does not have a model coefficient;
OPERATING SYSTEMS
OS
SHARE OF RESPONDENTS
WINDOWS62%
MAC OS X54%
UNIX16%
ANDROID (AS A DEVELOPER)11%
IOS (AS A DEVELOPER)11%
LINUX68%
SALARY MEDIAN AND IQR (US DOLLARS)
Range/Median
$30K $60K $90K $120K $150K
iOS (as a developer)Android (as a developer)
UnixMac OS XWindows
Linux
25

2016 SOFTWARE DEVELOPMENT SALARY SURVEY
Cluster 1 (JavaScript): not included in model, no coefficient
Cluster 2 (Java): not included in model, no coefficient
Cluster 3 (Python/Data/Web): –$61 per tool, up to 8 tools
Cluster 4 (.NET): –$1,227 per tool, up to 12 tools
Cluster 5 (Cloud Dev/ Containers): +$1,549 per tool, up to 10 tools
Cluster 6 (PHP/MySQL): –$4,147 per tool, up to 5 tools
Cluster 7 (Ruby Web): not included in model, no coefficient
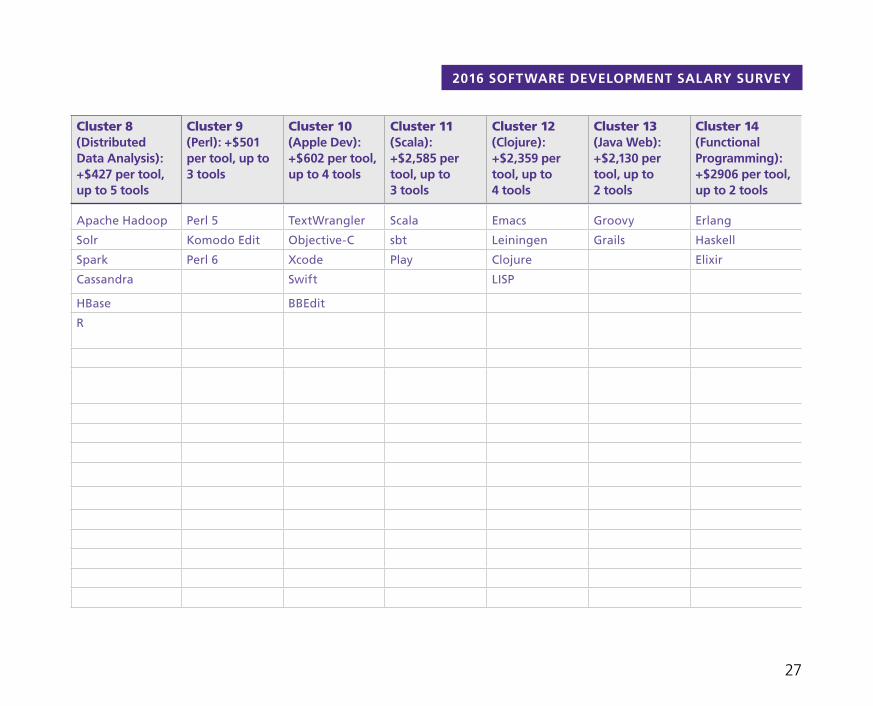
Cluster 8 (Distributed Data Analysis): +$427 per tool, up to 5 tools
Cluster 9 (Perl): +$501 per tool, up to 3 tools
Cluster 10 (Apple Dev): +$602 per tool, up to 4 tools
Cluster 11 (Scala): +$2,585 per tool, up to 3 tools
Cluster 12 (Clojure): +$2,359 per tool, up to 4 tools
Cluster 13 (Java Web): +$2,130 per tool, up to 2 tools
Cluster 14 (Functional Programming): +$2906 per tool, up to 2 tools
JavaScript Java Vim Notepad++ AWS MySQL PostgreSQL Apache Hadoop Perl 5 TextWrangler Scala Emacs Groovy Erlang
HTML Eclipse Bash Excel Jenkins PHP Ruby Solr Komodo Edit Objective-C sbt Leiningen Grails Haskell
CSS IntelliJ IDEA Python Visual Studio Docker PHPStorm Ruby on Rails Spark Perl 6 Xcode Play Clojure Elixir
jQuery Maven SQLite .NET Atom Zend Framework Heroku Cassandra Swift LISP
Sublime Text Spring C/C++ C# React Aptana Studio 3 TextMate HBase BBEdit
AngularJS Ant PyCharm Visual Studio Code
YAML Laravel RubyMine R
D3 Gradle Django ASP/ASP.NET Openstack Coda Backbone
Brackets Netbeans Scikit-learn Azure Google App Engine
Symfony
WebStorm Gedit Lua MS SQL Server Go CakePHP
Grunt Oracle BI Flask ASP.NET Ajax MongoDB
Gulp jEdit IDLE Visual Basic .NET Kubernetes
TextPad Android Studio make UltraEdit Mesos
DB2 nano TeamCity Elasticsearch
Processing SQL Cloud Foundry
MSBuild Bamboo
TFS OpenShift
F# Cloudbees
PowerShell
26
2016 SOFTWARE DEVELOPMENT SALARY SURVEY
Cluster 1 (JavaScript): not included in model, no coefficient
Cluster 2 (Java): not included in model, no coefficient
Cluster 3 (Python/Data/Web): –$61 per tool, up to 8 tools
Cluster 4 (.NET): –$1,227 per tool, up to 12 tools
Cluster 5 (Cloud Dev/ Containers): +$1,549 per tool, up to 10 tools
Cluster 6 (PHP/MySQL): –$4,147 per tool, up to 5 tools
Cluster 7 (Ruby Web): not included in model, no coefficient
Cluster 8 (Distributed Data Analysis): +$427 per tool, up to 5 tools
Cluster 9 (Perl): +$501 per tool, up to 3 tools
Cluster 10 (Apple Dev): +$602 per tool, up to 4 tools
Cluster 11 (Scala): +$2,585 per tool, up to 3 tools
Cluster 12 (Clojure): +$2,359 per tool, up to 4 tools
Cluster 13 (Java Web): +$2,130 per tool, up to 2 tools
Cluster 14 (Functional Programming): +$2906 per tool, up to 2 tools
JavaScript Java Vim Notepad++ AWS MySQL PostgreSQL Apache Hadoop Perl 5 TextWrangler Scala Emacs Groovy Erlang
HTML Eclipse Bash Excel Jenkins PHP Ruby Solr Komodo Edit Objective-C sbt Leiningen Grails Haskell
CSS IntelliJ IDEA Python Visual Studio Docker PHPStorm Ruby on Rails Spark Perl 6 Xcode Play Clojure Elixir
jQuery Maven SQLite .NET Atom Zend Framework Heroku Cassandra Swift LISP
Sublime Text Spring C/C++ C# React Aptana Studio 3 TextMate HBase BBEdit
AngularJS Ant PyCharm Visual Studio Code
YAML Laravel RubyMine R
D3 Gradle Django ASP/ASP.NET Openstack Coda Backbone
Brackets Netbeans Scikit-learn Azure Google App Engine
Symfony
WebStorm Gedit Lua MS SQL Server Go CakePHP
Grunt Oracle BI Flask ASP.NET Ajax MongoDB
Gulp jEdit IDLE Visual Basic .NET Kubernetes
TextPad Android Studio make UltraEdit Mesos
DB2 nano TeamCity Elasticsearch
Processing SQL Cloud Foundry
MSBuild Bamboo
TFS OpenShift
F# Cloudbees
PowerShell
27

Share of Respondents
Lang
uage
s
0% 10% 20% 30% 40% 50% 60%
SQL
Perl 6
Lua
Clojure
Swift
Go
Scala
Visual Basic .NET
Groovy
Objective-C
Perl 5
ASP/ASP.NET
Ruby
PHP
C/C++
C#
Python
Bash
Java
CSS
HTML
JavaScript
PROGRAMMING LANGUAGES

Range/Median
$0K $50K $100K $150K $200K
SQL
Perl 6
Lua
Clojure
Swift
Go
Scala
Visual Basic .NET
Groovy
Objective-C
Perl 5
ASP/ASP.NET
Ruby
PHP
C/C++
C#
Python
Bash
Java
CSS
HTML
JavaScript
Lang
uage
s
PROGRAMMING LANGUAGES

DATA TOOLS
MYSQL39%
EXCEL29%
POSTGRESQL27%
SQLITE18%
D38%
MS SQL SERVER
8%APACHE HADOOP
7%
SOLR7%
SPARK5%
ORACLE BI5%
CASSANDRA5%
MONGODB3%
SCIKIT-LEARN3%
HBASE2%
ELASTICSEARCH2%
SHARE OF RESPONDENTS
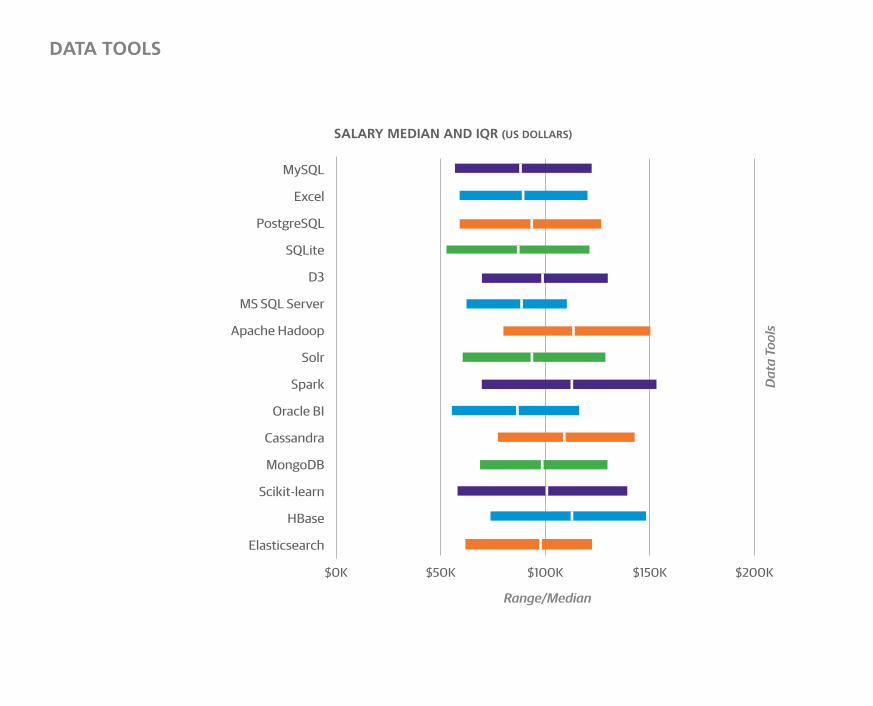
DATA TOOLS
SALARY MEDIAN AND IQR (US DOLLARS)
$0K $50K $100K $150K $200K
Elasticsearch
HBase
Scikit-learn
MongoDB
Cassandra
Oracle BI
Spark
Solr
Apache Hadoop
MS SQL Server
D3
SQLite
PostgreSQL
Excel
MySQL
Range/Median
Dat
a To
ols

TEXT EDITORS
VIM43%
NOTEPAD ++37%
SUBLIME TEXT33%
ATOM16%
VISUAL STUDIO CODE12%
EMACS9% TEXTWRANGLER
7%GEDIT5%
BRACKETS3%
ULTRAEDIT3%
KOMODO EDIT1%
JEDIT1%
SHARE OF RESPONDENTS
$0K $30K $60K $90K $120K $150K
jEditKomodo Edit
UltraEditBrackets
GeditTextWrangler
EmacsVisual Studio Code
AtomSublime Text
Notepad ++Vim
SALARY MEDIAN AND IQR (US DOLLARS)
Text
Edi
tors
Range/Median
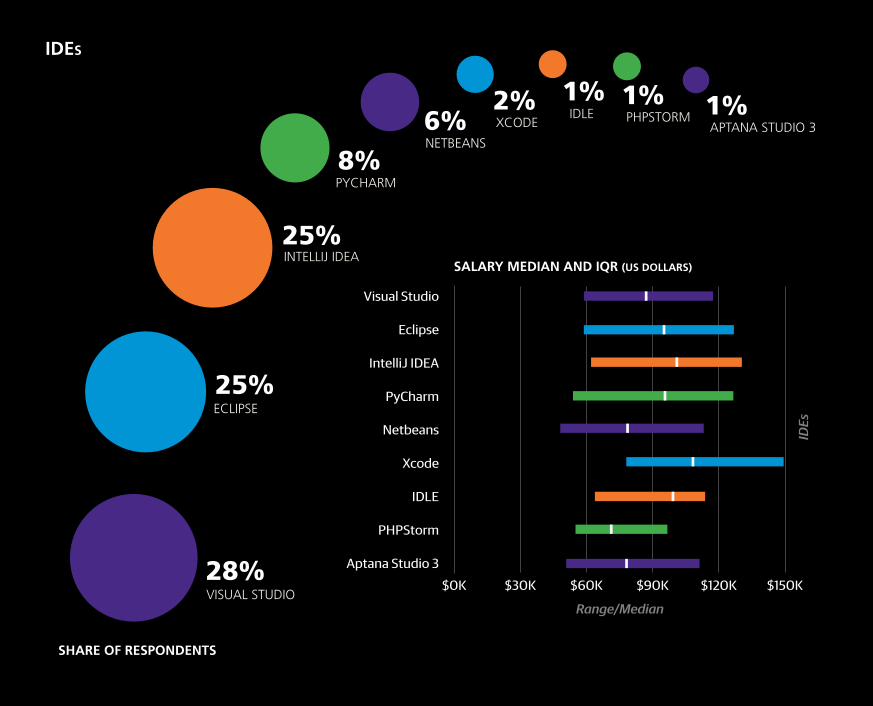
ECLIPSE25%
INTELLIJ IDEA25%
PYCHARM8%
NETBEANS6% XCODE
2%IDLE1%
PHPSTORM1%
APTANA STUDIO 31%
VISUAL STUDIO28%
SALARY MEDIAN AND IQR (US DOLLARS)
IDES
$0K $30K $60K $90K $120K $150K
Aptana Studio 3
PHPStorm
IDLE
Xcode
Netbeans
PyCharm
IntelliJ IDEA
Eclipse
Visual Studio
Range/Median
IDEs
SHARE OF RESPONDENTS

MAVEN23%
ANT14%
GRADLE13%
SBT4% LEININGEN
2% TEAMCITY2%
BAMBOO1% GRUNT
1%
JENKINS37%
SALARY MEDIAN AND IQR (US DOLLARS)
BUILD AUTOMATION TOOLS
$0K $30K $60K $90K $120K $150K
Grunt
Bamboo
TeamCity
Leiningen
sbt
Gradle
Ant
Maven
Jenkins
Range/Median
Build
Aut
omat
ion
Tool
s
SHARE OF RESPONDENTS

FRAMEWORKS
SALARY MEDIAN AND IQR (US DOLLARS)
$0K $50K $100K $150K $200K
FlaskGrails
Zend FrameworkPlay
YAMLASP.NET Ajax
DjangoRuby on Rails
ReactSpring
.NETAngularJS
jQuery
Range/Median
Fram
ewor
ks
JQUERY36%
ANGULARJS25%
.NET23%
SPRING15%
REACT11%
RUBY ON RAILS11%
DJANGO8% ASP.NET
AJAX
7%YAML6% PLAY
2%
ZEND FRAMEWORK2%
GRAILS2%
FLASK1%
SHARE OF RESPONDENTS
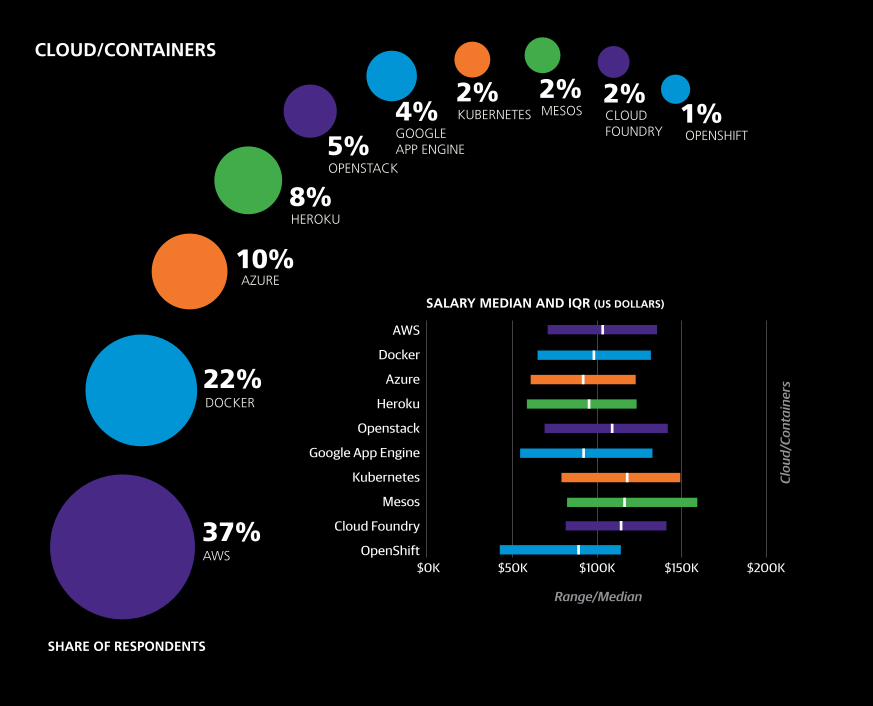
DOCKER22%
AZURE10%
HEROKU8%
OPENSTACK5%
GOOGLE APP ENGINE
4% KUBERNETES2%
MESOS2%
CLOUD FOUNDRY
2%OPENSHIFT1%
AWS37%
CLOUD/CONTAINERS
SHARE OF RESPONDENTS
$0K $50K $100K $150K $200KOpenShift
Cloud Foundry
Mesos
Kubernetes
Google App Engine
Openstack
Heroku
Azure
Docker
AWS
SALARY MEDIAN AND IQR (US DOLLARS)
Clou
d/Co
ntai
ners
Range/Median

2016 SOFTWARE DEVELOPMENT SALARY SURVEYusing more or fewer of these tools does not appear to affect salary
after all of the variables are taken into account. OracleBI seems an
outlier on a list of mostly Java tools; the correlation of OracleBI to
the other tools may indicate a higher concentration of enterprise
(i.e., big organization) use of Java.
Cluster 3 is typified by Python, although Vim and Bash have
more users. Cluster 3 has a small, negative coefficient of –$61.
Respondents used Python for a variety of programming tasks,
as reflected in the tools in this cluster, including data manage-
ment, data analysis, and web applications
Cluster 4 consists primarily of Microsoft products (in particular,
those in the .NET framework) and has a large negative coeffi-
cient of –$1,227. This was the second most well-used cluster:
on average respondents used two tools from this cluster. That
Excel shows up high on the list in the .NET clusters seems a sign
that Excel is an integral part of .NET developers’ toolboxes, for
analytics, data query, data investigation, and other uses.
Cluster 5 has a cloud/container theme, containing tools such
as AWS, Jenkins, and Docker. With a coefficient of +$1,549
per tool, this cluster has the highest potential salary estimate
contribution of all of the clusters. Cloud computing pays. The
appearance of the JavaScript UI tool React in the cluster shows
that the Cloud is used for app development; most of the tools
in the cluster are used by web engineers to manage complex,
cloud-based web application platforms, and also reflect the
move to containers for portable cloud deployment.
In contrast to Cluster 5, Cluster 6 has the largest negative coef-
ficient: –$4,147 per tool. This is the PHP/MySQL stack, one that
may be going somewhat out of style. Still, 43% of the sample
used at least one tool from this cluster. The PHP/MySQL cluster
appears to be a silo with no strong correlation to other web
development tools—an indication that PHP/MySQL represents
a separate web development path for the survey respondents.
Cluster 7, like Cluster 6, consists of tools that mostly support
building web apps (with RoR, and postgres as the backend
database). This cluster did not have a coefficient. Ruby on Rails
seems the center of gravity for the Ruby Web cluster, along
with a few infrastructure tools that support Ruby on Rails.
Cluster 8 is centered around data processing and analytics, and
notably it was split from Cluster 3 (Vim, Bash, Python), which
also contained data tools. However, Cluster 8 seems to be more
purely a data stack (Cluster 3 contained some web dev tools,
for example). This cluster had a small but positive coefficient of
+$427. The tools here are used for both data analysis and data
engineering, but we think the appearance of Spark, Cassandra,
HBase, and R indicate more emphasis on data analysis usage.
The six remaining clusters are much smaller both in terms of the
number of tools in the cluster and the number of respondents
who used them. Each is centered around one or two languages,
and thus is simpler to interpret than some of the previous
clusters. Furthermore, each had a large, positive coefficient in
the model. These tools are largely emerging technologies (with
the possible exception of Cluster 9, containing Perl), and their
stacks have yet to be fully developed.
37

2016 SOFTWARE DEVELOPMENT SALARY SURVEY
Past/Future Languages
RESPONDENTS WERE ASKED NOT ONLY WHICH
LANGUAGES THEY CURRENTLY USE, but also about those
that they previously used (but no longer use) and those that
they are planning to learn (within the next 1–2 years). Most re-
spondents had at least one “past” and “future” language: only
18% of the sample had never used
a language professionally that they
no longer use, and 17% did not plan
on learning any new languages.
The most common “past” languages
were C/C++ (35% of the sample),
Java (25%), PHP (22%), Visual Basic
.NET (17%), C# (17%), and Perl 5
(17%). This does not necessarily
mean these languages are dead or
dying: Java and C#, for example,
were reported more frequently as currently used languages
than past languages. LISP and Visual Basic, on the other hand,
were reported more frequently as past languages than currently
used languages: 4% vs. 1% for LISP and 17% vs. 4% for Visual
Basic. Interestingly, Visual Basic also correlates highly with two
sectors: Banking/Finance and Government.
Two positive coefficients are associated with past languages:
ASP/ASP.NET (+$2,403) and Scala (+$13,920). Interpretation is
not straightforward; it can be spun
negatively, since the respondents
got a big boost in their expected
salary when they stopped using
them, but it could also be a under-
stood in a positive light: these lan-
guages served as important career
steps or learning paths. Respon-
dents who used Scala in the past
were more likely to be computer
science majors (64% vs. 52% of
the whole sample) and were more
likely to work on collaborative code, read/edit code of others,
plan software projects, work on projects that require real-time
data analysis (27% vs. 17%), and do backend web develop-
ment; it is possible that the past-Scala-use coefficient indicates
Respondents who previously used C/C++ tend to use
Java now, and those who use Java now tend to
want to learn Scala.
38

2016 SOFTWARE DEVELOPMENT SALARY SURVEY
knowledge of some of the above features (and perhaps hidden
features, such as level), which in turn affect salary.
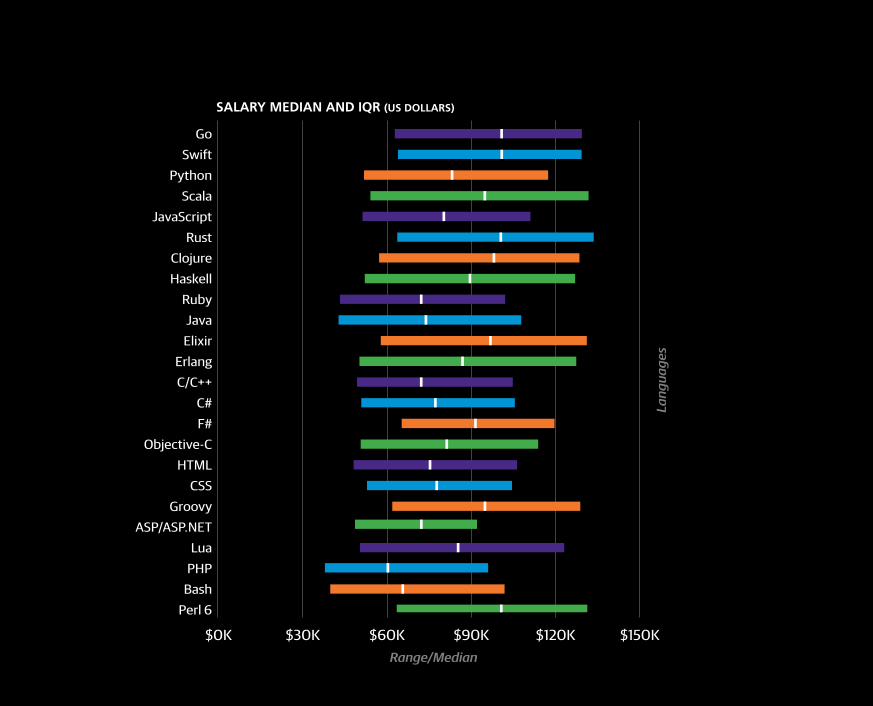
Most respondents (54%) selected one or two languages
that they would like to learn. The top choices were Go (22%
of respondents), Swift (20%), Python (18%), Scala (14%),
JavaScript (14%), Rust (10%), and Clojure (9%). There is a clear
distinction among languages on the top to-learn list defined
by the proportion of the sample share that currently uses the
language and the share that wants to learn them. In the case
of Go, Swift, Scala, Rust, Clojure, Haskell, Elixir, Erlang, and F#,
there are far more people who want or plan to learn them than
currently use them. In contrast, Python, JavaScript, Ruby, and
Java are used by more respondents currently than they were
chosen as learning goals.
Notably, for the top 20 future languages, the proportion of
current users to future learners was either less than 0.3 or more
than 1.2. This is a quantitative realization of the distinction be-
tween emerging languages and current (but popular/growing)
languages. Perhaps once the number of current users exceeds
a certain amount (and thus the current:learner proportion
surpasses .3), the rate that people learn the language is so high
that the proportion quickly tips and there are more actual users
than aspiring learners. However, this is only conjecture, and we
will have to wait for future survey data to make any more solid
conclusions.
As with past languages, the coefficients for future languages do
not lend themselves to obvious explanation: Erlang (–$3,867),
Ruby (–$5,363), and C# (–$7,721) all had negative coefficients.
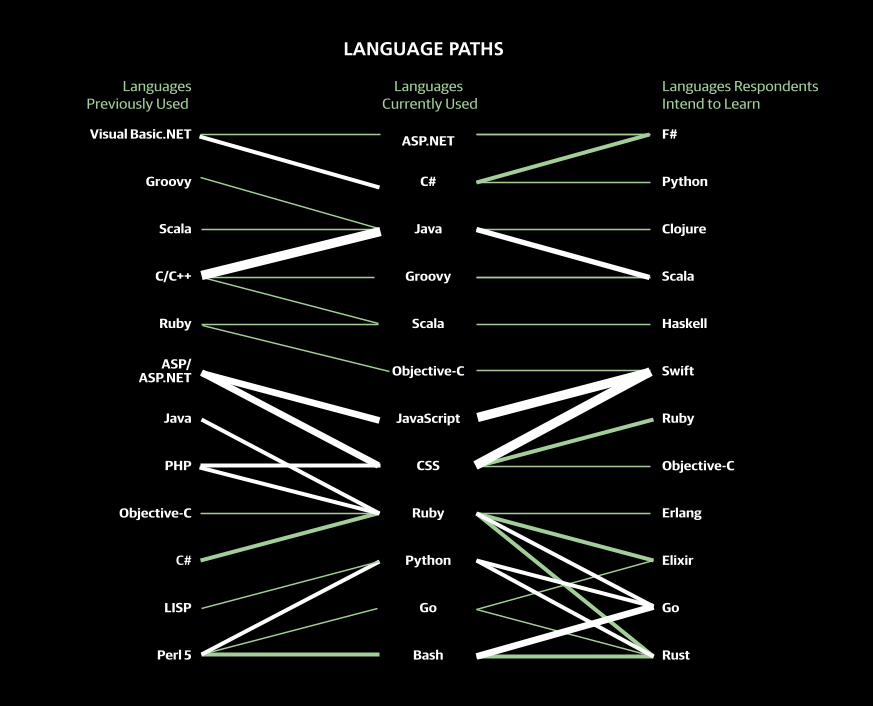
One final analysis we can make of the past-present-future
languages is to associate them in language paths. For example,
respondents who previously used C/C++ tend to use Java now,
and those who use Java now tend to want to learn Scala. The
most common paths are shown in the graph below. While
these pathways were not included as additional features to
the model, we can look at the median salaries of respondents
who took a particular path. Among common paths (at least 30
respondents), ones taken by the most well paid respondents
were Perl 5 > Java > Clojure (median salary $107K), LISP >
HTML > Swift ($104K), Ruby > Java > Clojure ($102K), and Perl
5 > Ruby > Swift ($100K).
39

Lang
uage
sShare of Respondents
SHARE OF RESPONDENTS
0% 5% 10% 15% 20% 25% 30% 35%
Haskell
Perl 6
Lua
Scala
Groovy
LISP
Objective-C
Bash
CSS
Ruby
Python
JavaScript
HTML
ASP/ASP.NET
Perl 5
C#
Visual Basic .NET
PHP
Java
C/C++
Lang
uage
s
SALARY MEDIAN AND IQR (US DOLLARS)
$0K $30K $60K $90K $120K $150K
Haskell
Perl 6
Lua
Scala
Groovy
LISP
Objective-C
Bash
CSS
Ruby
Python
JavaScript
HTML
ASP/ASP.NET
Perl 5
C#
Visual Basic .NET
PHP
Java
C/C++
PAST PROGRAMMING LANGUAGES (PREVIOUSLY USED PROFESSIONALLY)
Range/Median

Lang
uage
s
Share of Respondents
SHARE OF RESPONDENTS
0% 5% 10% 15% 20% 25%
Perl 6BashPHPLua
ASP/ASP.NETGroovy
CSSHTML
Objective-CF#C#
C/C++Erlang
ElixirJava
RubyHaskellClojure
RustJavaScript
ScalaPython
SwiftGo
Lang
uage
s
Range/Median
$0K $30K $60K $90K $120K $150K
Perl 6BashPHPLua
ASP/ASP.NETGroovy
CSSHTML
Objective-CF#C#
C/C++Erlang
ElixirJava
RubyHaskellClojure
RustJavaScript
ScalaPython
SwiftGo
FUTURE PROGRAMMING LANGUAGES (INTENT TO LEARN)
SALARY MEDIAN AND IQR (US DOLLARS)
Lang
uage
s
Share of Respondents
SHARE OF RESPONDENTS
0% 5% 10% 15% 20% 25%
Perl 6BashPHPLua
ASP/ASP.NETGroovy
CSSHTML
Objective-CF#C#
C/C++Erlang
ElixirJava
RubyHaskellClojure
RustJavaScript
ScalaPython
SwiftGo
Lang
uage
sRange/Median
$0K $30K $60K $90K $120K $150K
Perl 6BashPHPLua
ASP/ASP.NETGroovy
CSSHTML
Objective-CF#C#
C/C++Erlang
ElixirJava
RubyHaskellClojure
RustJavaScript
ScalaPython
SwiftGo
FUTURE PROGRAMMING LANGUAGES (INTENT TO LEARN)
SALARY MEDIAN AND IQR (US DOLLARS)
LANGUAGE PATHS
Perl 5
LISP
C#
Objective-C
PHP
Java
ASP/ASP.NET
Ruby
C/C++
Scala
Groovy
Visual Basic.NET
Bash
Go
Python
Ruby
CSS
JavaScript
Objective-C
Scala
Groovy
Java
C#
ASP.NET
Rust
Go
Elixir
Erlang
Objective-C
Ruby
Swift
Haskell
Scala
Clojure
Python
F#
Languages Previously Used
Languages Currently Used
Languages Respondents Intend to Learn
2016 SOFTWARE DEVELOPMENT SALARY SURVEY
MOST OF THE SAMPLE (63%) WORKED BETWEEN 40
AND 45 HOURS per week, with 4% working over 55 hours.
Work week correlated well with salary and produced a coef-
ficient of +$352 per hour. As mentioned before, those who
reported a work week shorter than 30
hours were not included in the model.
The other question was about bargain-
ing skills: respondents were asked to
rate how well they can bargain on a
scale of 1 to 5. Most respondents gave
themselves a 3 or 4. Although this is a highly subjective rating,
we find it necessary to have some proxy for bargaining skills,
since this can have a huge effect on your eventual compensa-
tion. Bargaining points correlated highly with salary, and the
model predicts a salary boost of +$3,733 for each point on
the scale.
Work Week, Bargaining, and Ease of Finding Work
Another question, similarly opinion based, was the ease of find-
ing new work. In some cases this may be obvious (for example,
if the respondent has job offers on the table, or had recently
been looking for work unsuccessfully), but in most cases it is
probably just as rough a measure as
bargaining skills. The average score,
also on a five-point scale, was 3.8.
Since this is not a variable that we can
change (that is, in the same way that
we can move to new states or coun-
tries, learn new tools, or shift careers
to new roles), this variable was not included in the model.
However, the residuals of the model do correlate with the ease-
of-finding-work score, and correspond to about a $2K increase
per point: the easier it is to find work, the higher your salary is
expected to be.
Work week correlated well with salary.
45

30 - 35 HOURS3%
36 - 39 HOURS10%
40 HOURS39%
41 - 45 HOURS25%
46 - 50 HOURS14%
51 - 55 HOURS4% 56 - 60 HOURS
2% >60 HOURS2%
< 30 HOURS1%
SALARY MEDIAN AND IQR (US DOLLARS)
WORK WEEK
$0K $50K $100K $150K $200K
60+
56 to 60
51 to 55
46 to 50
41 to 45
40 hours
36 to 39
30 to 35
< 30
Range/Median
Hou
rs/W
eek
SHARE OF RESPONDENTS

$30K $60K $90K $120K $150K
5 (very easy)432
1 (very dicult)
TASK COUNTS
4%9%
23%
37%
27%
Very Difficult-1
Very Easy - 5
2
3
4
SALARY MEDIAN AND IQR (US DOLLARS)
EASE OF FINDING A NEW ROLE ON A SCALE FROM 1-5 (1 being very difficult, 5 being very easy)
Range/Median
Ease
of F
indi
ng W
ork
SHARE OF RESPONDENTS
SALARY MEDIAN AND IQR (US DOLLARS)
SELF-ASSESSED BARGAINING SKILLS ON A SCALE FROM 1-5 (1 being poor, 5 being excellent)
$30K $60K $90K $120K $150K
Skill
Lev
el
Range/Median
SHARE OF RESPONDENTS
8%20%
37%
27%
POOR -1
8%EXCELLENT - 5
2
3
4 5 (Excellent)
4
3
2
1 (Poor)

2016 SOFTWARE DEVELOPMENT SALARY SURVEY
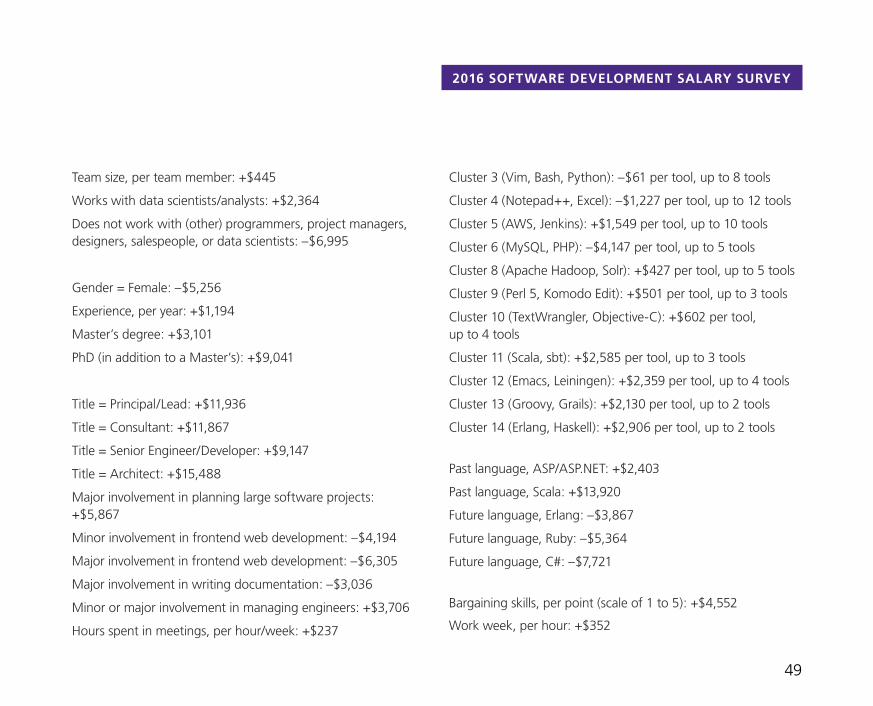
The Model in FullTHE MODEL HAS AN R2 OF 0.584: this means the model
explains approximately 58% of the variation in the sample
salaries. The intercept has been combined with the geograph-
ical coefficients, of which you select one. Then you proceed
through the coefficients, adding or subtracting the ones asso-
ciated with a feature that applies to you. Once you sum up the
coefficients, you will obtain an estimate for your annual total
salary in US dollars.
United Kingdom: +$25,782
Switzerland: +$53,983
France: +$2,017
Italy/Spain/Portugal/Greece/Turkey: –$5,163
Northern/Western Europe (except for countries above): +$17,443
Eastern Europe : –$14,804
Australia: +$29,636
New Zealand: +$17,443
India: –$22,064
Japan: +$36,076
2 Here “Eastern Europe” includes the Balkans, Baltics, and some countries more accurately described as “Central Europe”: Poland, Czech Republic, Hungary, Slovenia, and everything to the East and South (but not including Greece or Turkey).
Taiwan: –$14,285
Philippines: –$13,621
All other countries in Asia: +$17,443
Latin America: –$9,057
Africa (all respondents from Africa were from South Africa): –$3,766
Canada: +$17,443
US, Midwest: +$48,060
US, Pacific NW: +$57,838
US, Northeast: +$60,453
US, California: +$76,671
All other US states: +$52,778
Industry = Banking/Finance: +$11,367
Industry = Search/Social Networking: +$10,891
Industry = Education: –$11,812
Industry = Consulting (IT): +$4,528
Company size = 1: +$12,822
Company size = 10,000 or more: +$6,801
Company age = more than 20 years: –$6,279
48
2016 SOFTWARE DEVELOPMENT SALARY SURVEY
Cluster 3 (Vim, Bash, Python): –$61 per tool, up to 8 tools
Cluster 4 (Notepad++, Excel): –$1,227 per tool, up to 12 tools
Cluster 5 (AWS, Jenkins): +$1,549 per tool, up to 10 tools
Cluster 6 (MySQL, PHP): –$4,147 per tool, up to 5 tools
Cluster 8 (Apache Hadoop, Solr): +$427 per tool, up to 5 tools
Cluster 9 (Perl 5, Komodo Edit): +$501 per tool, up to 3 tools
Cluster 10 (TextWrangler, Objective-C): +$602 per tool, up to 4 tools
Cluster 11 (Scala, sbt): +$2,585 per tool, up to 3 tools
Cluster 12 (Emacs, Leiningen): +$2,359 per tool, up to 4 tools
Cluster 13 (Groovy, Grails): +$2,130 per tool, up to 2 tools
Cluster 14 (Erlang, Haskell): +$2,906 per tool, up to 2 tools
Past language, ASP/ASP.NET: +$2,403
Past language, Scala: +$13,920
Future language, Erlang: –$3,867
Future language, Ruby: –$5,364
Future language, C#: –$7,721
Bargaining skills, per point (scale of 1 to 5): +$4,552
Work week, per hour: +$352
Team size, per team member: +$445
Works with data scientists/analysts: +$2,364
Does not work with (other) programmers, project managers, designers, salespeople, or data scientists: –$6,995
Gender = Female: –$5,256
Experience, per year: +$1,194
Master’s degree: +$3,101
PhD (in addition to a Master’s): +$9,041
Title = Principal/Lead: +$11,936
Title = Consultant: +$11,867
Title = Senior Engineer/Developer: +$9,147
Title = Architect: +$15,488
Major involvement in planning large software projects: +$5,867
Minor involvement in frontend web development: –$4,194
Major involvement in frontend web development: –$6,305
Major involvement in writing documentation: –$3,036
Minor or major involvement in managing engineers: +$3,706
Hours spent in meetings, per hour/week: +$237
49

2016 SOFTWARE DEVELOPMENT SALARY SURVEY
Surveys certainly have their drawbacks, especially when the
sample is self-selected. In our conclusions here, we rely on the
assumption that the people who took the survey are reasonably
representative of the entire software development world, or at
least some important subset of it. The O’Reilly programming
audience—from which the respondents generally come—has a
proclivity toward choosing open source and emerging technol-
ogy, and this will affect the results: the percentages of respon-
dents who used certain tools, for example, are probably not
good estimates of the global development rates.
The correlation-causation distinction should certainly be kept
in mind when reading this report, but it is worth noting that,
while it does not imply causation, correlation does not deny it,
either. If you were planning on learning a language anyway,
it’s not a bad idea to choose one that correlates positively with
salary, if it suits your professional needs. Generally speaking, a
broader skillset is respected in the software world, and learning
more tools always opens new doors. Taking into account the in-
formation in this report might increase the chances of opening
a door with a bigger paycheck somewhere on the other side.
IN ANY INDUSTRY, IT IS WISE TO KEEP IN TOUCH WITH
RELEVANT TECHNOLOGICAL CHANGES that could affect
your career; in a field such as software development, where the
tools change so rapidly, this becomes an increasingly challeng-
ing task. This report is intended to give a quantitative look at
the various careers and profiles of software professionals, and
shed some light on what your next step might be, whether it is
to learn a new language or shift roles.
Conclusion
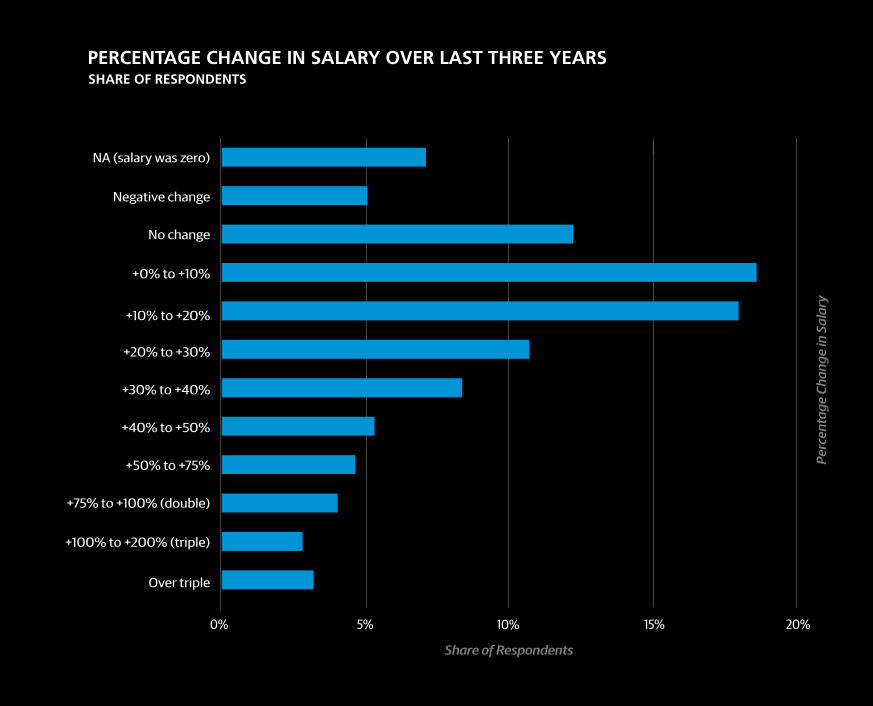
Share of Respondents
0% 5% 10% 15% 20%
Over triple
+100% to +200% (triple)
+75% to +100% (double)
+50% to +75%
+40% to +50%
+30% to +40%
+20% to +30%
+10% to +20%
+0% to +10%
No change
Negative change
NA (salary was zero)
PERCENTAGE CHANGE IN SALARY OVER LAST THREE YEARS
Perc
enta
ge C
hang
e in
Sal
ary
SHARE OF RESPONDENTS

We need your data.To stay up to date on this research, your participation is critical. The survey is now open for the 2017 report, and if you can spare just 10 minutes of your time, we encourage you to take the survey.oreilly.com/programming/2017-programming-salary-survey.html

53
Wait. There’s more.4 easy ways to stay ahead of the game. Programming technologies don’t stand still—neither should you. Sharpen your skills and advance your career potential with these resources, most of which are free.
1. Sign up for the O’Reilly Programming Newsletter (oreilly.com/programming/newsletter) to get fresh news each week, including ideas, insights, interviews, and advice from industry leaders, and even a couple of laughs. Receive advance notice of O’Reilly programming books, reports, and events, plus exclusive offers and discounts for subscribers.
2. Bookmark oreilly.com/topics/software-engineering, and make it part of your essential reading. You’ll find timely, in-depth interviews and podcasts with industry leaders, excerpts from forthcoming books, and special reports on software-related issues that will keep you on top of your game.
3. Participate in free webcasts at webcasts.oreilly.com. Learn programming skills and tools online from some of the top minds practicing today in a casual, interactive forum.
4. Immerse yourself in learning at an upcoming O’Reilly conference. Check out conferences.oreilly.com.
O’Reilly Media, Inc. O’Reilly is a registered trademark of O’Reilly Media, Inc.
