2016 shift index - deloitte us · 2016 shift index the paradox of flows ... executive turnover:...
TRANSCRIPT
2016 Shift IndexThe paradox of flows: Can hope flow from fear?

About the Center for the Edge
The Deloitte Center for the Edge conducts original research and develops substantive points of view for new corporate growth. The center, anchored in Silicon Valley with teams in Europe and Australia, helps senior executives make sense of and profit from emerging opportunities on the edge of business and technology. Center leaders believe that what is created on the edge of the competitive landscape—in terms of technology, geography, demographics, markets—inevitably strikes at the very heart of a business. The Center for the Edge’s mission is to identify and explore emerging opportunities related to big shifts that are not yet on the senior management agenda, but ought to be. While Center leaders are focused on long-term trends and opportunities, they are equally focused on implications for near-term action, the day-to-day environment of executives.
Below the surface of current events, buried amid the latest headlines and competitive moves, executives are beginning to see the outlines of a new business landscape. Performance pressures are mounting. The old ways of doing things are generating diminishing returns. Companies are having a harder time making money—and increasingly, their very survival is challenged. Execu-tives must learn ways not only to do their jobs differently, but also to do them better. That, in part, requires understanding the broader changes to the operating environment:
• What is really driving intensifying competitive pressures?
• What long-term opportunities are available?
• What needs to be done today to change course?
Decoding the deep structure of this economic shift will allow executives to thrive in the face of in-tensifying competition and growing economic pressure. The good news is that the actions needed to address short-term economic conditions are also the best long-term measures to take ad-vantage of the opportunities these challenges create. For more information about the Center’sunique perspective on these challenges, visit www.deloitte.com/centerforedge.
Deloitte Consulting LLP’s Strategy & Operations practice works with senior executives to helpthem solve complex problems, bringing an approach to executable strategy that combines deepindustry knowledge, rigorous analysis, and insight to enable confident action. Services includecorporate strategy, customer and marketing strategy, mergers and acquisitions, social impactstrategy, innovation, business model transformation, supply chain and manufacturing operations,sector-specific service operations, and financial management.
COVER IMAGE BY: MARIA CORTE MAIDAGAN

Contents
Overview | 2
A year of change
Increasing flows hold potential, if we learn to use them | 5
To move past fear to opportunity | 8
Conclusion | 10
Appendix | 11
2016 Shift Index metrics
Endnotes | 34
About the authors | 35
Acknowledgements | 36
Contacts | 36
The paradox of flows: Can hope flow from fear?
1

OverviewA year of change
The year 2016: It feels unprecedented, historic—a year that seemed destined to make clear, in ways that no series of charts ever could, that the world is changing, has changed, will continue to change. Events both global and local highlighted disparities in income and opportunity, skills and future prospects, and a widening gap between geographic regions with vibrant economies and others struggling with industries in transition, and we watched it all play out on a 24/7, always-connected, virtual stage.
WE are left with a sense of unease. It seems apparent that the American pub-lic, broadly, was gripped by a deep anxi-
ety this year, manifesting as fear or pessimism or cynicism. This national anxiety led to results that confounded experts, broke models, and defied ex-pectations. Time and again, 2016 has reminded us that our ability to understand and adapt has failed to keep pace with the speed of change in the world around us—socially and commercially—just as our ability to process and evaluate information has not kept up with the speed at which it is created, dis-seminated, and consumed. Even as some organiza-tions and political candidates made appeals to the past, the very way these appeals played out made clear that the world in which we live is changing, and the models and expectations we have about how the world works may no longer hold.
Why? Much has been made of an apparent turn in the national temperament. Demographics have been sliced and diced, with explanations and counter-ex-planations that fit some story we tell ourselves. The same themes pervaded, yet our perceptions of them seemed to vary wildly. What preoccupied our collec-tive imagination? Fairness, opportunity, the future, a need for change, and a fear of change already upon
us. What are those changes? They are myriad. Many of the most profound are universal and long-term.
The Shift Index is our attempt to quantify and make sense of the changes we see in the world around us, primarily through the lens of business.
The index (see sidebar “The Shift Index” for further definition) measures long-term trends across three categories: Foundations, Flows, and Impact. These broad trends have been building for decades, yet they don’t affect all industries or regions equally or at the same time. Some are just reaching an inflec-tion point at which the effects are difficult to ignore. In particular, we’re beginning to feel the cumulative effects of technological advances and demographic changes that are starting to turn up the steep part of an exponential curve. It can be disorienting.
Overall, this year’s index reflects the durability and stability of the trends we have reported on previ-ously. Despite the feeling of great upheaval, these indices have been fairly consistent and predictable over a period of decades.
The world of the Big Shift demands resilience and emphasizes learning over predictability and the status quo, scalable learning rather than scalable ef-ficiency, and participating effectively in knowledge
2016 Shift Index
2

THE SHIFT INDEXWe developed the Shift Index to help executives understand and take advantage of the long-term forces of change shaping the US economy. First released in 2009 and updated annually, the Shift Index tracks 25 metrics across more than 45 years, providing a comprehensive view of underlying forces not captured by short-term economic indicators. These metrics, and the relative rates of change between them, highlight the evolution and impact of long-term trends in technology and public policy.
The Shift Index metrics are divided into three indices that measure the waves of change in what we call the Big Shift in the global business environment:
1. The “Foundation” index tracks advances in the digital technology infrastructure and public policy that catalyze changes in the business landscape. Trends in the Foundation metrics have systematically reduced barriers to entry and movement.
2. The “Flow” index looks at the flows of knowledge, capital, and talent—key drivers of performance enabled by the Foundation—as well as at the amplifiers of these flows. Flow metrics tend to lag Foundation metrics because of the time required to understand and develop new practices consistent with advances in the foundation.
3. The “Impact” index captures the effects that long-term trends have on competition, volatility, and performance across industries. Impact metrics will change as firms begin to figure out how to participate in and harness the knowledge, capital, and talent flows across institutional and geographic boundaries.
Deloitte University Press | dupress.deloitte.com
TRS: Return to shareholdersCreative occupations and cities defined by Richard Florida’s The Rise of the Creative Class (2004).Measured by the Bureau of Transportation Statistics’ Transportation Services Index
Notes: ***
***
Source: Deloitte analysis.
Foun
dati
on in
dex
Flow
inde
xIm
pact
inde
x
Competitive intensity: Herfindahl indexLabor productivity: Index of labor productivity as defined by the Bureau of Labor StatisticsStock price volatility: Average standard deviation of daily stock price returns over one year
Asset profitability: Total ROA for all US firmsROA performance gap: Gap in ROA between firms in the top and the bottom quartilesFirm topple rate: Annual rank shuffling amongst US firmsShareholder value gap: Gap in the TRS* between firm in the top and the bottom quartiles
Consumer power: Index of 6 consumer power measuresBrand disloyalty: Index of 6 consumer disloyalty measuresReturns to talent: Compensation gap between more and less creative occupational groupings**Executive turnover: Number of top management terminated, retired, or otherwise leaving companies
Inter-firm knowledge flows: Extent of employee participation in knowledge flows across firmsWireless activity: Total annual volume of mobile minutes and SMS messagesInternet activity: Internet traffic between top 20 US cities with the most domestic bandwidth
Migration of people to creative cities: Population gap between top and bottom creative cities**Travel volume: Total volume of local commuter transit and passenger air transportation***Movement of capital: Value of US foreign direct investment inflows and outflows
Worker passion: Percentage of US workers who have three attributes—questing, connecting, and commitment to domain—related to their workSocial media activity: Time spent on social media as a percentage of total Internet time
Computing: Computing power per unit of costDigital storage: Digital storage capacity per unit of costBandwidth: Bandwidth capacity per unit of cost
Internet users: Number of people actively using the Internet as compared to the US populationWireless subscriptions: Percentage of active wireless subscriptions as compared to the US population
Economic Freedom: Index of 10 freedom components as defined by the Heritage Foundation
Markets
Firms
People
Virtual flows
Physical flows
Amplifiers
Technologyperformance
Infrastructurepenetration
Public policy
The paradox of flows: Can hope flow from fear?
3

flows within and across companies. The findings of the 2016 Shift Index suggest that companies and individuals are increasingly willing to participate in knowledge flows but still learning how to under-stand and harness them.
Mounting pressures, narrowing focusParadoxically, despite the stability and predictabil-ity of these long-term trends, the world around us seems consumed by a pervasive sense of uncertain-ty, insecurity, and resultant fear. This effect occurs somewhat independently of whether something is actually happening. For example, nothing in the Impact Index departs from the trends we have seen over the past decade, but there seems to be more of a sense of insecurity that isn’t directly connected to whether an individual’s company has declining performance or whether volatility has buffeted that individual’s stock portfolio.
At the same time, the pressure is increasing as the effects of the Big Shift begin to accumulate. As digi-tal technologies increasingly permeate all areas of our lives and reach all corners of our country, the positive and negative impacts of the Big Shift on business and society become more difficult to ig-nore. As Tom Friedman points out in his new book Thank You for Being Late, our ability (as humans or society) to adapt tends to follow a linear path, while the technological foundations are changing expo-nentially. The exponential curve gets only steeper when you consider the convergence of multiple, exponentially advancing building blocks (comput-ing, storage, and bandwidth) into technologies such as cloud computing, biosynthesis, and 3D printing, and the self-reinforcing cycles of innovation that follow.1 The resulting gap causes real economic dis-location in addition to a more general disorientation and anxiety.
Companies and individuals aren’t necessarily ben-efiting from the technology and policy trends. In fact, the Impact index shows that although labor pro-ductivity continues to increase, firm performance, as measured by ROA, continues to decline econo-my-wide, especially for companies in the bottom
quartile. There is real stress. Indeed, with electronic trading algorithms instantaneously reacting to ever larger flows of real-time data, both quantitative and sentiment- and headline-based, stock market vola-tility is ticking upward again after declining from the 2008 peak. Companies face mounting performance pressures; so do workers.
There’s a paradox here. In one part of our lives, as consumers, the Big Shift is giving us much more power; in another part of our lives, as workers, we are facing increasing performance pressure. Con-sumer power remains high in many categories, as does brand disloyalty. But consumer power matters only if you have money to spend, and awareness that employers might be facing significant performance challenges further fuels widespread anxiety.
This pressure leads to a narrower focus, causing many institutions and individuals to home in on iso-lated components and miss the broader picture of the Big Shift. Consider issues such as trade, global-ization, and job losses: Most of the discussion fails to consider them as they are today within the context of the broader changes represented by the Big Shift. Friedman describes it as a “new era of globalization,” one that is defined by interconnection and compa-nies and individuals participating in global flows.2 The mounting performance pressures can cause us to lose sight of the Big Shift and narrow our focus to more tangible components that seem easier to ad-dress through a specific policy or strategy. However, trade is only one of the forces creating and intensify-ing pressure. Focusing just on trade, or just on jobs, can’t help but fail to address the more complex web of flows that are reshaping our economic and social systems. Crafting effective solutions that will create new opportunity and drive higher levels of perfor-mance requires understanding the broader picture of the Big Shift.
2016 Shift Index
4

Increasing flows hold potential, if we learn to use them
WE believe part of the answer can be found in the Flow Index. Increasing volumes and speeds of flows—of information, peo-
ple, and money—and greater participation in these flows create an environment full of potential op-portunity. However, in the short term, these flows also increase our awareness of both an increasing pace of change and the disparity in outcomes in ad-vance of our ability to understand and make sense of them. The natural human reaction is to feel more uncertain, fearful, and anxious. On the one hand, as more data is opened up and reported on, we have greater visibility into how our institutions are func-tioning. On the other, it becomes more apparent to the public that our institutions are adapting too slowly to the changing environment and the chang-ing needs of individuals and society. The reported broad decline in trust in our institutions—according to Gallup, only 32 percent of Americans report hav-ing confidence in key US institutions, continuing a downward trend that began in 2004,3 while Edel-man’s trust barometer finds that only 41 percent of Americans trust government to keep pace with change4—reflects that anxiety.
In this year’s Shift Index, we see continued evidence of increasing flows. The Flow Index looks at the flow of knowledge, capital, and talent—as well as amplifi-ers of these component flows—enabled by advances in the digital infrastructure and a general trend to-ward public policy liberalization. Flow metrics tend to lag the foundational advances because flows re-flect the process of understanding and developing new practices consistent with foundational changes.
• The Interfirm Knowledge Flows indicate em-ployee participation in knowledge flows is start-ing to increase significantly, as more workers participate, and participate more frequently, in various forms of knowledge flows between com-panies. The technology, professional services, consumer products, and telecommunications industries lead the way with increased partici-pation in knowledge flows (see the appendix for further explanation of these and other Shift Index metrics). As we’ll discuss, we expect an absolute increase in the Flow Index, though the impact and implications of the increase depend on the type and diversity of the flows.
• Wireless activity is increasing as SMS has dipped as a result of alternative ways to connect; Internet activity continues to grow exponen-tially. Time spent on social media on personal computers is down to 14 percent from a high of 17 percent in 2011, but time spent on social media across all platforms continues to grow. Globally, social network users grew 9 percent in 2015, accounting for over 65 percent of all Internet users.5
• Migration to creative cities continues, widening the gap between population growth in the cities at the top of the creative list and those at the bot-tom. In 2015, the rate of population growth in
The paradox of flows: Can hope flow from fear?
5

the most creative cities was 34 percent higher than in the least creative cities, up from a gap of 24 percent in 2012. Growth in the least creative cities has declined with the population of those cities only slightly higher (less than 1 percent) than it was in 1990.
• Travel volume has climbed 70 percent in 25 years of increasing digital communication, and has increased by 8.5 percent in the past five years alone.
• Movement of capital is increasing again (for flows in and out of the United States).
• Worker passion, which serves to amplify flows, remains low; at 13 percent of American work-ers, it is statistically unchanged from two years ago. Just over half of workers have at least one attribute of passion.
Flows are increasing; now, how can we make that productive? If the goal of expanding flows within our society and economy is to accelerate learning rather than to simply expand data flows, we might create a more useful framework for optimizing both flows and friction. What kinds of flows are gen-erative, meaning that they promulgate even more productive flows over time? What kind of friction gives us opportunity for reflection and productive debate so that we can learn faster and come up with even more creative ideas and approaches over time?
First, we should consider the roles of both flows that happen in the physical world—of people, resources, or ideas—and flows that happen in the virtual world of the Internet: data, information, and ideas. One important finding of the Shift Index over the past decade has been that the Internet (and increases in virtual flows) is not replacing the need for physical flows via face-to-face interaction. Instead, virtual flows tend to reinforce and amplify face-to-face interactions.
One place we see this is in the Interfirm Knowledge Flows metric, in which online forums and social media have become more popular at work but so have face-to-face lunch meetings and conferences. This can also be seen in the continued growth in travel volume, which has climbed steadily, including 8.5 percent in the past five years, despite the parallel
development of increasingly rich and accessible means for virtual communication and collaboration. While not a comprehensive indicator of the total volume of face-to-face interactions, it is interesting that the trade show and conference planning indus-try has reported 2.7 percent annual growth over the past five years.6
Face-to-face interactions have the potential to accelerate learning by bringing individuals into contact with people and ideas they might not oth-erwise encounter or in an experience or context that isn’t easily replicated virtually. Although mul-tidisciplinary gatherings such as SxSW, TED, and the Aspen Ideas Festival occupy familiar conven-tion-center settings, they expand the scope beyond simple marketing or networking. These multi-disciplinary events bring attendees into contact with more diverse flows, from adjacent and even seemingly unrelated domains. Attendees have the opportunity to share ideas and make more diverse connections that can yield insights and potential collaborators. Attendance at SxSW has increased 53 percent over the past five years (to 37,660), and mega-events such as the International Consumer Electronics Show draw up to 150,000 attendees from across a spectrum of industries and disci-plines. Virtual flows, such as online forums, social media platforms, and messaging apps, can help make these large events more productive, allowing
One place we see this is in the Interfirm Knowl-edge Flows metric, in which online forums and social media have become more popu-lar at work but so have face-to-face lunch meet-ings and conferences.
2016 Shift Index
6

exhibitors and attendees to connect and engage with each other before, during, and after the events and continue to participate in more diverse flows that re-inforce and amplify the face-to-face learning. On the other end of the spectrum, numerous smaller-scale, in-person convenings—from Meetups for women coding enthusiasts to kids’ health hackathons to summits that mobilize makers or digital storytellers for the greater public interest7—are made possible by social media and other technologies that make it easier to organize, publicize, and mobilize.
There is a quality to flows individually and in aggre-gate. The value of flows in the Big Shift is dependent upon both having access to diverse types of flows and having diverse participants or sources of in-formation within those flows. Lack of diversity can reinforce mistaken beliefs and make it much more difficult to adapt to changing circumstances. Thus, companies can increase exposure to flows by par-ticipating in industry consortiums. However, if all of the consortium members are large companies in the same industry, the learning to come from that flow may be limited, both by lack of diversity and unwill-ingness to share learning and create new knowledge with competitors. Similarly, at the individual level, social media can have a “filter bubble” effect of al-lowing people to self-select into echo chambers that tend to reinforce existing beliefs rather than broaden exposure to new ideas and insights.8 For individuals, this heightens our sense of fear and threat and limits our exposure to diverse, productive flows.
Companies and individuals alike can fall prey to comparing their own experiences and performance against a self-selected group of peers that can ob-scure a widening gap between their approach, performance, and expectations relative to others not in their defined group. The old problem of “not knowing what it is you don’t know” has not gone
away in the age of increasing flows enabled by the Internet. It may in fact be greater now than ever, as a result of the accelerating pace of change and the sheer volume of data and information available.
The migration to creative cities metric highlights the importance of face-to-face interactions and the role of diversity in productive, generative flows. While growth among the cities ranked as least creative has declined, the most creative cities have grown, on average, 35 percent relative to 1990 populations. This despite the fact that, with the help of digital technology infrastructures and new employment models, individuals can theoretically access work opportunities from anywhere with a good broadband connection, and, in most parts of the United States, individuals all have access to the same brand-name goods and entertainment. Many of the “creative” cities suffer from higher costs of living but also have more vibrant and resilient economies. Physi-cal surroundings and face-to-face interactions still matter, fostering new connections and insights and exposing us to a wider variety of serendipitous flows and opportunities that we would never experience if not for proximity. More and more people appear to intuitively understand that they will learn faster and improve their performance more rapidly if they are physically present in a densely populated cre-ative city. They are willing to experience significant personal disruption as they move from a familiar location to a new city and to accept a higher cost of living in return for the perceived benefits that can help them cope with mounting performance pressure. The unfortunate byproduct of increased migration to cities is to drain economic potential and vibrancy from the areas that are seeing a signifi-cant outflow, leaving them isolated from generative flows in such a way as to further widen the gap.
The paradox of flows: Can hope flow from fear?
7

To move past fear to opportunity
THE challenge is to move beyond fear and focus on the chance to use the flows of information, people, capital, and resources to create more
opportunity for everyone. What are some of the op-portunities that come from increasing participation in global flows?
For institutions, flows can be harnessed to anticipate and capture more opportunities in a rap-idly changing business environment, to build deeper trust-based relationships with customers, and to create ecosystems that provide much greater lever-age and flexibility in more effectively responding to the changing environment. It is especially important that institutions take a broader view of the many flows in which they might participate. Consider the way fitness trackers such as FitBit are evolving their products to gain an increasingly intimate view of the customer’s daily life through data flows. When Nike decided to create an accelerator for companies to de-sign products around its Fuel technology rather than further develop the tracker itself, it found its way into another useful flow: the ideas and talent that can be harnessed to drive innovation in wearables technology and wellness applications. This is part of the reasoning that drives so many large corpora-tions to open “innovation centers” in places such as the Bay Area. While they often cannot point to spe-cific products or partnerships, these centers serve to keep their parent companies at least somewhat connected to flows of ideas and talent beyond their four walls. The ongoing and perplexing problem for institutions, of course, is whether participation in flows can be effectively translated into learning and performance improvement for the organization.
Brand-based companies can participate in flows to better understand their customers and to adjust and evolve their brand based on an ongoing dialogue. This isn’t entirely new. Back in 1993, when a Charles
Barkley ad series9 ignited a controversial exchange about role models, Nike elected not to pull the ads and, as a result, was able to learn more about cus-tomers’ values by participating in the dialogue the ad series sparked. Red Bull is another company that has chosen to play almost exclusively in the flows by creating events and media centered around the activities and personalities about which its custom-ers care. FirstBuild offers another example of how companies can think about participating in flows as a means of creating new opportunities: In this case, GE Appliance created a microfactory and community for crowdsourcing innovations in small appliances; the initiative allowed GE Appliance to participate in numerous flows that a large corpora-tion would not typically be part of, including maker, inventor, and crowdfunding communities.
For individuals, the digital infrastructure now offers tools to scale impact as an individual or to mobilize a group. As we’ve written about previously,10 it is eas-ier than ever for individual entrepreneurs to learn skills, develop, and market a product and reach
The ongoing and per-plexing problem for institutions is whether participation in flows can be effectively translated into learning and per-formance improvement for the organization.
2016 Shift Index
8

millions of potential customers. Friedman calls this the increasing “power of one.” Just look at Joseph Garrett, the 23-year-old Brit whose onscreen Mine-craft alter ego Stampy Cat has gained a following of more than 7 million YouTube subscribers.11 Or take the example of Michelle Phan, who began posting makeup how-to videos in 2007 and now has a life-style network, a beauty subscription service, and her own brand with a major cosmetics manufactur-er.12 In a rapidly growing number of cases such as these, social media platforms enable a certain type of flow between producer and consumer that few larger companies have effectively leveraged but are
powering young entrepreneurs who use them more instinctively. Individuals can also leverage flows to learn, find collaborators, and fine-tune their ideas.
It’s worth stating that mind-sets will likely have to shift before we can effectively get through this tran-sitory period of anxiety and insecurity to embrace the possibilities of a world connected in the Big Shift. And as some of these forms of flow mature, we can learn to use them more effectively and consciously. In emotional terms, we have to move from fear of change and growing inequality to hope that more diverse flows can lead to greater prosperity for all.
The paradox of flows: Can hope flow from fear?
9

Conclusion
WE believe this is a transitory phenom-enon—the double-edged sword of flow and the anxiety of broad and accelerating
change. The natural human reaction to the greater visibility and awareness that comes from digitiza-tion and widespread connectivity, on a global scale and in real time, is fear. And there are real risks of what that fear could produce if it continues to grow over time. But over the longer term, these increas-ing flows present significant opportunities to mobi-lize people to use these technologies to change their institutions and embrace hope. The good news is that, properly harnessed, these flows enable small moves, smartly made, to set big things in motion. A challenge for all of us is to make these small moves quickly so we can provide more tangible evidence of the positive impact that can spark hope and diminish fear.
At the Center for the Edge, we will continue to mea-sure how these trends impact the future—and how individuals and institutions can best stage their bets and make low-cost, but transformational, moves. Our next journey will tackle a bigger question: In the context of the Big Shift, what would an institu-tion redefined from the bottom up, with the goal of scalable learning, look like? Our future institutions may look very different from today’s, with faster learning and a renewed focus on our customers and ecosystems, all interacting to seize the opportunities that the Big Shift is creating.
2016 Shift Index
10

Appendix2016 Shift Index metrics
THE Shift Index consists of three sub-indices that measure the rate of change in today’s business environment: the Foundation index,
the Flow index, and the Impact index. We are cur-rently in the first wave of the Big Shift (measured by the Foundation index) and are still learning to em-brace the second wave (captured in the Flow index).
Foundation index The Foundation Index measures changes that are fundamental to the business landscape, includ-ing advances in technology performance, rates of infrastructure penetration, and trends toward liber-alization in public policies.
The cost/performance of the core digital technology building blocks has been improving exponentially for decades and at a faster rate than that of previous technologies. As a result, increasingly powerful and affordable mobile devices, combined with robust connectivity, enable individuals and institutions to more easily connect and communicate. At the same time, these core digital components combine in innovative ways to create new tools, including pow-erful cloud capabilities, that enable new business models and ways of working. Public policies that re-duce barriers to the movement of people, resources, and capital tend to reinforce the changes catalyzed by the digital infrastructure.
The metrics in the Foundation Index provide lead-ing indicators for potential change in other areas.
Deloitte University Press | dupress.deloitte.com
38 41 46 50 54 59 6474
8392 100
110121
132143
153168
190208
226242
253269
0
50
100
150
200
250
300
1993
1994
1995
1996
1997
1998
1999
2000
2001
2002
2003
2004
2005
2006
2007
2008
2009
2010
2011
2012
2013
2014
2015
Inde
x va
lue
Source: Deloitte analysis.
The Foundation Index continues to trend upward with no signs of slowing
Figure 1. The Foundation Index
The paradox of flows: Can hope flow from fear?
11

Technology performance
COMPUTERS
Deloitte University Press | dupress.deloitte.com
$0.10
$1
$10
$100
$1,000
1993
1994
1995
1996
1997
1998
1999
2000
2001
2002
2003
2004
2005
2006
2007
2008
2009
2010
2011
2012
2013
2014
2015
USD
per
1M
tra
nsis
tors
Source: Leading technology research vendor.
The cost of computing power has decreased significantly, from $222 per 1 million transistors in 1992 to $0.03 per 1 million transistors in 2015. This ongoing trend enables the increasing affordability of
the computational power at the core of the digital infrastructure.
Figure 2. Computing cost performance
$222.20
$0.06
$0.03
2016 Shift Index
12
DIGITAL STORAGE
BANDWIDTH
Deloitte University Press | dupress.deloitte.com
$0.10
$1
$10
$100
$1,00019
92
1994
1995
1996
1997
1998
1999
2000
2001
2002
2003
2004
2005
2006
2007
2008
2009
2010
2011
2012
2013
2014
2015
USD
per
gig
abyt
e (G
B)
Source: Leading technology research vendor.
1993
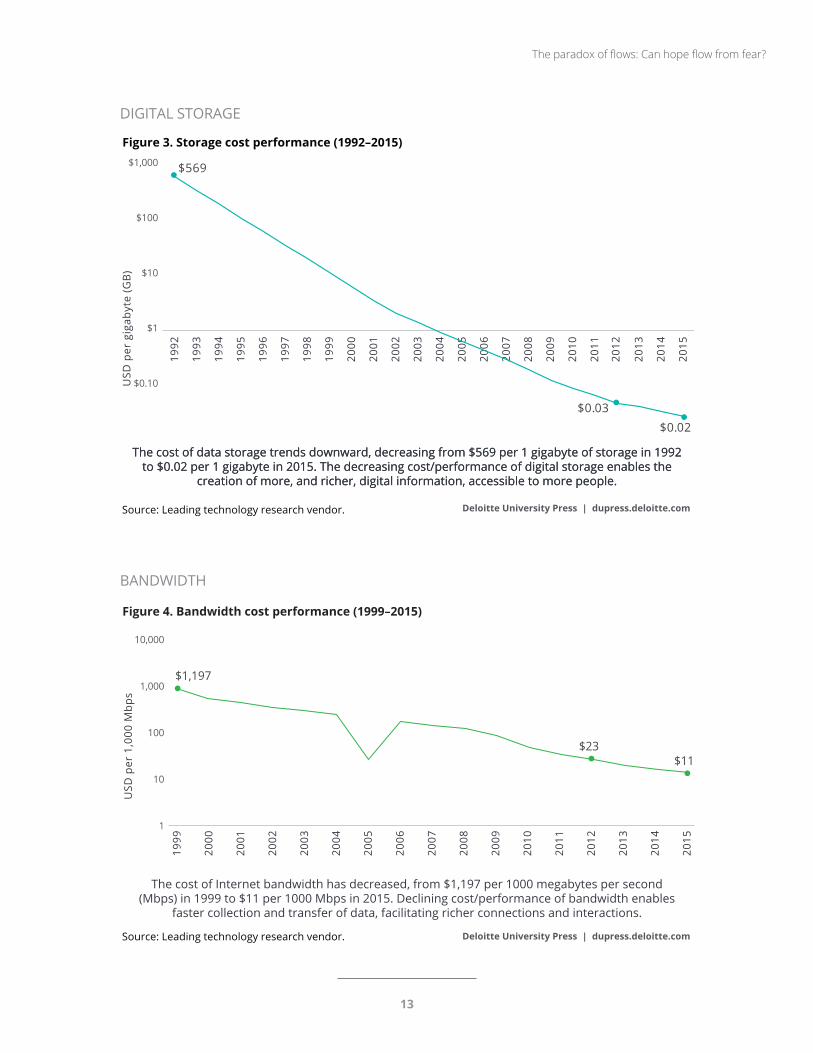
Figure 3. Storage cost performance (1992–2015)
$569
$0.02$0.03
The cost of data storage trends downward, decreasing from $569 per 1 gigabyte of storage in 1992 to $0.02 per 1 gigabyte in 2015. The decreasing cost/performance of digital storage enables the
creation of more, and richer, digital information, accessible to more people.
The cost of data storage trends downward, decreasing from $569 per 1 gigabyte of storage in 1992 to $0.02 per 1 gigabyte in 2015. The decreasing cost/performance of digital storage enables the
creation of more, and richer, digital information, accessible to more people.
Deloitte University Press | dupress.deloitte.com
1
100
1,000
10,000
1999
2000
2001
2002
2003
2004
2005
2006
2007
2008
2009
2010
2011
2012
2013
2014
2015
Source: Leading technology research vendor.
The cost of Internet bandwidth has decreased, from $1,197 per 1000 megabytes per second (Mbps) in 1999 to $11 per 1000 Mbps in 2015. Declining cost/performance of bandwidth enables
faster collection and transfer of data, facilitating richer connections and interactions.
USD
per
1,0
00 M
bps
10
Figure 4. Bandwidth cost performance (1999–2015)
$11$23
$1,197
The paradox of flows: Can hope flow from fear?
13
Infrastructure penetration
INTERNET USERS
Deloitte University Press | dupress.deloitte.com
0
10
20
30
1992
1994
1995
1996
1997
1998
1999
2000
2001
2002
2003
2004
2005
2006
2007
2008
2009
2010
2011
2012
2013
2014
2015
Perc
ent
of U
S po
pula
tion
acc
essi
ng t
he In
tern
et
Sources: comScore; Deloitte analysis.
1993
1990
1991
40
50
60
70
80
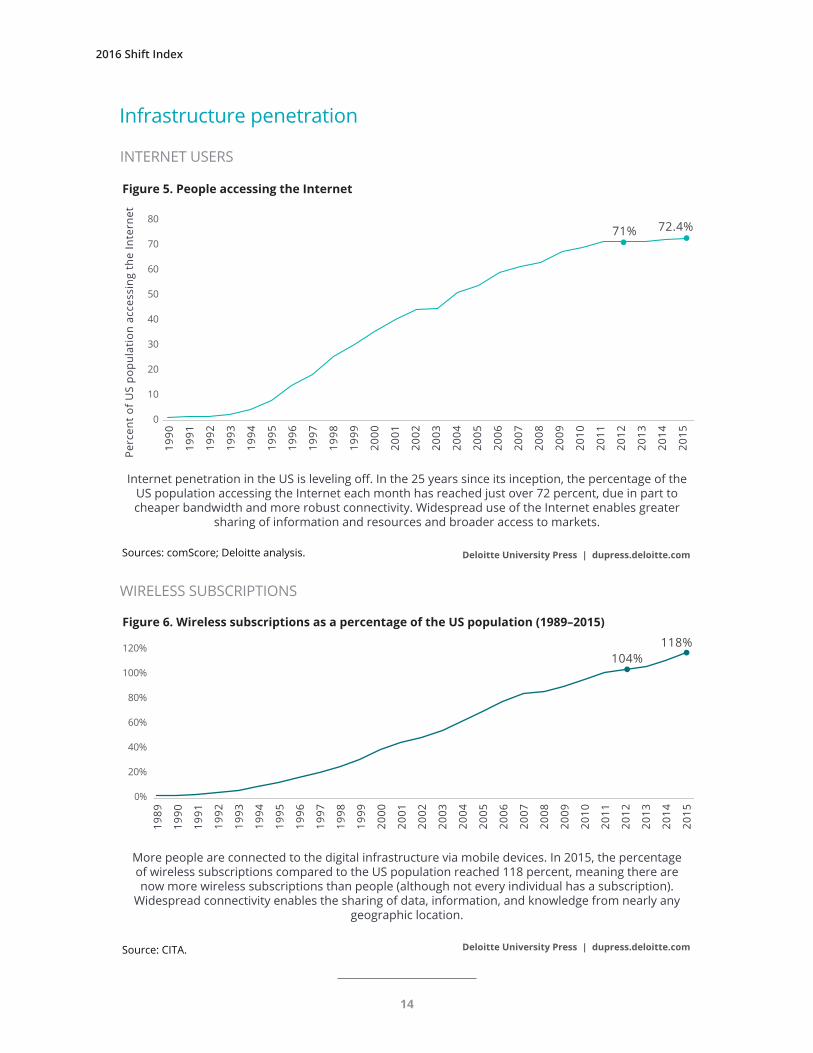
Internet penetration in the US is leveling off. In the 25 years since its inception, the percentage of the US population accessing the Internet each month has reached just over 72 percent, due in part to cheaper bandwidth and more robust connectivity. Widespread use of the Internet enables greater
sharing of information and resources and broader access to markets.
Figure 5. People accessing the Internet
72.4%71%
WIRELESS SUBSCRIPTIONS
Deloitte University Press | dupress.deloitte.com
0%
20%
40%
60%
1992
1994
1995
1996
1997
1998
1999
2000
2001
2002
2003
2004
2005
2006
2007
2008
2009
2010
2011
2012
2013
2014
2015
Source: CITA.
1993
1990
1991
80%
100%
120%
1989
More people are connected to the digital infrastructure via mobile devices. In 2015, the percentage of wireless subscriptions compared to the US population reached 118 percent, meaning there are now more wireless subscriptions than people (although not every individual has a subscription).
Widespread connectivity enables the sharing of data, information, and knowledge from nearly any geographic location.
Figure 6. Wireless subscriptions as a percentage of the US population (1989–2015)118%
104%
2016 Shift Index
14

Public policy
ECONOMIC FREEDOM
Deloitte University Press | dupress.deloitte.com
72
74
76
78
1995 1997 1999 2001 2003 2005 2007 2009 2011 2013 2015
Source: Heritage Foundation’s 2016 Index of Economic Freedom.
80
82
Inde
x (0
–100
)
Index of Economic Freedom is moving upward after four years of decline
Figure 7. Index of Economic Freedom (US) (1995–2015)
76.2%78%
Linear (Index of Economic Freedom (Overall score))
Index of Economic Freedom (Overall score)
The Index of Economic Freedom, a compilation of 10 indicators measured by the Heritage Foundation, is a proxy for public policies that promote open markets and the movement of capital, labor, prod-uct, and resources. Since 1995, the upward trend for the United States has been driven primarily by gains in investment freedom, financial freedom, trade
freedom, and business freedom (4 of the Index’s 10 components). Greater economic freedom increases competition and collaboration. After dropping in recent years, economic freedom is increasing again, led by changes in government size, monetary free-dom, and labor freedom.
Deloitte University Press | dupress.deloitte.comSource: Deloitte analysis.
Index of Economic Freedom is made up of 10 components.
Figure 7a. Components of economic freedom (1995–2015)
40
50
60
70
80
90
100
2006 2008 2010 2012 2014
Business Trade Fiscal Government size Monetary
Investment
Financial Property rights Freedom from corruption
Labor
The paradox of flows: Can hope flow from fear?
15

Flow indexThe Flow index measures key performance drivers— flows of knowledge, capital, and talent—unleashed by the forces measured in the Foundation Index. These flows are enabled by the rapidly advancing digital infrastructure and the general trend toward
policy liberalization. Worker passion and social me-dia activities amplify the flows.
In the Big Shift, stocks of knowledge are less valu-able, and participating in and harnessing knowl-edge flows become more important.
Deloitte University Press | dupress.deloitte.com
47 49 51 57 60 65 7277 83 89
104116
128139
145139
145155 158
152165 166
176
0
40
80
120
160
20
60
100
140
180
200
1993
1994
1995
1996
1997
1998
1999
2000
2001
2002
2003
2004
2005
2006
2007
2008
2009
2010
2011
2012
2013
2014
2015
Inde
x va
lue
Source: Deloitte analysis.
Figure 8. Flow index
2016 Shift Index
16

Deloitte University Press | dupress.deloitte.comSource: IPSOS; Deloitte analysis.
Interfirm knowledge flows have begun to increase as a result of more workers participating and participating more frequently. The technology, professional
services, consumer products, and telecommunications industries lead the way.
Figure 9. Interfirm Knowledge Flows by industry (2009–2015)
14.15%
0
10
20
30
40
2009 2011 2013 2015
Economy Aerospace and defense Automotive Aviation and transport services
Banking and financial institutions Consumer products Energy Health care services
Insurance Life sciences Media and entertainment Professional services firms
Retail Technology Telecommunications Process and industrial products
14.15% 15.56%
21.81%
Virtual flows
INTERFIRM KNOWLEDGE FLOWS
The paradox of flows: Can hope flow from fear?
17

Deloitte University Press | dupress.deloitte.comSource: IPSOS; Deloitte analysis.
Figure 9a. Percentage participation in Interfirm Knowledge Flows (2009–2015)
Conferences
Professional organizations
Telephone
Webcast/virtual hangout
Social media
Lunch meetings
Email alerts
Community organizations
Online groups/forums
47%48%
46%41%
43%47%
37%37%
39%33%
35%41%
37%38%
37%32%
33%37%
34%35%
33%34%
35%34%
32%38%
36%25%
30%39%
32%33%33%
26%31%
40%10%10%
31%45%
42%45%
25%26%
19%17%
20%24%
22%19%
16%18%
28%
Participation has increased across different types of flows.
2016 Shift Index
18
Overall participation in knowledge-sharing activi-ties that extend beyond organizational boundaries have increased for most activities since 2012, and workers are changing the types of activities in which they participate. While conferences are still most common, the percentage of survey respondents who participate in online groups and forums saw a significant increase, as did those who participated
in lunch meetings and in professional organiza-tions. The use of social media rebounded from its 2012 low. These results indicate that individuals may be becoming more proficient with their use of flows and more able to choose the right format for the purpose, and that companies may be becoming more comfortable with employees’ use of a variety of tools to participate in flows.
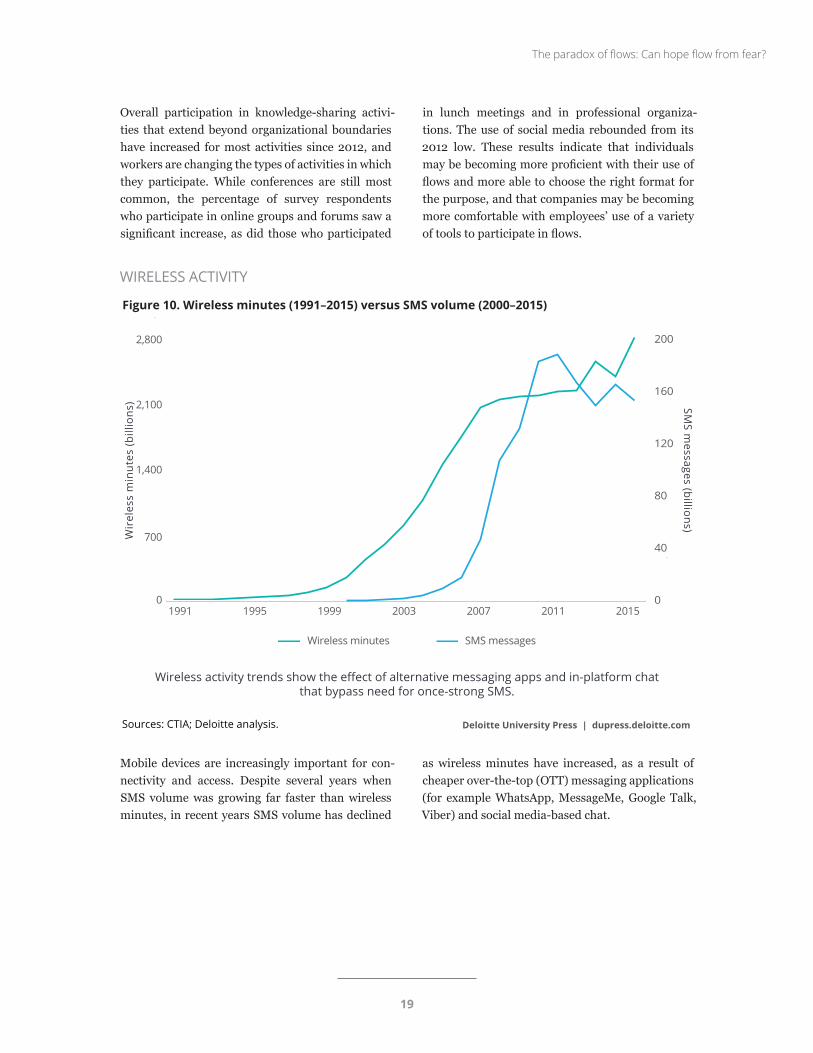
Mobile devices are increasingly important for con-nectivity and access. Despite several years when SMS volume was growing far faster than wireless minutes, in recent years SMS volume has declined
as wireless minutes have increased, as a result of cheaper over-the-top (OTT) messaging applications (for example WhatsApp, MessageMe, Google Talk, Viber) and social media-based chat.
WIRELESS ACTIVITY
Deloitte University Press | dupress.deloitte.com
Wir
eles
s m
inut
es (b
illio
ns)
Sources: CTIA; Deloitte analysis.
Wireless activity trends show the effect of alternative messaging apps and in-platform chat that bypass need for once-strong SMS.
SMS m
essages (billions)
Figure 10. Wireless minutes (1991–2015) versus SMS volume (2000–2015)
1991 1995 1999 2003 2007 2011 20150
700
2,100
1,400
2,800
0
40
80
120
200
160
Wireless minutes SMS messages
The paradox of flows: Can hope flow from fear?
19

INTERNET ACTIVITY
Deloitte University Press | dupress.deloitte.com
0
2,000
4,000
6,000
Source: Telegeography.
14,000
12,000
10,000
8,000
16,000
Ave
rage
tra
ffic
in g
igab
ytes
/sec
ond
Internet activity shows no signs of slowing. Traffic for the top 20 highest-capacity US routes has grown exponentially since 1993. In 2015, the average traffic rose to
14,097 gigabytes/second, up from 6,237 gigabytes/second in 2012.
Figure 11. Internet activity for the 20 highest-capacity routes
14,09719
93
1994
1995
1996
1997
1998
1999
2000
2001
2002
2003
2004
2005
2006
2007
2008
2009
2010
2011
2012
2013
2014
2015
Physical flows
MIGRATION OF PEOPLE TO CREATIVE CITIES
Deloitte University Press | dupress.deloitte.com
Gro
wth
from
199
0 (%
)
Sources: US Census Bureau; Richard Florida's The Rise of the Creative Class—Revisited; Deloitte analysis.
Migration to creative cities continues, increasing the growth rate gaps between the most creative and the least and concentrating certain types of talent and resources. The gap between migration rates for
these cities is increasing as people seek productive and enriching interactions in the physical world.
Figure 12. Migration to creative cities
0%
10%
20%
30%
40%
50%
2000
2001
2002
2003
2004
2005
2006
2007
2008
2009
2010
2011
2012
2013
2014
2015
1990
Top 10 creative cities’ growth from 1990 Bottom 10 creative cities’ growth from 1990
The shift in the trend lines is due to the redefinition of creative cities by Richard Florida in the latest edition of his book
2016 Shift Index
20

TRAVEL VOLUME
MOVEMENT OF CAPITAL
Deloitte University Press | dupress.deloitte.comSource: Bureau of Transportation Statistics; Deloitte analysis.
60
70
80
90
120
110
100
130
Gro
wth
from
199
0 (%
)
Travel volume, as measured by growth in the Transportation services index for passengers, has climbed 70 percent in the past 25 years despite
an increase in other options for communication and collaboration.
Figure 13. Travel volume
1993
1992
1991
1990
1994
1995
1996
1997
1998
1999
2000
2001
2002
2003
2004
2005
2006
2007
2008
2009
2010
2011
2012
2013
2014
2015
Despite better tools to connect digitally, people con-tinue to seek face-to-face interactions. Physical in-
teractions facilitate the transfer of tacit knowledge more readily than other means.
Deloitte University Press | dupress.deloitte.comSource: UNCTAD; Deloitte analysis.
0
100
200
300
500
400
600
The absolute amount of capital moving between countries has trended upward for the past 30 years. However, foreign direct investment is impacted by many factors, including relative tax rates, interest
rates, inflation, and protectionist policies—all of which can be quite volatile year-to-year.
Figure 14. Movement of capital
1970
1972
1974
1976
1978
1980
1982
1984
1986
1988
1990
1992
1994
1996
1998
2000
2002
2004
2006
2008
2010
2012
2014
421
The paradox of flows: Can hope flow from fear?
21

In a 2016 survey of 3,159 full-time American work-ers, only 13 percent of respondents exhibited all three attributes of worker passion: commitment to domain, questing, and connecting dispositions. The results are unsurprising—many institutions
were designed for predictability, with inflexible, tightly integrated processes to minimize variances to plan.13 However, the attributes of passion are im-portant to help companies and individuals navigate the challenges of a changing business environment.
Deloitte University Press | dupress.deloitte.comSource: IPSOS; Deloitte analysis.
Figure 15. Worker passion
39%
13%
48%
One or two attributes
No attributes of passion
All three attributes
Worker passion remains low in the population.
Flow amplifiers
WORKER PASSION
SOCIAL MEDIA ACTIVITY
Deloitte University Press | dupress.deloitte.com
0%
4%
8%
12%
Source: comScore.
16%
20%
1994
1995
1996
1997
1998
1999
2000
2001
2002
2003
2004
2005
2006
2007
2008
2009
2010
2011
2012
2013
2014
2015
1993
Figure 16. Percentage of Internet time spent on social media (1993–2015)
Social media remains important. The 2015 numbers were nearly identical to 2012, with the amount of time users spend on social media relative to the to-tal amount of time on the Internet on PCs at 13.9 percent. This decrease might reflect use of mobile
devices, rather than PCs, for social media; this met-ric doesn’t capture non-PC use. This type of multi-way communication opens up opportunities to share knowledge and collaborate.
2016 Shift Index
22

Impact indexThe Impact index demonstrates the consequenc-es of the Big Shift; thus, it is a lagging indicator. Individuals and companies are adopting new tech-
nologies and knowledge flows at different rates. In general, companies are still trying to evolve their efficiency-based legacy processes and practices to more fully benefit from the forces of the Big Shift.
IMPACT INDEX
Deloitte University Press | dupress.deloitte.com
107.24106.76
77.79
0
20
40
60
80
100
120
1993
1994
1995
1996
1997
1998
1999
2000
2001
2002
2003
2004
2005
2006
2007
2008
2009
2010
2011
2012
2013
2014
2015
Source: Deloitte analysis.
The Impact index reflects the consequences of the Big Shift. In recent years, the impact has been greater on people than on markets or firms.
Figure 17. Impact index
The paradox of flows: Can hope flow from fear?
23

Markets
COMPETITIVE INTENSITY
Deloitte University Press | dupress.deloitte.comSource: Compustat; Deloitte analysis.
0
0.2
0.4
0.10
0.08
0.06
0.14
0.12
0.16
Competitive intensity remained relatively constant since 2010.
Figure 18. HHI 1965–2015
1971
1973
1967
1965
1969
1975
1977
1979
1981
1983
1985
1987
1989
1991
1993
1995
1997
1999
2001
2003
2005
2007
2009
2011
2013
2015
Competitive intensity is inversely related to indus-try concentration (as measured by the Herfindahl-Hirschman Index). Before 1995, industry concentra-tion had trended downward for 30 years, indicating
a steady increase in competitive intensity. Despite ticking upward in recent years, industry concentra-tion is still less than half of what it was in 1965.
As a whole, productivity in the US economy has steadily improved for nearly five decades, from 45.3 in 1965 to 106 in 2015 (as measured by the Torn-
qvist aggregation, which shows how effectively eco-nomic inputs are converted into output).
Deloitte University Press | dupress.deloitte.comSource: BLS; Deloitte analysis.
0
60
40
20
100
80
120
Although labor productivity continues to improve, these gains are largely competed away.
Figure 19. Labor productivity
1971
1973
1967
1965
1969
1975
1977
1979
1981
1983
1985
1987
1989
1991
1993
1995
1997
1999
2001
2003
2005
2007
2009
2011
2013
2015
106
LABOR PRODUCTIVITY
2016 Shift Index
24
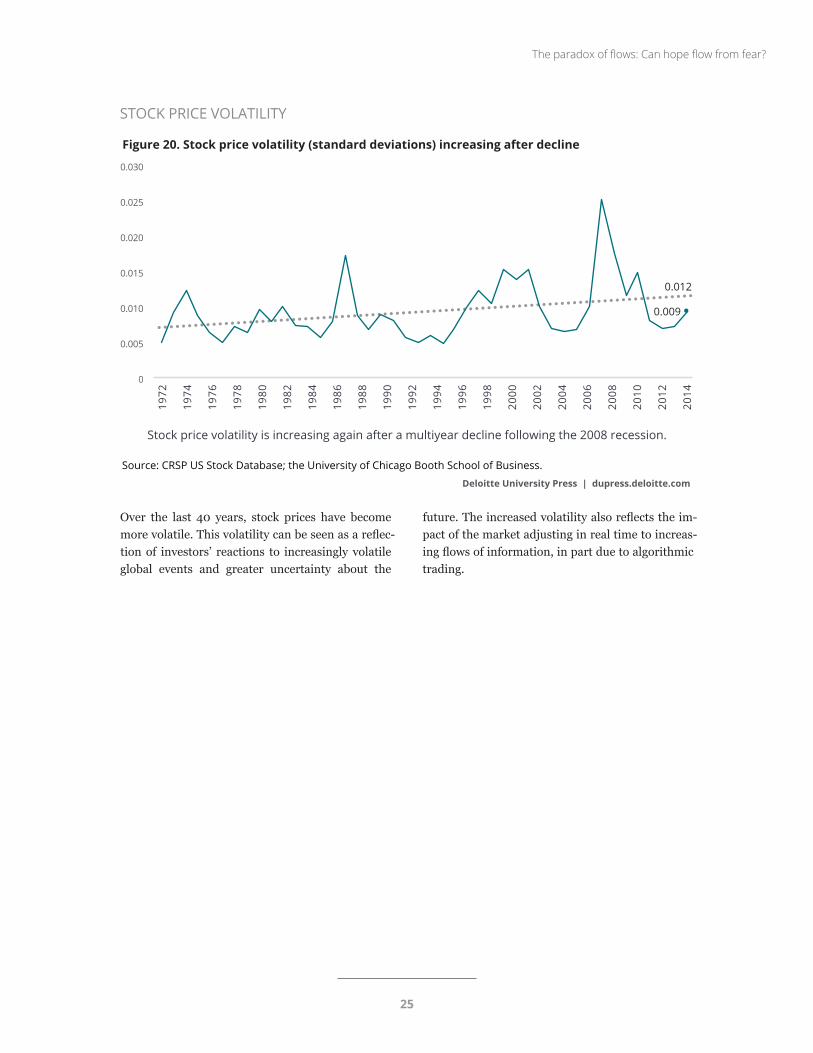
Over the last 40 years, stock prices have become more volatile. This volatility can be seen as a reflec-tion of investors’ reactions to increasingly volatile global events and greater uncertainty about the
future. The increased volatility also reflects the im-pact of the market adjusting in real time to increas-ing flows of information, in part due to algorithmic trading.
STOCK PRICE VOLATILITY
Deloitte University Press | dupress.deloitte.com
Source: CRSP US Stock Database; the University of Chicago Booth School of Business.
0
0.015
0.010
0.005
0.025
0.020
0.030
Stock price volatility is increasing again after a multiyear decline following the 2008 recession.
Figure 20. Stock price volatility (standard deviations) increasing after decline
1978
1980
1974
1972
1976
1982
1984
1986
1988
1990
1992
1994
1996
1998
2000
2002
2004
2006
2008
2010
2012
2014
0.009
0.012
The paradox of flows: Can hope flow from fear?
25

Firms
ASSET PROFITABILITY
Deloitte University Press | dupress.deloitte.comSource: Compustat; Deloitte analysis.
0.0%
3.5%
3.0%
2.0%
2.5%
1.5%
1.0%
0.5%
4.5%
4.0%
5.0%
Firm performance, as measured by ROA, continues to decline.
Figure 21. Economy-wide ROA
1979
1981
1975
1973
1977
1969
1967
1965
1971
1983
1985
1987
1989
1991
1993
1995
1997
1999
2001
2003
2005
2007
2009
2011
2013
2015
4.7%
1.3%
The aggregate ROA of US firms fell to less than a quarter of its 1965 levels in 2015. To increase—or even maintain—asset profitability, firms should find new ways to generate value from their assets. The decreasing performance of US firms suggests
that firms are not yet developing the new practices needed to benefit from the Big Shift. (For more dis-cussion of ROA and the rationale behind this mea-sure of firm performance, see our paper Success or struggle.)14
2016 Shift Index
26
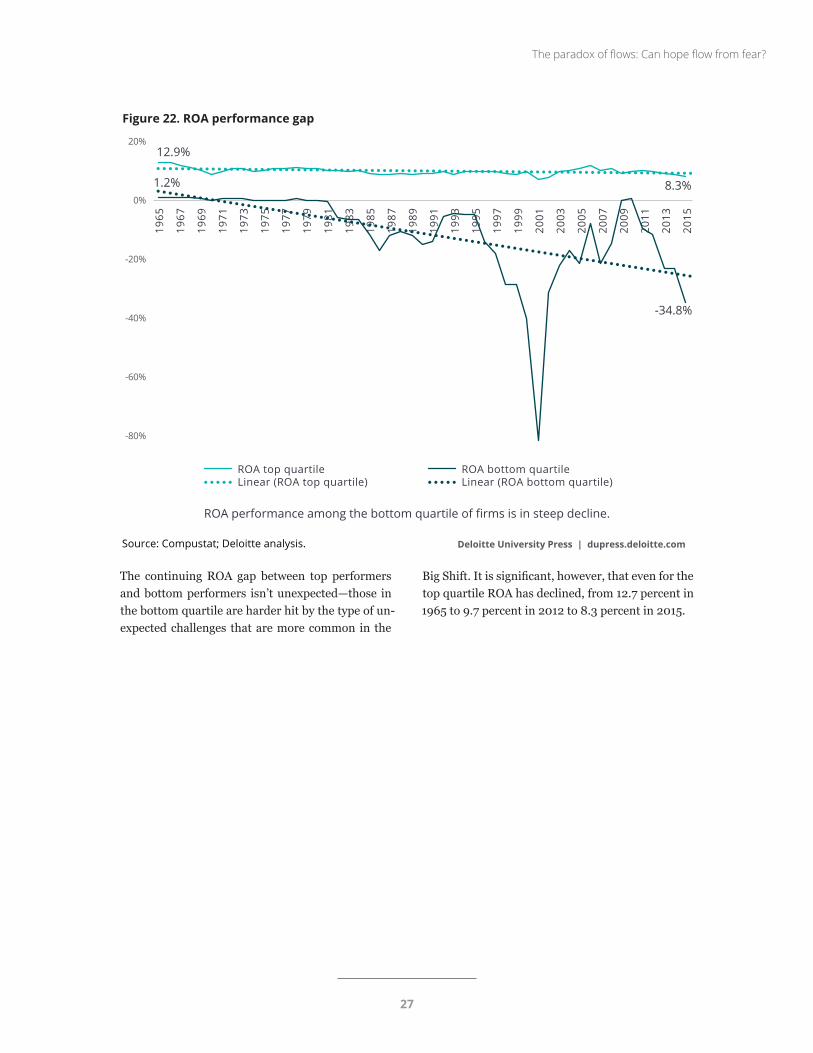
The continuing ROA gap between top performers and bottom performers isn’t unexpected—those in the bottom quartile are harder hit by the type of un-expected challenges that are more common in the
Big Shift. It is significant, however, that even for the top quartile ROA has declined, from 12.7 percent in 1965 to 9.7 percent in 2012 to 8.3 percent in 2015.
Deloitte University Press | dupress.deloitte.comSource: Compustat; Deloitte analysis.
-40%
-60%
-80%
0%
-20%
20%
ROA performance among the bottom quartile of firms is in steep decline.
Figure 22. ROA performance gap
1979
1981
1975
1973
1977
1969
1967
1965
1971
1983
1985
1987
1989
1991
1993
1995
1997
1999
2001
2003
2005
2007
2009
2011
2013
2015
ROA top quartileLinear (ROA top quartile)
ROA bottom quartileLinear (ROA bottom quartile)
-34.8%
8.3%
12.9%
1.2%
The paradox of flows: Can hope flow from fear?
27
FIRM TOPPLE RATE
Deloitte University Press | dupress.deloitte.com
Source: Compustat; Deloitte analysis; Thomas C. Powell and Ingo Reinhardt, "Rank friction: An ordinal approach to persistent profitability," Strategic Management 31(11), November 2010, pp. 1244–55.
0.00
0.10
0.20
0.50
0.40
0.30
0.70
0.60
0.80
0.34
0.42
0.38
Figure 23. Firm topple rate
1971
1973
1967
1965
1969
1975
1977
1979
1981
1983
1985
1987
1989
1991
1993
1995
1997
1999
2001
2003
2005
2007
2009
2011
2013
2015
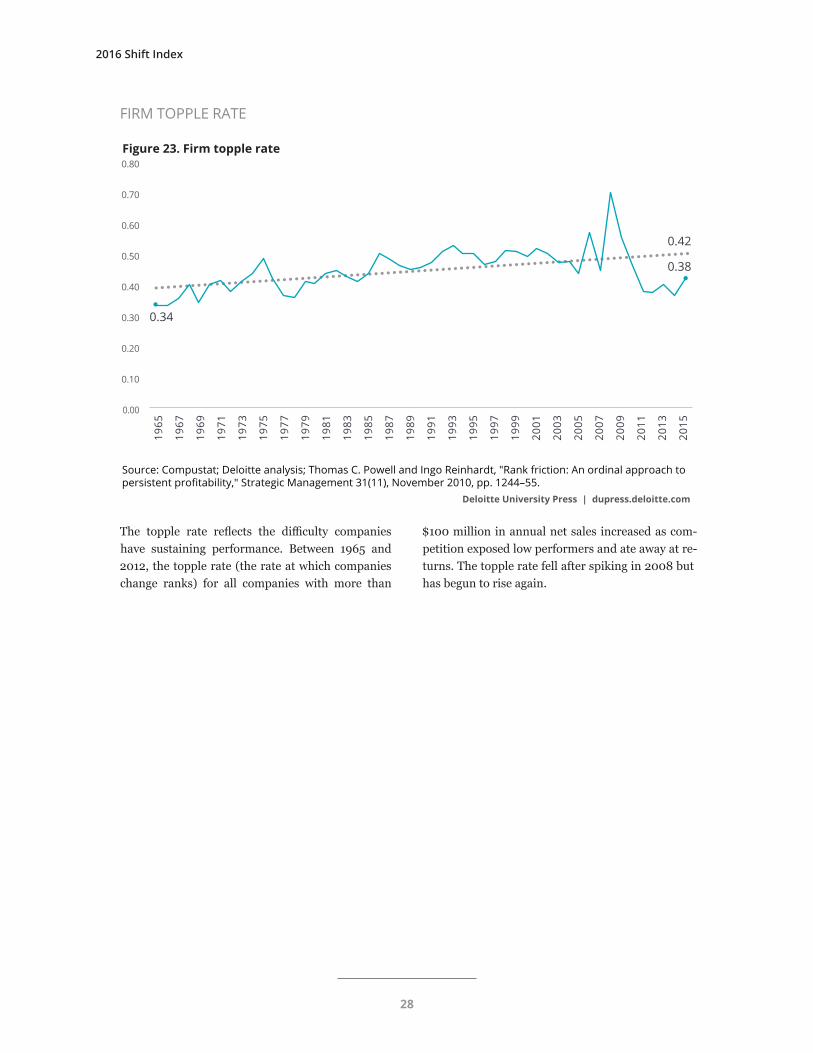
The topple rate reflects the difficulty companies have sustaining performance. Between 1965 and 2012, the topple rate (the rate at which companies change ranks) for all companies with more than
$100 million in annual net sales increased as com-petition exposed low performers and ate away at re-turns. The topple rate fell after spiking in 2008 but has begun to rise again.
2016 Shift Index
28

SHAREHOLDER VALUE GAP
Over the long term, the upper quartile of compa-nies—the “winners”—have only slightly increased the rate of return to shareholders. Meanwhile, in
the lower quartile, firms are destroying shareholder value at a faster rate.
Deloitte University Press | dupress.deloitte.comSource: Compustat; Deloitte analysis.
0.5
0.0
-0.5
1.5
1.0
20
Returns to shareholders vary widely year to year; however, the trend for bottom-quartile companies is declining.
Figure 24. Returns to shareholders by quartile
1979
1981
1975
1973
1977
1969
1967
1965
1971
1983
1985
1987
1989
1991
1993
1995
1997
1999
2001
2003
2005
2007
2009
2011
2013
2015
Return to shareholders—top quartileLinear (Return to shareholders—top quartile)
Bottom quartileLinear (bottom quartile)
-0.51
0.30
-0.38
0.43
The paradox of flows: Can hope flow from fear?
29

People
CONSUMER POWER INDEX
Deloitte University Press | dupress.deloitte.comSource: IPSOS; Deloitte analysis.
2011 2013 2015
Higher scores indicate more consumer power. Across most consumer categories, consumers’ perception of their power is high. Even at the low end, newspapers and
cable/satellite TV, the balance still favors the consumer.
Figure 25. Consumer power by category (2009–2015)
Automobilemanufacturer
686566
Athletic shoes69
6467
Soft drink68
6470
Snack chip68
6470
Householdcleaner
6662
67
Restaurant71
6668
6561
59Mass retailer
666465
Grocery store
6564
69
Departmentstore
Hotel72
6560
Gas station6161
70
Banking69
6667
Investment67
6564
Insurance(home/auto)
7067
71
Newspaper56
5268
BroadcastTV news
6966
65
Pain reliever69
6366
Cable/satelliteTV
6056
63
Search engine71
6861
7064
66Magazine
716463
Computer
6761
68
Gamingsystem
Homeentertainment
706667
Wirelesscarrier
696667
Shipping626162
Airline656466
2016 Shift Index
30

Deloitte University Press | dupress.deloitte.comSource: IPSOS; Deloitte analysis.
2011 2013 2015
Higher scores indicate higher brand disloyalty. Consumers continue to be less loyal to brands overall than a decade ago. Airlines, shipping, computers, TV, hotels, retailers, and grocery stores have all seen a decrease in brand disloyalty, potentially a sign that some
brands are learning to connect with and personalize to customers in more effective ways.
Figure 26. Brand disloyalty index
Automobilemanufacturer
6557
59
Athletic shoes61
5759
Soft drink4545
61
Snack chip56
5157
Householdcleaner
595255
Restaurant63
5474
6963
53Mass retailer
6862
51Grocery store
6864
56Department
store
Hotel72
6759
Gas station63
5966
Banking52
4763
Investment60
4863
Newspaper45
3957
BroadcastTV news
5050
60
Insurance(home/auto)
6048
68
Pain reliever56
5461
Cable/satelliteTV
6361
50
Search engine52
4965
534454
Magazine
6758
48Computer
585355
Gamingsystem
Homeentertainment
7064
59
Wirelesscarrier
6260
66
Shipping66
6245
Airline75
7254
The paradox of flows: Can hope flow from fear?
31

Workers in the “creative” class, as defined by Rich-ard Florida, are reaping relatively more rewards (in the form of compensation) than the rest of the US
labor force. The compensation gap between the cre-ative class and the rest of the workforce has steadily widened over the past 10 years.
RETURNS TO TALENT
Deloitte University Press | dupress.deloitte.com
$65,141
Sources: Bureau of Labor Statistics; Richard Florida's Rise of the Creative Class.
$60,994
$45,546
Figure 27. Returns to talent: Creative class compensation gap
2003 2007 2011 2014$0
$20,000
$40,000
$65,000
20132012201020092008200620052004 2015
2016 Shift Index
32

Over the long term, executives are leaving their po-sitions (resigning, retiring, or joining different com-panies) at an increasing rate. Turnover may acceler-
ate as a result of increasing performance pressures but also depends on the perception of other options available to executives.
EXECUTIVE TURNOVER
102.29
169.95
38.80
Figure 28. Executive turnover index
Deloitte University Press | dupress.deloitte.com
Source: Leading technology research vendor.
Executive turnover has declined after a sharp spike 2010–2012.
1993 1997 2001 2005 2009 2013 20150
40
80
120
160
The paradox of flows: Can hope flow from fear?
33
1. For further discussion of the cumulative effect of exponentials and advances in adjacent domains on the pace of change, see John Hagel, John Seely Brown, Tamara Samoylova, and Michael Lui, From exponential technologies to exponential innovation, Deloitte University Press, October 4, 2013, https://dupress.deloitte.com/dup-us-en/industry/technology/from-exponential-technologies-to-exponential-innovation.html.
2. Thomas Friedman, “Keynote address at the joint meeting of the United Nations Economic and Social Council (ECOSOC) and the Second Committee of the UN General Assembly on the changing political economy of globalization: Multilateral institutions and the 2030 agenda,” October 7, 2016, https://youtu.be/JYdh8naj-FI.
3. Jim Norman, “Americans’ confidence in institutions stays low,” Gallup, June 13, 2016, www.gallup.com/poll/ 192581/americans-confidence-institutions-stays-low.aspx.
4. Richard Edelman, “Beyond the grand illusion,” January 18, 2016, Edelman, www.edelman.com/p/6-a-m/beyond-grand-illusion/.
5. Jasmine Enberg, Global Social Platforms 2016: A country-by-country review of social network usage, eMarketer, April 2016, www.scribd.com/document/319459533/EMarketer-Global-Social-Platforms-2016-A-Country-By-Country- Review-of-Social-Network-Usage.
6. Stephen Morea, “Main event: Improved corporate profit and marketing budgets will support revenue gains,” IBISWorld Industry Report 56192, March 2016.
7. Meetup “Women Who Code SF” group, www.meetup.com/Women-Who-Code-SF/; Food Hackathon + Forum, http://foodhackathon.co/; Digital Narrative Association, “The Narrative Summit: Stories for Impact,” November 10, 2016, http://ourmedia.org/index.php/narrative-summit-november-10-2016/; Makers Summit, www.makerscollective. org/themakerssummit/.
8. Drake Baer, “The ‘filter bubble’ explains why Trump won and you didn’t see it coming,” New York, November 9, 2016, http://nymag.com/scienceofus/2016/11/how-facebook-and-the-filter-bubble-pushed-trump-to-victory.html.
9. For example, Nike, “I am not a role model,” 1993, https://youtu.be/4gqk4WPnrpM.
10. John Hagel, John Seely Brown, and Duleesha Kulasooriya, A movement in the making, Deloitte University Press, January 24, 2014, https://dupress.deloitte.com/dup-us-en/topics/emerging-technologies/a-movement-in-the-making.html; John Hagel, John Seely Brown, Tamara Samoylova, and Duleesha Kulasooriya, The hero’s journey through the landscape of the future, Deloitte University Press, July 24, 2014, https://dupress.deloitte.com/dup-us-en/topics/operations/heros-journey-landscape-future.html.
11. Stuart Dredge, “Joseph Garrett, the children’s presenter with 7.8 million subscribers,” Guardian, August 28, 2016, www.theguardian.com/technology/2016/aug/28/stampy-joseph-garrett-youtube-childrens-presenter-millions-of-viewers.
12. David Yi, “Michelle Phan is starting over,” Mashable, February 13, 2016, http://mashable.com/2016/02/13/michelle-phan-starting-over/.
13. For more information, see John Hagel, John Seely Brown, and Tamara Samoylova, Unlocking the passion of the explorer, Deloitte University Press, September 17, 2013, http://dupress.com/articles/unlocking-the- passion-of-the-explorer/.
14. John Hagel, John Seely Brown, Tamara Samoylova, and Michael Lui, Success or struggle: ROA as a true measure of business performance, Deloitte University Press, October 30, 2013, https://dupress.deloitte.com/dup-us-en/topics/ operations/success-or-struggle-roa-as-a-true-measure-of-business-performance.html.
ENDNOTES
2016 Shift Index
34

JOHN HAGEL
John Hagel is co-chairman of Deloitte Center for the Edge; he has nearly 35 years of experience as a management consultant, author, speaker, and entrepreneur and has helped companies improve perfor-mance by applying IT to reshape business strategies. In addition to holding significant positions at lead-ing consulting firms and companies throughout his career, Hagel is the author of bestselling business books such as Net Gain, Net Worth, Out of the Box, The Only Sustainable Edge, and The Power of Pull. He is on LinkedIn at www.linkedin.com/in/jhagel and on Twitter @jhagel.
JOHN SEELY BROWN
John Seely Brown (JSB) is independent co-chairman of Deloitte Center for the Edge and a prolific writer, speaker, and educator. In addition to his work with the Center for the Edge, JSB is adviser to the provost and a visiting scholar at the University of Southern California. This position followed a lengthy tenure at Xerox Corp., where he was chief scientist and director of the Xerox Palo Alto Research Center. JSB has published more than 100 papers in scientific journals and authored or co-authored seven books, includ-ing The Social Life of Information, The Only Sustainable Edge, The Power of Pull, and A New Culture of Learning.
MAGGIE WOOLL
Maggie Wooll is head of eminence at Deloitte Center for the Edge; she combines her experience advis-ing large organizations on strategy and operations with her passion for getting the stories behind the data and the data behind the stories to shape the Center’s perspectives. At the Center, she explores the emerging opportunities at the intersection of people, technologies, and institutions. She is particu-larly interested in the impact new technologies and business practices have on talent development and learning for the future workforce and workplace.
ANDREW DE MAAR
Andrew de Maar is head of research at Deloitte Center for the Edge; he leads the Center’s research agenda and helps clients make sense of and profit from emerging opportunities on the edge of business and technology. De Maar has worked with a wide range of public, private, and nonprofit entities to help executives explore long-term trends that are fundamentally changing the global business environment and identify high-impact initiatives that their organizations can pursue to more effectively drive near-term performance improvement and large-scale transformation.
ABOUT THE AUTHORS
The paradox of flows: Can hope flow from fear?
35

This article would not have been possible without the fearless data-wrangling efforts of Dan Elbert, who managed the Shift Index model for the 2016 update. In addition, the team would like to thank the following individuals whose feedback, institutional knowledge, and chart-building skills were invaluable: Blythe Aronowitz, Troy Bishop, Matthew Budman, John Day, Michael Ding, Jodi Gray, Carrie Howell, Emily Koteff Moreano, Duleesha Kulasooriya, Alok Pepakayala, Tamara Samoylova, and Molly Woodworth.
ACKNOWLEDGEMENTS
CONTACTS
Blythe Aronowitz Chief of staff, Center for the Edge Deloitte Services LP +1 408 704 2483 [email protected]
Wassili Bertoen Managing director, Center for the Edge Europe Deloitte Netherlands +31 6 21272293 [email protected]
Peter Williams Chief edge officer, Centre for the Edge Australia Tel: +61 3 9671 7629 [email protected]
2016 Shift Index
36

37

About Deloitte University Press Deloitte University Press publishes original articles, reports and periodicals that provide insights for businesses, the public sector and NGOs. Our goal is to draw upon research and experience from throughout our professional services organization, and that of coauthors in academia and business, to advance the conversation on a broad spectrum of topics of interest to executives and government leaders.
Deloitte University Press is an imprint of Deloitte Development LLC.
About this publication This publication contains general information only, and none of Deloitte Touche Tohmatsu Limited, its member firms, or its and their affiliates are, by means of this publication, rendering accounting, business, financial, investment, legal, tax, or other professional advice or services. This publication is not a substitute for such professional advice or services, nor should it be used as a basis for any decision or action that may affect your finances or your business. Before making any decision or taking any action that may affect your finances or your business, you should consult a qualified professional adviser.
None of Deloitte Touche Tohmatsu Limited, its member firms, or its and their respective affiliates shall be responsible for any loss whatsoever sustained by any person who relies on this publication.
About Deloitte Deloitte refers to one or more of Deloitte Touche Tohmatsu Limited, a UK private company limited by guarantee, and its network of member firms, each of which is a legally separate and independent entity. Please see www.deloitte.com/about for a detailed description of the legal structure of Deloitte Touche Tohmatsu Limited and its member firms. Please see www.deloitte.com/us/about for a detailed description of the legal structure of Deloitte LLP and its subsidiaries. Certain services may not be available to attest clients under the rules and regulations of public accounting.
Copyright © 2016 Deloitte Development LLC. All rights reserved. Member of Deloitte Touche Tohmatsu Limited
Follow @DU_Press
Sign up for Deloitte University Press updates at www.dupress.deloitte.com.