2016 school accountability report card - skymountaincs.org · note: mathematics test results...
TRANSCRIPT

2016-17 School Accountability Report Card for Sky Mountain Charter School Page 1 of 12
Sky Mountain Charter School
School Accountability Report Card
Reported Using Data from the 2016-17 School Year
Published During 2017-18
By February 1 of each year, every school in California is required by state law to publish a School Accountability Report Card (SARC). The SARC contains information about the condition and performance of each California public school. Under the Local Control Funding Formula (LCFF) all local educational agencies (LEAs) are required to prepare a Local Control and Accountability Plan (LCAP), which describes how they intend to meet annual school-specific goals for all pupils, with specific activities to address state and local priorities. Additionally, data reported in an LCAP is to be consistent with data reported in the SARC. • For more information about SARC requirements, see the California Department of Education (CDE) SARC Web page at
http://www.cde.ca.gov/ta/ac/sa/. • For more information about the LCFF or LCAP, see the CDE LCFF Web page at http://www.cde.ca.gov/fg/aa/lc/. • For additional information about the school, parents/guardians and community members should contact the school principal or
the district office. DataQuest DataQuest is an online data tool located on the CDE DataQuest Web page at http://dq.cde.ca.gov/dataquest/ that contains additional information about this school and comparisons of the school to the district and the county. Specifically, DataQuest is a dynamic system that provides reports for accountability (e.g., test data, enrollment, high school graduates, dropouts, course enrollments, staffing, and data regarding English learners). Internet Access Internet access is available at public libraries and other locations that are publicly accessible (e.g., the California State Library). Access to the Internet at libraries and public locations is generally provided on a first-come, first-served basis. Other use restrictions may include the hours of operation, the length of time that a workstation may be used (depending on availability), the types of software programs available on a workstation, and the ability to print documents.
About This School Contact Information (School Year 2017-18)
School Contact Information
School Name------- Sky Mountain Charter School
Street------- 4535 Missouri Flat Rd., Ste. 1A
City, State, Zip------- Placerville, CA 95667
Phone Number------- 800-979-4436
Principal------- Cynthia Rachel
E-mail Address------- [email protected]
Web Site------- www.skymountaincs.org
CDS Code 36750510115089

2016-17 School Accountability Report Card for Sky Mountain Charter School Page 2 of 12
District Contact Information
District Name------- Lucerne Valley Unified School District
Phone Number------- (760) 248-6108
Superintendent-------
Peter Livingston
E-mail Address------- [email protected]
Web Site------- http://www.lvsd.k12.ca.us
School Description and Mission Statement (School Year 2017-18)
Sky Mountain Charter School (SMCS) opened in the fall of the 2007/2008 school year. Sky Mountain values the role of the parent in the education of their children. SMCS believes in programs that offer individual learning plans for each student and takes pride in modeling these principles. SMCS is an independent Charter School sponsored by the Lucerne Valley School District in San Bernardino County. SMCS Educational Specialists (ESs) are California credentialed general education teachers who work closely with the families to serve the assigned students educational needs as determined by a written student agreement between the parent and the ES. The parent and ES work together toward student achievement and completion of individual growth and state standards. They also work diligently to meet the major deadlines on the yearly paperwork timetable, as well as the paperwork deadlines for each student. ESs serve their share of required proctor duties each school year and attend required professional growth trainings. Every ES must possess and maintain a valid teaching credential for every day they serve a student. Sky Mountain Charter School was granted WASC accreditation in 2008 and the school received a six-year renewal in 2012. Mission Statement: We believe in educating each of our students for the 21st century by providing individualized learning opportunities that incorporate parental participation, choice, and involvement in curricula offered in personalized learning environments Student Enrollment by Grade Level (School Year 2016-17)
Grade Number of
Level Students
Kindergarten 193
Grade 1 165
Grade 2 178
Grade 3 191
Grade 4 205
Grade 5 202
Grade 6 212
Grade 7 182
Grade 8 157
Grade 9 87
Grade 10 67
Grade 11 48
Grade 12 23
Total Enrollment 1,910
2016-17 School Accountability Report Card for Sky Mountain Charter School Page 3 of 12
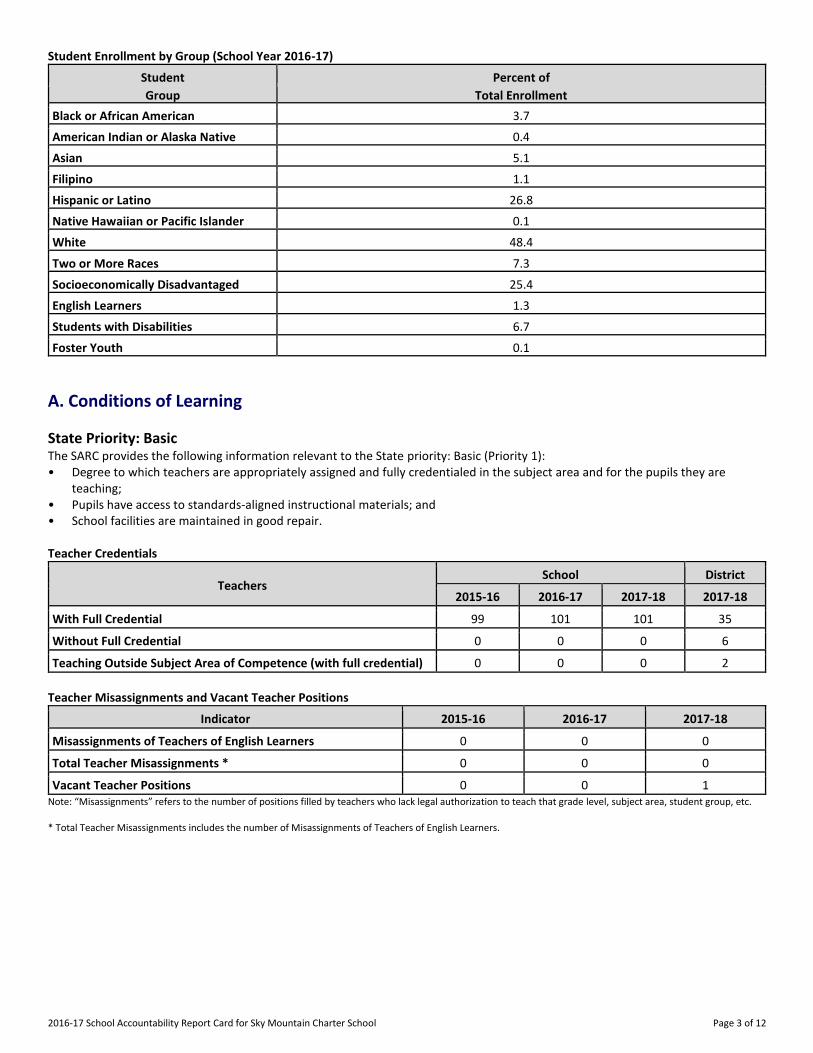
Student Enrollment by Group (School Year 2016-17)
Student Percent of
Group Total Enrollment
Black or African American 3.7
American Indian or Alaska Native 0.4
Asian 5.1
Filipino 1.1
Hispanic or Latino 26.8
Native Hawaiian or Pacific Islander 0.1
White 48.4
Two or More Races 7.3
Socioeconomically Disadvantaged 25.4
English Learners 1.3
Students with Disabilities 6.7
Foster Youth 0.1
A. Conditions of Learning
State Priority: Basic The SARC provides the following information relevant to the State priority: Basic (Priority 1): • Degree to which teachers are appropriately assigned and fully credentialed in the subject area and for the pupils they are
teaching; • Pupils have access to standards-aligned instructional materials; and • School facilities are maintained in good repair. Teacher Credentials
Teachers School District
2015-16 2016-17 2017-18 2017-18
With Full Credential 99 101 101 35
Without Full Credential 0 0 0 6
Teaching Outside Subject Area of Competence (with full credential) 0 0 0 2
Teacher Misassignments and Vacant Teacher Positions
Indicator 2015-16 2016-17 2017-18
Misassignments of Teachers of English Learners 0 0 0
Total Teacher Misassignments * 0 0 0
Vacant Teacher Positions 0 0 1 Note: “Misassignments” refers to the number of positions filled by teachers who lack legal authorization to teach that grade level, subject area, student group, etc. * Total Teacher Misassignments includes the number of Misassignments of Teachers of English Learners.

2016-17 School Accountability Report Card for Sky Mountain Charter School Page 4 of 12
Quality, Currency, Availability of Textbooks and Instructional Materials (School Year 2017-18) Year and month in which data were collected: January 2018 New textbooks and materials are available each year for every student.
Subject Textbooks and Instructional Materials/
Year of Adoption
From Most Recent
Adoption?
Percent of Students Lacking Own
Assigned Copy
Reading/Language Arts New textbooks and materials are available each year for every student.
0
Mathematics New textbooks and materials are available each year for every student.
0
Science New textbooks and materials are available each year for every student.
0
History-Social Science New textbooks and materials are available each year for every student.
0
Foreign Language New textbooks and materials are available each year for every student.
0
Health New textbooks and materials are available each year for every student.
0
Visual and Performing Arts New textbooks and materials are available each year for every student.
0
Science Laboratory Equipment (grades 9-12)
New textbooks and materials are available each year for every student.
0
School Facility Conditions and Planned Improvements (Most Recent Year)
N/A: SMCS is a non-site based, independent study school.

2016-17 School Accountability Report Card for Sky Mountain Charter School Page 5 of 12
B. Pupil Outcomes
State Priority: Pupil Achievement The SARC provides the following information relevant to the State priority: Pupil Achievement (Priority 4): • Statewide assessments (i.e., California Assessment of Student Performance and Progress [CAASPP] System, which includes the
Smarter Balanced Summative Assessments for students in the general education population and the California Alternate Assessments [CAAs] for English language arts/literacy [ELA] and mathematics given in grades three through eight and grade eleven. Only eligible students may participate in the administration of the CAAs. CAAs items are aligned with alternate achievement standards, which are linked with the Common Core State Standards [CCSS] for students with the most significant cognitive disabilities); and
• The percentage of students who have successfully completed courses that satisfy the requirements for entrance to the University of California and the California State University, or career technical education sequences or programs of study.
CAASPP Test Results in English Language Arts/Literacy (ELA) and Mathematics for All Students Grades Three through Eight and Grade Eleven
Subject
Percent of Students Meeting or Exceeding the State Standards (grades 3-8 and 11)
School District State
2015-16 2016-17 2015-16 2016-17 2015-16 2016-17
English Language Arts/Literacy (grades 3-8 and 11)
43 45 39 41 48 48
Mathematics (grades 3-8 and 11)
27 26 23 23 36 37
Note: Percentages are not calculated when the number of students tested is ten or less, either because the number of students in this category is too small for statistical accuracy or to protect student privacy.
CAASPP Test Results in ELA by Student Group Grades Three through Eight and Grade Eleven (School Year 2016-17)
Student Group Total
Enrollment Number Tested
Percent Tested
Percent Met or Exceeded
All Students 1,210 1,140 94.21 45.02
Male 609 571 93.76 40.14
Female 601 569 94.68 49.91
Black or African American 51 49 96.08 35.42
American Indian or Alaska Native -- -- -- --
Asian 57 54 94.74 64.15
Filipino -- -- -- --
Hispanic or Latino 326 313 96.01 35.37
White 599 565 94.32 47.87
Two or More Races 92 86 93.48 61.63
Socioeconomically Disadvantaged 291 278 95.53 27.7
English Learners 22 20 90.91 25
Students with Disabilities 108 97 89.81 22.34
Foster Youth -- -- -- -- Note: ELA test results include the Smarter Balanced Summative Assessment and the CAA. The “Percent Met or Exceeded” is calculated by taking the total number of students who met or exceeded the standard on the Smarter Balanced Summative Assessment plus the total number of students who met the standard (i.e., achieved Level 3–Alternate) on the CAAs divided by the total number of students who participated in both assessments. Note: Double dashes (--) appear in the table when the number of students is ten or less, either because the number of students in this category is too small for statistical accuracy or to protect student privacy.
2016-17 School Accountability Report Card for Sky Mountain Charter School Page 6 of 12
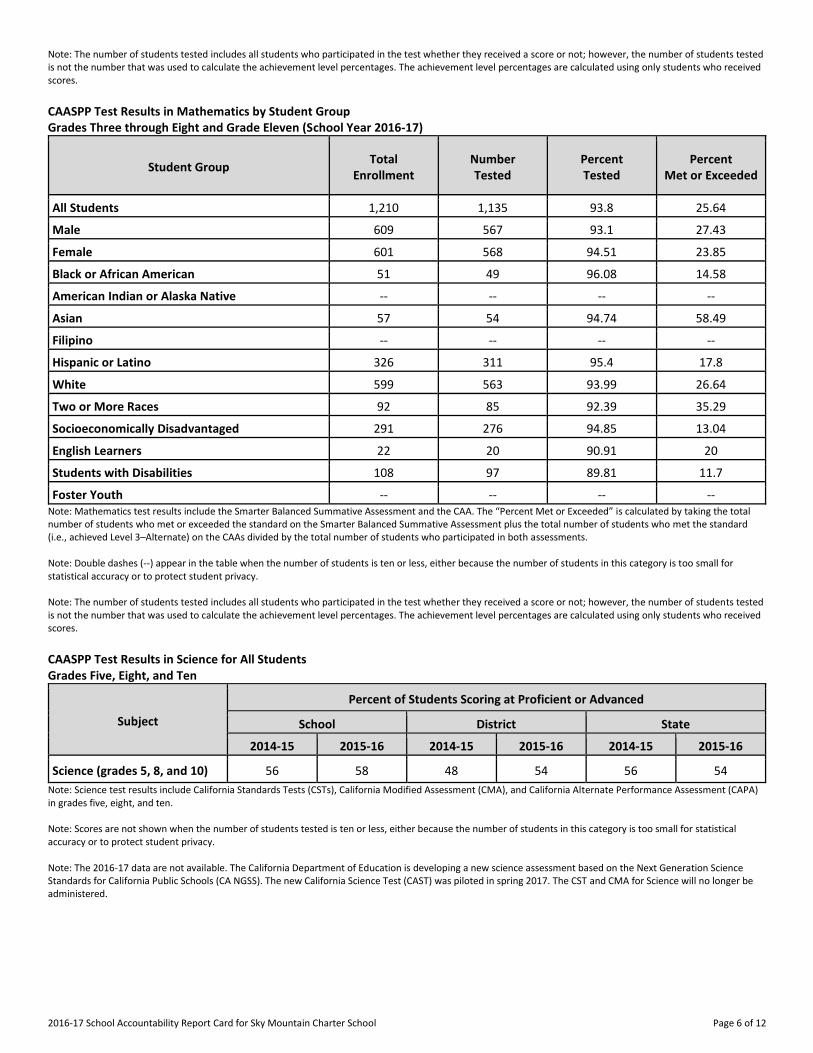
Note: The number of students tested includes all students who participated in the test whether they received a score or not; however, the number of students tested is not the number that was used to calculate the achievement level percentages. The achievement level percentages are calculated using only students who received scores.
CAASPP Test Results in Mathematics by Student Group Grades Three through Eight and Grade Eleven (School Year 2016-17)
Student Group Total
Enrollment Number Tested
Percent Tested
Percent Met or Exceeded
All Students 1,210 1,135 93.8 25.64
Male 609 567 93.1 27.43
Female 601 568 94.51 23.85
Black or African American 51 49 96.08 14.58
American Indian or Alaska Native -- -- -- --
Asian 57 54 94.74 58.49
Filipino -- -- -- --
Hispanic or Latino 326 311 95.4 17.8
White 599 563 93.99 26.64
Two or More Races 92 85 92.39 35.29
Socioeconomically Disadvantaged 291 276 94.85 13.04
English Learners 22 20 90.91 20
Students with Disabilities 108 97 89.81 11.7
Foster Youth -- -- -- -- Note: Mathematics test results include the Smarter Balanced Summative Assessment and the CAA. The “Percent Met or Exceeded” is calculated by taking the total number of students who met or exceeded the standard on the Smarter Balanced Summative Assessment plus the total number of students who met the standard (i.e., achieved Level 3–Alternate) on the CAAs divided by the total number of students who participated in both assessments. Note: Double dashes (--) appear in the table when the number of students is ten or less, either because the number of students in this category is too small for statistical accuracy or to protect student privacy. Note: The number of students tested includes all students who participated in the test whether they received a score or not; however, the number of students tested is not the number that was used to calculate the achievement level percentages. The achievement level percentages are calculated using only students who received scores.
CAASPP Test Results in Science for All Students Grades Five, Eight, and Ten
Subject
Percent of Students Scoring at Proficient or Advanced
School District State
2014-15 2015-16 2014-15 2015-16 2014-15 2015-16
Science (grades 5, 8, and 10) 56 58 48 54 56 54
Note: Science test results include California Standards Tests (CSTs), California Modified Assessment (CMA), and California Alternate Performance Assessment (CAPA) in grades five, eight, and ten. Note: Scores are not shown when the number of students tested is ten or less, either because the number of students in this category is too small for statistical accuracy or to protect student privacy. Note: The 2016-17 data are not available. The California Department of Education is developing a new science assessment based on the Next Generation Science Standards for California Public Schools (CA NGSS). The new California Science Test (CAST) was piloted in spring 2017. The CST and CMA for Science will no longer be administered.

2016-17 School Accountability Report Card for Sky Mountain Charter School Page 7 of 12
Career Technical Education Programs (School Year 2016-17)
As an independent study charter school, it is challenging to offer CTE courses and our CTE program is still under development. We have partnered with Brighton College, a private, online CTE college to offer 11 career pathways with certification exams at the end of the pathway. We have also begun to work with Drone University to offer a pathway to certification. Additionally, we have school created CTE courses in child development and fashion design. Further, we now work with 7 additional online curriculum vendors to offer CTE courses (not a full pathway). These vendors include Accelerate, APEX, K12, Advanced Academics (Connections), Silicon Valley High and Schmoop. Finally, we offer a wide variety of career exploration (pre-CTE) courses through eDynamic Learning that have been very popular with our students. Some of our most popular CTE courses are with eDynamic Learning. These courses are generally 1 semester in length and introduce the student to a specific career. We presently offer courses that introduce 53 separate careers. When a student is interested, they may, in many cases, continue their study on a career pathway through Brighton, Drone University, or one of our other online vendors. Working with UCCI, we created an integrated class: Fashion Forward World History. This is an honors course that integrated fashion design with world history and was written during the 2016-17 school year. Our Brighton College and other online courses support academic learning as many pathways have math and science components as well as reading and writing components. In the case of Brighton, students are paired with a learning success coach who identifies academic issues and helps to create an academic success plan for each individual student. Career Technical Education Participation (School Year 2016-17)
Measure CTE Program Participation
Number of pupils participating in CTE 57
% of pupils completing a CTE program and earning a high school diploma 1%
% of CTE courses sequenced or articulated between the school and institutions of postsecondary education 3%
Courses for University of California (UC) and/or California State University (CSU) Admission
UC/CSU Course Measure Percent
2016–17 Pupils Enrolled in Courses Required for UC/CSU Admission 5.97
2015–16 Graduates Who Completed All Courses Required for UC/CSU Admission 12.5
State Priority: Other Pupil Outcomes The SARC provides the following information relevant to the State priority: Other Pupil Outcomes (Priority 8): • Pupil outcomes in the subject areas of physical education. California Physical Fitness Test Results (School Year 2016-17)
Grade Level
Percent of Students Meeting Fitness Standards
Four of Six Standards Five of Six Standards Six of Six Standards
---5--- 19.3 27.5 29.5
---7--- 19.4 26.2 33
---9--- 21.1 23.2 29.5 Note: Percentages are not calculated when the number of students tested is ten or less, either because the number of students in this category is too small for statistical accuracy or to protect student privacy.

2016-17 School Accountability Report Card for Sky Mountain Charter School Page 8 of 12
C. Engagement
State Priority: Parental Involvement The SARC provides the following information relevant to the State priority: Parental Involvement (Priority 3): • Efforts the school district makes to seek parent input in making decisions for the school district and each schoolsite. Opportunities for Parental Involvement (School Year 2017-18)
SMCS parents receive emails from a parent listserv that provides resources such as classes in our various geographic areas, college scholarship opportunities, parent trainings and webinars and opportunities to participate in field trips. During a field trip, students may go to local museums, zoos, aquariums, or other educational venues. Students have the opportunity to learn cooperatively in a hands-on environment and complete pre and post learning activities that coincide with the activity. SMCS parents and ESs work together to select vendors that provide physical education classes (such as dance lessons, nutrition classes, swimming lessons, etc.). They also work together to select vendors who will provide group learning experiences such as small group tutoring or classes, music, art, and core subject classes. Parents participate with the credentialed teacher in the development of the student’s educational plan, initially and on an ongoing basis. Parents meet face to face with their Education Specialist at least once every 20 school days to review and document attendance and the student learning that occurs during that learning period. SMCS Parent Council members meet via teleconference a minimum of twice per year. The parents are elected to the council and serve as a member for a two-year term. The function of the Parent Council is to two-fold: to provide feedback and advice to IEM regarding SMCS students’ and parents’ home-based independent study experiences and concerns, as well as suggestions and ideas for improving the parents’ and the school’s educational programs; and to uphold the mission of the school and contribute to the success of SMCS. Parent Council members serve on a subcommittee to promote school and student needs. All parents with children enrolled in SMCS have the opportunity to volunteer their time to a council sub-committee. The role of the parent council member is to:
• Uphold the mission of school
• Develop/approve short and long-term goals
• Monitor the school's performance
• Monitor own performance
• Be involved in the accreditation process
• Serve for a two-year term
• Plan to attend all council meetings
• Make suggestions to improve the school
• Be true to the school's mission, not a personal agenda
• Be positive In addition, SMCS has a Governing Board consisting of five members of the Parent Council which were appointed by IEM and approved by the Parent Council. All vacant seats on the Governing Board are filled by Parent Council members appointed by IEM and serve until permanent members are approved by the Parent Council. The function of the Governing Board is to review and approve all policies or other matters that require Governing Board approval, or any other matter as directed or requested by IEM. The term of office for Governing Board members is one year pursuant to bylaws consistent with this charter. For Special Education students, there is ongoing parental collaboration and support provided to the parent to ensure that their student's needs are met as part of the Individualized Education Program.
State Priority: Pupil Engagement The SARC provides the following information relevant to the State priority: Pupil Engagement (Priority 5): • High school dropout rates; and • High school graduation rates.

2016-17 School Accountability Report Card for Sky Mountain Charter School Page 9 of 12
Dropout Rate and Graduation Rate (Four-Year Cohort Rate)
Indicator School District State
2013-14 2014-15 2015-16 2013-14 2014-15 2015-16 2013-14 2014-15 2015-16
Dropout Rate 7.4 0 0 30.3 7.1 14.5 11.5 10.7 9.7
Graduation Rate 88.89 100 100 63.64 82.14 72.58 80.95 82.27 83.77
Completion of High School Graduation Requirements - Graduating Class of 2016 (One-Year Rate)
Group Graduating Class of 2016
School District State
All Students 100 88.61 87.11
Black or African American 100 60 79.19
American Indian or Alaska Native 0 100 80.17
Asian 0 100 94.42
Filipino 0 0 93.76
Hispanic or Latino 100 93.55 84.58
Native Hawaiian/Pacific Islander 0 0 86.57
White 100 87.8 90.99
Two or More Races 0 0 90.59
Socioeconomically Disadvantaged 100 81.48 85.45
English Learners 0 100 55.44
Students with Disabilities 0 50 63.9
Foster Youth 0 100 68.19
State Priority: School Climate The SARC provides the following information relevant to the State priority: School Climate (Priority 6): • Pupil suspension rates; • Pupil expulsion rates; and • Other local measures on the sense of safety. Suspensions and Expulsions
Rate School District State
2014-15 2015-16 2016-17 2014-15 2015-16 2016-17 2014-15 2015-16 2016-17
Suspensions------- 0.0 0.0 0.0 4.8 4.2 4.0 3.8 3.7 3.6
Expulsions------- 0.0 0.0 0.0 0.0 0.0 0.0 0.1 0.1 0.1
School Safety Plan (School Year 2017-18)
N/A: SMCS has no school owned facilities that students attend. SMCS is an independent study model and does not operate any school learning centers.

2016-17 School Accountability Report Card for Sky Mountain Charter School Page 10 of 12
D. Other SARC Information
The information in this section is required to be in the SARC but is not included in the state priorities for LCFF. Federal Intervention Program (School Year 2017-18)
Indicator School District
Program Improvement Status N/A In PI
First Year of Program Improvement N/A 2011-2012
Year in Program Improvement* N/A Year 3
Number of Schools Currently in Program Improvement N/A 2
Percent of Schools Currently in Program Improvement N/A 66.7 Note: Cells with N/A values do not require data.
Average Class Size and Class Size Distribution (Elementary)
Grade Level
2014-15 2015-16 2016-17
Avg. Class Size
Number of Classes Avg. Class Size
Number of Classes Avg. Class Size
Number of Classes
1-20 21-32 33+ 1-20 21-32 33+ 1-20 21-32 33+
Number of classes indicates how many classes fall into each size category (a range of total students per class).
Average Class Size and Class Size Distribution (Secondary)
Subject
2014-15 2015-16 2016-17
Avg. Class Size
Number of Classrooms Avg. Class Size
Number of Classrooms Avg. Class Size
Number of Classrooms
1-22 23-32 33+ 1-22 23-32 33+ 1-22 23-32 33+
English------- ----------
2 76 2 63 2 99
Mathematics ----------
2 95 2 69 2 110
Science------- ----------
2 51 2 48 2 68
Social Science ----------
2 92 2 60 2 104 Note: Number of classes indicates how many classrooms fall into each size category (a range of total students per classroom). At the secondary school level, this information is reported by subject area rather than grade level. Academic Counselors and Other Support Staff (School Year 2016-17)
Title Number of FTE
Assigned to School Average Number of Students per
Academic Counselor
Academic Counselor------- 5 391
Counselor (Social/Behavioral or Career Development) 1 N/A
Library Media Teacher (Librarian) 0 N/A
Library Media Services Staff (Paraprofessional) 0 N/A
Psychologist------- .5 N/A
Social Worker------- 0 N/A
Nurse------- 0 N/A
Speech/Language/Hearing Specialist 2.28 N/A
Resource Specialist------- 4.05 N/A
Other------- 1.2 N/A Note: Cells with N/A values do not require data. *One Full Time Equivalent (FTE) equals one staff member working full time; one FTE could also represent two staff members who each work 50 percent of full time.
2016-17 School Accountability Report Card for Sky Mountain Charter School Page 11 of 12
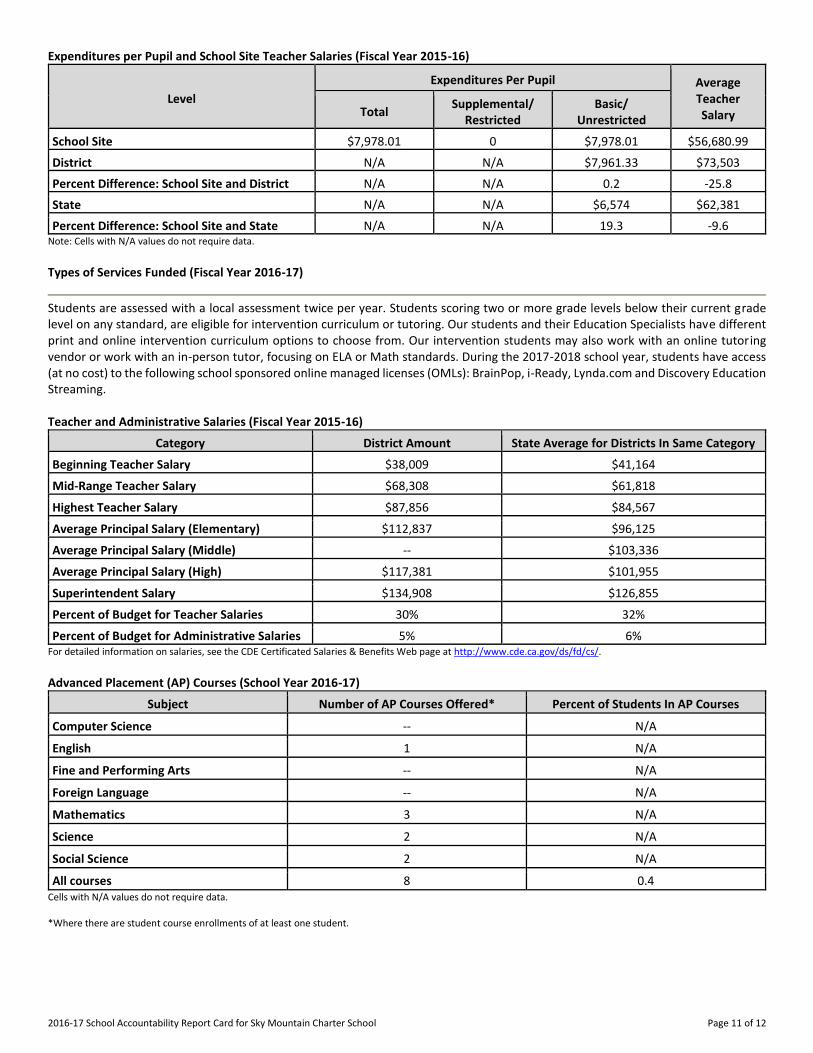
Expenditures per Pupil and School Site Teacher Salaries (Fiscal Year 2015-16)
Level
Expenditures Per Pupil Average Teacher Salary Total
Supplemental/ Restricted
Basic/ Unrestricted
School Site------- $7,978.01 0 $7,978.01 $56,680.99
District------- N/A N/A $7,961.33 $73,503
Percent Difference: School Site and District N/A N/A 0.2 -25.8
State------- N/A N/A $6,574 $62,381
Percent Difference: School Site and State N/A N/A 19.3 -9.6 Note: Cells with N/A values do not require data.
Types of Services Funded (Fiscal Year 2016-17)
Students are assessed with a local assessment twice per year. Students scoring two or more grade levels below their current grade level on any standard, are eligible for intervention curriculum or tutoring. Our students and their Education Specialists have different print and online intervention curriculum options to choose from. Our intervention students may also work with an online tutoring vendor or work with an in-person tutor, focusing on ELA or Math standards. During the 2017-2018 school year, students have access (at no cost) to the following school sponsored online managed licenses (OMLs): BrainPop, i-Ready, Lynda.com and Discovery Education Streaming. Teacher and Administrative Salaries (Fiscal Year 2015-16)
Category District Amount State Average for Districts In Same Category
Beginning Teacher Salary $38,009 $41,164
Mid-Range Teacher Salary $68,308 $61,818
Highest Teacher Salary $87,856 $84,567
Average Principal Salary (Elementary) $112,837 $96,125
Average Principal Salary (Middle) -- $103,336
Average Principal Salary (High) $117,381 $101,955
Superintendent Salary $134,908 $126,855
Percent of Budget for Teacher Salaries 30% 32%
Percent of Budget for Administrative Salaries 5% 6% For detailed information on salaries, see the CDE Certificated Salaries & Benefits Web page at http://www.cde.ca.gov/ds/fd/cs/. Advanced Placement (AP) Courses (School Year 2016-17)
Subject Number of AP Courses Offered* Percent of Students In AP Courses
Computer Science -- N/A
English------- 1 N/A
Fine and Performing Arts -- N/A
Foreign Language -- N/A
Mathematics 3 N/A
Science------- 2 N/A
Social Science 2 N/A
All courses 8 0.4 Cells with N/A values do not require data. *Where there are student course enrollments of at least one student.

2016-17 School Accountability Report Card for Sky Mountain Charter School Page 12 of 12
Professional Development (Most Recent Three Years)
New Educational Specialists (ESs) are guided through an initial training process which covers all aspects of the job including administrative reporting and procedures, educational philosophies, all assessments required of students, and how to select a curriculum that fits individual needs of their students. They also attend a learning record meeting of a veteran ES. The ESs demonstrate their knowledge and understanding of these topics by completing training tests within the required time, and by passing those tests with 100% accuracy. The new ESs also attend monthly new ES trainings for their first year on the job. An advisor is assigned to each Educational Specialist to interact with them as a mentor and supervisor. The advisor explains the procedures and requirements in further detail, oversees their paperwork, and ensures that they are following set policies and procedures correctly. All ESs attend required monthly professional development meetings with other ESs in their geographical area. Each meeting has a set agenda that informs the ESs of important information, reviews procedures and policies, new and current curriculum choices, teaching strategies and techniques, high school training, and conflict resolution strategies. The agenda also allows for networking time amongst the group on a variety of topics and procedures. Additionally, each ES must complete monthly professional development hours on a topic of their choice that relates to their annual goals. These are reported upon at the monthly meetings. There is a one-day professional development training day that occurs before the start of the school year which all staff must attend. Throughout the year, additional trainings are provided that are specific to policies, procedures, curriculum, and high school issues which are presented over a web-based media. This policy allows the school and ESs to respond to needs as they arise with appropriate training as needed. Special Education teachers engage in monthly department trainings with a wide variety of topics ranging from specific types of strategies for specific disabilities to training on legal issues to ensure compliance with federal and state laws. Special Education teachers attend the all staff meeting as well as participate in an 8-hour training in August to ensure that they are continuing to develop as Special Education teachers.